Embed Size (px)
Citation preview
1
Effects of Large-Scale Research Funding Programs:
A Japanese Case Study
Takanori Idaa, Naomi Fukuzawaa* a Graduate School of Economics, Kyoto University, Yoshida, Sakyo, Kyoto 606-8501, Japan
Abstract: This study investigates the effects of large-scale research funding from the Japanese
government on the research outcomes of university researchers. To evaluate the effects, we use
the difference-in-differences estimator and measure research outcomes in terms of number of
papers and citation counts per paper. Our analysis shows that the funding program led to an
increase in the number of papers in some fields and an increase in the citation counts in the other
fields. A comparison of our estimation results with assessment data obtained from peer reviews
showed important differences. Since the characteristics of research vary according to the field,
bibliometrics analysis should be used along with the peer review method for a more accurate
analysis of research impact.
Keywords: Research assessment; Difference-in-differences; Government grants; University
research; Bibliometrics; Peer review
* Corresponding author. Tel.:+81-90-8374-1660 E-mail address: [email protected]

2
1. Introduction
In the report titled “Present Status of Research Evaluations and its Future in Japan,” the
Science Council of Japan has indicated that research evaluations play an important role in
ensuring accountability in the use of research funds as well as in promoting research activities
and improving their quality (Committee for Research Evaluations 2008). However, the same
report has also highlighted that the research evaluation system of the Japanese government is not
adequately developed and that research evaluation in Japan is a complex process, requiring
considerable thought and effort from the evaluators and the evaluated academic units. In the
United Kingdom, allocation of research grants to universities is based on the results of research
evaluation process, known as the Research Assessment Exercise (RAE), which has already been
undertaken six times. Although the RAE offers a prototype for evaluation methodology, it
requires substantial inputs in terms of time and money (Kostoff, 1994; Oppenheim, 1995).
The purpose of this paper is to critically assess the performance of a large-sized research
funding program in Japan, known as the 21st Century Centers of Excellence (COE) Program,
using a different evaluation technique: a bibliometric analysis. The aim of this funding program
was to cultivate a competitive academic environment among Japanese universities by providing
targeted support for the creation of world-class research and education bases. Nearly 6,000
researchers benefited from the COE program; however, their publication-related achievements
have not been captured in a database. Institutions that applied for funds through the COE
included PhD departments of graduate schools and university-affiliated research institutes.
Applications for the COE program were reviewed by a team of 1,000 referees, each a specialist
or leading authority in the subject field. Category-specific subcommittees evaluated the proposals
through hearings and panel interviews. Applications were shortlisted by a screening committee,
and the selection results were submitted to the program committee for final judgment.
Applications for the COE program, which awarded research funding for a 5-year term, were
accepted in FY 2002 (5 fields), FY 2003 (5 fields), and FY 2004 (1 field)1. Program performance
was assessed by subject-specific subcommittees using peer review methods at a 2-year interval to
1 Details are given on the official site of the 21st COE Program (http://www.jsps.go.jp/english/e-21coe/index.html) of the Japan Society for the Promotion of Science.

3
verify the progress of the funded research projects, and final assessments were carried out after
project completion.
In this study, we attempt to evaluate the effects of the COE program through bibliometric
analysis, which overcomes the subjective biases of the peer review methods. To our knowledge,
this is the first study that intends to evaluate the success of the COE program by analyzing its
effects on the publication-related achievements of its recipients. Our analysis covers research
achievements in eight fields recognized under the COE program: (1) life sciences; (2)
information sciences, electrical and electronic engineering (henceforth, information sciences); (3)
chemistry and material sciences; (4) humanities; (5) social sciences; (6) medical sciences; (7)
mechanical, civil, architectural and other fields of engineering (henceforth, mechanical
engineering); and (8) mathematics, physics, and earth sciences (henceforth, the mathematics and
physics). Three interdisciplinary fields were excluded from the study as the research
achievements in these fields were difficult to evaluate.
Data for bibliometric analysis of research outcomes is typically obtained from scientific
databases. Previous studies have compared two scientific databases on the basis of the research
outcomes reported by them: Web of Science (Thomson Reuters) and Scopus (Elsevier) (Meho
and Yang, 2007; Norris and Oppenheim, 2007; Haddow and Genoni, 2010). Comparison results
showed that Scopus could replace Web of Science as a tool to evaluate research impact. For this
study, we used Scopus because of its comprehensive and accurate coverage of Japanese research
outcomes. To construct the outcome indexes, we used the number of papers published by each
researcher and the number of citations attributed to the researcher. We then employed the
difference-in-differences (DID) estimator to evaluate the difference between “the before–after
outcomes in the treatment group, which received funding” and “the before–after outcomes in the
control group, which did not receive funding.” Thus, we controlled for a certain number of
selection biases that stemmed from nonrandom assignment of the COE program.
Although other studies have attempted to analyze the effects of funding programs with the help
of control and treatment groups or with a before–after comparison, none of them have used DID
estimation, which combines both treatment–control comparison and a before–after comparison to
measure the effects of the treatment. Gaughan and Bozeman (2002) examined the effects of
funding from the National Science Foundation (NSF) on the number of papers published. They
found no significant difference in the total number of papers published between the treatment and

4
control groups. Gaughan and Ponomariov (2008) compared their treatment group, consisting of
researchers who received center support from the National Institute of Child Health and Human
Development (NICHD), with a suitable control group and showed that the center affiliation did
not have a significant influence on the publication rate. Gaughan (2009) compared the treatment
and control groups of a training program at the National Institute of Health (NIH) and showed
that center affiliation did not have a significant impact on the paper publication rate adjusted by
age. In a separate study, Bozeman and Gaughan (2007) showed that researchers who received
industry grants or government grants had a higher involvement rate in the industry. The number
of industry and government grants also had a significantly positive effect on industry
involvement. Dietz and Bozeman (2005) compared the five-year mean publication rate of
researchers who shifted from universities to industries and vice versa, and showed that the shift
had an important effect on productivity.
The main results of this paper are summarized as follows. In the fields of life sciences,
humanities, medical sciences, and mechanical engineering, we observed a statistically significant
increase in the number of papers as a result of the COE program. A statistically significant
increase in citation counts was also observed in the fields of life sciences fields, information
sciences, and medical sciences.
However, caution must be exercised when interpreting the increased effects in different
academic disciplines. In the natural sciences, the time lag between publication and citation is
considered to be short; therefore, the effects of research funding are comparatively easy to
ascertain. In the field of information sciences, there exists a stronger tendency to publish
proceedings rather than journal articles. In social sciences and the humanities, the research cycle
is longer, and the number of citations is lower. Thus, the field or discipline is a key factor
affecting research evaluations.
This paper is organized as follows. Section 2 describes the indexes of research outcomes and
the DID estimator method. Section 3 provides details on the scientific database used for the study
and the method employed for selecting data. Section 4 explains the truncation biases of the
citation counts and the DID estimator model. Section 5 describes the estimation results. Section 6
presents the discussions and conclusions.
2. Methods

5
In this section, we explain the indexes of research outcomes and the methods used for
evaluating the effectiveness of a research support program.
2.1 Indexes of research outcomes
Peer review, as a method of research evaluation, is a costly and lengthy process and suffers
from subjective biases, stemming from the “old boy” networks that exist in established fields and
“halo” effects, which refer to the higher likelihood of funding for more prominent scientists
(Gibbons and Georghiou, 1987; Kostoff, 1994; Oppenheim, 1995). To avoid these biases, this
study uses number of papers and citation counts of individual researchers as measures of research
outcomes. The use of number of papers and the citation counts, known as bibliometrics, to
evaluate research credibility is known as an indirect peer review (Gibbons and Georghiou, 1987)
and can be used as an alternative to peer reviews.
Many studies have investigated the correlation between peer review and bibliometrics
(Anderson, et al., 1978; Zhu, et al., 1991; Oppenheim, 1995, 1997; Rinia, et al., 1998, 2001). For
example, Oppenheim (1995, 1997) found a statistically significant correlation between the
number of citations received by a department in total and the RAE rating of that department,
derived from the peer-review method. Similarly, significant correlations between the two
approaches were found in the fields of anatomy, archaeology, and genetics. Rinia et al. (1998)
showed varying correlations between different bibliometric indicators and the results of peer
evaluation of 56 research programs on condensed matter physics, carried out at universities or
academic institutes in the Netherlands. In another study, Rinia et al. (2001) showed that the peer
review results did not significantly correlate with the degree of interdisciplinarity and the number
of publications per program; the total number of citations had a negative correlation with
interdisciplinarity in physics in the Netherlands.
Although each discipline of study is unique, number of citations of patents is often used as an
objective evaluation index for measuring patent value. Jaffe et al. (2000), Harhoff et al. (1999),
and Lanjouw and Schankerman (1999) showed a positive correlation between the number of
citations received by a patent and its importance (both economic and technological), as well as its
quality and value. In line with the above studies, we use the number of papers as an activity index,

6
while the citation counts reflect the quality of scientific research. Although the types of academic
publication contained in the database included articles, conference papers, reviews, and letters,
we restricted our analysis to only research articles, as these have passed through the most
rigorous peer review.
2.2 Treatment effect analysis
The average treatment effect (ATE) is one of the methods of evaluating the effects of a
research funding program (Rosenbaum and Rubin, 1983). ATE is the average difference between
“the outcome with treatment, 1y ” and “the outcome without treatment, 0y .” It is defined as
follows:
1 0ATE ( )E y y= − (1)
Let the variable T be a binary treatment indicator, where T 1= denotes the treatment group
and T 0= denotes the control group. An important assumption in order to identify treatment
effects is the conditional independence assumption or the strongly ignorable treatment
assignment (Rosenbaum and Rubin, 1983), which states that conditional on a vector of
observable variables x , the outcomes are independent of the treatment. The conditional
independence assumption is written as follows:
1 0( , ) T |y y xC (2)
0 (T 1| ) 1p x< = <
where C represents independence, following Dawid (1979), and the ATE is defined as follows:
1 0
1 0
1 0
ATE ( | )( | ) ( | )( | ,T 1) ( | ,T 0)
E y y xE y x E y xE y x E y x
= −= −= = − = (3)
Moreover, when the condition expressed in Eq. (2) holds, the average treatment effect on the
treated (ATET) (Heckman and Robb, 1985) is defined by Eq. (4).
1 0
1 0
1 0
ATET ( | T 1)( | ,T 1) ( | ,T 1)( | ,T 1) ( | ,T 0) ATE
E y yE y x E y xE y x E y x
= − == = − == = − = =
(4)
This is the expected value of the difference between “the results of the treatment” and “the results
7
without the treatment” in the treatment group.
We thus estimate ATET when the treatment of the program involves random assignment.
However, selection biases are inevitable in this case because the COE program is not based on
random assignment. For this reason, we use the “difference-in-differences (DID)” estimator,
explained in the following subsection.
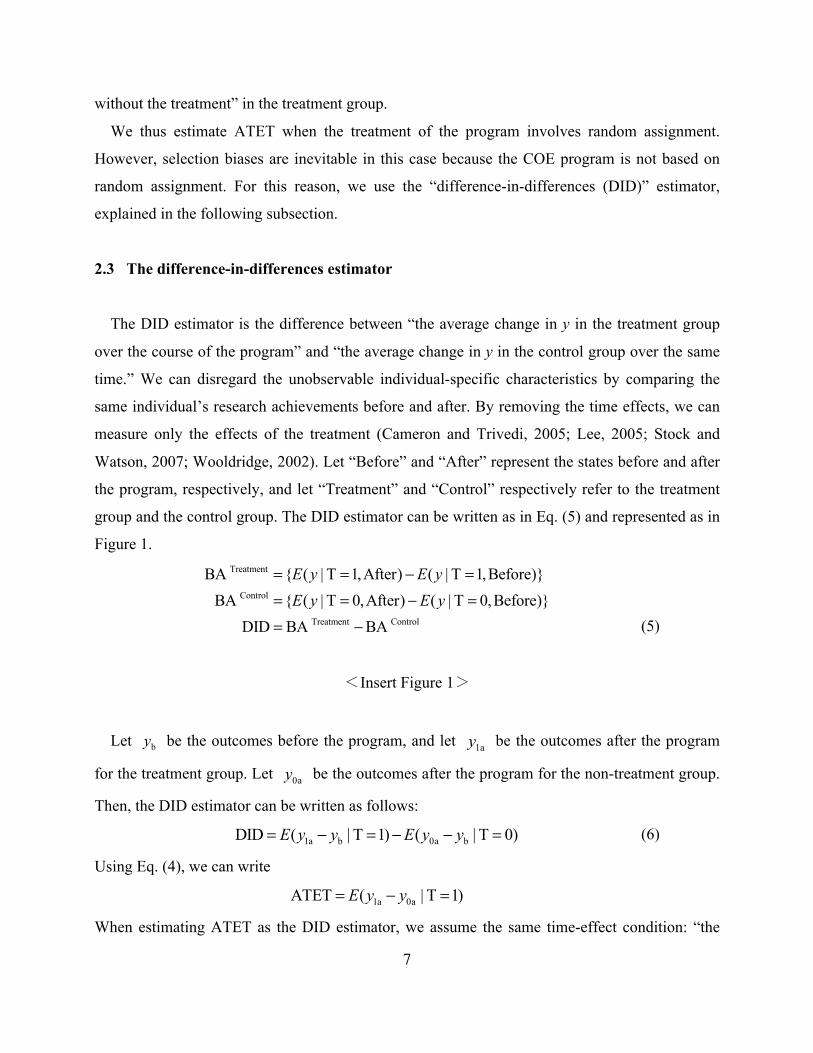
2.3 The difference-in-differences estimator
The DID estimator is the difference between “the average change in y in the treatment group
over the course of the program” and “the average change in y in the control group over the same
time.” We can disregard the unobservable individual-specific characteristics by comparing the
same individual’s research achievements before and after. By removing the time effects, we can
measure only the effects of the treatment (Cameron and Trivedi, 2005; Lee, 2005; Stock and
Watson, 2007; Wooldridge, 2002). Let “Before” and “After” represent the states before and after
the program, respectively, and let “Treatment” and “Control” respectively refer to the treatment
group and the control group. The DID estimator can be written as in Eq. (5) and represented as in
Figure 1.
Treatment
Control
Treatment Control
BA { ( | T 1,After) ( | T 1,Before)}BA { ( | T 0,After) ( | T 0,Before)}
DID BA BA
E y E yE y E y
= = − == = − == − (5)
<Insert Figure 1>
Let by be the outcomes before the program, and let 1ay be the outcomes after the program
for the treatment group. Let 0ay be the outcomes after the program for the non-treatment group.
Then, the DID estimator can be written as follows:
1a b 0a bDID ( | T 1) ( | T 0)E y y E y y= − = − − = (6)
Using Eq. (4), we can write
1a 0aATET ( | T 1)E y y= − =
When estimating ATET as the DID estimator, we assume the same time-effect condition: “the

8
effects of not belonging to the treatment group are the same between the treatment group and the
control group.”
0a b 0a b( | T 1) ( | T 0)E y y E y y− = = − = (7)
Then we have
1a b 0a b 1a 0aDID ( | T 1) ( | T 0) ( | T 1) ATETE y y E y y E y y= − = − − = = − = = .
We measured the program effects assuming Eq. (7) holds2. In this study, the control group was
formulated by extracting researchers randomly from the same university, the same graduate
school, and the same major as the ones in the treatment group. Further, the indirect effects of
belonging to the selected university were offset by using the DID estimator, which can estimate
only the direct effects.
3. Data
In this section, we describe the scientific database used in this study and explain the process of
obtaining data.
3.1 Database selection
Previous studies on research evaluation using bibliometrics have relied on either Web of
Science (WoS) or Scopus, both of which are international scientific databases. Meho and Yang
(2007) compared the ranking of the citation counts (published between 1996 and 2005) between
WoS and Scopus for 15 faculty members of the School of Library and Information Science at
Indiana University, Bloomington, and found that the overall relative ranking of the faculty
members did not change significantly between the two data sources. Norris and Oppenheim
(2007) compared four scientific databases (WoS, Scopus, Google Scholar, and CSA Illumina) by
using data from the RAE (2001) and from the International Bibliography in the Social Sciences,
which includes non-English journals in the field. They concluded that Scopus offered the best
coverage and could replace WoS as a tool to evaluate research impact in the social sciences
fields.
A key concern in this analysis was identifying researchers correctly using the search function
2 This condition is weaker than the random assignment condition in Eq. (2).

9
in the databases. We compared WoS and Scopus from this perspective and found that although
WoS facilitated a longer-term analysis, it did not allow users to perform a full name search,
which made it difficult to identify the researchers. Scopus, on the other hand, assigned author IDs
to prominent researchers, facilitating full name search. Hence, we decided to use Scopus as the
database for this study3.
3.2 Data on research outcomes
The author ID function on the Scopus database was not completely error-free, leading to
problems especially in identifying authors whose affiliations had changed. To solve this problem,
we first compiled a list that included details of the researchers’ affiliations and departments at the
start of the COE program, from the official COE website. We then searched for published papers
and citations counts of each researcher. To avoid problems in data accuracy, the collected data
were filtered by matching their affiliations and departments listed in the published papers to those
at the start of the COE program. Since this process could lead to the accidental omission of
researchers who had changed their affiliations a number of times, we contacted each researcher
via e-mail address and confirmed the list of publications with each researcher (researcher’s
self-check). Added to this, we excluded researchers who had enrolled but left the COE program
within a 5-year term.
To form the control group (researchers not engaged in the COE program), we randomly chose
researchers from each university selected in the program. The ratios of full professors, divisions,
and majors between the treatment and control groups were equalized. The number of teams and
researchers used for analysis and the results of the researcher’s self-check are summarized in
Table 1.
<Insert Table 1>
To avoid any selection biases resulting from the researcher’s self-check, we analyzed the
difference between the “before–after outcomes of researchers who replied to self-check e-mail” 3 A drawback of the Scopus database is that it includes citation counts only since 1996. However, since we have used data only after 1997, this drawback did not affect our analysis.

10
and “before–after of the outcomes of researchers who did not reply to the self-check e-mail”
using a t-test of the number of papers. Because the null hypothesis of no difference could not be
rejected in all fields at a 5% level of statistical significance, we conclude that the biases are not
serious.
4. Estimation models
4.1 Truncation bias of the citation counts
One of the major problems associated with the use of citation counts is truncation bias. The
decline in the citations of recent papers is a result of such truncation. To address this problem,
some studies have used normalization, which is also used with forward citation of patents (Jaffe
and Trajtenberg, 1996; Jaffe and Lerner, 2001; Hall et al., 2000, 2001). There are two approaches
of normalization: the fixed-effects approach and the quasi-structural approach (Hall et al., 2001).
The fixed-effects approach assumes normalization by dividing each citation by the corresponding
year-field citation mean. The quasi-structural approach attempts to distinguish the multiple
effects on citation via econometric estimation.
In this paper, we estimated the fixed effects using an eclectic mix of the two above-mentioned
methods. Let the dependent variable be the citation counts per paper. We reviewed citation data
from 1997 to 2007 for the fields funded by the COE program in FY 2002, and data from 1998 to
2008 for the fields funded by the COE program in FY 2003. We use the year dummy variable as
an independent variable4. The regression equation is shown below:
year pit it itCited d uα β= + + (8)
: citation counts per paper for year t of researcher i yearitd : year dummy variable with some base year
We used the least-squares method for each team of the treatment group and the control group.
We subtracted the “estimated amount in each year” from the “citation counts in each year”
because this estimated amount is negative, given that there is underestimation by truncation.
4 We used 1998 as the base year for the fields incorporated in the COE program of FY 2002, and 1999 for the fields incorporated in the COE program of FY 2003.
pitCited

11
4.2 Difference-in-differences estimator models
We conducted a linear panel regression analysis using ten years of data for each researcher,
excluding the year of program adoption. The regression model is shown below.
treat After treat After0 1 2it i it i it itPaper d d d dγ γ γ δ ε= + + + + (9)
adjusted treat After treat After0 1 2' ' ' 'it i it i it itCited d d d dγ γ γ δ ε= + + + + (10)
: total number of papers in year t of researcher i
: adjusted number of citations per paper per year of researcher i treatid : dummy variable indicating the researcher selected by the program
: dummy variable of the time period after the program
The DID estimator of the number of papers and citation counts is δ in Eq. (9) and 'δ in Eq.
(10), respectively.
5. Estimation results
In this section, we describe the DID estimation results. The DID estimation results for the eight
science fields analyzed in this study are shown in Table 2. Results of the average increased
effects in the number of papers and citations are shown in Tables 3–10. After performing a
Hausman’s specification test, we were not able to reject the null hypothesis that “there is no
correlation between the individual characteristics effect and the independent variables” in all the
fields. Consequently, we adopted a random-effects model. We explain the results in detail below.
<Insert Table 2>
5.1 Life sciences
In the fields of life sciences, we found a statistically significant increase in the number of
papers and citations. The main results are given as below.
itPaperadjusteditCited
Afteritd

12
The number of papers per researcher per year increased from 3.08 to 4.38 after the
introduction of the COE program. The COE effect accounted for 0.71 of total increase
(Δ1.30), which was statistically significant at the 1% level. Moreover, the citation counts per
paper increased from 28.56 to 37.39 after the COE program (Δ8.83). The COE effect
amounted to 4.67, which was also statistically significant at the 1% level.
We obtained statistically significant results for the number of papers authored by 13 teams
out of a total of 28 teams. We also obtained statistically significant results for the citation
counts of 5 teams.
The effects of the COE program on national and public universities (22 teams) were
compared with those on private universities (6 teams). The number of papers per researcher
per year increased by 0.7 and 0.1, respectively. Similarly, citation counts per paper increased
by 6.4 and 1.5, respectively (see Table 3).
With regard to specific disciplines, biological sciences witnessed the highest increase in the
number of papers, while the disciplines of life science and biological mechanisms and
functions witnessed the highest increase in citation counts.
We compared the results of the peer review methods with our estimation results. The three
teams that had obtained the highest peer review assessment were among the 13 teams shown
to have significant impact on the number of papers, in our estimation. Further, the two teams
that had received the highest peer review assessment were among the 5 teams shown to have
significant effects on the citation counts, in our estimation.
<Insert Table 3>
5.2 Information sciences and electrical and electronic engineering
In the field of information sciences, we found a statistically significant increase in the number
of citations. The main results are given below.
The number of papers per researcher per year increased from 1.75 to 2.32 after the
introduction of the COE program (Δ0.57). The COE effect accounted for 0.02, which was
not statistically significant. The citation counts per paper increased from 5.89 to 8.12 after

13
the implementation of the program. Of the total increase (Δ2.23), the COE effect was 1.49,
which was statistically significant at the 5% level.
We obtained statistically significant results for the number of papers by 4 teams out of a
total of 20. Statistically significant results were also obtained for the citation counts of 5
teams.
Within national universities (15 teams), the number of papers per researcher per year
increased by 0.1; however, no such increase was found for the teams in the private
universities (5 teams). Further, citation counts per paper increased by 0.9 and 4.8,
respectively (see Table 4).
Classification of effects according to graduate course showed that graduate schools of
science and engineering witnessed the highest increase in citation counts.
Comparison of our estimation results with the peer review analysis showed the following:
one team, among 4, that received the highest peer review assessment had a significant effect
on the number of papers, in our model. Similarly, the team that received the highest peer
review assessment from among 5 teams had a significant impact on the citation counts, in
our analysis.
<Insert Table 4>
5.3 Chemistry and material sciences
In the fields of chemistry and material sciences, no statistically significant increase in numbers
of papers or citation counts was observed. The main results are summarized below.
The number of papers per researcher per year increased from 4.57 to 5.87 (Δ1.30). The COE
effect was 0.32, which was not statistically significant. Citation counts per paper increased
from 13.75 to 16.19 after the implementation of the program. COE was responsible for 0.12
of the total increase (Δ2.44), which was not statistically significant.
Statistically significant results were obtained for the number of papers authored by 2 teams
out of a total of 21 teams. Results were also statistically significant for the citation counts of
one team.
14
Within national universities (18 teams) and private universities (3 teams), the number of
papers per researcher per year increased by 0.3 and 0.4, respectively. The citation counts per
paper decreased by 0.1 and increased by 1.0, respectively (see Table 5).
Graduate schools of science experienced the highest increase both in the number of papers
and citation count.
The team that received the highest peer review assessment among 2 teams had significant
effects, in our model, on the number of papers. Further, one team that did not receive the
highest peer review assessment had significant effects, in our model, on the citation counts.
<Insert Table 5>
5.4 Humanities
Within humanities, we found a statistically significant increase in the number of papers. The
main results are as follows.
The number of papers per researcher per year increased from 0.12 to 0.19 after the
introduction of COE program (Δ0.07). The COE effect was 0.04, statistically significant
only at the 10% level. Citation counts per paper increased from 0.79 to 0.96 (Δ0.17).
Although COE effect was exclusively responsible for this increase in citations, the value
was not statistically significant.
We obtained statistically significant results for the number of papers, which were written by
2 out of 20 teams. However, no significant results were obtained for citation counts.
Within national and public universities (14 teams), the number of papers per researcher per
year increased by 0.1; however, no such increase was found for the teams in the private
universities (6 teams). Similarly, citation counts per paper increased by 0.2 and 0.1,
respectively (see Table 6).
Among graduate courses, the field of psychology witnessed the highest increase both of in
the number of papers and citation count.
The team that received the highest peer review assessment among 2 teams had significant
effect in terms of the number of papers, in our model.

15
<Insert Table 6>
5.5 Social sciences
In the field of social sciences, no statistically significant increase was observed for the number
of papers or citation counts. The main results are given below.
The number of papers per researcher per year increased from 0.15 to 0.23 after the COE
program. Of the total increase (Δ0.08), the COE effect accounted for 0.03, which was not
statistically significant. The citation counts per paper increased from 0.70 to 0.99 after the
implementation of the program (Δ0.29). The COE effect was 0.12, which was not a
statistically significant value.
We obtained statistically significant results for the number of papers from 3 out of 25 teams.
No such significant results were obtained for citation counts.
In national universities (17 teams) and private universities (8 teams), the number of papers
per researcher per year increased by 0.05 and decreased by 0.03, respectively. Citation
counts per paper increased by 0.29 and decreased by 0.03, respectively (see Table 7).
In terms of subject areas within the social sciences, economics and policy studies witnessed
the highest increase in the number of papers and citations. The relatively higher academic
performance in economics can be attributed to the fact that researchers in this field tend to
publish in international English journals more often than researchers working in the other
social sciences fields. The increase in the number of published economics papers was 0.12,
statistically significant at the 1% level. Although the increase in the number of citation
counts was 0.34, the value was not statistically significant.
The 3 teams having significantly positive impact on the number of papers in our analysis
had received the highest peer review assessments. However, 8 other teams that did not have
a significantly positive impact on the number of papers in our estimation fared well on the
peer review assessment because the training offered to the graduate students in their
universities and the novelty of their research studies were highly evaluated.
<Insert Table 7>

16
5.6 Medical sciences
A statistically significant increase in the number of papers and citations was reported in the
field of medical sciences. The main results are as under.
The number of papers per researcher per year increased from 4.22 to 6.71 once the COE
program was introduced (Δ2.49). The COE effect was 1.06, which was statistically
significant at the 1% level. Citation counts per paper increased from 25.22 to 31.17. The
COE effect was 3.43 of the total increase (Δ5.94), which was statistically significant at the
5% level.
We obtained statistically significant results for the number of papers from 15 teams out of a
total of 35 teams. Statistically significant results were also obtained for the citation counts
by 8 teams.
In national and public universities (26 teams) and private universities (9 teams), the number
of papers per researcher per year increased by 1.1 and 0.7, and citation counts per paper
increased by 4.1 and 2.6, respectively (see Table 8).
Graduate schools of medicine accounted for the highest increase in the number of papers
and citations.
Eleven of 15 teams that had a significantly positive effect on the number of papers in our
model had received the highest peer review assessment. Similarly, 5 of 8 teams with
significantly positive effects on the citation counts, in our model, had received the highest
the peer review assessment.
<Insert Table 8>
5.7 Mechanical, civil, architectural and other fields of engineering
In mechanical engineering and allied fields, we found a statistically significant increase in the
number of papers. The following are the main results.

17
The number of papers per researcher per year increased from 0.87 to 1.47 after the
introduction of the COE program. Of the total increase (Δ0.60), the COE effect was 0.34,
statistically significant at the 1% level. Moreover, the citation counts per paper increased
from 3.63 to 5.43 after the program was launched (Δ1.80). The COE effect was 0.42, which
was not statistically significant.
In terms of the number of papers, we obtained statistically significant results from 7 out of a
total of 22 teams. For citation counts, we obtained statistically significant results from 2
teams.
Comparison of the COE effects between national and public universities (17 teams) and
private universities (5 teams) showed that the number of papers per researcher per year
increased by 0.4 and decreased by 0.1, respectively. Further, citation counts per paper
increased by 0.9 and decreased by 1.0, respectively (see Table 9).
Out of a total of 7 teams that had a significant impact on the number of the papers in our
model, three teams had received a high peer review assessment. Similarly, the team that
received the highest peer review assessment was among the 2 teams that had a significantly
positive impact on the citation counts, in our model.
<Insert Table 9>
5.8 Mathematics, physics, and earth sciences
In the fields of mathematics, physics, and earth sciences, no statistically significant increase
was observed in the number of papers or citations. The main results are summarized below.
The number of papers per researcher per year increased from 1.88 to 2.31 after the
implementation of the COE program (Δ0.43). We found a negative COE effect of –0.15,
which was not statistically significant. The citation counts per paper increased from 9.20 to
10.59 once the program began. The COE effect accounted for –2.46 of the total increase
(Δ1.39). Because the before–after outcomes in the control group ( ControlBA ) exceeded those
of the treatment group ( TreatmentBA ), these fields have negative effects (see Eq.(5)).
We obtained statistically significant results for the number of papers authored by 1 out of a

18
total of 23 teams. No such significant results were obtained for the citation counts in any
team.
In national and public universities (21 teams) and private universities (2 teams), the number
of papers per researcher per year decreased by 0.1 and 0.3, respectively. Further, the citation
counts per paper decreased by 2.4 and 2.0, respectively (see Table 10).
Comparison between our estimation results and those of the peer review showed that one
team that had not received the highest peer review assessment had significant effects on the
number of papers in our model. The negative evaluation in the peer review assessment was
attributed to a decrease in the enrollment of doctoral course students and lack of novelty in
research achievements, which only seemed to extend conventional research.
<Insert Table 10>
6. Discussion and Conclusion
The results above confirm that the positive impact of the 21st COE program, measured in terms
of increase in the number of papers and citation counts, differs across research fields. The fields
of life sciences and medical sciences have experienced the maximum impact of the COE program,
both in terms of number of papers and citations. Having said that, one must also note that
research cycles are remarkably different across fields, and the level and scale of the achievements
in each research field before the introduction of the program was not the same (see Table 2). For
instance, there are a great number of Japanese books and journals in the fields of social sciences
and humanities5.
Haddow and Genoni (2010) compared the four-tier ranking of the Australian social science
journals by Excellence in Research for Australia (ERA) with the citation-based indicators for
these journals derived from WoS and Scopus databases. They showed that the correlation
between the journal rank and citation counts was low. Further, the database coverage of journals
in the social sciences was poor, whereas natural sciences journals were more easily cited, with
shorter time lag between publication and citation. 5 In future, we may perform a DID estimation using the number of Japanese books in these fields along with English-only journal papers and citations, from another database.

19
One of the limitations of this study is that we may not have succeeded in accurately capturing
the research trends specific to each field of study as we did not include the publications in
proceedings. Only journal articles were used in this analysis, because they are considered as final
achievements. We calculated the ratio of publications in proceedings for the teams that had a
significantly positive impact on the papers and citations. In the field of life sciences, this ratio
was 5%, whereas it was 44% in the information sciences.
The differences, as mentioned above, in the research and education styles across fields make it
difficult to determine the field that received the highest policy impact. One of the best approaches
to adjust for the differences among fields and to compensate for this demerit of quantitative
bibliometrics is the peer review. Bibliometric indexes play a supporting role and supplement the
peer review with important information (Rinia et al., 1998). Thus, evaluation by a field-specific
expert, as in a peer review, and econometric analysis, based on an individual researcher’s
achievements, have different merits and demerits.
In our study, we identified a few discrepancies between the results of the econometric analysis
and the peer review. For instance, despite their significantly positive impact on the number of
papers or citations, some teams did not fare well in the peer review. This was because peer
reviews typically offered unfavorable evaluations for aspects related to the training of researchers
and their collaborative research within a team. In other cases, the peer reviewers felt that research
papers lacked novelty or original thought.
On the other hand, some teams that did not have a statistically significant impact on the
number of papers or citation counts in our model received a favorable peer review assessment.
This could be attributed to the highly positive evaluation of the training and research uniqueness.
Our study also has the following limitations. First, the educational component of the COE
program was as important as the research component, and it aimed to develop excellent
researchers. Although a peer review considers these aspects, we did not use any index to evaluate
these educational aspects of the program. Second, it is difficult to evaluate the creativity and
novelty of research activities through number of papers and citations in a short-term (five years)
evaluation. For a more effective evaluation, both peer reviews and econometric evaluation
methods should be used together.

20
References
Anderson, R., Narin, F. and McAllister, P., 1978. Publication Ratings versus Peer Ratings of
Universities. Journal of The American Society for Information Science 29, 91-103.
Bozeman, B. and Gaughan, M., 2007. Impacts of Grants and Contracts on Academic Researchers’
Interactions with Industry. Research Policy 36, 694-707.
Cameron, A. and Trivedi, P. (2005). Microeconometrics: Methods and Applications. Cambrige
University Press, pp.860-898.
Committee for Research Evaluations, 2008. Present Status of Research Evaluations and its
Future in Japan. Science Council of Japan.
Dawid, A., 1979. Conditional Independence in Statistical Theory. Journal of the Royal Statistical
Society, Series B(Methodological) 41, 1-31.
Dietz, J. and Bozeman, B., 2005. Academic Careers, Patents, and Productivity: Industry
Experience as Scientific and Technical Human Capital. Research Policy 34, 349-367.
Gaughan, M. and Bozeman,B., 2002. Using Curriculum Vitae to Compare Some Imapcts of NSF
Research Grants with Research Center Funding. Research Evaluation 11, 17-26.
Gaughan, M. and Ponomariov, B., 2008. Faculty Publication Productivity, Collaboration, and
Grants Velocity: Using Curricula Vitae to Compare Center-Affiliated and Unaffiliated
Scientists. Research Evaluation 17, 103-110.
Gaughan, M., 2009. Using the Curriculum Vitae for Policy Research: An Evaluation of National
Institutes of Health Center and Training Support on Career Trajectories. Research
Evaluation 18, 117-124.
Gibbons, M. and Georghiou, L., 1987. Evaluation of Research: A Selection of Current Practices.
Organisation for Economic Co-operation and Development, Paris.
Haddow, G and Genoni,P., 2010. Citation Analysis and Peer Ranking of Australian Social
Science Journals. Scientometrics 85, 471-487.
Hall, B., Jaffe, A. and Trajtenberg, M., 2000. Market Value and Patent Citations: A First Look.
NBER Working Paper 7741.
Hall, B., Jaffe, A. and Trajtenberg, M., 2001. The NBER Patent Citations Data File: Lessons,
Insights and Methodological Tools. NBER Working Paper 8498.
Harhoff, D., Narin, F., Scherer, F. and Vopel, K., 1999. Citation Frequency and the Value of

21
Patented Inventions. The Review of Economics and Statistics 81, 511-515.
Heckman, J. and Robb, R., (1985). Alternative Methods for Evaluating the Impact of
Interventions, in Heckman,J. and Singer, B. eds. Longitudinal Analysis of Labor Market
Data, New York: Cambridge University Press, pp.156-245.
Jaffe, A. and Lerner, J., 2001. Reinviting Public R&D: Patent Policy and the Commercialization
of National Laboratory Technologies. RAND Journal of Economics 32, 167-198.
Jaffe, A. and Trajtenberg, M., 1996. Flows of Knowledge from Universities and Federal
Laboratories: Modeling the flow of Patent Citations over Time and Across Institutional and
Geographic Boundaries. Proceedings of the National Academy of Sciences 93,
12671-12677.
Jaffe, A., Trajtenberg, M. and Fogarty, M., 2000. The Meaning of Patent Citations: Report of the
NBER/Case-Western Reserve Survey of Patentees. NBER Working Paper 7631.
Kostoff, R., 1994. Federal Research Impact Assessment: State-of-the-Art. Journal of the
American Society for Information Science 45, 428-440.
Lanjouw, J. and Schankerman, M., 1999. The Quality of Ideas: Measuring Innovation with
Multiple Indicators. NBER Working Paper 7345.
Lee, M.-J., 2005. Micro-Econometrics for Policy, Program, and Treatment Effects. New York,
Oxford University Press.
Meho, L. and Yang, K., 2007. Impact of Data Sources on Citation Counts and Rankings of LIS
Faculty: Web of Science versus Scopus and Google Scholar. Journal of the American
Society for Information Science and Technology 58, 2105-2125.
Norris, M. and Oppenheim, C., 2007. Comparing Alternatives to the Web of Science for
Coverage of the Social Sciences' Literature. Journal of Informetrics 1, 161-169.
Oppenheim, C., 1995. The Correlation Between Citation Counts and the 1992 Research
Assessment Exercise Ratings for British Library and Information Science University
Departments. Journal of Documentation 51, 18-27.
Oppenheim, C., 1997. The Correlation Between Citation Counts and the 1992 Research
Assessment Exercise Ratings for British Research in Genetics. Anatomy and Archaeology.
Journal of Documentation 53, 477-487.
Rinia, E., van Leeuwen, Th., van Vuren, H. and van Raan, A., 1998. Comparative Analysis of a
Set of Bibliometric Indicators and Central Peer Review Criteria Evaluation of Condensed
22
Matter Physics in the Netherlands. Research Policy 27, 95-107.
Rinia, E., van Leeuwen, Th., van Vuren, H., and van Raan, A., 2001. Influence of
Interdisciplinarity on Peer-Review and Bibliometric Evaluations in Physics Research.
Research Policy 30, 357-361.
Rosenbaum, P. and Rubin, D., 1983. The Central Role of the Propensity Score in Observational
Studies for Causal Effects. Biometrika 70, 41-55.
Stock, J. and Watson, M., (2007). Introduction to Econometrics: International ed.
Pearson/Addison-Wesley, 2nd ed., pp.468-519.
Wooldridge, J., (2002). Econometric Analysis of Cross Section and Panel Data. The MIT Press,
pp.603-643.
Zhu, J., Meadows, A. and Mason, G., 1991. Citations and Departmantal Research Ratings.
Scientometrics 21, 171-179.

Figure 1: The Difference-in-differences estimator
Difference-in-differences
y
Selection bias
Time period
Treatment group
Control group
BATreatment
BAControl
BAControl
Source: We created this figure based on Stock and Watson(2007), p.482.

24
Table 1: The number of researchers, teams, and the result of the researcher’s self-check

25
Table 2: The DID estimation results for the eight sciences fields

26
Table 3: The increased effects classified according to the universities and the major in the life sciences

27
Table 4: The increased effects classified according to the universities and the major in the information sciences

28
Table 5: The increased effects classified according to the universities and the major in the chemistry, material sciences

29
Table 6: The increased effects classified according to the universities and the major in the humanities

30
Table 7: The increased effects classified according to the universities and the major in the social sciences

31
Table 8: The increased effects classified according to the universities and the major in the medical sciences

32
Table 9: The increased effects classified according to the universities and the major in the mechanical engineering

33
Table 10: The increased effects classified according to the universities and the major in the mathematics and physics