Embed Size (px)
Citation preview
Limnetica, 29 (2): x-xx (2011)Limnetica, 30 (2): 347-362 (2011)c© Asociacion Iberica de Limnologıa, Madrid. Spain. ISSN: 0213-8409
Effects of landscape metrics and land-use variables onmacroinvertebrate communities and habitat characteristics
Rui M. Cortes1, ∗, Simone Varandas1, Amılcar Teixeira3, Samantha Jane Hughes1, MarcoMagalhaes1 Jose Barquın2, Mario Alvarez-Cabria2 and Diego Fernandez2
1 CITAB, UTAD, Apartado 1013, 5001-811Vila Real, Portugal.2 Environmental Hydraulics Institute, University of Cantabria.3 CIMO, ESA, Instituto Politecnico de Braganca, Campus de Santa Apolonia-Apartado 1172, 5301-855Braganca, Portugal.
∗ Corresponding author: [email protected]
Received: 22/6/2010 Accepted: 10/5/2011
ABSTRACT
Effects of landscape metrics and land-use variables on macroinvertebrate communities and habitat characteristics
The growing number of studies establishing links between stream biota, environmental factors and river classification hascontributed to a better understanding of fluvial ecosystem function. Environmental factors influencing river systems aredistributed over hierarchically organised spatial scales. We used a nested hierarchical sampling design across four catchmentsto assess how benthic macroinvertebrate community composition and lower spatial scale habitat descriptors were shapedby landscape and land-use patterns. We found that benthic macroinvertebrate community structure and composition variedsignificantly from catchment to habitat level. We assessed and identified fractal metrics of landscape descriptors capableof explaining compositional and functional change in the benthic faunal indicators and compared them with the traditionalvariables describing land use and reach level habitat descriptors within a 1 km radius of each sampling site. We found thatfractal landscape metrics were the best predictor variables for benthic macroinvertebrate community composition, function,instream habitat and river corridor characteristics.
Key words: Fractal landscape metrics, land use, macroinvertebrates, habitat, spatial scale.
RESUMEN
Efecto de las variables metricas del paisaje y de los usos del suelo sobre las caracterısticas de las comunidades demacroinvertebrados y de los habitats
El creciente numero de estudios que relacionan la biota fluvial, los factores ambientales y la clasificacion de los rıos,ha contribuido a comprender el funcionamiento de los ecosistemas fluviales. La organizacion de los factores ambientalesfluviales es entendida, en la actualidad, como una jerarquıa de factores con varias escalas espaciales. Para evaluar como lacomposicion de los macroinvertebrados bentonicos y las caracterısticas del habitat a escala local son afectadas por el usodel paisaje y del suelo, se siguio un diseno de muestreo jerarquico en cuatro cuencas. Hemos verificado que la estructuray composicion de las comunidades de macroinvertebrados bentonicos vario significativamente desde la escala de cuencahasta la del habitat. Fueron evaluadas e identificadas metricas fractales del paisaje que podrıan explicar los cambios enla composicion y funcionalidad de la fauna bentonica y se ha comparado tambien con la influencia de las tradicionalesvariables de usos del suelo y descriptores del habitat al nivel del tramo, en un cırculo de 1 km de radio alrededor de cadatramo. Encontramos que las metricas fractales del paisaje fueron las mejores variables predictoras de la composicion yfuncionalidad de las comunidades de macroinvertebrados y de las caracterısticas del habitat en el cauce y del corredorfluvial.
Palabras clave: Metricas fractales del paisaje, usos del suelo, macroinvertebrados, habitat, escala espacial, tipologıa.
348 Rui et al.
INTRODUCTION
River ecosystems are structured across a strongspatial hierarchy, descending from higher spatialscales, such as ecoregion and catchment, to lowerspatial scales, such as reach, habitat and micro-habitat (Allan Erickson & Fay 1997, Lamouroux,Doledec and Gayraud, 2004). Local, smaller-scale abiotic and biotic features are nested within,and therefore constrained and controlled by, suc-cessively larger-scale factors that act as environ-mental filters (Frissell et al., 1986; Poff, 1997;Davies et al., 2000; Allan, 2004a; Hughes et al.,2008). This spatial filtering process shapes bio-logical diversity at a given site, creating a distinctsubset from the original pool of potential colonis-ers that passes through the system of environ-mental filters, which can include changes due tohuman intervention (Heino et al., 2002; Boyero,2003; Bonada et al., 2005; Hughes et al., 2008).
According to Poff (1997), the functional sig-nificance of changes detected in macroinverte-brate traits is relative to both qualitative andquantitative habitat conditions located at thelower end of the spatial scale of the environ-mental filters. For example, energy source type(e.g., allochthonous versus autochthonous input)will influence the trophic group and the foragingmode traits. The quantity of the energy sourcewill influence the relative abundance levels.
Several studies have highlighted the importanceof the interactions of higher scale factors, such asgeology, climate and landscape-level factors (e.g.,land use and vegetation patterns) in shaping thelocal habitat characteristics and the benthic faunalcomposition, traits and metrics (Lammert & Allan,1999; Joy & Death, 2004; Hughes et al., 2008).Hughes et al. (2008) found that both the basinlevel environmental variables (e.g., geology andtemperature) and the pressure of changes in landuse influenced the macroinvertebrate commu-nity composition and metrics in an intermittentMediterranean river in southern Portugal.
Other studies have emphasised how localscale features, such as ecohydraulics or micro-habitat quality (Boyero, 2003; Heino et al., 2004;Merigoux & Doledec, 2004; Sandin & John-son, 2004), influence macroinvertebrate abun-
dance, metrics and functional feeding groups.Factors considered in these studies ranged fromreach scale (e.g., dominant flow type, streamdepth/width relationship and riparian composi-tion/structure), to habitat and microhabitat scale(e.g., substrate composition, maximum currentvelocity and hydraulic stress).
More recent studies have focused on the de-pendence of local hydromorphological characteris-tics on catchment level features and land use, espe-cially the suitability of reach or catchment scalevegetation as predictors of in-stream features (Al-lan, 2004b; Buffagni et al., 2009; Sandin, 2009).However, spatial scale effects are often diffi-cult to interpret, due to the innate complexityof the physical habitat produced by the interac-tion of many multi-scale environmental variablesand the limitations and lack of standardisationbe-tween the river habitat assessmentmethodologies.
These findings highlight the need for integra-tive habitat assessment strategies that incorporateinformation from relevant spatial scales (Corteset al., 2009). These are aspects already incor-porated into methodologies proposed in severaldifferent field surveys, such as the River HabitatSurvey (RHS) and Qualitat del Bosc de Ribera(“QBR” riparian forest quality index) (e.g., Pratet al. 2003, Raven, 1998, Raven et al. 2002). De-spite the apparent contradictions and difficulties,consideration of the spatial hierarchy of fluvialecosystems is crucial for identifying associationsbetween the different spatial levels, allowing ha-bitat features, processes and communities to belinked. Such knowledge is essential for devel-oping appropriate management and monitoringmeasures (Sandin, 2009) because many effectsof human pressure on aquatic habitats are spreadover several spatial scales (Hughes et al., 2008).
Using a nested approach, the objectives of thisstudy were to (i) determine how benthic macroin-vertebrate community composition and traits areshaped by hierarchically organised landscapepatterns and land-use variables, possibly reflect-ing disturbance; (ii) determine the contributionof different environmental factors observed atdifferent spatial scales; and (iii) assess the de-pendence of lower spatial scale descriptors ofphysical habitat and river corridor attributes on
Effects of landscape metrics and land use on macroinvertebrates 349
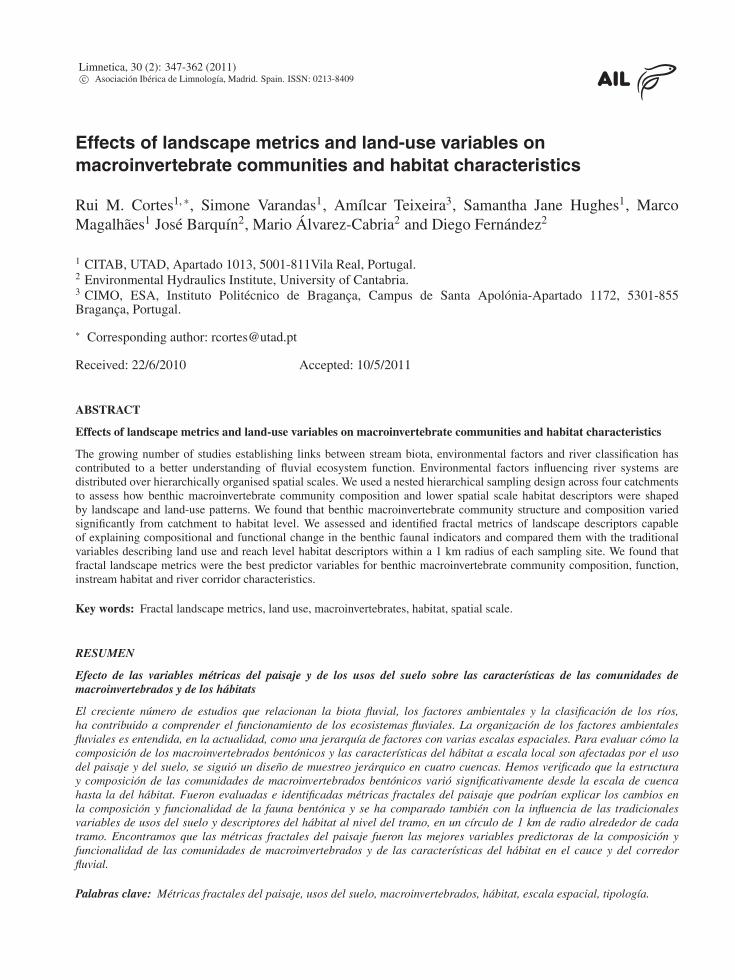
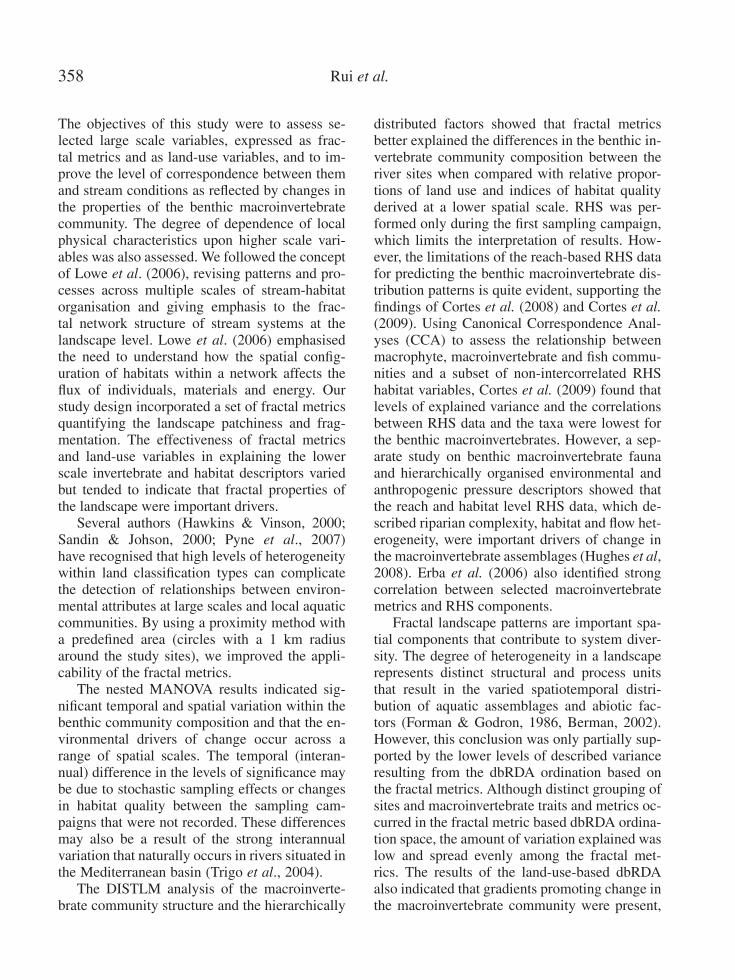
Figure 1. Location of the 15 study sites along the Olo, Corgo, Pinhao and Tua rivers in the Douro catchment in northern Portugal.Study sites are spread along the longitudinal axis of the main rivers except in the Tua catchment, which was sampled only in the lowersection. Localizacion de los 15 puntos de muestreo en los rıos Olo, Corgo, Pinhao y Tua, todos de la cuenca del Duero, Norte dePortugal. Los puntos de muestreo se encuentran repartidos a lo largo del eje longitudinal del rıo principal, excepto para la cuencadel Tua, la cual fue solo muestreada en la seccion mas baja.
larger surrounding land-use patterns. We anal-ysed higher scale landscape and land-use pat-terns within a fixed buffer zone around each siteand lower scale physical instream habitat assess-ment data derived from River Habitat Survey(RHS), the official method for assessing WaterFramework Directive (WFD) lotic hydromorpho-logical support elements in Portugal and theUnited Kingdom. All features subject to anal-ysis originated from comparable spatial scalesalong stream segments. The results from thisstudy should contribute to the future developmentof river habitat assessment methods by recordingspatially relevant information regarding key fea-tures that determine community distribution pat-terns, which can subsequently be applied in rivermanagement programmes.
METHODS
Study Area
The study area comprises four sub-catchments ofthe Douro basin, namely the rivers Olo, Corgo,
Pinhao and Tua (Fig. 1, Table 1). All of theserivers are high gradient streams ranging in alti-tude from 50 m to 1100 m. The rivers cover arange of conditions, from almost completely pris-tine areas (the Olo, Pinhao and Tua catchments)to areas affected by agriculture, especially vine-yards, in particular the downstream sections ofthe Corgo and Pinhao. The upstream segmentsdrain maritime pine and oak forests mixed withshrub and grassland areas.
The study sites were distributed along the lengthof the main river channels with the exception ofthe Tua catchment, which was only sampled inthe lower section (Fig. 1). The streams range from2nd to 6th order (Strahler classification), flow-ing through granite and schist bedrocks, result-ing in low background conductivity values (20-200 µS). The principal sources of disturbanceinclude forest fire and consequent soil loss andagricultural non-pointdiffusepollution in the down-streamsections.Only theRiverCorgo exhibits clearsigns of eutrophication from point source con-tamination of food industry effluents, urban run-off, and wastewater treatment plants (Table 2).
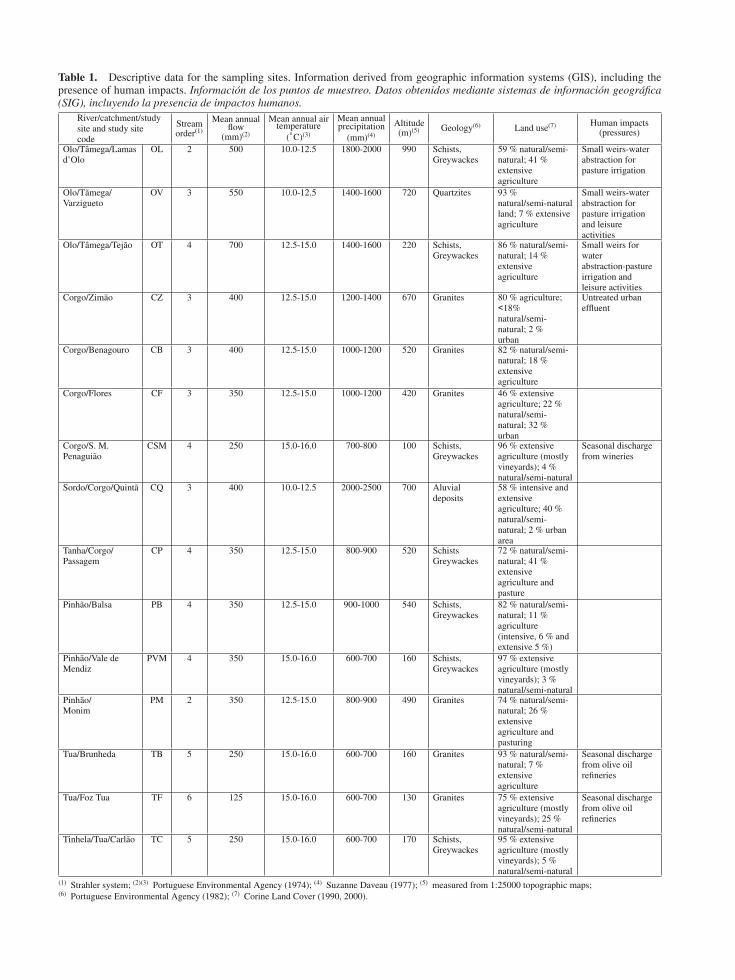
Table 1. Descriptive data for the sampling sites. Information derived from geographic information systems (GIS), including thepresence of human impacts. Informacion de los puntos de muestreo. Datos obtenidos mediante sistemas de informacion geografica(SIG), incluyendo la presencia de impactos humanos.
River/catchment/studysite and study sitecode
Streamorder(1)
Mean annualflow
(mm)(2)
Mean annual airtemperature
(◦C)(3)
Mean annualprecipitation
(mm)(4)
Altitude(m)(5) Geology(6) Land use(7) Human impacts
(pressures)
Olo/Tamega/Lamasd’Olo
OL 2 500 10.0-12.5 1800-2000 990 Schists,Greywackes
59 % natural/semi-natural; 41 %extensiveagriculture
Small weirs-waterabstraction forpasture irrigation
Olo/Tamega/Varzigueto
OV 3 550 10.0-12.5 1400-1600 720 Quartzites 93 %natural/semi-naturalland; 7 % extensiveagriculture
Small weirs-waterabstraction forpasture irrigationand leisureactivities
Olo/Tamega/Tejao OT 4 700 12.5-15.0 1400-1600 220 Schists,Greywackes
86 % natural/semi-natural; 14 %extensiveagriculture
Small weirs forwaterabstraction-pastureirrigation andleisure activities
Corgo/Zimao CZ 3 400 12.5-15.0 1200-1400 670 Granites 80 % agriculture;<18%natural/semi-natural; 2 %urban
Untreated urbaneffluent
Corgo/Benagouro CB 3 400 12.5-15.0 1000-1200 520 Granites 82 % natural/semi-natural; 18 %extensiveagriculture
Corgo/Flores CF 3 350 12.5-15.0 1000-1200 420 Granites 46 % extensiveagriculture; 22 %natural/semi-natural; 32 %urban
Corgo/S. M.Penaguiao
CSM 4 250 15.0-16.0 700-800 100 Schists,Greywackes
96 % extensiveagriculture (mostlyvineyards); 4 %natural/semi-natural
Seasonal dischargefrom wineries
Sordo/Corgo/Quinta CQ 3 400 10.0-12.5 2000-2500 700 Aluvialdeposits
58 % intensive andextensiveagriculture; 40 %natural/semi-natural; 2 % urbanarea
Tanha/Corgo/Passagem
CP 4 350 12.5-15.0 800-900 520 SchistsGreywackes
72 % natural/semi-natural; 41 %extensiveagriculture andpasture
Pinhao/Balsa PB 4 350 12.5-15.0 900-1000 540 Schists,Greywackes
82 % natural/semi-natural; 11 %agriculture(intensive, 6 % andextensive 5 %)
˜Pinhao/Vale deMendiz
PVM 4 350 15.0-16.0 600-700 160 Schists,Greywackes
97 % extensiveagriculture (mostlyvineyards); 3 %natural/semi-natural
Pinhao/Monim
PM 2 350 12.5-15.0 800-900 490 Granites 74 % natural/semi-natural; 26 %extensiveagriculture andpasturing
Tua/Brunheda TB 5 250 15.0-16.0 600-700 160 Granites 93 % natural/semi-natural; 7 %extensiveagriculture
Seasonal dischargefrom olive oilrefineries
Tua/Foz Tua TF 6 125 15.0-16.0 600-700 130 Granites 75 % extensiveagriculture (mostlyvineyards); 25 %natural/semi-natural
Seasonal dischargefrom olive oilrefineries
Tinhela/Tua/Carlao TC 5 250 15.0-16.0 600-700 170 Schists,Greywackes
95 % extensiveagriculture (mostlyvineyards); 5 %natural/semi-natural
(1) Strahler system; (2)(3) Portuguese Environmental Agency (1974); (4) Suzanne Daveau (1977); (5) measured from 1:25000 topographic maps;(6) Portuguese Environmental Agency (1982); (7) Corine Land Cover (1990, 2000).
Effects of landscape metrics and land use on macroinvertebrates 351
Biological characterisation
A hierarchical nested design was used for sam-pling benthic macroinvertebrate communities at15 sites across the four catchments to capturethe typological gradients and assess how factorsrelated to changes in land use have modified thephysical and biological components of the riversacross the study sites (see Heino, Louhi andMuotka, 2004). At each site, we defined threetransects with 3 microhabitats (replicates) withineach transect. The macroinvertebrate communi-ties were sampled at the same sites and at thesame time of year (May/June) in 2006 and 2007using a Surber sampler (20 × 20 cm frame) ran-domly located along the transects. A total of 270samples were collected and sorted in the labora-tory. Organisms were preserved in 70 % ethanol
and identified to genus level for most taxonomicfamilies (except Diptera and Oligochaeta).
To assess the relationship between the envi-ronmental variables and the benthic fauna, ma-croinvertebrate community composition, metricsand trait data were used to determine the mostsuitable approach for identifying the effects ofland use on the aquatic biota. Traits express theadaptation of an organism to the surroundingconditions (e.g., respiration, locomotion or tro-phic group), providing additional information re-garding the effect of environmental changes onriver biota and ecosystem function.
Environmental characterisation
We used environmental variables from landscapeand reach levels of observation. Landscape and
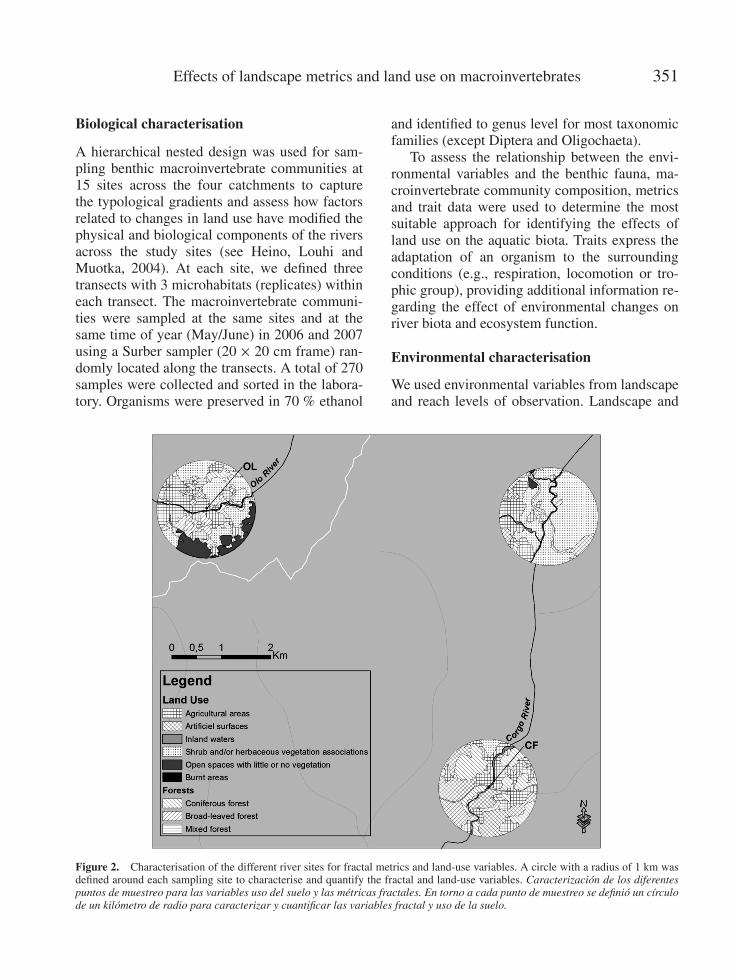
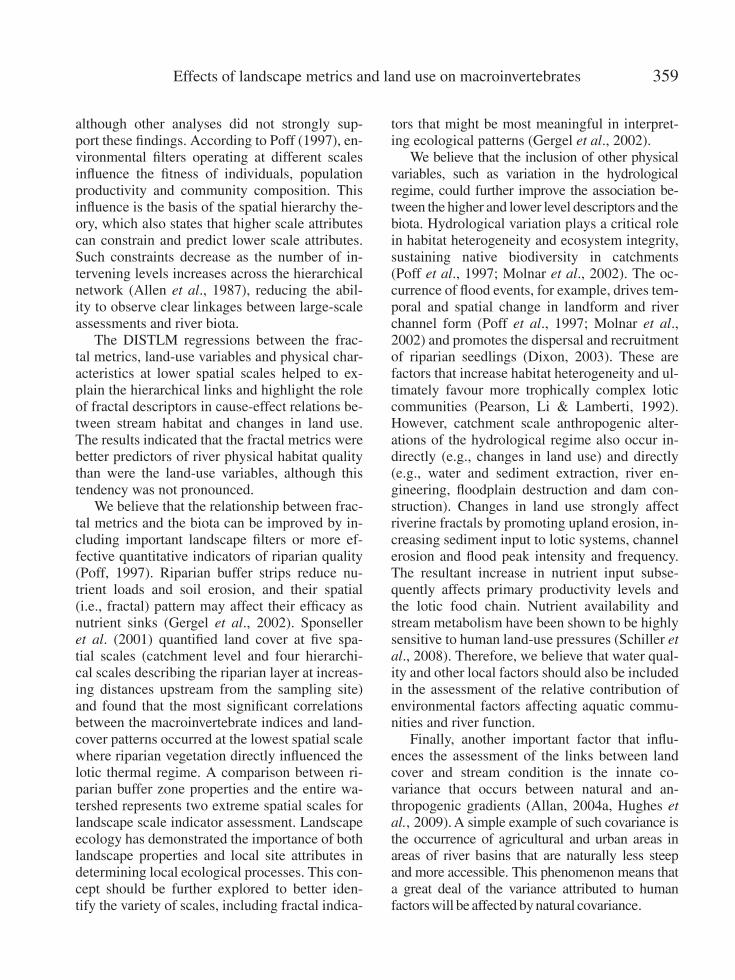
Figure 2. Characterisation of the different river sites for fractal metrics and land-use variables. A circle with a radius of 1 km wasdefined around each sampling site to characterise and quantify the fractal and land-use variables. Caracterizacion de los diferentespuntos de muestreo para las variables uso del suelo y las metricas fractales. En torno a cada punto de muestreo se definio un cırculode un kilometro de radio para caracterizar y cuantificar las variables fractal y uso de la suelo.
352 Rui et al.
land-use data were obtained from Corine Land-cover. Several authors (e.g., Hawkins & Vin-son, 2000; Sandin & Johnson, 2000; Pyne et al.,2007) have mentioned the absence of strong as-sociations between environmental descriptors athigher spatial scales and local aquatic communi-ties, due to the high levels of heterogeneity withineach land cover classification type. To over-come this potential limitation, we used a prox-imity method, defining a circle with a radius of1 km around each site (Fig. 2).
We applied fractal and non-fractal metrics tothe landscape data. Fractal metrics describe thesize, shape and interspersion of patches, whichare essentially individual polygons or contigu-ous sets of cells. Non-fractal metrics describethe relative proportions of different classes/landuses, i.e., they group patches together that sharethe same attribute. Six fractal metrics were ap-plied to each of the eight types of land use de-fined, giving a total of 48 variables (Table 2). TheRiver Habitat Survey methodology was used torecord reach scale physical habitat characteristics(RHS; Raven et al., 1997, Raven et al. 1998). TheSTAR project (Furse et al, 2006), which anal-ysed the interaction of different biological qual-ity elements (macroinvertebrates, macrophytes,diatoms, fish, hydro-morphology and chemistry)over a wide geographical range and between
stream types, also used RHS for preliminary test-ing of links between selected invertebrates met-rics and modification in rivers. These results in-dicated that selected macroinvertebrate metricswere highly correlated with features recordedby RHS (Erba et al, 2006). For these rea-sons, and because RHS is the selected metho-dology for assessing WFD lotic hydromorpho-logical support elements in Portugal, we appliedthis methodology in the field.
RHS assesses habitat quality over a 500 mreach and within a 50 m buffer on each bank.Features such as channel substrate, flow type,habitat features, aquatic vegetation types, bankvegetation structure and artificial modificationswere recorded at 10 transects (“spot checks”) at50 m intervals along the 500 m reach. Obser-vations (“sweep up”) were also made along the500 m reach to include features not describedat each spot-check (e.g., counts of natural andman-made features or riparian vegetation). RHSalso records hydromorphological measurementstaken at a representative cross-section of the500 m reach and the presence of key taxa.
RHS data were used to derive two indices,namely, the Habitat Quality Assessment (HQA)and the Habitat Modification Score (HMS).The HQA comprises the sum of scores of 9sub-indices covering physical habitat, vegetation
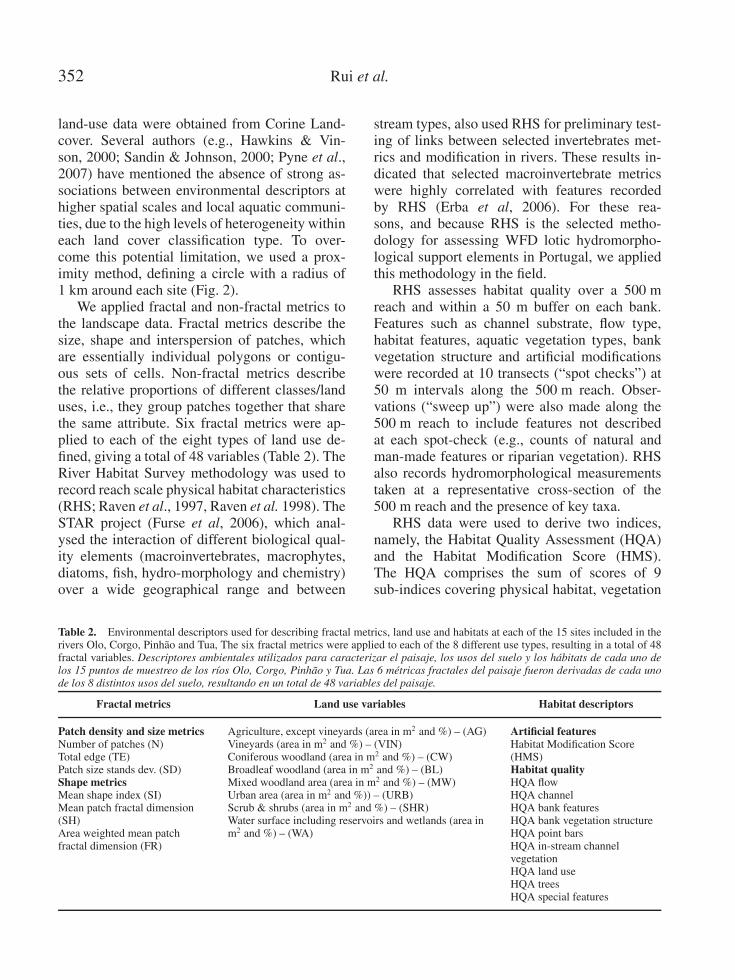
Table 2. Environmental descriptors used for describing fractal metrics, land use and habitats at each of the 15 sites included in therivers Olo, Corgo, Pinhao and Tua, The six fractal metrics were applied to each of the 8 different use types, resulting in a total of 48fractal variables. Descriptores ambientales utilizados para caracterizar el paisaje, los usos del suelo y los habitats de cada uno delos 15 puntos de muestreo de los rıos Olo, Corgo, Pinhao y Tua. Las 6 metricas fractales del paisaje fueron derivadas de cada unode los 8 distintos usos del suelo, resultando en un total de 48 variables del paisaje.
Fractal metrics Land use variables Habitat descriptors
Patch density and size metricsNumber of patches (N)Total edge (TE)Patch size stands dev. (SD)Shape metricsMean shape index (SI)Mean patch fractal dimension(SH)Area weighted mean patchfractal dimension (FR)
Agriculture, except vineyards (area in m2 and %) – (AG)Vineyards (area in m2 and %) – (VIN)Coniferous woodland (area in m2 and %) – (CW)Broadleaf woodland (area in m2 and %) – (BL)Mixed woodland area (area in m2 and %) – (MW)Urban area (area in m2 and %)) – (URB)Scrub & shrubs (area in m2 and %) – (SHR)Water surface including reservoirs and wetlands (area inm2 and %) – (WA)
Artificial featuresHabitat Modification Score(HMS)Habitat qualityHQA flowHQA channelHQA bank featuresHQA bank vegetation structureHQA point barsHQA in-stream channelvegetationHQA land useHQA treesHQA special features
Effects of landscape metrics and land use on macroinvertebrates 353
cover, hydrodynamic characteristics of the riverchannel and adjacent land use. The HMS quanti-fies the extent of modification (e.g., the presenceof weirs, bank protections, water diversions andabstractions) along the channel (Table 2).
Slight modifications, such as key taxa andtypes of human modification, were introducedto the RHS methodology to account for thegeographical location. RHS was carried out ateach site the same time as the biological inven-tories during the first year; we assumed RHScharacteristics remained unchanged in the 2nd
year. The environmental descriptors were takenfrom the sub-indices derived from the RHSdata that contribute to the final score of theHQA index and the HMS (Table 2).
Statistical Analysis
Prior to all analyses, a non-redundant subset oflandscape parameters was derived to avoid multi-collinearity. Redundant environmental and pres-sure parameters were removed using the Spear-man Rank Correlation analysis method (Heringet al., 2006a, c; Feld & Hering, 2007). If twoenvironmental or pressure variables were highlycorrelated (with a threshold value of r ≥ 0.7) thevariable with a higher overall mean correlationcoefficient was excluded from further analysis.
We performed a nested permutational multi-variate analysis of variance (MANOVA) using areduced Bray Curtis Coefficient based model toanalyse the dependence of the biological assem-blages upon the three spatial levels of observation,namely, the basin, mesohabitat and microhabitat.All of the spatial levels were considered to befixed factors. MANOVA calculates the pseudo-Fstatistic, which is equivalent to the original Fstatistic in traditional ANOVA but does not have aknowndistributionunder a true null hypothesis.
Following MANOVA analyses, we determinedthe principal environmental factors contributingto change in the macroinvertebrate communitystructure at each spatial scale by running threeseparate multiple non-parametric regressionsfrom distance-based linear models (DISTLM)between macroinvertebrate taxa (dependent vari-ables; genus level data of taxa occurring at
≤ 2 sampling sites were excluded) and RHS-derived habitat quality sub-indices, land-use vari-ables and fractal metrics (independent variables;see Table 2). Following the regression analyses,Akaike’s informationcriterion (AIC;Akaike 1973,Akaike 1974) was used to extract the variablesthat significantly increased the amount of explainedvariation, therebyoptimising the globalAIC.
Distance-based redundancy analysis (dbRDA)was computed with the benthic faunal metricssensitive to contamination, land use and fractalmetrics to determine how fractal patterns anddisturbance shaped river function as described bythe macroinvertebrate traits. As with DISTLM,
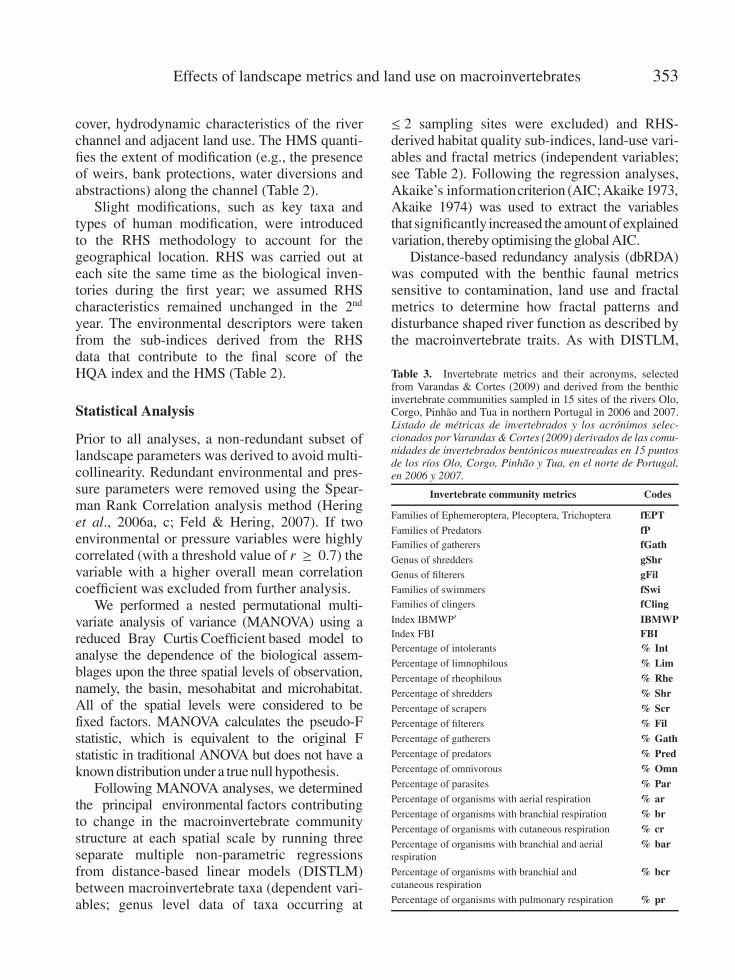
Table 3. Invertebrate metrics and their acronyms, selectedfrom Varandas & Cortes (2009) and derived from the benthicinvertebrate communities sampled in 15 sites of the rivers Olo,Corgo, Pinhao and Tua in northern Portugal in 2006 and 2007.Listado de metricas de invertebrados y los acronimos selec-cionados por Varandas & Cortes (2009) derivados de las comu-nidades de invertebrados bentonicos muestreadas en 15 puntosde los rıos Olo, Corgo, Pinhao y Tua, en el norte de Portugal,en 2006 y 2007.
Invertebrate community metrics Codes
Families of Ephemeroptera, Plecoptera, Trichoptera fEPTFamilies of Predators fPFamilies of gatherers fGathGenus of shredders gShrGenus of filterers gFilFamilies of swimmers fSwiFamilies of clingers fCling
Index IBMWP′ IBMWPIndex FBI FBIPercentage of intolerants % IntPercentage of limnophilous % LimPercentage of rheophilous % RhePercentage of shredders % ShrPercentage of scrapers % ScrPercentage of filterers % FilPercentage of gatherers % GathPercentage of predators % PredPercentage of omnivorous % OmnPercentage of parasites % ParPercentage of organisms with aerial respiration % arPercentage of organisms with branchial respiration % brPercentage of organisms with cutaneous respiration % crPercentage of organisms with branchial and aerialrespiration
% bar
Percentage of organisms with branchial andcutaneous respiration
% bcr
Percentage of organisms with pulmonary respiration % pr
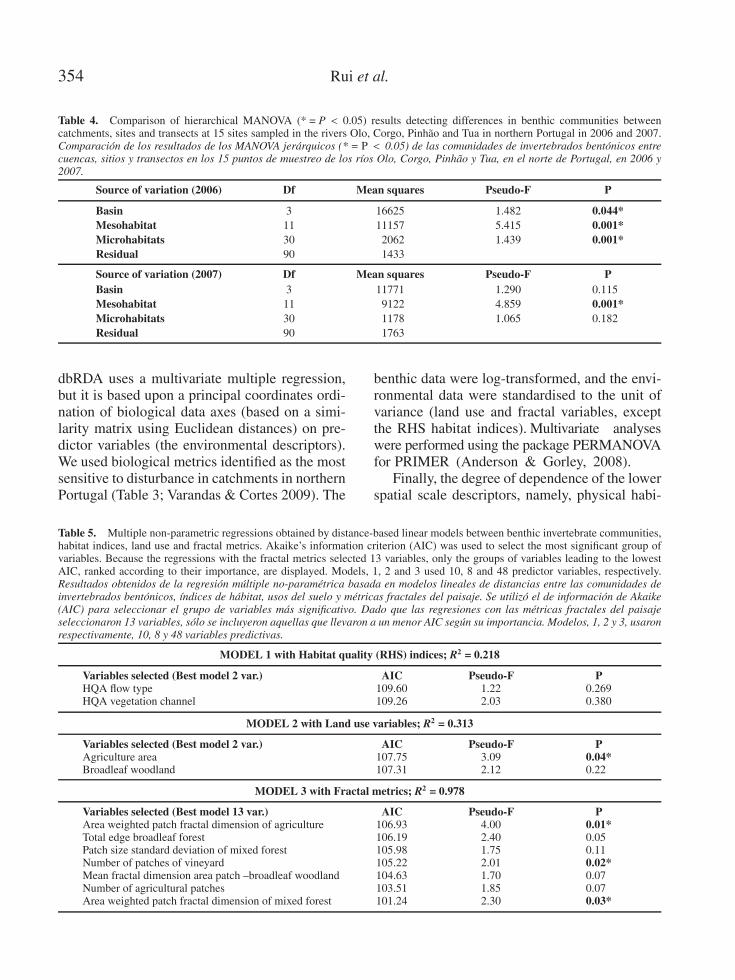
354 Rui et al.
Table 4. Comparison of hierarchical MANOVA (* = P < 0.05) results detecting differences in benthic communities betweencatchments, sites and transects at 15 sites sampled in the rivers Olo, Corgo, Pinhao and Tua in northern Portugal in 2006 and 2007.Comparacion de los resultados de los MANOVA jerarquicos (* = P < 0.05) de las comunidades de invertebrados bentonicos entrecuencas, sitios y transectos en los 15 puntos de muestreo de los rıos Olo, Corgo, Pinhao y Tua, en el norte de Portugal, en 2006 y2007.
Source of variation (2006) Df Mean squares Pseudo-F P
Basin 3 16625 1.482 0.044*Mesohabitat 11 11157 5.415 0.001*Microhabitats 30 12062 1.439 0.001*Residual 90 11433
Source of variation (2007) Df Mean squares Pseudo-F PBasin 3 11771 1.290 0.115*Mesohabitat 11 19122 4.859 0.001*Microhabitats 30 11178 1.065 0.182*Residual 90 11763
dbRDA uses a multivariate multiple regression,but it is based upon a principal coordinates ordi-nation of biological data axes (based on a simi-larity matrix using Euclidean distances) on pre-dictor variables (the environmental descriptors).We used biological metrics identified as the mostsensitive to disturbance in catchments in northernPortugal (Table 3; Varandas & Cortes 2009). The
benthic data were log-transformed, and the envi-ronmental data were standardised to the unit ofvariance (land use and fractal variables, exceptthe RHS habitat indices). Multivariate analyseswere performed using the package PERMANOVAfor PRIMER (Anderson & Gorley, 2008).
Finally, the degree of dependence of the lowerspatial scale descriptors, namely, physical habi-
Table 5. Multiple non-parametric regressions obtained by distance-based linear models between benthic invertebrate communities,habitat indices, land use and fractal metrics. Akaike’s information criterion (AIC) was used to select the most significant group ofvariables. Because the regressions with the fractal metrics selected 13 variables, only the groups of variables leading to the lowestAIC, ranked according to their importance, are displayed. Models, 1, 2 and 3 used 10, 8 and 48 predictor variables, respectively.Resultados obtenidos de la regresion multiple no-parametrica basada en modelos lineales de distancias entre las comunidades deinvertebrados bentonicos, ındices de habitat, usos del suelo y metricas fractales del paisaje. Se utilizo el de informacion de Akaike(AIC) para seleccionar el grupo de variables mas significativo. Dado que las regresiones con las metricas fractales del paisajeseleccionaron 13 variables, solo se incluyeron aquellas que llevaron a un menor AIC segun su importancia. Modelos, 1, 2 y 3, usaronrespectivamente, 10, 8 y 48 variables predictivas.
MODEL 1 with Habitat quality (RHS) indices; R2 = 0.218
Variables selected (Best model 2 var.)HQA flow typeHQA vegetation channel
AIC109.60109.26
Pseudo-F1.222.03
P0.2690.380
MODEL 2 with Land use variables; R2 = 0.313
Variables selected (Best model 2 var.)Agriculture areaBroadleaf woodland
AIC107.75107.31
Pseudo-F3.092.12
P0.04*0.22
MODEL 3 with Fractal metrics; R2 = 0.978
Variables selected (Best model 13 var.)Area weighted patch fractal dimension of agricultureTotal edge broadleaf forestPatch size standard deviation of mixed forestNumber of patches of vineyardMean fractal dimension area patch –broadleaf woodlandNumber of agricultural patchesArea weighted patch fractal dimension of mixed forest
AIC106.93106.19105.98105.22104.63103.51101.24
Pseudo-F4.002.401.752.011.701.852.30
P0.01*0.050.110.02*0.070.070.03*
Effects of landscape metrics and land use on macroinvertebrates 355
tat and river corridor attributes, on the sur-rounding larger scale environmental conditionswas also assessed using DISTLM between theRHS indices (HQA and HMS), the fractal me-trics and the land-use factors.
RESULTS
The MANOVA results revealed several significantassociations (Table 4; P < 0.05) between spa-tial hierarchy (i.e., independent factors of basin,mesohabitat and microhabitats) and the benthicmacroinvertebrate assemblage (the dependent fac-tor). Significant associations were identified acrossall spatial scales for the first sampling year (2006),especially at the lower spatial scales of mesohabitatand microhabitats. The only statistically significantassociation detected in the second year (2007)was at the mesohabitat level (Table 4). The resultsclearly show interannual variation in the statisticalstrengthof these associations ( p < 0.05).
The results of the multiple non-parametric re-gressions from the distance-based linear mod-els (DISTLM) between the macroinvertebratetaxa and the hierarchically organised variablesof habitat quality (Table 5) clearly highlightedhow fractal metrics (particularly the fractal di-mensions of broadleaf forest, agricultural patchesand the number of vineyard patches; p < 0.05)and land use (agriculture; p < 0.05) appear tostrongly shape benthic composition when com-pared with RHS descriptors of habitat quality(R2 = 0.978 for the fractal metrics, R2 = 0.313for land use and R2 = 0.218 for the RHS indices;Table 5). However, care must be taken in inter-preting these results by directly comparing the R-values because each model used a different num-bers of predictors. The larger number of variablesin the final model, for example, contributed to thehigher R2 value for this analysis.
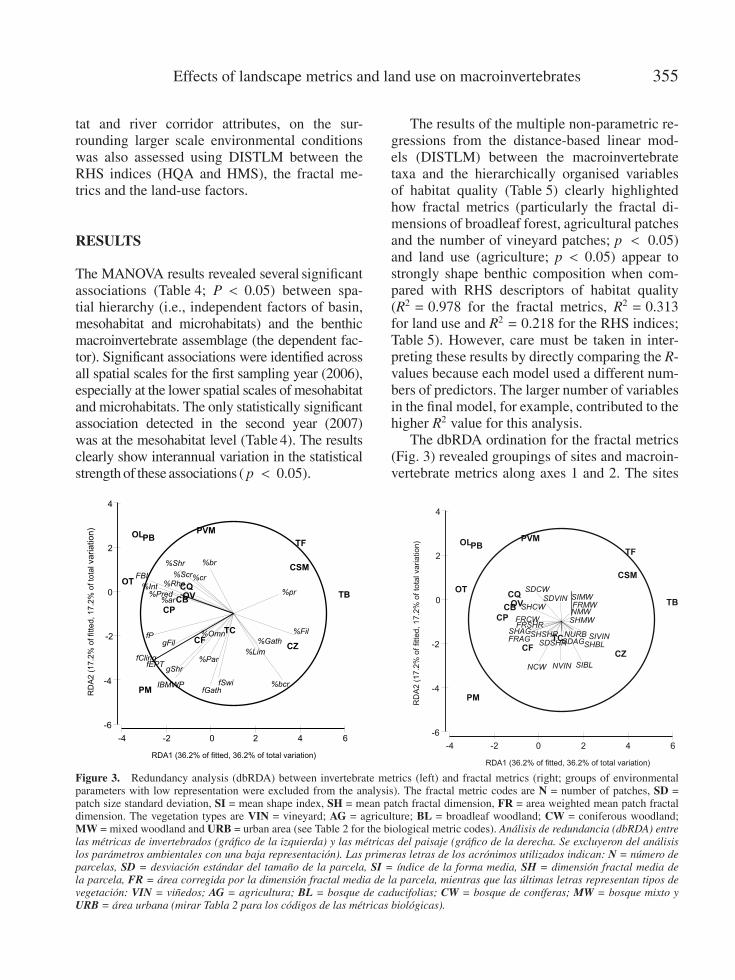
The dbRDA ordination for the fractal metrics(Fig. 3) revealed groupings of sites and macroin-vertebrate metrics along axes 1 and 2. The sites
-4 -2 0 2 4 6
RDA1 (36.2% of fitted, 36.2% of total variation)
-6
-4
-2
0
2
4
CZ
CSM
CP
PVM
CQ
PB
TB
TF
TC
PM
CB
CF
OV
OL
OT
NCW NVIN
NMW
NURBSDAG
SDCWSDVIN
SDSHRSIVIN
SIMW
SIBL
SHSHRSHAG
SHCW
SHMW
SHBL
FRSHR
FRAG
FRCW
FRMW
RD
A2 (
17.2
%of
fitt
ed, 1
7.2
%of
tota
lvariatio
n)
-4 -2 0 2 4
RDA1 (36.2% of fitted, 36.2% of total variation)
-6
-4
0
2
4
CZ
CSM
CP
PVM
CQ
PB
TB
TC
PM
CB
CF
OV
OL
OT
%br
%Rhe
%Shr
RD
A2 (
17.2
% o
f fitted, 17.2
% o
f to
talva
ria
tio
n)
-2
%Pred
%Fil
%Gath
%Lim
%bcrfGath
fSwi
%Par
IBMWP
gShr
fP
%cr
%OmngFil
fClingfEPT
FBI
%Int
%Scr
%ar
6
%pr
TF
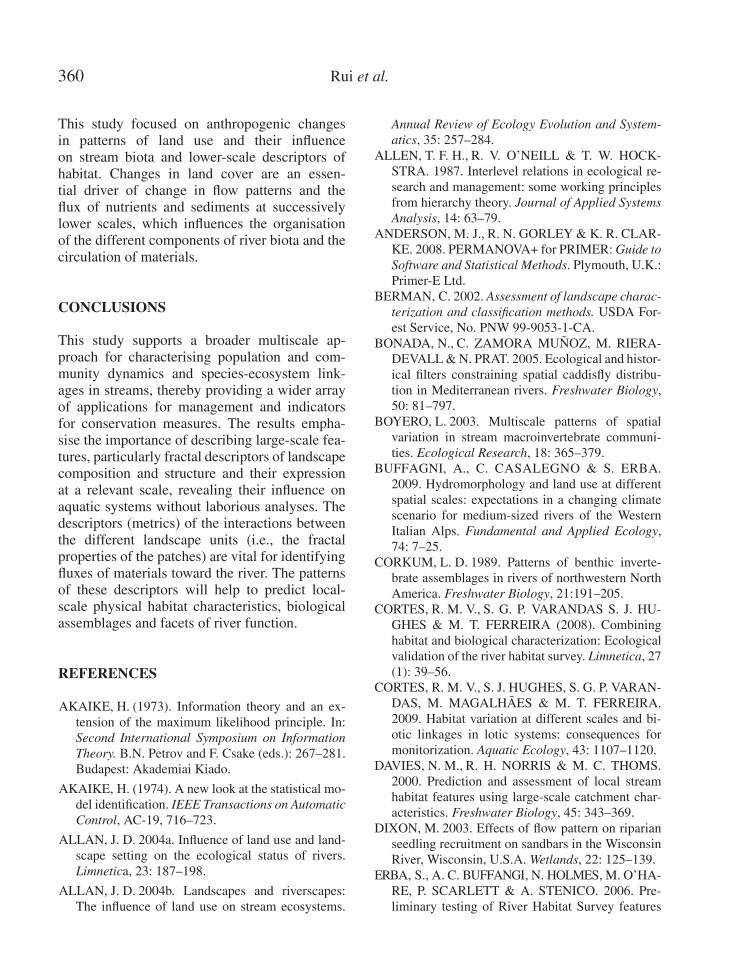
Figure 3. Redundancy analysis (dbRDA) between invertebrate metrics (left) and fractal metrics (right; groups of environmentalparameters with low representation were excluded from the analysis). The fractal metric codes are N = number of patches, SD =patch size standard deviation, SI = mean shape index, SH = mean patch fractal dimension, FR = area weighted mean patch fractaldimension. The vegetation types are VIN = vineyard; AG = agriculture; BL = broadleaf woodland; CW = coniferous woodland;MW = mixed woodland and URB = urban area (see Table 2 for the biological metric codes). Analisis de redundancia (dbRDA) entrelas metricas de invertebrados (grafico de la izquierda) y las metricas del paisaje (grafico de la derecha. Se excluyeron del analisislos parametros ambientales con una baja representacion). Las primeras letras de los acronimos utilizados indican: N = numero deparcelas, SD = desviacion estandar del tamano de la parcela, SI = ındice de la forma media, SH = dimension fractal media dela parcela, FR = area corregida por la dimension fractal media de la parcela, mientras que las ultimas letras representan tipos devegetacion: VIN = vinedos; AG = agricultura; BL = bosque de caducifolias; CW = bosque de conıferas; MW = bosque mixto yURB = area urbana (mirar Tabla 2 para los codigos de las metricas biologicas).
356 Rui et al.
from the rivers Corgo and Tua were clearly sepa-rated from remaining sites along axis 1, whereassites on the River Olo were separated along axis2. The sites in the upper left quadrant (all of theRiver Olo sites and two sites along the RiverPinhao) were grouped according to fractal me-trics describing properties of coniferous wood-land and macroinvertebrate metrics describing agreater percentage of shredders, scrapers and cu-taneous or branchial modes of respiration. Theincreased percentage of intolerant macroinver-tebrates and the higher FBI index values in-dicated the presence of essentially stenobionticorganisms. Sites in the lower left hand quad-rant (from the River Tua, River Corgo and theRiver Pinhao) were predominantly characterisedby agricultural fractal metrics and macroinverte-brate metrics describing trophic traits (e.g., gen-era of shredders, genera of filterers, families ofgatherers, and families of predators) and habit orlocomotion (e.g., families of clingers and fami-lies of swimmers). Higher values for the IBMWPand the EPT metrics also occurred at these sites.The sites in the upper right-hand quadrant (fromthe Rivers Tua and Corgo) were characterisedby fractal metrics of mixed woodland with lower
values of the biological metrics and traits previ-ously described. The single site in the lower rightquadrant (from the River Corgo (CZ)), separatedalong both axes 1 and 2, was of low quality with amixture of fractalmetrics describing a highly frag-mented landscape consisting of vineyards, ur-ban areas, agriculture and broadleaf woodlands.
The macroinvertebrate metrics and traits de-scribed the presence of filter-feeders, branchial/cutaneous and pulmonary respiration and a pre-dominance of gatherers. The lack of any stronggradient associated with the fractal metrics in theordination space, revealed by the short length ofthe associated arrows, suggests that the level of ex-plained variationwas evenly divided between them.
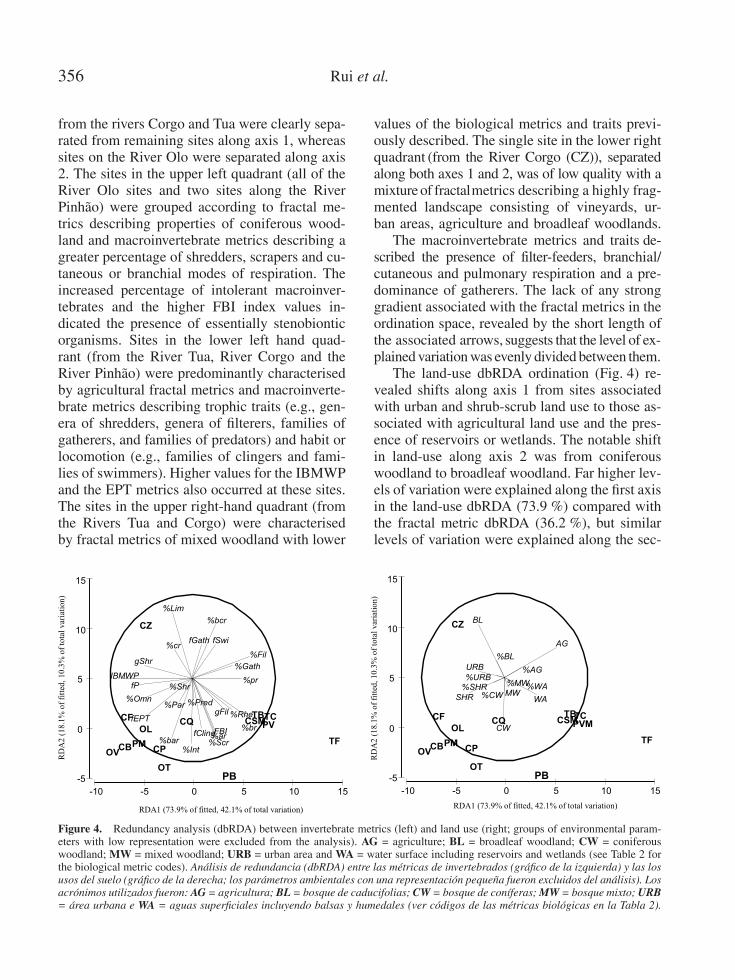
The land-use dbRDA ordination (Fig. 4) re-vealed shifts along axis 1 from sites associatedwith urban and shrub-scrub land use to those as-sociated with agricultural land use and the pres-ence of reservoirs or wetlands. The notable shiftin land-use along axis 2 was from coniferouswoodland to broadleaf woodland. Far higher lev-els of variation were explained along the first axisin the land-use dbRDA (73.9 %) compared withthe fractal metric dbRDA (36.2 %), but similarlevels of variation were explained along the sec-
-10 -5 0 5 10 15
RDA1 (73.9% of fitted, 42.1% of total variation)
-5
0
5
10
15
CZ
CSM
CP
PVMCQ
PB
TB
TF
TC
PMCB
CF
OV
OL
OT
AG
%AG
CW
%CW
BL
%BL
MW
%MW
URB
%URB
WA
%WA
SHR
%SHR
RD
A2
(18.1
%o
ffi
tted
,10
.3%
of
tota
lv
aria
tio
n)
-10 -5 0 5 10 15
RDA1 (73.9% of fitted, 42.1% of total variation)
-5
0
5
10
15
CZ
CSM
CP
PVCQ
PB
TB
TF
TC
PMCB
CF
OV
OL
OT
RD
A2
(18.1
%o
ffi
tted
,10
.3%
of
tota
lv
aria
tio
n)
%br
%Pred
%Fil
%Gath
%Lim
%bcr
fGath fSwi
%Par
IBMWP
gShr
fP
%Omn
gFil
fCling
fEPT
%ar
%Rhe
%Shr
%cr
%Int%Scr
FBI
%pr
%bar
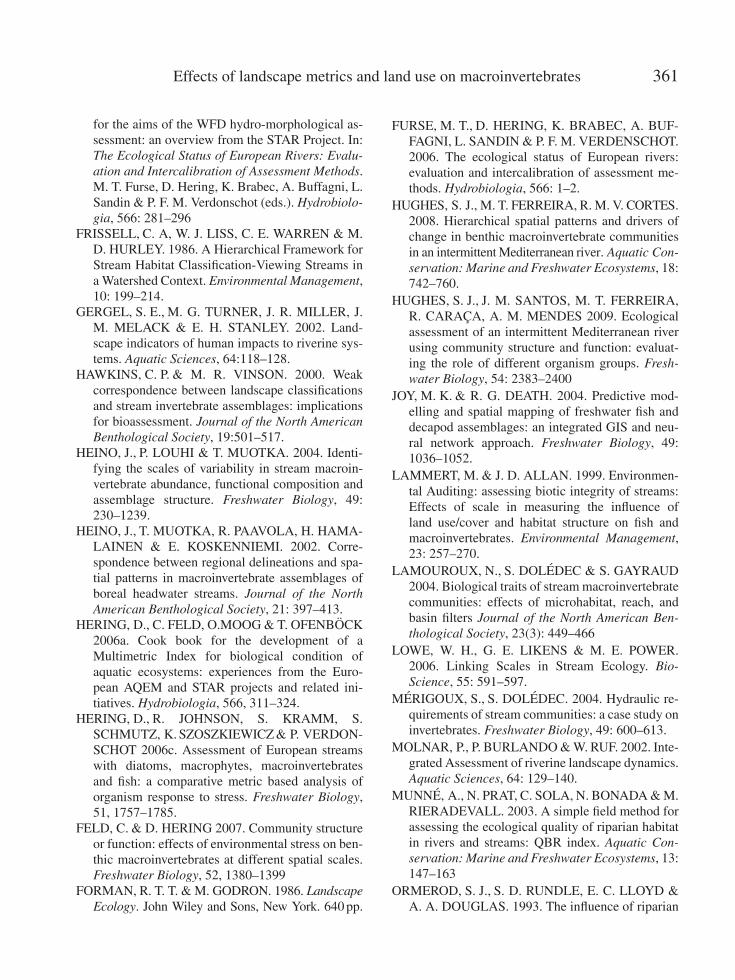
Figure 4. Redundancy analysis (dbRDA) between invertebrate metrics (left) and land use (right; groups of environmental param-eters with low representation were excluded from the analysis). AG = agriculture; BL = broadleaf woodland; CW = coniferouswoodland; MW = mixed woodland; URB = urban area and WA = water surface including reservoirs and wetlands (see Table 2 forthe biological metric codes). Analisis de redundancia (dbRDA) entre las metricas de invertebrados (grafico de la izquierda) y las losusos del suelo (grafico de la derecha; los parametros ambientales con una representacion pequena fueron excluidos del analisis). Losacronimos utilizados fueron: AG = agricultura; BL = bosque de caducifolias; CW = bosque de conıferas; MW = bosque mixto; URB= area urbana e WA = aguas superficiales incluyendo balsas y humedales (ver codigos de las metricas biologicas en la Tabla 2).
Effects of landscape metrics and land use on macroinvertebrates 357
ond axis of each analysis (18.1 % for the land-usedbRDA, 17.2 % for the fractal dbRDA).
The marked IBMWP gradient along axis 1 didnot appear to be strongly matched with any par-ticular type of land use, although stronger associ-ations could be detected with the fEPT metric andthe presence of shrub-scrub. The strongest as-sociations in the ordination space were betweenbroadleaf woodland and the presence of highernumbers of cutaneous respiring organisms, agri-cultural woodland and the presence of greaternumbers of filterers and gatherers and conifer-ous woodland and the presence of greater num-bers of intolerant organisms and branchial andaerial modes of respiration. As seen previously,the site CZ on the River Corgo was isolatedin the ordination space and was associated withbroadleaf woodland land use but with no particu-lar macroinvertebrate metric or trait. Macroinver-tebrate traits and metrics expressed as percent-ages tended to exhibit slightly stronger gradientsin the land-use ordination space. This pattern wasnot apparent in the fractal metric based dbRDA.
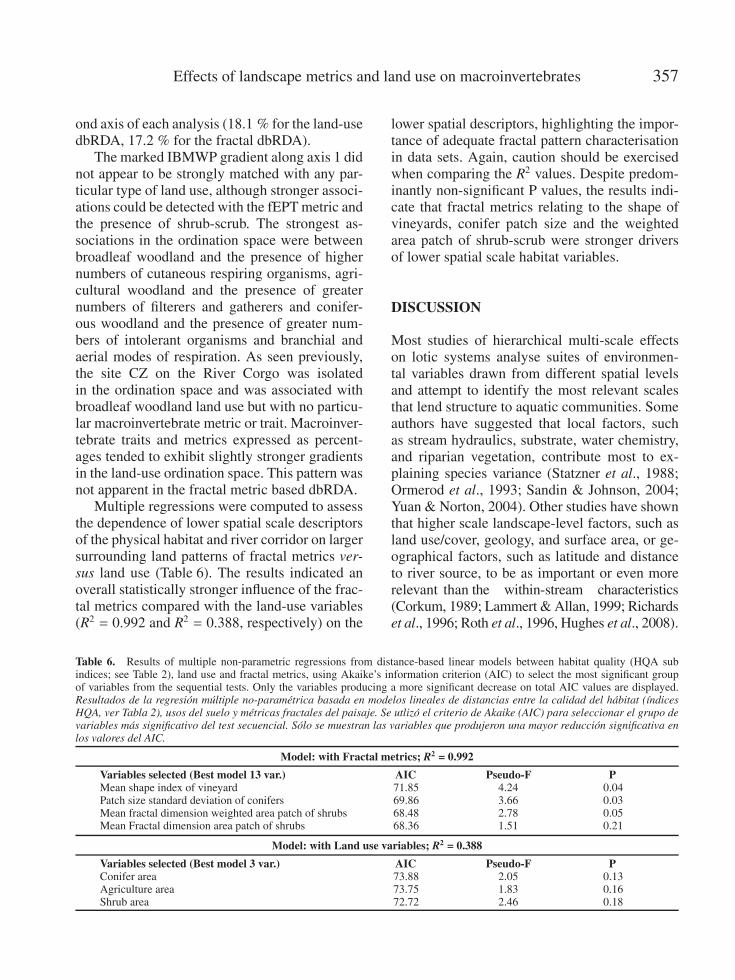
Multiple regressions were computed to assessthe dependence of lower spatial scale descriptorsof the physical habitat and river corridor on largersurrounding land patterns of fractal metrics ver-sus land use (Table 6). The results indicated anoverall statistically stronger influence of the frac-tal metrics compared with the land-use variables(R2 = 0.992 and R2 = 0.388, respectively) on the
lower spatial descriptors, highlighting the impor-tance of adequate fractal pattern characterisationin data sets. Again, caution should be exercisedwhen comparing the R2 values. Despite predom-inantly non-significant P values, the results indi-cate that fractal metrics relating to the shape ofvineyards, conifer patch size and the weightedarea patch of shrub-scrub were stronger driversof lower spatial scale habitat variables.
DISCUSSION
Most studies of hierarchical multi-scale effectson lotic systems analyse suites of environmen-tal variables drawn from different spatial levelsand attempt to identify the most relevant scalesthat lend structure to aquatic communities. Someauthors have suggested that local factors, suchas stream hydraulics, substrate, water chemistry,and riparian vegetation, contribute most to ex-plaining species variance (Statzner et al., 1988;Ormerod et al., 1993; Sandin & Johnson, 2004;Yuan & Norton, 2004). Other studies have shownthat higher scale landscape-level factors, such asland use/cover, geology, and surface area, or ge-ographical factors, such as latitude and distanceto river source, to be as important or even morerelevant than the within-stream characteristics(Corkum, 1989; Lammert & Allan, 1999; Richardset al., 1996; Roth et al., 1996, Hughes et al., 2008).
Table 6. Results of multiple non-parametric regressions from distance-based linear models between habitat quality (HQA subindices; see Table 2), land use and fractal metrics, using Akaike’s information criterion (AIC) to select the most significant groupof variables from the sequential tests. Only the variables producing a more significant decrease on total AIC values are displayed.Resultados de la regresion multiple no-parametrica basada en modelos lineales de distancias entre la calidad del habitat (ındicesHQA, ver Tabla 2), usos del suelo y metricas fractales del paisaje. Se utlizo el criterio de Akaike (AIC) para seleccionar el grupo devariables mas significativo del test secuencial. Solo se muestran las variables que produjeron una mayor reduccion significativa enlos valores del AIC.
Model: with Fractal metrics; R2 = 0.992
Variables selected (Best model 13 var.)Mean shape index of vineyardPatch size standard deviation of conifersMean fractal dimension weighted area patch of shrubsMean Fractal dimension area patch of shrubs
AIC71.8569.8668.4868.36
Pseudo-F4.243.662.781.51
P0.040.030.050.21
Model: with Land use variables; R2 = 0.388
Variables selected (Best model 3 var.)Conifer areaAgriculture areaShrub area
AIC73.8873.7572.72
Pseudo-F2.051.832.46
P0.130.160.18
358 Rui et al.
The objectives of this study were to assess se-lected large scale variables, expressed as frac-tal metrics and as land-use variables, and to im-prove the level of correspondence between themand stream conditions as reflected by changes inthe properties of the benthic macroinvertebratecommunity. The degree of dependence of localphysical characteristics upon higher scale vari-ables was also assessed. We followed the conceptof Lowe et al. (2006), revising patterns and pro-cesses across multiple scales of stream-habitatorganisation and giving emphasis to the frac-tal network structure of stream systems at thelandscape level. Lowe et al. (2006) emphasisedthe need to understand how the spatial config-uration of habitats within a network affects theflux of individuals, materials and energy. Ourstudy design incorporated a set of fractal metricsquantifying the landscape patchiness and frag-mentation. The effectiveness of fractal metricsand land-use variables in explaining the lowerscale invertebrate and habitat descriptors variedbut tended to indicate that fractal properties ofthe landscape were important drivers.
Several authors (Hawkins & Vinson, 2000;Sandin & Johson, 2000; Pyne et al., 2007)have recognised that high levels of heterogeneitywithin land classification types can complicatethe detection of relationships between environ-mental attributes at large scales and local aquaticcommunities. By using a proximity method witha predefined area (circles with a 1 km radiusaround the study sites), we improved the appli-cability of the fractal metrics.
The nested MANOVA results indicated sig-nificant temporal and spatial variation within thebenthic community composition and that the en-vironmental drivers of change occur across arange of spatial scales. The temporal (interan-nual) difference in the levels of significance maybe due to stochastic sampling effects or changesin habitat quality between the sampling cam-paigns that were not recorded. These differencesmay also be a result of the strong interannualvariation that naturally occurs in rivers situated inthe Mediterranean basin (Trigo et al., 2004).
The DISTLM analysis of the macroinverte-brate community structure and the hierarchically
distributed factors showed that fractal metricsbetter explained the differences in the benthic in-vertebrate community composition between theriver sites when compared with relative propor-tions of land use and indices of habitat qualityderived at a lower spatial scale. RHS was per-formed only during the first sampling campaign,which limits the interpretation of results. How-ever, the limitations of the reach-based RHS datafor predicting the benthic macroinvertebrate dis-tribution patterns is quite evident, supporting thefindings of Cortes et al. (2008) and Cortes et al.(2009). Using Canonical Correspondence Anal-yses (CCA) to assess the relationship betweenmacrophyte, macroinvertebrate and fish commu-nities and a subset of non-intercorrelated RHShabitat variables, Cortes et al. (2009) found thatlevels of explained variance and the correlationsbetween RHS data and the taxa were lowest forthe benthic macroinvertebrates. However, a sep-arate study on benthic macroinvertebrate faunaand hierarchically organised environmental andanthropogenic pressure descriptors showed thatthe reach and habitat level RHS data, which de-scribed riparian complexity, habitat and flow het-erogeneity, were important drivers of change inthe macroinvertebrate assemblages (Hughes et al,2008). Erba et al. (2006) also identified strongcorrelation between selected macroinvertebratemetrics and RHS components.
Fractal landscape patterns are important spa-tial components that contribute to system diver-sity. The degree of heterogeneity in a landscaperepresents distinct structural and process unitsthat result in the varied spatiotemporal distri-bution of aquatic assemblages and abiotic fac-tors (Forman & Godron, 1986, Berman, 2002).However, this conclusion was only partially sup-ported by the lower levels of described varianceresulting from the dbRDA ordination based onthe fractal metrics. Although distinct grouping ofsites and macroinvertebrate traits and metrics oc-curred in the fractal metric based dbRDA ordina-tion space, the amount of variation explained waslow and spread evenly among the fractal met-rics. The results of the land-use-based dbRDAalso indicated that gradients promoting change inthe macroinvertebrate community were present,
Effects of landscape metrics and land use on macroinvertebrates 359
although other analyses did not strongly sup-port these findings. According to Poff (1997), en-vironmental filters operating at different scalesinfluence the fitness of individuals, populationproductivity and community composition. Thisinfluence is the basis of the spatial hierarchy the-ory, which also states that higher scale attributescan constrain and predict lower scale attributes.Such constraints decrease as the number of in-tervening levels increases across the hierarchicalnetwork (Allen et al., 1987), reducing the abil-ity to observe clear linkages between large-scaleassessments and river biota.
The DISTLM regressions between the frac-tal metrics, land-use variables and physical char-acteristics at lower spatial scales helped to ex-plain the hierarchical links and highlight the roleof fractal descriptors in cause-effect relations be-tween stream habitat and changes in land use.The results indicated that the fractal metrics werebetter predictors of river physical habitat qualitythan were the land-use variables, although thistendency was not pronounced.
We believe that the relationship between frac-tal metrics and the biota can be improved by in-cluding important landscape filters or more ef-fective quantitative indicators of riparian quality(Poff, 1997). Riparian buffer strips reduce nu-trient loads and soil erosion, and their spatial(i.e., fractal) pattern may affect their efficacy asnutrient sinks (Gergel et al., 2002). Sponselleret al. (2001) quantified land cover at five spa-tial scales (catchment level and four hierarchi-cal scales describing the riparian layer at increas-ing distances upstream from the sampling site)and found that the most significant correlationsbetween the macroinvertebrate indices and land-cover patterns occurred at the lowest spatial scalewhere riparian vegetation directly influenced thelotic thermal regime. A comparison between ri-parian buffer zone properties and the entire wa-tershed represents two extreme spatial scales forlandscape scale indicator assessment. Landscapeecology has demonstrated the importance of bothlandscape properties and local site attributes indetermining local ecological processes. This con-cept should be further explored to better iden-tify the variety of scales, including fractal indica-
tors that might be most meaningful in interpret-ing ecological patterns (Gergel et al., 2002).
We believe that the inclusion of other physicalvariables, such as variation in the hydrologicalregime, could further improve the association be-tween the higher and lower level descriptors and thebiota. Hydrological variation plays a critical rolein habitat heterogeneity and ecosystem integrity,sustaining native biodiversity in catchments(Poff et al., 1997; Molnar et al., 2002). The oc-currence of flood events, for example, drives tem-poral and spatial change in landform and riverchannel form (Poff et al., 1997; Molnar et al.,2002) and promotes the dispersal and recruitmentof riparian seedlings (Dixon, 2003). These arefactors that increase habitat heterogeneity and ul-timately favour more trophically complex loticcommunities (Pearson, Li & Lamberti, 1992).However, catchment scale anthropogenic alter-ations of the hydrological regime also occur in-directly (e.g., changes in land use) and directly(e.g., water and sediment extraction, river en-gineering, floodplain destruction and dam con-struction). Changes in land use strongly affectriverine fractals by promoting upland erosion, in-creasing sediment input to lotic systems, channelerosion and flood peak intensity and frequency.The resultant increase in nutrient input subse-quently affects primary productivity levels andthe lotic food chain. Nutrient availability andstream metabolism have been shown to be highlysensitive to human land-use pressures (Schiller etal., 2008). Therefore, we believe that water qual-ity and other local factors should also be includedin the assessment of the relative contribution ofenvironmental factors affecting aquatic commu-nities and river function.
Finally, another important factor that influ-ences the assessment of the links between landcover and stream condition is the innate co-variance that occurs between natural and an-thropogenic gradients (Allan, 2004a, Hughes etal., 2009).A simple example of such covariance isthe occurrence of agricultural and urban areas inareas of river basins that are naturally less steepand more accessible. This phenomenon means thata great deal of the variance attributed to humanfactorswill be affectedbynatural covariance.
360 Rui et al.
This study focused on anthropogenic changesin patterns of land use and their influenceon stream biota and lower-scale descriptors ofhabitat. Changes in land cover are an essen-tial driver of change in flow patterns and theflux of nutrients and sediments at successivelylower scales, which influences the organisationof the different components of river biota and thecirculation of materials.
CONCLUSIONS
This study supports a broader multiscale ap-proach for characterising population and com-munity dynamics and species-ecosystem link-ages in streams, thereby providing a wider arrayof applications for management and indicatorsfor conservation measures. The results empha-sise the importance of describing large-scale fea-tures, particularly fractal descriptors of landscapecomposition and structure and their expressionat a relevant scale, revealing their influence onaquatic systems without laborious analyses. Thedescriptors (metrics) of the interactions betweenthe different landscape units (i.e., the fractalproperties of the patches) are vital for identifyingfluxes of materials toward the river. The patternsof these descriptors will help to predict local-scale physical habitat characteristics, biologicalassemblages and facets of river function.
REFERENCES
AKAIKE, H. (1973). Information theory and an ex-tension of the maximum likelihood principle. In:Second International Symposium on InformationTheory. B.N. Petrov and F. Csake (eds.): 267–281.Budapest: Akademiai Kiado.
AKAIKE, H. (1974). A new look at the statistical mo-del identification. IEEE Transactions on AutomaticControl, AC-19, 716–723.
ALLAN, J. D. 2004a. Influence of land use and land-scape setting on the ecological status of rivers.Limnetica, 23: 187–198.
ALLAN, J. D. 2004b. Landscapes and riverscapes:The influence of land use on stream ecosystems.
Annual Review of Ecology Evolution and System-atics, 35: 257–284.
ALLEN, T. F. H., R. V. O’NEILL & T. W. HOCK-STRA. 1987. Interlevel relations in ecological re-search and management: some working principlesfrom hierarchy theory. Journal of Applied SystemsAnalysis, 14: 63–79.
ANDERSON, M. J., R. N. GORLEY & K. R. CLAR-KE. 2008. PERMANOVA+ for PRIMER: Guide toSoftware and Statistical Methods. Plymouth, U.K.:Primer-E Ltd.
BERMAN, C. 2002. Assessment of landscape charac-terization and classification methods. USDA For-est Service, No. PNW 99-9053-1-CA.
BONADA, N., C. ZAMORA MUNOZ, M. RIERA-DEVALL & N. PRAT. 2005. Ecological and histor-ical filters constraining spatial caddisfly distribu-tion in Mediterranean rivers. Freshwater Biology,50: 81–797.
BOYERO, L. 2003. Multiscale patterns of spatialvariation in stream macroinvertebrate communi-ties. Ecological Research, 18: 365–379.
BUFFAGNI, A., C. CASALEGNO & S. ERBA.2009. Hydromorphology and land use at differentspatial scales: expectations in a changing climatescenario for medium-sized rivers of the WesternItalian Alps. Fundamental and Applied Ecology,74: 7–25.
CORKUM, L. D. 1989. Patterns of benthic inverte-brate assemblages in rivers of northwestern NorthAmerica. Freshwater Biology, 21:191–205.
CORTES, R. M. V., S. G. P. VARANDAS S. J. HU-GHES & M. T. FERREIRA (2008). Combininghabitat and biological characterization: Ecologicalvalidation of the river habitat survey. Limnetica, 27(1): 39–56.
CORTES, R. M. V., S. J. HUGHES, S. G. P. VARAN-DAS, M. MAGALHAES & M. T. FERREIRA.2009. Habitat variation at different scales and bi-otic linkages in lotic systems: consequences formonitorization. Aquatic Ecology, 43: 1107–1120.
DAVIES, N. M., R. H. NORRIS & M. C. THOMS.2000. Prediction and assessment of local streamhabitat features using large-scale catchment char-acteristics. Freshwater Biology, 45: 343–369.
DIXON, M. 2003. Effects of flow pattern on riparianseedling recruitment on sandbars in the WisconsinRiver, Wisconsin, U.S.A. Wetlands, 22: 125–139.
ERBA, S., A. C. BUFFANGI, N. HOLMES, M. O’HA-RE, P. SCARLETT & A. STENICO. 2006. Pre-liminary testing of River Habitat Survey features
Effects of landscape metrics and land use on macroinvertebrates 361
for the aims of the WFD hydro-morphological as-sessment: an overview from the STAR Project. In:The Ecological Status of European Rivers: Evalu-ation and Intercalibration of Assessment Methods.M. T. Furse, D. Hering, K. Brabec, A. Buffagni, L.Sandin & P. F. M. Verdonschot (eds.). Hydrobiolo-gia, 566: 281–296
FRISSELL, C. A, W. J. LISS, C. E. WARREN & M.D. HURLEY. 1986. A Hierarchical Framework forStream Habitat Classification-Viewing Streams ina Watershed Context. Environmental Management,10: 199–214.
GERGEL, S. E., M. G. TURNER, J. R. MILLER, J.M. MELACK & E. H. STANLEY. 2002. Land-scape indicators of human impacts to riverine sys-tems. Aquatic Sciences, 64:118–128.
HAWKINS, C. P. & M. R. VINSON. 2000. Weakcorrespondence between landscape classificationsand stream invertebrate assemblages: implicationsfor bioassessment. Journal of the North AmericanBenthological Society, 19:501–517.
HEINO, J., P. LOUHI & T. MUOTKA. 2004. Identi-fying the scales of variability in stream macroin-vertebrate abundance, functional composition andassemblage structure. Freshwater Biology, 49:230–1239.
HEINO, J., T. MUOTKA, R. PAAVOLA, H. HAMA-LAINEN & E. KOSKENNIEMI. 2002. Corre-spondence between regional delineations and spa-tial patterns in macroinvertebrate assemblages ofboreal headwater streams. Journal of the NorthAmerican Benthological Society, 21: 397–413.
HERING, D., C. FELD, O.MOOG & T. OFENBOCK2006a. Cook book for the development of aMultimetric Index for biological condition ofaquatic ecosystems: experiences from the Euro-pean AQEM and STAR projects and related ini-tiatives. Hydrobiologia, 566, 311–324.
HERING, D., R. JOHNSON, S. KRAMM, S.SCHMUTZ, K. SZOSZKIEWICZ& P. VERDON-SCHOT 2006c. Assessment of European streamswith diatoms, macrophytes, macroinvertebratesand fish: a comparative metric based analysis oforganism response to stress. Freshwater Biology,51, 1757–1785.
FELD, C. & D. HERING 2007. Community structureor function: effects of environmental stress on ben-thic macroinvertebrates at different spatial scales.Freshwater Biology, 52, 1380–1399
FORMAN, R. T. T. & M. GODRON. 1986. LandscapeEcology. John Wiley and Sons, New York. 640pp.
FURSE, M. T., D. HERING, K. BRABEC, A. BUF-FAGNI, L. SANDIN & P. F. M. VERDENSCHOT.2006. The ecological status of European rivers:evaluation and intercalibration of assessment me-thods. Hydrobiologia, 566: 1–2.
HUGHES, S. J., M. T. FERREIRA, R. M. V. CORTES.2008. Hierarchical spatial patterns and drivers ofchange in benthic macroinvertebrate communitiesin an intermittent Mediterranean river. Aquatic Con-servation: Marine and Freshwater Ecosystems, 18:742–760.
HUGHES, S. J., J. M. SANTOS, M. T. FERREIRA,R. CARACA, A. M. MENDES 2009. Ecologicalassessment of an intermittent Mediterranean riverusing community structure and function: evaluat-ing the role of different organism groups. Fresh-water Biology, 54: 2383–2400
JOY, M. K. & R. G. DEATH. 2004. Predictive mod-elling and spatial mapping of freshwater fish anddecapod assemblages: an integrated GIS and neu-ral network approach. Freshwater Biology, 49:1036–1052.
LAMMERT, M. & J. D. ALLAN. 1999. Environmen-tal Auditing: assessing biotic integrity of streams:Effects of scale in measuring the influence ofland use/cover and habitat structure on fish andmacroinvertebrates. Environmental Management,23: 257–270.
LAMOUROUX, N., S. DOLEDEC & S. GAYRAUD2004. Biological traits of stream macroinvertebratecommunities: effects of microhabitat, reach, andbasin filters Journal of the North American Ben-thological Society, 23(3): 449–466
LOWE, W. H., G. E. LIKENS & M. E. POWER.2006. Linking Scales in Stream Ecology. Bio-Science, 55: 591–597.
MERIGOUX, S., S. DOLEDEC. 2004. Hydraulic re-quirements of stream communities: a case study oninvertebrates. Freshwater Biology, 49: 600–613.
MOLNAR, P., P. BURLANDO & W. RUF. 2002. Inte-grated Assessment of riverine landscape dynamics.Aquatic Sciences, 64: 129–140.
MUNNE, A., N. PRAT, C. SOLA, N. BONADA & M.RIERADEVALL. 2003. A simple field method forassessing the ecological quality of riparian habitatin rivers and streams: QBR index. Aquatic Con-servation: Marine and Freshwater Ecosystems, 13:147–163
ORMEROD, S. J., S. D. RUNDLE, E. C. LLOYD &A. A. DOUGLAS. 1993. The influence of riparian
362 Rui et al.
management on the habitat structure and macroin-vertebrate communities of upland streams drainingplantation forests. Journal of Applied Ecology, 30:13–24.
PARSONS, M. & M. C. THOMS. 2007. Hierarchi-cal patterns of physical–biological associations inriver ecosystems. Geomorphology, 89: 127–146.
PEARSON, T. N., H. W. LI & G. A. LAMBERTI.1992. Influence of habitat complexity on resistanceto flooding and resilience of stream fish assem-blages. Transactions of the American Fisheries So-ciety, 121, 427–436.
POFF, N. L. 1997. Landscape filters and speciestraits: Towards mechanistic understanding and pre-diction in stream ecology. Journal of the NorthAmerican Benthological Society, 16: 391–409.
POFF, N. J. D. ALLAN, M. B. BAIN, J. R. KARR,K. L. PRESTEGAARD, B. D. RICHTER, R. E.SPARKS & J. C. STROMBERG. 1997. The natu-ral flow regime: A paradigm for river conservationand restoration. BioScience, 47: 769–784.
PYNE, M. L., R. B. RADER & W. F. CHRISTEN-SEN. 2007. Predicting local biological character-istics in streams: a comparison of landscape clas-sifications. Freshwater Biology, 52: 1302–1321.
RAVEN, P. J., P. FOX, M. EVERARD, N. T. H. HOL-MES, F. H. DAWSON. 1997. River Habitat Sur-vey: a new system for classifying rivers accord-ing to their habitat quality. In: Freshwater quality:defining the indefinable? Boon, P. J., Howell, D. L.(eds.): 215–234. The Stationery Office, Edinburgh.
RAVEN, P. J., N. T. H. HOLMES, F. H. DAWSON,P. FOX, M. EVERARD, I. R. FOZZARD & K. J.ROUEN. 1998. River habitat quality: the physicalcharacter of rivers and streams in the UK and theIsle of Man. River Habitat Survey report no. 2,Environment Agency, Bristol. 86 pp.
RAVEN, P. J., N. T. H. HOLMES, P. CHARRIER, F.H. DAWSON, M. NAURA & P. J. BOON. 2002.Towards a harmonized approach for hydromorpho-logical assessment of rivers in Europe: a qualitativecomparison of three survey methods. Aquatic Con-servation: Marine and Freshwater Ecosystems, 12:405–424.
RICHARDS, C., L. B. JOHNSON & G. E. HOST1996. Landscape-scale influences on stream habi-
tats and biota. Canadian Journal of Fisheries andAquatic Sciences, 53: 295–311.
ROTH, N. E., J. D. ALLAN & D. L. ERICKSON.1996. Landscape influences on stream biotic in-tegrity assessed at multiple spatial scales. Land-scape Ecology, 11: 141–156.
SANDIN, L. 2009. The relationship between land-use, hydromorphology and river biota at differentspatial and temporal scales: a synthesis of sevencase studies. Fundamental and Applied Ecology,174: 1–5.
SANDIN, L. & R. K. JOHNSON. 2000. Ecoregionsand benthic macroinvertebrate assemblages ofSwedish streams: Journal of the North AmericanBenthological Society, 19: 462–474.
SANDIN, L. & R. K. JOHNSON. 2004. Local, land-scape and regional factors structuring benthic ma-croinvertebrate assemblages in Swedish streams.Landscape Ecology, 19: 501–514.
SCHILLER, D. V., E. MARTI, J. L. RIERA, M. RI-BOT, J. C. MARKS & F. SABATER. 2008. Influ-ence of land use on stream ecosystem function in aMediterranean catchment. Freshwater Biology, 53:2600–2612.
SPONSELLER, R. A., E. F. BENFIELD & H. M.VALLET. 2001. Relationships between land use,spatial scale and stream macroinvertebrate com-munities. Freshwater Biology, 46: 1409–1424.
STATZNER, B., J. A. GORE & V. H. RESH. 1988.Hydraulic stream ecology: observed patterns andpotential applications. Journal of the North Amer-ican Benthological Society, 7: 307–360.
TRIGO, R. M., D. POZO-VAZQUEZ, T. J. OS-BORN, Y. CASTRO-DIEZ, S. GAMIZ-FORTIS& M. J. ESTEBAN-PARRA, 2004. North AtlanticOscillation Influence on precipitation, river flowand water resources in the Iberian Peninsula. In-ternational Journal of Climatology, 24: 925–944.
VARANDAS, S. G. & R. M. V. CORTES. 2010. Eval-uating macroinvertebrate biological metrics forecological assessment of streams in northern Por-tugal. Environmental Monitoring and Assessment,166: 201–221.
YUAN, L. &S. B. NORTON. 2004. Assessing the rela-tive severity of stressors at a watershed scale. Envi-ronmentalMonitoring andAssessment, 98: 323–349.