Embed Size (px)
Citation preview

Muhasebe ve Finansman Dergisi Ekim/2016
187
Effects Of Interaction Between Erp And Advanced Managerial Accounting Techniques On Firm Performance: Evidence From Turkey*
Melek EKER** Alp AYTAÇ***
ABSTRACT Almost all large and middle-sized firms worldwide have adopted enterprise planning
(ERP) systems and advanced managerial accounting techniques (AMAT). However, there are virtually no studies on the interaction between ERP and AMAT and the effects of this interaction on firm performance. In this study, the effects of interaction between ERP and AMAT on firm performance are examined via an empirical analysis based on data from 125 manufacturing firms selected from among the top 500 in Turkey in 2015. The results support the hypothesis that high interaction between ERP and AMAT is associated with high financial and non-financial performance.
Keywords: ERP, Advanced Managerial Accounting Techniques, Financial Performance, Non- Financial Performance, Factor Analysis, Logistic Regression Analysis
Jel Codes:M10, M40, M41, D24
ÖZET Dünya çapında neredeyse tüm büyük ve orta ölçekli işletmeler kurumsal kaynak
planlama (Enterprise Resource Planing (ERP)) ve ileri yönetim muhasebesi tekniklerini (advanced managerial accounting techniques (AMAT)) kullanmaya başlamışlardır. Ancak, ERP ve AMAT arasıdnaki ilişkiyi ve bunun firma performansı üzerine olan etkisini ortaya koyan bir çalışma bulunmamaktadır. Bu çalışmada 2015 yılında Türkiye’de ilk 500 üretim firması içerisinde yer alan 125 firmadan elde edilen veriler doğrultusunda ERP ve AMAT’ın firma performansına etkisi incelenmiştir. Elde edilen sonuçlar ERP ve AMAT arasındaki ilişkinin yüksek finansal ve finansal olmayan performansı etkilediği hipotezini destekler niteliktedir.
Anahtar Kelimeler: ERP, İleri Yönetim Muhasebesi Teknikleri, Finansal Performans, Finansal Olmayan Performans, Faktör Analizi, Lojistik Regresyon Analizi
Jel Kodu: M10, M40, M41, D24
* Bu çalışma Uludağ Üniversitesi Bilimsel Araştırma Projeleri tarafından desteklenen KUAP(İ) 14/59 numaralı projenin çıktısı olarak ele alınmıştır. ** Doç.Dr. Melek Eker, Uludağ Üniversitesi İİBF, [email protected] *** Araş.Gör. Alp Aytaç, Uludağ Üniversitesi İİBF, [email protected]
The Journal of Accounting and Finance October/2016
188
1. INTRODUCTION
The competitive structure of the global world economy has intensified due to the speed of technological development. Enterprises should establish their own future vision by understanding well the context, which is defined by different and diverse forms of technology and competition in this market, which transcends the borders of a nation-state. Naturally, the best approach to understanding this situation is to obtain timely and reliable information.
Companies have used different methods to obtain this information. Most companies employed independent, disconnected information systems that were specific to a unit or a function until the 1990s (Davenport, 1998). Although these information systems helped managers with the processes of operation, reporting and decision making, these systems remained indifferent to a significant number of factors such as automation, productivity and efficiency of operations, and the need to react quickly and obtain real-time information for companies’ success.
Today’s business environment demands more integrated, comprehensive, flexible and real time financial and operational information from all units. This situation is the successful result of using new technologies to obtain information and observe companies’ changing environment. One of the results of this search is the enterprise resource planning (ERP) system.
ERP is a corporate information technology that has been widely used worldwide for almost 30 years, and it continues to expand. In the process, it has become a complex computer application targeted at specific user needs (particularly on the effective use of resources and increase of profit), integrating all processes and functions and sharing a common and integrated database with an overall perspective.
Thus, business processes become not only automatic but also enterprise-wide information that depends on data sharing. These functions become accurate and occur in real time with ERP. Enterprises’ critical functions, including data gathering, warehousing, spreading and using, have thereby radically changed the nature of accounting applications. Because employees receive accurate information rapidly and efficiently, operational coordination among departments becomes easier, and consequently, strategic planning and control become efficient. Efficiency has been seen in areas such as increasing the flexibility of data gathering, integration of accounting applications and quality of financial reporting ( Spathis and Constantinides, 2004:235); fast decision making, harmonizing of conflicting purposes and standardization of business processes (Colmenares, 2009:5); and increasing efficiency of transactions and information quality, facilitating access to information and supporting interim reporting ( Booth; 2000).
With these features, ERP becomes not only a focal point of managerial accounting but also a strategic control tool for managers in the 21st century competitive market. Due to system software, employees can do many transactions electronically. Because of the creation of a common database among departments, immediate reports can be sent to responsible units when there is a problem, and consequently, traditional roles’ content can be changed within
Muhasebe ve Finansman Dergisi Ekim/2016
189
enterprises. Accountants and managerial accountants have felt this change intensely (Scapens and Jazayeri, 2003:201). Along with the change in routine processes, companies hire department managers with accounting knowledge; based on this change, the managerial accountant role has become more extensive (Malinic ve Jovanovic; 2012, Scapens ve Jazayeri; 2003, Mahesha ve Akash; 2013, Booth; 2000, Colmenares; 2009, Spathis ve Ananiadis; 2005, El Sayed; 2006, Kanellou ve Spathis; 2013).
2. LITERATURE REVIEW
Managerial accounting, which fundamentally focuses on historical cost reporting, has become unresponsive to companies’ needs primarily because technological development changes production style and management and organization structure. Consequently, fundamental enterprise notions such as cost structure and performance become multidimensional and complex. The firm environment, which affects the processes of all management applications (planning, control, decision making and communication), has inevitably expanded the mission of managerial accounting systems (MASs).
A MAS is a system not only to generate enterprise-wide financial control but also to realize cost reduction in line with value creation. Thus, a MAS should support fundamental functions such as the correct determination of product cost, effective control and clearing the way for the innovation of identified goals, ensuring employees’ productive work, improvement of processes, elimination of waste, and the planning, managing and controlling of operations for establishing strategies. Managerial accounting systems and ERP have a strong relationship. ERP can offer important contributions to MASs for fulfilling these functions. In our opinion, MASs’ effectiveness has increased dramatically by ensuring interdepartmental integration, thus facilitating budgeting applications and tracking responsibility on prepared reports. However, based on the literature, this effect is scarce (Booth, Matolcsy and Wieder, 2000: 4; Granlund and Malmi, 2002; Scapens and Jayazeri, 2003). ERP was developed to establish control over complicated operations, increase efficiency and productivity within enterprises, decrease production and transaction costs (Davenport, 1998; Dong, 2001; Holland and Light, 2001) and build full and flexible information systems for all of these processes. ERP becomes a milestone of the use of effective, fast and comprehensive information by integrating enterprises’ inside and outside operational processes. ERP is a software system aimed at corporate resource planning. This system is based on establishing effective control and coordination of resources in different geographic regions in parallel with companies’ strategic goals, purposes and customer needs. Viewing data from all departments and making it generally available when employees enter data into systems once is the attractiveness of ERP. Consequently, information flow among fundamental processes becomes easier, and full, smooth integration will result. Fahy and Lynch (1999) find that while ERP systems improve the supply of transaction data for strategic management accounting activities, they typically cause significant damage to existing decision support capability of firm. Also the implementation of ERP system leads to better information and more streamlined financial processes.
The Journal of Accounting and Finance October/2016
190
ERP systems on the one hand are very useful for companies to achieve goals, on the other hand it is very costly. Companies should establish an optimum balance between quality and low cost. Total management quality is a management philosophy for achieving this goal. Enterprises which embrace this philosophy understand the need to bring employee participation in all stages, teamwork and continuous improvement to the forefront to increase product or service quality, eliminate waste, decrease cost, and raise productivity and customer satisfaction (Zbaracki, 1998: 602). ERP, which is an important tool of Total Quality Management (TQM), addresses not only a product-based quality concept but also enterprise-wide successful organizational operation. In fact, ERP systems’ chance of success decreased in companies that could not fully establish the TQM philosophy’s method as a culture (Jha and Joshi, 2007).
When looking at studies between ERP and business process reeengineering Hammer (1990) mentioned that, ‘We should ‘‘reengineer’’ our businesses: use the power of modern information technology to radically redesign our business processes in order to achieve dramatic improvements in their performance’. Also, in 2005, Bosilj-Vuksic and Spremic investigated a pharmaceutical company in Croatia and their study showed that successful implementation of the ERP system must be accompanied by an appropriate BRP project ( Bosilj-Vukšić and Spremić, 2005:9). Another study done by Jiang and Ruan (2008) showed the strong interaction of the systems and they reported, ‘To ensure successful application of ERP and achieve the desired effect, we must first redesign our business processes.’ (Jiang and Ruan, 2008:2). Bac and Erkan’s (2013) research proved that using both BPR and ERP together further improves supply chain management performance to a point that neither the business process reengineering application nor the ERP implementation might reach individually.
ERP system and benchmarking effect each other. Especially Aberdeen Groups’ report in 2006 about Benchmarking ERP in SMB shed light on enterprises’ current situation. In their report they classified ERP framework into three pieces which are laggard, industry average and best in class. In order to find companies’ location in this system, they use process, organization, knowledge and technology data.
ERP and life cycle also have a strong interaction. Without determining right ERP stage, companies’ effort to initiate ERP system will fail. The ERP life-cycle stages cover initiation, contagion, control and integration, and these stages have a direct relationship concerning maintenance and support success, implementation success and overall ERP success (Law et al., 2010:300).
In 2005 Ragowsky et al.’s study points out importance of ERP and value engineering relation. They reported that information systems applications commonly found in ERP systems add value to an organization’s activities when that organization’s particular operational characteristics are taken into account (Ragowsky et al., 2005:395). Besides Ragowsky et al., in 2014, Rem et al. used antecedent factors to explain how they interact with ERP and competitive advantage and their results showed that an assessment and

Muhasebe ve Finansman Dergisi Ekim/2016
191
understanding of system quality, organizational readiness, business environment and an assessment of the strategic value of adopting ERP can be crucial for generating the desired competitive advantage after ERP adoption (Ram et al., 2014:130).
Target costing is a part of managerial accounting systems and plays an important role in enterprise resurce planning systems. The target costing approach helps a firm integrate its accounting function with operations management and effectively support the firm’s competitive strategies (Lee et al., 2002:111). Also, according to Zhang ‘The two models (activity based costing and target costing) should be integrated in an ERP system to form a new model of the cost control management in an ERP environment.’ (Zhang, 2010:224).
ERP is considered a catalyst for JIT applications because it creates an updated database with real time information for planning, controlling and stock management (Powell et al, 2013:330).
Activity-based costing is a strategic system that directs managers and evaluates companies’ operations performance in terms of cost. The purpose of the system is increasing profit consistently by annihilating activities that are increasing the cost of the products and services that are offered to meet customer expectations. With the help of ABC, management can identify which operations are performed in the production of products and services, why they are performed and how they can be optimized (Turney and Stratton, 1999: 47). ERP can facilitate this identification process. The confidence-building nature of ERP and ABC integration comes from smoothing decision makers’ task to effectively manage improved information flow, shortening operations that not add value, specification of process improvement chances and an increase in product and customer profitability (Kudyba and Vitaliano, 2003).
Balanced scorecard is a performance measurement tool. Companies which integrate ERP should track down their overall performance. Balanced scorecard, which has been nourished by ERP, can instantly report firm unit performance to management; thereby, a company’s position compared with the strategy can easily be monitored, understood and acted upon (Edwards, 2001).
This article examines how new management accounting applications become effective and productive with the support of an ERP system and how this interaction increases firm performance as empirical.
3. METHODOLGY 3.1. Sample and Data Collection
The data used in this study were collected from 445 manufacturing enterprises from among the top 500 in Turkey. The survey forms were sent on 01 September 2015 by post to the top managers (general manager or assistant general manager) of the manufacturing firms that participated in this study. A total of 125 completed survey forms were received, yielding a response rate of 28%. The sectoral distribution of the firms is depicted in table 1.

The Journal of Accounting and Finance October/2016
192
Table 1. Sectoral Distribution of Survey Respondents
Industry Frequency Percent Valid Cumulative
Textile and clothing 14 11,1 11,2 11,2
Food and allied 30 23,8 24,0 35,2
Construction 8 6,3 6,4 41,6
Chemical and Petroleum 9 7,1 7,2 48,8
Plastic products 9 7,1 7,2 56,0
Mining 5 4,0 4,0 60,0
Metal Products and Machinery 16 12,7 12,8 72,8
Forest Products 4 3,2 3,2 76,0
Automotive and Spare part 16 12,7 12,8 88,8
Glass 1 ,8 ,8 89,6
Electronic 12 9,5 9,6 99,2
Alcohol and tobacco 1 ,8 ,8 100,0
Total 125 99,2 100,0
The table shows the sectoral distributions as follows: 24% Food and Allied Product, 12.8% metal products and automotive, 11.2% textile, clothing and footwear and 9.6% glass.
3.2. Survey Instrument
The survey form that was developed to collect the research data comprised three parts. In the first part, “ERP used or not used” and “which of the models are included in the ERP system” questions were asked to determine the level of use of ERP. ERP models were evaluated by a twelve item, six-point Likert scale developed by Kallunki et al. (2011). All respondents were asked to respond by circling a number from “not adopted or considered” (1) to “ERP was adopted more than 3 years ago” (6) on the scale for each of the items.
In the second part, AMAT aimed to determine the level of use. A five-point Likert scale was used to represent choices showing degree of usage between 1 and 5: “not used at all”, “partly used”, “sometimes used”, “usually used”, and “used very much”.
In the last part, top managers were asked to indicate on nine-point Likert scales, ranging from “well below average” to “well above average”, their assessment of their firms’ performance compared with their major competitors on the twelve selected items.
3.3. Data Analysis
In this study, the obtained data were entered into the SPSS statistical package program in Windows 13. The analysis of the data employed factor analysis, multiple correlation analysis, logistic regression analysis and t-test analysis.

Muhasebe ve Finansman Dergisi Ekim/2016
193
3.3.1. Factor Analysis
Factor analysis was utilized to group variables that are associated with one another. ERP modules are composed of twelve items. In this analysis, principal components and the "varimax" rotation technique for factor derivation techniques were used. The obtained factor analysis results were examined, sales and marketing variables with similar covariance were removed from the analysis of variance, and factor analysis was performed again. In the analysis, KMO sampling sufficiency was found to be 0.827, and 3 factors were determined whose eigenvalue is greater than 1. Three factors explained 61.493% of the total variance. Factor 1 explained a significant proportion of the total variance (31.682%) and consisted of variables that contained “supply and Manufacturing modules”. Factor 2 explained 16.024% of the total variance and consisted of variables that were related to “business intelligence and accounting”. Factor 3 explained 13.787% of the total variance and consisted of variables that were related to “customer and e-commerce modules”. Cronbach's alpha coefficients of ERP modules, respectively, were found to be 84.9%, 60.2% and 45.3%; ERP modules 1-2 show good and ERP Module 3 shows low internal consistency of the survey data.
Table 2. Factor Analysis of ERP Modules
ERP Modules 1.Faktör 2.Faktör 3.Faktör
ERP Modul 1
Procurement ,909
Inventory management ,908
Manufacturing and product management ,785
Supply chain management ,722
Human resource management ,592
ERP Modul 2
Service and maintenance ,707
Business intelligence and analytics ,646
Budgeting and planning ,626
Performance evaluation ,555
ERP Modul 3
E-commerce applications ,851
Customer relationship management ,555
The Journal of Accounting and Finance October/2016
194
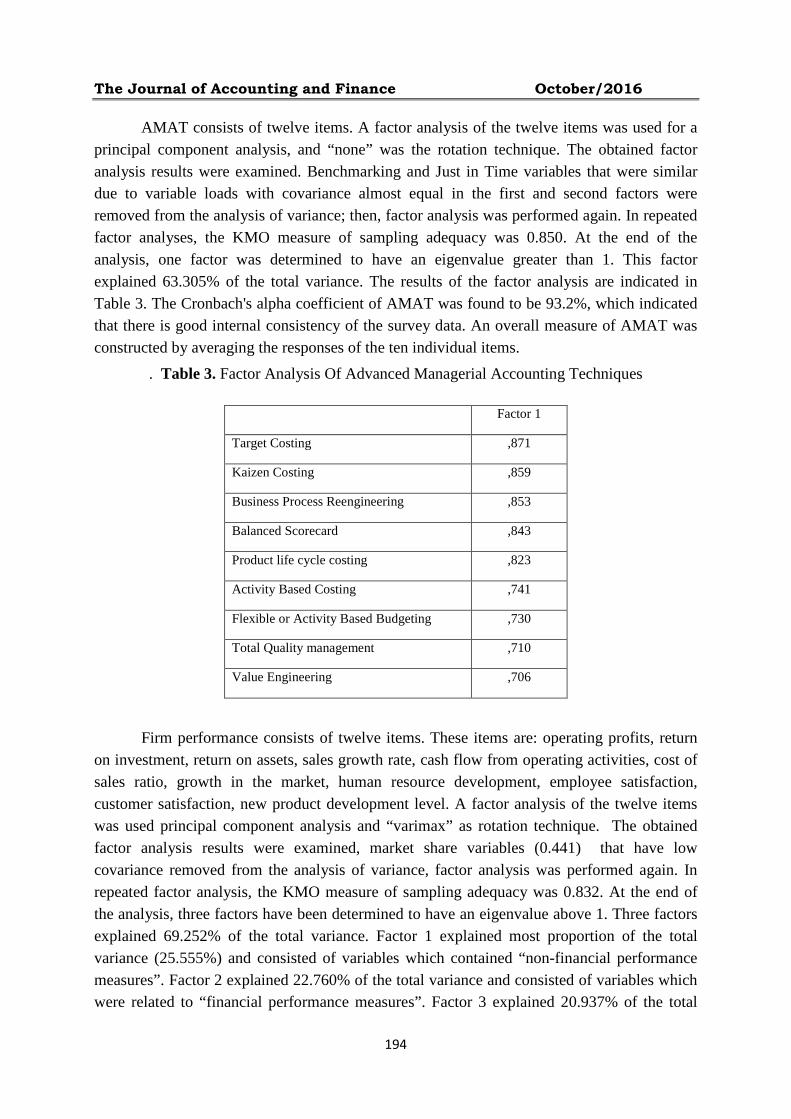
AMAT consists of twelve items. A factor analysis of the twelve items was used for a principal component analysis, and “none” was the rotation technique. The obtained factor analysis results were examined. Benchmarking and Just in Time variables that were similar due to variable loads with covariance almost equal in the first and second factors were removed from the analysis of variance; then, factor analysis was performed again. In repeated factor analyses, the KMO measure of sampling adequacy was 0.850. At the end of the analysis, one factor was determined to have an eigenvalue greater than 1. This factor explained 63.305% of the total variance. The results of the factor analysis are indicated in Table 3. The Cronbach's alpha coefficient of AMAT was found to be 93.2%, which indicated that there is good internal consistency of the survey data. An overall measure of AMAT was constructed by averaging the responses of the ten individual items.
. Table 3. Factor Analysis Of Advanced Managerial Accounting Techniques
Factor 1
Target Costing ,871
Kaizen Costing ,859
Business Process Reengineering ,853
Balanced Scorecard ,843
Product life cycle costing ,823
Activity Based Costing ,741
Flexible or Activity Based Budgeting ,730
Total Quality management ,710
Value Engineering ,706
Firm performance consists of twelve items. These items are: operating profits, return
on investment, return on assets, sales growth rate, cash flow from operating activities, cost of sales ratio, growth in the market, human resource development, employee satisfaction, customer satisfaction, new product development level. A factor analysis of the twelve items was used principal component analysis and “varimax” as rotation technique. The obtained factor analysis results were examined, market share variables (0.441) that have low covariance removed from the analysis of variance, factor analysis was performed again. In repeated factor analysis, the KMO measure of sampling adequacy was 0.832. At the end of the analysis, three factors have been determined to have an eigenvalue above 1. Three factors explained 69.252% of the total variance. Factor 1 explained most proportion of the total variance (25.555%) and consisted of variables which contained “non-financial performance measures”. Factor 2 explained 22.760% of the total variance and consisted of variables which were related to “financial performance measures”. Factor 3 explained 20.937% of the total

Muhasebe ve Finansman Dergisi Ekim/2016
195
variance and consisted of variables which were related to “financial performance measures”. Cronbach's alpha coefficients of performance measures respectively, was found to be 81.3%, 90.3% and 73.1%, which indicate very high internal reliability for the scale. An overall measure of financial I, financial II and non-financail performance was constructed by averaging the responses of the individual items.
Table 4. Factor Analysis of Firm Performance.
Performance Measures 1.Factor 2.Factor 3.Factor
Non-Financial P.M
Human Resource Development ,878
Employee Satisfaction ,802
Customer Satisfaction ,663
New Product Development level ,660
Financial P.M-I
Return on Investment ,890
Return on Assets ,823
Operating Profits ,744
Financial P.M.-II
Sales Growth rate ,709
Growth in the market ,707
Cost of Sales Ratio ,686
Cash flow from operating activities ,614
3.3.2. Descriptive Statistics and Correlation Analysis for All Variables
In table 5, the descriptive statistical data related to ERP, ERP moduls, advanced managerial accounting techniques, financial and non-financial performance of the firms which participated in the research have beeen presented.

The Journal of Accounting and Finance October/2016
196
Table 5. The Descriptive Statistical Analysis For All Items
Variables N Items Minimum Maximum Mean Standard Deviation
ERP 126 2 1 2 1.7619 0.42762
ERPModul 1 96 6 1 6 4.9296 1.29878
ERPModul 2 96 4 1 6 3.1446 1.38400
ERPModul 3 96 2 1 6 2.4691 1.54079
AMAT 114 9 1 5 3.8947 1,11600
Financial P-I 120 3 1.67 9 6.2417 1,62911
Financial P-II 121 4 3 9 6.4008 1,20825
Non-Financial P. 121 4 2 9 6.5820 1,43210
Looking at the percentage for implementation of ERP, while %23.8 (30) of firms was not used ERP system, %76.2 (96) of firms was used ERP system. The degree of adoption of ERP modules were between 1 and 6, respectively the averages were 4.9296, 3.1446 and 2.4691. These averages show that Modul 1 and 2 were used, but Modul 3 was not used. Advanced managerial accounting techniques scores ranged between 1 and 5, the mean was 3.4847. practicing level of advanced managerial accounting techniques, %3.5(4) of the firms was not used at all, %9.6 (11) of the firms was partly used, %17.5 (20) of the firms was sometimes used, %32.5 (37) of firms usually used and %36.8 (42) of the firms was used very much. Looking at the firm’s performance, financial performance-I changed between 1.67 and 9 and the average was 6.2417. Financial performance-II varied between 3 and 9 and average was 6.4008. Lastly, non-financial performance measures ranged between 2 and 9 and average was 6.5820. The performance data obtained show us that the firm’s performance was above middle.

Muhasebe ve Finansman Dergisi Ekim/2016
197
Tablo 6. Correlation Analysis for All Variables
Model I ERP ERPM1 ERPM2 ERPM3 FP-I FP-II Non-FP
AMAT ,144 ,230(*) ,328(**) ,125 .441(**)
.333(**) .559(**)
Model II ERP
ERPM-I ERPM-II ERPM-III AMAT AMAT X
ERP
AMAT X
ERPM1
AMAT X
ERPM2
AMAT X
ERPM3
FP-I ,181(*) ,249(*) ,297(**) ,331(**) ,441(**) ,399(**) ,364(**) ,436(**) ,413(**)
FP-II -,083 ,256(*) ,150 ,117 ,333(**) ,199(*) ,357(**) ,312(**) ,175
Non-FP ,020 ,121 ,144 ,117 ,559(**) ,445(**) ,325(**) ,324(**) ,236(*)
** Correlation is significant at the 0.01 level (2-tailed). * Correlation is significant at the 0.05 level (2-tailed).
In table 6, Model I displays the correlations between firm’s advanced managerial
accounting techniques (AMAT) application levels, ERP, ERP modules, financial and non financial performance. The numbers which are marked with an asterisk in the table show that according to the meaningfulness level 1% and 5%, there is a meaningful relationship between the variables. According to this, the relationship between AMAT application levels and ERP modul 1, ERP modul 2, financial performance-I, financial performance-II and non-financial performance, is meaningful and relations degree realized is in the order 0. 230 (p<0.01), 0.328 (p<0.01), 0.441 (p<0.01), 0.333 (p<0.01) and 0.559 (p<0.01).
Moreover, in this table model II shows that the relationship between the financial and non-financial performance and ERP, ERP modules, AMAT and interaction variables. According to the table 6, the correlation between financial performance-I and all variables are in a positive direction and the relations degree realized is in the order 0.181(p<0.05), 0.249(p<0.05), 0.297(p<0.01), 0.331(p<0.01), 0.441(p<0.01), 0.399(p<0.01), 0.364(p<0.01), 0.436(p<0.01) and 0.413 (p<0.01). The relationship between Financial performance-II and ERP modul-I, AMAT, AMATXERP Interaction term, AMATXERPM-I Interaction term, AMAT XERPM-II Interaction term, are meaningful and the relations degree realized is in the order 0. 256 (p<0.05), 0.333 (p<0.01), 0.199 (p<0.05), 0.357 (p<0.05) and 0.312 (p<0.01). The relationship between non-financial performance and AMAT, AMATXERP Interaction term, AMATXERPM-I Interaction term, AMATXERPM-II Interaction term, AMAT XERPM-III Interaction term, are meaningful and the relations degree realized is in the order 0.559 (p<0.01), 0.445 (p<0.01), 0.325 (p<0.01), 0.324 (p<0.01) and 0.236 (p<0.05).

The Journal of Accounting and Finance October/2016
198
3.3.3. Logistic Regression Analysis
In this section, the effects of ERP, ERP models, interaction terms on advanced managerial accounting techniques and firm performance were investigated by using a logistic regression analysis. For selecting variables in the logistic regression the stepwise forward selection method was used. In the first logistic regression analysis, for determining the impact of ERP, ERP models and firm performance on advanced managerial accounting techniques (AMAT), the firms with low AMAT, was coded with the reference category=1 and the firms with high AMAT was coded with the reference category=2.
In the logistic regression model which was constituted for determining the effect of predictor variables on AMAT practice levels of firms, Hosmer-Lemeshow statistic was 4,986, -2 log likelihood statistic (LL) was 104,368 and significant level (p) was 0,759 (p>,05) with 8 degrees of freedom. The results of goodness-of-fit test which are shown in Table 7 indicated that the logistic regression model was not a good fit. The Cox and Snell R2 was found to be 16,2% in the second step and this statistic indicated that there was an approximately 16% relationship between AMAT practice levels and mentioned variables. Also, Nagelkerke R2 indicated that there was a 21.9% relationship between above variables. In other words it indicated that 22% of the variation in the dependent variable was explained by independent variables in the model.
Table 7. Goodness-Of-Fit Test Of Model For Advanced Managerial Accounting Techniques.
Step -2 Log
likelihood
Cox & Snell
R2
Nagelkerke
R2
Chi-square Df Sig.
1 110,761(a) ,100 ,135 3,787 8 ,876
2 104,368(a) ,162 ,219 4,986 8 ,759
a Estimation terminated at iteration number 4 because parameter estimates changed by less than ,001. In Table 8, “B” column shows the coefficients (called Beta Coefficients) associated
with each predictor, “sig.” column shows the significant levels and “Exp(B)” column shows the odds ratios. The odds ratio is defined as the probability of the outcome event occurring divided by the probability of the event not occurring and the odds ratio for a predictor tells the relative amount by which the odds of the outcome increase (odds ratio greater than 1.0) or decrease (odds ratio less than 1.0) when the value of the predictor value is increased by 1.0 units. The Table's left column shows that the stepwise model-building process included two steps. In the first step, a constant as well as ERP Model II predictor variable was entered into the model and at the second step, non-financial performance predictor variable was added to the model.
In the Model, the “B” coefficent was 0,521 for ERP Model II term, p value was 0,004 and the model was statistically significant (p<,05). The odds ratio was 1,684 and it indicated

Muhasebe ve Finansman Dergisi Ekim/2016
199
that one unit increase in ERP Model II term increases 1,196 times the odds of having high AMAT. The beta coefficient of was 0.460 and p value was 0.017 (p<.05). The odds ratio of non-financial performance (NFPM) predictor was 1.585 and this statistic indicated that a one unit increase in NFPM variable increases 1.585 times the odds of having high AMAT.
Table 8. Results of Logistic Regression For AMAT
B S.E. Wald Df Sig. Exp(B) 95,0% C.I. for EXP(B)
Lower Upper Step 1(a)
ERPM2 ,521 ,183 8,110 1 ,004 1,684 1,176 2,411
Constant -1,192 ,582 4,203 1 ,040 ,303
Step 2(b)
ERPM-II ,485 ,191 6,447 1 ,011 1,624 1,117 2,362
NFPM ,460 ,192 5,736 1 ,017 1,585 1,087 2,310
Constant -4,085 1,392 8,617 1 ,003 ,017
a Variable(s) entered on step 1: ERPM-II. b Variable(s) entered on step 2: NFPM.
The success of the logistic regression can be assessed by looking at the classification
table. Table 9 shows correct and incorrect estimates. The columns are the two predicted values of the dependent, while the rows are the two observed (actual) values of the dependent. According to this table, the 58.3 % of the firms with low AMAT, 77.4% of the firms with high AMAT appointed correctly. With the analysis made the correct classification rate was found as 69.7%.
Table 9. Classification table of logistic regression for AMAT
Predicted
Percentage Correct
Advanced MA Techniques 1 2
Observed Advanced MA Techniques
1 21 15 58,3 2 12 41 77,4
Overall Percentage
69,7
a The cut value is ,500 In the second logistic regression model which was constituted for determining the
effect of ERP, ERP Modules, AMAT, and interaction variables on finansal performance level I of firms, Hosmer-Lemeshow statistic was 7,954, -2 log likelihood statistic (LL) was 97,786 and significant level (p) was 0,438 (p>,05) with 8 degrees of freedom. The results of goodness-of-fit test which are shown in Table 6 indicated that the logistic regression model

The Journal of Accounting and Finance October/2016
200
was not a good fit. The Cox and Snell R2 was found to be 15,1% in the first step and this statistic indicated that there was an approximately 15% relationship between financial performans I level and mentioned variables. Also, Nagelkerke R2 indicated that there was a 21.1% relationship between above variables. In other words it indicated that 21% of the variation in the dependent variable was explained by independent variables in the model.
Table 10. Goodness-Of-Fit Test Of Model For Financial Performans I Level
Step -2 Log likelihood
Cox & Snell R2
Nagelkerke R2
Chi-square Df Sig.
1 97,786(a) ,151 ,211 7,954 8 ,438 a Estimation terminated at iteration number 5 because parameter estimates changed by less than ,001.
In the Model, the “B” coefficent was 0,178 for AMATXERP Model III Interaction term, p value was 0,002 and the model was statistically significant (p<,05). The odds ratio was 1,195 and it indicated that one unit increase in AMATXERP Model III Interaction term increases 1,195 times the odds of having high financial performance I level.
Table 11. Results Of Logistic Regression For Financial Performance I
B S.E. Wald Df Sig. Exp(B) 95,0% C.I. for EXP(B)
Lower Upper Step 1(a)
AMAT XERP Model III ,178 ,058 9,443 1 ,002 1,195 1,067 1,339
Constant -,585 ,432 1,833 1 ,176 ,557 a Variable(s) entered on step 1: AMAT XERP Model III Interaction term
According to table 12, the 20.7 % of the firms with low financial performance-I level, 88.3% of the firms with high financial performance-I level were appointed correctly. With the analysis made the correct classification rate was found as 66.3%.
Table 12. Classification table of logistic regression for financial performance I level
Predicted
Percentage Correct
Financial Performance I 1 2
Observed Financial Performance I
1 6 23 20.7 2 7 53 88.3
Overall Percentage
66.3
a The cut value is ,500
In the third logistic regression model which was constituted for determining the effect of ERP, ERP Modules, AMAT, and Interaction variables on finansal performance-II level of firms, Hosmer-Lemeshow statistic was 13,421, -2 log likelihood statistic (LL) was 113,347 and significant level (p) was 0,098 (p>,05) with 8 degrees of freedom. The results of goodness-of-fit test which are shown in Table 6 indicated that the logistic regression model

Muhasebe ve Finansman Dergisi Ekim/2016
201
was not a good fit. The Cox and Snell R2 was found to be 6.4% in the first step and this statistic indicated that there was an approximately 6% relationship between financial performance II level and mentioned variables. Also, Nagelkerke R2 indicated that there was a 8.8% relationship between above variables. In other words it indicated that 9% of the variation in the dependent variable was explained by independent variables in the model.
Table 13. Goodness-Of-Fit Test Of Model For Financial Performans I Level
Step -2 Log likelihood
Cox & Snell R2
Nagelkerke R2
Chi-square Df Sig.
1 113,347(a) ,064 ,088 13,421 8 ,098
a Estimation terminated at iteration number 4 because parameter estimates changed by less than ,001.
In the Model, the “B” coefficent was 0,073 for AMAT XERP Model_I Interaction term, p value was 0,018 and the model was statistically significant (p<,05). The odds ratio was 1,075 and it indicated that one unit increase in AMATXERP Model I Interaction term increases 1,075 times the odds of having high financial performance II level.
Table 14. Results Of Logistic Regression For Financial Performance II
B S.E. Wald Df Sig. Exp(B) 95,0% C.I. for EXP(B)
Lower Upper Step 1(a)
AMAT XERP Model I ,073 ,031 5,645 1 ,018 1,075 1,013 1,142
Constant -,772 ,569 1,839 1 ,175 ,462
a Variable(s) entered on step 1: AMAT XERP Model I Interaction term
According to table 15, the 35.3 % of the firms with low financial performance-II level, 85.7% of the firms with high financial performance-II level were appointed correctly. With the analysis made the correct classification rate was found as 66.7%.
Table 15. Classification Table Of Logistic Regression For Financial Performance I Level
Predicted
Percentage Correct
Financial Performance II 1 2
Observed Financial Performance II
1 12 22 35.3 2 8 48 85.7
Overall Percentage
66.7
a The cut value is ,500

The Journal of Accounting and Finance October/2016
202
In the fourth logistic regression model which was constituted for determining the effect of ERP, ERP Modules, AMAT, and Interaction variables on non-financial performance of firms, Hosmer-Lemeshow statistic was 11,001, -2 log likelihood statistic (LL) was 103,636 and significant level (p) was 0,202 (p>,05) with 8 degrees of freedom. The results of goodness-of-fit test which are shown in Table 16 indicated that the logistic regression model was not a good fit. The Cox and Snell R2 was found to be 6.8% in the first step and this statistic indicated that there was an approximately 7% relationship between non-financial performance level and mentioned variables. Also, Nagelkerke R2 indicated that there was a 9.6% relationship between above variables. In other words it indicated that 10% of the variation in the dependent variable was explained by independent variables in the model.
Table 16: Goodness-Of-Fit Test Of Model For Non-Financial Performance Level
Step -2 Log likelihood
Cox & Snell R2
Nagelkerke R2
Chi-square Df Sig.
1 103,636(a) ,068 ,096 11,001 8 ,202
a Estimation terminated at iteration number 4 because parameter estimates changed by less than ,001.
In the Model, the “B” coefficent was 0,574 for AMAT term, p value was 0,014 and the model was statistically significant (p<,05). The odds ratio was 1,775 and it indicated that one unit increase in AMAT term increases 1,775 times the odds of having high non-financial performance level.
Table 17. Results Of Logistic Regression For Non-Financial Performance
B S.E. Wald Df Sig. Exp(B) 95,0% C.I. for EXP(B)
Lower Upper Step 1(a)
AMAT ,574 ,235 5,982 1 ,014 1,775 1,121 2,812
Constant -1,139 ,827 1,899 1 ,168 ,320
a Variable(s) entered on step 1: AMAT
According to table 18, the 22.2 % of the firms with low non-financial performance level, 95.2% of the firms with high non-financial performance level were appointed correctly. With the analysis made the correct classification rate was found as 73.3%.

Muhasebe ve Finansman Dergisi Ekim/2016
203
Table 18. Classification table of logistic regression for Non-financial performance I level
Predicted
Percentage Correct
Non-Financial Performance
1 2
Observed Non-Financial Performance
1 6 21 22.2
2 3 60 95.2
Overall Percentage
73.3
a The cut value is ,500
3.3.4. Results of t-test Analysis
In this section, we explore whether ERP, ERP Modules, advanced managerial accounting techniques (AMAT) and interaction terms varies between low and high financial and non-financial firm performance. With this aim, t-test analysis was performed and results of the analysis were presented in Table 19.
Table 19. Mean (SD) and t-test For ERP, ERP Modules, AMAT and interaction terms
between High vs. Low firm Financial Performance-I
Variables Firms having low financial Performance-I.
Firms having high financial Performance-I
t-value(p=.001)
ERP 1,6591(,47949) N=44
1,8026(,40066) N=76
.081
ERP Modul-I 4,6207(1,32163) N=29
5,1000 (1,26340) N=64
.098
ERP Modul-II 2,6236 (1,22507) N=29
3,3347 (1,39431) N=63
.021
ERP Modul-III 1,7586 (1,05746) N=29
2,7661 (1,61123) N=62
.003
Modern AMAT 3,0103 (1,21100) N=42
3,7334 (,93711) N=69
.001
ERPX AMAT 5,1951 (2,60420) N=42
6,8634 (2,20209) N=69
.000
ERPM-IX AMAT 15,0565 (7,74948) N=29
19,1197 (7,05238) N=62
.015
ERPM-IIX AMAT 8,4364 (5,09616) N=29
13,0774 (7,06305) N=60
.002
ERPM-IIIX AMAT 5,3652 (3,28631) N=29
10,4017 (7,09447) N=60
.000

The Journal of Accounting and Finance October/2016
204
According to the mean scores on financial performance_I, t-test indicates that firms with high financial performance-I have ERP modul-II, ERP Modul-III, AMAT, ERPXAMAT interaction term, ERPM-IXAMAT interaction term, ERPM-IIXAMAT interaction term and ERPM-IIIXAMAT interaction term greater extent than firms with low financial performance-I. In other words, the results of t-test refer to significant variations (p<0.01) between groups in terms of their ERP modul-II, ERP Modul-III, AMAT, ERPXAMAT interaction term, ERPM-IXAMAT interaction term, ERPM-IIXAMAT interaction term and ERPM-IIIXAMAT interaction term.
Table 20. Mean (SD) and t-test For ERP, ERP Modules, AMAT, and interaction terms
between High vs. Low firm financial Performance-II
Variables Firms having low financial Performance-II.
Firms having high financial Performance-II
t-value(p=.001)
ERP 1,8140 (,39375)
N=43
1,7179 (,45291)
N=78
.245
ERP Modul-I 4,6529 (1,37008)
N=34
5,1367 (1,22211)
N=60
.081
ERP Modul-II 2,8452 (1,34631)
N=35
3,2773 (1,37041)
N=58
.142
ERP Modul-III 2,1765 (1,48672)
N=34
2,6121 (1,52765)
N=58
.186
Modern AMAT 3,1376 (1,14406)
N=42
3,6751 (1,03977)
N=70
.012
ERPX AMAT 5,8069 (2,57643)
N=42
6,5411 (2,43235)
N=70
.133
ERPM-IX AMAT 15,4807 (7,26021)
N=34
19,4089 (7,39612)
N=58
.015
ERPM-IIX AMAT 9,4765 (5,48906)
N=34
12,9393 (7,23438)
N=56
.018
ERPM-IIIX AMAT 7,3221 (6,17952)
N=34
9,7454 (6,63599)
N=56
.088
According to the mean scores on financial performance-II indicated that firms with high financial performance-II appear to have AMAT level more than firms with low financial performance-II. Also, as expected, the two-way interaction between AMAT and ERP Modul I was found significant differences between firms with high and low financial performance-II.

Muhasebe ve Finansman Dergisi Ekim/2016
205
In other words, these findings show that high interaction between AMAT and ERP Modul I is associated with high financial performance-II. Similarly, t-test indicates that firms with high financial performance-II have interaction between AMAT and ERP Modul II greater extent than firms with low financial performance-II.
Table 21. Mean (SD) and t-test For ERP, ERP Modules, AMAT, and interaction terms
between High vs. Low firm Non-financial Performance
Variables Firms having low non-financial Performance.
Firms having high non-financial Performance
t-value(p=.001)
ERP 1,7179 (,45588)
N=39
1,7683 (,42452)
N=82
.553
ERP Modul-I 4,9778 (1,13182)
N=27
4,9552 (1,35862)
N=67
.939
ERP Modul-II 2,9196 (1,37446)
N=28
3,1987 (1,37055)
N=65
.370
ERP Modul-III 2,3889 (1,25064)
N=27
2,4769 (1,62604)
N=65
.802
Modern AMAT 2,8754 (1,24850)
N=38
3,7807 (,88824)
N=74
.000
ERPX AMAT 5,1162 (2,80214)
N=38
6,8561 (2,11973)
N=74
.000
ERPM-IX AMAT 16,2208 (7,74328)
N=27
18,6784 (7,40998)
N=65
.156
ERPM-IIX AMAT 9,7307 (6,78561)
N=27
12,4456 (6,70818)
N=63
.083
ERPM-IIIX AMAT 7,7194 (5,23092)
N=27
9,3059 (7,01081)
N=63
.294
As to the mean scores on non-financial performance, t-test indicates that firms with high non-financial performance have AMAT greater extent than firms with low non-financial performance. Similarly, as expected, the two-way interaction between AMAT and ERP was found significant differences between firms with high and low non-financial performance. In other words, these findings show that high interaction between AMAT and ERP is associated with high non-financial performance.

The Journal of Accounting and Finance October/2016
206
4. DISCUSSION AND CONCLUSION
In this study, the impact of interaction between ERP and advanced managerial accounting techniques (AMAT) on firm financial and non-financial performance is examined. To test this relationship, the study surveyed the data of 125 manufacturing firms placed in the top 500 in Turkey. Considering that the issue is new to Turkey, the study is important to understand the interaction between advanced managerial accounting techniques and ERP and the effects of the interaction on firm performance.
According to the results, there is a meaningful relationship between ERP, AMAT and firm performance. So the results confirm our hypothesis. In other words, high level interaction between ERP and AMAT is associated with high financial and non-financial performance.
To provide more details of the results, the logistic regression model was constituted for determining the effects of predictor variables (ERP, ERP moduls, AMAT, interaction term ERPXAMAT, interaction term ERPMXAMAT,) on the financial and non-financial levels of firms. In the first created model, It was observed that the ERP Model II and non-financial performance terms were effective for AMAT. According to this outcome, the odds ratio was 1,684 and it indicated that one unit increase in ERP Model II term increases 1,196 times the odds of having high AMAT. The odds ratio of non-financial performance predictor was 1.585 and this statistic indicated that one unit increase in non-financial performance variable increases 1.585 times the odds of having high AMAT. In the second formed model, It was found that the AMATXERP Model III Interaction term were effective for firm financial performance I. As to this outcome, the odds ratio was 1.195 and it indicated that one unit increase in AMATXERP Model III interaction term increases 1,195 times the odds of having high financial performance I level. In the third generated model, it is seen that the AMATXERP Model I interaction term is effective on firm financial performance II. According to this result, the odds ratio was 1,075 and it indicated that one unit increase in MASXERP Model I Interaction term increases 1,075 times the odds of having high financial performance II level. In the fourth constituted model, it was observed that AMAT was effective for non-financial performance of firm. As to this finding, the odds ratio was 1,775 and it indicated that one unit increase in AMAT term increases 1,775 times the odds of having high non-financial performance level.
Additionally, t-test was used to see whether ERP, ERP Modules, advanced managerial accounting techniques and interaction terms varies between low and high financial and non-financial firm performance. In the first created model, t-test indicates that firms with high financial performance-I have ERP modul-II, ERP Modul-III, AMAT, ERPXAMAT interaction term, ERPM-IXAMAT interaction term, ERPM-IIXAMAT interaction term and ERPM-IIIXAMAT interaction term greater extent than firms with low financial performance-I. In the second created model, It was seen that firms with high financial performance-II appear to have AMAT practice level, ERPM-IXAMAT interaction term and ERPM-IIXAMAT interaction term more than firms with low financial performance-II. In the third generated model, it was observed that firms with high non-financial performance have AMAT

Muhasebe ve Finansman Dergisi Ekim/2016
207
practice level and ERPXAMAT interaction term greater extent than firms with low non-financial performance.
Some limitations of this study can be identified. The first is the limitation of the sample by including top 500 manufacturing firms in Turkey. Thus, more comprehensive and different sample types might be useful for future studies. Another limitation is related to the subject. The subject could be examined in different aspects such as management control systems, environmental uncertainties, competition and culture in the future.
REFERENCES
Aberdeen Group (2006), Benchmarking ERP in SMB. Bac, Ugur- Erkan, Erman T. (2013), ‘‘Effects of Business Process Reengineering and
Enterprise Resource Planning on Supply Chain Management Performance’’, International Conference on IT and Intelligent Systerns, 2013 Bangkok, pp. 80–83.
Bhatt, G. (2000), “An Empirical Examination of the Effects of Information Systems Integration on Business Process Improvement”, International Journal of Operations and Production Management, (20:11), pp. 1331-1359.
Booth, Peter (2000) “Forum on Enterprise resource planning” Australian Accounting Review, Volume 10, Issue 22, November, pp.2–3.
Booth, Peter - Matolcsy, Zoltan - Wieder, Bernhard (2000) “The Impacts of Enterprise Resource Planning Systems on Accounting Practice – The Australian Experience”, Australian Accounting Review, Volume 10, Issue 22, November, pp. 4–18.
Bosilj, Vukšić, Vesna. - Spremić, Mario (2005), ‘‘ERP System Implementation and Business Process Change: Case Study of a Pharmaceutical Company’’, Journal of Computing and Information Technology, 13(1), pp. 11–24. http://doi.org/10.2498/cit.2005.01.02
Charalambos, Spathis – Sylvia, Constantinides (2004), “Enterprise resource planning systems’ impact on accounting processes”, Business Process Management Journal, Vol. 10 No. 2, 2004, pp. 234-247.
Colmenares, Leopoldo. (2009), “Benefits Of Erp Systems For Accounting And Financial Management” Allied Academies International Conference, Academy of Information and Management Sciences. Proceedings, 13.1, pp. 3-7.
Davenport, TH. (1998), “Putting the enterprise into the enterprise system”, Harvard Bus Rev, 76(4), pp. 121–131.
Dewhurst, F.W.- Martinez-Lorente, A.R.- Sanchez-Rodrıguez, C. (2003), ‘‘An initial assessment of the influence of IT on TQM: A multiple case study’’, International Journal of Operations and Production Management, 23 (4), pp. 348–374.
Dong, L. (2001), ‘‘Modelling top management influence on ES implementation’’, Business Process Management Journal, (7)3, pp. 243-250

The Journal of Accounting and Finance October/2016
208
Edwards, James B. (2001), “ERP, Balanced Scorecard, and IT: How Do They Fit Together?”, The Journal of Corporate Accounting & Finance, Vol.12, Issue 5, July/August, pp. 3-12
El Sayed, Heba (2006), "ERPs and accountants' expertise: the construction of relevance", Journal of Enterprise Information Management, Vol. 19 Iss: 1, pp. 83 – 96.
Fahy, MJ -Lynch R.(1999), ‘‘Enterprise resource planning (ERP) systems and strategic management accounting’’, Paper presented at the 22nd Annual Congress of the European Accounting Association, Bordeaux, France, May 5–7.
Granlund, M. - Malmi, T (2002), “Moderate impact of ERPS on management accounting: a lag or permanent outcome?”, Management accounting research, Volume 13, Issue 3, September, pp. 299–321.
Hammer, Michael (1990), ‘‘Reengineering Work: Don’t Automate, Obliterate’’, Harvard Business Review, (July-August), pp. 104–112.
Holland, C - B. Light (2001), "A stage maturity model for enterprise resource planning systems use." ACM SIGMIS Database 32(2), pp. 34-45.
International Federation of Accountants (IFAC) (1998), Internatinal Management Accounting Practice Statement: Management Accounting Concepts, New York
Jha, V. S., - Joshi, H. (2007), ‘‘Relevance of Total Quality Management (TQM) or business Excellence Strategy Implementation for Enterprise Resource Planning (ERP) – A Conceptual Study.
Jiang, Hua, - Ruan, Junhu (2008), ‘‘Study on the interactive relationship between BPR and ERP’’, 2008 International Conference on Wireless Communications, Networking and Mobile Computing, WiCOM 2008, pp. 1–5. http://doi.org/10.1109/WiCom.2008.1431
Kanellou, Alexandra - Spathis, Charalambos (2013), “Accounting benefits and satisfaction in an ERP environment”, International Journal of Accounting Information Systems, Volume 14, Issue 3, September, pp. 209–234.
Kudyba, Stephan - Vitaliano, Donald (2003), “Information Technology and Corporate Profitability: A Focus on Operating Efficiency”, Information Resources Management Journal, Volume 16 Issue 1, January, pp. 1-13.
Law, Chuch C. H.-, Chen, Charlie C. - Wu, Bruce J. P. (2010), ‘‘Managing the full ERP life-cycle: Considerations of maintenance and support requirements and IT governance practice as integral elements of the formula for successful ERP adoption’’, Computers in Industry, 61(3), pp. 297–308. http://doi.org/10.1016/j.compind.2009.10.004
Lee, Juun-Min - Chen, Injazz - Chen, Richard C. W., Chung - Chen H. (2002), ‘‘A Target-Costing Based Strategic Decision Support System’’, Journal of Computer Information Systems, 43(1), pp. 110–116.
Mahesha, V.- Akash, S. B (2013), “Management Accounting Benefits: ERP Environment”, SCMS Journal of Indian Management, Jul-Sep, Vol. 10 Issue 3, pp. 67-74.

Muhasebe ve Finansman Dergisi Ekim/2016
209
Malinić, Slobodan - Jovanović, Dejan (2012), “ERP and Management Accounting Changes of Industrial Enterprises in Serbia” Industrija, Vol.40, No.3, pp. 25-31.
Martinez, Lorente (2004), “The effect of ınformation Technologies on TQM: an initial analysis”Int. J. Production Economics 89, pp. 77-93.
Powell, Daryl - Alfnes, Erlend - Strandhagen, Jan Ola - Dreyer, Heidi (2013), “The concurrent application of lean production and ERP: Towards an ERP-based lean implementation process”, Computers in Industry, 64(3), pp. 324–335.
Ragowsky, Arik - Somers, Toni M.- Adams, Dennis A. (2005), ‘‘Assessing the Value Provided by ERP Applications Through Organizational Activities’’ Cais, 16(1), pp. 381–407.
Ram, Jiwat - Corkindale, David - Wu, Ming-Lu (2014), ‘‘ERP adoption and the value creation: Examining the contributions of antecedents’’, Journal of Engineering and Technology Management, 33, pp. 113–133.
Scapens, Robert W. - Jazayeri, Mostafa (2003), “ERP Systems and Management Accounting Change: Opportunities or Impacts? A Research Note”, European Accounting Review, Vol. 12, No. 1, pp. 201-233.
Spathis, Charalambos - Ananiadis, John (2005), “Assessing the benefits of using an enterprise system in accounting information and management”, Journal of Enterprise Information Management, 04; 18(2), pp. 195-210.
Turney, Peter b.b. - Alan j. Stratton (1999), “Using ABC to support continuous improvement” Management accounting, September, pp. 46-50
Zbaracki, M.J. (1998) 'The rhetoric and reality of total quality management', Administrative Science Quarterly, pp. 602-636.
Zhang, Huiru (2010),‘‘The innovation in cost management in the ERP environment’’, 2010 International Conference on Computer and Information Application, pp. 221–224, http://doi.org/10.1109/ICCIA.2010.6141576

The Journal of Accounting and Finance October/2016
210