Embed Size (px)
Citation preview
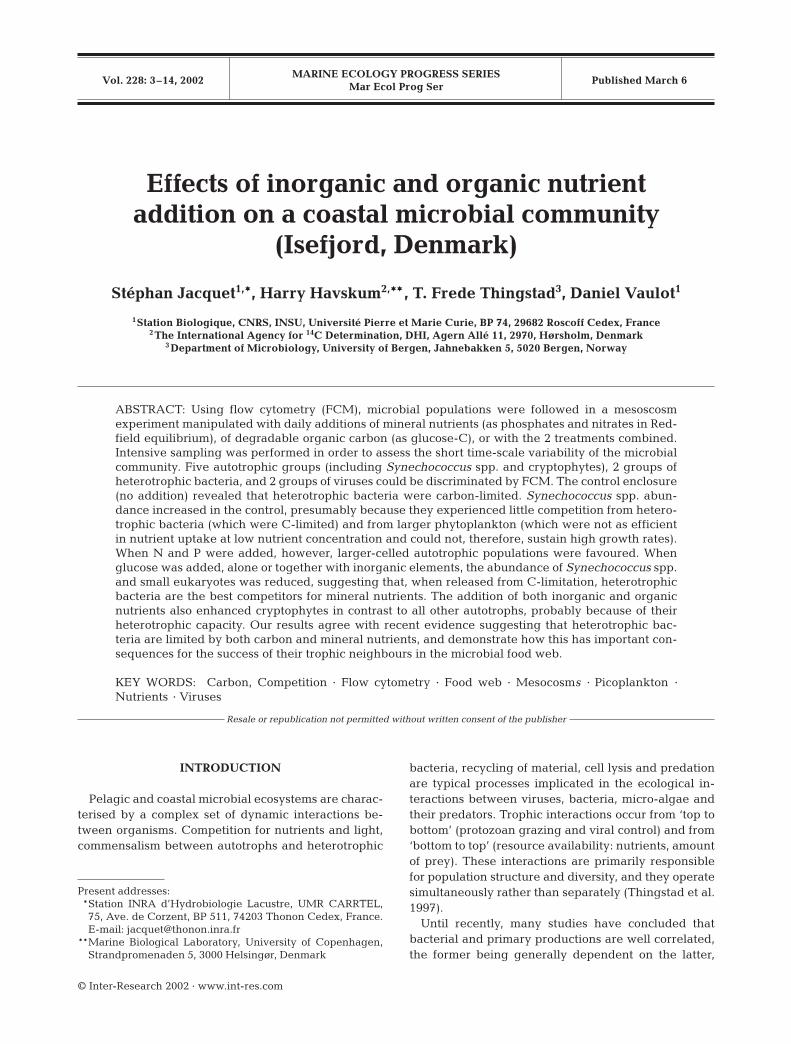
MARINE ECOLOGY PROGRESS SERIESMar Ecol Prog Ser
Vol. 228: 3–14, 2002 Published March 6
INTRODUCTION
Pelagic and coastal microbial ecosystems are charac-terised by a complex set of dynamic interactions be-tween organisms. Competition for nutrients and light,commensalism between autotrophs and heterotrophic
bacteria, recycling of material, cell lysis and predationare typical processes implicated in the ecological in-teractions between viruses, bacteria, micro-algae andtheir predators. Trophic interactions occur from ‘top tobottom’ (protozoan grazing and viral control) and from‘bottom to top’ (resource availability: nutrients, amountof prey). These interactions are primarily responsiblefor population structure and diversity, and they operatesimultaneously rather than separately (Thingstad et al.1997).
Until recently, many studies have concluded thatbacterial and primary productions are well correlated,the former being generally dependent on the latter,
© Inter-Research 2002 · www.int-res.com
Present addresses:**Station INRA d’Hydrobiologie Lacustre, UMR CARRTEL,
75, Ave. de Corzent, BP 511, 74203 Thonon Cedex, France.E-mail: [email protected]
**Marine Biological Laboratory, University of Copenhagen,Strandpromenaden 5, 3000 Helsingør, Denmark
Effects of inorganic and organic nutrient addition on a coastal microbial community
(Isefjord, Denmark)
Stéphan Jacquet1,*, Harry Havskum2,**, T. Frede Thingstad3, Daniel Vaulot1
1Station Biologique, CNRS, INSU, Université Pierre et Marie Curie, BP 74, 29682 Roscoff Cedex, France2The International Agency for 14C Determination, DHI, Agern Allé 11, 2970, Hørsholm, Denmark
3Department of Microbiology, University of Bergen, Jahnebakken 5, 5020 Bergen, Norway
ABSTRACT: Using flow cytometry (FCM), microbial populations were followed in a mesoscosmexperiment manipulated with daily additions of mineral nutrients (as phosphates and nitrates in Red-field equilibrium), of degradable organic carbon (as glucose-C), or with the 2 treatments combined.Intensive sampling was performed in order to assess the short time-scale variability of the microbialcommunity. Five autotrophic groups (including Synechococcus spp. and cryptophytes), 2 groups ofheterotrophic bacteria, and 2 groups of viruses could be discriminated by FCM. The control enclosure(no addition) revealed that heterotrophic bacteria were carbon-limited. Synechococcus spp. abun-dance increased in the control, presumably because they experienced little competition from hetero-trophic bacteria (which were C-limited) and from larger phytoplankton (which were not as efficientin nutrient uptake at low nutrient concentration and could not, therefore, sustain high growth rates).When N and P were added, however, larger-celled autotrophic populations were favoured. Whenglucose was added, alone or together with inorganic elements, the abundance of Synechococcus spp.and small eukaryotes was reduced, suggesting that, when released from C-limitation, heterotrophicbacteria are the best competitors for mineral nutrients. The addition of both inorganic and organicnutrients also enhanced cryptophytes in contrast to all other autotrophs, probably because of theirheterotrophic capacity. Our results agree with recent evidence suggesting that heterotrophic bac-teria are limited by both carbon and mineral nutrients, and demonstrate how this has important con-sequences for the success of their trophic neighbours in the microbial food web.
KEY WORDS: Carbon, Competition · Flow cytometry · Food web · Mesocosms · Picoplankton ·Nutrients · Viruses
Resale or republication not permitted without written consent of the publisher
Mar Ecol Prog Ser 228: 3–14, 2002
according to the general scheme that bacterial produc-tion is sustained by the flow of organic matter pro-duced by the phytoplankton (Cole et al. 1988 and ref-erences therein). Using a more theoretical approach, ithas been shown that relatively simple food web mod-els, incorporating both predation and competition formineral nutrients, can exhibit 2 types of steady statescharacterised by a limitation of the growth rate of het-erotrophic bacteria by degradable organic-C or min-eral nutrients, respectively (Thingstad et al. 1997). Thisleads to a more subtle picture of the relationship be-tween nutrient loading, phytoplankton and bacteriathan the empirical observation ‘more phytoplankton—more degradable dissolved organic matter (DOM) —more bacterial production’. This theory seems able toexplain the main dynamical features in experimentalsystems in which natural pelagic communities aremanipulated with the addition of organic and inor-ganic nutrients (Thingstad et al. 1999). One inherentproblem in this theory, however, is the following: whydo bacteria not outcompete phytoplankton when lim-ited by the same mineral nutrient (Currie & Kalff1984)? This can be resolved by incorporating selectivepredation on the superior competitor, in this caseassumed to be the heterotrophic bacteria (Thingstad etal. 1998). The outcome in terms of biomass distributionbetween competing organisms is thus not explainableby competitive abilities alone, but has to incorporatethe effect of predation. Since prey size is normallybelieved to be a main factor determining predatorselectivity (Gonzales et al. 1990), the coexistence of thesmall autotrophic picoplankton and heterotrophic bac-teria (autotrophic picoplankton approach, and to someextent overlap, heterotrophic bacteria in size) is partic-ularly intriguing.
Coastal and pelagic ecosystems share the presenceof an active picoplankton community that includescyanobacteria, eukaryotic algae, heterotrophic bacte-ria (Azam et al. 1983, Li & Platt 1987) and viruses(Bergh et al. 1989). Coastal ecosystems are charac-terised by continuous or sporadic nutrient inputs (bothinorganic and organic) that favour the occurrence ofpopulations of large cells such as diatoms. These eco-systems display a cascade of trophic relationships andan efficient transfer of matter towards higher trophiclevels (Rivkin et al. 1996). In this context, the smallersize class of the plankton (the picoplankton) is viewedas a ‘background’ group in enriched coastal systems,although it may dominate these systems under nutri-ent-depleted conditions (Agawin et al. 2000). Theexpected response to increased nutrient input is there-fore an increase in biomass of the larger sized phyto-plankton, i.e. of the size class for which the time scaleof predator response is long (of the order of a week toa month). This was demonstrated experimentally in
open-ocean waters during the Ironex II experiment(see for example Cavender-Bares et al 1999).
Unfortunately, data on the response of the pico-plankton community are still very scarce (Ypma &Throndsen 1996). Open-field studies suffer from inher-ent problems with experimental manipulation, as wellas from difficulties in interpreting population changesin drifting water masses. Hence, mesocosms, althoughnot perfect representations of natural ecosystems be-cause of their ecological inertia and resilience (Egge& Heimdal 1994), constitute an interesting alternativeto field measurements to study various phenomenaoccurring in the marine environment such as pollution,effect of herbicides and pesticides, and/or trophic rela-tionships (Berg et al. 1999 and references therein).
During a field workshop in Isefjord waters (Den-mark) in June 1998, a mesocosm study was conductedusing 3 m3 enclosures in order to investigate theresponse of the microbial food web structure to dailyaddition of phosphorus, nitrogen and carbon. An effortwas made to sample several times a day to investigateshort time-scale variability in population abundanceand some cellular parameters (e.g. scatter and chloro-phyll fluorescence) measured by flow cytometry. Thisstrategy enabled us to investigate the following: whatare the effects of both inorganic and organic nutrientaddition on photosynthetic organisms vs heterotrophicbacteria competition within a coastal microbial com-munity?
MATERIALS AND METHODS
Study site and experimental set up. The mesocosmenrichment experiment was conducted in a coastalembayement of the Isefjord, located in the central east-ern part of Denmark (55° 42’ N, 11° 48’ E) from 16 to 26June 1998. Enclosures consisted of large nylon-armednatural polyethylene bags (Monarfold, Fjordblink PlastIndustries, Randers, Denmark), 3 m in length (straightdown) and 1.25 m in diameter at the top. On 15 June,1 d before the beginning of the experiment, they were
4
Table 1. Experimental design summary. Nutrients were ad-ded daily to each enclosure to obtain final concentrationsshown. N+P+10C corresponds to a 10 times carbon excess
compared to the Redfield ratio
Enclosure Added Final concentration (µM)nutients NaNO3 KH2PO4 C6H12O6
1 +N+P 1.6 0.1 –4 +N+P+10C 1.6 0.1 106.09 Nothing – – –11 +10C – – 106.0
Jacquet et al.: Coastal microbial food web
filled with approximately 3 m3 of fjord water sampled70 m from the coast (water depth 3.5 m). Water-columnhomogeneity inside the bags was ensured by an air-liftsystem (e.g. Egge & Heimdal 1994). Metallic scare-crows were installed at the top of each enclosure toprevent the introduction of faeces from perching birds.
Nutrient enrichment. The combinations of nutrientconcentrations used in this study are summarised inTable 1. Enrichments began in the evening of 16 Juneand were performed daily between 21:00 and 22:00 h(local time). Nutrient concentrations were measureddaily (Fig. 1) from samples taken between 9:00 and10:00 h.
Physical and environmental parameters. Water para-meters (temperature, salinity, and oxygen concentra-tion) were measured every day in all enclosures using
a multiparameter water-quality monitor (600 XL-200-M,Endeco/YSI, OH, USA). Weather parameters such aswind, irradiance level, cloud cover and rainfalls werealso monitored (not shown). The length of the day wasabout 18 h (sunrise at 4:00 to 4:30 h and sunset at 22:00to 22:30 h).
Sampling strategy. Sampling was performed onaverage 7 times a day (except for the first day) duringthe first week (between 16 and 19 June), and 10 to 11times a day during the second week (between 20 and26 June). The sampling interval was about 3 to 4 h, and2 h during the first and the second weeks, respectively.A small volume of water (about 10 ml) was sampled0.4 m under the surface and in the central part of the bagnear the water flow created by the air-mixing system.
Flow cytometry sample-processing and analysis.Samples were fixed with a mixture of glutaraldehydeand paraformaldehyde (0.05 and 1% final concentra-tion, respectively: see Jacquet et al. 1998) for 15 minin subdued light conditions and then frozen in liquidnitrogen. Back at the laboratory, they were kept at–80°C until flow cytometry (FCM) analysis with aFACSort instrument (Becton Dickinson, San Jose, CA,USA). FCM analyses of autotrophs, heterotrophic bac-teria and viruses were performed as described inMarie et al. (1999, 2000). Autotrophic populations werediscriminated on the basis of their forward- and right-angle light scatters (FALS and RALS), chlorophyll(chl) fluorescence and phycoerythrin (PE) fluorescencewhen available (Fig. 2A,B). Heterotrophic bacteria andviruses were stained using the nucleic acid dye SYBRGreen I (see Marie et al. 1999) and discriminated onthe basis of their FALS and RALS vs their green-DNAfluorescence (Fig. 2C,D,E). All cellular parameterswere normalised to the values measured for 0.95 µmbeads. Data were collected in listmode files and thenanalysed using CYTOWIN (Vaulot 1989, available atwww.sb-roscoff.fr/Phyto/cyto.html).
Confocal microscopy analysis. Some samples wereobserved using confocal laser scanning microscopy(CLSM, Fluoview, Olympus Optical Co., Tokyo, Japan)in order to identify some specific groups such as thelarge elongated bacteria (see below) and to measure cellsize of the heterotrophic bacterial community. Sampleswere filtered onto 0.2 µm pore-size inorganic membranefilters (Anodisc, Whatman™, Maidstone, UK). The filterwas placed onto a slide. A 20 µl mixture (50 to 50%) ofPBS (phosphate buffer saline, Sigma) and bi-distilledglycerol (d = 1.26, Fisher Scientific, Elancourt, France)was added with a drop of SYBR green I (1/1000 final con-centration). A 22 × 40 mm coverslip was overlaid onpreparation. Images were acquired with the Fluoviewsoftware and the cell size of the bacteria was computedusing Image Tools (T. Wilcox, Version 1.27, available atwww.uthscsa.edu/dig/download.html).
5
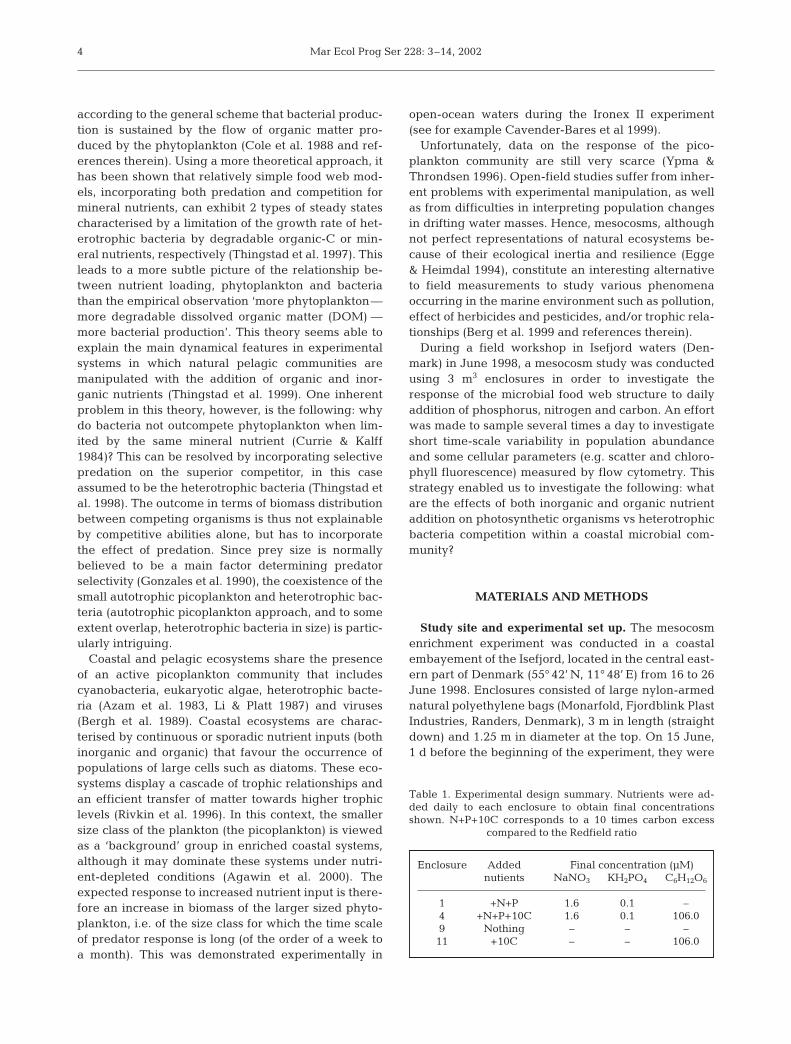
Fig. 1. Evolution of nutrient concentration. Nutrient additionsand measurements were performed once daily. P was neverdetected (limit of detection 0.16 µM); the threshold of detec-tion for N was 0.36 µM. (Data kindly provided by Rita
Muchitsch)
Mar Ecol Prog Ser 228: 3–14, 2002
Biomass estimation. Bacterial size, determined byconfocal microscopy and image analysis, allowed us toconvert cell number to biomass using the conversionfactor of 20 fgC cell–1 (Lee & Furhman 1987) for hetero-
trophic picobacteria ranging between 0.4 and 0.5 µmin diameter, and a factor of 53 fgC cell–1 for large elon-gated bacteria (Simon & Azam 1989). Average cell vol-umes for Synechococcus spp. and cryptophytes were
6
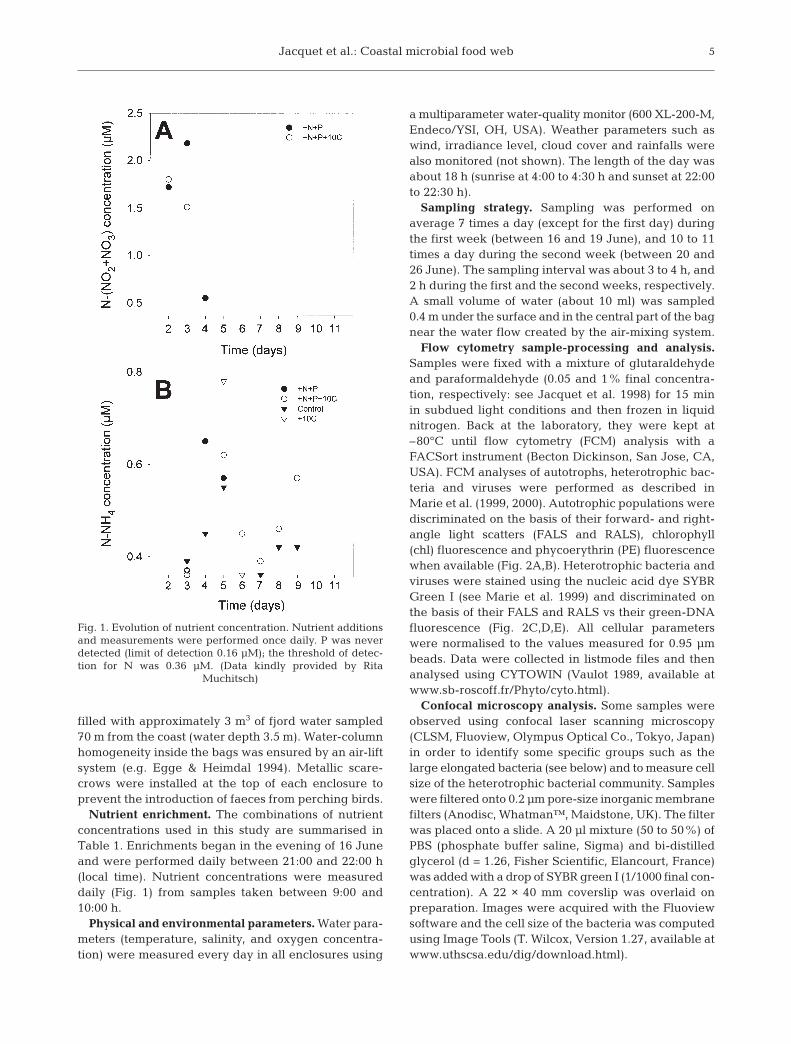
Fig. 2. Flow cytometric analysis of natural populations sampled in Enclosure 1 (09:00 h, 20 June 1998). On unstained samples,Synechococcus spp., cryptophytes and eukaryotic algae (Syn., Crypto., Euk1, 2 and 3, respectively) were discriminated on the ba-sis of forward angle light scatter (FALS) vs chlorophyll red fluorescence (A) or phycoerythrin orange fluorescence (B). On samplesstained with the DNA dye SYBR Green I, picobacteria (C) and Viruses V-I and V-II (D) were discriminated on the basis of the greenDNA-dye complex fluorescence vs right-angle light scatter (RALS). Large elongated bacteria were discriminated on the same ba-sis (E), using red vs green DNA fluorescence to verify they were not autotrophic cells (F). Insets on panel (F) correspond to photosobtained with the confocal microscope, illustrating both pico- and large elongated bacteria after staining with SYBR green
2 µm
Jacquet et al.: Coastal microbial food web
determined from 100 individual measurements andwere converted to cell carbon (pg) using conversionfactors of 0.22 pgC µm–3 for picocyanobacteria (Søn-dergaard et al. 1991) and 0.11 pgC µm–3 for crypto-phytes (Mullin et al. 1966). A value of 2108 fgC cell–1
was used for other eukaryotic algae (Verity et al. 1992).For viruses, a carbon content of 0.08 fgC virus–1 wasused according to Bratbak et al. (1992), assuming thatmost viruses had a mean size of 60 nm, a density of 1.4,and a carbon content of 50%.
Net growth rate estimation. Net growth rate (µ) wasestimated from cell numbers as follows:
where N(t1) and N(t2) are the average values (n = 2) ofthe population at the beginning (t1) and the end (t2) ofa 24 h sampling period (early morning), when no divi-sion occurs (as judged from the FCM signals).
RESULTS
Hydrographic parameters and nutrient evolution
Patterns recorded for temperature were similar in allenclosures during the course of the experiment (datanot shown). Temperature increased on average from14.5 to 18°C throughout the period of study. Salinitychanged very little, (between 21.2 and 21.7 PSU), as aresult of balance between evaporation and precipita-tion (data not shown). From 16 to 21 June, there was animportant increase in oxygen saturation in all theenclosures from 70–73% to 100–115%. Subsequently,oxygen decreased slightly for the +N+P-treated enclo-sure and more strongly in the other bags. The decreasewas especially marked in the +N+P+10C-treated bag(data not shown). Despite the daily additions, all theenclosures were depleted in PO4 (concentrationsalways below the threshold of detection). NO2+NO3
was detected at µM levels in the enclosures thatreceived +N+P additions for the first 3 d only (Fig. 1A).The presence of NH4, ranging from 0.1 to 0.8 µM, wasdetected in all bags from Day 3, but disappeared ra-pidly in both +N+P and +10C enclosures at Days 5 and6 respectively, in contrast to what was observed in theother 2 bags (Fig. 1B).
Microbial diversity
Five autotrophic populations could be discriminatedby FCM (Fig. 2A,B). Among these autotrophs, 2 popu-lations displayed strong orange fluorescence, most
likely due to phycoerythrin. The population with thesmaller scatter had a typical Synechococcus (cyano-bacterium) signature. We verified by epifluorescencemicroscopy (EFM) following flow cytometry sortingthat the larger population was composed of crypto-phytes and not of large cyanobacteria as reported inthe equatorial Pacific Ocean by Neveux et al. (1999).The same approach did not allow us to identify othereukaryotic populations. However, other data suggestthat they were most likely prymnesiophytes, prasino-phytes and dinoflagellates (see ‘Discussion’). These3 populations were named Euk1, Euk2 and Euk3(Fig. 2A). On Day 3, we observed a population of het-erotrophic bacteria with higher light scatter and DNAfluorescence (Fig. 2C,E,F) than the picobacteria pre-sent in the original seawater community. FCM sortingand EFM observation suggested that these cells werelarge elongated bacteria. Average picobacteria cell dia-meter was about 0.5 µm (SD = 0.14, n = 194), whereasthe length of large bacteria was about 2.3 µm on aver-age (SD = 0.5, n = 9, Fig. 2F: top inset). We observed 2distinct populations of viral particles (Fig. 2D), namedV-I and V-II following Marie et al. (1999).
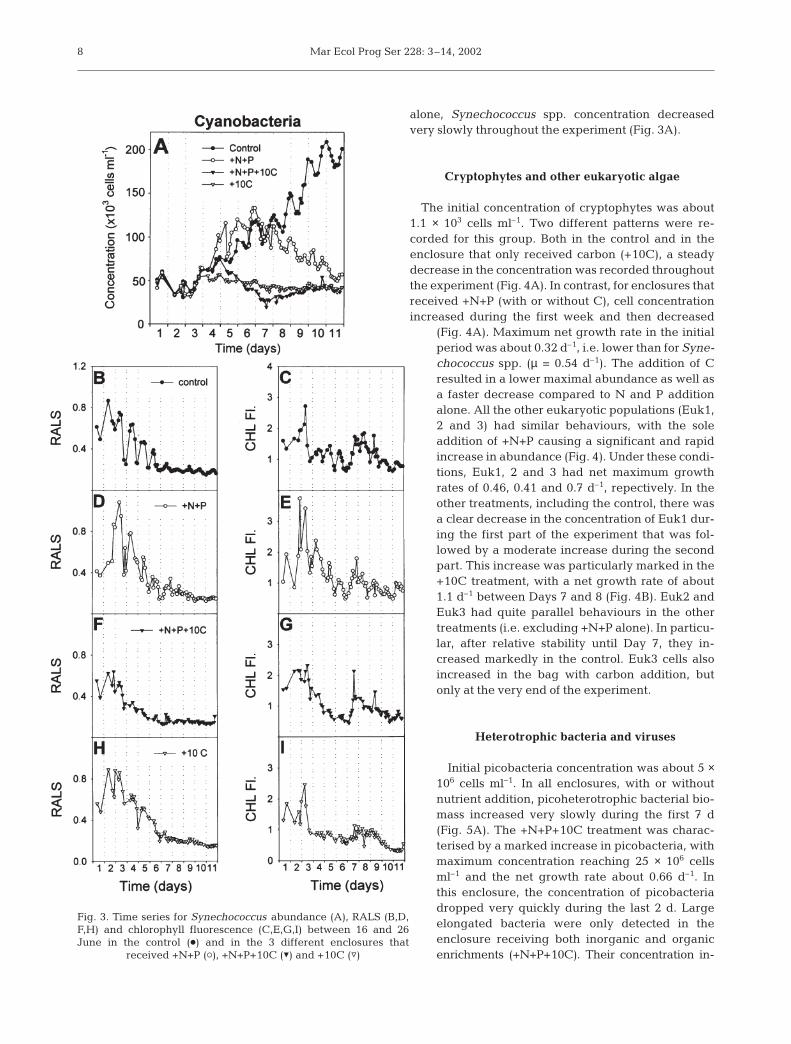
Synechococcus spp.
At the beginning of the experiment, the Synechococ-cus spp. concentration was about 5 × 10⁴ cells ml–1. Inall enclosures, an identical decrease in concentrationwas recorded between the first and the second days.Subseqently, each treatment induced a specific pattern.In the control, a clear and regular increase in cellconcentrations was observed throughout the experi-ment (Fig. 3A). Cell numbers displayed a diel patternwith minimum and maximum concentrations recordedaround 12:00 and 24:00 h, respectively. Average netgrowth rate was about 0.2 to 0.3 d–1 over the study pe-riod. Relative values of chl fluorescence and RALS de-creased significantly between the start of the experi-ment and the beginning of the second week (Fig. 3B,C).The addition of inorganic +N+P resulted in a bell-shaped pattern for cell number. During the period of in-crease, maximum net growth rate was about 0.54 d–1
(2-fold higher than in the control). Maximum concen-tration was reached on Day 6, followed by a steadydecrease. Both RALS and chl fluorescence increasedsignificantly compared to the control during the firstfew days, but thereafter returned to control values(Fig. 3D,E). Addition of +N+P+10C or of 10C alone re-sulted in only weak variations in cell abundance andpoorly defined diel patterns compared to the 2 previoustreatments (Fig. 3A). With +N+P+10C, Synechococcusspp. cell concentration increased slightly for about 4 d,and then dropped and stabilised. With +10C addition
µ =
( ) ( )[ ]( )
ln–
N t N tt t
2 1
2 1
7
Mar Ecol Prog Ser 228: 3–14, 2002
alone, Synechococcus spp. concentration decreasedvery slowly throughout the experiment (Fig. 3A).
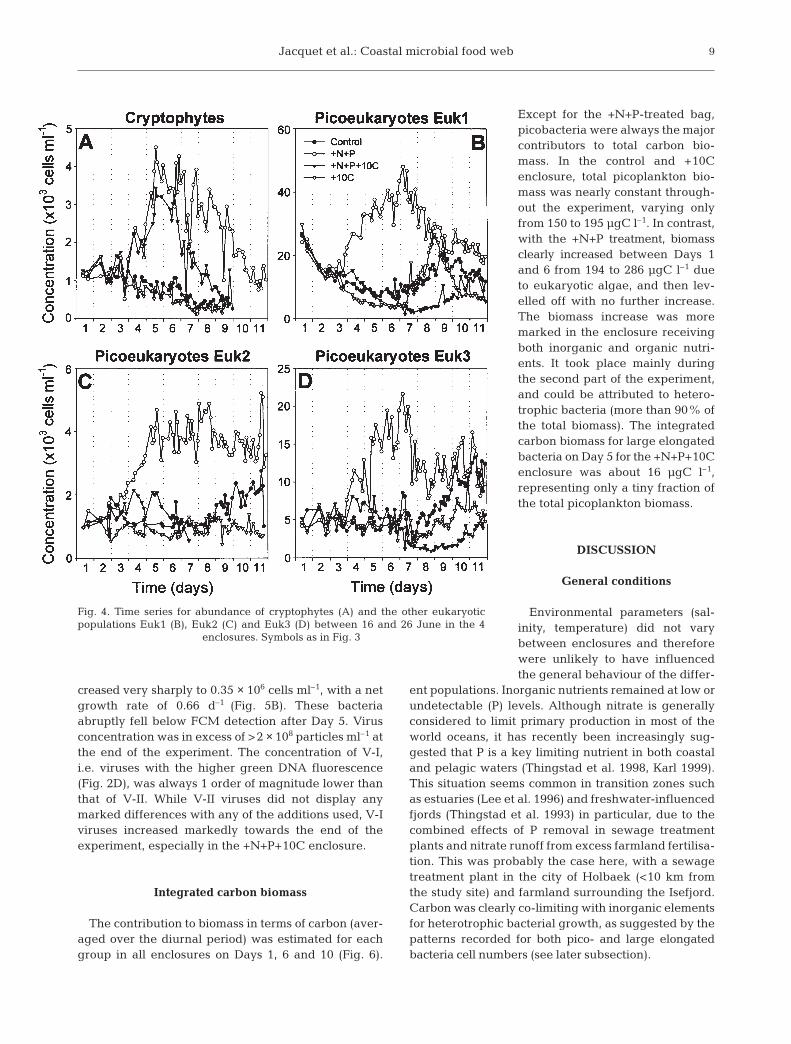
Cryptophytes and other eukaryotic algae
The initial concentration of cryptophytes was about1.1 × 103 cells ml–1. Two different patterns were re-corded for this group. Both in the control and in theenclosure that only received carbon (+10C), a steadydecrease in the concentration was recorded throughoutthe experiment (Fig. 4A). In contrast, for enclosures thatreceived +N+P (with or without C), cell concentrationincreased during the first week and then decreased
(Fig. 4A). Maximum net growth rate in the initialperiod was about 0.32 d–1, i.e. lower than for Syne-chococcus spp. (µ = 0.54 d–1). The addition of Cresulted in a lower maximal abundance as well asa faster decrease compared to N and P additionalone. All the other eukaryotic populations (Euk1,2 and 3) had similar behaviours, with the soleaddition of +N+P causing a significant and rapidincrease in abundance (Fig. 4). Under these condi-tions, Euk1, 2 and 3 had net maximum growthrates of 0.46, 0.41 and 0.7 d–1, repectively. In theother treatments, including the control, there wasa clear decrease in the concentration of Euk1 dur-ing the first part of the experiment that was fol-lowed by a moderate increase during the secondpart. This increase was particularly marked in the+10C treatment, with a net growth rate of about1.1 d–1 between Days 7 and 8 (Fig. 4B). Euk2 andEuk3 had quite parallel behaviours in the othertreatments (i.e. excluding +N+P alone). In particu-lar, after relative stability until Day 7, they in-creased markedly in the control. Euk3 cells alsoincreased in the bag with carbon addition, butonly at the very end of the experiment.
Heterotrophic bacteria and viruses
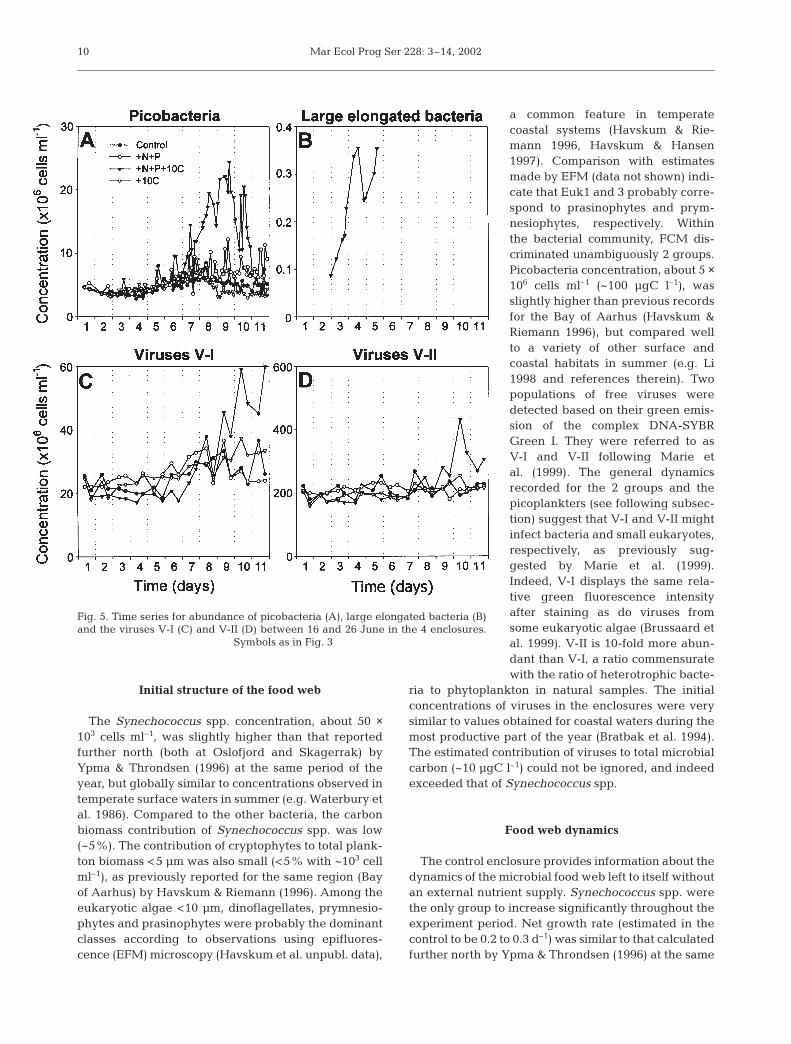
Initial picobacteria concentration was about 5 ×10⁶ cells ml–1. In all enclosures, with or withoutnutrient addition, picoheterotrophic bacterial bio-mass increased very slowly during the first 7 d(Fig. 5A). The +N+P+10C treatment was charac-terised by a marked increase in picobacteria, withmaximum concentration reaching 25 × 106 cellsml–1 and the net growth rate about 0.66 d–1. Inthis enclosure, the concentration of picobacteriadropped very quickly during the last 2 d. Largeelongated bacteria were only detected in theenclosure receiving both inorganic and organicenrichments (+N+P+10C). Their concentration in-
8
Fig. 3. Time series for Synechococcus abundance (A), RALS (B,D,F,H) and chlorophyll fluorescence (C,E,G,I) between 16 and 26June in the control (d) and in the 3 different enclosures that
received +N+P (s), +N+P+10C (z) and +10C (y)
Jacquet et al.: Coastal microbial food web
creased very sharply to 0.35 × 10⁶ cells ml–1, with a netgrowth rate of 0.66 d–1 (Fig. 5B). These bacteriaabruptly fell below FCM detection after Day 5. Virusconcentration was in excess of >2 × 10⁸ particles ml–1 atthe end of the experiment. The concentration of V-I,i.e. viruses with the higher green DNA fluorescence(Fig. 2D), was always 1 order of magnitude lower thanthat of V-II. While V-II viruses did not display anymarked differences with any of the additions used, V-Iviruses increased markedly towards the end of theexperiment, especially in the +N+P+10C enclosure.
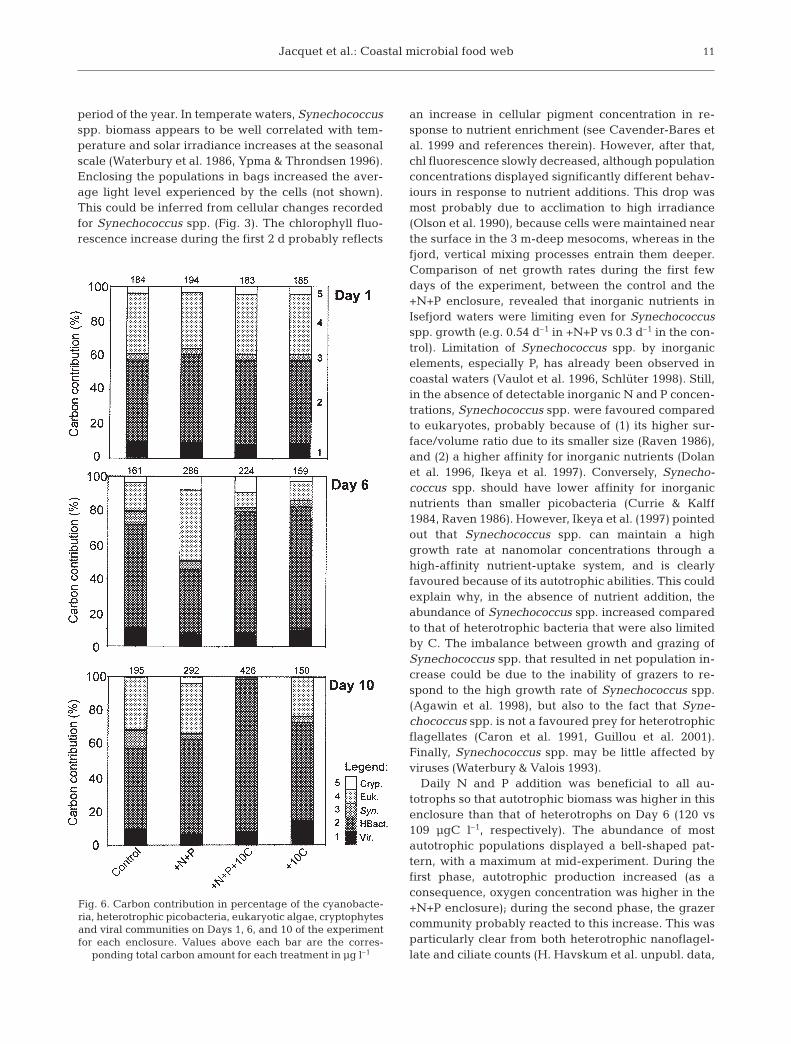
Integrated carbon biomass
The contribution to biomass in terms of carbon (aver-aged over the diurnal period) was estimated for eachgroup in all enclosures on Days 1, 6 and 10 (Fig. 6).
Except for the +N+P-treated bag,picobacteria were always the majorcontributors to total carbon bio-mass. In the control and +10Cenclosure, total picoplankton bio-mass was nearly constant through-out the experiment, varying onlyfrom 150 to 195 µgC l–1. In contrast,with the +N+P treatment, biomassclearly increased between Days 1and 6 from 194 to 286 µgC l–1 dueto eukaryotic algae, and then lev-elled off with no further increase.The biomass increase was moremarked in the enclosure receivingboth inorganic and organic nutri-ents. It took place mainly duringthe second part of the experiment,and could be attributed to hetero-trophic bacteria (more than 90% ofthe total biomass). The integratedcarbon biomass for large elongatedbacteria on Day 5 for the +N+P+10Cenclosure was about 16 µgC l–1,representing only a tiny fraction ofthe total picoplankton biomass.
DISCUSSION
General conditions
Environmental parameters (sal-inity, temperature) did not varybetween enclosures and thereforewere unlikely to have influencedthe general behaviour of the differ-
ent populations. Inorganic nutrients remained at low orundetectable (P) levels. Although nitrate is generallyconsidered to limit primary production in most of theworld oceans, it has recently been increasingly sug-gested that P is a key limiting nutrient in both coastaland pelagic waters (Thingstad et al. 1998, Karl 1999).This situation seems common in transition zones suchas estuaries (Lee et al. 1996) and freshwater-influencedfjords (Thingstad et al. 1993) in particular, due to thecombined effects of P removal in sewage treatmentplants and nitrate runoff from excess farmland fertilisa-tion. This was probably the case here, with a sewagetreatment plant in the city of Holbaek (<10 km fromthe study site) and farmland surrounding the Isefjord.Carbon was clearly co-limiting with inorganic elementsfor heterotrophic bacterial growth, as suggested by thepatterns recorded for both pico- and large elongatedbacteria cell numbers (see later subsection).
9
Fig. 4. Time series for abundance of cryptophytes (A) and the other eukaryoticpopulations Euk1 (B), Euk2 (C) and Euk3 (D) between 16 and 26 June in the 4
enclosures. Symbols as in Fig. 3
Mar Ecol Prog Ser 228: 3–14, 2002
Initial structure of the food web
The Synechococcus spp. concentration, about 50 ×103 cells ml–1, was slightly higher than that reportedfurther north (both at Oslofjord and Skagerrak) byYpma & Throndsen (1996) at the same period of theyear, but globally similar to concentrations observed intemperate surface waters in summer (e.g. Waterbury etal. 1986). Compared to the other bacteria, the carbonbiomass contribution of Synechococcus spp. was low(~5%). The contribution of cryptophytes to total plank-ton biomass <5 µm was also small (<5% with ~103 cellml–1), as previously reported for the same region (Bayof Aarhus) by Havskum & Riemann (1996). Among theeukaryotic algae <10 µm, dinoflagellates, prymnesio-phytes and prasinophytes were probably the dominantclasses according to observations using epifluores-cence (EFM) microscopy (Havskum et al. unpubl. data),
a common feature in temperatecoastal systems (Havskum & Rie-mann 1996, Havskum & Hansen1997). Comparison with estimatesmade by EFM (data not shown) indi-cate that Euk1 and 3 probably corre-spond to prasinophytes and prym-nesiophytes, respectively. Withinthe bacterial community, FCM dis-criminated unambiguously 2 groups.Picobacteria concentration, about 5 ×10⁶ cells ml–1 (~100 µgC l–1), wasslightly higher than previous recordsfor the Bay of Aarhus (Havskum &Riemann 1996), but compared wellto a variety of other surface andcoastal habitats in summer (e.g. Li1998 and references therein). Twopopulations of free viruses weredetected based on their green emis-sion of the complex DNA-SYBRGreen I. They were referred to asV-I and V-II following Marie etal. (1999). The general dynamicsrecorded for the 2 groups and thepicoplankters (see following subsec-tion) suggest that V-I and V-II mightinfect bacteria and small eukaryotes,respectively, as previously sug-gested by Marie et al. (1999).Indeed, V-I displays the same rela-tive green fluorescence intensityafter staining as do viruses fromsome eukaryotic algae (Brussaard etal. 1999). V-II is 10-fold more abun-dant than V-I, a ratio commensuratewith the ratio of heterotrophic bacte-
ria to phytoplankton in natural samples. The initialconcentrations of viruses in the enclosures were verysimilar to values obtained for coastal waters during themost productive part of the year (Bratbak et al. 1994).The estimated contribution of viruses to total microbialcarbon (~10 µgC l–1) could not be ignored, and indeedexceeded that of Synechococcus spp.
Food web dynamics
The control enclosure provides information about thedynamics of the microbial food web left to itself withoutan external nutrient supply. Synechococcus spp. werethe only group to increase significantly throughout theexperiment period. Net growth rate (estimated in thecontrol to be 0.2 to 0.3 d–1) was similar to that calculatedfurther north by Ypma & Throndsen (1996) at the same
10
Fig. 5. Time series for abundance of picobacteria (A), large elongated bacteria (B)and the viruses V-I (C) and V-II (D) between 16 and 26 June in the 4 enclosures.
Symbols as in Fig. 3
Jacquet et al.: Coastal microbial food web
period of the year. In temperate waters, Synechococcusspp. biomass appears to be well correlated with tem-perature and solar irradiance increases at the seasonalscale (Waterbury et al. 1986, Ypma & Throndsen 1996).Enclosing the populations in bags increased the aver-age light level experienced by the cells (not shown).This could be inferred from cellular changes recordedfor Synechococcus spp. (Fig. 3). The chlorophyll fluo-rescence increase during the first 2 d probably reflects
an increase in cellular pigment concentration in re-sponse to nutrient enrichment (see Cavender-Bares etal. 1999 and references therein). However, after that,chl fluorescence slowly decreased, although populationconcentrations displayed significantly different behav-iours in response to nutrient additions. This drop wasmost probably due to acclimation to high irradiance(Olson et al. 1990), because cells were maintained nearthe surface in the 3 m-deep mesocoms, whereas in thefjord, vertical mixing processes entrain them deeper.Comparison of net growth rates during the first fewdays of the experiment, between the control and the+N+P enclosure, revealed that inorganic nutrients inIsefjord waters were limiting even for Synechococcusspp. growth (e.g. 0.54 d–1 in +N+P vs 0.3 d–1 in the con-trol). Limitation of Synechococcus spp. by inorganicelements, especially P, has already been observed incoastal waters (Vaulot et al. 1996, Schlüter 1998). Still,in the absence of detectable inorganic N and P concen-trations, Synechococcus spp. were favoured comparedto eukaryotes, probably because of (1) its higher sur-face/volume ratio due to its smaller size (Raven 1986),and (2) a higher affinity for inorganic nutrients (Dolanet al. 1996, Ikeya et al. 1997). Conversely, Synecho-coccus spp. should have lower affinity for inorganicnutrients than smaller picobacteria (Currie & Kalff1984, Raven 1986). However, Ikeya et al. (1997) pointedout that Synechococcus spp. can maintain a highgrowth rate at nanomolar concentrations through ahigh-affinity nutrient-uptake system, and is clearlyfavoured because of its autotrophic abilities. This couldexplain why, in the absence of nutrient addition, theabundance of Synechococcus spp. increased comparedto that of heterotrophic bacteria that were also limitedby C. The imbalance between growth and grazing ofSynechococcus spp. that resulted in net population in-crease could be due to the inability of grazers to re-spond to the high growth rate of Synechococcus spp.(Agawin et al. 1998), but also to the fact that Syne-chococcus spp. is not a favoured prey for heterotrophicflagellates (Caron et al. 1991, Guillou et al. 2001).Finally, Synechococcus spp. may be little affected byviruses (Waterbury & Valois 1993).
Daily N and P addition was beneficial to all au-totrophs so that autotrophic biomass was higher in thisenclosure than that of heterotrophs on Day 6 (120 vs109 µgC l–1, respectively). The abundance of mostautotrophic populations displayed a bell-shaped pat-tern, with a maximum at mid-experiment. During thefirst phase, autotrophic production increased (as aconsequence, oxygen concentration was higher in the+N+P enclosure); during the second phase, the grazercommunity probably reacted to this increase. This wasparticularly clear from both heterotrophic nanoflagel-late and ciliate counts (H. Havskum et al. unpubl. data,
11
Fig. 6. Carbon contribution in percentage of the cyanobacte-ria, heterotrophic picobacteria, eukaryotic algae, cryptophytesand viral communities on Days 1, 6, and 10 of the experimentfor each enclosure. Values above each bar are the corres-
ponding total carbon amount for each treatment in µg l–1
Mar Ecol Prog Ser 228: 3–14, 2002
Perez et al. unpubl. data). Net growth rates of eukary-otic populations (i.e. 0.32, 0.46, 0.41 and 0.7 d–1 for thecryptophytes, Euk1, 2 and 3 respectively) fell into a2-fold range, but were comparable to that of Synecho-coccus spp., suggesting a good efficiency in using highnutrient concentrations and a limited impact of grazersand/or viruses, at least at the beginning of populationgrowth. In contrast to autotrophs, heterotrophic bacter-ial populations only increased slightly in response to+N+P addition, most likely because of DOC limitation(see below). At first sight, there was only a weak varia-tion in the abundance of free pelagic viruses betweenthis enclosure and the control, suggesting that virusesare little affected by changes in the autotrophic com-partment and may be more related to the heterotrophs.However, the slight increase in the higher DNA-fluorescing V-I particles that followed (with a 2 d lag)that of the eukaryotes could suggest that V-I are in-deed infectious to eukaryotes as suggested above, andthat +N+P favoured the production of eukaryotic lyticviruses (Wilson et al. 1998). It was not possible from ourdata to verify this assumption, which should be consid-ered with caution until further investigation.
Addition of glucose alone led to very similar patternsfor all communities. Virtually no change occurred dur-ing the first week, followed by a slight increase or nochange for the second period. In particular, the factthat heterotrophic bacteria remained at constant levelsstrongly suggests that carbon was not the sole limitingfactor for their growth and that inorganic nutrientswere also involved. The most striking effect of carbonaddition alone compared to the control was the ab-sence of increase in Synechococcus spp., probablybecause, when glucose was added, heterotrophic bac-teria could outcompete Synechococcus spp. in the useof the very low concentration of inorganic nutrient pre-sent in the enclosure. This assumption is in agreementwith the lower affinity of Synechococcus spp. for inor-ganic nutrients than picobacteria when C is available.In our case, it is likely that predation pressure equalledpopulation growth. These results are in agreementwith the idealised food-web model proposed by Thing-stad et al. (1999) based on heterotrophic bacteria,cyanobacteria and phototrophic eukaryotes with 1 dis-tinct predator for each of these groups. In Thingstad’smodel, the sum of the biomass of cyanobacteria and ofpredators on heterotrophic bacteria is invariant anddoes not depend on what limits bacterial growth rate(Thingstad et al. 1999). Switching from C-limitation tomineral nutrient limitation, as done here by adding asurplus of glucose, is predicted to shift the biomass dis-tribution: cyanobacteria decrease and heterotrophicflagellates preying on heterotrophic bacteria increase(Thingstad et al. 1999). Indeed, a net increase in theamount of heterotrophic nanoflagellates was recorded
during our experiment (Perez et al. unpubl. data).The addition of both inorganic and organic nutrients
induced the most important changes inside the micro-bial community. Both auto- and heterotrophic groupscompeted for the available resources. The addition of+N+P+10C was not followed by an immediate increasein picobacteria abundance, and the most important re-sponse was registered for larger heterotrophic cells andcryptophytes. Large elongated bacteria were only de-tected in this enclosure, and therefore clearly requiredboth organic and inorganic nutrients. They were proba-bly not the result of growth of smaller cells, since suchlarge bacteria were already detected by EFM (in verylow numbers) at the beginning of the experiment. Thisopportunistic population displayed higher net growthrate than picobacteria, suggesting that it could be a bet-ter competitor at high nutrient concentrations and moreresistant to grazing by fast-growing nanoflagellates(Caron et al. 1999). Its rapid disappearance aroundDay 5 was probably the result of a virus-induced celllysis or of strong grazing pressure by larger bacteri-vores such as ciliates. During this first week, autotrophincrease was very limited and ceased abruptly, mostprobably because of the strong grazing pressure fromboth nanoflagellates and ciliates, which increasedmarkedly in the same period (Perez et al. unpubl. data).Compared to the other eukaryotes, cryptophyte abun-dance increased markedly in response to +N+P+10Caddition, suggesting a very different strategy forgrowth. Their heterotrophic capacity, via either osmo-trophy or phagotrophy (Gervais 1997, Maranger et al.1998), may give them a competitive advantage over theother autotrophic groups when both inorganic and or-ganic nutrients are available. The faster decrease ofcryptophytes in this enclosure compared to the +N+Penclosure also suggested that they were rapidly grazed.The weak increase of Synechococcus spp. abundancerecorded during the first few days was followed by a
12
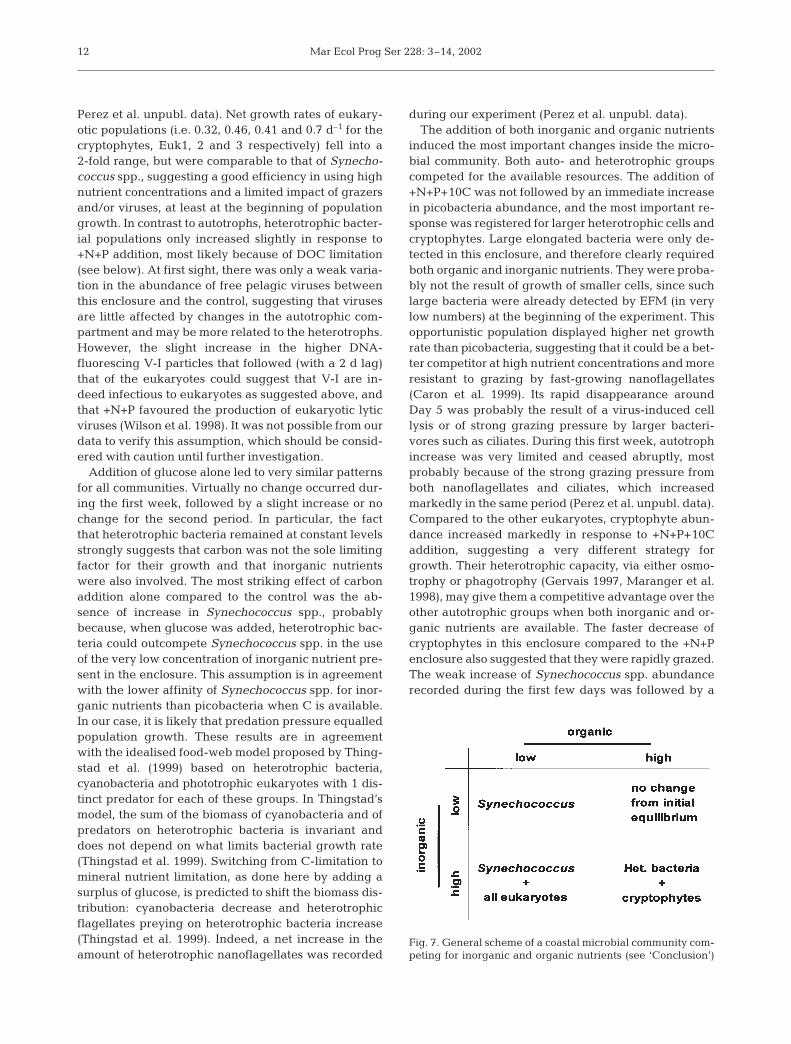
Fig. 7. General scheme of a coastal microbial community com-peting for inorganic and organic nutrients (see ‘Conclusion’)
Jacquet et al.: Coastal microbial food web
net decrease, confirming that Synechococcus spp. wereoutcompeted by bacteria for inorganic nutrients whenlabile DOC was available (see above). The general in-crease in virus abundances towards the end of the ex-periment may have been caused by the nutritionallyfavourable conditions for virus multiplication. Indeed, ithas been suggested that viruses are favoured by highenergy input and biological productivity (Bratbak et al.1994) which, here, could be related to the highest bac-terial growth rate. The parallel evolution of both het-erotrophic bacteria and viruses suggests that bacterialactivity affected viral dynamics which, in turn, couldhave influenced the structure and diversity of the mi-crobial community (Tuomi et al. 1995).
CONCLUSION
Understanding the effects of nutrient addition onautotroph vs heterotroph competition within coastalmicrobial communities is very important to conceptu-alise the functioning of food webs. Heterotrophic bac-teria that are the main recyclers of organic matter inmarine systems have often been portrayed as depen-dent on primary production and protozoan predation.This view has to be enlarged to take into accountthe shift between mineral nutrient- vs carbon-limitedgrowth of the heterotrophic bacteria. We have shownhere that such a shift does not only influence the suc-cess of the heterotrophic bacteria themselves, but alsoinfluences the success of their trophic neighbours inthe food web. The main conclusions have been sum-marised in Fig. 7. Very schematically, under limitingconditions, smaller cells are clearly favoured. Thus,when both C and inorganic nutrients are limiting,Synechococcus spp. are favoured because of theirautotrophic capacity. Addition of carbon is unfavour-able to Synechococcus spp. because they are now out-competed by bacteria for inorganic nutrient resources.However, heterotrophic bacteria still do not increasecompared to the control situation because the initialnutrient stock is low (no additions made) and becausebacteria are efficiently grazed. Conversely, when inor-ganic nutrients alone are added, all autotrophs increase,especially large cells (cryptophytes and picoeukary-otes), which are the best competitors. However, if car-bon is added as well, heterotrophic bacteria are ‘thewinners’ along with cryptophytes, probably because ofthe heterotrophic capacity of the latter.
Acknowledegments. This work was supported by contractMAS3-CT95-0016 (MEDEA) from the European Commis-sion and by a doctoral fellowship from the Ministère de laRecherche et de l’Enseignement Supérieur granted to S.J.We wish to thank Jan C. Bangsholt and Rita Muchitsch from
The International Agency for 14C Determination (Hørsholm,Denmark) for physical and nutrient data. We are grateful toJean-François Lennon for technical assistance when using theconfocal microscope. We are grateful to all the workshop par-ticipants for helpful discussion and for the excellent atmo-sphere that prevailed at the Søminestationen. Three anony-mous reviewers and the editor are acknowledged for theirsuggestions on the manuscript.
LITERATURE CITED
Agawin NSR, Duarte CM, Agusti S (1998) Growth and abun-dance of Synechococcus sp. in a Mediterranean Bay: sea-sonality and relationship with temperature. Mar Ecol ProgSer 170:45–53
Agawin NSR, Duarte CM, Agusti S (2000) Nutrient and tem-perature control of the contribution of picoplankton tophytoplankton biomass and production. Limnol Oceanogr45:591–600
Azam F, Fenchel T, Field JG, Gray JS, Meyer-Reil LA,Thingstad F (1983) The ecological role of water-columnmicrobes in the sea. Mar Ecol Prog Ser 10:257–263
Berg GM, Gilbert PM, Chen CC (1999) Dimension effects ofenclosures on ecological processes in pelagic systems.Limnol Oceanogr 44:1331–1340
Bergh O, Borsheim KY, Bratbak G, Heldal M (1989) Highabundances of viruses found in aquatic environments.Nature 340:467–468
Bratbak G, Heldal M, Thingstad TF, Riemann B, HaslundOH (1992) Incorporation of viruses into the budget ofmicrobial C-transfer. A first approach. Mar Ecol Prog Ser83:273–280
Bratbak G, Thingstad TF, Heldal M (1994) Viruses and themicrobial loop. Microb Ecol 28:209–221
Brussard CPD, Thyrhaug R, Marie D, Bratbak G (1999) Flowcytometric analyses of viral infection in two marine phyto-plankton species, Micromonas pusilla (Prasinophyceae)and Phaeocystis pouchetii (Prymnesiophyceae). J Phycol35:941–948
Caron DA, Lin LE, Miceli G, Waterbury JB, Valois FW (1991)Grazing and utilisation of chroococcoid cyanobacteria andheterotrophic bacteria by protozoa in laboratory culturesand a coastal plankton community. Mar Ecol Prog Ser 76:205–217
Caron DA, Peele ER, Lim LE, Dennett MR (1999) Picoplank-ton and nanoplankton and their trophic coupling in sur-face waters of the Sargasso Sea south of Bermuda. LimnolOceanogr 44:259–272
Cavender-Bares KK, Mann E, Chisholm SW, Ondrusek ME,Bidigare RR (1999) Differential response of EquatorialPacific phytoplankton to iron fertilization. Limnol Ocean-ogr 44:237–246
Cole JJ, Findlay S, Pace ML (1988) Bacterial production infresh and seawater ecosystem: a cross-system overview.Mar Ecol Prog Ser 43:1–10
Currie D, Kalff J (1984) Can bacteria outcompete phytoplank-ton for phosphorus? A chemostat test. Microb Ecol 10:205–216
Dolan JR, Thingstad TF, Rassoulzadegan F (1996) Phosphorustransfer between microbial size-fractions in VillefrancheBay (North Western Mediterranean Sea), France, inautumn 1992. Ophelia 41:15–22
Egge JK, Heimdal BR (1994) Blooms of phytoplankton includ-ing Emiliania huxleyi (Haptophyta): effects of nutrientsupply in different N:P ratios. Sarsia 79:333–348
Gervais F (1997) Light-dependent growth, dark survival, and
13
Mar Ecol Prog Ser 228: 3–14, 2002
glucose uptake by cryptophytes isolated from a freshwaterthemocline. J Phycol 33:18–25
Gonzales JM, Sherr EB, Sherr BF (1990) Size-selective graz-ing on bacteria by natural assemblages of estuarine flagel-lates and ciliates. Appl Environ Microbiol 56:583–589
Guillou L, Jacquet S, Chrétiennot-Dinet MJ, Vaulot D (2001)Grazing impact of two small heterotrophic flagellates onProchlorococcus and Synechococcus. Aquat Microb Ecol26:201–207
Havskum H, Hansen AS (1997) Importance of pigmented andcolourless nano-sized protists as grazers on nanoplanktonin a phosphate-depleted Norwegian fjord and in enclo-sures. Aquat Microb Ecol 12:139–151
Havskum H, Riemann B (1996) Ecological importance of bac-terivorous, pigmented flagellates (mixotrophs) in the Bayof Aarhus, Denmark. Mar Ecol Prog Ser 137:251–263
Ikeya T, Ohki K, Takahashi M, Fujita Y (1997) Study on phos-phate uptake of the marine cyanophyte Synechococcussp. NIBB 1071 in relation to oligotrophic environments inthe open ocean. Mar Biol 129:195–202
Jacquet S, Lennon JF, Marie D, Vaulot D (1998) Picoplanktonpopulation dynamics in coastal waters of the NW Mediter-ranean Sea. Limnol Oceanogr 43:1916–1931
Karl DM (1999) A sea of change: biogeochemical variability inthe North Pacific subtropical gyre. Ecosystems 2:181–214
Lee S, Fuhrman JA (1987) Relationships between biovolumeand biomass of naturally derived marine bacterioplank-ton. Appl Environ Microbiol 53:1298–1303
Lee YS, Seiki T, Mukai T, Takimoto K, Okada M (1996) Limit-ing nutrients of phytoplankton community in HiroshimaBay, Japan. Water Res 30:1490–1494
Li WKW (1998) Annual average abundance of heterotrophicbacteria and Synechococcus in surface ocean waters.Limnol Oceanogr 43:1746–1753
Li WKW, Platt T (1987) Photosynthetic picoplankton in theocean. Sci Prog 71:117–132
Maranger R, Bird DF, Price NM (1998) Iron acquisition byphotosynthetic marine phytoplankton from ingested bac-teria. Nature 396:248–251
Marie D, Brussaard C, Bratbak G, Vaulot D (1999) Enumera-tion of marine viruses in culture and natural samples byflow cytometry. Appl Environ Microbiol 65:45–52
Marie D, Partensky F, Simon N, Guillou L, Vaulot D (2000) Flowcytometry analysis of marine picoplankton. In: Diamond RA,DeMaggio S (eds) Living colors: protocols in flow cytometryand cell sorting. Springer-Verlag, Berlin, p 422–454
Mullin MM, Sloan PR, Eppley PW (1966) Relationship be-tween carbon content, cell volume, and area in phyto-plankton. Limnol Oceanogr 11:307–311
Neveux J, Lantoine F, Vaulot D, Marie D, Blanchot J (1999)Phycoerythrins in the southern tropical and equatorialPacific Ocean: evidence for new cyanobacterial types.J Geophys Res 104:3311–3321
Olson RJ, Chisholm SW, Zettler ER, Armbrust EV (1990) Pig-ment, size and distribution of Synechococcus in the NorthAtlantic and Pacific Ocean. Limnol Oceanogr 35:45–48
Raven JA (1986) Physiological consequence of extremelysmall size in autotrophic organisms in the sea. Can BullFish Aquat Sci 214:1–70
Rivkin RB and 18 others (1996) Vertical flux of biogenic car-
bon in the ocean: is there food web control? Science 272:1163–1166
Schlüter L (1998) The influence of nutrient addition on growthrates of phytoplankton groups, and microzooplanktongrazing rates in a mesocosm experiment. J Exp Mar BiolEcol 228:53–71
Simon M, Azam F (1989) Protein content and protein synthe-sis rates of planktonic marine bacteria. Mar Ecol Prog Ser51:201–213
Søndergaard M, Jensen LM, Ærtebjerg G (1991) Picoalgae inDanish coastal waters during summer stratification. MarEcol Prog Ser 79:139–149
Thingstad TF, Heldal M, Bratbak G, Dundas I (1993) Areviruses important partners in pelagic food webs? TrendsEcol Evol 8:209–213
Thingstad TF, Bratbak G, Heldal M, Dundas I (1997) Trophicinteractions controlling the diversity in pelagic microbialfood webs. In: Martins MT (ed) Progress in microbial eco-logy, Brazilian Society for Microbiology, Rio de Janeiro,p 107–114
Thingstad TF, Zweifel UL, Rassoulzadegan F (1998) Indica-tions of P-limitation for heterotrophic bacteria and phy-toplankton in the NW Mediterranean summer surfacewaters. Limnol Oceanogr 43:88–94
Thingstad TF, Perez M, Pelegri S, Dolan JR, Rassoulzade-gan F (1999) Trophic control of bacterial growth in micro-cosms containing a natural community from northwestMediterranean surface waters. Aquat Microb Ecol 18:145–156
Tuomi P, Fagerbakke KM, Bratbak G, Heldal M (1995)Nutritional enrichment of a microbial community: theeffects on activity, elemental composition, communitystructure and virus production. FEMS Microbiol Ecol16:123–134
Vaulot D (1989) CytoPC: processing software for flow cyto-metric data. Signal Noise 2:8
Vaulot D, Lebot N, Marie D, Fukai E (1996) Effect of phos-phorus on the Synechococcus cell cycle in surface inMediterranean waters during summer. Appl EnvironMicrob 132:265–274
Verity PG, Robertson CY, Tronzo CR, Andrews MG, NelsonJR, Sieracki ME (1992) Relationships between cell volumeand the carbon and nitrogen content of marine photosyn-thetic nanoplankton. Limnol Oceanogr 37:1434–1446
Waterbury JB, Valois FW (1993) Resistance to co-occuringphages enables marine Synechococcus communities tocoexist with cyanophages abundant in seawater. ApplEnviron Microbiol 59:3393–3399
Waterbury JB, Watson SW, Valois FW, Franks DG (1986) Bio-logical and ecological characterisation of the marine uni-cellular cyanobacterium Synechococcus. Can Bull FishAquat Sci 214:71–120
Wilson WH, Turner S, Mann NH (1998) Population dynamicsof phytoplankton and viruses in a phosphate-limited meso-cosm and their effect on DMSP and DMS production.Estuar Coast Shelf Sci 46:49–59
Ypma JE, Throndsen J (1996) Seasonal dynamics of bacteria,autotrophic picoplankton and small nanoplankton in theinner Oslofjord and the Skagerrak in 1993. Sarsia 81:57–66
14
Editorial responsibility: Otto Kinne (Editor), Oldendorf/Luhe, Germany
Submitted: October 18, 2000; Accepted: August 14, 2001Proofs received from author(s): February 12, 2002