Embed Size (px)
Citation preview

Effects of Information Technology and Innovative Human Resource Management Techniques on
Productivity and Wages in Europe
Kelvin Wee Chiang See1
(Advisor: Professor Kathryn Shaw)
10 April 2003
Abstract U.S. enterprises have increased their usage of sets of new HRM practices over the last decade and it is typical for a U.S. business to have several of these innovations for managing its workforce. Comparatively, there has been a lot more literature and studies on the effects of innovative HRM and IT amongst U.S. businesses than their European counterparts. In this study, I will review the different techniques of innovative human resource management practices that have been introduced in the European labor market, especially the major countries and also review the effects that these innovative HRM practices and the introduction of IT have on the wages and productivity of the workforce. 1. Department of Economics, Graduate School of Industrial Administration, Carnegie Mellon University
1
1 Introduction
“Not many organizations, even global ones, have a strategic framework for HR. Most companies simply use a ‘multidomestic approach’ – the culture of the place they’re headquartered in tends to drive the overall company culture.”
Reed Keller
Global Human Resource Solutions In recent years of rapid technological advancements and the widespread popularity of the Internet, human capital has gained prominence as the key factor for success in enterprises. In the past, investments in key infrastructure have been the key to economic success, but with the emergence of the “New Economy”, economic management has shifted to a new paradigm. A workforce with the ability to absorb, process and apply knowledge is now the key source of wealth and opportunities. An enterprise’s real value and success is no longer found in its fixed assets or capital but in its human and intellectual capital. In the face of increasing global competition and rapid changes, enterprises are beginning to outsource services, downsize manpower and focus on upgrading capabilities in their competencies to bring about greater innovation. For enterprises to remain competitive, it is imperative that they show a reinvigorated commitment to their employees. Hence, this calls out for a new paradigm for human resource management. This model will enable the human resource management function to play a pivotal role in the management of the enterprise as a whole. We subcategorized this paradigm into two main parts, the first part being ‘Innovative Human Resource Management Practices’ and the second part being ‘Information Technology and R&D’. The former includes the usage of new HRM techniques like the usage of problem-solving teams to manage the workforce in place of the traditional techniques like top-down hierarchical management. The latter includes the introduction and usage of information technology, in particular the computer, into the enterprise, especially with the Internet boom and the rapidly declining cost of such technologies, we feel that it is increasing important not to exclude this important element into the daily management of the workforce. In this study, we will review the different techniques of innovative human resource management practices that have been introduced in the European labor market, especially the major countries and also review the effects that these innovative HRM practices and the introduction of IT have on the wages and productivity of the workforce. 1.1 European versus American labor market U.S. enterprises have increased their usage of sets of new HRM practices over the last decade and it is typical for a U.S. business to have several of these innovations for managing its workforce (Shaw and Ichniowski, 2002). Comparatively, there has been a lot more literature and studies on the effects of innovative HRM and IT amongst U.S. businesses than their European counterparts. (see Gibbons 1998; Lazear 1999; Prendergast, 1999). In order to better understand the European labor market, it is probably best to take a look at the differences between it and the labor market in the U.S. and understand the situation in Europe before ‘plunging’ into the literature to review the existence and effects of the new emerging paradigm that we introduced earlier.
2
Firstly, the obvious difference between the two markets is that the worker composition amongst the U.S workforce is probably more homogenous than that of its European counterpart, which consists of a lot more different cultures, languages and working conditions. Given that a huge percentage of the U.S workforce actually originates from different nationalities and culture, a huge part of this workforce has been ‘Americanized’, ie they speak English and they are subjected to the largely the same labor policies throughout the entire country. The European labor market is obviously more diverse in all aspects, including the different labor policies made by their individual governments. Also, in Europe, firms are more restricted in levels of organization autonomy as compared to their U.S counterparts. In other words, they do not have as much freedom to ‘innovate’ in their HRM practices and also they have lower exposure to market processes. Also, social partners like trade and labor unions play a more active role in the European labor market compared to the unions in the U.S. and there are also higher levels of government intervention, especially in countries like Britain and Germany. The European patterns of HRM can be subdivided into these few different categories:
a. Differential business structures & systems b. Powerful public sectors c. Small family-owned businesses d. Institutional context (role of institutions) e. Impact of national culture on European HRM systems f. Differential managerial qualities g. Distinctive career maps dependent on national culture h. Perceptions of the manager-subordinate relationship i. Distributive justice and socially healthy pay j. Different mindsets about organization structure k. Differences in professional allegiance, role and structure of HRM functions
We manage to break down the factors that may affect HRM in Europe into four main factors. Firstly, there are cultural factors that may affect HRM. These include how the employees generally react to new labor policies introduced into the enterprises, ie will they response in a positive and active manner. Institutional factors also play a significant role in affecting HRM practices. These institutions include the unions and government ministries and how active or passive they are about seeking ways and methods to introduce new HRM techniques to improve the quality of the workforce. Also, differences in businesses structures and systems amongst the different European firms are crucial in deciding the types of HRM that can succeed in the European labor market. What works in one European firm does not necessarily guarantee its success in another European business. Finally, factors relating to roles and competence of HRM professionals will play a huge role in determining the success of HRM in Europe. It is these professionals who will have to innovate and develop new HRM practices and attempt to implement them successfully. Their competence and ability will be important in determining the success of these HRM practices. Also, finally, although there are several different countries in Europe with vastly different work cultures, we managed to categorize them all into four different resourcing models. The first model is the German model with a recruitment system reliant on apprenticeship, low levels of subsequent organization training and prudent use of flextime practices to facilitate recruitment of scarce resources. The second model follows the Scandinavian model that is characterized by advance labor market planning with low skill shortages, high level management involvement, high levels of advertising and a maintenance of qualification or age standards. The next model is the central European model (which includes France, Britain) which utilizes a professional personnel function and agencies, low levels of apprenticeship, a wide range of recruitment techniques to accommodate skills demands and international resourcing. The final model includes the countries Spain, Portugal and Turkey who rely very much on international labor, in particular for technical skills and adopted several flexible work methods to attract scarce labor.
3
Needless to say, with the emergence of the ‘New Economy’, Europe, like U.S is undergoing transitional changes in their organizations and inevitably, their approach towards managing their workforce. There have been more transnational coordination through strategic mergers and acquisitions amongst European enterprises. This may eventually result in integration of HRM amongst different countries in Europe. There is also a changing professional frame of reference with more emphasis on social competitiveness rather than social welfare and protection. In our study, we will be concentrating more on the first three models of European resourcing, ie Germany, France, Britain and part of the Scandinavian countries. We will selectively review the European literature on the different HRM innovations and the introduction of IT, which has been carried out in the firms, concentrating on the effects that these have on productivity and to a certain extent, wages. In particular, I will be looking at three HRM innovations, namely ‘Incentive Pay Schemes’, ‘Training’ and ‘High Performance Work Organizations’. The role of the European governments and the European Union cannot be ignored as well. It is the role of these governmental bodies that provide the environment in which the workers are managed. Hence, I included a section on ‘Labor Policy’ where I will examine the labor policies put in place by these governments and the EU as a whole. Specifically, I will dedicate a section on their policy on training, which is the most important area most economists feel that the government can take an active role in.
4
2 Incentive Pay Schemes
“The ability to pay employees based on a variety of performance measures is a key way of implementing motivational schemes.”
Andy Balchin
VP Finance & Corporate Services 2.1 Introduction Rapid changes in the economic environment, coupled by skilled-biased technological change have led to different trends in wage formation in the past decades. Incentive pay schemes have gained popularity in many of the major European labor markets like Germany, France and Britain and are gaining popularity amongst the Scandinavian markets as well. Most workplaces have some form of incentive pay schemes (Millward 1994). In Europe, the traditional fixed wage model has evolved into two main incentive pay schemes, piece rates and profit sharing. ‘Piece rates’ include a variable into the wage structure whereby an employee’s wage is dependent on the result of his productivity. Hence, it requires the design and implementation of a method that can accurately measure the results of the employees. Profit sharing avoids this problem by linking the earnings of the worker directly to profitability, ie the higher the profits, the more the employee earns. This, however, results in a free-rider problem where a worker may have very little influence on the overall profitability. Traditionally, incentive pay schemes have always been fiercely opposed by trade unions all over Europe as they see these schemes as an “employers’ issue”. However, this has changed in recent years. Mix results have been obtained in previous studies of the effect of incentive pay schemes on performance and productivity. The reasons supporting the usage of such schemes are as follows. Firstly, employees will work more co-operatively among themselves, since co-operation, especially in the presence of teams, will result in better performance results and higher profitability of the firms, thereby increasing their earnings (Weitzmann & Kruse 1990). They indirectly increase employer effort and commitment by improving communications about the firm’s performance and through educating employees about the importance of profitability (Mitchell 1990). Lastly, they increase identification with the company. These schemes will make the worker feel that he is an integral part of the company and how the firm fares is directly related to how he performs (Cannell & Woods 1992). However, Marsden & Richardson’s (1994) study on performance related pay and motivation in the Inland Revenue found that the effects of these schemes on performance had at best been small and possibly counter-effective. There may be a variety of reasons for this. Lewis (1991) stated that the belief in the importance of money as a motivator contradicts many of the major motivation theories. In other words, using money as the motivation factor is often ineffective as the workers’ performances may be mainly affected by their job satisfaction, loyalty to the firm and dedication to their job. Also, having such schemes implies a great deal of risks sharing by the employees, which they may not be so keen on. Incentive pay schemes throw in an uncertain variable into the picture and the worker risks not being to earn enough in the event of a poor performance that may not necessarily be any fault of his.
5
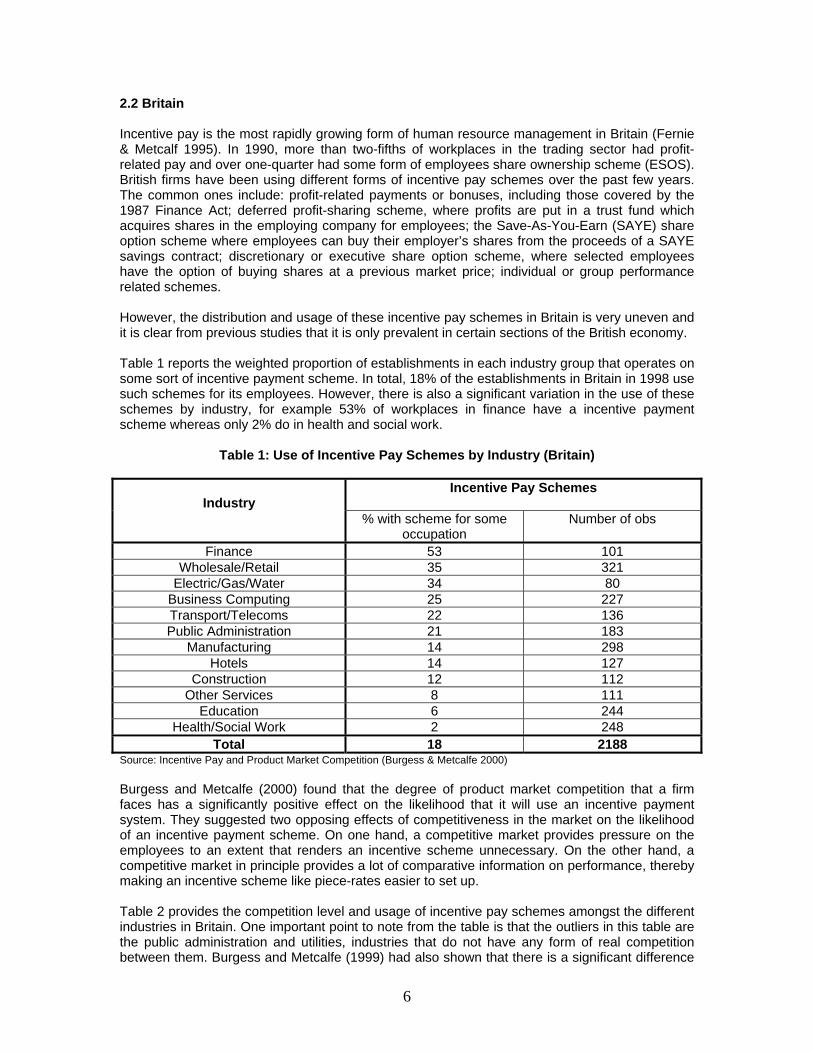
2.2 Britain Incentive pay is the most rapidly growing form of human resource management in Britain (Fernie & Metcalf 1995). In 1990, more than two-fifths of workplaces in the trading sector had profit-related pay and over one-quarter had some form of employees share ownership scheme (ESOS). British firms have been using different forms of incentive pay schemes over the past few years. The common ones include: profit-related payments or bonuses, including those covered by the 1987 Finance Act; deferred profit-sharing scheme, where profits are put in a trust fund which acquires shares in the employing company for employees; the Save-As-You-Earn (SAYE) share option scheme where employees can buy their employer’s shares from the proceeds of a SAYE savings contract; discretionary or executive share option scheme, where selected employees have the option of buying shares at a previous market price; individual or group performance related schemes. However, the distribution and usage of these incentive pay schemes in Britain is very uneven and it is clear from previous studies that it is only prevalent in certain sections of the British economy. Table 1 reports the weighted proportion of establishments in each industry group that operates on some sort of incentive payment scheme. In total, 18% of the establishments in Britain in 1998 use such schemes for its employees. However, there is also a significant variation in the use of these schemes by industry, for example 53% of workplaces in finance have a incentive payment scheme whereas only 2% do in health and social work.
Table 1: Use of Incentive Pay Schemes by Industry (Britain)
Incentive Pay Schemes
Industry
% with scheme for some occupation
Number of obs
Finance 53 101 Wholesale/Retail 35 321
Electric/Gas/Water 34 80 Business Computing 25 227 Transport/Telecoms 22 136 Public Administration 21 183
Manufacturing 14 298 Hotels 14 127
Construction 12 112 Other Services 8 111
Education 6 244 Health/Social Work 2 248
Total 18 2188 Source: Incentive Pay and Product Market Competition (Burgess & Metcalfe 2000) Burgess and Metcalfe (2000) found that the degree of product market competition that a firm faces has a significantly positive effect on the likelihood that it will use an incentive payment system. They suggested two opposing effects of competitiveness in the market on the likelihood of an incentive payment scheme. On one hand, a competitive market provides pressure on the employees to an extent that renders an incentive scheme unnecessary. On the other hand, a competitive market in principle provides a lot of comparative information on performance, thereby making an incentive scheme like piece-rates easier to set up. Table 2 provides the competition level and usage of incentive pay schemes amongst the different industries in Britain. One important point to note from the table is that the outliers in this table are the public administration and utilities, industries that do not have any form of real competition between them. Burgess and Metcalfe (1999) had also shown that there is a significant difference
6
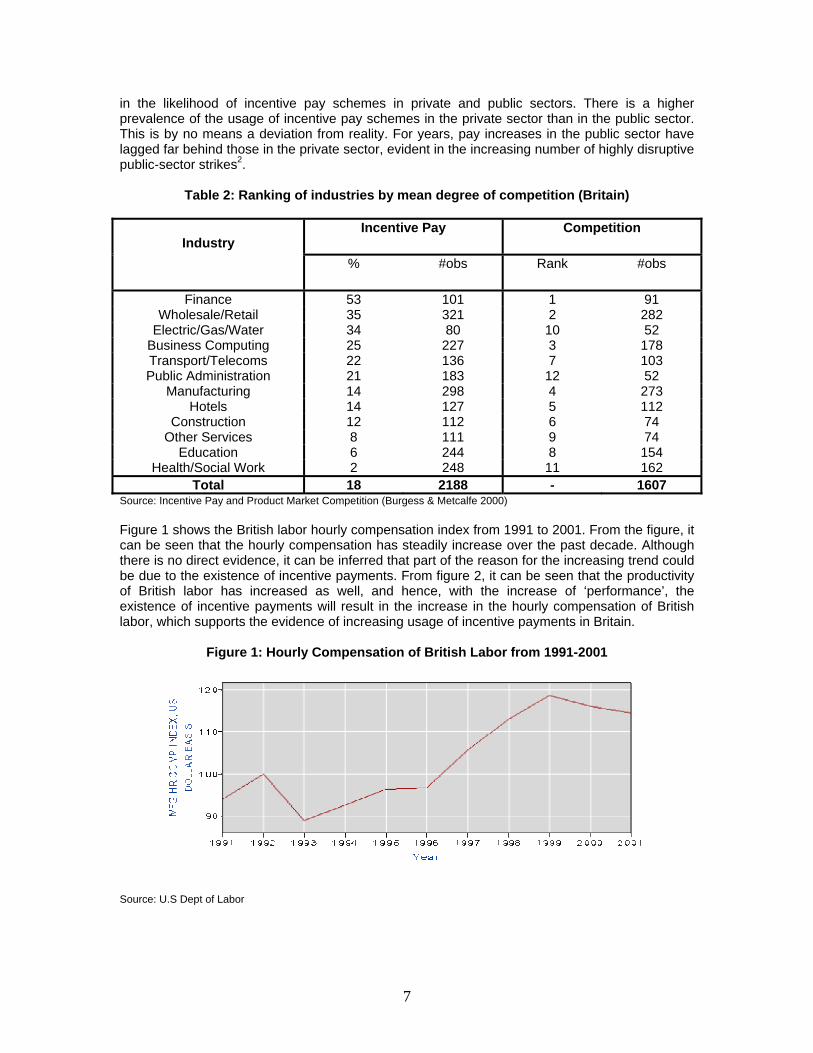
in the likelihood of incentive pay schemes in private and public sectors. There is a higher prevalence of the usage of incentive pay schemes in the private sector than in the public sector. This is by no means a deviation from reality. For years, pay increases in the public sector have lagged far behind those in the private sector, evident in the increasing number of highly disruptive public-sector strikes2.
Table 2: Ranking of industries by mean degree of competition (Britain)
Incentive Pay Competition Industry
% #obs Rank #obs
Finance 53 101 1 91 Wholesale/Retail 35 321 2 282
Electric/Gas/Water 34 80 10 52 Business Computing 25 227 3 178 Transport/Telecoms 22 136 7 103 Public Administration 21 183 12 52
Manufacturing 14 298 4 273 Hotels 14 127 5 112
Construction 12 112 6 74 Other Services 8 111 9 74
Education 6 244 8 154 Health/Social Work 2 248 11 162
Total 18 2188 - 1607 Source: Incentive Pay and Product Market Competition (Burgess & Metcalfe 2000) Figure 1 shows the British labor hourly compensation index from 1991 to 2001. From the figure, it can be seen that the hourly compensation has steadily increase over the past decade. Although there is no direct evidence, it can be inferred that part of the reason for the increasing trend could be due to the existence of incentive payments. From figure 2, it can be seen that the productivity of British labor has increased as well, and hence, with the increase of ‘performance’, the existence of incentive payments will result in the increase in the hourly compensation of British labor, which supports the evidence of increasing usage of incentive payments in Britain.
Figure 1: Hourly Compensation of British Labor from 1991-2001
Source: U.S Dept of Labor
7
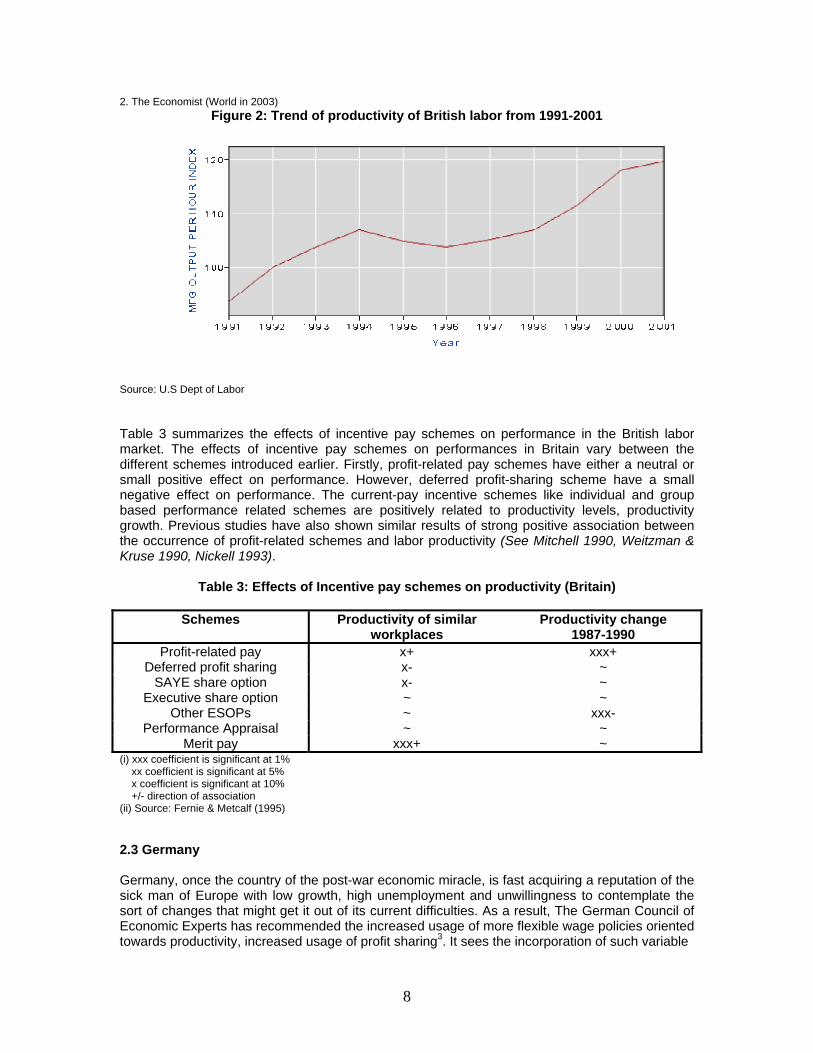
2. The Economist (World in 2003) Figure 2: Trend of productivity of British labor from 1991-2001
Source: U.S Dept of Labor Table 3 summarizes the effects of incentive pay schemes on performance in the British labor market. The effects of incentive pay schemes on performances in Britain vary between the different schemes introduced earlier. Firstly, profit-related pay schemes have either a neutral or small positive effect on performance. However, deferred profit-sharing scheme have a small negative effect on performance. The current-pay incentive schemes like individual and group based performance related schemes are positively related to productivity levels, productivity growth. Previous studies have also shown similar results of strong positive association between the occurrence of profit-related schemes and labor productivity (See Mitchell 1990, Weitzman & Kruse 1990, Nickell 1993).
Table 3: Effects of Incentive pay schemes on productivity (Britain)
Schemes Productivity of similar workplaces
Productivity change 1987-1990
Profit-related pay x+ xxx+ Deferred profit sharing x- ~
SAYE share option x- ~ Executive share option ~ ~
Other ESOPs ~ xxx- Performance Appraisal ~ ~
Merit pay xxx+ ~ (i) xxx coefficient is significant at 1% xx coefficient is significant at 5% x coefficient is significant at 10% +/- direction of association (ii) Source: Fernie & Metcalf (1995) 2.3 Germany Germany, once the country of the post-war economic miracle, is fast acquiring a reputation of the sick man of Europe with low growth, high unemployment and unwillingness to contemplate the sort of changes that might get it out of its current difficulties. As a result, The German Council of Economic Experts has recommended the increased usage of more flexible wage policies oriented towards productivity, increased usage of profit sharing3. It sees the incorporation of such variable
8
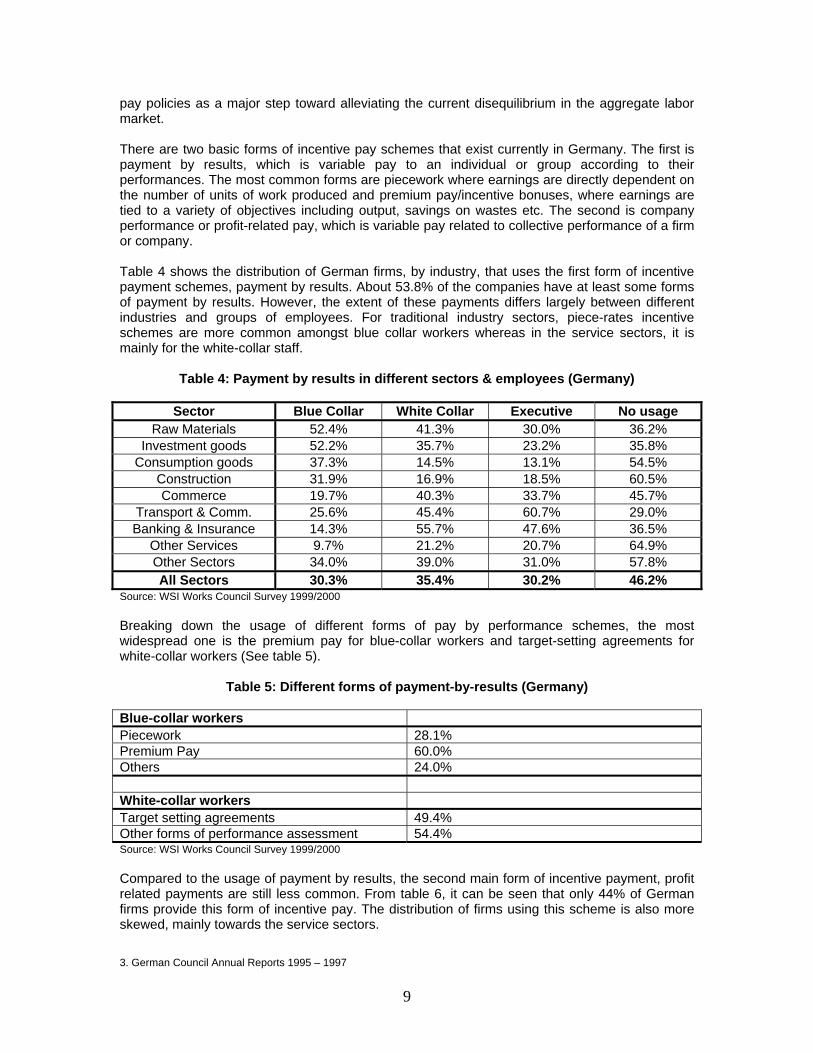
pay policies as a major step toward alleviating the current disequilibrium in the aggregate labor market. There are two basic forms of incentive pay schemes that exist currently in Germany. The first is payment by results, which is variable pay to an individual or group according to their performances. The most common forms are piecework where earnings are directly dependent on the number of units of work produced and premium pay/incentive bonuses, where earnings are tied to a variety of objectives including output, savings on wastes etc. The second is company performance or profit-related pay, which is variable pay related to collective performance of a firm or company. Table 4 shows the distribution of German firms, by industry, that uses the first form of incentive payment schemes, payment by results. About 53.8% of the companies have at least some forms of payment by results. However, the extent of these payments differs largely between different industries and groups of employees. For traditional industry sectors, piece-rates incentive schemes are more common amongst blue collar workers whereas in the service sectors, it is mainly for the white-collar staff.
Table 4: Payment by results in different sectors & employees (Germany)
Sector Blue Collar White Collar Executive No usage Raw Materials 52.4% 41.3% 30.0% 36.2%
Investment goods 52.2% 35.7% 23.2% 35.8% Consumption goods 37.3% 14.5% 13.1% 54.5%
Construction 31.9% 16.9% 18.5% 60.5% Commerce 19.7% 40.3% 33.7% 45.7%
Transport & Comm. 25.6% 45.4% 60.7% 29.0% Banking & Insurance 14.3% 55.7% 47.6% 36.5%
Other Services 9.7% 21.2% 20.7% 64.9% Other Sectors 34.0% 39.0% 31.0% 57.8% All Sectors 30.3% 35.4% 30.2% 46.2%
Source: WSI Works Council Survey 1999/2000 Breaking down the usage of different forms of pay by performance schemes, the most widespread one is the premium pay for blue-collar workers and target-setting agreements for white-collar workers (See table 5). Table 5: Different forms of payment-by-results (Germany) Blue-collar workers Piecework 28.1% Premium Pay 60.0% Others 24.0%
White-collar workers Target setting agreements 49.4% Other forms of performance assessment 54.4% Source: WSI Works Council Survey 1999/2000 Compared to the usage of payment by results, the second main form of incentive payment, profit related payments are still less common. From table 6, it can be seen that only 44% of German firms provide this form of incentive pay. The distribution of firms using this scheme is also more skewed, mainly towards the service sectors.
3. German Council Annual Reports 1995 – 1997
9
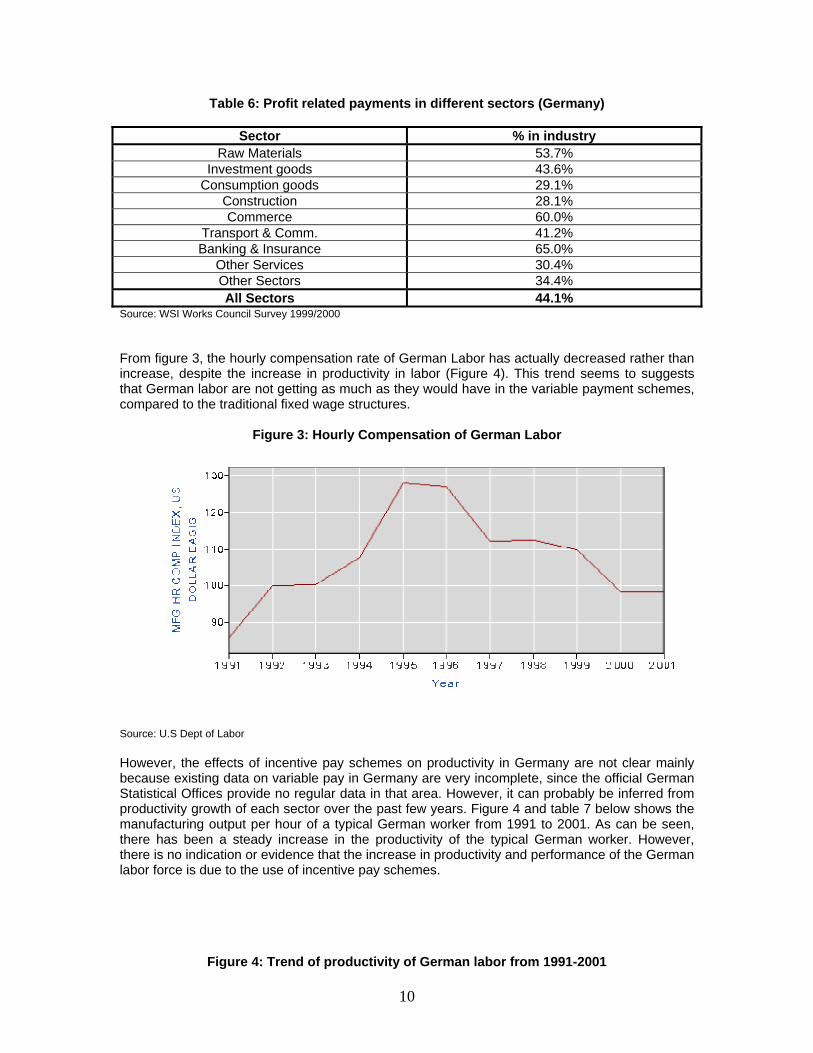
Table 6: Profit related payments in different sectors (Germany)
Sector % in industry Raw Materials 53.7%
Investment goods 43.6% Consumption goods 29.1%
Construction 28.1% Commerce 60.0%
Transport & Comm. 41.2% Banking & Insurance 65.0%
Other Services 30.4% Other Sectors 34.4% All Sectors 44.1%
Source: WSI Works Council Survey 1999/2000 From figure 3, the hourly compensation rate of German Labor has actually decreased rather than increase, despite the increase in productivity in labor (Figure 4). This trend seems to suggests that German labor are not getting as much as they would have in the variable payment schemes, compared to the traditional fixed wage structures.
Figure 3: Hourly Compensation of German Labor
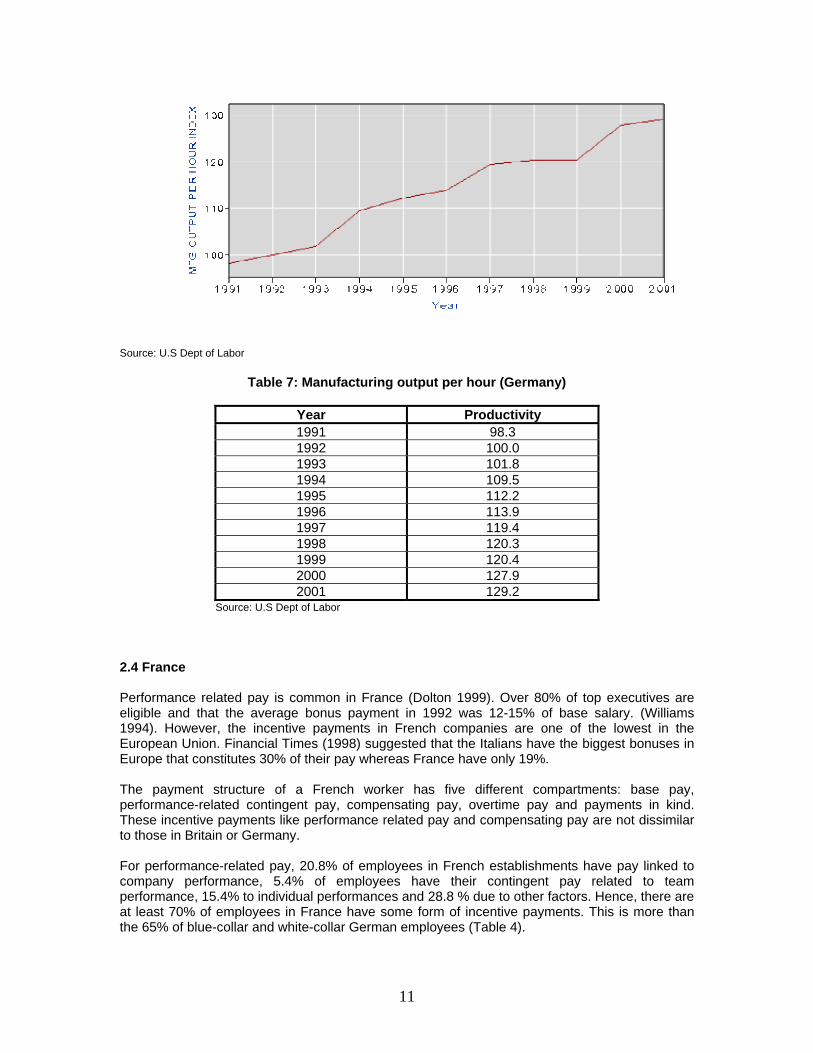
Source: U.S Dept of Labor However, the effects of incentive pay schemes on productivity in Germany are not clear mainly because existing data on variable pay in Germany are very incomplete, since the official German Statistical Offices provide no regular data in that area. However, it can probably be inferred from productivity growth of each sector over the past few years. Figure 4 and table 7 below shows the manufacturing output per hour of a typical German worker from 1991 to 2001. As can be seen, there has been a steady increase in the productivity of the typical German worker. However, there is no indication or evidence that the increase in productivity and performance of the German labor force is due to the use of incentive pay schemes.
Figure 4: Trend of productivity of German labor from 1991-2001
10
Source: U.S Dept of Labor
Table 7: Manufacturing output per hour (Germany)
Year Productivity
1991 98.3 1992 100.0 1993 101.8 1994 109.5 1995 112.2 1996 113.9 1997 119.4 1998 120.3 1999 120.4 2000 127.9 2001 129.2
Source: U.S Dep r
.4 France
erformance related pay is common in France (Dolton 1999). Over 80% of top executives are
he payment structure of a French worker has five different compartments: base pay,
or performance-related pay, 20.8% of employees in French establishments have pay linked to
t of Labo
2 Peligible and that the average bonus payment in 1992 was 12-15% of base salary. (Williams 1994). However, the incentive payments in French companies are one of the lowest in the European Union. Financial Times (1998) suggested that the Italians have the biggest bonuses in Europe that constitutes 30% of their pay whereas France have only 19%. Tperformance-related contingent pay, compensating pay, overtime pay and payments in kind. These incentive payments like performance related pay and compensating pay are not dissimilar to those in Britain or Germany. Fcompany performance, 5.4% of employees have their contingent pay related to team performance, 15.4% to individual performances and 28.8 % due to other factors. Hence, there are at least 70% of employees in France have some form of incentive payments. This is more than the 65% of blue-collar and white-collar German employees (Table 4).
11

For profit-related pay or share (option) schemes, about 19,000 French firms have mandatory profit-sharing, 14,600 have voluntary profit sharing and about 6000 companies have both. That amounts to about 33% of all French employees in the private sector being covered by mandatory profit-sharing, 20% covered by voluntary profit-sharing and about 16% covered by both. Over the past decade, many French establishments are moving to incentive pay systems, due to an increasing recognition by senior executives that the financial performances of French firms are much lower compared to America and their major EU counterparts. Hence, they have begun to introduce and implement new value metrics into their compensation systems (Mottis & Ponssard 2000). To drive home the message, major French companies like AGF, AXA, Danone have changed their management compensation packages to include a high proportion of variable pay to fixed salary (from about 40% for top executives to about 15% to middle management4). A differing development of incentive pay in France compared to Britain and German is the increasing use of stock options. Approximately a third of French companies have an Employee Stock Ownership Plan (ESOP), with an average share capital at 4% or some 40 billion euros. (D’Arcimoles & Trebucq 2002). Most stock option packages for top management in France today are designed explicitly as performance incentives. Many are based on relative performance of the company. However, there exist some controversial clauses in these stock option packages. Table 8 shows some of the clauses/conditions that some of the French firms require their employees fulfill in order to exercise their options.
Table 8: Conditions for Exercising Stock Options
Company Conditions Alsthom 38% increase in market price
Air Liquide 10% growth in earnings per share BNP Achievement of quantified operational targets
Schneider 12% growth in earnings per share Vivendi Old approach: 40% increase in market price
Source: Stock Options & Performance-Based Pay in France, March 2001 From figure 5 and 6, it can be seen that, like their German counterparts, the French workers do seem disadvantaged by the increase in variable wage components in their wage structure. One possible reason for this could be due to the existence of controversial stock options mention earlier that actually decreased the real wage that the workers are actually bringing back. 4. U.S-France Analysis, March 2001
12
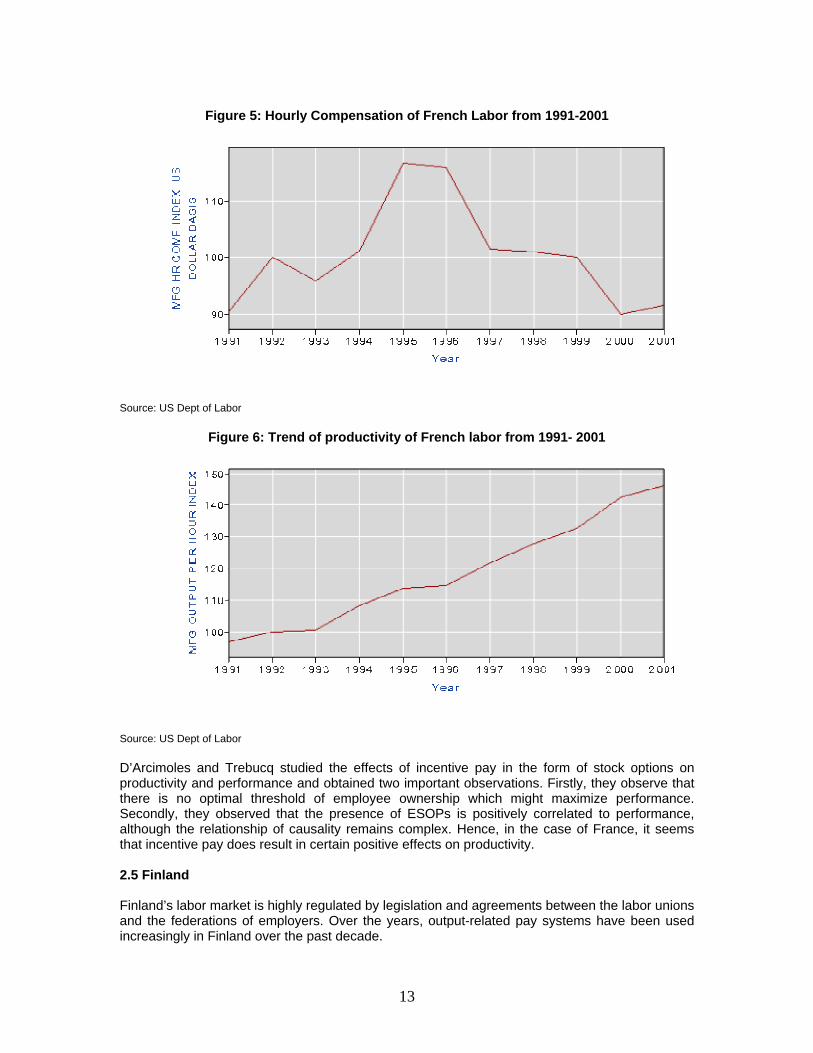
Figure 5: Hourly Compensation of French Labor from 1991-2001
Source: US Dept of Labor
Figure 6: Trend of productivity of French labor from 1991- 2001
Source: US Dept of Labor D’Arcimoles and Trebucq studied the effects of incentive pay in the form of stock options on productivity and performance and obtained two important observations. Firstly, they observe that there is no optimal threshold of employee ownership which might maximize performance. Secondly, they observed that the presence of ESOPs is positively correlated to performance, although the relationship of causality remains complex. Hence, in the case of France, it seems that incentive pay does result in certain positive effects on productivity. 2.5 Finland Finland’s labor market is highly regulated by legislation and agreements between the labor unions and the federations of employers. Over the years, output-related pay systems have been used increasingly in Finland over the past decade.
13
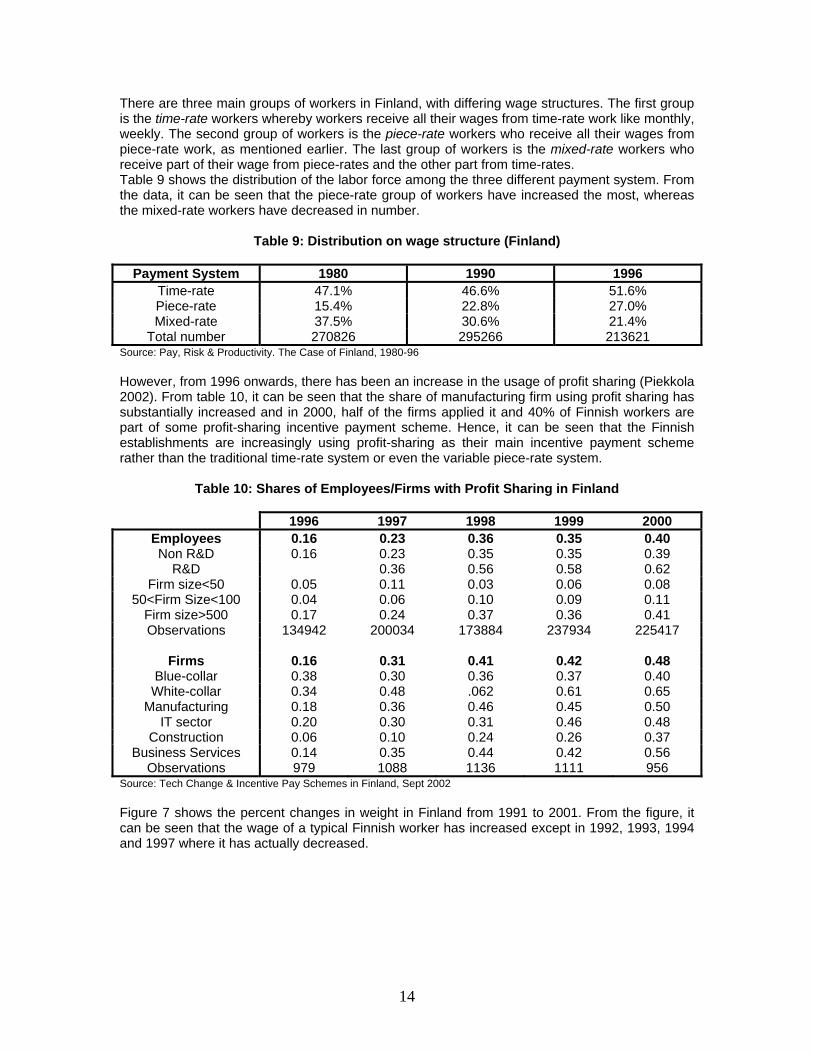
There are three main groups of workers in Finland, with differing wage structures. The first group is the time-rate workers whereby workers receive all their wages from time-rate work like monthly, weekly. The second group of workers is the piece-rate workers who receive all their wages from piece-rate work, as mentioned earlier. The last group of workers is the mixed-rate workers who receive part of their wage from piece-rates and the other part from time-rates. Table 9 shows the distribution of the labor force among the three different payment system. From the data, it can be seen that the piece-rate group of workers have increased the most, whereas the mixed-rate workers have decreased in number.
Table 9: Distribution on wage structure (Finland)
Payment System 1980 1990 1996 Time-rate 47.1% 46.6% 51.6% Piece-rate 15.4% 22.8% 27.0% Mixed-rate 37.5% 30.6% 21.4%
Total number 270826 295266 213621 Source: Pay, Risk & Productivity. The Case of Finland, 1980-96 However, from 1996 onwards, there has been an increase in the usage of profit sharing (Piekkola 2002). From table 10, it can be seen that the share of manufacturing firm using profit sharing has substantially increased and in 2000, half of the firms applied it and 40% of Finnish workers are part of some profit-sharing incentive payment scheme. Hence, it can be seen that the Finnish establishments are increasingly using profit-sharing as their main incentive payment scheme rather than the traditional time-rate system or even the variable piece-rate system.
Table 10: Shares of Employees/Firms with Profit Sharing in Finland
1996 1997 1998 1999 2000 Employees 0.16 0.23 0.36 0.35 0.40 Non R&D 0.16 0.23 0.35 0.35 0.39
R&D 0.36 0.56 0.58 0.62 Firm size<50 0.05 0.11 0.03 0.06 0.08
50<Firm Size<100 0.04 0.06 0.10 0.09 0.11 Firm size>500 0.17 0.24 0.37 0.36 0.41 Observations 134942 200034 173884 237934 225417
Firms 0.16 0.31 0.41 0.42 0.48
Blue-collar 0.38 0.30 0.36 0.37 0.40 White-collar 0.34 0.48 .062 0.61 0.65
Manufacturing 0.18 0.36 0.46 0.45 0.50 IT sector 0.20 0.30 0.31 0.46 0.48
Construction 0.06 0.10 0.24 0.26 0.37 Business Services 0.14 0.35 0.44 0.42 0.56
Observations 979 1088 1136 1111 956 Source: Tech Change & Incentive Pay Schemes in Finland, Sept 2002 Figure 7 shows the percent changes in weight in Finland from 1991 to 2001. From the figure, it can be seen that the wage of a typical Finnish worker has increased except in 1992, 1993, 1994 and 1997 where it has actually decreased.
14
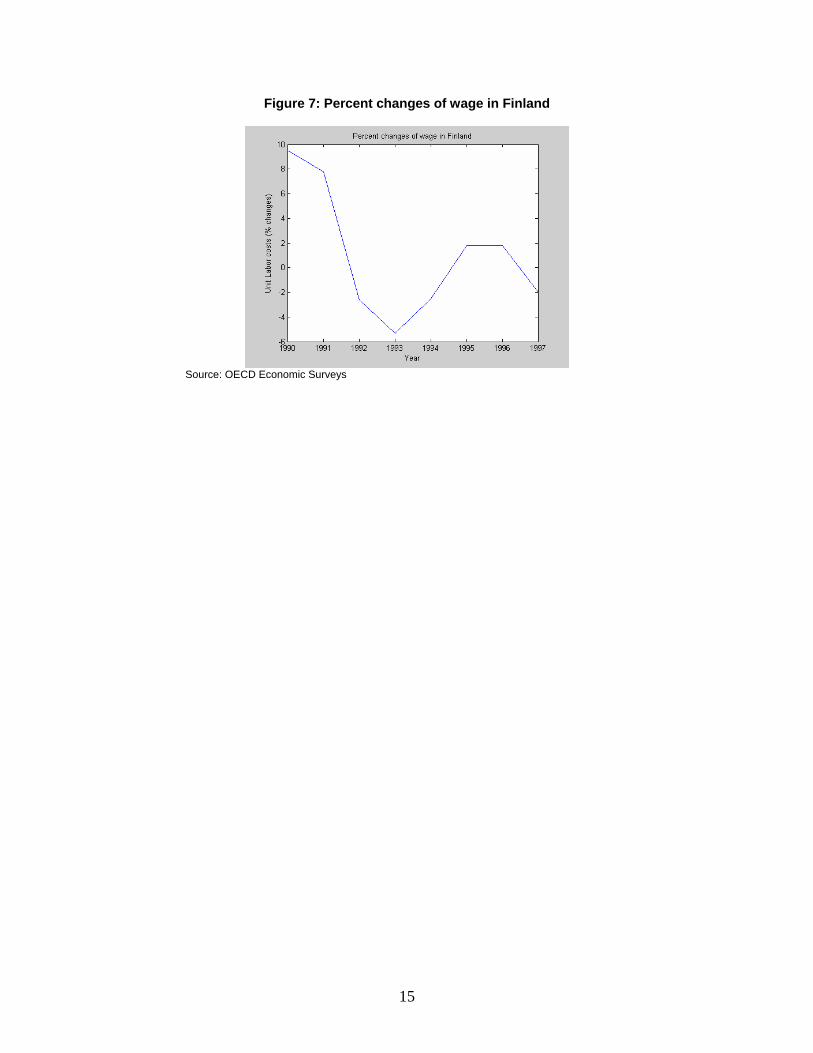
Figure 7: Percent changes of wage in Finland
Source: OECD Economic Surveys
15

3 Training
3.1 Introduction Employers often view training as an important tool for increasing output per employee and also as an incentive to attract and retain talent within their company. The primary aim of training is productivity increase. Training enables workers to cope with new technological advances more ably. Work-linked training was a popular topic highlighted in the ‘Council Decision’ of 21 December 1998 on the promotion of European pathways in work-linked training including apprenticeship. There are a number of reasons why work-linked training and particularly apprenticeship, provide suitable preparations for participation in the modern workplace. Firstly, the contract in an apprenticeship gives a partnership between employer, trainee and training provider and this relationship is a facet of education frequently highlighted. Secondly, researchers believe that it is a practical way of introducing people to ‘communities of practice’ where the transfer of tacit skills can take place which otherwise would be difficult in a formal classroom setting. Thirdly, work now consists of processes rather than specific tasks and the work-process knowledge that it requires can only be acquired in the workplace and apprenticeship enables the integration of theory and practice and of non-formal and formal learning. Apprenticeship is clearly the most established form of work-related training in Europe, but it is not the only form. Table 11 shows the distribution of the number of apprenticeship programs in Europe. However, many countries have different alternatives based on their own training traditions and systems, like in Britain the GNVQ, in Ire land the Applied Leaving Certificate, Sweden’s 14 vocationally-oriented programs in upper secondary education etc.
Table 11: Overall apprenticeship statistics in the Member States 1996-97
Country 1996 1997 Belgium 14,538 total
9,273 Flanders 5,265 Wallonia
5476 Flanders
Denmark 38,500 31,494 Germany 1,590,000 total
579,000 new entrants 1,622,000 total
587,000 new entrants Greece 5,500 6,800 Spain 184,577 156,151 France 295,828 312,828 Ireland 6,317 new entrants 7,506 new entrants
Italy 413,892 393,138 Luxembourg 2,083 2,190
The Netherlands 110,459 114,973 Austria 119,932 total
37,079 new entrants 121,629 total
40,175 new entrants Portugal 13,124 6,419 Finland 26,255 36,289 Sweden 150 in pilot projects Britain 28,000 82,000 Norway 25,836 30,268
16

17,588 new entrants 16, 045 new entrants Source: CEDEFOP (Martina Ni Cheallaigh 1999) However, it is believed that employers will only bear the costs of training to the extent that they expect to reap the rewards. Hence, it is more realistic that the firms will only be willing to do some general training (Acemoglou & Pischke 1997). However, workers may leave after their general training is done and hence, firms are unwilling to risk wasting extra costs and will not train their employees to an optimal level. The employees themselves may be unable or unwilling to bear the short-term financial costs of general training and these result in a low-wage low-skill equilibrium (Blundell & Dearden 1999). Chapman, Peterson and Booth (1992) found that in the US, UK and Australia, company-based training (as opposed to training outside the firm) provided the largest return followed by off-the-job training. Other studies like Blanchflower and Lynch (1992) using UK and US panel data, Winkelmann (1994) using German data have shown that there are significant positive returns to training. As mentioned earlier, there are risks involved in training and employers are only willing to bear the costs of training to the extent that they are expected to reap the rewards. As such, in the next section, I will briefly examine if firms view their investment in their workers in the form of training as an essential performance mechanism or a risk that they are taking. On one hand, training improves productivity but on the other hand, training gives the workers more flexibility to leave the firm. Hence, I will look briefly into this issue before looking at different training models in the European countries. 3.2 Do firms value their investments in people? Human capital is probably the only form of capital that does not have well-defined accounting and reporting requirements associated with it. Firms have little knowledge about the nature and magnitude of their investments they make in people and they know even less about the effectiveness of those investments. For example, the estimation of how much firms spend on education and training – the most conspicuous form of human capital investment – are at best very sketchy. Prominent CEOs often say, “People are our most important asset”. If this is the case, it would seem that firms should value their investments in people very highly and seriously indeed. This general phenomenon that senior management recognizes the value and importance of their people can be illustrated in two examples. Disney states that it has only two assets: Show and Story. While Story is its collection of fairy tales and its ability to entertain every member of the family, Show is its people and their ability to tell and carry on the tradition of Story. Hence, Disney invests a lot in training all of its people in Show. Sears has also worked hard to increase its employees’ satisfaction. Sears claims that an increase in its overall employee satisfaction at a store location will precede an increase in customer satisfaction two months later and then later by a rise in revenues three months later. Hence, to Sears, the value of investment in people is an increase in cash flows. More recently, Ernst and Young’s Center for Business Innovation completed two studies, the Twenty Questions about Knowledge Survey and a capital markets study. The results show evidence that support the claim that both the senior management of a firm and the capital markets recognize the value of human capital to the firm. Summarizing the results of the findings, the Twenty Question on Knowledge in the Organization, a group of senior managers say that people are the source of a tremendously important asset – the knowledge of why and how to achieve the firm’s mission. They believe that investments in people will eventually lead to higher returns in revenue. Also, results of the study in capital markets showed that capital markets use non-financial performance as a leading indicator of
17

future performance. Hence, the higher the markets rate a firms’ management, experience and capabilities and the firm’s people’s skills, commitment and alignment with the firm’s goals, the better the markets believe the firm will perform. Hence, as a result, the firms will naturally view investments in people to be of utmost importance if they want revenues to increase. These results show that people that make up a firm from top to bottom are recognized as importance determining factors of the overall performance of the firm. Markets recognize the value of people by valuing more highly the stocks of firms with more talented employees whereas senior management affirms the importance of the knowledge their employees bring to the firm and believes that if investments are managed properly, investment in people can lead to competitive advantage in the market. Since these results indicate that most firms agree that training is an essential performance tool, there have been a lot of calls for the government to be more actively involved in subsidizing training, because of the costs risk that the firm is unwilling to take, especially if training increases the flexibility of the worker to leave as well. These constitute a policy issue which I will examine in section 6.4, where I will look at the different ways in which the U.S. government and the European governments subsidize training budgets 3.3 Britain It is widely accepted in Britain that training is needed to increase the skill level of the work force. Not only does this ensure stronger economic performances of British establishments, training is widely seen as a tool that will bridge the increasing wage inequality between the low-skilled and highly-skilled workers (Gosling, Machin & Meghir 1998). A form of a training system in Britain is youth training, delivered through a contract, offers a guarantee of up to two years training for young people not in employment (usually) or full-time educationfrom the end of compulsory education to the age of 18. The new deal for young people is intended for those aged 18 to 24 who have been unemployed for six months or more and are receiving the jobseekers allowance. Following help with job search and career guidance, those who do not find an unsubsidized job have four options: a subsidized job with an employer; work in the voluntary sector; full-time education and training; work in the environmental task force. Variations of the new deal have been developed for the long-term unemployed and single mothers. Table 12 shows the percentage and males and females that had some form of work-related training (WRT) in 1991. These WRTs cover training courses leading to a recognized vocational qualification (QTC) like a diploma and employer-provided training courses (EPTCs), which may or may not lead to a recognized vocational qualification. By definition, this covers all non-employer-provided schemes as well as some employer-provided courses. As can be seen from table 11, out of the sample size, more than two-thirds of British male workers received some form of training from their employees and a little less than half of British female workers received training. This is a relatively significant number of workers that receive some form of training that will upgrade their skills in Britain and one would imagine that the percentage would have increased over the past decade.
Table 12: Percentage of workers with work-related training (WRT) in Britain
Males Females Workers who have undertaken:
Number % Total Number % Total No WRT since 1981 778 37.66 789 51.47 WRT(s) since 1981: 1288 62.34 544 48.53 EPTC with no qualification 1063 51.45 567 36.99 EPTC with qualification 269 13.02 159 10.37
18
Private WRT with qualification 205 9.92 176 11.48 Current Job: EPTC with qualification 153 7.41 77 5.02 EPTC with no qualification 845 40.90 409 26.68 Previous Job: EPTC with qualification 125 6.05 92 6.00 EPTC with no qualification 331 16.02 205 13.37 Beginning of new job 40 1.94 25 1.63 All employed persons 1981 and 1991
2066 100 1533 100
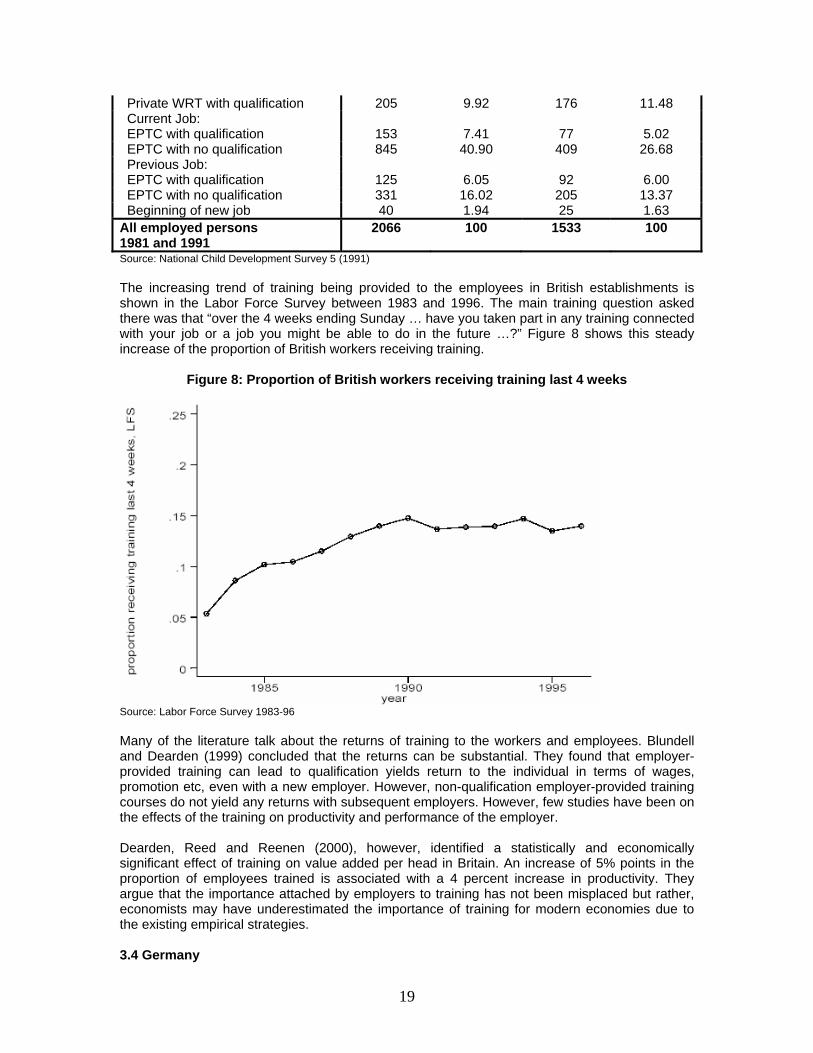
Source: National Child Development Survey 5 (1991) The increasing trend of training being provided to the employees in British establishments is shown in the Labor Force Survey between 1983 and 1996. The main training question asked there was that “over the 4 weeks ending Sunday … have you taken part in any training connected with your job or a job you might be able to do in the future …?” Figure 8 shows this steady increase of the proportion of British workers receiving training.
Figure 8: Proportion of British workers receiving training last 4 weeks
Source: Labor Force Survey 1983-96 Many of the literature talk about the returns of training to the workers and employees. Blundell and Dearden (1999) concluded that the returns can be substantial. They found that employer-provided training can lead to qualification yields return to the individual in terms of wages, promotion etc, even with a new employer. However, non-qualification employer-provided training courses do not yield any returns with subsequent employers. However, few studies have been on the effects of the training on productivity and performance of the employer. Dearden, Reed and Reenen (2000), however, identified a statistically and economically significant effect of training on value added per head in Britain. An increase of 5% points in the proportion of employees trained is associated with a 4 percent increase in productivity. They argue that the importance attached by employers to training has not been misplaced but rather, economists may have underestimated the importance of training for modern economies due to the existing empirical strategies. 3.4 Germany
19
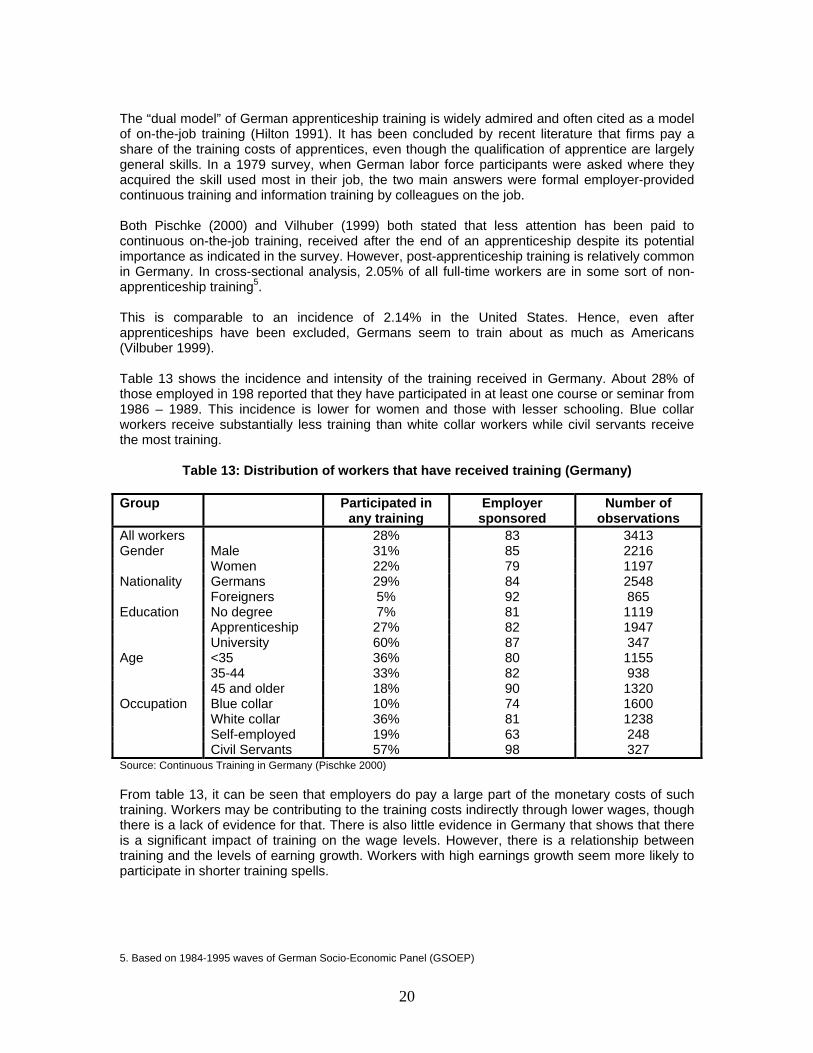
The “dual model” of German apprenticeship training is widely admired and often cited as a model of on-the-job training (Hilton 1991). It has been concluded by recent literature that firms pay a share of the training costs of apprentices, even though the qualification of apprentice are largely general skills. In a 1979 survey, when German labor force participants were asked where they acquired the skill used most in their job, the two main answers were formal employer-provided continuous training and information training by colleagues on the job. Both Pischke (2000) and Vilhuber (1999) both stated that less attention has been paid to continuous on-the-job training, received after the end of an apprenticeship despite its potential importance as indicated in the survey. However, post-apprenticeship training is relatively common in Germany. In cross-sectional analysis, 2.05% of all full-time workers are in some sort of non-apprenticeship training5. This is comparable to an incidence of 2.14% in the United States. Hence, even after apprenticeships have been excluded, Germans seem to train about as much as Americans (Vilbuber 1999). Table 13 shows the incidence and intensity of the training received in Germany. About 28% of those employed in 198 reported that they have participated in at least one course or seminar from 1986 – 1989. This incidence is lower for women and those with lesser schooling. Blue collar workers receive substantially less training than white collar workers while civil servants receive the most training.
Table 13: Distribution of workers that have received training (Germany) Group Participated in
any training Employer
sponsored Number of
observations All workers 28% 83 3413 Gender Male 31% 85 2216 Women 22% 79 1197 Nationality Germans 29% 84 2548 Foreigners 5% 92 865 Education No degree 7% 81 1119 Apprenticeship 27% 82 1947 University 60% 87 347 Age <35 36% 80 1155 35-44 33% 82 938 45 and older 18% 90 1320 Occupation Blue collar 10% 74 1600 White collar 36% 81 1238 Self-employed 19% 63 248 Civil Servants 57% 98 327 Source: Continuous Training in Germany (Pischke 2000) From table 13, it can be seen that employers do pay a large part of the monetary costs of such training. Workers may be contributing to the training costs indirectly through lower wages, though there is a lack of evidence for that. There is also little evidence in Germany that shows that there is a significant impact of training on the wage levels. However, there is a relationship between training and the levels of earning growth. Workers with high earnings growth seem more likely to participate in shorter training spells.
5. Based on 1984-1995 waves of German Socio-Economic Panel (GSOEP)
20
This relationship shows smaller returns to training during work hours than to training during leisure time, particularly for women. These results, along with the financing of training, suggest that employers may reap some rewards from training investments in their employees (Pischke 2000). This is also obtained by Pannenberg (1997) and direct questions on benefits of training. Hence, the effects of training on the productivity of the workers and performance of the firm may be positively related, although inference, not direct evidence, can be made. 3.5 France France has the best example of a mixed training system in Europe. It is home of alternating systems, where some of the many variations include guidance contract for young people aged 22 and over who do not have a vocational diploma and have not completed upper secondary; qualification contract offered to young people under 26 to supplement their initial training by job-related training to give them better possibilities of access to jobs; adaptation contract which is aimed at young people under 26 to provide training that will help them adapt to a job. Human capital theory implies that workers are paid their marginal productivity (MP). Hence, recorded increases of salaries with tenure can then be interpreted as effects of specific training. General training can only be financed by the workers themselves. It should be immediately reflected in their wage as a result of perfect competition in the labor market. As a result, there is no return for the firm. Due to this, firms tend to under invest in training activities and since the workers are financially constrained, there is an under-provision of training in the economy like in France, where there are levies on firms to fund training. This can be a burden to the nation’s resources. French firms are compelled by a 1971 law on training to spend a minimum percentage of the wage bill on training or pay the equivalent tax to the Government. They distinguish between three categories of firms, those spending more than the legal minimum, those spending the minimum rate, and those spending less than the minimum on training and paying the difference as a tax to the Treasury. There is a demand now for more direct measures of the productivity impact of training. There are debates about the efficiency of training systems and reforms of these systems are being debated in France (Gauron 2000). Carriou and Jeger (1997) analyzed over 10,000 French firms, for the period 1986-92. They estimated that declining training expenditures on value added for each year separately and find it to be positive and significant. Delame and Kramarz (1997) analyzed longitudinal French data for 1982-87 and concluded that the effects of training on productivity are significant only for managers, engineers and technicians, and only for the first group of firms. Other literature studying the effects of training on performance and productivity include Ballot and Taymaz (1998) which found that training has a positive effect on profitability, indicating a positive effect on productivity as well. Ballot, Fakhfakh and Taymaz (2002) showed that there is a positive and significant relationship between training and productivity of the workers and returns to the firm. Table 14 shows the relationship between training and productivity. As can be seen, the effects of training on productivity are positive and significant and training elasticities of value added per employee are positive.
21
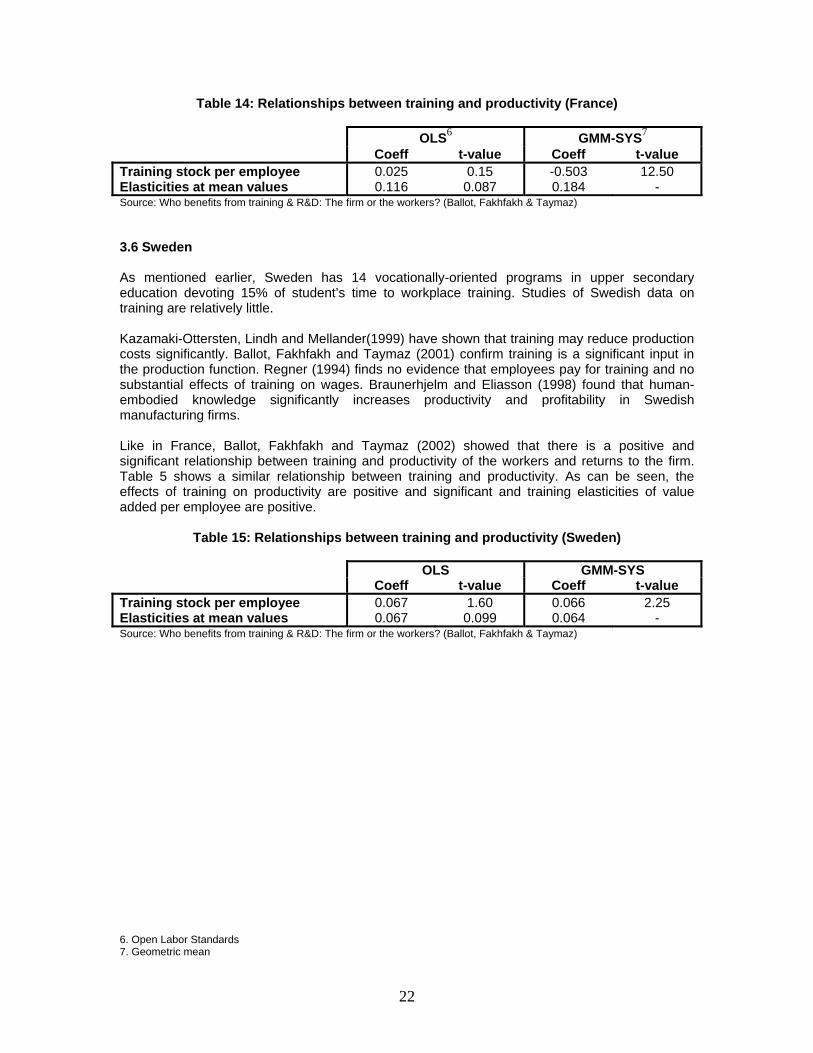
Table 14: Relationships between training and productivity (France) OLS6 GMM-SYS7
Coeff t-value Coeff t-value Training stock per employee 0.025 0.15 -0.503 12.50 Elasticities at mean values 0.116 0.087 0.184 - Source: Who benefits from training & R&D: The firm or the workers? (Ballot, Fakhfakh & Taymaz) 3.6 Sweden As mentioned earlier, Sweden has 14 vocationally-oriented programs in upper secondary education devoting 15% of student’s time to workplace training. Studies of Swedish data on training are relatively little. Kazamaki-Ottersten, Lindh and Mellander(1999) have shown that training may reduce production costs significantly. Ballot, Fakhfakh and Taymaz (2001) confirm training is a significant input in the production function. Regner (1994) finds no evidence that employees pay for training and no substantial effects of training on wages. Braunerhjelm and Eliasson (1998) found that human-embodied knowledge significantly increases productivity and profitability in Swedish manufacturing firms. Like in France, Ballot, Fakhfakh and Taymaz (2002) showed that there is a positive and significant relationship between training and productivity of the workers and returns to the firm. Table 5 shows a similar relationship between training and productivity. As can be seen, the effects of training on productivity are positive and significant and training elasticities of value added per employee are positive.
Table 15: Relationships between training and productivity (Sweden) OLS GMM-SYS Coeff t-value Coeff t-value Training stock per employee 0.067 1.60 0.066 2.25 Elasticities at mean values 0.067 0.099 0.064 - Source: Who benefits from training & R&D: The firm or the workers? (Ballot, Fakhfakh & Taymaz) 6. Open Labor Standards 7. Geometric mean
22
4 High Performance Work Organizations
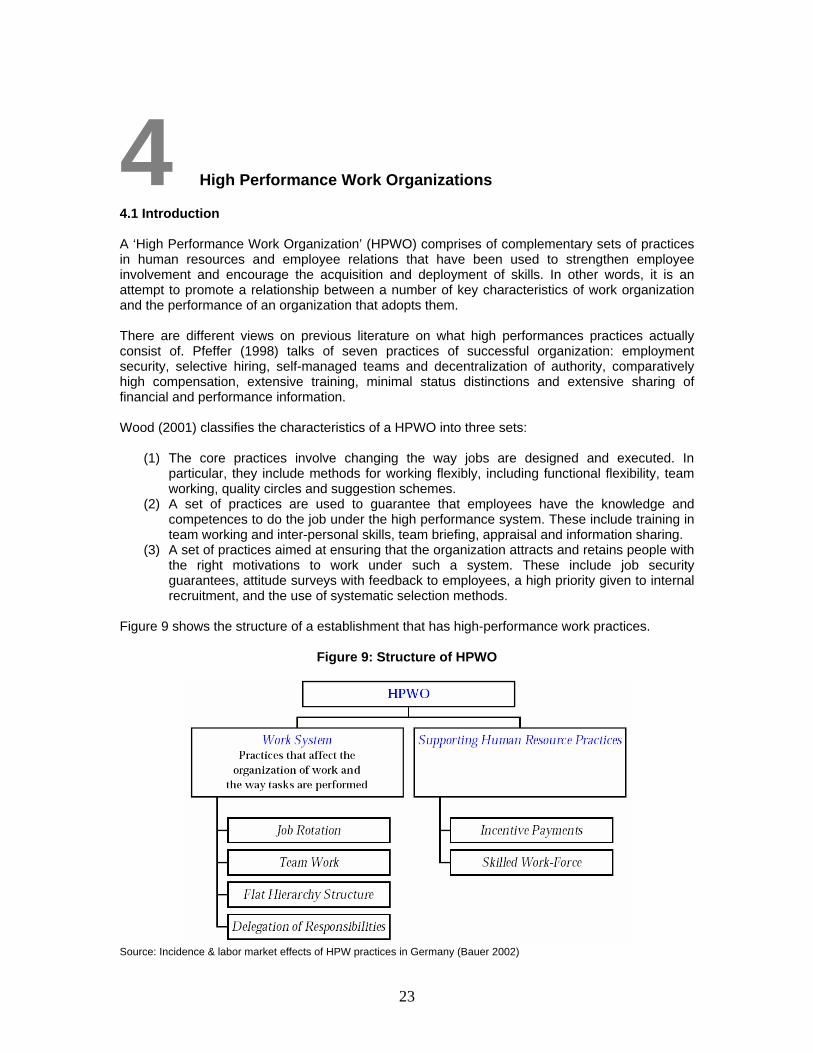
4.1 Introduction A ‘High Performance Work Organization’ (HPWO) comprises of complementary sets of practices in human resources and employee relations that have been used to strengthen employee involvement and encourage the acquisition and deployment of skills. In other words, it is an attempt to promote a relationship between a number of key characteristics of work organization and the performance of an organization that adopts them. There are different views on previous literature on what high performances practices actually consist of. Pfeffer (1998) talks of seven practices of successful organization: employment security, selective hiring, self-managed teams and decentralization of authority, comparatively high compensation, extensive training, minimal status distinctions and extensive sharing of financial and performance information. Wood (2001) classifies the characteristics of a HPWO into three sets:
(1) The core practices involve changing the way jobs are designed and executed. In particular, they include methods for working flexibly, including functional flexibility, team working, quality circles and suggestion schemes.
(2) A set of practices are used to guarantee that employees have the knowledge and competences to do the job under the high performance system. These include training in team working and inter-personal skills, team briefing, appraisal and information sharing.
(3) A set of practices aimed at ensuring that the organization attracts and retains people with the right motivations to work under such a system. These include job security guarantees, attitude surveys with feedback to employees, a high priority given to internal recruitment, and the use of systematic selection methods.
Figure 9 shows the structure of a establishment that has high-performance work practices.
Figure 9: Structure of HPWO
Source: Incidence & labor market effects of HPW practices in Germany (Bauer 2002)
23
As can be seen from the figure, a HPWO has the following characteristics:
• flatter, non-hierarchical structures • moving away from reliance on management control • teamwork • autonomous working, based on high levels of trust • communication • workers highly skilled and engaged in lifelong learning, mastering new skills and
behaviors
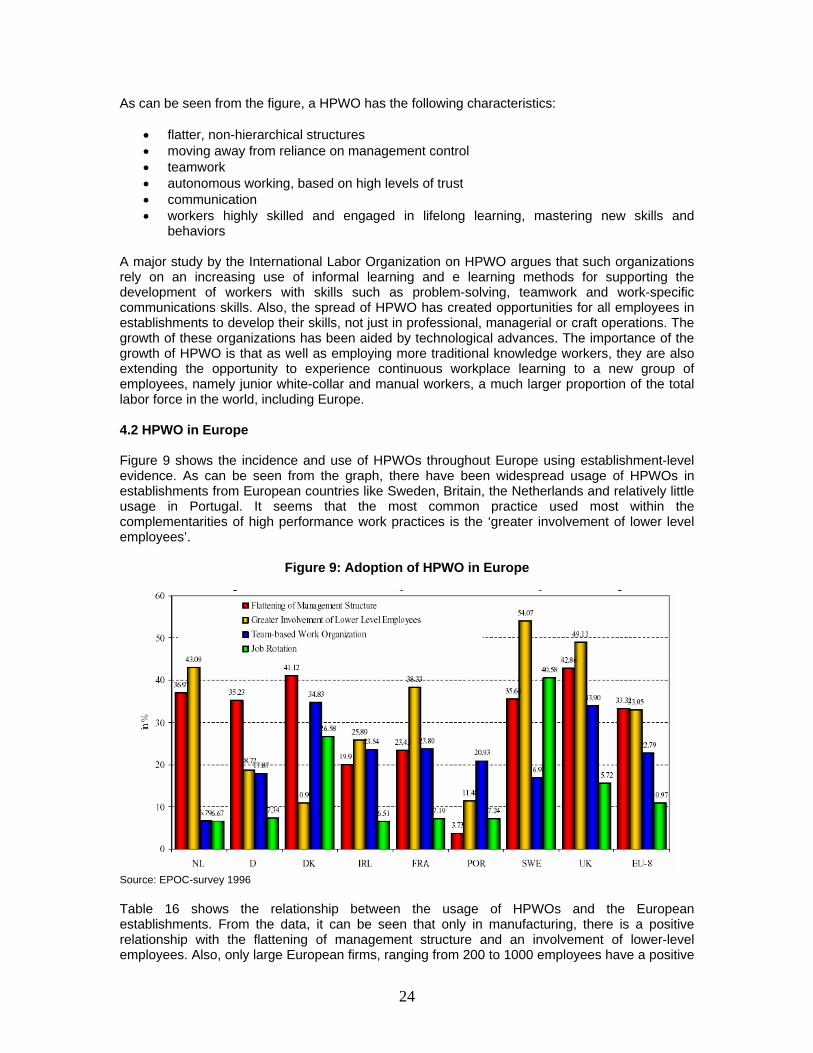
A major study by the International Labor Organization on HPWO argues that such organizations rely on an increasing use of informal learning and e learning methods for supporting the development of workers with skills such as problem-solving, teamwork and work-specific communications skills. Also, the spread of HPWO has created opportunities for all employees in establishments to develop their skills, not just in professional, managerial or craft operations. The growth of these organizations has been aided by technological advances. The importance of the growth of HPWO is that as well as employing more traditional knowledge workers, they are also extending the opportunity to experience continuous workplace learning to a new group of employees, namely junior white-collar and manual workers, a much larger proportion of the total labor force in the world, including Europe. 4.2 HPWO in Europe Figure 9 shows the incidence and use of HPWOs throughout Europe using establishment-level evidence. As can be seen from the graph, there have been widespread usage of HPWOs in establishments from European countries like Sweden, Britain, the Netherlands and relatively little usage in Portugal. It seems that the most common practice used most within the complementarities of high performance work practices is the ‘greater involvement of lower level employees’.
Figure 9: Adoption of HPWO in Europe
Source: EPOC-survey 1996 Table 16 shows the relationship between the usage of HPWOs and the European establishments. From the data, it can be seen that only in manufacturing, there is a positive relationship with the flattening of management structure and an involvement of lower-level employees. Also, only large European firms, ranging from 200 to 1000 employees have a positive
24
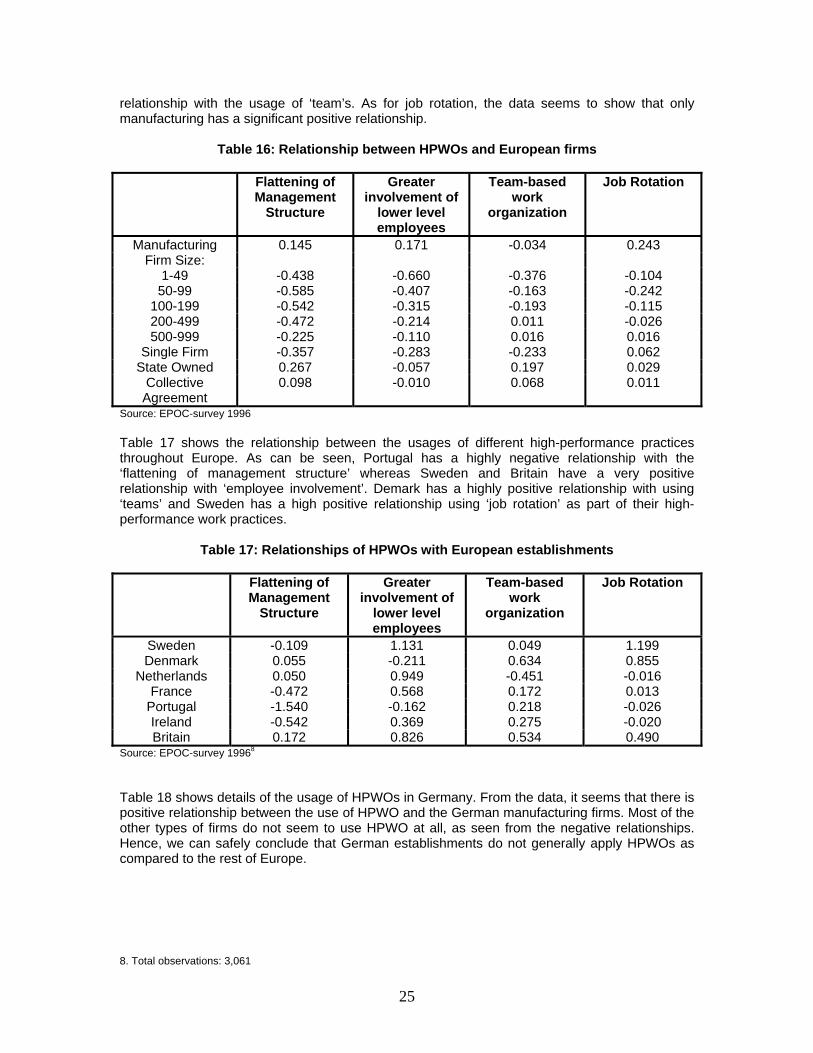
relationship with the usage of ‘team’s. As for job rotation, the data seems to show that only manufacturing has a significant positive relationship.
Table 16: Relationship between HPWOs and European firms
Flattening of Management
Structure
Greater involvement of
lower level employees
Team-based work
organization
Job Rotation
Manufacturing 0.145 0.171 -0.034 0.243 Firm Size:
1-49 -0.438 -0.660 -0.376 -0.104 50-99 -0.585 -0.407 -0.163 -0.242
100-199 -0.542 -0.315 -0.193 -0.115 200-499 -0.472 -0.214 0.011 -0.026 500-999 -0.225 -0.110 0.016 0.016
Single Firm -0.357 -0.283 -0.233 0.062 State Owned 0.267 -0.057 0.197 0.029
Collective Agreement
0.098 -0.010 0.068 0.011
Source: EPOC-survey 1996 Table 17 shows the relationship between the usages of different high-performance practices throughout Europe. As can be seen, Portugal has a highly negative relationship with the ‘flattening of management structure’ whereas Sweden and Britain have a very positive relationship with ‘employee involvement’. Demark has a highly positive relationship with using ‘teams’ and Sweden has a high positive relationship using ‘job rotation’ as part of their high-performance work practices.
Table 17: Relationships of HPWOs with European establishments
Flattening of Management
Structure
Greater involvement of
lower level employees
Team-based work
organization
Job Rotation
Sweden -0.109 1.131 0.049 1.199 Denmark 0.055 -0.211 0.634 0.855
Netherlands 0.050 0.949 -0.451 -0.016 France -0.472 0.568 0.172 0.013
Portugal -1.540 -0.162 0.218 -0.026 Ireland -0.542 0.369 0.275 -0.020 Britain 0.172 0.826 0.534 0.490
Source: EPOC-survey 19968
Table 18 shows details of the usage of HPWOs in Germany. From the data, it seems that there is positive relationship between the use of HPWO and the German manufacturing firms. Most of the other types of firms do not seem to use HPWO at all, as seen from the negative relationships. Hence, we can safely conclude that German establishments do not generally apply HPWOs as compared to the rest of Europe. 8. Total observations: 3,061
25
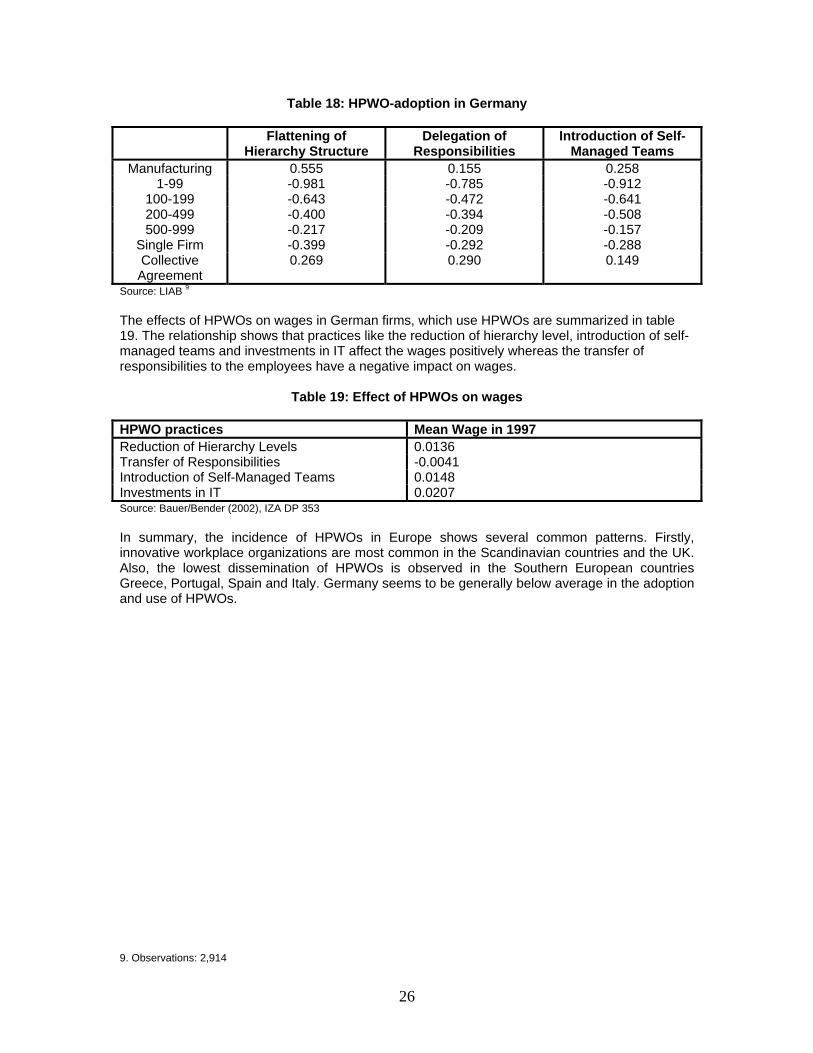
Table 18: HPWO-adoption in Germany
Flattening of Hierarchy Structure
Delegation of Responsibilities
Introduction of Self-Managed Teams
Manufacturing 0.555 0.155 0.258 1-99 -0.981 -0.785 -0.912
100-199 -0.643 -0.472 -0.641 200-499 -0.400 -0.394 -0.508 500-999 -0.217 -0.209 -0.157
Single Firm -0.399 -0.292 -0.288 Collective Agreement
0.269 0.290 0.149
Source: LIAB 9
The effects of HPWOs on wages in German firms, which use HPWOs are summarized in table 19. The relationship shows that practices like the reduction of hierarchy level, introduction of self-managed teams and investments in IT affect the wages positively whereas the transfer of responsibilities to the employees have a negative impact on wages.
Table 19: Effect of HPWOs on wages HPWO practices Mean Wage in 1997 Reduction of Hierarchy Levels 0.0136 Transfer of Responsibilities -0.0041 Introduction of Self-Managed Teams 0.0148 Investments in IT 0.0207 Source: Bauer/Bender (2002), IZA DP 353 In summary, the incidence of HPWOs in Europe shows several common patterns. Firstly, innovative workplace organizations are most common in the Scandinavian countries and the UK. Also, the lowest dissemination of HPWOs is observed in the Southern European countries Greece, Portugal, Spain and Italy. Germany seems to be generally below average in the adoption and use of HPWOs. 9. Observations: 2,914
26
5 Information Technology
5.1 Introduction From the early days of IT deployment in establishments, economists have found it difficult to measure the contribution of IT investments. The challenge of measuring the economic impacts of IT lies in the indirect ways and processes through which IT applications create value. In comparing IT investments to non-IT capital assets, Banker, Kauffman and Mahmood (1993) suggested, “The focus of information technology assessment shifts from measuring hard and quantitative dollar benefits that will appear on the firm’s income statement to measuring indirect, diffuse qualitative and contingent impacts that are very difficult to quantify well.” “You can see the computer age everywhere these days, except in the productivity statistics” (Robert Solow). The apparent lack of a positive contribution from IT investments has been discussed extensively, especially in the United States (e.g. Kauffman & Weill, 1989; Brynjolfsson, 1993). Research on the impacts of IT usually starts with the basic assumption that generally, computers enhance productivity. Various studies in recent years have tried to uncover the IT productivity paradox at the firm level. Brynjolfsson (1993) notes that IT investments may not pay off immediately after investment and that the time periods covered by productivity studies may not be sufficient;y long to capture the delayed creation of value. He also suggested that in a competitive business sector, firms may be compelled to pass on technology-related benefits to consumers and that productivity studies may fail to detect this redistribution effect. Despite many studies and literature on this topic, the economic impacts of IT continue to pose major challenges regarding theoretical foundation, measurement, and data issues. After a string of research showing insignificant or even negative returns from IT investments, recent studies have found a positive linkage between IT and economic performances (e.g Brynjolfsson & Hitt 1993, 1996; Dewan & Min, 1997). Landauer (1995) argues that exisiting evidence in favor of productivity effects is rather weak and that existing studies suffer from severe measurement problems. In fact, in an interview in 1999 by Lohr, Robert Solow took a more positive stance on the impact of IT, “My beliefs are shifting on this subject… the story always was that it took a long time for people to use information technology and truly become more efficient. The story sounds a lot more convincing today than it did a year or two ago.” This rapid diffusion of information technology has widely changed the consequences of IT use on the labor market. In the early eighties, knowledge of computers/ IT was an advantage in a career, the same knowledge now is so commonplace that the inability to use such tools is widely seen as a professional handicap in many industries. The introduction of IT transforms the production function of firms, modifying both the composition and the quality of production factors. The firms’ capital stock will include an increasing volume of electronic/computer equipment that performs more efficiently. Hence, with this increasing presence of information technology, firms have to employ more specialized labor, who must then acquire the specific knowledge and skills in order to manage and maintain the new IT equipment installed. Also, firms will now have to modify their production, administrative and sales structures, adapting the competencies of their workforce, in the fields of design and supervision as well as in production itself. This spread of IT should enable these firms to improve performance particularly in terms of labor productivity and total factor productivity. However, Landauer (1995) maintains that “computers have not contributed nearly as much to labor productivity as we had hoped, were promised, believed – or by rights, they should.” Yet, IT remained an important field of corporate investment in all sectors, including Europe. For example, the German IT market was valued at about 37 billion ECU in 1994, or about 4.5% of Germany’s GDP (Licht and Moch 1997).
27
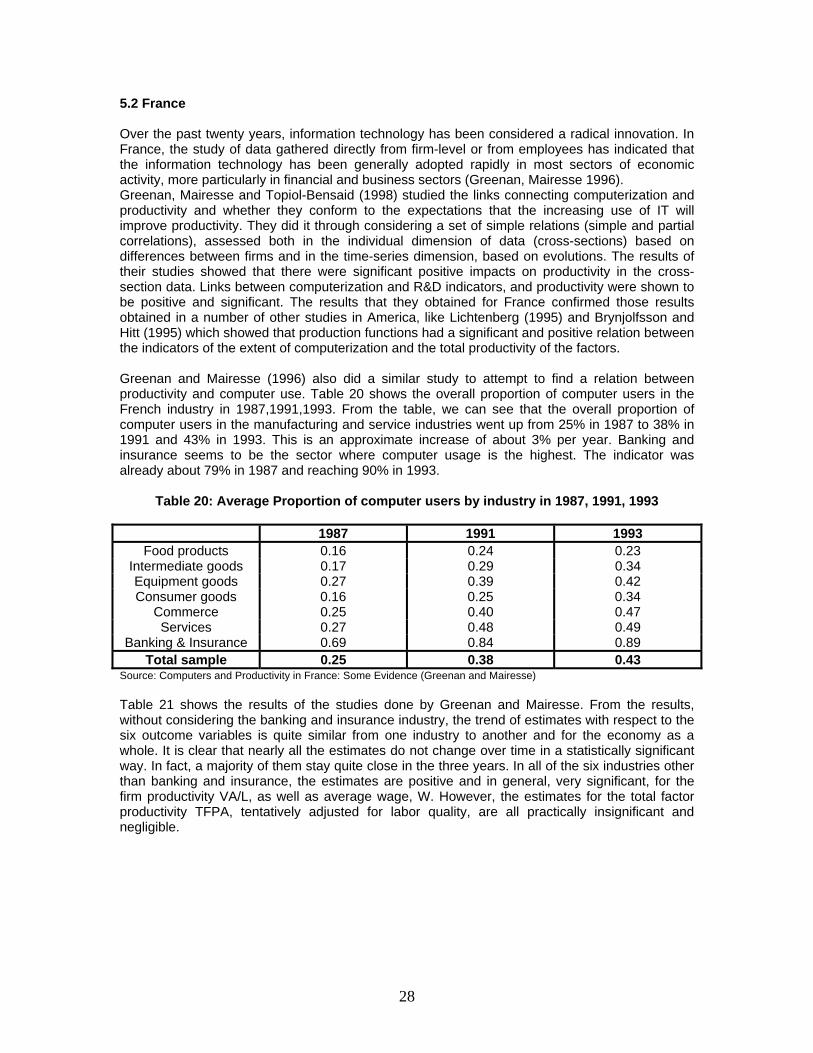
5.2 France Over the past twenty years, information technology has been considered a radical innovation. In France, the study of data gathered directly from firm-level or from employees has indicated that the information technology has been generally adopted rapidly in most sectors of economic activity, more particularly in financial and business sectors (Greenan, Mairesse 1996). Greenan, Mairesse and Topiol-Bensaid (1998) studied the links connecting computerization and productivity and whether they conform to the expectations that the increasing use of IT will improve productivity. They did it through considering a set of simple relations (simple and partial correlations), assessed both in the individual dimension of data (cross-sections) based on differences between firms and in the time-series dimension, based on evolutions. The results of their studies showed that there were significant positive impacts on productivity in the cross-section data. Links between computerization and R&D indicators, and productivity were shown to be positive and significant. The results that they obtained for France confirmed those results obtained in a number of other studies in America, like Lichtenberg (1995) and Brynjolfsson and Hitt (1995) which showed that production functions had a significant and positive relation between the indicators of the extent of computerization and the total productivity of the factors. Greenan and Mairesse (1996) also did a similar study to attempt to find a relation between productivity and computer use. Table 20 shows the overall proportion of computer users in the French industry in 1987,1991,1993. From the table, we can see that the overall proportion of computer users in the manufacturing and service industries went up from 25% in 1987 to 38% in 1991 and 43% in 1993. This is an approximate increase of about 3% per year. Banking and insurance seems to be the sector where computer usage is the highest. The indicator was already about 79% in 1987 and reaching 90% in 1993.
Table 20: Average Proportion of computer users by industry in 1987, 1991, 1993
1987 1991 1993 Food products 0.16 0.24 0.23
Intermediate goods 0.17 0.29 0.34 Equipment goods 0.27 0.39 0.42 Consumer goods 0.16 0.25 0.34
Commerce 0.25 0.40 0.47 Services 0.27 0.48 0.49
Banking & Insurance 0.69 0.84 0.89 Total sample 0.25 0.38 0.43
Source: Computers and Productivity in France: Some Evidence (Greenan and Mairesse) Table 21 shows the results of the studies done by Greenan and Mairesse. From the results, without considering the banking and insurance industry, the trend of estimates with respect to the six outcome variables is quite similar from one industry to another and for the economy as a whole. It is clear that nearly all the estimates do not change over time in a statistically significant way. In fact, a majority of them stay quite close in the three years. In all of the six industries other than banking and insurance, the estimates are positive and in general, very significant, for the firm productivity VA/L, as well as average wage, W. However, the estimates for the total factor productivity TFPA, tentatively adjusted for labor quality, are all practically insignificant and negligible.
28
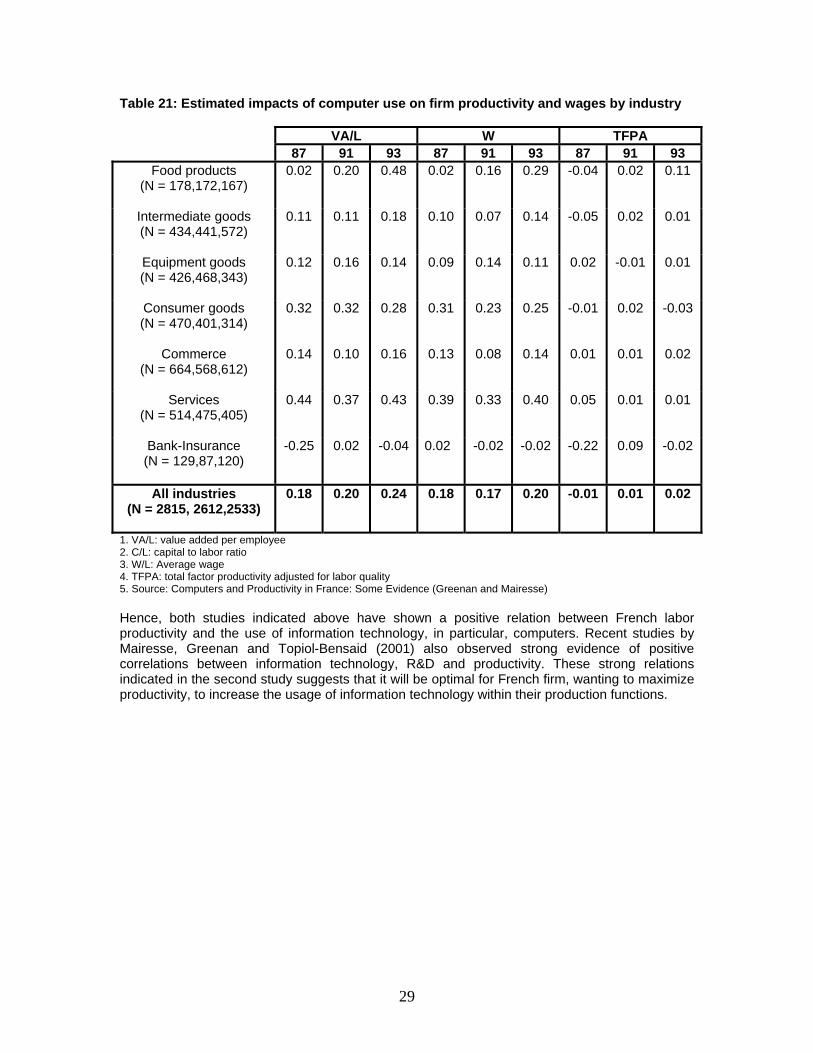
Table 21: Estimated impacts of computer use on firm productivity and wages by industry
VA/L W TFPA 87 91 93 87 91 93 87 91 93
Food products (N = 178,172,167)
0.02 0.20 0.48 0.02 0.16 0.29 -0.04 0.02 0.11
Intermediate goods (N = 434,441,572)
0.11 0.11 0.18 0.10 0.07 0.14 -0.05 0.02 0.01
Equipment goods (N = 426,468,343)
0.12 0.16 0.14 0.09 0.14 0.11 0.02 -0.01 0.01
Consumer goods (N = 470,401,314)
0.32 0.32 0.28 0.31 0.23 0.25 -0.01 0.02 -0.03
Commerce (N = 664,568,612)
0.14 0.10 0.16 0.13 0.08 0.14 0.01 0.01 0.02
Services (N = 514,475,405)
0.44 0.37 0.43 0.39 0.33 0.40 0.05 0.01 0.01
Bank-Insurance (N = 129,87,120)
-0.25 0.02 -0.04 0.02 -0.02 -0.02 -0.22 0.09 -0.02
All industries (N = 2815, 2612,2533)
0.18 0.20 0.24 0.18 0.17 0.20 -0.01 0.01 0.02
1. VA/L: value added per employee 2. C/L: capital to labor ratio 3. W/L: Average wage 4. TFPA: total factor productivity adjusted for labor quality 5. Source: Computers and Productivity in France: Some Evidence (Greenan and Mairesse) Hence, both studies indicated above have shown a positive relation between French labor productivity and the use of information technology, in particular, computers. Recent studies by Mairesse, Greenan and Topiol-Bensaid (2001) also observed strong evidence of positive correlations between information technology, R&D and productivity. These strong relations indicated in the second study suggests that it will be optimal for French firm, wanting to maximize productivity, to increase the usage of information technology within their production functions.
29
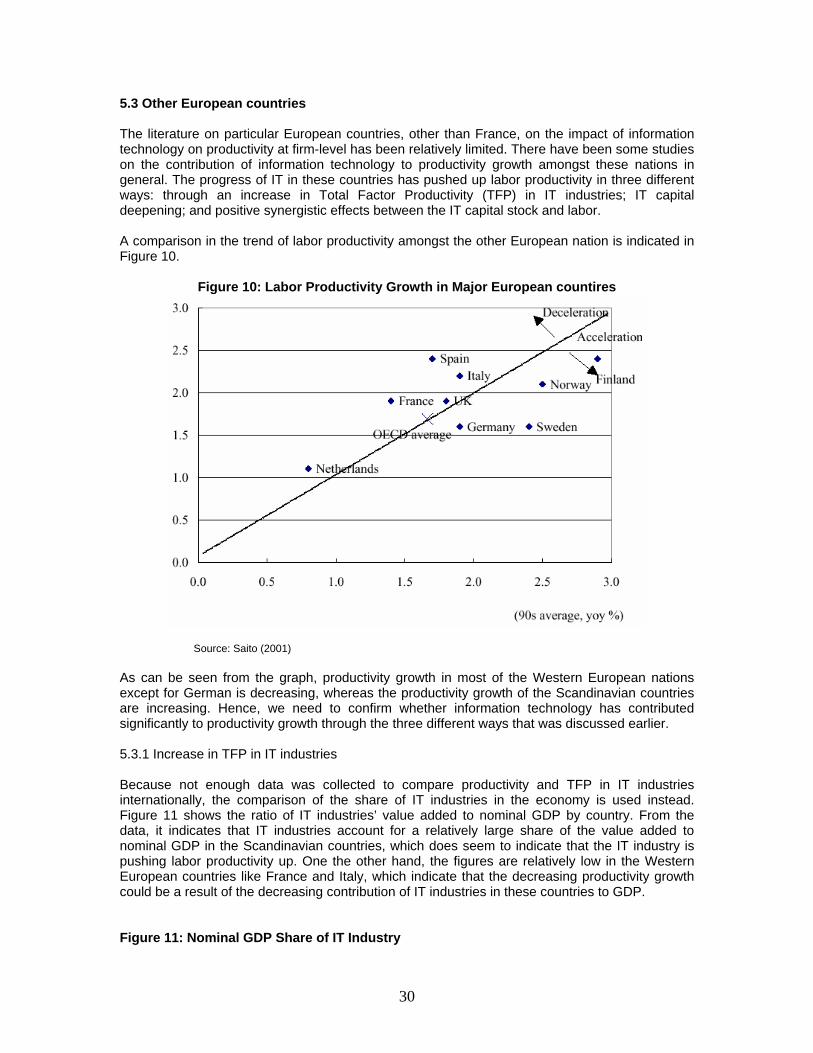
5.3 Other European countries The literature on particular European countries, other than France, on the impact of information technology on productivity at firm-level has been relatively limited. There have been some studies on the contribution of information technology to productivity growth amongst these nations in general. The progress of IT in these countries has pushed up labor productivity in three different ways: through an increase in Total Factor Productivity (TFP) in IT industries; IT capital deepening; and positive synergistic effects between the IT capital stock and labor. A comparison in the trend of labor productivity amongst the other European nation is indicated in Figure 10.
Figure 10: Labor Productivity Growth in Major European countires
Source: Saito (2001) As can be seen from the graph, productivity growth in most of the Western European nations except for German is decreasing, whereas the productivity growth of the Scandinavian countries are increasing. Hence, we need to confirm whether information technology has contributed significantly to productivity growth through the three different ways that was discussed earlier. 5.3.1 Increase in TFP in IT industries Because not enough data was collected to compare productivity and TFP in IT industries internationally, the comparison of the share of IT industries in the economy is used instead. Figure 11 shows the ratio of IT industries’ value added to nominal GDP by country. From the data, it indicates that IT industries account for a relatively large share of the value added to nominal GDP in the Scandinavian countries, which does seem to indicate that the IT industry is pushing labor productivity up. One the other hand, the figures are relatively low in the Western European countries like France and Italy, which indicate that the decreasing productivity growth could be a result of the decreasing contribution of IT industries in these countries to GDP. Figure 11: Nominal GDP Share of IT Industry
30
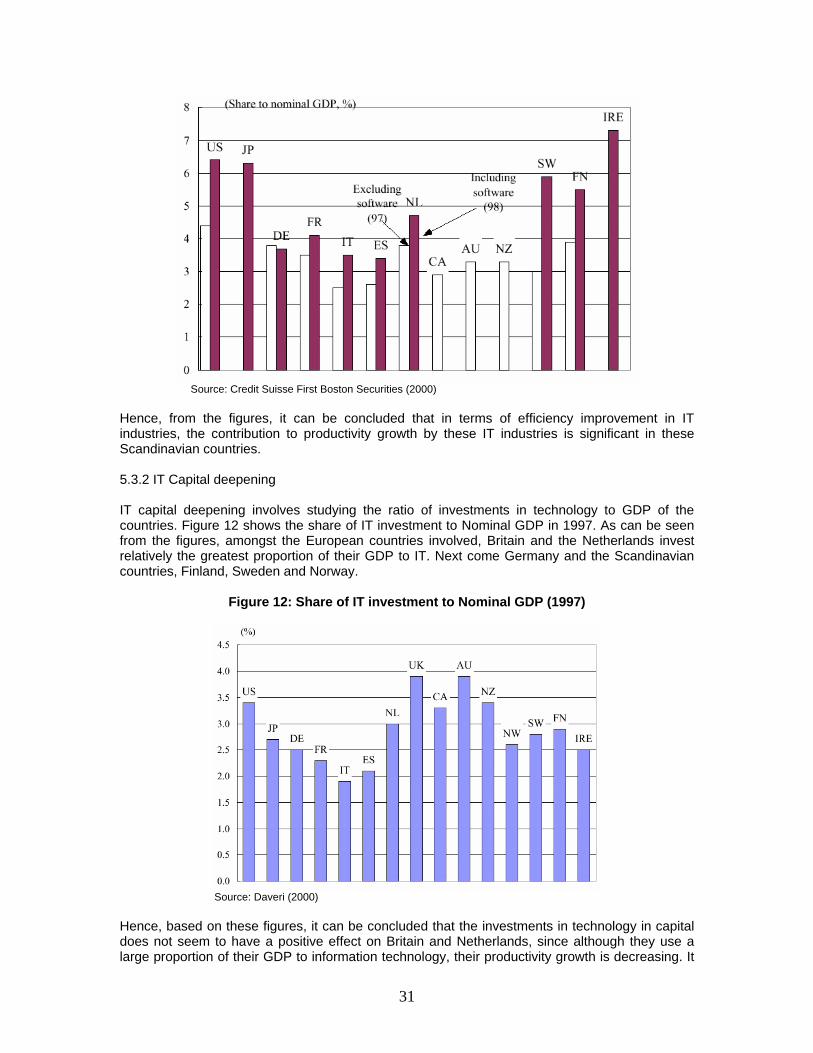
Source: Credit Suisse First Boston Securities (2000) Hence, from the figures, it can be concluded that in terms of efficiency improvement in IT industries, the contribution to productivity growth by these IT industries is significant in these Scandinavian countries. 5.3.2 IT Capital deepening IT capital deepening involves studying the ratio of investments in technology to GDP of the countries. Figure 12 shows the share of IT investment to Nominal GDP in 1997. As can be seen from the figures, amongst the European countries involved, Britain and the Netherlands invest relatively the greatest proportion of their GDP to IT. Next come Germany and the Scandinavian countries, Finland, Sweden and Norway.
Figure 12: Share of IT investment to Nominal GDP (1997)
Source: Daveri (2000) Hence, based on these figures, it can be concluded that the investments in technology in capital does not seem to have a positive effect on Britain and Netherlands, since although they use a large proportion of their GDP to information technology, their productivity growth is decreasing. It
31
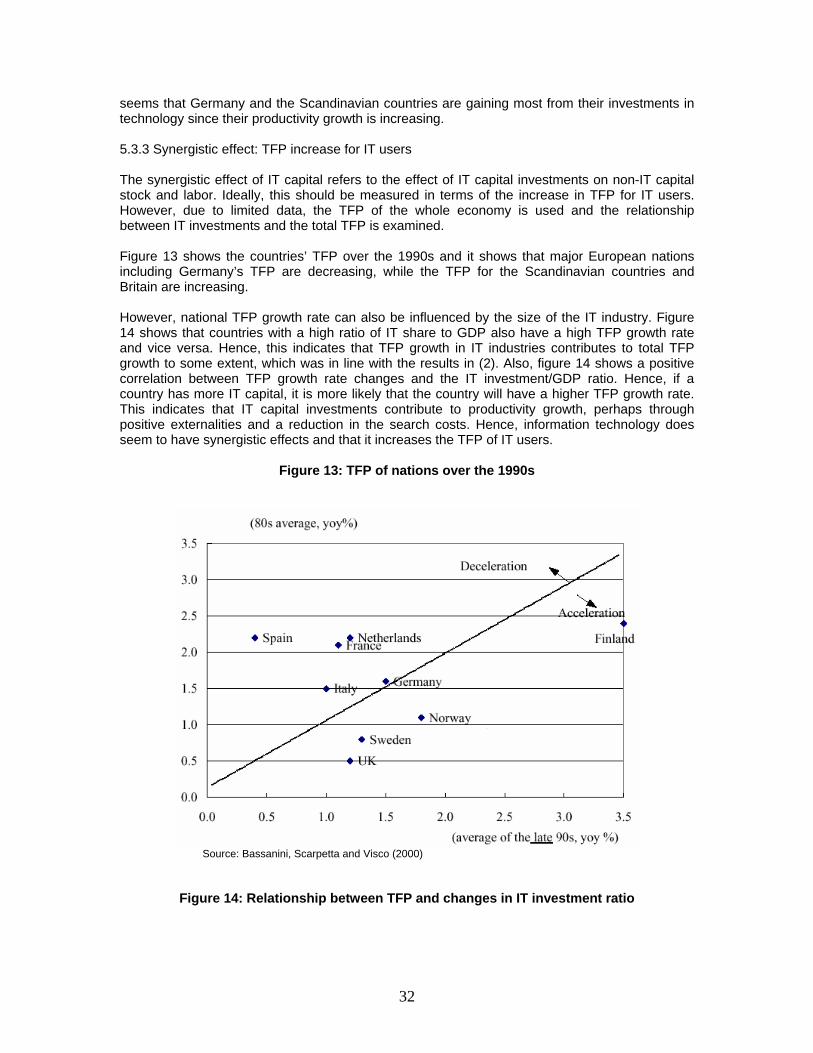
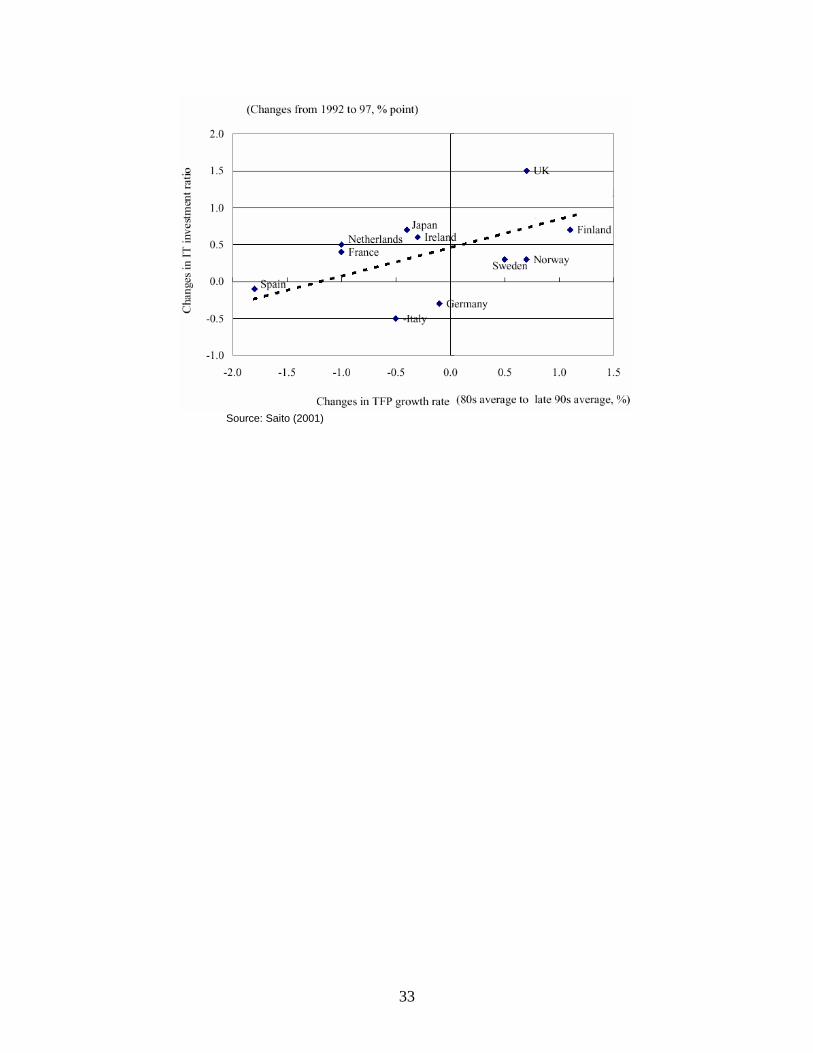
seems that Germany and the Scandinavian countries are gaining most from their investments in technology since their productivity growth is increasing. 5.3.3 Synergistic effect: TFP increase for IT users The synergistic effect of IT capital refers to the effect of IT capital investments on non-IT capital stock and labor. Ideally, this should be measured in terms of the increase in TFP for IT users. However, due to limited data, the TFP of the whole economy is used and the relationship between IT investments and the total TFP is examined. Figure 13 shows the countries’ TFP over the 1990s and it shows that major European nations including Germany’s TFP are decreasing, while the TFP for the Scandinavian countries and Britain are increasing. However, national TFP growth rate can also be influenced by the size of the IT industry. Figure 14 shows that countries with a high ratio of IT share to GDP also have a high TFP growth rate and vice versa. Hence, this indicates that TFP growth in IT industries contributes to total TFP growth to some extent, which was in line with the results in (2). Also, figure 14 shows a positive correlation between TFP growth rate changes and the IT investment/GDP ratio. Hence, if a country has more IT capital, it is more likely that the country will have a higher TFP growth rate. This indicates that IT capital investments contribute to productivity growth, perhaps through positive externalities and a reduction in the search costs. Hence, information technology does seem to have synergistic effects and that it increases the TFP of IT users.
Figure 13: TFP of nations over the 1990s
Source: Bassanini, Scarpetta and Visco (2000)
Figure 14: Relationship between TFP and changes in IT investment ratio
32
Source: Saito (2001)
33
6 Labor Policy Issues
6.1 Introduction In Europe, an effective labor policy exclusively at the national level can no longer be successfully managed due to globalization and European integration. Labor market policies and agreement on employment policy priorities (promotion of investment, raising the employment intensity of growth, lowering non-wage costs, active labor market policies, improvement in measures on behalf of “problem groups of labor market”) are all aimed at making a concrete contribution to modernizing labor markets. Labor policy implementations can differentiated into four areas/ regions in terms of the national economic structures and regulatory systems within the European Union. The first system is the North European region (Finland, Sweden, Denmark), which is characterized economically by high labor productivity in industry and successful “niche production” globally. Politically, these countries follow a social democratic statist political and welfare state model and thus are distinguished by a high welfare state sector and whose industrial relations are part of this statis regulatory model. The second model include Western Germany, the Benelux countries, France and northern Italy, which can be characterized by a highly productive, export oriented and successful Fordist production model (“high quality, high-skill, high wage production”), whose regulatory system, especially in Germany, is characterized by corporatist association structures, a functional connection of industrial and bank capital, high labor standards and a high share in the social product of the welfare state and social security. The third region is the Southern Region of Europe (Portugal, Spain, Greece, Southern Italy), which is still strongly agrarian and which have regionally dominant traditional social structures and also with individual companies or entire districts centered around large urban centers such as Barcelona. This region functions more as subcontractors to the productivist core of Europe. The last region include Great Britain and Ireland, characterized by the separation of industrial and financial capital and the conquest by brute force of a “mature economy” by Thatcherist radical market policies, which resulted in a drop in the standard of labor, forced the unions and “collective baragaining” systems into a corner and reduced and partially privatized the social security system and state infrastructure. 6.2 Policies proposed by the European Commission With globalization and the integration of the European nations into a single economic market, the European commission, in 1993, presented a White Paper, with regards to new labor policies that the European nations should undertake in order to stay competitive. The Commission determined that, contrary to the view that Europe’s economic system is not competitive because of its high wages and social welfare benefits, labor cost is not the sole factor that determines international competitiveness and that sharp fluctuations in labor costs are actually due to massive rate fluctuations in the bilateral exchange rates of the European currencies, dollar and yen. In addition, it argued that wage differentials relative to newly industrialized nations are so large that wage reductions are useless. Hence, it proposed that the growth in real wages should be a percentage point below the growth of labor productivity. The Commission also recommended that there should be a clear reduction in non-wage costs in the form of wage taxes and social contributions. Also, the future skills supply of labor was emphasized as well. The Commission noted that the employment system in Europe no longer meets the requirements, which changed clearly under
34
the conditions of globalization. Recovering and preserving the competitive position and lowering unemployment require a skills profile of workers that is flexible and high and who can adapt to innovations of work-organization technology, one that ensures high productivity and correspondingly high incomes and can contribute to the company internally and externally. “The introduction of more flexible and open training systems and the development of individuals’ adaptability are becoming increasingly necessary; for companies as well, to enable them to better utilize the technological innovations they have developed or purchased.” (Commission 1993, p132) Thirdly, the Commission recommended a reduction in the working week. Working reductions in the early 1990s made a clear contribution to employment security and job creation. In the Netherlands, half of the 30% rise in employment was due to the reduction in the average working time. Hence, the Commission introduced new forms of working time policy such as flexible retirement rules, modulated working times during the year and expanded part-time models. It recognized that innovative working time concepts could increase firms’ innovation capability and contribute to enhanced productivity. In recent months, the EU undertook a few new initiatives concerning employment and labor issues. These proposals focused on the revision of current EU directives and seek to fill in the gaps left by treaties and directives already in force. It has undergone research into the sustainability of pension systems and has completed recommendations to provide for said structures. There have also been changes to the European Works Councils Directive in that France, Germany and Britain now fall into the works council structure of labor relations. In 2001, there have been three major new EU draft directives. They are
i. Equal treatment of women in the workplace ii. Requirements on exposure of workers to risks arising from noise iii. Information and Consultation of Employees
The third directive is the most interesting one in this context. It seeks to establish minimum standards of consultation and informing workers in establishments operating within a single member state. It will complement the existing directives with provisions on information and consultation in situations of collective redundancies and of transfers of undertakings and the European Works Council directive that applies to firms operating in two or more member states. Employers are required to provide information of when probable developments will affect employment in regards to levels of employment, work organization or contractual relations. Consultation must incorporate:
• Timing, method and content must be appropriate to the situation; • The relevant level of management and representation must be involved; • Relevant information must be supplied by the employer; • The Employees’ representative must be able to meet with the employer and obtain a
reasonable response to any opinion submitted; • All consultation must be done with a view to reaching an agreement on decisions within
the scope of the employer’s powers. Although there had been successes in the integrated labor policies, many EU members lean towards giving preference to a further deregulation of labor markets and a dismantling of social security systems (Foden 1996). It is thus important that in order for further integration, further democratizing the EU institutions, strengthening the European parliament, adopting fundamental social rights in a future European constitution and anchoring an active European employment policy must be carried out.
35
6.3 Major Developments in European countries 6.3.1 Britain This new directive proposing information and consultation of workers will force Britain to accept Europe’s system of work councils. In the past, Britain has no such system of consultation. She has always been subject to the directive that establishes work council in multinational companies but will now have to expand this use to all domestic firms. 6.3.2 Germany The German parliament approved a bill in June 2001 that strengthens the work councils in the state. This new legislation includes a simplified voting system for representatives to the work councils. It also reduces the number of employees a company must have (200) before they have to provide paid time off to serve on a works’ council. Also, it limits employers’ authority to use short-term job contracts and increased employees’ rights to part time work, although this may seem a bit paradoxical. To placate the employers, the legislation enables rules before labor boards to be resolved quicker and cheaper. Also, a commission appointed by the government released that Germany would have to open its doors to immigration if it is to remain an economic power. It states that a new immigration policy is necessary to achieve this goal. Germany will have to allow entry of some 50,000 qualifies workers a year and will incorporate a plan to seek balance in the diversity of workers admitted, combining permanent migrants, younger workers seeking training and temporary workers intent on working in sectors with labor shortages. Also, five of the separate trade unions in Germany merged into the Union of Service Trade Unions. The unions cited membership recruitment concerns as the driving force behind the merger, which combines important sectors in the service economy like public services, transport and communications etc. 6.3.3 France New legislation was proposed to significantly strengthen workers’ rights after two massive layoffs by large employers in France. The costs of cutting jobs will be greatly increased through a series of measures. The first will double the minimum compensation paid to cut staff and a mandatory job conversion with an employees’ contract extended through the period of re-training. Other measures include strengthening the work councils, imposing longer notice periods and additional obligation on profitable companies to provide alternative jobs and retraining instead of straight job cuts. There will also be a 21-day delay period before any redundancy program is announced, giving the employees greater time to challenge any downsizing and consult with the company. 6.4 Government’s role in subsidizing training 6.4.1 Introduction As stated earlier in Chapter 3, training does have an effect on productivity in European markets, as well as in the U.S. labor market. The key question for training is that it entails the presence of uncertainty and asymmetric information among the stakeholders. If, for example, the workers are asked to bear the expense and opportunity costs of training, they face the uncertainty of the subsequent demand for the job, which they went training for. If the firms are asked to bear the expense, they will now face the uncertainty of future occupational needs and the uncertainty of whether a trained employee will stay or leave before they can recoup a return on the investments. Lastly, if the government is to subsidize training, uncertainty still remains about future labor demand.
36
However, many economists argue that the government should do more to increase its workers’ skills, i.e. subsidizing training, as this helps the country maintain flexible and productive workforces in the face of technological change and global competition. I will now attempt to examine the different labor policies which the U.S. government and other key European countries have on subsidies to training. 6.4.2 United States The United States government subsidizes firm’s investment in training mainly in the form of subsidies allocated in the budget, whereby firms can use this amount of money allocated for training their workers. The government had fostered cooperation between training institutions and employers for many years now. The 1997 Balanced Budget Act established the HOPE scholarship fund, giving most work families a tuition credit of up to $1,500 per student for postsecondary education and training. Its main purpose is to give workers an opportunity to develop new skills and to retrain. Most training programs in the U.S. are actually administered by the States, which devise unique organizational and coordination frameworks. In addition, most education institutions, secondary through post secondary are organized and financed by the State government and most for-profit training centers are regulated and licensed by United States. Over the past two decades, the State government has expanded their business development efforts at not only wooing new firms to boost the State economy but also at inducing existing employers to create new jobs or to avoid layoffs. In the 1988-89 fiscal year, 44 states operated 1 or more company-customized training programs with annual budgets totaling about US$375 million. Ever since, there has been a growing state government role in subsidizing training as an economic development tool. As stated earlier, the states are mainly involved in federal training subsidies and programs. Hence, state programs are of particular interest as the state governments prepare to implement the Workforce Investment Act (WIA) of 1998, which for the first time explicitly provides for the expenditure of federal money for training incumbent workers. Since the late 1950s, all but three states have allocated part of their budget to subsidize customized training for individual firms. Currently, at least 45 states operate such programs. The main aim of such programs is to improve the lives of state residents. However, there are distinctions between such state programs and federal programs. Firstly, the state program is different from Federal training subsidies whose emphasis is more of social goals whereas state programs are more geared towards attracting and retaining jobs. Also, unlike the worker-centered federal programs, the state programs are employer-centered where the programs have few requirements for targeting individuals, with employers are free to decide whom to train. Lastly, state programs allow training of incumbent workers for new jobs or new job duties, which they view as necessary in a fast-changing economy. As stated earlier, total spending by the states in 1988-89 was US$375 million. This has increased to about US$593 million, up 10 percent from the year before and up about 60 percent from 10 years before. In fact, since 1992-93, national budgets on training subsidies have increased every year, with the largest one-year increase being in 1996-97, when funding increased by more than US$100 million. The top 10 states ranked by 1998-99 budgets in training subsidies are California, Texas, Iowa, Kansas, Michigan, Pennsylvania, Missouri, Illinois, New Jersey and North Carolina, which spend almost 60% of the national total. Iowa is the top state in training subsidies, with nearly $30 per worker in the state, with Kansas being second at $25 per worker. Table 22 gives a case study example of the amounts of training subsidies given out by the Washington State government in 2000.
Table 22: Types, Sources and Amounts of Washington State Government Training Subsidies in Fiscal 2000
37
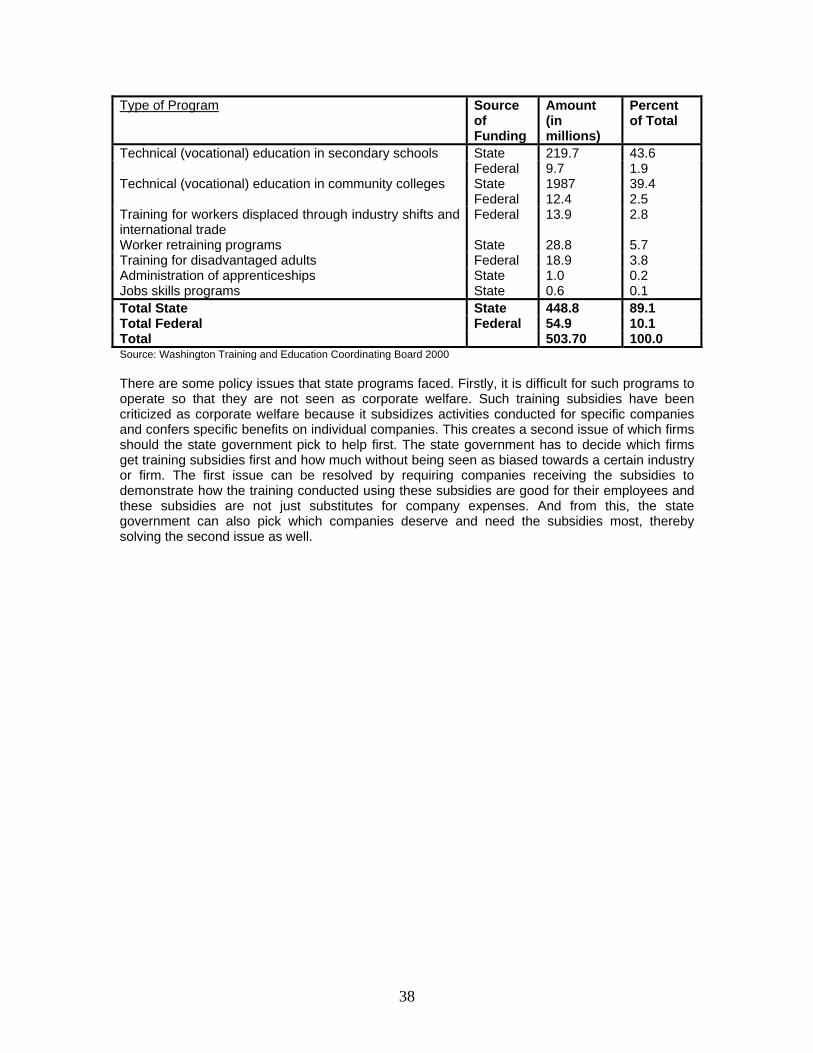
Type of Program Source of Funding
Amount (in millions)
Percent of Total
Technical (vocational) education in secondary schools State 219.7 43.6 Federal 9.7 1.9 Technical (vocational) education in community colleges State 1987 39.4 Federal 12.4 2.5 Training for workers displaced through industry shifts and international trade
Federal 13.9 2.8
Worker retraining programs State 28.8 5.7 Training for disadvantaged adults Federal 18.9 3.8 Administration of apprenticeships State 1.0 0.2 Jobs skills programs State 0.6 0.1 Total State State 448.8 89.1 Total Federal Federal 54.9 10.1 Total 503.70 100.0 Source: Washington Training and Education Coordinating Board 2000 There are some policy issues that state programs faced. Firstly, it is difficult for such programs to operate so that they are not seen as corporate welfare. Such training subsidies have been criticized as corporate welfare because it subsidizes activities conducted for specific companies and confers specific benefits on individual companies. This creates a second issue of which firms should the state government pick to help first. The state government has to decide which firms get training subsidies first and how much without being seen as biased towards a certain industry or firm. The first issue can be resolved by requiring companies receiving the subsidies to demonstrate how the training conducted using these subsidies are good for their employees and these subsidies are not just substitutes for company expenses. And from this, the state government can also pick which companies deserve and need the subsidies most, thereby solving the second issue as well.
38

6.4.3 Europe The basic pattern of subsidizing firms’ investment training in Europe is as follows: Initial vocational training that takes place outside the firm is publicly financed by the government as well as continuing training for the unemployed, which is also funded by the state budget or unemployment insurance. In most of the European countries, the financing of training system is usually through a mixed system. The government will subsidize training through taxes, firms will finance through their private budget. On-the-job training, for example, is externally financed to a considerable extent as a result of public subsidies from national or regional governments or the European Union, through collective agreements between the government and the firms. Continuing training for the unemployed is paid mainly by the government. The rest of the training are financed by the firms’ own private budget. There are basically two distinguishable coherent patters in Europe and in both patterns, it involves a “tripartite” system, whereby the financing of training resources are done via tripartite understandings reached between the employers’ federations, government and trade unions. This understanding is not necessarily the same as a “collective agreement” but rather it can constitute binding agreements between the three parties. The first system can be found in the French speaking countries and Italy in Europe. In France, the financing of training is embedded in a complex tangle of regulations on a contractual and legal basis. There is a “teaching tax” which is equivalent to 0.5% of total wage used to subsidize training of apprentices and to contribute toward financing statutory training in schools. Firms will then be able to write off their expenses for the training of apprentices from their taxes. This acts a type of subsidy by the government on training. The French system is regulated by many overlapping instruments. Firms are required by the government to spend 1.5% of their overall gross payroll on continuing training. On top of that, they must prove to the government that they have already done so, failing which they must pay a certain amount to the tax authorities as a penalty. There are additional requirements as well required by the government, such as the firms are obliged to finance study leave etc. Public funds at the regional and sectorial level are also set up, where the money is used for financing training courses. These funds are contributed by the firms that are under contracts and the punishing mechanism set up by the government is as mentioned earlier. In total, an overall 128 billion francs was spent on training in state-run schools in 1994, roughly 12% was obtained from the public funds. In Spain, there was a statutory vocational training tax that the government collects to pay for qualifying the unemployed and integrating people that are starting out to work. This tax was collected together with social security payments. At the end of 1992 however, new framework conditions were laid down for the financing of training: a bilateral agreement between the employers’ organization and the unions and a tripartite contract including the Spanish government. In Greece, there has been a similar agreement as in France, whereby there have been joint fund-based financing. Two funds had been set up by law within the context of work administration: namely a fund for employees in the continuing vocational training sector, which employers fund with 0.45% of the overall payroll and a fund for financing of training measures aimed at combating unemployment to which the employers contribute 0.5% and the workers 0.2%. The Greek government, like its French counterpart, will act as a mediator ensuring that these conditions have been fulfilled.
39

In Italy, funds have already existed for a long time for the financing of publicly run continuing training courses and company resources (0.3% of the payroll total), state and European funds (taken from the Structural Funds) flow into them. The second system is mainly found in the Scandinavian countries like Denmark and Sweden. In Denmark, the system can be described as a “training society” whereby taking part in continuing training is part and parcel of the Danish culture. Training activities have been dominated by state financing as well as in vocational and continuing training. The Danish system of training is largely characterized by state regulations and the government has a very strong commitment towards training, mainly due to the structure of the sizes of companies in Denmark – most have fewer than 10 employees. The state commitment is intended to promote the vocational training of people working for small companies. In the past, training courses had been financed via central employment funds fed by taxes but now, state financing in Denmark is giving way towards a system of co-financing whereby the training courses are not only being subsidized by the government but also by the employers and workers themselves. There exists a legally established and jointly administered public fund “Arbejdsgivernes Elevrefusion” which reimburses wage costs payable by employers during the period of education at vocational training schools and the costs arising in connection with the training outside the company. All the firms have to pay a certain amount into this fund and the Danish government will supplement a certain fraction of the total amount to the fund from the Danish national budget. In Finland and Sweden, the training courses are also actively being financed out of tax revenue. For example, in Finland, a financial support system has been undergoing trails for the long-term unemployed taking part in continuing training courses/ The allocation made from the government subsidies are topped up from the vocational training fund and redundancy pay so as to motivate the individuals concerned to take part. Other smaller kinds of systems to finance training can also be found in different European countries. In Belgium, there exists an agreement reached in a multi-sectorial collective agreement with a view to finance training courses for groups at risk on the labor market by means of a government tax levied on companies equivalent to 0.25% of the overall payroll and paid into a national fund. This arrangement has since been legally anchored in line with the Belgian political model. In the Netherlands, there have been joint funds in several sectors for financing initial and continuing training. State resources earmarked for the training of apprentices have also flowed into these joint funds. However, unlike the agreements concluded in France, here sectorial agreements are autonomous arrangements between the parties to collective bargaining, rather than agreements that might have come about on a tripartite basis. In both Germany and Austria, company-level schemes dominate and the government’s role in the subsidy of training programs is limited. 6.4.4 Summary The main difference between the U.S. and European countries’ method of subsidizing training courses is that in Europe, there seems to exist a closer relationship between the parties involved, mainly the employers’ organization, the trade unions and the government in deciding the training budget and all three parties would make contributions towards a central fund. Whereas in the United States, the notion of a central training fund is limited and there seems to be a clear distinction in the types of training funds, the state subsidy and the firms’ individual training budgets.
40
7 Summary
The main problem encountered in this paper is the difficulty in finding suitable data for analysis. There is comparatively limited literature on innovative HRM practice and information technology of European countries and data sets have been particularly difficult to come up with. From the evidence which was actually collected, it is clear that there is a high usage of innovative HR management techniques and information technology in major European countries, especially from those in the European Union. I picked three main innovative HR management techniques that are employed widely in Europe, incentive pay systems, training and high performance work organizations (HPWO). For incentive pay, the effect on productivity is ambivalent, i.e. the impact of having incentive pays differs from country to country. From the data, we found that Britain and Finland had positive impacts on productivity from the use of incentive pay, whereas France and Germany had negative impacts on productivity. For training, we found from the countries where data was analyzed, namely Britain, France Germany and Sweden, training had a positive impact on productivity, although no direct evidence was found in Germany. For HPWOs, there is evidence to show widespread usage amongst European Union members. Although no evidence can be found on the impact of productivity on productivity from firms employing HPWOs, there has been evidence to suggest that HPWOs have an impact on wages instead. From Germany, the effects of practices like reduction of hierarchy level, introduction of self-managed teams and investments in IT affect wages positively whereas employees’ empowerment have a negative impact on wages. As for information technology, its impact on productivity differs amongst the European nation. Generally, evidence suggests that I.T. seems to have a greater positive impact on Scandinavian countries like Finland, Sweden and have a small impact on major Western countries like Germany and Britain. I included a portion of ‘Labor Policy’ Issues in the paper as well, because I feel that the adoption of innovative HRM practices and information technology can be complemented by a good policy by the government as well. Many economists believe that the government should take up a more active role in labor management at the firm level, especially in the area of training, for which I discussed for an entire section. Different governments, like the ones from France and Denmark, have two different systems for financing training of their labors and I compared these different systems with the United States government. Whilst in U.S, the government finances training in the form of subsidies, which are financed by taxes themselves, the system in Europe often relies on a ‘tripartite agreement’ between the government, the employers’ organization and the trade unions for the employees. Depending on what the agreement is, each party may have to pay a certain percentage to the central fund. The French system is based mainly on a intricate mix of government regulations on a contractual and legal basis, whereby the firm may be punished for not providing the legal amount of training for their workers, whereas in the Danish model, training is part and parcel of their culture and is accepted by all the three parties. It has been anticipated that Europe will have a year of high drama this year, with much of the action coming in the European Union, with an anticipated increase in the number of members in the Union, up to 25 or more members. The inclusion of countries like Poland, Hungary, Slovenia, Slovakia, the Czech Republic, the three Baltic states, Cyprus and Malta will mean an increase of the EU’s population by a fifth but its GDP by only less than one-twentieth. This means an increase in the number of workers, particularly comparatively unskilled, that are eligible to work anywhere in the EU and hence, there will be increasing competition for jobs. This will place a
41

greater importance in government labor policies to deal with an expected influx of workers from the East to the Western European nations. Also, the current innovative HRM practices especially that of training, incentive pay systems may have to change in order to accommodate a lower-educated, lower-skilled and probably a lower-wage worker.
42
Bibliography Bassanini, A., S. Scarpetta and I. Visco, “Knowledge, Technology and Economic Growth: Recent Evidence from OECD Countries,” Working Papers-Research Series No. 6, National Bank of Belgium, May 2000 Casey Ichniowski and Kathyrn Shaw, “Beyond Incentive Pay: Insiders’ Estimates of the Value of Complementary Human Resource Management Practices”, 2002 Credit Suisse First Boston Securities, Economic Notes, 31 July 2000 Daveri, F, “Is Growth an Information Technology Story in Europe too,” mimeo, July 2000 D’Arcimoles Charles-Henri, Trebucq Stephane, “The Effects of ESOPs on Performance and Risk: Evidence from France”, July 2002 Eva Meyersson-Milgrom, Trond Petersen and Rita Asplund, “Pay, Risk, and Productivity: The Case of Finland, 1980-96”, 2002 Geoff Mason, Karin Wagner, David Finegold and Brent Keltner, “The IT Productivity Paradox revisited: International Comparisons of Information Technology, Work Organization and Productivity in Service Industries” Georg Licht and Dietmar Moch, “Innovation and Information Technology in Services”, May 1997 Gerard Ballot, Fathi Fakhfakh and Erol Taymaz, “Who benefits from training & R&D: The firm or the workers? A study on panels of French and Swedish firms”, Jun 2002 Hannu Piekkola, “Technological Change and Incentive Pay Schemes in Finland, New Challenges for the Labor Market Institutions and Income Distribution”, Sept 2002 International Labor Organization, ”High Performance Work Research Project – Case Studies” Jean-Pierre Ponssard, “Stock Options and Performance-Based Pay in France”, U.S-France Analysis, Mar 2001 John Heywood, Olaf Hubler and Uwe Jirjahn, “Use of Variable Payment Schemes: Evidence from Germany”, Dec 1997 Lorraine Dearden, Howard Reed and John Van Reenen, “Who gains when workers train? Training and corporate productivity in a panel of British Industries”, March 2000 Martina Ni Cheallaigh, “Promotion of Apprenticeship and other forms of work-related training in member states”, Oct 1999 Millward, N, “The New Industrail Relations?”, London PSI Nathalie Greenan and Jacques Mairesse, “Computers and Productivity in France: Some Evidence”, Nov 1996 Nathalie Greenan, Jacques Mairesse and Agnes Topiol-Bensaid, “Computerization and R&D: Links connecting skills, average salaries and productivity. A study on French Firm Level data”, May 1998 Nickell, S, “The Performance of Companies”
43

P. Dolton, J. Lanfranchi and A. Skalli, “Executive Pay in France: The Role of Compensating and Performance Elements”, 1999 Paul R. Sparrow and Jean-Marie Hiltrop, “Redefining the Field of European HRM: a Battle between National Mindsets and Forces of Business Transition?” Richard Blundell, Costa Meghir and Lorraine Dearden, “Work Related Training and Earnings”, Jun 1999 Simon Burgess and Paul Metcalfe, “Incentive Pay and Product Market Competition”, 2000 Simon Burgess and Paul Metcalfe, ”The Use of Incentive Schemes in Public & Private Sectors: Evidence from British Establishments”, Nov 1999 Stephen Wood, “What is a High Performance Work System?”, 2001 Sue Fernie and David Metcalf, “Participation, Contingent Pay, Representation and Workplace Performance: Evidence from Great Britain”, British Journal of Industrial Relations, pg 379-415, 1995 “The World in 2003”, The Economists Thomas Bauer, “Incidence and labor market effects of High-Performance Work Practices in Germany”, Oct 2002 Yoshihito Saito, “The Contribution of Information Technology to Productivity Growth”, International Department, Bank of Japan, March 2001
44


![NOTICE WARNING CONCERNING COPYRIGHT …shelf2.library.cmu.edu/Tech/37746914.pdfularly, insect societies [1], cellular communities [2], genetic algorithms [3], blackboards [4], simulated](https://img.pdfslide.us/doc/110x75/60b7ff3576a56877816feeff/notice-warning-concerning-copyright-ularly-insect-societies-1-cellular-communities.jpg)