Embed Size (px)
Citation preview

Journal of Education and Learning; Vol. 5, No. 1; 2016 ISSN 1927-5250 E-ISSN 1927-5269
Published by Canadian Center of Science and Education
154
Effects of Infographics on Students Achievement and Attitude towards Geography Lessons
Taner Çifçi1 1 Primary Education Program, Faculty of Education, Cumhuriyet University, Sivas, Turkey
Correspondence: Taner Çifçi, Primary Education Program, Faculty of Education, Cumhuriyet University, 58140, Sivas, Turkey. Tel: 90-346-219-1010. E-mail: [email protected]
Received: January 3, 2016 Accepted: January 17, 2016 Online Published: January 21, 2016
doi:10.5539/jel.v5n1p154 URL: http://dx.doi.org/10.5539/jel.v5n1p154
Abstract
Geography is a very comprehensive field of study with many subjects to study topics. Using a wide range of materials in the teaching of this course can this lesson be made effective and permanent because we do not have chances to observe natural phenomena. Therefore, in geography education materials natural environment is to be brought to class by using materials. One of these materials is infographics. Within the scope of this study, the effects of use of infographics on students’ achievement and attitude in geography course. The study is important as it can contribute to design of new instructional materials to be used in classes. The study was designed as quasi-experimental study, which is one of the quantitative study methods. In the study, “Solomon Four Group Design” has been used. As a result, it can be said that using infographics in geography lessons increase academic achievement and attitude levels of the students. It can also contribute to visual and verbal learning levels. Besides, these results can also provide guidance to teachers as they provide alternative and different instructional materials in geography lessons. Infographics can be effectively and widely used in geography lessons in different grade levels and learning areas when visual and information are to be given together. It is also suggested to use infographics in cases where achievement and attitudes of students in geography lesson is low.
Keywords: geography course, infographic, academic success, attitude level
1. Introduction
Geography is a branch of positive science nature which is human and nature centered, and thus explains the interaction between society and environment using the dynamics of science and explains these situations which include processes at local and global level with its unique principles and which bridges the gap between positive sciences and social sciences (Doğanay, 1994; Gaile & Willmott, 2003; Herbert & Matthews, 2001). Naturally, teaching in such a comprehensive field of study requires the use of a wide range of materials (Demiralp, 2005). In this context, a range of materials used in geography is more compared to many other fields of study (Üçışık, Ünlü, & Özey, 2002) because we do not have chances to observe geographic phenomena as they occur. Therefore, in teaching geography natural environment is to be brought to the class in various ways using materials (maps, photographs, collections, model spheres etc.) (Öztürk, 2002). This situation in geography education program is expressed as follows: teachers are to make photographs, maps, films, CD-ROMs and simulation programs, multimedia and hypermedia tools a part of geography lessons. Teachers can develop materials with students and this can lead to permanent learning (MEB, 2011). Thus, new learning potential is presented to the participants when using this materials (Ampa, 2015). However, materials to be used in instructional activities are not to be very detailed, they should be appropriate level of the students’ basic knowledge and skill level, simple and clear-cut and designed to give a certain message (Demirel, Seferoğlu, & Yağcı, 2002; Doornekamp, 2001).
In the modern world where technology is evolving rapidly, quick developments and innovations are experienced in very different fields (Dikmenli, 2015). These rapid innovations can be considered as a mainstream phenomenon that benefits the society (Kılcan & Akbaba, 2014). However, increasing intensity of information in the modern world and easy access to information lead to bombardment of people with information, which requires a careful selection of useful information (Güler, 2008). One of the effective materials that can be used to this end are infographics. Infographic production started as early as the period of early hunting people’s drawing of hunting figures on the walls of the caves. Although these drawings and designs are considered to be primitive,

www.ccsenet.org/jel Journal of Education and Learning Vol. 5, No. 1; 2016
155
they have been used for many purposes in the history. For example, the maps which tells Napoleon’s excursion to Moscow in 1812 and the number of soldiers lost during this excursion and the reasons why they were lost and the diagram and graphic Florence Nightingale draw to tell causes of death of English soldiers in the war in Crimea have importance place in the historical development of infographics (Lankow, Ritchie, & Crooks, 2012; Zedeli, 2014). Today infographics are effectively used in many fields like education, politics, economics, and medicine. How are infographics that are used widely in the modern world defined? İnfographic is the illustration of information fast and clear-cut using graphics like illustrations, charts, bars, maps or diagrams. Infographics are devices that transmit information through illustrations (Newsom & Haynes, 2004; Öztürk, 2012). By the same token, Smiciklas (2012) infographics is data visualization or information construction which aim to make understanding of complex information, data and ideas faster, easier and simpler. In this context, with the use of infographics in lessons for instructional purposes, different dimensions of knowledge can be transmitted by explaining the processes and events, establishing connections between concepts and concretizing abstract notions (Holsanova, Holmberg, & Holmqvist, 2009; Meeusah & Tangkijviwat, 2013). Geography is one of the subjects in whose teaching infographics can be effectively and widely employed. In geography, with the visualization of information, concrete visual presentations are prepared, spatial topics and problems are visualized, individuals’ powerful skills to process information can be revealed (MacEachren & Monmonier, 1992; Taş, 2006). Infographics can be prepared by students or teachers. Besides, animation, sound or video can be used in infographics. However, the following principles are to be considered when producing and designing infographics:
1) Its aim is to be set,
2) The topic is to determined,
3) It must be simple and understandable,
4) Visuals, videos, sounds, animations or information are to be attracting,
5) Its references are to be reliable,
6) It must be appropriate to the students’ level,
7) Its inscription, figure, graphic and illustrations are to be integrated.
As a result, infographics as student-centered instructional materials which synthesize information and visualization, and which encourage multi-dimensional and analytic thinking can be used in geography lessons.
Samples of infographics that can be used in geography lessons:
Figure 1. Wind energy

www.ccsenet.org/jel Journal of Education and Learning Vol. 5, No. 1; 2016
156
Figure 2. Haiti earthquake
This study was carried out to determine whether infographics used as instructional materials in geography lesson lead to significant difference in academic achievement and attitudes. The study is of great significance as it will make a new contribution to instructional materials that can be used in lessons. With regard to this topic, there are studies by İslamoğlu et al. (2015), Kibar and Akkoyunlu (2015), Yıldırım et al. (2014), Zedeli (2014) studies in Turkey and studies carried out abroad include studies by Dick (2014), Lankow et al. (2012), Matrix and Hodson (2014), Rajamanickam (2005), Smiciklas (2012), Weinschenk (2012) and Williams (2002). However, these studies are developed for educational purposes, communication and daily life. This study sets an example for use infographics especially for geography education. It is also considered that this study will contribute to the world of science as it will be point of reference for further studies.
1.1 Statement of the Problem
The problem statements of the study is determined as follows:
a. Are there significant differences at the level of significance (α ≤ 0.05) in student’s academic achievement due to the infographics way?
b. Are there significant differences at the level of significance (α ≤ 0.05) in student’s attitudes towards learning due to the infographics way?
2. Methodolgy
2.1 Study Design
The study was designed as a quasi-experimental study, which is one of the quantitative research designs, to reveal differentiation in students’ achievement and attitude. “Solomon Four Group Design”, which is the soundest experimental model and which provides inner and external validity at the same time (Karasar, 2008; Cook & Campbell, 1979). In this model, there are four groups formed via impartial assignment and two of these groups are the experimental group and two of them are the control group (Büyüköztürk et al., 2011). Although measurements are made in all of the groups after the experimental process, pre-experimental measurements are made only in two groups, one being the experimental group and the other being the control group. The research design used in the study can be symbolized as in the following table:
Table 1. Solomon four group design
Groups Impartiality Pre-test Experimental
Treatment Post-test
Group 1 R O1 X O2
Group 2 R O3 O4
Group 3 R X O5
Group 4 R O6

www.ccsenet.org/jel Journal of Education and Learning Vol. 5, No. 1; 2016
157
Group 1-3: the Experimental group I and the Experimental group II and Group 2-4 are the Control group I and Control group II. O1 and O3 are Pre-test administrations, and O2, O4, O5, and O6 are post-test administrations. X: indicates the experimental treatment, R: random assignment. (Fraenkel & Wallen, 2000; Helmstadter, 1970; Sawilowsky et al., 1994).
2.2 Study Group
The study group is composed of 113 10th grade students randomly assigned to the experimental and control group from four different sections in two private schools affiliated with the Ministry of Education in the central district of Sivas province in Turkey in the fall term of 2015-2016 academic year. The study group has been formed as follows:
Table 2. Study group
Schools Groups f
School 1 Group 1 (Experimental I)
Group 2 (Control I)
26
28
School 2 Group 3 (Experimental II)
Group 4 (Control II)
30
29
Total 113
2.3 The Use of Materials
The infographics have been developed using on-line info-graphic development tools and according to the achievements in the topics covered in 10th grade geography course: “water, soil and vegetation” (Figure 3). Before the study, necessary permissions were taken from the school administration and the teachers. The researcher first held a meeting with the teachers about the rationale and importance of study and how to use materials. Later on, the researcher and teachers gave information to the participant about the study and made a short presentation. The study lasted 6 weeks. At the beginning of the study, achievement and attitude test were administrated. While courses were taught with infographics in the experimental groups, in the control groups the usual materials and methods were used. At the end of 6 weeks, achievement test covering the topics studied and attitude scales were administrated to the experimental groups and the control groups. The results have been detailed in the findings section.
Figure 3. A sample of infographics used in the study

www.ccsenet.org/jel Journal of Education and Learning Vol. 5, No. 1; 2016
158
2.4 Data Collection Tools
In the study, “Academic Achievement Test” and “geography developed by the researcher to measure students knowledge and “Attitude Scale for Geography Lesson” developed by Özgen and Bindak (2009) were used data collection tools.
2.4.1 Achievement Test
For the validity and reliability of the 35-item achievement test developed by the researcher to cover the achievements related to “water, soil and vegetation” topics, the tests was administrated to 102 11th grade students who had already studied these topics. To achieve the validity and reliability of the test, assessment and measurement expert, geography education expert (who holds PhD in the field), experienced geography teacher and language experts were consulted. The data obtained in the pilot have been analyzed using ITEMAN3.0 (Item and Test Analysis) software. As a result of statistical analysis, item difficulty indexes, item discrimination indexes, test mean, standard deviation and reliability coefficient (KR-20) were calculated. The KR-20 coefficient was found to be .78. Besides, test and item analysis of the achievement test were made, the difficulty index of each item (Pj) and discriminative index (rjx) were analyzed separately. The items with difficulty index 0.30 and over and lower than 0.70 and the items with discrimination index 0.30 and over were included in the test. The other items were omitted from the test. As a result, 10 items were removed from the test and a 25 item achievement was obtained.
2.4.2 Attitude Scale
The attitude scale developed by Özgen and Bindak (2009) has reliability and validity. The Cronbach’s alpha reliability coefficient of the 20-item scale is 0.92, test-retest reliability coefficient was found to be 0.88. Higher scores on the 5 point Likert scale indicate positive attitude. However, as the items 1, 3, 4, 5, 8, 9, 11, 13, 15, 18 and 20 have negative expressions, the items were coded negatively.
Cronbach’s alpha values were calculated to determine the reliability of “Attitude Scale for Geography Lesson”. The Cronbach’s alpha value of the attitude was determined as .77. Büyüköztürk et al. (2011) states that reliability coefficient 0.70 and higher is sufficient to determine a test’s reliability. In this framework, it can be said that attitude test is reliable.
2.5 Data Analysis
For the analysis of the data obtained in the study, SPSS 18.0 (Statistical Package for the Social Sciences) and ITEMAN 3.0 (Item and Test Analysis) analysis software were used. After the pre-test and post-test scores of the experimental and the control groups, the mean scores of the groups and score distributions together with standard deviations have been calculated. Dependent samples t test, independent samples t test and one way variance analysis (ANOVA) and Tukey test were performed to determine whether there were statistically significant differences between the scores of the students in the experimental groups and the control groups. These analyses have been applied both to the achievement test and attitude scale. Significance level was determined as p < .05.
3. Results
3.1 Results Related to Pre-Test Scores of the Experimental Groups and Control Group
Table 3. Means and standard deviation of the pre-test scores of the students in the experimental and control group on the achievement test
Group N X Ss
Experimental Experimental I 26 42.9 11.28
Experimental II 30 - -
Control Control I 28 43.9 11.62
Control II 29 - -
Total 113 43.44 11.36

www.ccsenet.org/jel Journal of Education and Learning Vol. 5, No. 1; 2016
159
According to the results of the analyses shown in Table 3, it can be said that there is not a significant difference the arithmetic means of the pre-test achievement scores of the experimental group I ( X = 42.9) and the control group I ( X = 43.9).
3.2 Pre-Test Scores of the Experimental Group I and the Control Group I on the Achievement Test
To determine whether academic achievement scores of the experimental group I and the control group I, independent groups t test was performed and the results are given in Table 4.
Table 4. Independent samples t-test results with regard to pre-test scores of the students in the experimental I and in the control I on the achievement test
Group N X Ss sd t p
Experimental I 26 42.92 11.28 52 -.322 .749
Control I 28 43.92 11.62
(p < .05)
When Table 4 is examined, it is seen that there is not a significant difference between pre-test scores of the students on the achievement test [t(52) = -.322; p > .05]. According to this results, it can be said that before the treatment, the experimental group I ( X = 42.92) and the control group I ( X = 43.92) are close to each other in terms of academic achievement.
3.3 Results with Regard to the Post-Test Scores of Students in the Experimental and the Control Groups
In this section, the post-test scores of the students were analyzed in terms of their groups.
Table 5. Independent samples t-test results for the post-test scores of the experimental and the control groups on the achievement test
Group N X Ss sd t p
Experimental 56 71.57 11.88 111 4.019 .001
Control 57 62.31 12.57
(p < .05)
When Table 5 is examined, it is seen that while the mean of the post-test scores of the students in the experimental groups on the achievement test is X = 71.57, the mean of post-test scores of the students in the control groups on the achievement test is X = 62.31). In addition to the difference in post-test scores in favor of the experimental group (9.26). This difference is statistically significant [t(111) = 4.019; p < .05] in terms of the experimental group.
The use of infographics as an instructional material in geography lessons led to significant increase in the students’ achievement in the experimental group. On the other hand, after the treatment there was not a significant difference in geography achievement scores of the control groups where infographics were not used.
3.4 Results with Regard to Achievement Post-Test Scores of the Students in the Experimental and Control Groups

www.ccsenet.org/jel Journal of Education and Learning Vol. 5, No. 1; 2016
160
Table 6. Mean and standard deviations of the achievement post-test scores of the students in the experimental and the control group
Group N X Ss
Post test
Experimental Experimental I 26 71.84 10.76
Experimental II 30 71.33 12.95
Control Control I 28 63.14 13.74
Control II 29 61.51 11.53
Total 113 66.90 13.04
In Table 6, the difference between experimental group I, experimental group II, Control group I and Control group II groups has been revealed. According to the results of the analysis, it is seen that there is a difference between the arithmetic means of the post-test achievement scores of the experimental group I ( X = 71.84) and experimental group II ( X = 71.33) and the Control group I ( X = 63.14) and the Control group II ( X = 61.51) .
In this section, the post-test scores of the students who took part in the study have been analyzed on the achievement test in terms of their groups.
Table 7. Independent samples t-test results with regard to the post-test scores of the students in the experimental groups and the control groups on the achievement test
Group N X Ss sd t p
Experimental 56 71.57 11.88 111 4.019 .001
Control 57 62.31 12.57
(p < .05)
When Table 7 is examined, according to the post-test scores on the achievement test, the post-test mean of the students in the experimental group is X = 71.57, and the post-test mean scores of the students in the control groups is X = 62.31. Besides 9.26 score difference between the post-test mean scores on the achievement test in favor of the students in the experimental group (9.26), this difference is statistically significant [t(111) = 4.019; p < .05] in favor of the experimental group.
The use of infographics as instructional materials in geography lessons led to significant difference in favor of the students in the experimental group. There is not a significant difference in the students in the control group in terms of their achievement in geography lesson after the treatment.
Table 8. One Way Variance Analysis (ANOVA) results of the post-scores of the students in the experimental groups and the control groups on the achievement test
Source of Variance
Sum of Squares
Degree of Freedom
Mean of Squares
f p Sig.
Between Groups
2461.2 3 820.4
5.391 .002
a-d
c-d
Within Groups
16586.7 109 152.1
Total 19047.9 112
a: Experimental I, b: Control I, c: Experimental II, d: Control II
According to the analysis results given in Table 8, there is a statistically significant difference between the students in the experimental groups and control [F(3-109) = 5,391; p < .05]. According to Tukey test results carried

www.ccsenet.org/jel Journal of Education and Learning Vol. 5, No. 1; 2016
161
out to determine the groups which differed significantly, this difference is between the Experimental Group I and Experimental group II and the Control group II in favor of the Experimental Group I and Experimental II groups. This finding indicates that using infographics has a positive influence on the students’ scores on the achievement test.
3.5 Results with Regard to the Pre-Test and Post-Test Scores of the Students in the Experimental Group I and Control Group I
Table 9. Dependent sample t-test results with regard to the pre-test and post test scores of the students in the experimental group I
Group N X Ss sd t p
Experimental I Pre Test 26 42.9 11.2 25 -20.28 .001
Post- Test 26 71.8 10.7
p < .05
In Table 9, it is seen that there is a difference between the pre-test ( X = 42.9) and post-test ( X = 71.8) scores of the students in the experimental group on the achievement test. As a result of the t-test conducted to see whether the difference is statistically significant, the difference was found to be significant [t(25) = -20.28; p < .05].
Table 10. Dependent samples t-test results for the pre-test and post-test scores of the students in the control group I
Group N X Ss sd t p
Control I Pre Test 28 43.9 11.6
27 -20.28 .001 Post Test 28 63.1 13.7
p < .05
In Table 10, it is seen that there is a difference between the pre-test ( X = 43.9) and post-test ( X = 63.1) scores of the students in the control group I. As a result of t-test conducted to determine whether there was a statistical difference [t(27) = -20.28; p < .05], a significant difference was found.
As a result, it is seen that the pre-test scores of students in the experimental group I and the control group I are close to each other. However, as given Table 6, it can be argued that there is a difference between the mean post-test scores of the students in favor of those in the experimental group I.
In this part, the levels of the students on the ASGL (Attitude Scale for Geography Lesson) have been examined.
3.6 Results Related to Pre-Test Scores of the Students in the Experimental and Control Groups on the ASGL
Analyses of the results related to the pre-test scores of the students in the experimental and control groups on the ASGL are given below.
Table 11. Mean and standard deviation scores related to the pre-test scores of the students in the experimental group and the control group on the attitude scale
Group N X Ss
Experimental Experimental I 26 3.09 0.245
Experimental II 30
Control Control I 28 3.05 0.208
Control II 29
Total 113 3.07 0.225

www.ccsenet.org/jel Journal of Education and Learning Vol. 5, No. 1; 2016
162
According to the results of the analyses in Table 11, it seen that there is not a significant difference between the arithmetic means of the pre-test scores of the students in the experimental group I ( X = 3.09) and the control group I ( X = 3.05) on the attitude scale. The independent sample t-test results related to the pre-test scores of the experimental group I and the control group I are given in Table 11.
Table 12. The independent samples t-test analysis results related to pre-test scores of the experimental group I and the control group I on the attitude scale
Group N X Ss sd t p
Experimental I 26 3.09 .24 52 .689 .494
Control I 28 3.05 .20
(p < .05)
According to the results of the analysis given in Table 12, there is not a statistically significant difference between the pre-treatment attitude scores of the experimental group I and the control group I [t(52) = .689; p > .05]. According to this result, it can be argued that attitude levels of the groups before the treatment is the same.
3.7 Results with Regard to the Post-Treatment Scores of the Experimental and the Control Groups on the Attitude Scale
Table 13. T-test analysis results of the post-treatment attitude scores of the experimental and the control groups
Group N X Ss sd t p
Experimental 56 2.96 .41 111 8.202 0.001
Control 57 2.25 .50
(p < .05)
When the analysis results given in Table 13 are examined, it is seen that there is a statistically significant difference between the experimental and the control group [t(111) = 8.202; p < .05]. This difference is in favor of the experimental group. It can be said the use of infographics as instructional materials can be effective in improving students’ attitudes towards the subject of geography.
Table 14. One Way Variance Analysis (ANOVA) results with regard to the post-treatment scores of the experimental and the control group on ASGL
Source of Variance
Sum of Squares
Degree of Freedom
Sum of Squares
f p Sig.
Between Groups
14.2 1 14.2 67.27 .001 a-b
a-d
c-b
c-d
Within Groups
23.4 111 .212
Total 37.7 112
a: Experimental I, b: Control I, c: Experimental II, d: Control II
According to the data analysis seen in Table 14, there is a significant difference between the post-treatment attitude scores of the students in the experimental and the control groups [f(1-111) = 67,27; p < .05]. According to the Tukey test performed to determine the source of difference, this difference is between the experimental group I and the experimental group II and the control group I and the control group II and the difference is in favor of the experimental group I and the experimental group II.
www.ccsenet.org/jel Journal of Education and Learning Vol. 5, No. 1; 2016
163
According to the results of the Tukey test, it has been found out that there is a significant difference between the mean of the post-test scores of the students in the experimental group I and the experimental group II who were instructed using infographics and that of the students in the Control group I and the Control group II in favor of the experimental group I and the experimental group II. These findings are important in that they indicate that using infographics help developing positive attitudes towards the subject.
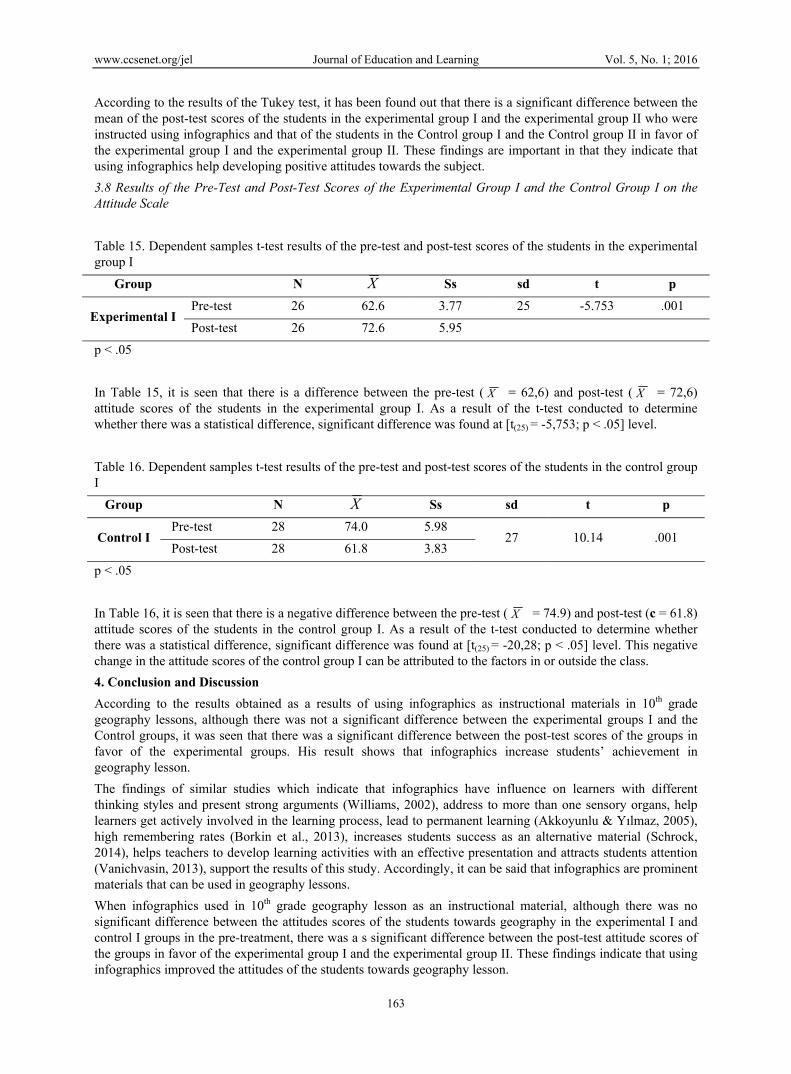
3.8 Results of the Pre-Test and Post-Test Scores of the Experimental Group I and the Control Group I on the Attitude Scale
Table 15. Dependent samples t-test results of the pre-test and post-test scores of the students in the experimental group I
Group N X Ss sd t p
Experimental I Pre-test 26 62.6 3.77 25 -5.753 .001
Post-test 26 72.6 5.95
p < .05
In Table 15, it is seen that there is a difference between the pre-test ( X = 62,6) and post-test ( X = 72,6) attitude scores of the students in the experimental group I. As a result of the t-test conducted to determine whether there was a statistical difference, significant difference was found at [t(25) = -5,753; p < .05] level.
Table 16. Dependent samples t-test results of the pre-test and post-test scores of the students in the control group I
Group N X Ss sd t p
Control I Pre-test 28 74.0 5.98
27 10.14 .001 Post-test 28 61.8 3.83
p < .05
In Table 16, it is seen that there is a negative difference between the pre-test ( X = 74.9) and post-test (c = 61.8) attitude scores of the students in the control group I. As a result of the t-test conducted to determine whether there was a statistical difference, significant difference was found at [t(25) = -20,28; p < .05] level. This negative change in the attitude scores of the control group I can be attributed to the factors in or outside the class.
4. Conclusion and Discussion
According to the results obtained as a results of using infographics as instructional materials in 10th grade geography lessons, although there was not a significant difference between the experimental groups I and the Control groups, it was seen that there was a significant difference between the post-test scores of the groups in favor of the experimental groups. His result shows that infographics increase students’ achievement in geography lesson.
The findings of similar studies which indicate that infographics have influence on learners with different thinking styles and present strong arguments (Williams, 2002), address to more than one sensory organs, help learners get actively involved in the learning process, lead to permanent learning (Akkoyunlu & Yılmaz, 2005), high remembering rates (Borkin et al., 2013), increases students success as an alternative material (Schrock, 2014), helps teachers to develop learning activities with an effective presentation and attracts students attention (Vanichvasin, 2013), support the results of this study. Accordingly, it can be said that infographics are prominent materials that can be used in geography lessons.
When infographics used in 10th grade geography lesson as an instructional material, although there was no significant difference between the attitudes scores of the students towards geography in the experimental I and control I groups in the pre-treatment, there was a s significant difference between the post-test attitude scores of the groups in favor of the experimental group I and the experimental group II. These findings indicate that using infographics improved the attitudes of the students towards geography lesson.

www.ccsenet.org/jel Journal of Education and Learning Vol. 5, No. 1; 2016
164
As infographics are highly liked by (Yıldırım et al., 2014), break monotonous atmosphere and attracts individuals attention (Smiciklas, 2012) and lead to faster and more effective communication (Matrix & Hodson, 2014), they are expected to increase attitudes towards the lesson. It can be said that infographic use can be regarded as potential area in social and ethical development of pupils. Infographics can be also used to help pupils internalize values in character education and provide them new opportunities by revealing pupils’ spiritual moods and attitudes (İslamoğlu et al., 2015).
As a result, it can be said that using infographics in geography lessons increase academic achievement and attitude levels of the students. It can also contribute to visual and verbal learning levels. Besides, these results can also provide guidance to teachers as they provide alternative and different instructional materials in geography lessons.
5. Suggestions
Infographics can be effectively and widely used in geography lessons in different grade levels and learning areas when visual and information are to be given together. It is also suggested to use infographics in cases where achievement and attitudes of students in geography lesson is low.
Further studies to increase the use of infographics as instructional materials in geography syllabuses and textbooks are to be carried out. Besides, nationwide studies with regard to the use of infographics in different branches should be carried out.
References
Akkoyunlu, B., & Yılmaz, M. (2005). Türetimci çoklu ortam öğrenme kuramı. Hacettepe Üniversitesi Eğitim Fakültesi Dergisi, 28, 9-18.
Ampa, A. T. (2015). The implementation of interactive multimedia learning materials in teaching listening skills. English Language Teaching, 8(12), 56-62. http://dx.doi.org/10.5539/elt.v8n12p56
Borkin, M. A., Vo, A. A., Bylinskii, Z., Isola, P., Sunkavalli, S., Oliva, A., & Pfister, H. (2013). What makes a visualization memorable? IEEE Transactions On Visualization And Computer Graphics, 12(19), 2306-2315. http://dx.doi.org/10.1109/TVCG.2013.234
Büyüköztürk, Ş., Çakmak, E., Kılıç, A., Özcan, E., Karadeniz, Ş., & Demirel, F. (2011). Bilimsel AraştırmaYöntemleri. Pegem Akademi Yayınları, Ankara.
Cook, T. D., & Campbell, D. T. (1979). Quasi-experimentation: Design & analysis ıssues for field settings. Boston: Houghton Mifflin Company.
Demiralp, N. (2005). Coğrafya eğitiminde materyaller & 2005 coğrafya dersi öğretim programı. Kastamonu Eğitim Dergisi, 15(1), 373-384.
Demirel, Ö., Seferoğlu, S. S., & Yağcı, E. (2002). Öğretim teknolojileri ve materyal geliştirme. Ankara: Pegema Yayıncılık.
Dick, M. (2014). Interactive infographics and news values. Digital Journalism, 2(4), 490-506. http://dx.doi.org/10.1080/21670811.2013.841368
Dikmenli, Y. (2015). Öğretmen adaylarının coğrafya okuryazarlığı algı düzeylerinin farklı değişkenlere göre incelenmesi. International Periodical For The Languages, Literature and History of Turkish or Turkic, 10(3), 353-368. http://dx.doi.org/10.7827/TurkishStudies.7155
Doğanay, H. (1994). Türkiye beşeri coğrafyası. Ankara: Gazi Büro Kitapevi.
Doornekamp, B. G. (2001). Designing teaching materials for learning problem solving in technology education. Research in Science & Technological Education, 19(1), 25-38. http://dx.doi.org/10.1080/02635140120046204
Fraenkel, J. R., & Wallen, N. E. (2000). How to Design and Evaluate Research in Education. New York, NY: Mc Grawhill Companies Inc.
Gaile, G. L., & Willmott, C. J. (Eds.). (2003). Geography in america at the dawn of the 21st century. New York: Oxford University Press.
Güler, T. (2008). Grafik tasarımda yeni bir alanı: Bilgilendirme tasarımı ve bir uygulama (Yayımlanmamış Doktora Tezi). Dokuz Eylül Üniversitesi, İzmir.

www.ccsenet.org/jel Journal of Education and Learning Vol. 5, No. 1; 2016
165
Helmstadter, G. C. (1970). Research concepts in human behavior: Education, psychology, sociology. New York: Appleton-Century-Crofts.
Herbert, D. T., & Matthews, J. A. (2001). Geography, in the encyclopaedic dictionary of environmental change. London: Arnold.
Holsanova, J., Holmberg, N., & Holmqvist, K. (2009). Reading information graphics: The role of spatial contiguity and dual attentional guidance. Applied Cognitive Psychology, 23(9), 1215-1226. http://dx.doi.org/10.1002/acp.1525
İslamoğlu, H., Ay, O., İliç, U., Mercimek, B., Dönmez, P., Kuzu, A., & Odabaşı, F. (2015). Infographics: A new competency area for teacher candidates. Cypriot Journal of Educational Sciences, 10(1), 32-39.
Karasar, N. (2008). Bilimsel Araştırma Yöntemi (17. Baskı). Ankara: Nobel Yayın Dağıtım.
Kılcan, B., & Akbaba, B. (2014). Examining students’ perceptions on esthetic value in social studies teaching program. Journal of Theory and Practice in Education, 10(4), 1047-1076.
Kibar, P., & Akkoyunlu, B. (2015). Eğitimde bilgi görselleştirme: Kavram haritalarından infografiklere. Ankara: TOJET.
Lankow, J., Ritchie, J., & Crooks, R. (2012). Infographics the power of visual storytelling. USA: John Wiley & Sons, Inc.
MacEachren, A. M., & Monmonier, M. (1992). What’s special about visualization? Cartography and Geographic Information Systems, 19(4), 197-200. http://dx.doi.org/10.1559/152304092783721303
Matthews, J. A. (Ed.). (2001). The encyclopaedic dictionary of environmental change. London: Arnold.
Matrix, S., & Hodson, J. (2014). Teaching with infographics: Practicing new digital competencies and visual literacies. Journal of Pedagogic Development, 4(2), 17-27.
MEB. (2011). Coğrafya Dersi Öğretim Programı. Ankara: Talim Terbiye Kurulu Başkanlığı.
Meeusah, N., & Tangkijviwat, U. (2013). Effect of data set and hue on a content understanding of infographic. ACA2013 Thanyaburi: Blooming Color for Life December, 11-14.
Newsom, D., & Haynes, J. (2004). Public relations writing: Form & style (7th ed.). Belmont, CA: Wadsworth Publishing.
Özgen, N., & Bindak, R. (2009). Lise öğrencilerinin coğrafya dersine yönelik tutumlarının çeşitli değişkenlere göre incelenmesi Siirt örneği. Gazi Eğitim Fakültesi Dergisi, 2, 421-440.
Öztürk, K. K. (2012). Ulusal basında bilginin sunumu: Infografik ve illüstrasyonlar (Yayımlanmamış Yüksek Lisans Tezi). Mustafa Kemal Üniversitesi, Sosyal Bilimler Enstitüsü, Hatay.
Öztürk, M. K. (2002). Liselerde coğrafya öğretiminde araç, gereç, materyal kullanımı ve önemi. Hacettepe Üniversitesi Eğitim Fakültesi Dergisi, 22, 126-129.
Rajamanickam, V. (2005). Infographics Seminar Handout. Retrieved from http://venkatra.files.wordpress.com/2012/08/infographic_handout.pdf
Sawilowsky, S., Kelley, D. L., Blair, R. C., & Markman, B. S. (1994). Meta-analysis and the solomon four group design. The Journal of Experimental Education, 62(4), 361-376. http://dx.doi.org/10.1080/00220973.1994.9944140
Schrock, K. (2014). Infographics as a creative assessment. Retrieved September 29, 2014, from http://www.schrockguide.net/infographics-as-an-assessment.html
Smiciklas, M. (2012). The power of infographics. Using pictures to communicate and connect with your audiences. USA: Pearson Education Inc.
Taş, H. İ. (2006). Coğrafya eğitiminde görselleştirmenin önemi: Mekansal algılamaya pedagojik bir bakış. Doğu Coğrafya Dergisi, 11(16), 211-238.
Üçışık, S., Ünlü, M., & Özey, R. (2002). Coğrafya eğitim ve öğretiminde fotoğrafların önemi. Marmara Coğrafya Dergisi, 5, 1-8.
Yıldırım, S., Yıldırım, G., Çelik, E., & Aydin, M. (2014). Bilgi grafiği (infografik) oluşturma sürecine yönelik öğrenci görüşleri. Journal of Research in Education and Teaching, 3(24), 247-255.

www.ccsenet.org/jel Journal of Education and Learning Vol. 5, No. 1; 2016
166
Vanichvasin, P. (2013). Enhancing the quality of learning through the use of infographics as visual communication tool and learning tool (pp. 135-142). In the Proceedings ICQA 2013: The International Conference on QA Culture: Cooperation or Competition. Bangkok: Offset Plus. Retrieved December, 13, 2014, from http://www.icqa2014.com/downloads/Proceeding_29.pdf
Weinschenk, M. (2012). The power of ınfographics. U.S.A: New Riders.
Williams, M. F. (2002). Diversity, thinking styles, and infographics (Paper presented at 12th International Conference of Women in Engineering, Science and Technology, Ottawa July 27-31 2002). Retrieved September 30, 2014, from http://www.mun.ca/cwse/icwes_infographics.pdf.
Zedeli, A. R. (2014). İnfografiklerin görsel ve içeriksel açıdan dergi tasarımındaki yeri (Yayımlanmamış Yüksek Lisans Tezi). Haliç Üniversitesi, Sosyal Bilimler Enstitüsü, İstanbul.
Copyrights
Copyright for this article is retained by the author(s), with first publication rights granted to the journal.
This is an open-access article distributed under the terms and conditions of the Creative Commons Attribution license (http://creativecommons.org/licenses/by/3.0/).