Embed Size (px)
Citation preview

Effects of Inclusion of Modified Mixing Devices on Effluent Quality in
Aerated Lagoons: Case Study at Wingate, IN WWTP
Ernest R. Blatchley III, Ph.D., P.E, BCEE
Professor, School of Civil Engineering and Division of Environmental & Ecological Engineering
Purdue University
West Lafayette, IN 47907
INTRODUCTION Lagoons are commonly used for treatment of municipal wastewater in small, rural
communities. The motivations for their use in these settings include low operation and
maintenance costs, as well as availability of inexpensive land. Aerated lagoons are used as an
alternative to other lagoon systems (e.g., facultative lagoons). Aerated lagoons typically include
mechanical devices to promote mixing and O2 transfer, thereby facilitating biochemical
oxidation of reduced substrates.
Aerated lagoons are relatively simple to operate and accomplish effective removal of
suspended solids (TSS) and carbonaceous biochemical oxygen demand (CBOD); however,
control of reduced nitrogen, including ammonia-N, can be problematic in lagoon systems,
especially during periods of prolonged cold weather. This is believed to be attributable to the
relatively slow growth rates that are typical of nitrifying bacteria, as well as their relative
intolerance of cold conditions.
On the other hand, some success in accomplishing nitrification in aerated lagoon systems
has been reported in cold regions among systems where attached growth is promoted. For
example, Richard and Hutchins (1995) reported results of a study in which a “ringlace” medium
was included in an aerated lagoon in Winter Park, CO, resulting in significant increases in
nitrification rate (as indicated by an increase in the concentration of nitrate-N in the effluent),
even under conditions where the water temperature was just above freezing. They attributed this
behavior to an increase in total system biomass, which was presumed to include the community
of nitrifying bacteria. Promotion of attached growth in their system also yielded reductions in
effluent TSS and BOD.
In an aerated lagoon system, several possible fates of substrates (including N) can be
identified, including:
1. Uptake by the microbial community for incorporation into new cells
2. Incorporation into settled solids
3. Liquid gas transfer
4. Biochemical oxidation (or reduction in the sludge bed)
5. Effluent discharge.
To varying degrees, all of these fates can be influenced through process design and
control. For example, consider the basic dynamics of liquid gas transfer, as described by the
“two-film” theory. Under this model, the rate of transport between the two phases is described
as follows:
( )
(1)
where:

F = net flux of compound between phases
= net mass transport rate of compound between phases, per unit interfacial area
Kl = overall mass transfer coefficient, based on liquid-phase concentration
Ceq = liquid-phase concentration that is in equilibrium with (bulk) gas phase
C = actual liquid-phase concentration.
When C = Ceq, the system is at equilibrium and no net transport will be observed. When C < Ceq,
net transport will be from gas liquid phase. When C > Ceq, the opposite will be true (i.e., net
transport will be from liquid gas phase). In general, the difference between the equilibrium
and actual conditions is used to represent the “driving force” for transport between the two
phases in contact.
Any change to the system that affects one or more terms in this equation can be expected
to also affect the net rate of transport between the gas and liquid phases. For example, the
inclusion of mechanical mixing (normally applied to the liquid phase) is known to decrease
resistance to transport on the liquid side of the gas:liquid interface. For volatile compounds, this
can lead to a substantial increase in the overall mass transfer coefficient. In addition, some
mixing devices can increase the gas:liquid interfacial area, thereby promoting mass transfer.
Independent of mechanical mixing, it is also possible to influence the rate of mass
transport by changing system chemistry, so as to alter the equilibrium condition. For example,
ammonia-N is known to participate in a simple acid-base reaction:
(2)
Like all acid-base reactions, equilibrium conditions for this reaction are established essentially
instantaneously, and are governed by pH. The equilibrium condition for this reaction determines
the fraction of ammonia-N that is present as NH3, as well as the fraction that is present as NH4+.
The equilibrium for this acid-base reaction is defined as follows:
[ ][
]
[ ]
(3)
At T = 20C, the acid-dissociation constant for this reaction has a value of 10-9.3
(Stumm and
Morgan, 1996). Therefore, because NH3 is volatile and NH4+ is not, knowledge of equilibrium
for this reaction provides information about the distribution of ammonia-N, defined as:
[ ] [ ]
(4)
that is present in the volatile form (NH3) and the non-volatile form (NH4+). Figure 1 illustrates
this equilibrium distribution. From this illustration, it is evident that as pH increases to approach
the pKa of equation (3), we should expect the efficiency of removal of ammonia-N from water to
increase, simply because a larger fraction of the ammonia-N will be present in the volatile form,
thereby increasing the “driving force” for liquidgas transfer.

pH
7 8 9 10 11 12
[i]/
CT
,N
0.0
0.2
0.4
0.6
0.8
1.0
[NH3]
[NH4
+]
Figure 1. Equilibrium distribution of ammonia-N (CT,N) as a function of pH at T = 20C. For
pH values below 9.3, the majority of ammonia-N will be present as NH4+.
Temperature can influence the rate of virtually any physico/chemical or biochemical
process. Specifically, the rate constants and equilibrium constants of reaction and transport
processes typically demonstrate temperature dependence. Therefore, seasonal changes in
temperature can be expected to influence many aspects of the behavior of wastewater treatment
systems, which typically depend on a combination of physico/chemical and biochemical
processes.
In a general sense, biochemical nitrification will proceed when conditions are favorable
for growth of nitrifying bacteria. Because these organisms are relatively slow-growing, they
typically require long (cell) detention times in the system (Metcalf and Eddy, 2003). In addition,
because nitrification can result in expression of substantial oxygen demand, it is necessary to
provide sufficient oxygen to support this process. This usually requires an increase in oxygen
transfer rate, relative to a system where biochemical nitrification does not take place.
WASTEWATER TREATMENT IN WINGATE, IN The town of Wingate, IN constructed their wastewater treatment system in 1984 using
funds from a construction grant. The facility, which is located roughly 1.2 miles northeast of the
town of Wingate, includes a three-cell aerated lagoon that discharges treated water to Charles

Ludlow Ditch. The facility receives septic effluent from residential and commercial activities in
Wingate. The Wingate wastewater treatment system was originally configured with two 5-HP
“arrow” mixers in the first lagoon, with one 3-HP mixer in each of the second and third lagoons
(16 HP total). In this configuration, the system accomplished acceptable treatment with respect
to BOD and TSS. However, the performance of the system has been inconsistent or poor with
respect to removal of ammonia-N, particularly during periods of extended cold weather.
Discharge limitations on ammonia-N were included in the Wingate NPDES permit beginning in
the winter of 2011. Therefore, modifications to the system and/or the method of operation will
be required to comply with these pending permit limits.
A conventional approach to this problem involves construction of a “mechanical”
wastewater treatment facility to replace the lagoons. Such a system can accomplish reliable
treatment, such that consistent permit compliance can be accomplished. However, these systems
are more complicated and expensive to operate than lagoons, and the capital costs of such a
system are likely to represent an unacceptable financial burden for the community.
Another option is to alter the lagoon system to improve its performance, particularly as
related to removal of ammonia-N. The specific alteration that is being examined at Wingate is
the inclusion of alternative mixing devices, and inclusion of media to allow for development of
an attached-growth community in the lagoons. This approach is conceptually similar to the
approach reported by Richard and Hutchins (1995). As described previously, such a system
should allow for a substantial increase in the total biomass within the system, possibly including
an increase in the population of nitrifiers. Relative to a conventional mechanical (or “package”)
system, this modification to the existing lagoon system has substantially lower capital costs. In
addition, the basic operation of the lagoon system remains largely unchanged.
To examine the effectiveness of this approach, a long-term experiment was initiated at
the Wingate WWTP as a collaborative effort involving the Town of Wingate; Bradley
Environmental (BE); Commonwealth Biolabs (CB); the Indiana Department of Environmental
Management (IDEM); and Purdue University (School of Civil Engineering). Participation on the
part of Purdue University originally involved Professor M.K. Banks. However, Professor Banks
has left Purdue University and is unable to continue her participation in this project.
PROJECT HISTORY The project was initiated in July 2010 with installation of a single BE 1-HP pump (see
Figure 2) in the third lagoon at the Wingate facility. Data collection was initiated in December
2010, with analyses being performed by CB. In February 2011, six additional BE 1-HP pumps
were installed in the first lagoon. Soon thereafter (February 2011), 1-HP enclosed biochemical
reactors (“BOBBER,” see Figure 3) were installed in each of lagoons 2 and 3 (one each). In
October 2011, the BOBBER in lagoon 3 was moved to lagoon 2, and four additional BOBBERs
were installed.
The 1-HP BE pumps draw water from the lagoon through an 8” port and is discharged
back into the lagoon through an array of radially-oriented PVC pipes (see Figure 2). In lagoon 1,
the six 1-HP BE pumps are distributed roughly uniformly across the surface of the lagoon.
Lagoon 2 is now configured with six BOBBERs, which are also distributed roughly uniformly
across the surface of the lagoon. For these systems, water is again drawn toward the device
through a series of radially-oriented PVC pipes. However, in the BOBBER system the water is
discharged into a 6’-diameter black plastic sphere that contains a medium with a high specific

surface area which provides extensive surface area for development of attached growth within
the system.
Figure 2. Schematic illustration of 1-HP BE mixing devices installed at Wingate WWTP (left);
digital image of 1-HP BE surface mixing device (images provided by Bradley Environmental).
Figure 3. Digital images of BE “BOBBER” devices (photos provided by Bradley
Environmental).
METHODS In addition to routine collection and analysis of samples for monthly reporting of system
operation and performance, sample collection was initiated in December 2010. Effluent samples
from all three lagoons were collected roughly every other week from the Wingate facility and
transported to the CB labs for analysis. Analyses conducted by CB labs included the following:
Ammonia-N: performed by basification of samples to pH > 11 (to convert all ammonia-N
to NH3), followed by analysis with an ammonia-selective electrode. The voltage signal
from analysis of a basified sample was compared with the voltage signals that were
developed from a series of standards to define the ammonia-N concentration in the
sample.
Nitrification rate: 100 mg (as N) NH4Cl was added to a 100 mL sample. The sample was
then aerated for 24 hours, after which the ammonia-N concentration was measured, as
described above.
Media nitrification rate: Twenty randomly-selected beads of media were transferred from
a BOBBER to a 100 mL solution of hard synthetic water. The assay described above was
then performed to determine the rate at which ammonia-N was removed.
Heterotrophic bacteria: These were quantified using a conventional plate method.
Algae: Algal cells were counted under a microscope using a Sedgewick-Rafter counting
cell.
NO2-: Nitrite was quantified through formation of an azo dye produced at low pH by
coupling diazotized sulfanilamide with N-(1-naphthyl)-ethylenediamine dihydrochloride
(NED dihydrochloride). The concentration of the azo dye was measured
spectrophotometrically by comparison with measurements from a set of standards.
NO3- + NO2
-: Nitrate in a sample was reduced to NO2
- using metallic cadmium, followed
by the complexation and colorimetric analysis described above. NO3- concentration was
then estimated by subtraction of the NO2- signal described above.
Other parameters (pH, T, BOD, TSS, DO) were measured using conventional methods.
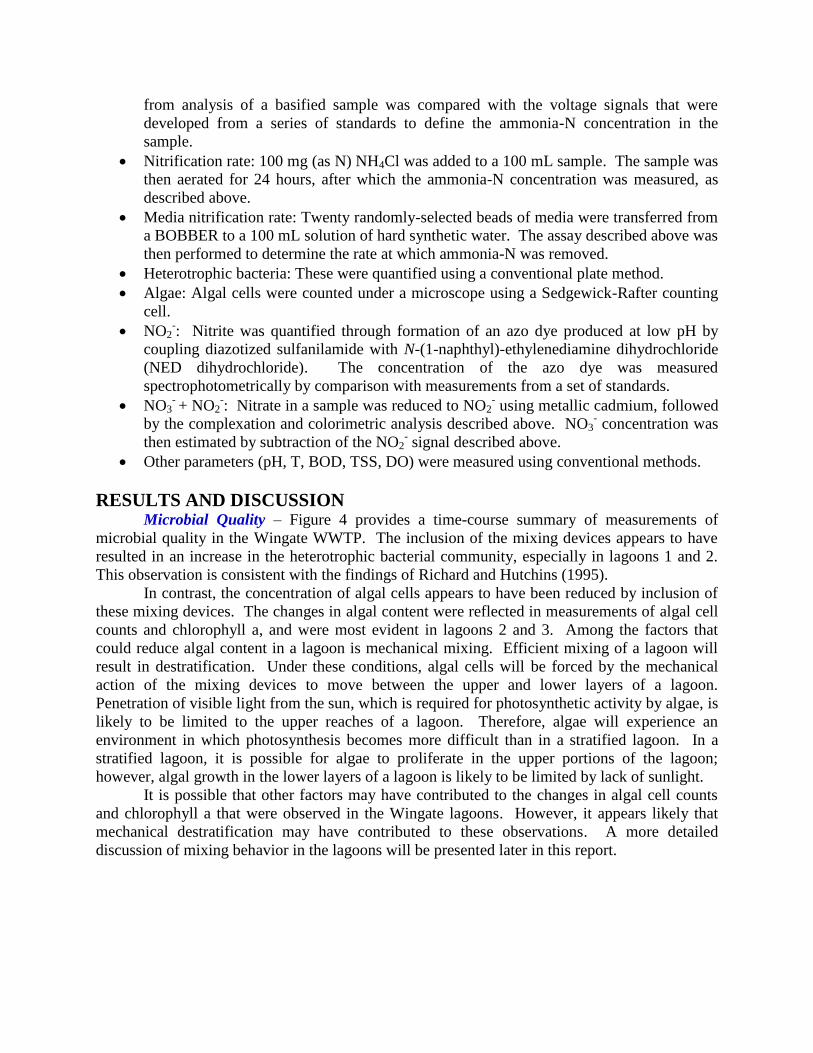
RESULTS AND DISCUSSION Microbial Quality – Figure 4 provides a time-course summary of measurements of
microbial quality in the Wingate WWTP. The inclusion of the mixing devices appears to have
resulted in an increase in the heterotrophic bacterial community, especially in lagoons 1 and 2.
This observation is consistent with the findings of Richard and Hutchins (1995).
In contrast, the concentration of algal cells appears to have been reduced by inclusion of
these mixing devices. The changes in algal content were reflected in measurements of algal cell
counts and chlorophyll a, and were most evident in lagoons 2 and 3. Among the factors that
could reduce algal content in a lagoon is mechanical mixing. Efficient mixing of a lagoon will
result in destratification. Under these conditions, algal cells will be forced by the mechanical
action of the mixing devices to move between the upper and lower layers of a lagoon.
Penetration of visible light from the sun, which is required for photosynthetic activity by algae, is
likely to be limited to the upper reaches of a lagoon. Therefore, algae will experience an
environment in which photosynthesis becomes more difficult than in a stratified lagoon. In a
stratified lagoon, it is possible for algae to proliferate in the upper portions of the lagoon;
however, algal growth in the lower layers of a lagoon is likely to be limited by lack of sunlight.
It is possible that other factors may have contributed to the changes in algal cell counts
and chlorophyll a that were observed in the Wingate lagoons. However, it appears likely that
mechanical destratification may have contributed to these observations. A more detailed
discussion of mixing behavior in the lagoons will be presented later in this report.

12/01/2010
03/01/2011
06/01/2011
09/01/2011
12/01/2011
03/01/2012
Hete
rotr
ophic
Bacte
ria (
cfu
/mL)
100
1000
10000
100000
Lagoon 1 Effluent
Lagoon 2 Effluent
Lagoon 3 Effluent
Process Changes
12/01/2010
03/01/2011
06/01/2011
09/01/2011
12/01/2011
03/01/2012
Alg
al C
ells
(cells
/mL)
10
100
1000
Date
12/01/2010
03/01/2011
06/01/2011
09/01/2011
12/01/2011
03/01/2012
Chlo
rophyll
a
0
1
2
3
4
5
Figure 4. Time-course measurements of microbial quality in effluent samples from the three
lagoons at the Wingate WWTP. For each panel, the vertical dashed lines indicate the last three
modifications to the system. Top panel represents measurements of heterotrophic bacteria;
center panel represents algal cell counts; bottom panel illustrates measurements of chlorophyll a.
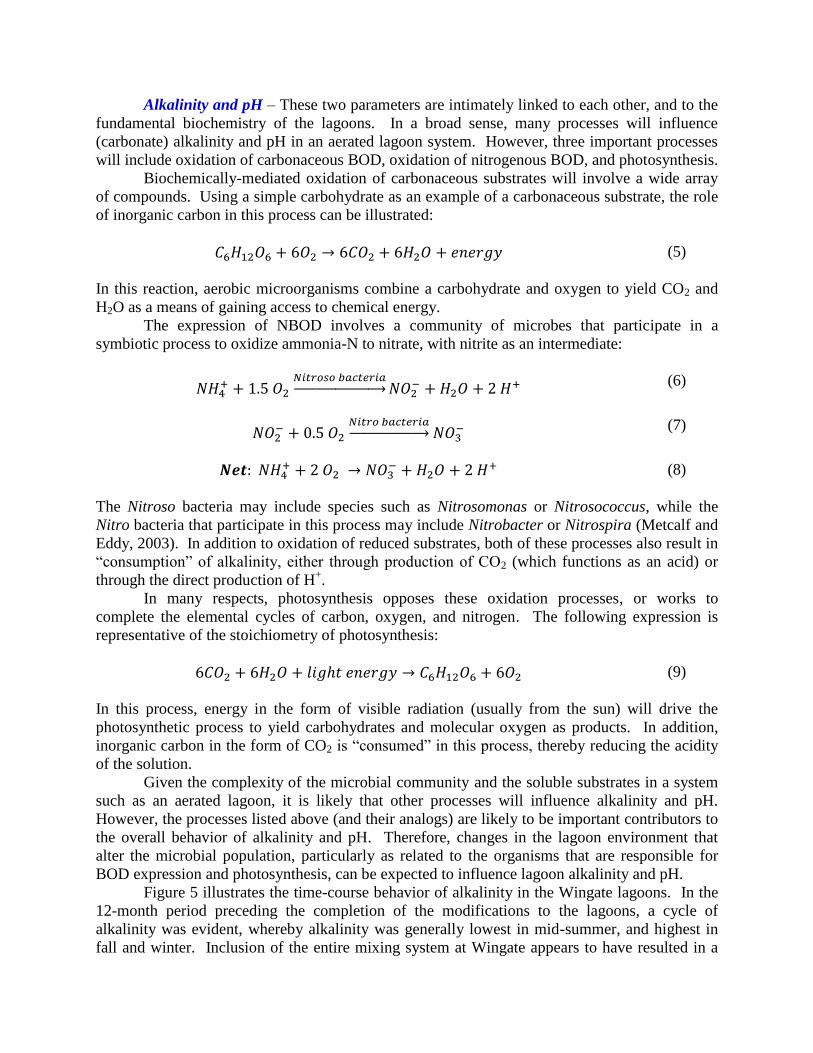
Alkalinity and pH – These two parameters are intimately linked to each other, and to the
fundamental biochemistry of the lagoons. In a broad sense, many processes will influence
(carbonate) alkalinity and pH in an aerated lagoon system. However, three important processes
will include oxidation of carbonaceous BOD, oxidation of nitrogenous BOD, and photosynthesis.
Biochemically-mediated oxidation of carbonaceous substrates will involve a wide array
of compounds. Using a simple carbohydrate as an example of a carbonaceous substrate, the role
of inorganic carbon in this process can be illustrated:
(5)
In this reaction, aerobic microorganisms combine a carbohydrate and oxygen to yield CO2 and
H2O as a means of gaining access to chemical energy.
The expression of NBOD involves a community of microbes that participate in a
symbiotic process to oxidize ammonia-N to nitrate, with nitrite as an intermediate:
→
(6)
→
(7)
(8)
The Nitroso bacteria may include species such as Nitrosomonas or Nitrosococcus, while the
Nitro bacteria that participate in this process may include Nitrobacter or Nitrospira (Metcalf and
Eddy, 2003). In addition to oxidation of reduced substrates, both of these processes also result in
“consumption” of alkalinity, either through production of CO2 (which functions as an acid) or
through the direct production of H+.
In many respects, photosynthesis opposes these oxidation processes, or works to
complete the elemental cycles of carbon, oxygen, and nitrogen. The following expression is
representative of the stoichiometry of photosynthesis:
(9)
In this process, energy in the form of visible radiation (usually from the sun) will drive the
photosynthetic process to yield carbohydrates and molecular oxygen as products. In addition,
inorganic carbon in the form of CO2 is “consumed” in this process, thereby reducing the acidity
of the solution.
Given the complexity of the microbial community and the soluble substrates in a system
such as an aerated lagoon, it is likely that other processes will influence alkalinity and pH.
However, the processes listed above (and their analogs) are likely to be important contributors to
the overall behavior of alkalinity and pH. Therefore, changes in the lagoon environment that
alter the microbial population, particularly as related to the organisms that are responsible for
BOD expression and photosynthesis, can be expected to influence lagoon alkalinity and pH.
Figure 5 illustrates the time-course behavior of alkalinity in the Wingate lagoons. In the
12-month period preceding the completion of the modifications to the lagoons, a cycle of
alkalinity was evident, whereby alkalinity was generally lowest in mid-summer, and highest in
fall and winter. Inclusion of the entire mixing system at Wingate appears to have resulted in a

decrease in the seasonal fluctuation of alkalinity across the lagoons, relative to the preceding
year.
Date
12/01/2010
03/01/2011
06/01/2011
09/01/2011
12/01/2011
03/01/2012
Alk
alin
ity (
mg/L
as C
aC
O3)
0
50
100
150
200
250
300
Lagoon 1 Effluent
Lagoon 2 Effluent
Lagoon 3 Effluent
Process Changes
Figure 5. Time-course measurements of alkalinity in effluent samples from the Wingate WWTP
lagoons.
Figure 6 provides an illustration of influent and effluent pH as a function of time (top
panel), as well as illustrations of the difference between influent and effluent pH (pH) across
the system. Effluent pH was higher than influent pH for the entire monitoring period. If this
interpreted in terms of the processes of biochemical oxidation and photosynthesis, these results
imply that photosynthetic activity has a greater effect on pH than expression of BOD. As
described above, the inclusion of the modified mixing systems has led to a reduction in the
concentration of algal cells, while the concentration of heterotrophic bacteria appears to have
increased. The increase in biomass also has been accompanied by a decrease in effluent BOD
and ammonia-N concentration (to be discussed later). These changes would be expected to yield
a decrease in CO2 uptake by photosynthesis, along with an increase in CO2 and H+ production
resulting from CBOD and NBOD expression. Collectively, these changes would be expected to
yield a decrease in effluent pH along with a smaller value of pH. Both of these changes are

evident in the pattern of data illustrated in Figure 4, particularly for the period since October
2011. However, it is important to recognize that the full configuration of the lagoons with all
mixers operating has only been in place for roughly 6 months, and as such it is not possible to
define the behavior of this system in terms of an annual cycle.
Date
1/1/2010
4/1/2010
7/1/2010
10/1/2010
1/1/2011
4/1/2011
7/1/2011
10/1/2011
1/1/2012
4/1/2012
pH
7.0
7.5
8.0
8.5
9.0
Influent
Effluent
Process Changes
Date
01/01/2010
04/01/2010
07/01/2010
10/01/2010
01/01/2011
04/01/2011
07/01/2011
10/01/2011
01/01/2012
04/01/2012
p
H
0.0
0.2
0.4
0.6
0.8
1.0
1.2
1.4
Figure 6. Time-course measurements of influent and effluent pH at the Wingate WWTP (top
panel). Bottom panel illustrates difference between influent and effluent pH (pH) as a function
of time.

The behavior of the bacteria that are responsible for nitrification is known to be related to
pH. Specifically, pH is known to influence nitrifier activity via changes in the form and
availability of inorganic carbon, activation or deactivation of nitrifying bacteria, and inhibition
by formation of NH3 or HNO2. Villaverde et al. (1997) examined nitrifier activity in an
attached-growth system and found that the optimum pH for ammonia-oxidizing bacteria was
near pH = 8.2 (see Figure 7, left). This observation was consistent with earlier findings of
Alleman (1984). Villaverde et al. (1997) also observed that free ammonia (NH3) inhibits the
activity of nitrite-oxidizing bacteria (see Figure 7, right).
Figure 7. Observations of the effect of pH on activity of nitrifying bacteria (from Villaverde et
al., 1997). Left panel illustrates activity of Nitrosomonas spp. as a function of pH. Right panel
illustrates accumulation of NH3-N as a function of pH (left vertical axis) as well as accumulation
of NO2--N as a function of pH (right vertical axis).
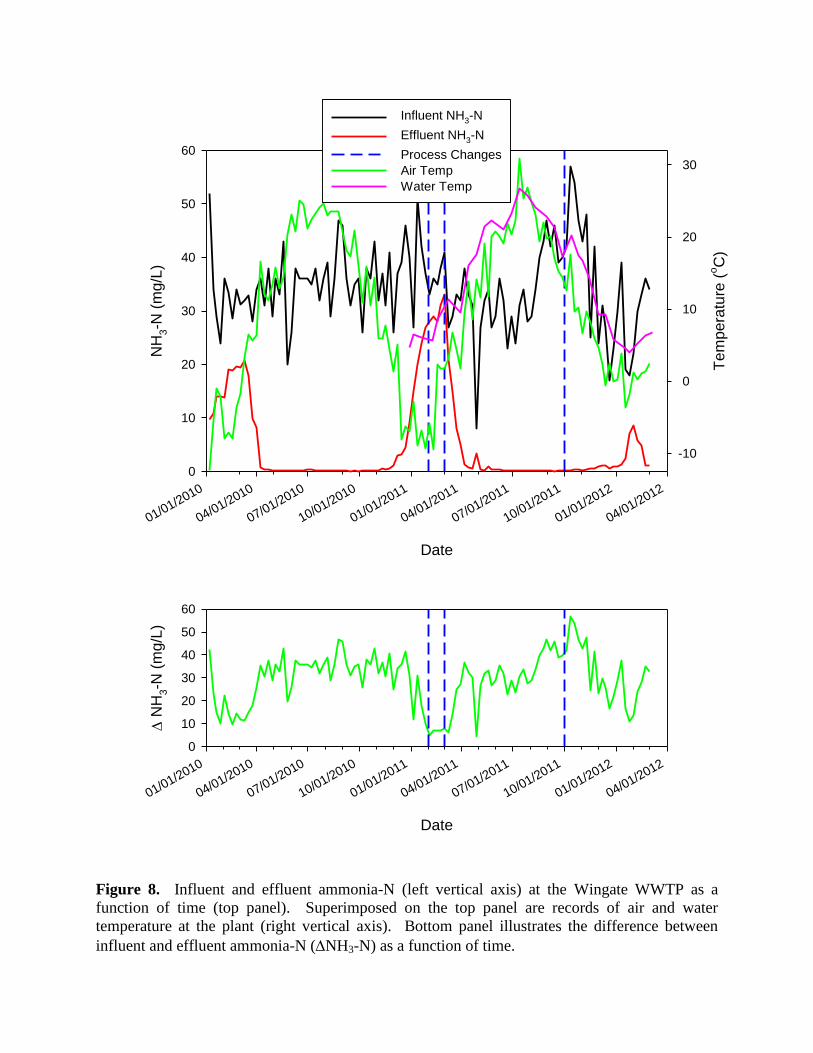
Nitrogen – A primary objective of this project was to examine the ability of the process
modifications to improve removal of ammonia-N. Figure 8 illustrates influent and effluent
ammonia-N as a function of time. The inclusion of the complete set of mixing devices, which
was completed in October of 2011, appears to have resulted in improved removal of ammonia-N
form the lagoons in winter.
Date
01/01/2010
04/01/2010
07/01/2010
10/01/2010
01/01/2011
04/01/2011
07/01/2011
10/01/2011
01/01/2012
04/01/2012
NH
3-N
(m
g/L
)
0
10
20
30
40
50
60
Tem
pera
ture
(oC
)
-10
0
10
20
30
Influent NH3-N
Effluent NH3-N
Process Changes
Air Temp
Water Temp
Date
01/01/2010
04/01/2010
07/01/2010
10/01/2010
01/01/2011
04/01/2011
07/01/2011
10/01/2011
01/01/2012
04/01/2012
N
H3-N
(m
g/L
)
0
10
20
30
40
50
60
Figure 8. Influent and effluent ammonia-N (left vertical axis) at the Wingate WWTP as a
function of time (top panel). Superimposed on the top panel are records of air and water
temperature at the plant (right vertical axis). Bottom panel illustrates the difference between
influent and effluent ammonia-N (NH3-N) as a function of time.

The results of these measurements are in qualitative agreement with the report of
Richards and Hutchins (1995), in that promotion of attached-growth and an overall increase in
biomass within the system appears to have yielded improvement in removal of ammonia-N from
the system.
Also included in Figure 8 (top panel) are measurements of air and water temperature at
the Wingate facility. These measurements are included in this graph because the behavior of
nitrifying bacteria is known to be adversely affected by cold temperature. The bottom panel of
Figure 8 illustrates the change in ammonia-N concentration (NH3-N) as a function of time.
There is considerable variability in this signal, but a clear seasonal pattern is evident, whereby
removal of ammonia-N diminished during the winter months. This pattern generally holds
across the entire data set, but the reduction in ammonia-N removal was less pronounced in winter
2011-2012 than in previous years.
It is important to recognize that the winter of 2011-2012 was unusually mild in central
Indiana, in terms of air temperature. On the other hand, water temperature at the Wingate
facility during the winter of 2011-2012 was similar to water temperature in the preceding winter
season, yet removal ammonia was improved in winter 2011-2012 relative to previous years.
One other issue to consider regarding the temperature signals is heat transfer. The
physics of heat transfer are similar to those of mass or momentum transfer. Systems that
increase mass transfer (e.g., by improved mixing) are likely to increase heat (and momentum)
transfer. In a general sense, the dynamics of heat transfer between air and (liquid) water can be
described mathematically by a relationship of the following form:
( )
(10)
where,
FH = flux of heat between air and water
= rate of heat transfer from air to water per unit air:water interfacial area
KH = overall heat transfer coefficient
Tair = air temperature
Twater = water temperature.
In general, the rate of heat transfer between phases will be determined by the product of
the interfacial contact area, the heat transfer coefficient, and the difference between air and water
temperatures. The mixing systems included at the Wingate facility almost certainly increased the
interfacial contact area between air and water, as well as the heat transfer coefficient (because of
improved mixing). Interestingly, water temperature during winter 2011-2012 was similar to the
water temperature during winter 2010-2011, despite the fact that air temperatures during winter
2010-2011 were substantially lower. In other words, the driving force for heat transfer (T) was
smaller in winter 2011-2012. This suggests that heat transfer was improved by the new mixing
devices. If this is true, then it is possible that water temperature could be substantially reduced
by the system during a period of prolonged cold weather, as is common in central Indiana
winters. It is not clear how this may affect performance of the system with respect to
nitrification (or other aspects of treatment), but this is an issue that should be monitored in the
future.
Figure 9 illustrates the time-course behavior of ammonia-N (top), nitrite (center), and
nitrate in effluent samples from the three lagoons at Wingate. Ammonia-N was removed in all
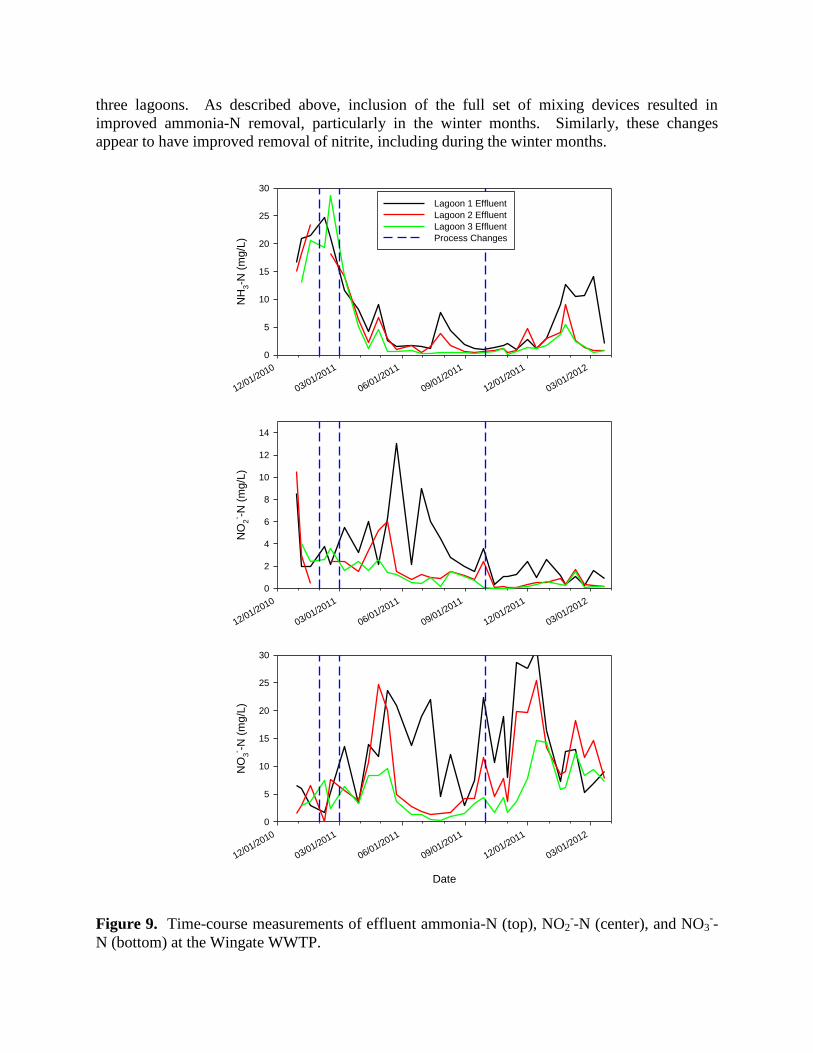
three lagoons. As described above, inclusion of the full set of mixing devices resulted in
improved ammonia-N removal, particularly in the winter months. Similarly, these changes
appear to have improved removal of nitrite, including during the winter months.
12/01/2010
03/01/2011
06/01/2011
09/01/2011
12/01/2011
03/01/2012
NH
3-N
(m
g/L
)
0
5
10
15
20
25
30
Lagoon 1 Effluent
Lagoon 2 Effluent
Lagoon 3 Effluent
Process Changes
12/01/2010
03/01/2011
06/01/2011
09/01/2011
12/01/2011
03/01/2012
NO
2
- -N (
mg/L
)
0
2
4
6
8
10
12
14
Date
12/01/2010
03/01/2011
06/01/2011
09/01/2011
12/01/2011
03/01/2012
NO
3
- -N (
mg/L
)
0
5
10
15
20
25
30
Figure 9. Time-course measurements of effluent ammonia-N (top), NO2--N (center), and NO3
--
N (bottom) at the Wingate WWTP.

The nitrate-N signal indicates that NO3- concentrations in all three lagoons are higher
than they were prior to introduction of the mixing devices. This is consistent with promotion of
biochemical nitrification within the lagoons. The pattern of the NO3- signal is such that the
concentration consistently decreases as water moves through the facility. This may be an
indication of denitrification activity within the lagoons. This pattern of behavior appears to be
somewhat more regular after October 2011 than before this date.
Date
01/01/2010
04/01/2010
07/01/2010
10/01/2010
01/01/2011
04/01/2011
07/01/2011
10/01/2011
01/01/2012
04/01/2012
CB
OD
(m
g/L
)
0
20
40
60
80
100
120
140
160
Influent
Effluent
Process Changes
Date
01/01/2010
04/01/2010
07/01/2010
10/01/2010
01/01/2011
04/01/2011
07/01/2011
10/01/2011
01/01/2012
04/01/2012
C
BO
D (
mg/L
)
0
20
40
60
80
100
120
140
160
Figure 10. Time-course record of influent and effluent CBOD (top) and change in CBOD
(CBOD, bottom) at the Wingate WWTP.
CBOD - Figure 10 illustrates the behavior of CBOD at the Wingate WWTP. In general,
effluent CBOD has consistently been below 20 mg/L, and the performance of the Wingate
facility with respect to CBOD removal or control was not substantially affected by inclusion of
the process modifications.
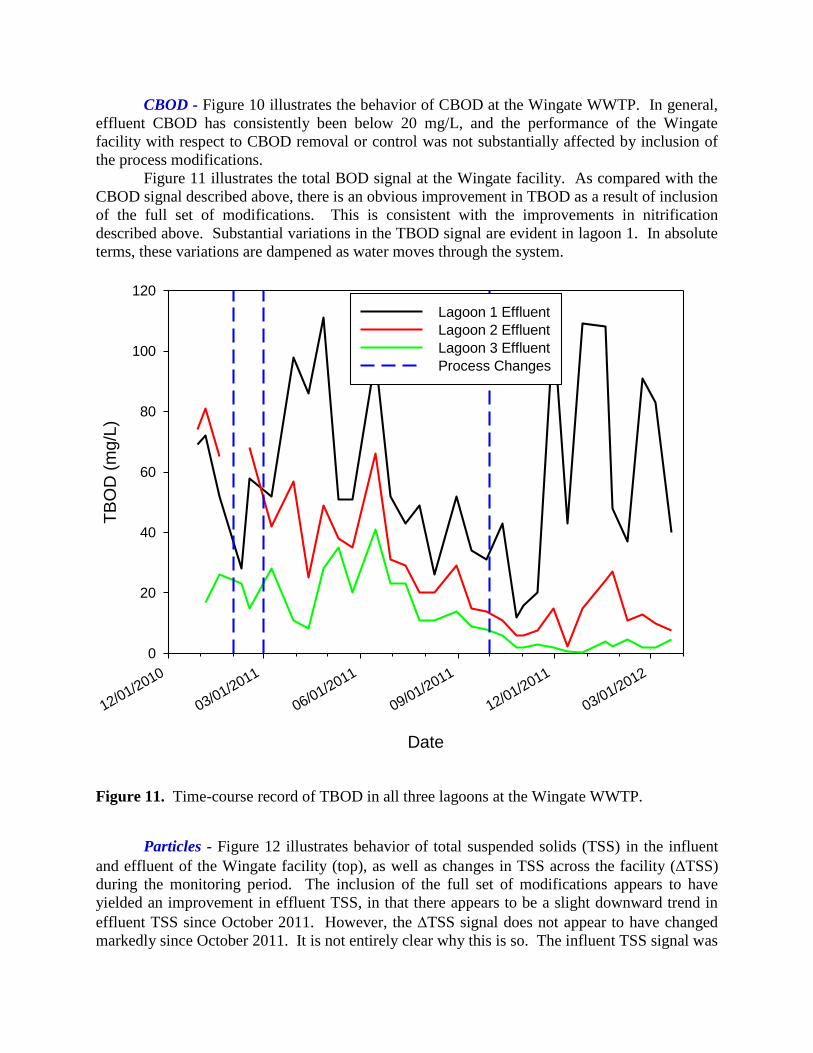
Figure 11 illustrates the total BOD signal at the Wingate facility. As compared with the
CBOD signal described above, there is an obvious improvement in TBOD as a result of inclusion
of the full set of modifications. This is consistent with the improvements in nitrification
described above. Substantial variations in the TBOD signal are evident in lagoon 1. In absolute
terms, these variations are dampened as water moves through the system.
Date
12/01/2010
03/01/2011
06/01/2011
09/01/2011
12/01/2011
03/01/2012
TB
OD
(m
g/L
)
0
20
40
60
80
100
120
Lagoon 1 Effluent
Lagoon 2 Effluent
Lagoon 3 Effluent
Process Changes
Figure 11. Time-course record of TBOD in all three lagoons at the Wingate WWTP.
Particles - Figure 12 illustrates behavior of total suspended solids (TSS) in the influent
and effluent of the Wingate facility (top), as well as changes in TSS across the facility (TSS)
during the monitoring period. The inclusion of the full set of modifications appears to have
yielded an improvement in effluent TSS, in that there appears to be a slight downward trend in
effluent TSS since October 2011. However, the TSS signal does not appear to have changed
markedly since October 2011. It is not entirely clear why this is so. The influent TSS signal was

quite variable in samples collected after October 2011, but within this variable signal there
appears to be a slight downward trend in influent TSS. With the relatively long residence time
that characterizes the Wingate lagoons, it is reasonable to expect some dampening of the TSS
signal by simple equalization. It is difficult to conclude from this data set that any significant
improvement in TSS removal can be ascribed to the process modifications.
Date
01/01/2010
04/01/2010
07/01/2010
10/01/2010
01/01/2011
04/01/2011
07/01/2011
10/01/2011
01/01/2012
04/01/2012
TS
S (
mg/L
)
0
20
40
60
80
100
Influent
Effluent
Process Changes
Date
01/01/2010
04/01/2010
07/01/2010
10/01/2010
01/01/2011
04/01/2011
07/01/2011
10/01/2011
01/01/2012
04/01/2012
T
SS
(m
g/L
)
0
20
40
60
80
100
Figure 12. Time-course record of influent and effluent TSS at the Wingate WWTP (top) and
changes in TSS (TSS) across the Wingate facility (bottom).
Figure 13 provides a more comprehensive summary of the behavior of suspended
particles at the Wingate facility. The data presented in Figure 13, in which suspended particles
are characterized by measures of TSS (top panel), settleable solids (center panel), and turbidity
(bottom panel), indicate improved particle removal as a result of inclusion of the process
modifications. These observations are consistent with those reported by Richard and Hutchins
(1995).

12/01/2010
03/01/2011
06/01/2011
09/01/2011
12/01/2011
03/01/2012
TS
S (
mg/L
)
0
100
200
300
400
500
600
Lagoon 1 Effluent
Lagoon 2 Effluent
Lagoon 3 Effluent
Process Changes
12/01/2010
03/01/2011
06/01/2011
09/01/2011
12/01/2011
03/01/2012
Se
ttle
ab
le S
olid
s (
mg/L
)
0
100
200
300
400
500
600
Date
12/01/2010
03/01/2011
06/01/2011
09/01/2011
12/01/2011
03/01/2012
Tu
rbid
ity (
NT
U)
0
100
200
300
400
500
600
Figure 13. Time-course record of effluent particle concentrations from the three lagoons at the
Wingate WWTP, as indicated by TSS (top panel), settleable solids (center), and turbidity
(bottom).

Sludge Blanket Depth - Collectively, the improvements in NBOD removal and
suspended solids removal imply that sludge production within the Wingate facility should
increase as a result of inclusion of the process modifications. Figure 14 provides a summary of
sludge depth measurements that have been performed periodically at the Wingate WWTP
roughly once per month, beginning in May 2011. No obvious trend of increasing sludge depth is
evident from these measurements. Therefore, if changes in sludge accumulation in the Wingate
facility do result from the process changes, it appears that these will be evident on a longer time-
scale than is illustrated in Figure 14.

Lagoon 1
Date
5/1/2011 7/1/2011 9/1/2011 11/1/2011 1/1/2012 3/1/2012
Slu
dge D
epth
(in
ches)
0
10
20
30
40
50
60
Location A
Location B
Location C
Process Changes
Lagoon 2
Date
5/1/2011 7/1/2011 9/1/2011 11/1/2011 1/1/2012 3/1/2012
Slu
dge D
epth
(in
ches)
0
10
20
30
40
50
60
Location A
Location B
Location C
Process Changes
Lagoon 3
Date
5/1/2011 7/1/2011 9/1/2011 11/1/2011 1/1/2012 3/1/2012
Slu
dge D
epth
(in
ches)
0
10
20
30
40
50
60
Location A
Location B
Location C
Process Changes
Figure 14. Time-course measurements of sludge depth in the lagoons at the Wingate WWTP:
lagoon 1 (top), lagoon 2 (center), lagoon 3 (bottom).
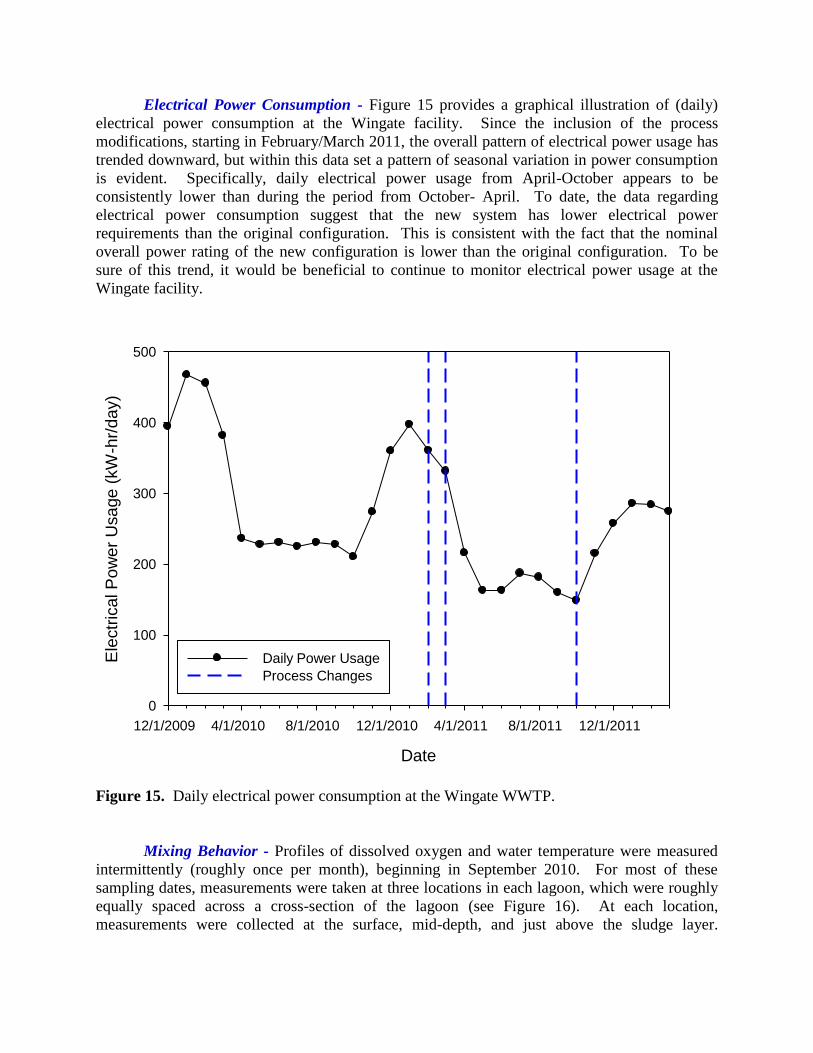
Electrical Power Consumption - Figure 15 provides a graphical illustration of (daily)
electrical power consumption at the Wingate facility. Since the inclusion of the process
modifications, starting in February/March 2011, the overall pattern of electrical power usage has
trended downward, but within this data set a pattern of seasonal variation in power consumption
is evident. Specifically, daily electrical power usage from April-October appears to be
consistently lower than during the period from October- April. To date, the data regarding
electrical power consumption suggest that the new system has lower electrical power
requirements than the original configuration. This is consistent with the fact that the nominal
overall power rating of the new configuration is lower than the original configuration. To be
sure of this trend, it would be beneficial to continue to monitor electrical power usage at the
Wingate facility.
Date
12/1/2009 4/1/2010 8/1/2010 12/1/2010 4/1/2011 8/1/2011 12/1/2011
Ele
ctr
ica
l P
ow
er
Usa
ge
(kW
-hr/
da
y)
0
100
200
300
400
500
Daily Power Usage
Process Changes
Figure 15. Daily electrical power consumption at the Wingate WWTP.
Mixing Behavior - Profiles of dissolved oxygen and water temperature were measured
intermittently (roughly once per month), beginning in September 2010. For most of these
sampling dates, measurements were taken at three locations in each lagoon, which were roughly
equally spaced across a cross-section of the lagoon (see Figure 16). At each location,
measurements were collected at the surface, mid-depth, and just above the sludge layer.

Therefore, on most sampling dates, nine measurements of DO and temperature were collected in
each lagoon.
A
B
C
Lagoon#1
Lagoon # 2 Lagoon # 3
A B C A B C
NORTH
Figure 16. Schematic illustration of sampling locations for lagoon profiling measurements. At
each location, samples were collected from the surface, roughly 5 feet below the surface, and at the
top of the sludge layer.

Date
9/1/2010 12/1/2010 3/1/2011 6/1/2011 9/1/2011 12/1/2011 3/1/2012
Dis
so
lve
d O
xyge
n C
on
ce
ntr
atio
n (
mg/L
)
0
2
4
6
8
10
12
14
16
Lagoon 1
Lagoon 2
Lagoon 3
Process Changes
Date
9/1/2010 12/1/2010 3/1/2011 6/1/2011 9/1/2011 12/1/2011 3/1/2012
Wa
ter
Te
mp
era
ture
(oC
)
0
5
10
15
20
25
30 Lagoon 1
Lagoon 2
Lagoon 3
Process Changes
Figure 17. Results from lagoon profiling measurements. Top panel illustrates dissolved
oxygen concentration measurements, while bottom panel illustrates water temperature
measurements. Symbols represent the mean of all measurements (n=9 for most dates), while
error bars represent one standard deviation for this same set of measurements.
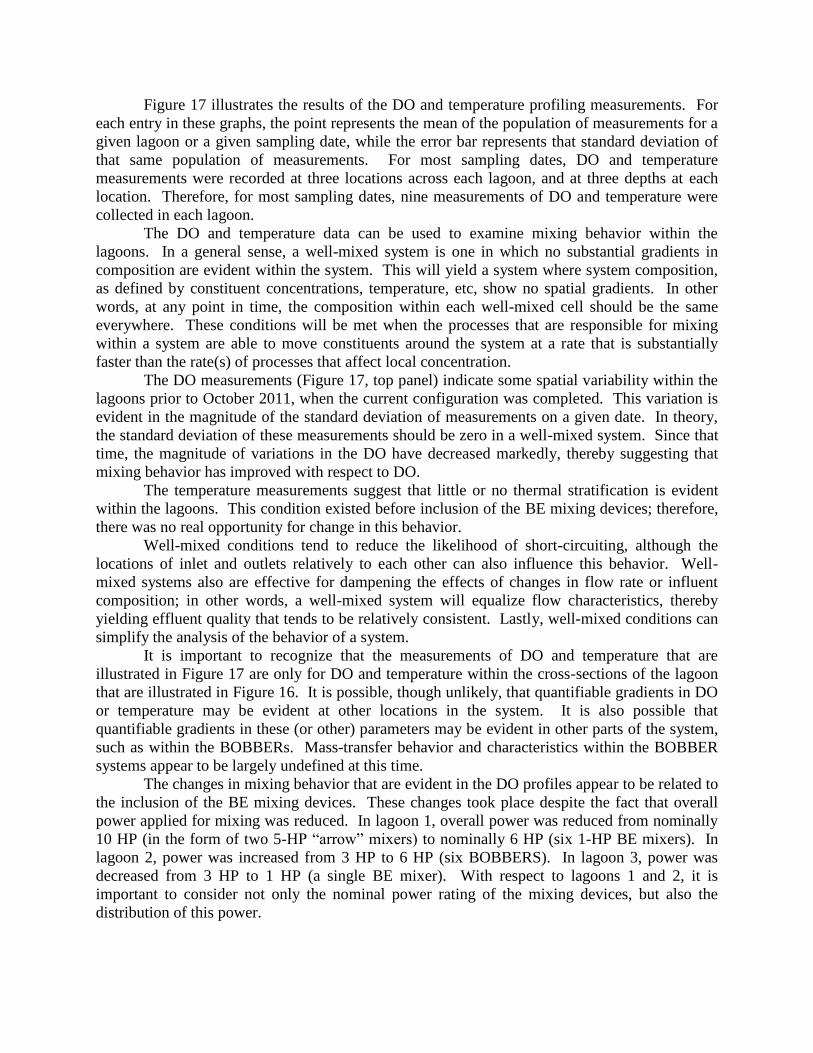
Figure 17 illustrates the results of the DO and temperature profiling measurements. For
each entry in these graphs, the point represents the mean of the population of measurements for a
given lagoon or a given sampling date, while the error bar represents that standard deviation of
that same population of measurements. For most sampling dates, DO and temperature
measurements were recorded at three locations across each lagoon, and at three depths at each
location. Therefore, for most sampling dates, nine measurements of DO and temperature were
collected in each lagoon.
The DO and temperature data can be used to examine mixing behavior within the
lagoons. In a general sense, a well-mixed system is one in which no substantial gradients in
composition are evident within the system. This will yield a system where system composition,
as defined by constituent concentrations, temperature, etc, show no spatial gradients. In other
words, at any point in time, the composition within each well-mixed cell should be the same
everywhere. These conditions will be met when the processes that are responsible for mixing
within a system are able to move constituents around the system at a rate that is substantially
faster than the rate(s) of processes that affect local concentration.
The DO measurements (Figure 17, top panel) indicate some spatial variability within the
lagoons prior to October 2011, when the current configuration was completed. This variation is
evident in the magnitude of the standard deviation of measurements on a given date. In theory,
the standard deviation of these measurements should be zero in a well-mixed system. Since that
time, the magnitude of variations in the DO have decreased markedly, thereby suggesting that
mixing behavior has improved with respect to DO.
The temperature measurements suggest that little or no thermal stratification is evident
within the lagoons. This condition existed before inclusion of the BE mixing devices; therefore,
there was no real opportunity for change in this behavior.
Well-mixed conditions tend to reduce the likelihood of short-circuiting, although the
locations of inlet and outlets relatively to each other can also influence this behavior. Well-
mixed systems also are effective for dampening the effects of changes in flow rate or influent
composition; in other words, a well-mixed system will equalize flow characteristics, thereby
yielding effluent quality that tends to be relatively consistent. Lastly, well-mixed conditions can
simplify the analysis of the behavior of a system.
It is important to recognize that the measurements of DO and temperature that are
illustrated in Figure 17 are only for DO and temperature within the cross-sections of the lagoon
that are illustrated in Figure 16. It is possible, though unlikely, that quantifiable gradients in DO
or temperature may be evident at other locations in the system. It is also possible that
quantifiable gradients in these (or other) parameters may be evident in other parts of the system,
such as within the BOBBERs. Mass-transfer behavior and characteristics within the BOBBER
systems appear to be largely undefined at this time.
The changes in mixing behavior that are evident in the DO profiles appear to be related to
the inclusion of the BE mixing devices. These changes took place despite the fact that overall
power applied for mixing was reduced. In lagoon 1, overall power was reduced from nominally
10 HP (in the form of two 5-HP “arrow” mixers) to nominally 6 HP (six 1-HP BE mixers). In
lagoon 2, power was increased from 3 HP to 6 HP (six BOBBERS). In lagoon 3, power was
decreased from 3 HP to 1 HP (a single BE mixer). With respect to lagoons 1 and 2, it is
important to consider not only the nominal power rating of the mixing devices, but also the
distribution of this power.

In lagoon 1, the original configuration involved two arrow mixers, both located near the
center of the lagoon, pointing in opposing directions. The new configuration involves six surface
aerators, which are distributed roughly uniformly across the lagoon (see Figure 18, left).
Similarly, the six BOBBERs in lagoon 2 are roughly uniformly distributed (see Figure 18, right).
This more uniform distribution of mixing energy, as opposed to the original configuration,
probably results in improved mixing in the lagoons.
Figure 18. Digital images of BE mixing devices in Lagoon 1 (left) and Lagoon 2 (right) at the
Wingate WWTP.
SUMMARY AND CONCLUSIONS The results of sampling and analysis at the Wingate WWTP to date indicate that the
inclusion of the BE mixing devices has yielded improvements in effluent quality with respect to
suspended particles and ammonia-N. These improvements appear to have resulted from the
inclusion of an alternative mixing regime within the system, as well as the inclusion of the
BOBBER systems, which promote attached growth. Overall, these systems appear to be using
less electrical power than the previous system.
The new configuration appears to provide for more efficient and more complete mixing
than was accomplished with the previous configuration. This should promote oxygen transfer,
and may also lead to improved stripping of volatile gases, such as NH3. On the other hand,
conditions that lead to efficient mass transfer also tend to promote efficient transfer of heat. The
data from the winter of 2011-2012 indicate the heat transfer from air to water may have been
improved by the new mixing devices. It is possible that this could lead to substantial reductions
in water temperatures during periods of extended cold weather. The winter of 2011-2012 was
the warmest on record in west-central Indiana. It is not clear how these systems will perform
during a “normal” or “cold” winter season, given this apparent improvement in heat transfer.
RECOMMENDATIONS The inclusion of the BE mixing devices appears to have yielded improvements in overall
process performance, both in terms of effluent quality and electrical power usage. These
improvements indicate the potential for these systems to be used in other, similar applications.

And given the number of lagoon-based systems that are in use in the U.S. and elsewhere, there
certainly appears to be a market for this type of system.
At present, there is no well-defined approach to be used in the design of systems based on
this technology. On the other hand, design approaches for other, related systems are in place.
Therefore, it is likely that the principles of design that have been applied in these related systems
could be adapted to the BE mixers. Moreover, the extension of this technology to other
facilities, and possibly other settings, represents a logical opportunity for continued collaboration
among the participants in this project.
In terms of applied research, several specific topics appear to merit attention. These
include:
Quantification of NH3 and CBOD uptake rates by the attached-growth community in the
BOBBER systems – this behavior of the system is likely to be influenced by mass-
transfer behavior and the composition of the microbial community within the BOBBERs.
By defining this behavior and the process parameters that influence this behavior, it may
be possible to develop a design procedure for the BOBBER system that can be verified
against field measurements.
Fluid mechanics in aerated lagoons – the BOBBERs and the BE mixers appear to have
resulted in improved mixing behavior in the lagoons at Wingate. However, the evidence
to define this behavior is incomplete. Numerical simulations (perhaps involving
computational fluid dynamics) and physical tests (e.g., “tracer” tests to allow
measurement of the residence time distribution of lagoon cells) may be beneficial as
methods of validating the effects of the mixing devices. In addition, these tests may
indicate opportunities for improvement of mixing behavior in lagoons.
Mass and heat transfer – the improved mixing in the Wingate lagoons should yield
increased mass and heat transfer. With respect to mass transfer, one area of particular
relevance is the ability of these systems to transfer oxygen. However, a closely-related
issue is the potential to strip volatile gases, such as NH3. Heat transfer is likely to be
most important in the winter months. Detailed information about heat transfer
characteristics of these systems may provide insights into the behavior of these systems
in cold-weather months, as well as opportunities to improve this behavior.
REFERENCES Alleman, J.E. (1984) “Elevated Nitrite Occurrence in Biological Wastewater Treatment
Systems,” Water Science & Technology, 17, 409-419.
Metcalf & Eddy (2003) Wastewater Engineering: Treatment and Reuse, Fourth Edition
(G.T. Tchobanoglous, F.L. Burton, and H.D. Stensel), McGraw-Hill, New York.
Richard, M. and Hutchins, B. (1995) “Enhanced Cold Temperature Nitrification in a
Municipal Aerated Lagoon Using Ringlace Fixed Film Media,” Presented at the Rocky
Mountain American Waterworks Association / Water Environment Association Annual
Conference, Sheridan Wyoming September 11th, 1995.
Stumm, W. and Morgan, J.J. (1996) Aquatic Chemistry: Chemical Equilibria and Rates
in Natural Waters, Third Edition, John Wiley & Sons, New York.
Villaverde, S.; Garcia-Encina, P.A., Fdz-Polanco, F. (1997) “Influence of pH Over
Nitrifying Biofilm Activity in Submerged Biofilters,” Water Research, 31, 1180-1186.