Embed Size (px)
Citation preview
Effects of Including Hysteresis when Simulating Infiltration
Swen Magnuson
AgE 558
April 13, 2001

Overview
• Background
• Purpose
• Approach
• Results
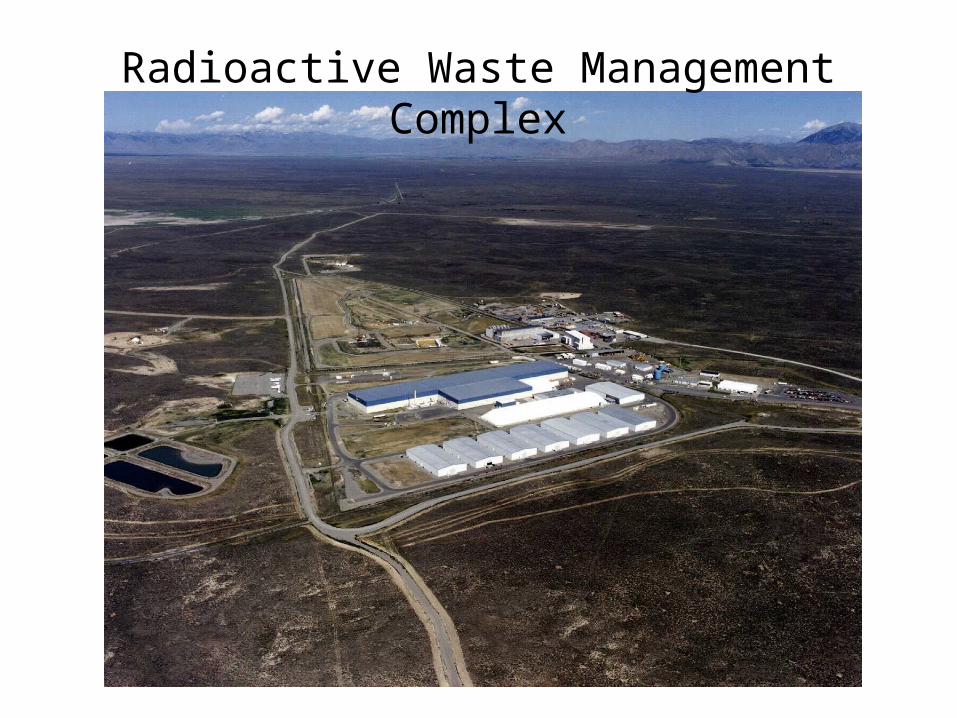
Radioactive Waste Management Complex
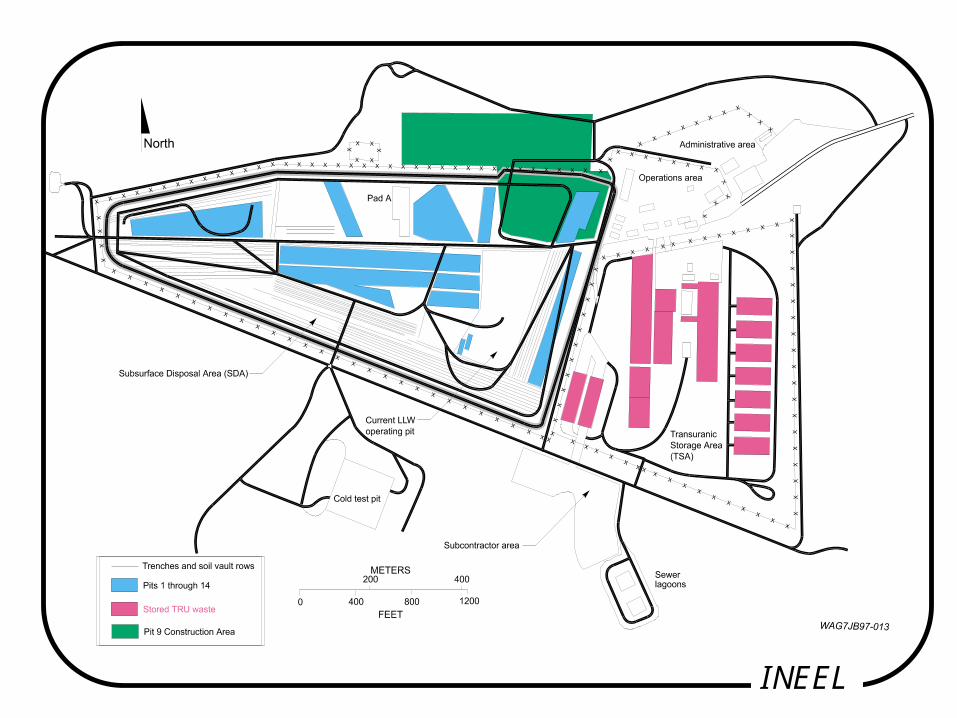
INEEL
LO W M EDIUM HIG H
WAG 7J B97-026
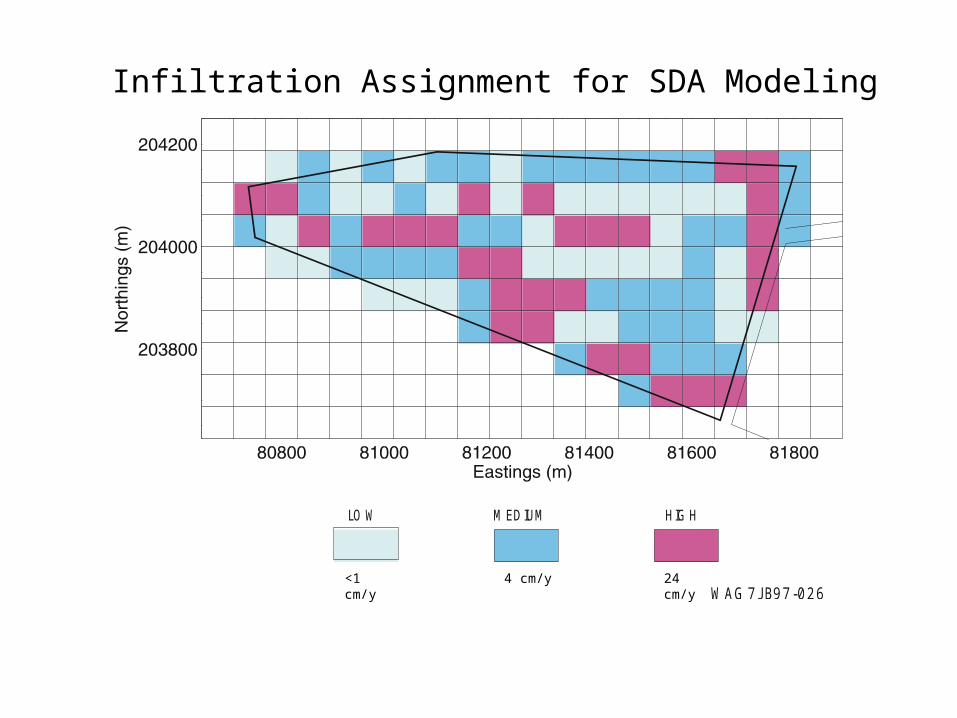
Infiltration Assignment for SDA Modeling
<1 cm/y 4 cm/y 24 cm/y
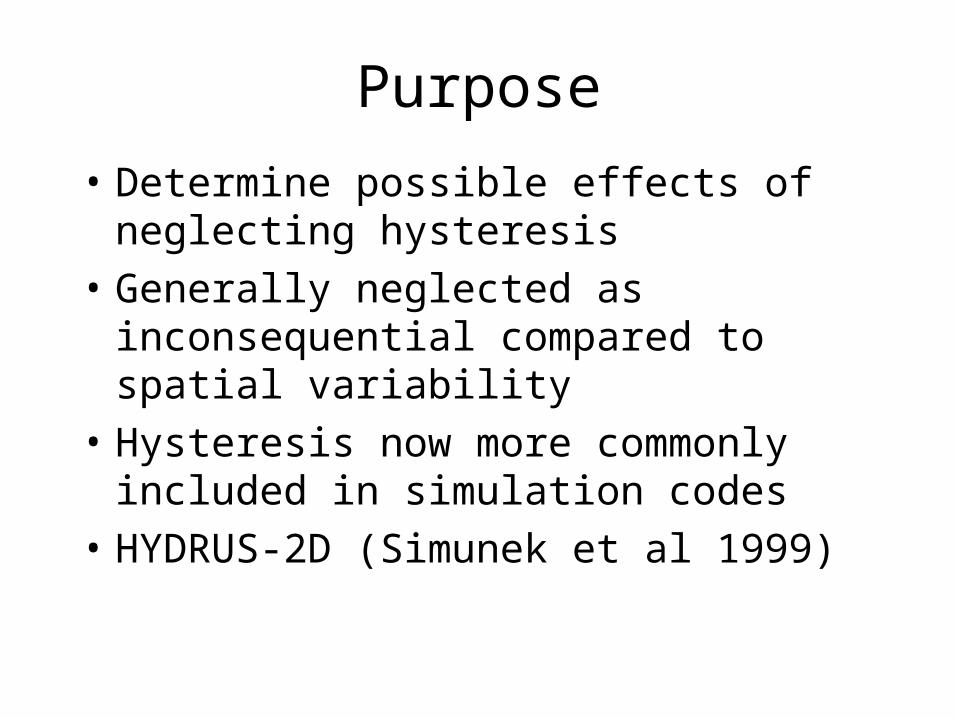
Purpose
• Determine possible effects of neglecting hysteresis
• Generally neglected as inconsequential compared to spatial variability
• Hysteresis now more commonly included in simulation codes
• HYDRUS-2D (Simunek et al 1999)
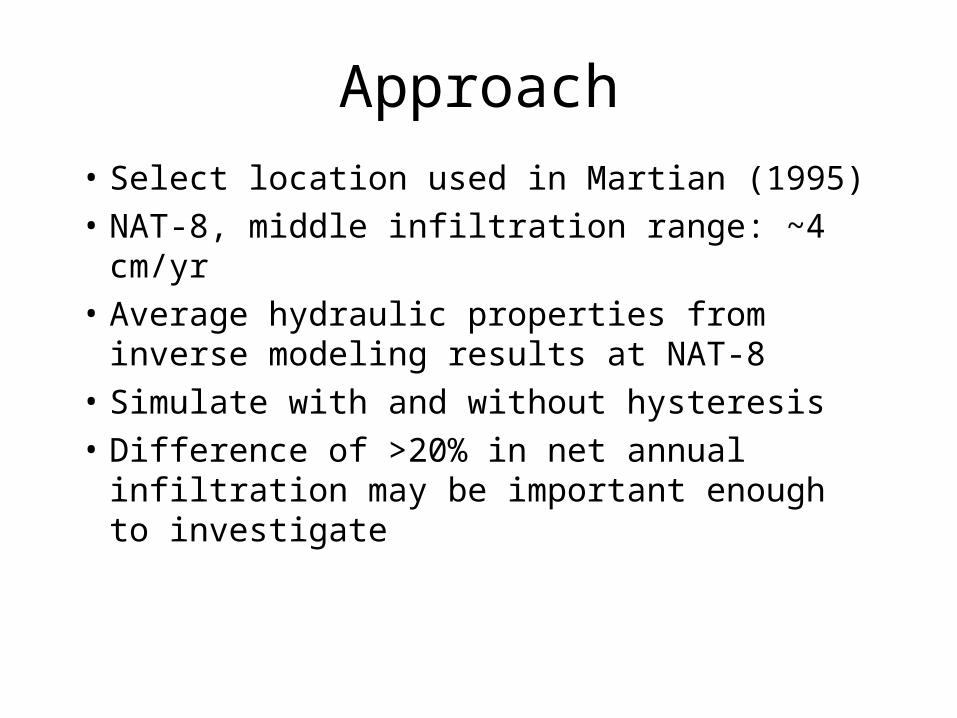
Approach
• Select location used in Martian (1995)• NAT-8, middle infiltration range: ~4 cm/yr• Average hydraulic properties from inverse
modeling results at NAT-8• Simulate with and without hysteresis• Difference of >20% in net annual infiltration
may be important enough to investigate
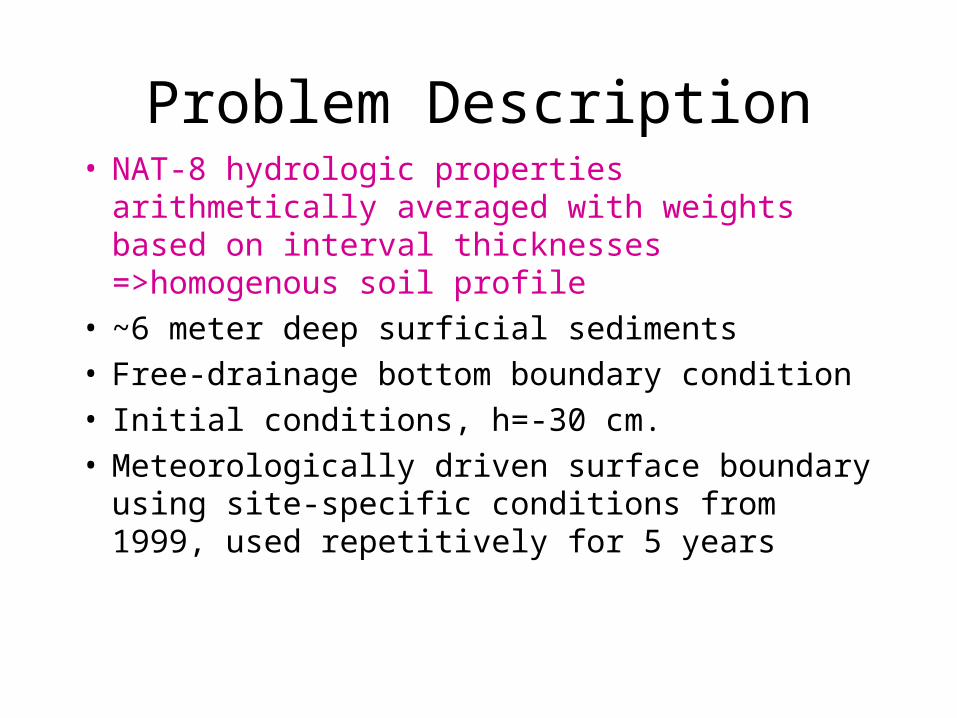
Problem Description• NAT-8 hydrologic properties arithmetically
averaged with weights based on interval thicknesses =>homogenous soil profile
• ~6 meter deep surficial sediments• Free-drainage bottom boundary condition• Initial conditions, h=-30 cm.• Meteorologically driven surface boundary using
site-specific conditions from 1999, used repetitively for 5 years

Average Soil Properties for NAT-8
Parameter Value
Hydraulic conductivity, K 135 cm/day
Porosity, 0.49
Residual moisture content, r 0.11
van Genuchten 0.019 cm-1
van Genuchten N 1.75
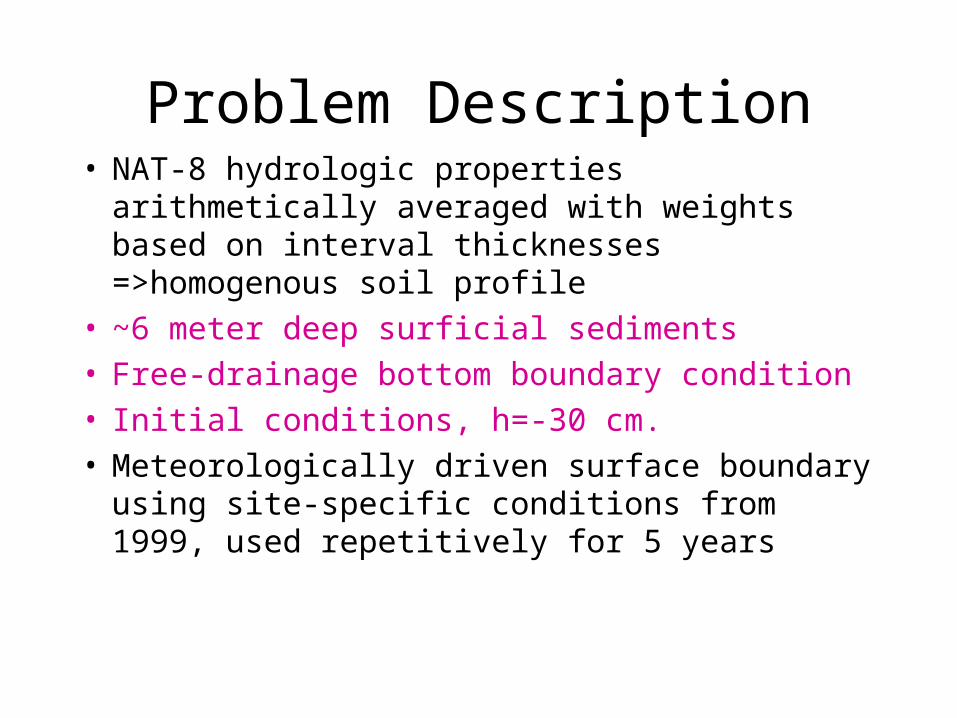
Problem Description• NAT-8 hydrologic properties arithmetically
averaged with weights based on interval thicknesses =>homogenous soil profile
• ~6 meter deep surficial sediments• Free-drainage bottom boundary condition• Initial conditions, h=-30 cm.• Meteorologically driven surface boundary using
site-specific conditions from 1999, used repetitively for 5 years
-2.0
-1.5
-1.0
-0.5
0.0
0.5
1.0
1.5
0 50 100 150 200 250 300 350 400
Time [days]
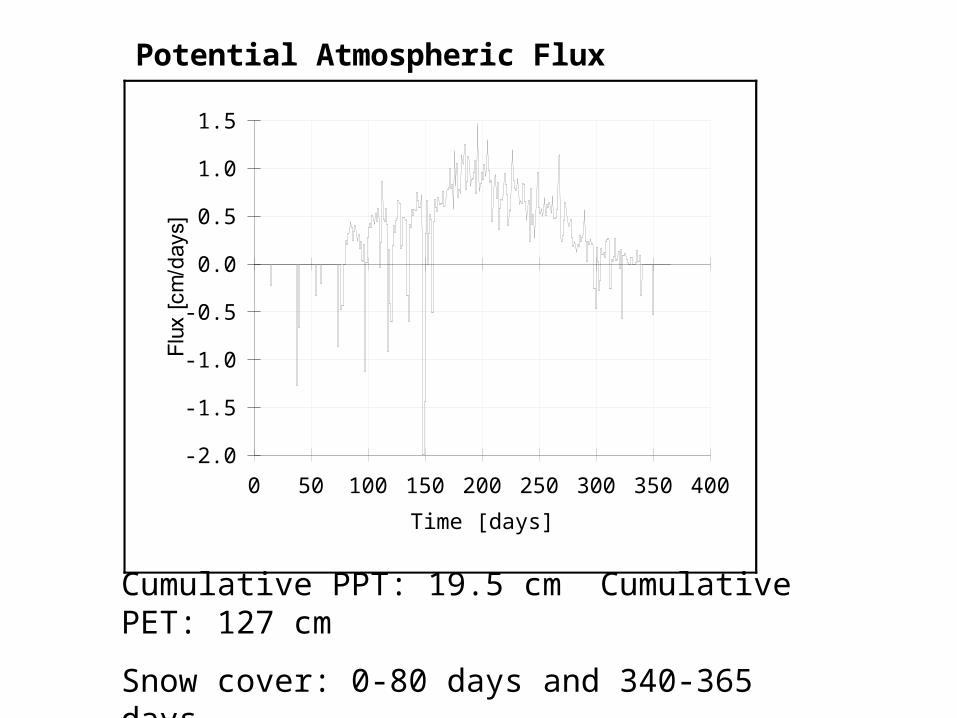
Potential Atmospheric Flux
Cumulative PPT: 19.5 cm Cumulative PET: 127 cm
Snow cover: 0-80 days and 340-365 days
0.2 0.4M oisture Conent
0.1
1.0
10.0
100.0
1000.0
10000.0
- Pressure Head (cm
)
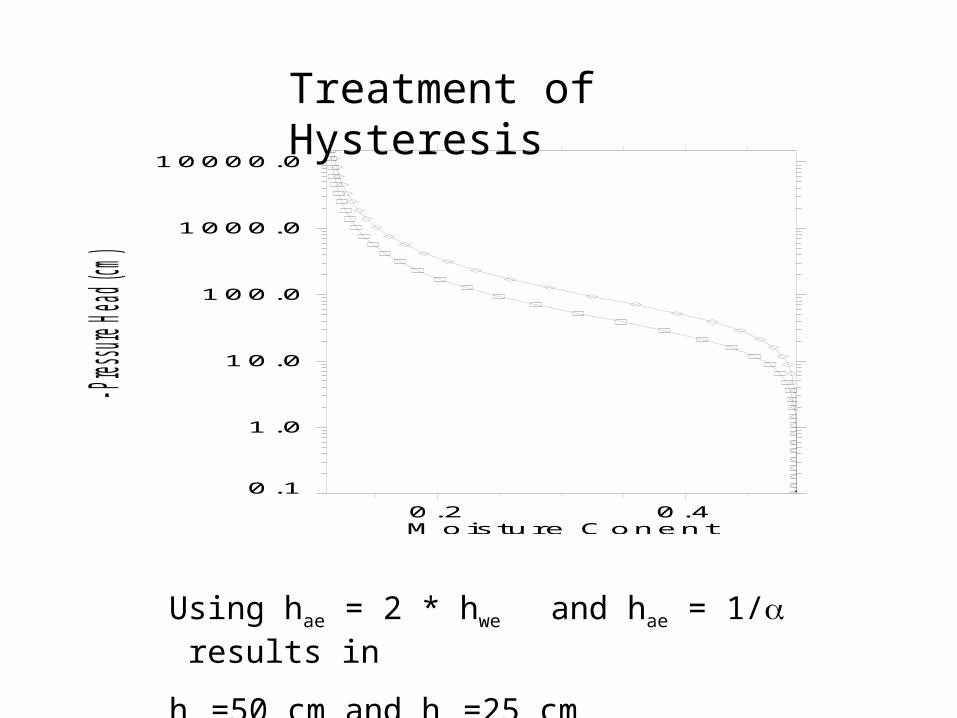
Using hae = 2 * hwe and hae = 1/ results in
hae=50 cm and hwe=25 cm
Treatment of Hysteresis
More on Hysteresis
• Uses something closely approximating the independent domain model: completely specify both wetting and draining curves.
• HYDRUS-2D has options to consider hysteresis in the - relationship and in the K-relationship (both tested)
• Initial conditions must be associated with either the draining or wetting curve.
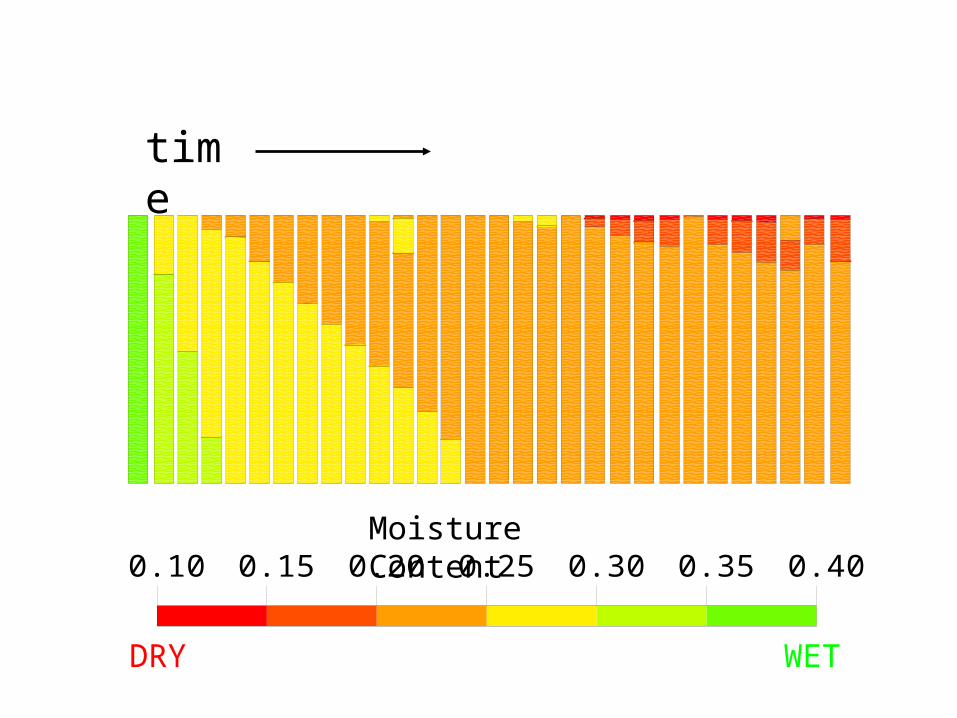
0.10 0.40 0.15 0.20 0.25 0.30 0.35
time
Moisture Content
DRY WET
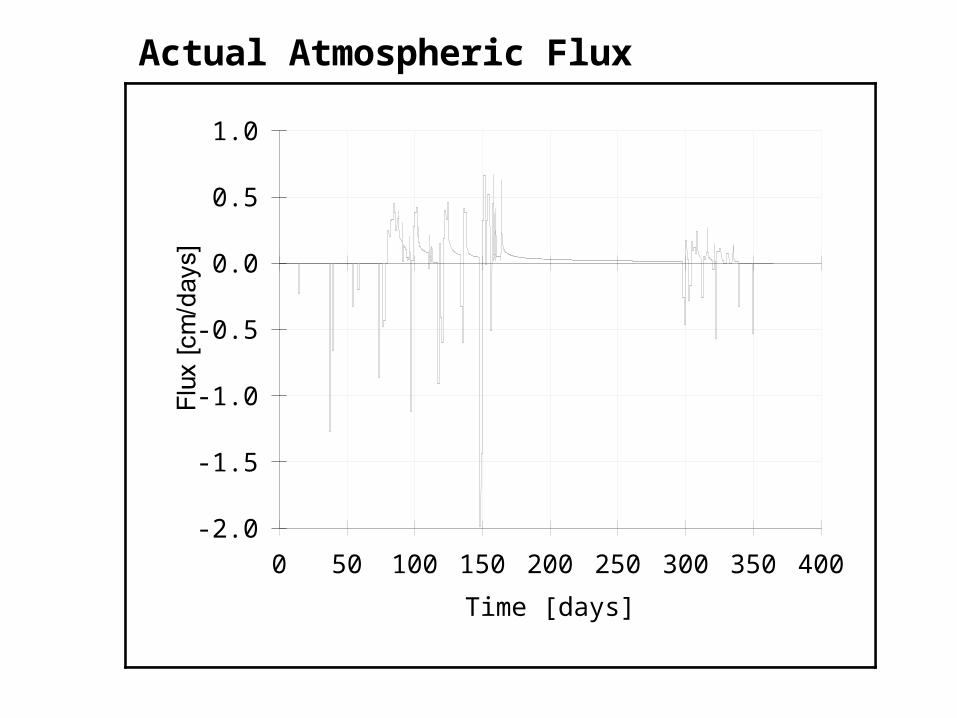
-2.0
-1.5
-1.0
-0.5
0.0
0.5
1.0
0 50 100 150 200 250 300 350 400
Time [days]
Actual Atmospheric Flux
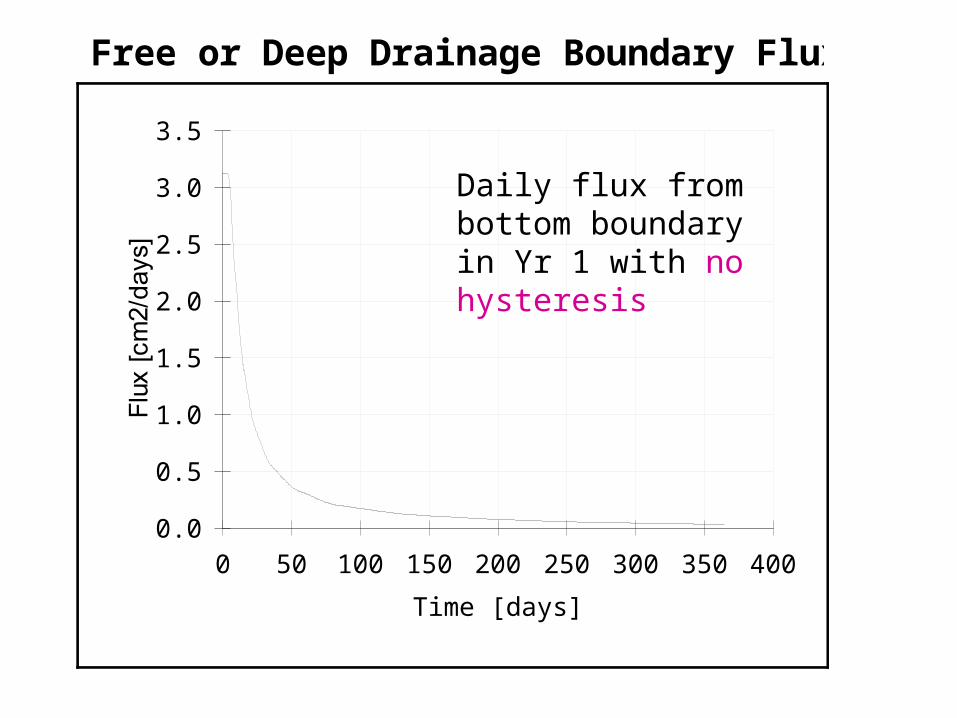
0.0
0.5
1.0
1.5
2.0
2.5
3.0
3.5
0 50 100 150 200 250 300 350 400
Time [days]
Free or Deep Drainage Boundary Flux
Daily flux from bottom boundary in Yr 1 with no hysteresis
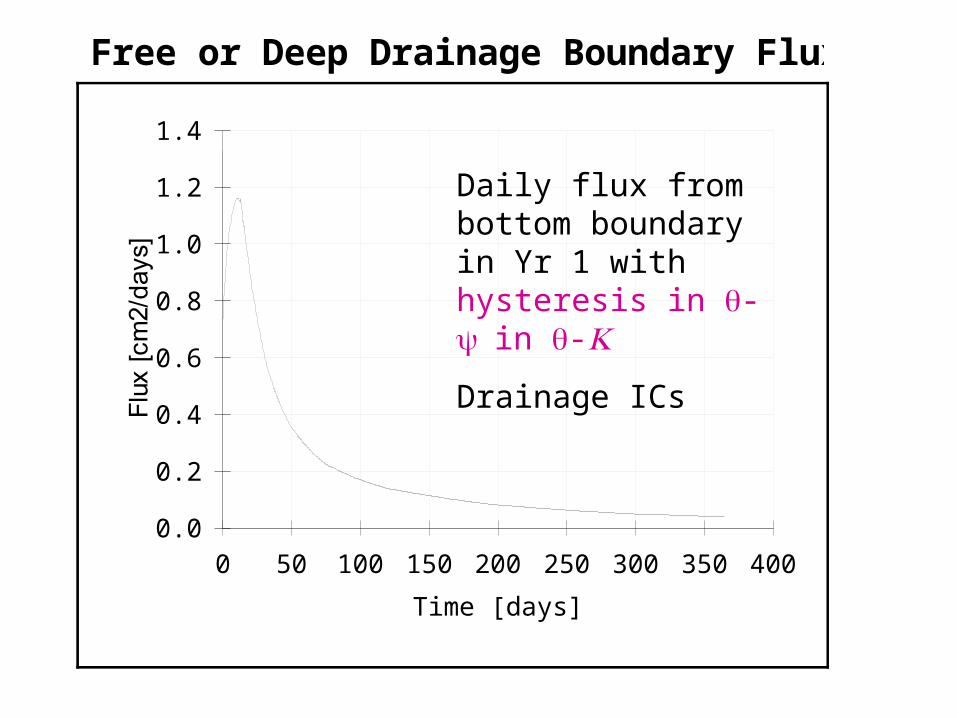
0.0
0.2
0.4
0.6
0.8
1.0
1.2
1.4
0 50 100 150 200 250 300 350 400
Time [days]
Free or Deep Drainage Boundary Flux
Daily flux from bottom boundary in Yr 1 with hysteresis in -in -
Drainage ICs
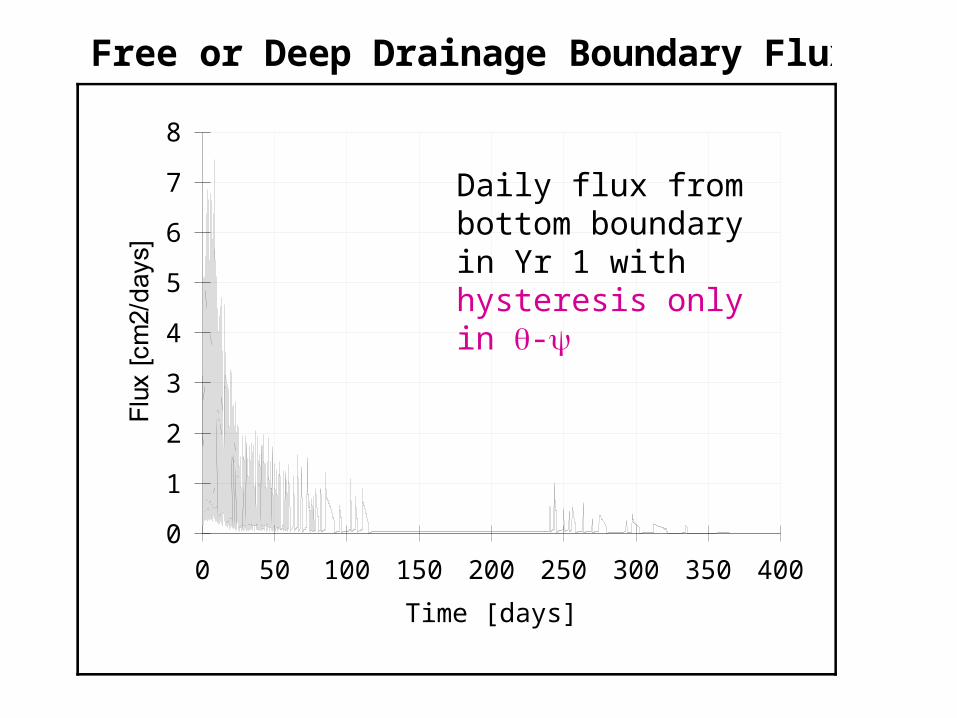
0
1
2
3
4
5
6
7
8
0 50 100 150 200 250 300 350 400
Time [days]
Free or Deep Drainage Boundary Flux
Daily flux from bottom boundary in Yr 1 with hysteresis only in -
0.02
0.04
0.06
0.08
0.10
0.12
0.14
0.16
0.18
0 50 100 150 200 250 300 350 400
Time [days]
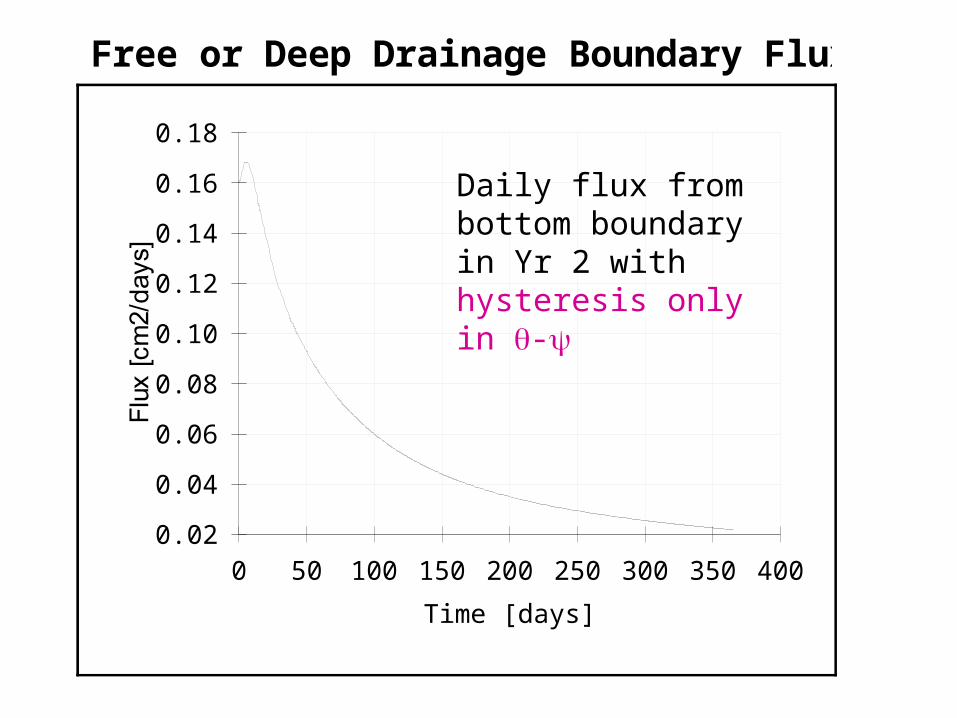
Free or Deep Drainage Boundary Flux
Daily flux from bottom boundary in Yr 2 with hysteresis only in -
0.00E+00
1.00E-02
2.00E-02
3.00E-02
4.00E-02
5.00E-02
6.00E-02
7.00E-02
8.00E-02
9.00E-02
1.00E-01
1 1.5 2 2.5 3 3.5 4 4.5 5
Simulation Year
Dra
inag
e F
lux
(cm
/day
)
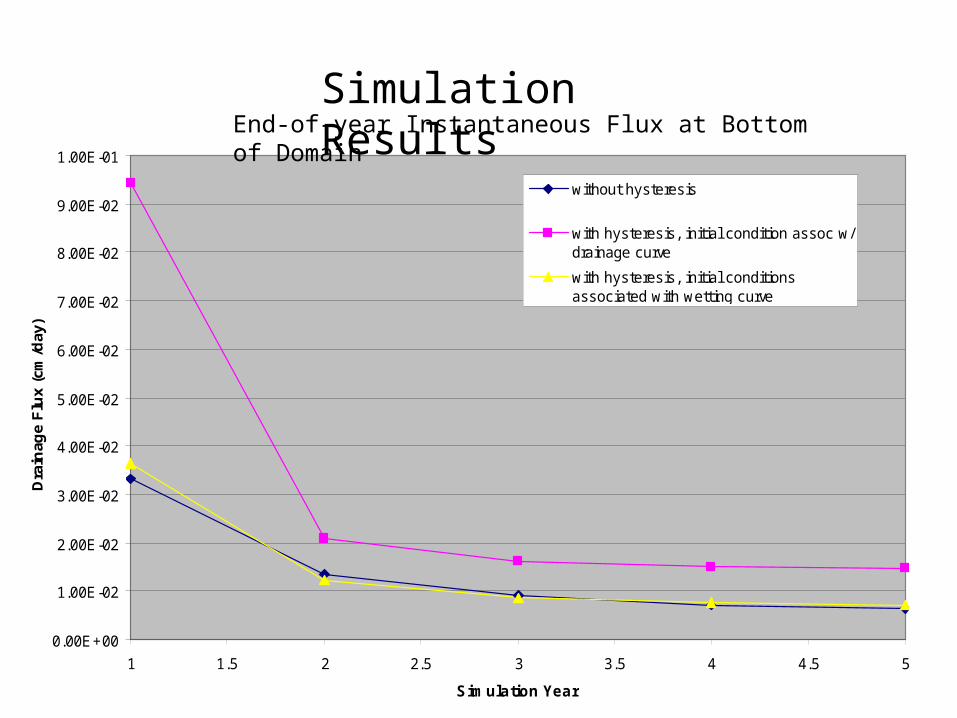
without hysteresis
with hysteresis, initial condition assoc w/drainage curve
with hysteresis, initial conditionsassociated with wetting curve
Simulation ResultsEnd-of-year Instantaneous Flux at Bottom of Domain
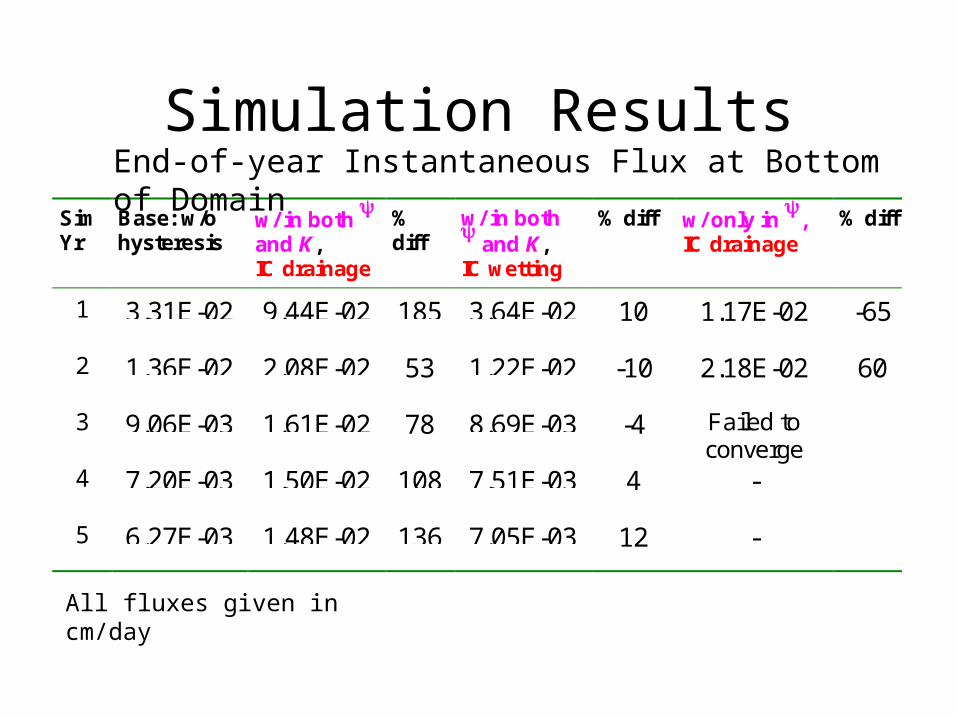
Simulation Results
SimYr
Base: w/ohysteresis
w/ in both
and K,IC drainage
%diff
w/ in both and K,IC wetting
% diff w/ only in ,IC drainage
% diff
1 3.31E-02 9.44E-02 185 3.64E-02 10 1.17E-02 -65
2 1.36E-02 2.08E-02 53 1.22E-02 -10 2.18E-02 60
3 9.06E-03 1.61E-02 78 8.69E-03 -4 Failed toconverge
4 7.20E-03 1.50E-02 108 7.51E-03 4 -
5 6.27E-03 1.48E-02 136 7.05E-03 12 -
All fluxes given in cm/day
End-of-year Instantaneous Flux at Bottom of Domain

Simulation Results
SimYr
Base: w/ohysteresis
w/ in both
and K,IC drainage
%diff
w/ in both and K,IC wetting
% diff w/ only in ,IC drainage
% diff
1 92.5 70.1 24 44.7 -52 88.3 -5
2 7.36 11.6 58 6.42 -13 19.2 160
3 4.02 6.34 58 3.69 -8 Failed toconverge
-
4 2.95 5.49 86 2.92 -1 - -
5 2.46 5.31 116 2.64 7 - -
All fluxes given in cm
Cumulative Annual Drainage
Observations on Running HYDRUS-2D
• GUI post-processing difficulties
• Do not currently trust result for drainage in case w/o hysteresis
• Problems suspected to be associated with installation
Conclusions
• Premature
• Appears that hysteresis can influence net infiltration by greater than 20%