Embed Size (px)
Citation preview
Loughborough UniversityInstitutional Repository
Effects of geometry on theflow characteristics andtexturing performance ofair-jet texturing nozzles
This item was submitted to Loughborough University's Institutional Repositoryby the/an author.
Citation: VERSTEEG, H., BILGIN, S. and ACAR, M., 1994. Effects of geom-etry on the flow characteristics and texturing performance of air-jet texturingnozzles. Textile Research Journal, 64 (4), pp.240-246.
Additional Information:
• VERSTEEG, H., BILGIN, S. and ACAR, M., 1994. Effects of geometryon the flow characteristics and texturing performance of air-jet textur-ing nozzles. Textile Research Journal, 64 (4), pp.240-246. c© SAGE.Reprinted by permission of SAGE Publications.
Metadata Record: https://dspace.lboro.ac.uk/2134/26889
Version: Accepted for publication
Publisher: c© SAGE
Rights: This work is made available according to the conditions of the Cre-ative Commons Attribution-NonCommercial-NoDerivatives 4.0 International(CC BY-NC-ND 4.0) licence. Full details of this licence are available at:https://creativecommons.org/licenses/by-nc-nd/4.0/
Please cite the published version.
Effects of Geometry on the Flow Characteristics and Texturing Performance of Air-Jet Texturing Nozzles·
H.K. VERSTEEG, S. BILGIN, AND M. ACAR
Department of Mechanical Engineering, Loughborough University of Technology, Loughborough, Leicestershire, LE 11 3TU, United Kingdom
ABSTRACT
Air-jet texturing is a versatile process for producing a range of synthetic yarns with a spun-like appearance, which are widely used for apparel and furnishing fabrics and industrial textiles. There is no universal nozzle capable of processing any supply yarn of any linear density. The role played by nozzle geometry is still not fully understood. The experimental study presented here seeks to compare air flow characteristics and texturing data for nine nozzles under realistic texturing conditions as a basis for an improved understanding of the effect of nozzle geometry. Compressed air consumption results show that the nozzle flow is choked at air inlets; thus the nozzles behave as converging-diverging passages. The exit flow distribution is approximately axisymmetric in all cases. Nozzle exit flow characteristics are typical of underexpanded jets with a ratio of jet exit plane static pressure to ambient pressure smaller than or equal to approximately 2. Textured yarns with varying visual appearance were produced by different nozzles under identical processing conditions. Nevertheless, the strength properties of the yarns were broadly the same, as was their increase in linear density. Of all test variables, the tension .in the stabilizing zone was the only quantity to show some promise as a correlating parameter with texturing quality. Neither the presence of shock waves in the exit region nor the magnitude of the exit zone velocity correlated with texturing effectiveness. The texturing results of these trials highlight the fact that the current descriptions of air-jet texturing are not fully capable of explaining the subtle effects due to nozzle geometry and can at best be described as incomplete.
Air-jet texturing is a versatile process for producing of a wide range of synthetic yarns with a spun-like appearance. A bundle of parallel filaments is "overfed" to a specially designed nozzle, where it interacts with a powerful, supersonic air stream. Entanglement of the core of the yarn and surface loops is produced as a result of the interaction. Air-jet textured yarns are then used further to yield apparel fabrics, furniture and car upholstery, and industrial textiles.
The product range of a given texturing nozzle is limited, and there is no universal nozzle capable of processing any supply yarn. Despite extensive study over a 25-year period (Wray [12], Sen [10], Bock and Luenenschloss [4], Acar et al. [3], Demir [6]) the mechanism of air-jet texturing and the role played by nozzle geometry are still poorly understood. The design of these nozzles takes place largely by trial and error.
The work presented here seeks to compare air flow characteristics and texturing data for nine air-jet texturing nozzles under laboratory conditions as a basis for an improved understanding of the effect of nozzle geometry. We measured the total pressure in the nozzle exit region and the air consumption at the texturing air pressure of 8 bar (gauge) and visualized the flow in the jet exit region by means of shadowgraphy. Additionally, textured yarns were produced with the nozzles using PES 167/66 as supply yarn.
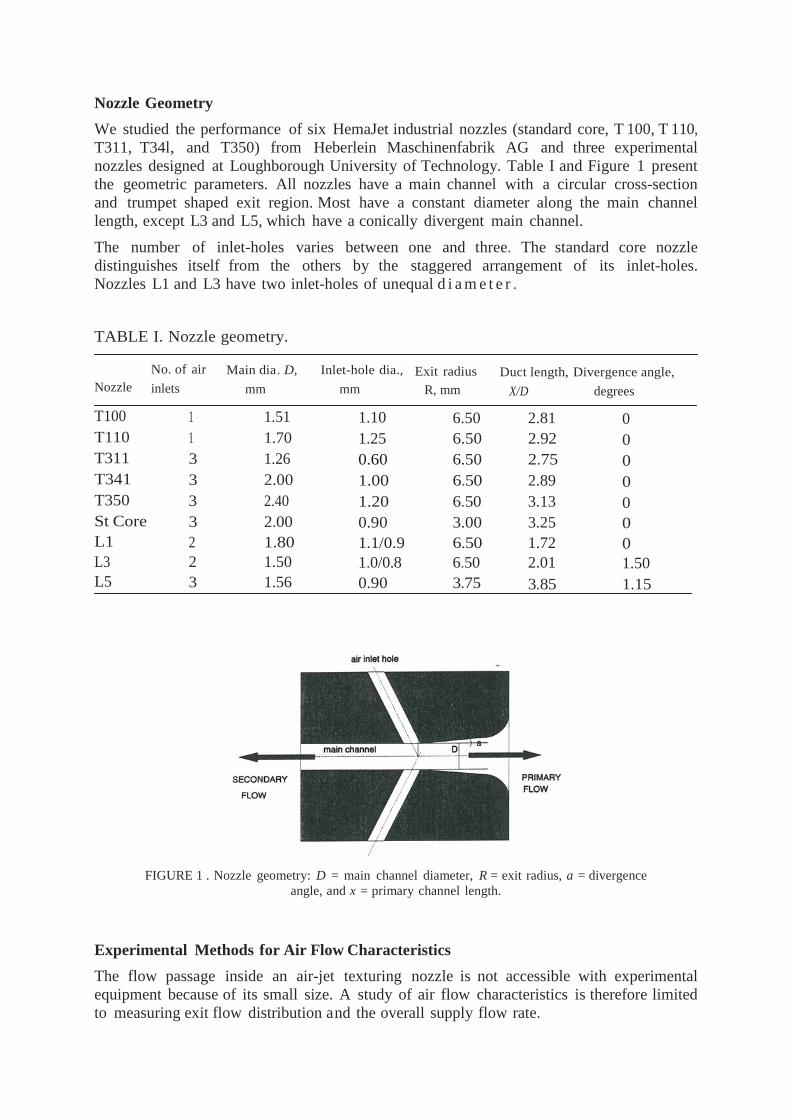
Nozzle Geometry We studied the performance of six HemaJet industrial nozzles (standard core, T 100, T 110, T311, T34l, and T350) from Heberlein Maschinenfabrik AG and three experimental nozzles designed at Loughborough University of Technology. Table I and Figure 1 present the geometric parameters. All nozzles have a main channel with a circular cross-section and trumpet shaped exit region. Most have a constant diameter along the main channel length, except L3 and L5, which have a conically divergent main channel.
The number of inlet-holes varies between one and three. The standard core nozzle distinguishes itself from the others by the staggered arrangement of its inlet-holes. Nozzles L1 and L3 have two inlet-holes of unequal d i a m e t e r .
TABLE I. Nozzle geometry.
No. of air Main dia. D, Inlet-hole dia., Exit radius Duct length, Divergence angle, Nozzle inlets mm mm R, mm X/D degrees
T100 1 1.51 1.10 6.50 2.81 0 T110 1 1.70 1.25 6.50 2.92 0 T311 3 1.26 0.60 6.50 2.75 0 T341 3 2.00 1.00 6.50 2.89 0 T350 3 2.40 1.20 6.50 3.13 0 St Core 3 2.00 0.90 3.00 3.25 0 L1 2 1.80 1.1/0.9 6.50 1.72 0 L3 2 1.50 1.0/0.8 6.50 2.01 1.50 L5 3 1.56 0.90 3.75 3.85 1.15
FIGURE 1 . Nozzle geometry: D = main channel diameter, R = exit radius, a = divergence
angle, and x = primary channel length.
Experimental Methods for Air Flow Characteristics The flow passage inside an air-jet texturing nozzle is not accessible with experimental equipment because of its small size. A study of air flow characteristics is therefore limited to measuring exit flow distribution and the overall supply flow rate.

We measured the total pressure in the exit region of the nozzles with a 0.6 mm internal diameter pitot tube made from fine stainless steel tubing. Detailed accounts of the experimental techniques are available in Acar et al. [2], Demir [6], and Chong [5].
Figure 2 is a schematic sketch of the experimental set-up. The probe movement in the x, y, and z directions was controlled by means of stepper motor drives and a Victor V286A PC. The pitot tube was connected to a Druck DP 1260 pressure transducer with a range of 0-200 kPa (gauge). The signals from the transducer were processed by the microcomputer.
Due to range limitations of the experimental equipment, the total pressure data of T350 and LS had to be taken at 7 bar (gauge) supply pressure . All other data were acquired at a pressure of 8 bar (gauge).
FIGURE 2. Total pressure measuring system.
Total pressure distributions were measured along the center line of all nozzles in 0.25 mm steps from a distance of 2 mm inside up to 8 mm away from the nozzle exit plane. Cross-stream distributions of total pressure were obtained at the exit plane and l, 2, and 3 (main channel) diameters away from the exit. Data were taken within a grid of 25 by 25 points within the region where total pressures were noticeably different from atmospheric.
The compressed air consumption of each nozzle was measured with a Platon flow control rotameter at the texturing supply pressure. Readings were converted to standard m3/ hour using the manufacturer's calibration chart.
Shadowgraphs of the exit flows were produced by illuminati ng the exit region of the nozzle with an expanded, parallel laser beam and projecting the resulting image on a screen. Standard texts such as Shapiro [11] explain the technique in more detail. The shadowgraphs were recorded with a 35 mm camera.
Texturing Trials In order to compare the performance of the various nozzles, we ran a series of texturing trials using the experimental texturing machine designed and built by Acar (1). The supply yarn for these tests was PES 167/66, a typical industrial yarn, which is within the range of suitable yarns for most of the six industrial nozzles quoted by the 1J1anufacturer's literature [7].
Experiments were performed under conditions typical of those used in industry. Processing conditions of the texturing experiments were 8 bar (gauge) supply pressure, 200 m/min
texturing speed, 20% overfeed, 4% draw at stabilizing zone, and 1 1Ihour water supply flow rate. We measured tenacity, breakage elongation, instability, increase in linear density, and tension in yarn stabilizing zone. Tenacity and breakage elongation were measured on at least 20 samples from each pack- age of textured yarn under the standard conditions recommended by Demir (5): 300 mm specimen length, 20 mm/min cross-head speed, and 0.5 cN/dtex nominal load (untextured yarn dtex value). The instability of the yarn is the percent elongation between loads of 0.0I and 0.5 cN/ dtex, where dtex is the linear density of the untextured yarn. We obtained the increase in linear density by comparing the weight of a 50 m length of textured yarn with the weight of an equal length of supply yarn. Tension in the stabilizing zone was measured on-line with a Rothschild tensiometer, whose sensing head was positioned between the two sets of rollers immediately after the nozzle and before the wind-up rollers.
In addition to these mechanical properties, we made a qualitative performance check by visual inspection, backed up by scanning electron .microscopy (SEM). The criteria for the qualitative assessment of texturing performance by visual inspection were handling, light reflection, loop structure (size, shape, etc.), occurrence of untextured sections, and overall appearance.
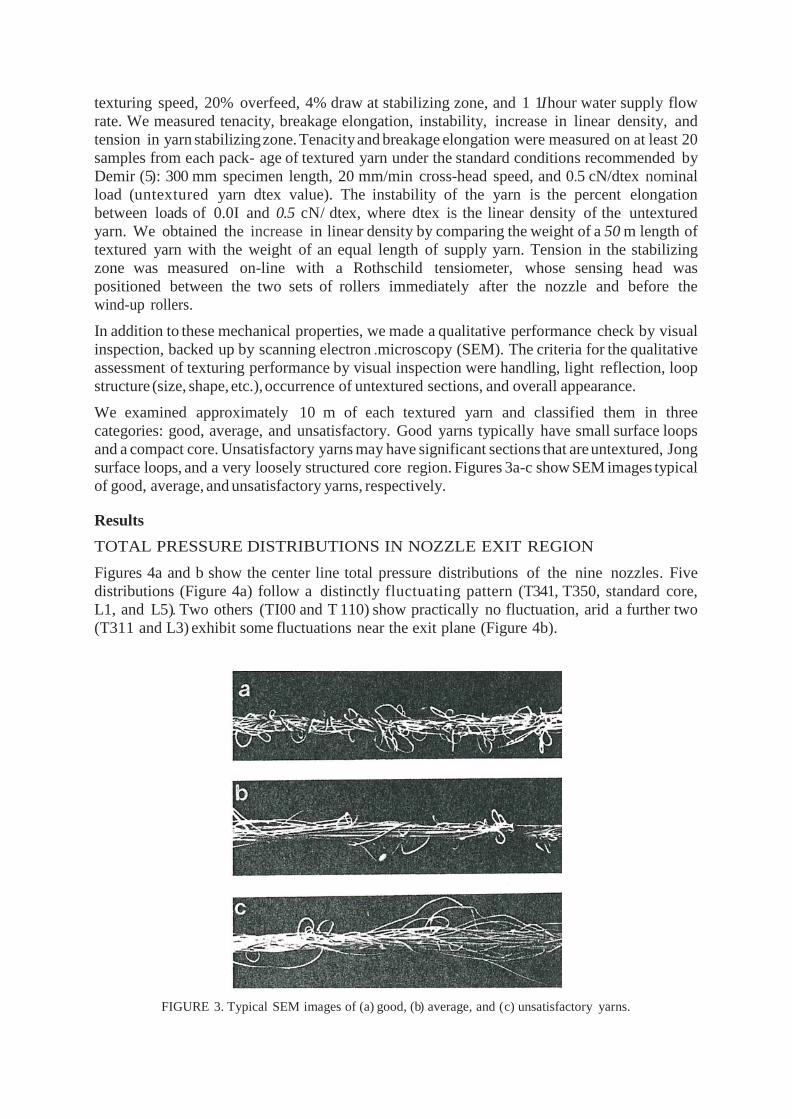
We examined approximately 10 m of each textured yarn and classified them in three categories: good, average, and unsatisfactory. Good yarns typically have small surface loops and a compact core. Unsatisfactory yarns may have significant sections that are untextured, Jong surface loops, and a very loosely structured core region. Figures 3a-c show SEM images typical of good, average, and unsatisfactory yarns, respectively.
Results TOTAL PRESSURE DISTRIBUTIONS IN NOZZLE EXIT REGION
Figures 4a and b show the center line total pressure distributions of the nine nozzles. Five distributions (Figure 4a) follow a distinctly fluctuating pattern (T341, T350, standard core, L1, and L5). Two others (TI00 and T 110) show practically no fluctuation, arid a further two (T311 and L3) exhibit some fluctuations near the exit plane (Figure 4b).
FIGURE 3. Typical SEM images of (a) good, (b) average, and (c) unsatisfactory yarns.
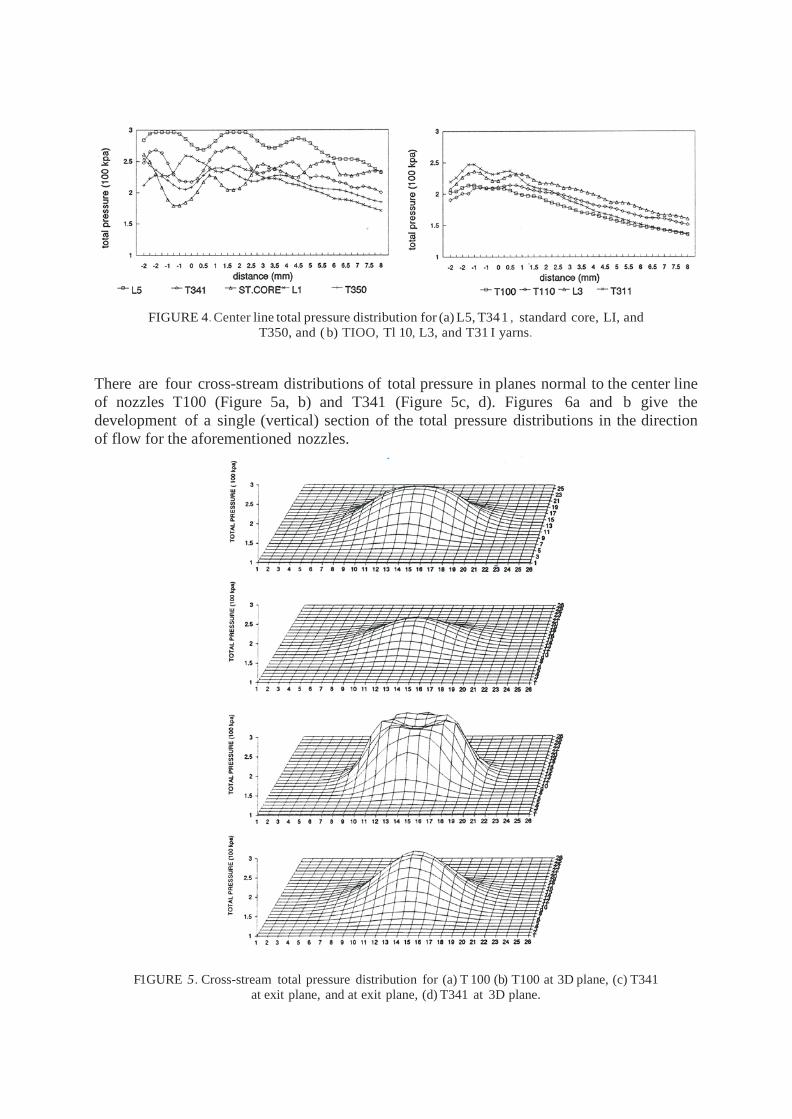
FIGURE 4. Center line total pressure distribution for (a) L5, T34 1 , standard core, LI, and
T350, and ( b) TIOO, Tl 10, L3, and T31 I yarns.
There are four cross-stream distributions of total pressure in planes normal to the center line of nozzles T100 (Figure 5a, b) and T341 (Figure 5c, d). Figures 6a and b give the development of a single (vertical) section of the total pressure distributions in the direction of flow for the aforementioned nozzles.
F1GURE 5. Cross-stream total pressure distribution for (a) T 100 (b) T100 at 3D plane, (c) T341
at exit plane, and at exit plane, (d) T341 at 3D plane.
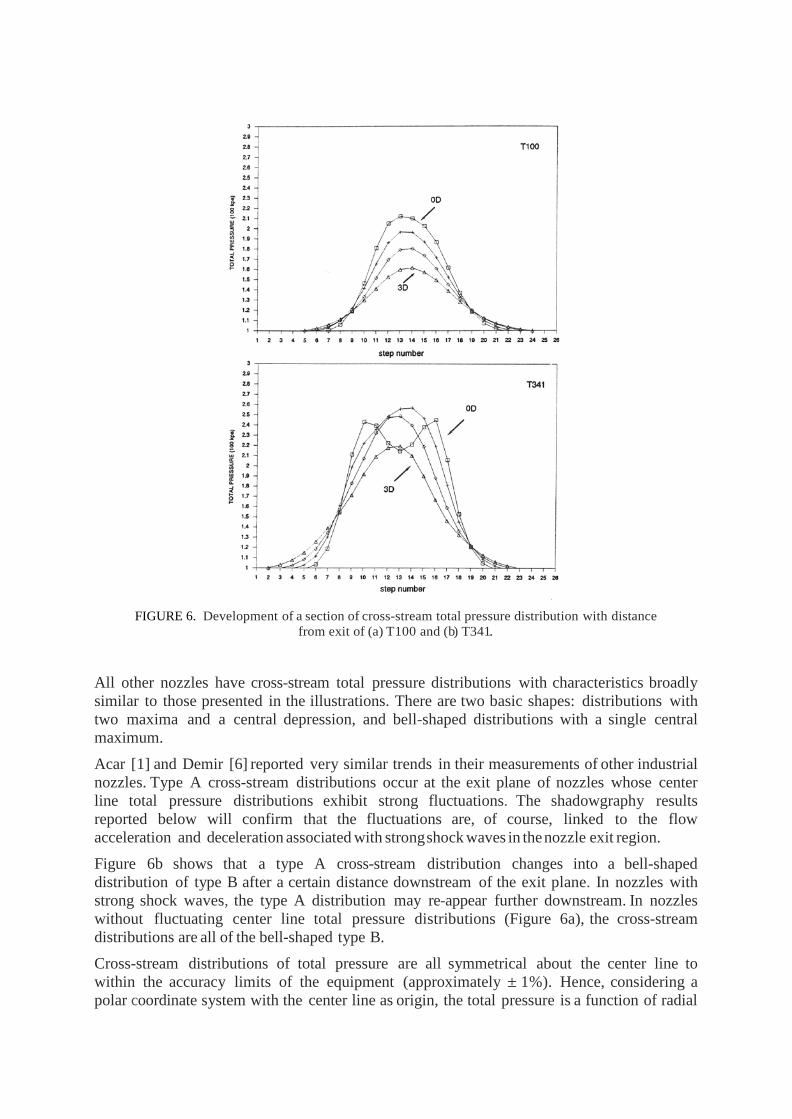
FIGURE 6. Development of a section of cross-stream total pressure distribution with distance
from exit of (a) T100 and (b) T341.
All other nozzles have cross-stream total pressure distributions with characteristics broadly similar to those presented in the illustrations. There are two basic shapes: distributions with two maxima and a central depression, and bell-shaped distributions with a single central maximum.
Acar [1] and Demir [6] reported very similar trends in their measurements of other industrial nozzles. Type A cross-stream distributions occur at the exit plane of nozzles whose center line total pressure distributions exhibit strong fluctuations. The shadowgraphy results reported below will confirm that the fluctuations are, of course, linked to the flow acceleration and deceleration associated with strong shock waves in the nozzle exit region.
Figure 6b shows that a type A cross-stream distribution changes into a bell-shaped distribution of type B after a certain distance downstream of the exit plane. In nozzles with strong shock waves, the type A distribution may re-appear further downstream. In nozzles without fluctuating center line total pressure distributions (Figure 6a), the cross-stream distributions are all of the bell-shaped type B.
Cross-stream distributions of total pressure are all symmetrical about the center line to within the accuracy limits of the equipment (approximately ± 1%). Hence, considering a polar coordinate system with the center line as origin, the total pressure is a function of radial
position, not angular position. It appears that the main channel length of these texturing nozzles is sufficiently great to redistribute the flow asymmetry that may occur in nozzles due to single or staggered inlet-hole arrangements.
SHAOOWGRAPHY IN NOZZLE EXIT REGION
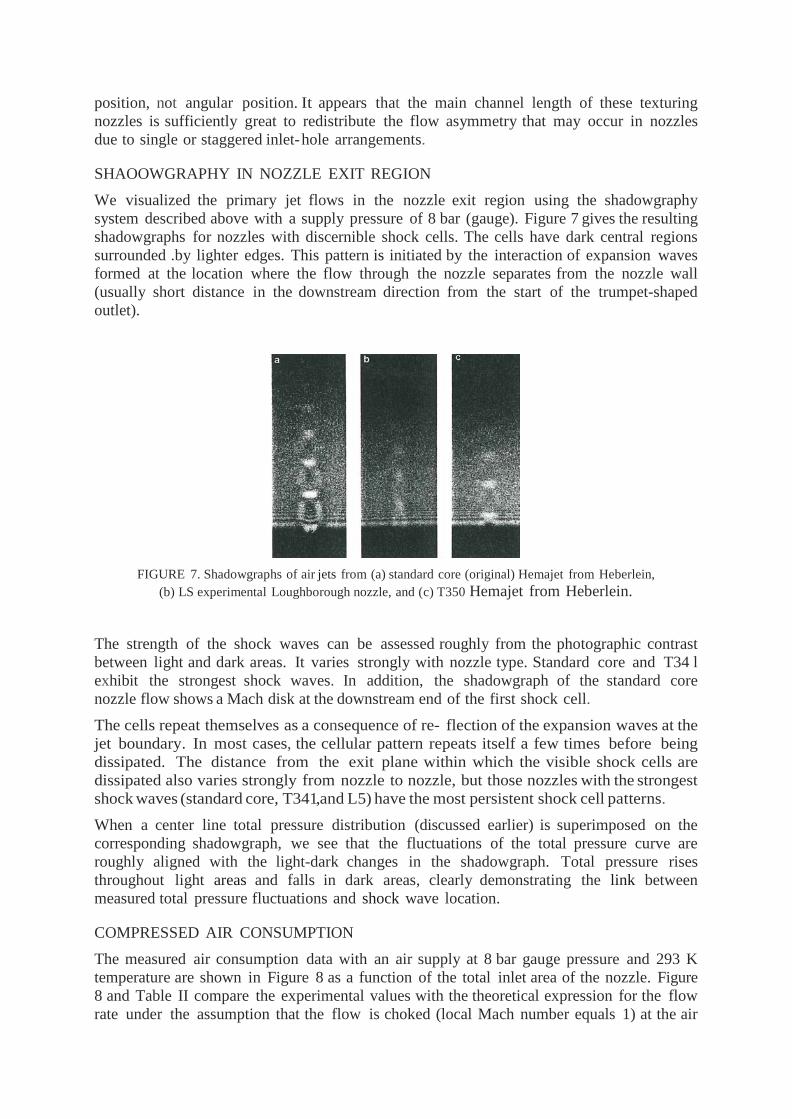
We visualized the primary jet flows in the nozzle exit region using the shadowgraphy system described above with a supply pressure of 8 bar (gauge). Figure 7 gives the resulting shadowgraphs for nozzles with discernible shock cells. The cells have dark central regions surrounded .by lighter edges. This pattern is initiated by the interaction of expansion waves formed at the location where the flow through the nozzle separates from the nozzle wall (usually short distance in the downstream direction from the start of the trumpet-shaped outlet).
FIGURE 7. Shadowgraphs of air jets from (a) standard core (original) Hemajet from Heberlein,
(b) LS experimental Loughborough nozzle, and (c) T350 Hemajet from Heberlein.
The strength of the shock waves can be assessed roughly from the photographic contrast between light and dark areas. It varies strongly with nozzle type. Standard core and T34 l exhibit the strongest shock waves. In addition, the shadowgraph of the standard core nozzle flow shows a Mach disk at the downstream end of the first shock cell.
The cells repeat themselves as a consequence of re- flection of the expansion waves at the jet boundary. In most cases, the cellular pattern repeats itself a few times before being dissipated. The distance from the exit plane within which the visible shock cells are dissipated also varies strongly from nozzle to nozzle, but those nozzles with the strongest shock waves (standard core, T341, and L5) have the most persistent shock cell patterns.
When a center line total pressure distribution (discussed earlier) is superimposed on the corresponding shadowgraph, we see that the fluctuations of the total pressure curve are roughly aligned with the light-dark changes in the shadowgraph. Total pressure rises throughout light areas and falls in dark areas, clearly demonstrating the link between measured total pressure fluctuations and shock wave location.
COMPRESSED AIR CONSUMPTION
The measured air consumption data with an air supply at 8 bar gauge pressure and 293 K temperature are shown in Figure 8 as a function of the total inlet area of the nozzle. Figure 8 and Table II compare the experimental values with the theoretical expression for the flow rate under the assumption that the flow is choked (local Mach number equals 1) at the air
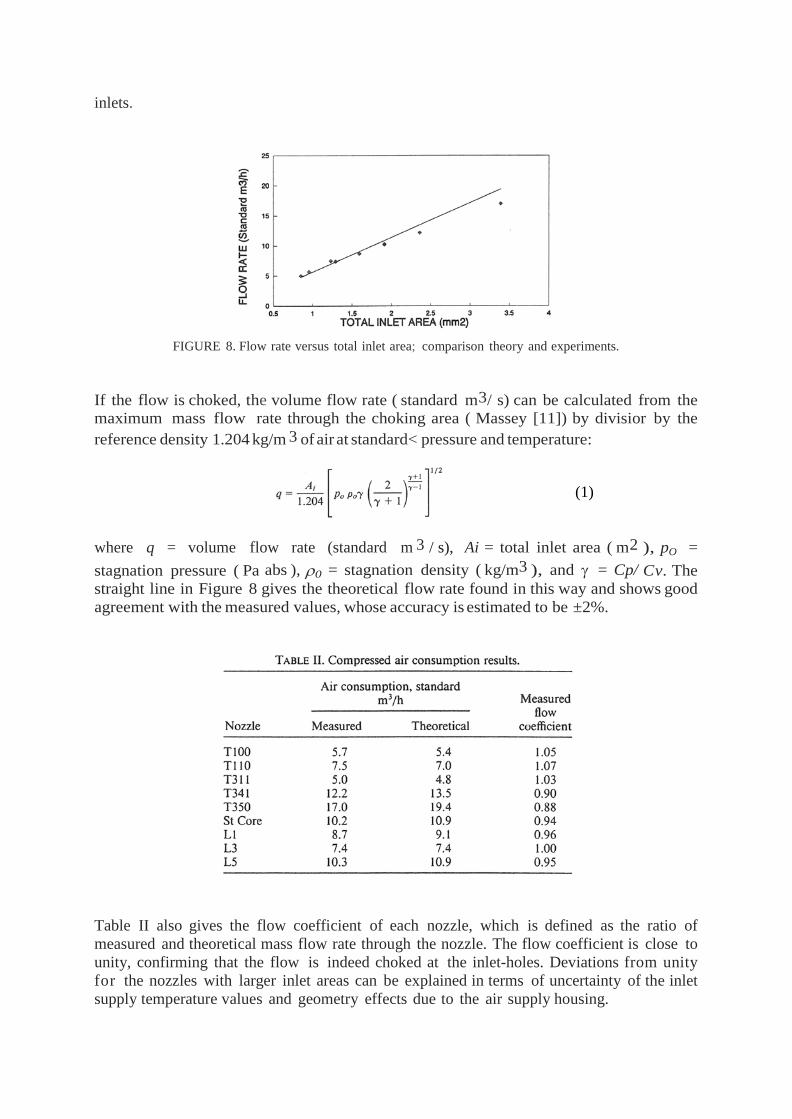
inlets.
FIGURE 8. Flow rate versus total inlet area; comparison theory and experiments.
If the flow is choked, the volume flow rate ( standard m3/ s) can be calculated from the maximum mass flow rate through the choking area ( Massey [11]) by divisior by the reference density 1.204 kg/m 3 of air at standard< pressure and temperature:
(1)
where q = volume flow rate (standard m 3 / s), Ai = total inlet area ( m2 ), pO = stagnation pressure ( Pa abs ), ρ0 = stagnation density ( kg/m3 ), and γ = Cp/ Cv. The straight line in Figure 8 gives the theoretical flow rate found in this way and shows good agreement with the measured values, whose accuracy is estimated to be ±2%.
Table II also gives the flow coefficient of each nozzle, which is defined as the ratio of measured and theoretical mass flow rate through the nozzle. The flow coefficient is close to unity, confirming that the flow is indeed choked at the inlet-holes. Deviations from unity for the nozzles with larger inlet areas can be explained in terms of uncertainty of the inlet supply temperature values and geometry effects due to the air supply housing.

TEXTURI NG TESTS
Results of the tensile tests on yarns produced during the texturing trials are given in Table III. The supply yarn tenacity is 3.77 cN/ dtex. A comparison of tenacities for supply and textured yarns shows that the text uring process causes supply yarn to lose, on average, 44% of its strength.
The average of all tenacity results is 2.13 cN/ dtex with a standard deviation (SD) of 0.11 cN / dtex. The breakage elongation is on average 14.75% ( SD 1.74%), 1nd the mean instability is 1.48% ( SD 0.19%). The increase in linear density also shows small variations. Its mean is 17% and the standard deviation is 0.78%. interestingly, textured yarns created by geometrically very different nozzles under identical processing conditions exhibit only a very small variation in strength properties and increase in linear density.
Table IV gives a summary of the normalized tension in the stabilizing zone, which shows a much wider variation. Its average value (over all nozzles) is 0.57 with a standard deviation of 0.24.
Visual inspections and SEM images of the textured yarns are considerably different. Well textured yarns have small and frequent loops, no untextured areas, a tight core, low light reflection, and spun-like handling characteristics. Figure 3a shows a SEM image typical
of such a yarn. Unsatisfactory yarns have significant untextured sections, which give rise to high light reflectivity and typical synthetic yarn handling. Figure 3 gives an example.
Individual values for tension in the stabilizing zone do not correlate particularly well with the visual grading. The tendency, however, is apparently for higher tension in the stabilizing zone to be associated with higher yarn quality and lower tension with lower quality.
Discussion and Conclusions Measured total pressure distributions and shadowgraphs give very useful complementary pictures, clearly showing the relationship between shock wave position and pitot tube reading in the nozzle exit region. We found that the total pressure was only a function of radial distance from the center line; in other words, even the shortest main channel removed all the asymmetry in the flow associated with the nozzle inlets.
The agreement between theoretical and measured air consumption results shows that the flow is choked at the nozzle inlets. Subsequent area enlargement ensures that flow characteristics in all texturing nozzles correspond to those of convergent-divergent nozzles. This conclusion is in agreement with previously published modeling assumptions by Acar et al. [3] and Demir [6]. The data suggest that nozzles with low air consumption must of necessity have small air inlet-holes.
The shadowgraphs show shock cells with convex boundaries, which are characteristic of under-expanded jets. This is very plausible given the high prevailing supply pressures. The first visible shock cell in the shadowgraph of the standard core nozzle contains a Mach disk. Work by Ramskill [9] on under-expanded jets from convergent-divergent nozzles shows that this occurs when the ratio n of jet exit plane static pressure to ambient pressure is greater than or equal to approximately 2. The shadowgraphs of flows in the exit region of other nozzles do not show Mach disks, leading to the conclusion that the standard core operates at n of around 2 and all other nozzles at a lower degree of under-expansion (l < n < 2).
The texturing trials show that some nozzles with very weak shock waves in the exit region produce good texturing, whereas some others with strong shock waves yield poorly textured yams. This seemingly negative result implies that the presence of shock waves in the exit region is not a necessary or sufficient condition for good texturing, as suggested in Bock and Luenenschloss [4].
Demir [6] presents a careful argument linking the total pressure as measured by the pitot probe to the local velocity. He and Acar et al. [3] have suggested that the magnitude of the exit velocity may be one of the key factors in determining texturing efficiency. However, in our tests, we could find no correlation between mean total pressure level in the exit region and texturing quality. The texturing results of our trials highlight the fact that previously proposed mechanisms of air-jet texturing fall short of explaining the subtle effects due to nozzle geometry and can at best be de- scribed as incomplete.
Textured yams with different visual appearance were produced by the different nozzles under identical processing conditions. Nevertheless, the strength properties of the yams were broadly the same, as well as their increase in linear density. This result stresses the in- adequacy of simple strength tests as indicators of texturing effectiveness. Of all the test variables, the tension in the stabilizing zone was the only quantity to show some promise as a correlating parameter with texturing quality. The results tentatively suggest that an increased tension in the stabilizing zone is a favorable indication of texturing
effectiveness when comparing nozzles of different geometry.
A test program that explores the influence of nozzle geometry for a number of systematic variations of a generic nozzle shape is currently in progress at Lough- borough. The results of this exercise will be reported in the near future.
Literature Cited
1. Acar, M., An Analysis of the Air-jet Yarn Texturing Process and the Development of Improved Nozzles, Doctoral thesis, Loughborough Univ. of Tech., Loughborough, UK, 1984.
2. Acar, M ., Turton, R. K., and Wray, G. R., An Analysis of the Air-jet Texturing Process, Part II: Experimental Investigation of the Air Flow, J. Textile Inst. 77, 28-43 ( 1986).
3. Acar, M., Turton, R. K., and Wray, G. R., Air Flow in Yarn Texturing Nozzles, Trans . ASME J. Eng. lndust. 109 (3), 197-202, ( 1987).
4. Bock, G., Luenenschloss, J., An Analysis of the Mechanism of Air-texturing, in "Textile Machinery: Investing for the Future, 66th Conference Papers," The Textile Institute, Manchester, UK 1982.
5. Chong, K. F. J., Computer Control of an xyz Manipulator, Project report, Loughborough Univ of Tech., Loughborough, UK, 1990.
6. Demir, A., The Air-jet Texturing Process with Particular Reference to the Nozzle Design and Improved Yarn Test Methods', Doctoral thesis, Loughborough Univ of Tech., Loughborough, UK, 1987.
7. Heberlein Product Information Sheet, Jet Cores-Series T, Heberlein Maschinenfabrik AG, Wattwill, Switzer- land, 1987.
8. Massey, B. S., "Mechanics of Fluids," 6th ed., Van Nostrand Reinhold, London, 1989.
9. Ramskill , P. K., A Study of Axisymmetric Under-expanded Gas Jets, Report SRDR302, Safety and Reliability Directorate, UK Atomic Energy Authority, Warrington, March 1985.
10. Sen, H., A Study of the Air-jet Type Bulked Filament Process, Doctoral thesis, Loughborough Univ of Tech., Loughborough, UK, 1970.
11. Shapiro, A. H., "The Dynamics and Thermodynamics of Compressible Fluid Flow," vol. 1, Ronald Press, NY, 1953.
12. Wray, G. R., The Properties of Air-textured Continuous Filament Yarns, J. Textile Inst, 59, 122-36 ( 1986).
![Discrete Differential Geometry (600.657)misha/Fall09/15-willmoreflow.pdfDifferential Geometry: Willmore Flow [Discrete Willmore Flow. Bobenko and Schröder, 2005] Quaternions Quaternions](https://img.pdfslide.us/doc/110x75/60e39496d9393942a254d1ec/discrete-differential-geometry-600657-mishafall0915-differential-geometry.jpg)