Embed Size (px)
Citation preview
The University of Adelaide School of Economics
Research Paper No. 2009-11 March 2009
Effects of GATT/WTO on Asia’s Trade Performance
Will Martin, Kym Anderson and Cong S. Pham
The University of Adelaide, School of Economics Working Paper Series No: 0070 (2009-11)
Effects of GATT/WTO on Asia’s Trade Performance
Will Martin (World Bank), Kym Anderson (University of Adelaide) and Cong S. Pham
(World Bank and Deakin University)
19 February 2008
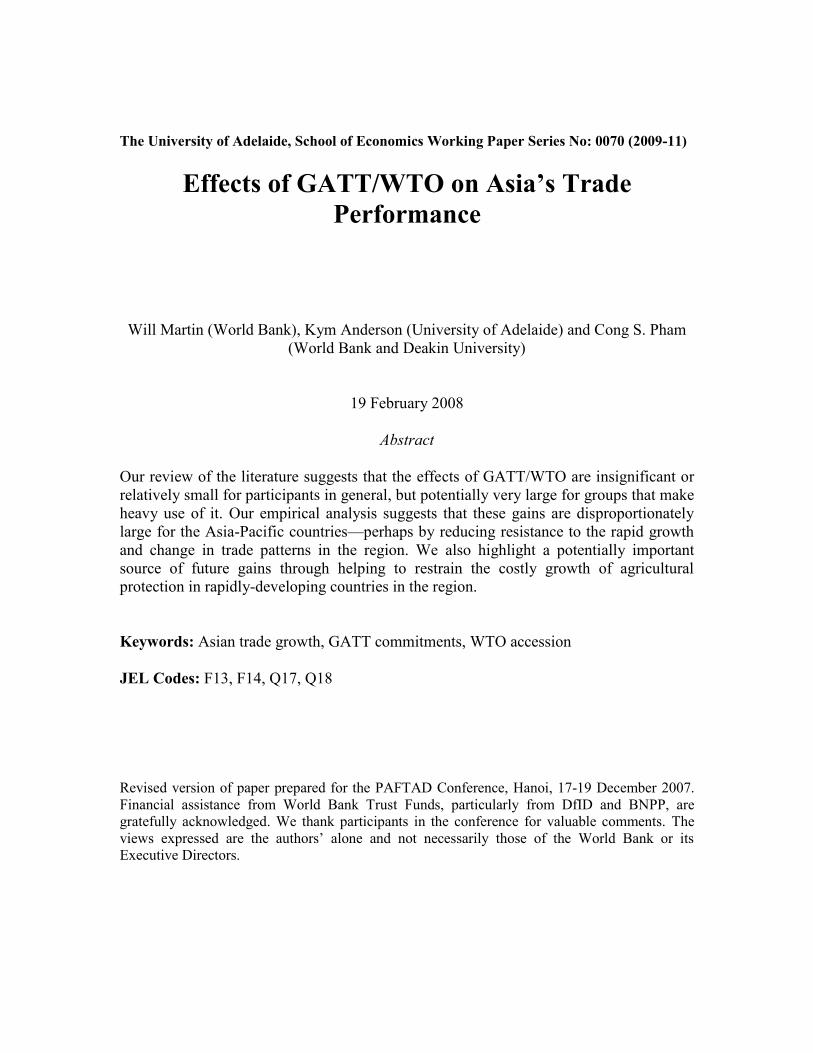
Abstract Our review of the literature suggests that the effects of GATT/WTO are insignificant or relatively small for participants in general, but potentially very large for groups that make heavy use of it. Our empirical analysis suggests that these gains are disproportionately large for the Asia-Pacific countries—perhaps by reducing resistance to the rapid growth and change in trade patterns in the region. We also highlight a potentially important source of future gains through helping to restrain the costly growth of agricultural protection in rapidly-developing countries in the region. Keywords: Asian trade growth, GATT commitments, WTO accession JEL Codes: F13, F14, Q17, Q18 Revised version of paper prepared for the PAFTAD Conference, Hanoi, 17-19 December 2007. Financial assistance from World Bank Trust Funds, particularly from DfID and BNPP, are gratefully acknowledged. We thank participants in the conference for valuable comments. The views expressed are the authors’ alone and not necessarily those of the World Bank or its Executive Directors.
Effects of GATT/WTO on Asia’s Trade Performance
I. Introduction The overarching official objective of the WTO is ―to help trade flow smoothly, freely,
fairly and predictably‖1. Since the inauguration of the multilateral trading system in 1947,
trade has certainly growth rapidly—although perhaps not always predictably—in the
Asia-Pacific. Over the last quarter-century, exports from the developing countries of East
Asia alone have grown at an annual rate of 13 percent per year, fast enough to raise their
share of global exports from 3.4 percent to 10.5 percent. However, as Rose (2004a) has
reminded us so forcefully, correlation is not causation, and careful analysis is needed to
assess the extent to which the multilateral trading system has contributed to this felicitous
outcome, and to the region’s economic growth more broadly.
For the Asia-Pacific region, the role of the GATT/WTO has been complex. The
United States, India, Pakistan, Burma, Ceylon (Sri Lanka), Canada, Australia, New
Zealand, and Chile were contracting parties to the GATT from its inception, but
important countries such as Japan and Korea entered the system much later (1955 and
1967, respectively) while China’s participation in the GATT lapsed in 1950 and she
acceded to the WTO only at the end of 2001– after 15 years of negotiations on (re)entry.
It will therefore be particularly important to distinguish the implications of the system for
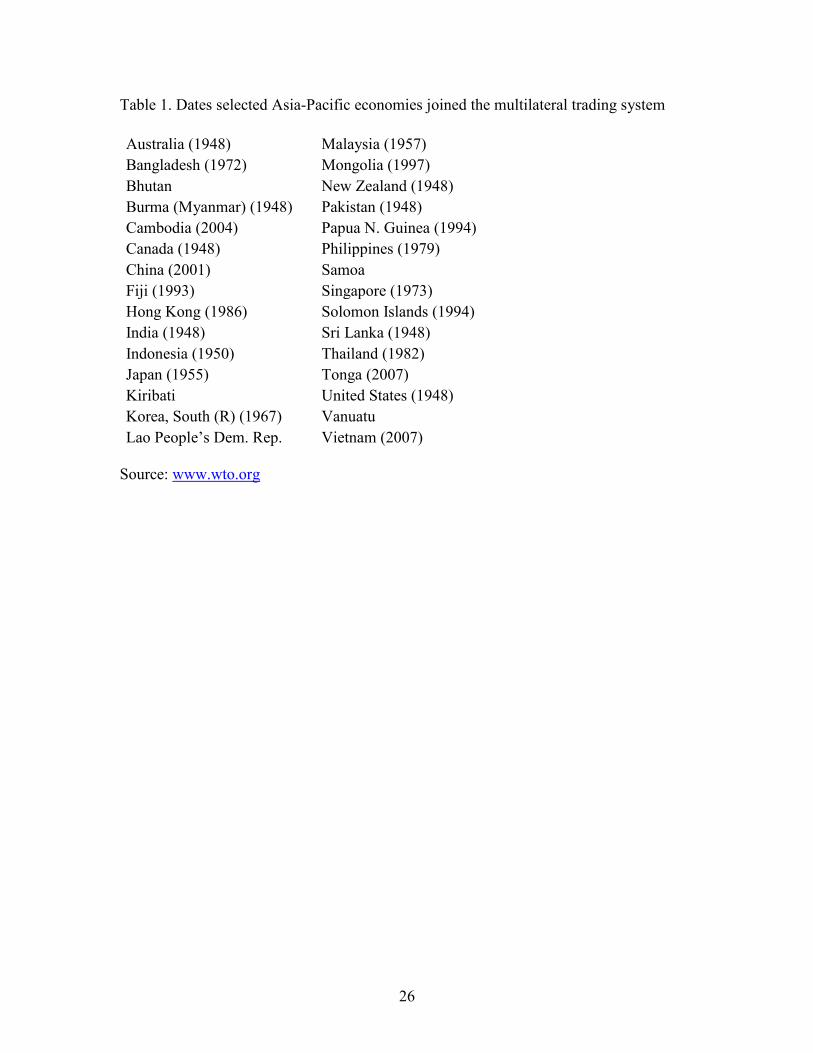
countries with such widely divergent experiences. As background, Table 1 gives the dates
on which a range of Asia-Pacific countries acceded to the GATT/WTO system. As noted
by Tomz, Goldstein and Rivers (2007), these dates can be extremely misleading, since
some signatories hardly participated in its activities while other non-signatory countries
participated informally in the GATT system for many years without acceding. Some
decisions on protection by some non-members, most prominently China, were strongly
influenced by the prospect of accession to the WTO, as assumed by Ianchovichina and
Martin (2004) in their analysis of the impacts of China’s WTO accession.
One way in which the GATT/WTO may be much more important in the future
than it has been in the past is through restraining effects on agricultural protection that 1 www.wto.org
2
were not present under the GATT. There is a strong tendency for agricultural protection
to increase as economies grow—a finding reinforced in an ongoing, large-scale study by
Kym Anderson. Taking this into account, the value of commitments on agricultural
tariffs—even those at or above current applied rates—may be much greater than would
appear to be the case when the conventional procedure of comparing bound with current
applied rates is used. This may matter particularly with accessions, where some countries
have made commitments that may have considerable value in the future. If, for instance,
Japan had bound its tariff on rice at its then-current level of 46 percent on accession to
the GATT in 1955 (Anderson, Hayami and Others 1986), this would have precluded the
extremely costly subsequent emergence of rates of protection of close to 700 percent
(OECD 2007).
We begin by considering the operation of the GATT/WTO and how it might have
influenced past trade policies in Asia-Pacific countries. Then we survey some of the key
empirical evidence on the extent to which GATT/WTIO may have influenced trade
outcomes. Third, we present some new econometric estimates of the extent to which the
system has actually influenced trade outcomes. Finally, we look forward, using a case
study of China, at the potential benefits of WTO disciplines, particularly as they affect
agricultural protection.
II. How the GATT/WTO might have influenced outcomes in the Asia-Pacific
The WTO system aims to operate by: (1) setting and enforcing rules for international
trade, (2) providing a forum for negotiating and monitoring further trade liberalization,
(3) resolving trade disputes, (4) increasing the transparency of decision-making processes,
(5) cooperating with other major international economic institutions involved in global
economic management, and (6) helping developing countries benefit fully from the
global trading system. We consider first how the ―rules‖ functions of the GATT/WTO
might have influenced the trade and development options of Asia-Pacific countries,
before turning to look more specifically at the roles of negotiating and monitoring trade
liberalization.

3
Over the sixty years since the inauguration of the GATT in 1947, the rule-setting
function of the multilateral system has probably been the most important for most Asia-
Pacific countries, although the negotiation and monitoring of trade liberalization has
probably received the most attention. Fundamental rules such as the MFN principle
(Article I of GATT)–outlawing discrimination between suppliers– may have played an
important role even in developing country members that did not make extensive
commitments to bind and reduce tariffs. So too might provisions outlawing the
imposition of higher domestic taxes on imported goods (Article III) and the general
prohibition on use of quantitative restrictions (Article XI), although developing countries
were able to use such restrictions with little restraint under Article XVIII:B until well
after the Uruguay Round. The requirement under Article X to publish trade regulations
might have contributed to transparency in international trade. And Article XXIV’s
requirement that regional arrangements should cover ―substantially all trade‖ may have
helped reduce the confusing and ultimately counterproductive proliferation of different
preference margins that arose under preferential arrangements in the 19th century.
The formal dispute settlement procedures of the GATT probably played a
relatively minor role simply because any contracting party, even the defendant, could
block adoption of a dispute settlement report prior to the Uruguay Round. This changed
after the Uruguay Round, and is widely thought to have greatly strengthened the dispute-
settlement function. Co-ordination with other international agencies was also relatively
limited during the GATT era—and to this day the only substantive mention of
interactions with other international agencies is to the International Monetary Fund in the
context of balance-of-payments provisions.2
The role of the system in helping developing countries has turned out to be
something of a two-edged sword. One element—the unilateral granting by high-income
countries of tariff preferences—increased the market access of developing countries to
some degree, although there is much debate about the extent to which these preferences
provided meaningful increases in market access. A second element of special and
differential treatment—waiving the obligation of developing countries to liberalize their
2 The Uruguay Round Agreement establishing the WTO includes a Ministerial Decision on improving coherence in global policy making through interaction with the World Bank and the International Monetary Fund. Winters (2007) concludes that this has achieved very little to date.
4
own trade policies—may well have reduced their gains from participation in the
multilateral system by reducing the economic welfare gains resulting from liberalization
of countries’ own trade barriers, and from greater access to markets in other developing
countries (Hoekman and Ozden 2006).
The trade negotiation function of the GATT/WTO is designed, through
commitments not to increase protection above agreed levels (tariff bindings in the case of
merchandise trade), to contribute by reducing the barriers in and facing countries, and by
increasing the transparency and predictability of the trading system. As noted by
Subramanian and Wei (2007), this function of the GATT/WTO has had a much more
varied and interesting career than is frequently suggested. Many note that the first
(Geneva) round of GATT negotiations was completed in only eight months, and that all
rounds of negotiations since the 1960s have taken considerably longer. This view
typically notes that the Uruguay Round, initiated in 1986, took around eight years from
its formal launch, and 12 years from its initial, aborted launch in 1982. The Doha Agenda,
initiated in 2001 after a failed attempt to launch at Seattle in 1999, has already taken
almost six years, and may well take much longer.
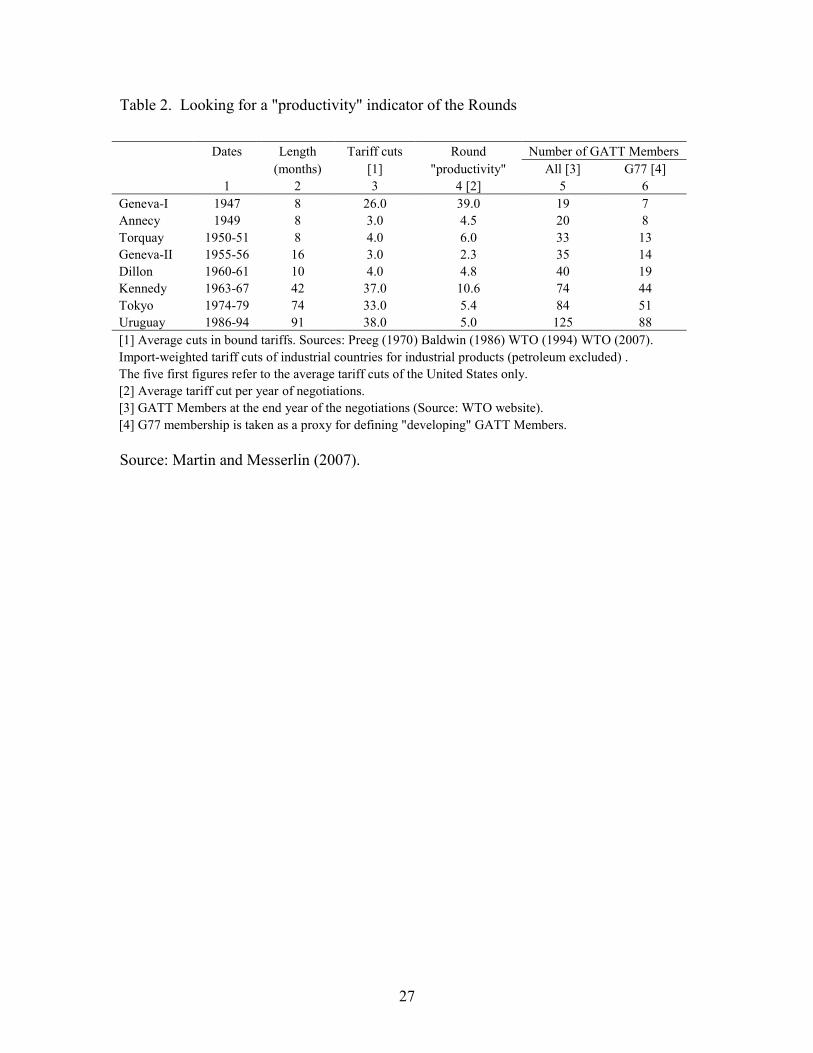
However, this perspective fails to emphasize the much greater ambition of the
more recent rounds. Martin and Messerlin (2007) found that the three rounds of
negotiations since the 1960s—the Kennedy Round (1963-7); the Tokyo Round (1974-79)
and the Uruguay Round (1986-2004)—had brought about much larger reductions in
tariffs than all earlier rounds (Table 2). Apart from the initial Geneva-I negotiations, at
which it is frequently argued that the United States made greater commitments than other
members in order to launch the multilateral system, the first five rounds resulted in only
very modest tariff reductions. Not shown in Table 2 is the fact that these reductions were
in only a small number of members, with developing countries, and countries such as
Australia and New Zealand, being unwilling to make large tariff reductions on the
grounds that they needed to use protection to stimulate the growth of their infant
manufacturing industries.
As noted in Table 2, the Kennedy and Tokyo Rounds brought about much greater
reductions in tariffs in the northern hemisphere’s industrial countries. A large part of the
reason for the greater success of these rounds in reducing tariffs appears to have been the
5
move from a request-and-offer system to a formula-based approach (Baldwin 1986). The
developing countries, and some industrial countries such as Australia, were exempted
from the formula. Even in the industrial countries, many products were excluded from
liberalization. Unfortunately, these exceptions disproportionately affected the products of
export interest to developing countries, such as textiles, clothing and footwear. This may
have been because the developing countries were not active participants in the exchange
of market access concessions, and hence unable to effectively press for the retention of
formula cuts on these products.
By the beginning of the Uruguay Round, average industrial-product tariffs in the
industrial countries were 4.1 percent, with an average tariff of 5.1 percent applied against
the exports of developing countries, and 3.9 percent against exports from industrial
countries (1996). In developing countries, the average tariff on industrial products was
18.8 percent, with a rate of 19.6 percent levied on exports from the industrial countries
and 13 percent against developing country exports. While the industrial countries had
bound tariffs covering 94 percent of their imports of industrial products, the developing
countries had bound only 13 percent (Abreu 1996). The large differences between
industrial and developing countries—and between products-- in the extent to which they
liberalized under the GATT system were the apparent causes of the big differences in
trade outcomes identified by Subramanian and Wei (2007).
The Uruguay Round brought agricultural trade back into the WTO system. While
many agricultural commitments were at levels substantially above existing applied rates,
such bindings may have much greater value than first appears, by restraining both
subsequent increases in protection, and volatility in protection rates. The Uruguay Round
saw a major shift in the role of developing countries, with developing countries making
commitments that would lower their applied tariffs on industrial products by an estimated
25 percent, and increase the coverage of their tariff bindings from 13 to 61 percent
(Abreu 1996). A major demand of the industrial countries in the Doha agenda
negotiations has been further deepening of developing country commitments to liberalize.
After the Uruguay Round, there also appear to have been some significant
changes in the operation of the accession process (Martin 2007). Prior to the Uruguay
Round, many countries that acceded to the GATT after becoming independent were not
6
required to make any changes in their trade policies. Existing members were also
constrained in seeking concessions from potential members since, if they engaged in
bilateral negotiations, they would be unable to threaten to invoke non-application of the
agreement. The fact that informal membership was abolished as an option, and the much
greater enthusiasm for membership in the multilateral trading system in general, greatly
strengthened the hand of the existing members relative to new members. The incumbent
members have generally used this greater strength to seek more liberalization from
membership candidates—something which is politically challenging to the candidates,
but likely economically beneficial. While they have sometimes also used this power to
protect themselves, as in the case of safeguards against China, there has not been large-
scale use of non-application as there was with Japan’s accession to GATT.
One possible asymmetry in the effect of GATT/WTO on trade might involve the
nature of the growth path of exports. Countries whose exports grow and transform rapidly
are more likely to generate political resistance from established interest groups. It may be
that GATT/WTO membership, whose rules place restrictions on the extent to which
countries can restrict the exports of dynamic exporters, are more useful to rapidly-
growing exporters than to those growing at a more leisurely pace. It seems possible that
WTO membership might, in this sense, be more useful to dynamic exporters such as
many of those in East Asia, than to those in other parts of the world whose exports have
not been growing at the same pace.
This brief survey of the activities of the GATT/WTO suggests that we should
probably expect sizeable effects of this system on trade and growth outcomes since the
1960s, more than in earlier periods. It also suggests a likely pattern of greater trade
liberalization under the aegis of the GATT/WTO in industrial countries relative to
developing countries. But there is also a possibility that the GATT/WTO rules have been
of greater value to more dynamic exporters, many of whom have been concentrated in the
Asia-Pacific.
III. Econometric Evidence on the Impact of the GATT/WTO on Trade
7
A popular approach to assessing whether the GATT/WTO system has expanded trade
uses the ―gravity model‖ to assess empirically the effect of GATT/WTO membership or
participation on the countries trade, trade barriers or the variability of trade (see, for
example, Rose (2004a;2004b;2005); Subramanian and Wei (2007); and Tomz, Goldstein
and Rivers (2007). This literature was initiated by Rose (2004a) with the surprising (to
many) finding that the GATT/WTO had, on average, no significant effect on the trade of
its members, except through preferences granted under the Generalized System of
Preferences (GSP). In related papers, Rose (2004b;2005) examined whether GATT/WTO
members had more liberal trade policies, and whether WTO membership affected the
variability of trade outcomes. In all cases, he found a negative conclusion—that WTO
membership did not significantly contribute to these intended goals.
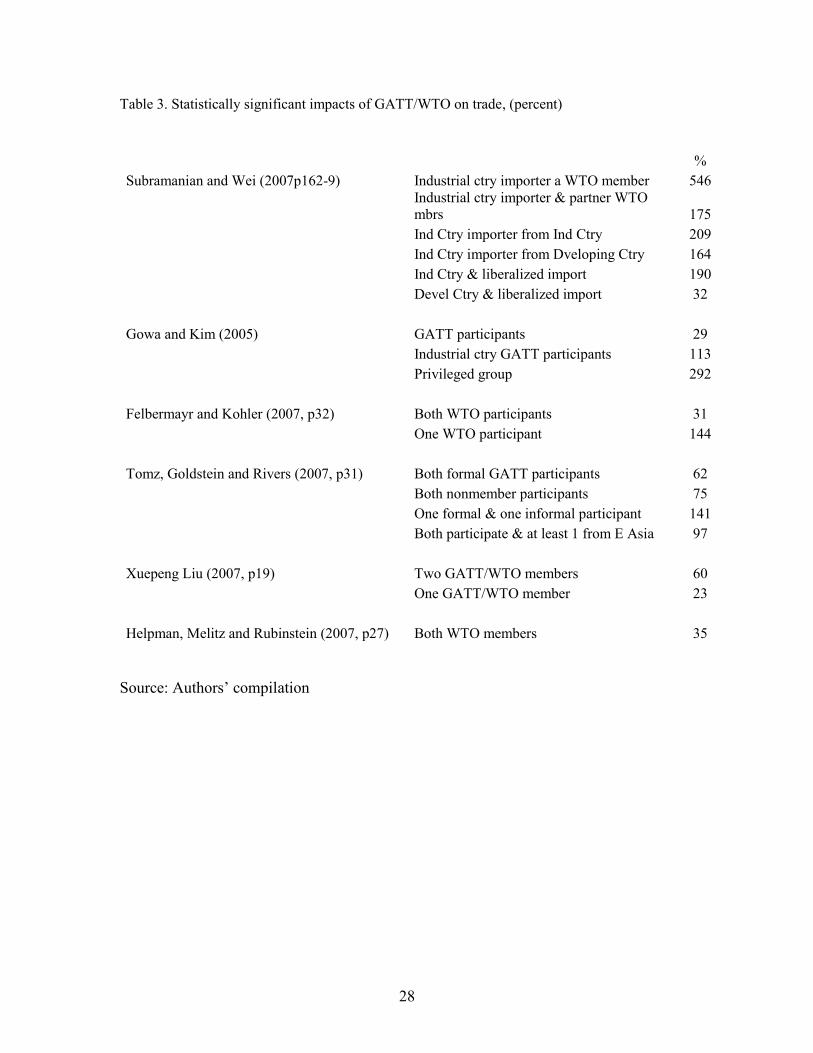
Rose’s provocative and challenging work stimulated a range of studies, many of
which found significant impacts of the GATT/WTO on trade. The estimated significant
impacts on imports or trade obtained in these studies are presented in Table 3.
Subramanian and Wei (2007) re-examined Rose’s finding using import data,
rather than the total trade estimates favored by Rose and distinguishing between
industrial and developing countries, and between products. They found that the industrial
countries that participated more actively than developing countries in reciprocal trade
negotiations experienced large gains in their trade. For industrial-country members of the
WTO, they concluded that imports were over five times higher than for non-members,
and that this estimate is strongly statistically significant. By contrast, they concluded that
the imports of developing country members are significantly smaller. Like Rose, they
conclude that industrial countries granting GSP preferences increase their imports from
preference-receiving countries substantially—although the dummy variable used for this
analysis does not seem to take into account the range of products on which these
preferences are granted.
Subramanian and Wei also investigated differences in the sectoral coverage of
WTO liberalization. For the range of industrial products that have been subject to
liberalization—defined as beginning with a tariff of over 5 percent in 1989 and ending
with a zero tariff—they found that imports into industrial country WTO members
increased very substantially and significantly (by 190 percent, with a t-statistic of more
8
than six). The expansion in imports of these products from developing country exporters
was 32 percent, with a t statistic of 2.7. By contrast, for clothing, footwear and food, the
WTO membership dummies were either negative or insignificant. Finally, they examined
whether new members of the system had increased their trade more than older members.
With a cutoff date of 1990, they found significant positive impacts.
Tomz, Goldstein and Rivers (2007) took a very different approach to the
definition of GATT participation. They noted that, in the GATT era (1947-1994), many
customs territories were covered by the GATT system even though they were not formal
members. In some cases, this was because they were colonies or overseas territories.
Other economies were informal participants. While these participants did not engage in
exchanges of market access during negotiations, they would have benefited from aspects
of the multilateral trading system such as Most-Favored-Nation (MFN) treatment. With
the scope of participation in the GATT/WTO system broadened in this way, they found
that GATT/WTO participation substantially increased trade (by 71 percent in their
benchmark case).
Gowa and Kim (2005) use the same broader definition of GATT participation as
Tomz, Goldstein and Rivers and focused on the 1950-1994 period, with comparisons to
trade in the period between World Wars I and II. Like Subramanian and Wei, they used
import data from the IMF’s Direction of Trade, rather than the total trade measures used
by Rose (2004a). Like Tomz, Goldstein and Rivers, they found that GATT participation
by both members of a bilateral trading relationship increased trade—by around 29
percent. However, the industrial country members of GATT benefited much more—by
113 percent on average. And the ―privileged group‖ consisting of Britain, Canada,
France, Germany, and the United States that were the major trading partners of the
founders of the GATT, the United States and Britain benefited by an estimated 292
percent in their trade as a result of the GATT.
All of the studies reviewed thus far took the traditional gravity model approach of
focusing on non-zero trade flows. A number of recent studies have taken into account the
fact that very large fractions of trade flows are frequently zero, and that so-called
extensive-margin growth associated with new trade flows may be an important dimension
of trade growth.
9
Felbermayr and Kohler (2006;2007) focus on the extensive margin of trade
growth. They note (2006, p656) that, even in 1997, only 58 percent of total trade
relationships involved positive levels of trade. In their 2006 paper, they show that
omitting cases with zero trade results in downward-biased estimators of the impact of the
WTO on trade and their numerical estimates suggest this effect may be very large (2006,
p670). Like Rose (2004a), they use average trade in both directions, formed by dividing
all four potential trade flows for each bilateral pair of countries by four. They argue for
this on the grounds that it avoids upward bias in trade values for distant country pairs
resulting from inclusion of the cif-fob margin in the value of reported imports. In
Felbermayr and Kohler (2007) the focus is on the effect of the WTO on trade. Using a
combination of a Probit model for the decision on whether to trade at all and a Tobit
model to predict the level of trade, they find that, when both countries are WTO members,
their trade is 31 percent higher than it would otherwise be (p.20). A surprising feature of
their results is that the effects of GATT participation are greater when one economy is a
member than when both are members.
Xuepeng Liu (2007) also focuses on the extensive margin of trade growth over
the period from 1948 to 2003, with a dataset designed to allow tracking of the extensive,
as well as the intensive, margin of trade growth. Like Rose, he uses official membership
of the GATT/WTO, rather than the broader concept of participation favored by Tomz,
Goldstein and Waters. Following Santos Silva and Tenreyro (2006) he estimates in levels
to avoid the need to delete or arbitrarily adjust the zero trade values prior to estimation.
He uses the Poisson Pseudo-Maximum Likelihood estimation technique which Santos
Silva and Tenreyro show is much more robust to problems of bias resulting from
heteroscedasticity in nonlinear models such as the gravity model. He concludes that
GATT/WTO membership increased trade between members by 60 percent and between
one member and another by 23 percent.
Although it was not the focus of their study, Helpman, Melitz and Rubinstein
(2007) included a WTO membership dummy in their widely-cited study of extensive and
intensive margin trade growth. They conclude that, when both partners are WTO
members, trade is 35 percent higher than it otherwise would be. A key innovation of their
study is a two-step estimator that takes into account not only the distinction between zero
10
and non-zero trade flows. It extends the Heckman (1979) estimator that is designed to
deal with sample-selection problems to include an extensive margin in which increasing
numbers of firms participate in trade.
The estimated impacts of GATT/WTO on bilateral trade presented in Table 2
show the wide range of results that have been obtained in those cases where significant
coefficients have been obtained. Where a generalized WTO effect has been estimated,
without distinction by country group or commodity, the coefficients tend to be between
30 and 60 percent. Some results outside this range, such as the finding by Felbermayr and
Kohler (2007) of a larger coefficient where only one member is a GATT participant seem
surprising even to their authors. However, the higher estimates for particular sub-
categories, such as industrial country WTO members or the Gowa and Kim ―privileged
group‖, or East Asian WTO members, seem plausible given what we know about the way
the GATT/WTO have operated.
We remain concerned about some potentially important aspects of the estimation
procedures used in current studies— and particularly the problem of sample selection
bias and the approaches used to deal with it. The omission of the zero trade values has
been known since Tobin’s (1958) classic paper to result in potentially serious bias
because of sample selection. Santos Silva and Tenreyro (2006) identify a potentially very
serious problem of bias resulting from heteroscedasticity in nonlinear models such as the
gravity model. The Poisson Pseudo-Maximum likelihood (PPML) estimator as a potential
solution to this problem, appears to be robust to the heteroscedasticity problem in their
Monte-Carlo simulations. However, as noted in Martin and Pham (2007) these
simulations include no true zero values. While the PPML estimator appears to perform
extraordinarily well in dealing with the problems of bias created by heteroscedasticity
and model nonlinearity, its performance in dealing with limited-dependent variable
problems appears to need further investigation. Heckman-type estimators appear to
perform much better than alternative estimators as long as exclusion restrictions are
available.
While the Poisson estimator seems likely to play a very important role in other
nonlinear applications such as production functions, it is less clear that it is suited to
dealing with the endemic zero problems in estimation of the gravity model. Martin and
11
Pham find that the PPML estimator can be subject to serious bias when a sizeable
fraction (say 40 or 50 percent of the sample) consists of zero observations. Martin and
Pham find that estimators designed specifically to deal with the problem of sample
selection are less subject to bias in these cases. In our empirical analysis, we therefore
include two estimators designed to deal with the problem of sample selection bias.
IV. The Benefits of GATT/WTO Membership in the Asia-Pacific
To the best of our knowledge, the only study to date that includes tests for differences in
GATT/WTO effects between regions is Rose (2004a, p107), which reports a positive and
marginally significant effect for South Asia, and no significant effect for East Asia.
Given the focus of this paper on the Asia-Pacific region of interest to PAFTAD, we
decided to re-investigate the importance of GATT/WTO for the region.
In our empirical analysis, we use the Subramanian and Wei (2007) dataset, kindly
supplied by the authors through their web site. This dataset has advantages because it
covers the long period from 1950 to 2000, in five year intervals. Further, it contains a
substantial share of zero trade values, unlike the datasets used by Rose and by Tomz,
Goldstein and Rivers. We follow Anderson and van Wincoop (2003) in using country and
time fixed effects, and hence omitting all single-country variables such as GDP,
population and area. We consider a set of PAFTAD countries3 that captures some of the
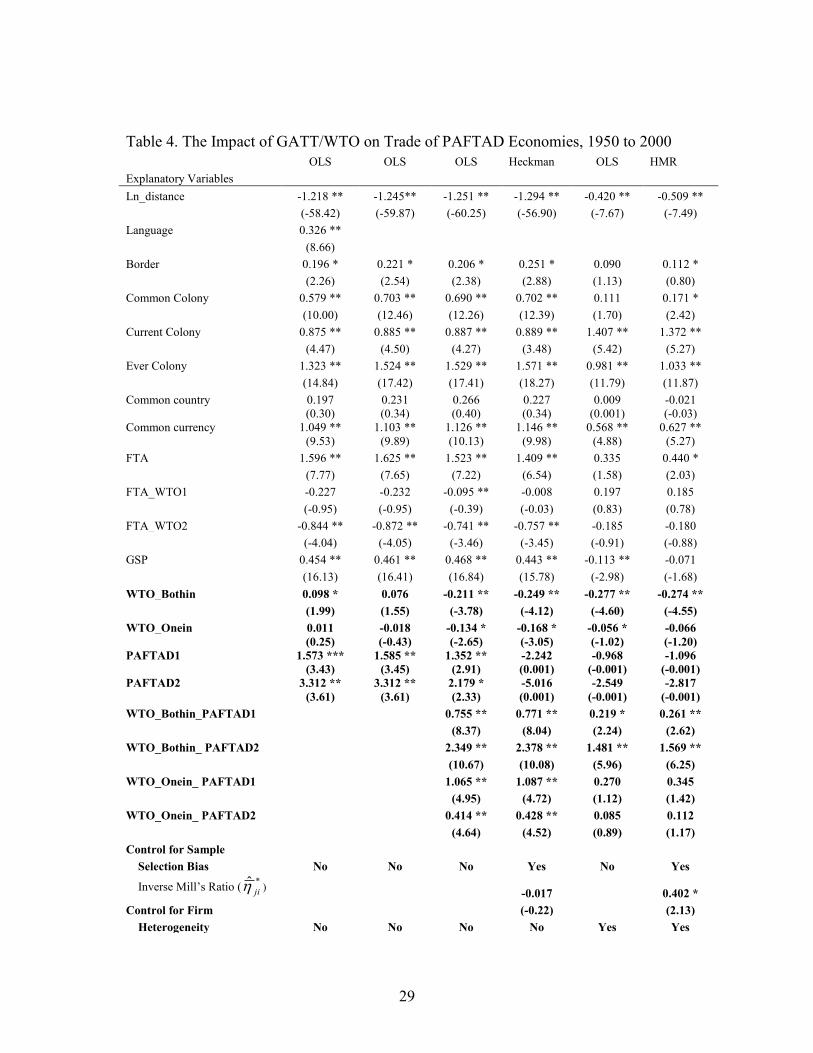
countries of greatest interest to the region. The results of the analysis are presented in
Table 4. Since the analysis closely follows Subramanian and Wei (2007), our discussion
focuses on the policy variables related to GATT/WTO.
The first three columns of results in Table 4 use the standard OLS estimator,
ignoring the presence of zero-trade observations. The fourth column uses the Heckman
(1979) two-step estimator estimator, which deals with bias resulting from sample-
selection problems by adding an additional variable—the inverse Mills ratio. The fifth
and sixth columns are based on the Helpman, Melitz and Rubinstein (2007) approach to
3 The countries included are Australia, Canada, Cambodia, Chile, China, Indonesia, Hong Kong, Japan, Republic of Korea, Laos, Malaysia, Mexico, Myanmar, Papua New Guinea, Peru, Philippines, Singapore, Thailand, United States and Vietnam
12
estimation, which adjusts for the number of firms that will export (which takes into
account potential gains from increased variety) as well as the probability of non-zero
exports. In the sixth column, the standard Inverse Mills ratio is found to be implausible in
magnitude so it is dropped in light of the evidence from Helpman, Melitz and Robinstein
(2007) that this variable is less important than the export variety effect. On balance,
columns (5) and (6) are our preferred equations, although we will consider results from
all specifications.
If we focus on the WTO-related variables, we see that the dummy variables for
WTO membership (WTO_Onein and WTO_Bothin) are economically and/or statistically
insignificant in the OLS equations. This essentially confirms the findings of Rose (2004a)
and Subramanian and Wei (2007) that generalized WTO variables have little explanatory
power. The dummy variables for the PAFTAD region are, by contrast, extremely—in fact,
implausibly—large and statistically significant. The results in the second column imply
that trade between two countries that are both in the PAFTAD group is over 25 times
larger than it would otherwise be. When we introduce the interaction terms for PAFTAD
and the WTO, the coefficients on the PAFTAD variables decline. The interaction terms
are large and strongly significant, with t-statistics of around 10 for the interaction
between WTO and PAFTAD membership by both members of a bilateral trading pair. In
the fifth column, with product variety taken into account, the coefficients on the regional
dummies, as well as the WTO dummies, become insignificant. It is noteworthy that the
coefficient estimate on the bilateral distance is substantially reduced but remains
statistically significant, which is in line with the results found by Helpman, Melitz and
Rubeinstein. What remains extremely important, and highly significant, is the interaction
term between WTO and regional membership, which increases trade by a factor of four
for countries falling into both categories. This suggests that WTO membership may have
helped facilitate the rapid growth of trade in the Asia-Pacific region.
V. Prospects for WTO Disciplining Growth in Protection: The Case of Agriculture
Standard approaches to the evaluation of WTO agreements begin by assessing the applied
rate of protection in place before the agreement. They then examine the commitments,
13
such as tariff bindings, made under the agreement. Where these commitments are below
the initially applied rates it is assumed the applied rates will be reduced to respect the
commitments. After comparing the bound and applied tariffs at the finest possible level
of product disaggregation, the tariffs are aggregated to the level feasible in quantitative
analysis.
This approach seems a substantial improvement over the simpler approach widely
used in earlier evaluations of trade reforms (see, for example, Brandão and Martin 1993),
and still used in studies such as Polaski (2006), where the stylized nature of the tariff
reduction is captured in a measure such as a 36 percent cut in applied tariff rates. While
policy agreements are sometimes described in simplified terms such as this, the actual
impact on applied tariffs is likely to be quite different from the description when the
details of the agreement are taken into account (see Hathaway and Ingco 1995). Now that
data on applied tariffs and bindings are available on an ad valorem basis for standardized
commodities at the six-digit level of the Harmonized System, we can take into account a
great deal of information that was ignored in earlier studies. This broad approach was
used in Anderson and Martin (2006), and is now incorporated in the tariff analysis feature
of software programs such as WITS (www.wits.worldbank.org).
A key challenge for this type of analysis has to do with the counterfactual. What
would applied tariffs have been in the absence of the agreement? Since it is agriculture
that seems most resistant to reform, and where there are indications that protection is
potentially increasing rather than declining, we focus on it in the rest of this section.
There are two particularly interesting cases for analysis of agricultural trade reforms. The
first is the short-run impact of the tariff reductions on variables such as agricultural
output, trade levels and farm incomes. The second is the long term consequences of these
commitments.
The standard approach to specifying the counterfactual level of protection is
appropriate for short-run analysis, although there is frequently some ambiguity.
Ianchovichina and Martin (2004) for instance, assume that most of the tariff reductions
associated with China’s accession to the WTO were actually undertaken before China
joined the WTO, as China sought to establish her bona fides for the market-oriented
WTO system. A similar ambiguity arises in analyses of the Doha negotiations with
14
Europe’s pre-announced liberalization of agricultural trade policies. Should such policies
be treated as part of the counterfactual, even though they are not locked in through WTO
commitments and hence are potentially reversible?
For analyses of longer-run impacts, the specification of the counterfactual is even
more challenging. We know that the appropriate counterfactual depends on secular
changes in both the level of protection of the type analyzed by Anderson, Hayami and
others (1986) and in the variability of that protection over time (Francois and Martin
2004). It also depends on the important questions raised in recent research by Melitz
(2003) and Kehoe and Ruhl (2003): to what extent would a more liberal regime result in
growth of exports and imports at the extensive margin—that is through the emergence of
new varieties and new products—as distinct from through increases in the quantities of
goods initially traded?
In the case of China’s accession to the WTO, it is particularly important to
recognize that, prior to accession to WTO, most of the important agricultural trade
barriers in China were implemented through measures such as state trading, import and
export quotas and licenses, rather than through trade taxes (Ianchovichina and Martin
2004). Tariff rates for imports of many commodities were high, while the protection
actually delivered appears to have been very low or negative for many of these
commodities (Huang, Liu, Martin and Rozelle 2007). Studies such as that by
Schmidhuber (2001), which use initial applied tariff rates, tend to overstate the short-run
impact of liberalization by overstating the amount of protection actually delivered to
domestic producers. In this section, we draw on new estimates of protection actually
delivered to producers and consumers in 2004, as provided by Huang, Liu, Martin and
Rozelle (2008) for the major project on agricultural distortions led by Kym Anderson.
In the long run, however, there is a risk that our standard approach to welfare
evaluation may understate the benefits of reform. In the absence of commitments such as
those China made under the WTO, it seems reasonable from the experience of other East
Asian economies to assume that farm protection might have risen substantially for the
political-economy reasons discussed in Anderson, Hayami and others (1986) and
Anderson (1995). It also seems likely that this protection would have varied more from
year to year, potentially increasing the cost of protection by a substantial margin
15
(Francois and Martin 2004). Further, the more liberal approach embodied under the WTO
is likely to result in an expansion in the range of products traded (Melitz 2003).
Our empirical focus here is on the first of these weaknesses in the standard
approach, although we address also the other two in a less formal manner. To do this, we
take advantage of new assessments of levels and trends in agricultural protection in China
and other East Asian economies emerging from a new World Bank project on global
agricultural distortions (Anderson 2008). The estimates for the higher-income East Asian
countries update and expand on earlier estimates of agricultural protection in the region
(Anderson, Hayami and Others 1986), and estimates for the other 80 countries included
in that project allow us to put it in a broader context. New estimates from that project for
China (Huang, Liu, Martin and Rozelle 2007) allow us to examine the stance of China’s
agricultural policies back to the early 1980s, when China’s current generation of farmers
first became thoroughly responsive to market prices.
China’s agricultural protection in international context
There have been substantial changes in China’s agricultural distortions since the early
1980s, with most of these changes reducing the earlier disprotection facing farmers. The
changes have included reductions in taxation on exported products, reductions in
protection to import-competing goods, and reductions in the taxation of farmers imposed
through the procurement system. Much of the experience of China has been very specific
to the national context of reform and appears very different from the evolution of policy
in other East Asian countries. There are, for instance, major differences in the way that
key policies have been used. The parallels between China’s policies and those of
neighboring economies seem limited on issues like the use and abolition of the commune
system; the introduction of the household responsibility system; the use and abolition of
procurement quotas; and the importance of state trading. Another major difference has
been in policies to promote technical change and changes in the composition of exports,
which have allowed China to maintain the growth of agricultural output and to avoid
dramatic increases in the import volume of key products such as grains.
The direct impact of agricultural policies on farmer incentives was very negative
when the reforms began but has diminished over the past 25 years. Another important

16
influence on the incentive environment for China’s agriculture is protection to the non-
agricultural sector. Protection to non-agricultural sectors imposes an implicit tax on the
agricultural sector by competing resources away from agriculture. As part of the process
of WTO accession, protection rates to both agriculture and manufacturing were reduced
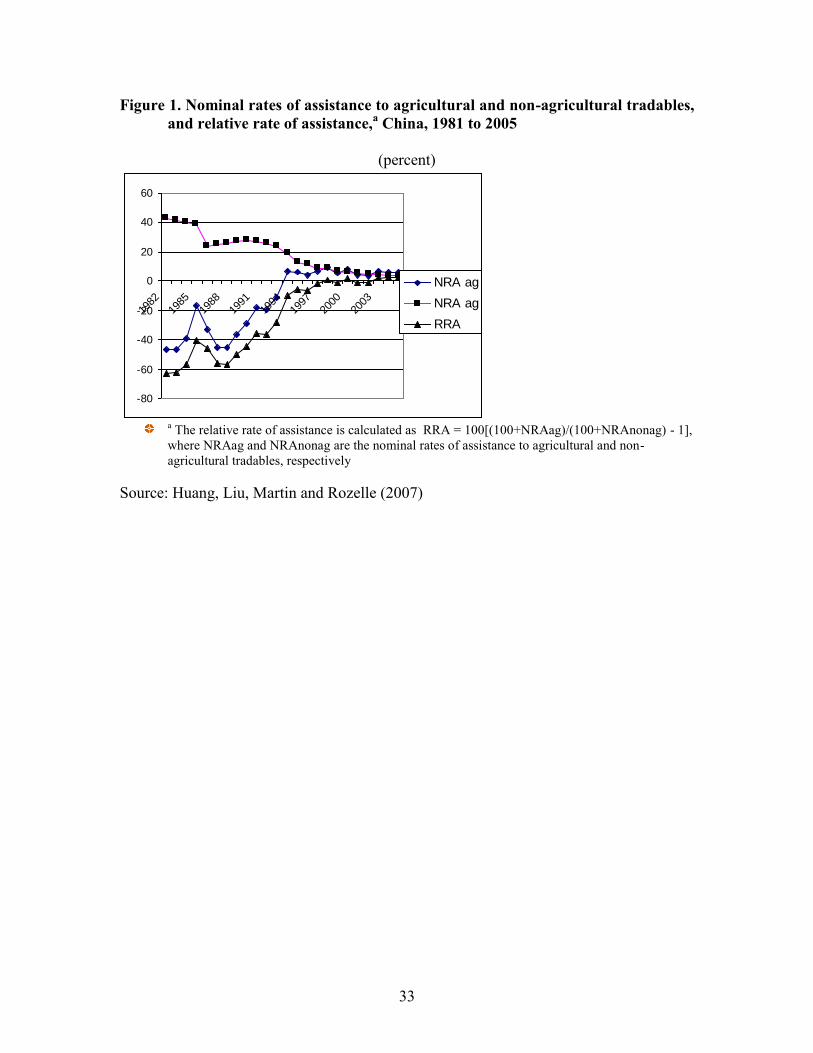
substantially, and these reductions were locked-in through tariff bindings. The relative
rate of assistance (RRA), depicted in Figure 1, provides a simple summary measure
combining the effects of direct and indirect incentives. From the Figure, it is clear that the
combined effect of reductions in direct taxation and indirect taxation through protection
to other sectors outweighed the effect of reductions in protection to protected agricultural
sectors in the late 1990s and early 2000s, and improved the overall incentives for
agricultural production in China.
Despite the differences between China’s situation and that of her neighbors, there
are also important similarities. As noted by Anderson, Hayami and Others (1986) and by
Lindert (1991), the political economy of trade policy tends to change in similar ways as
countries develop. In countries as poor as China was in 1981, urban consumers care a
great deal about the price of food and relatively well organized (Pinstrup-Andersen 1988).
Farmers by contrast, are numerous but poorly organized. They also tend to be
subsistence-oriented, selling only a relatively small share of their output in the market.
Agricultural products tend to be exports, and hence easily taxed through direct border
taxes or, as in the case of China, through state trading enterprises. The result tends to be a
policy of taxation of agriculture of the type evident in our earlier discussion of China.
Historically, import substitution policies and exchange rate distortions have resulted in
protection of the non-agricultural sector, and hence additional, indirect taxation of
agriculture.
As economies develop and incomes grow, many of these elements change. Food
becomes a smaller share of the expenditure of urban people. As countries become more
urbanized, the urban community becomes more diverse in its interests and more difficult
to organize. Farmers become more commercial in orientation, selling a larger share of
their output in the market, which makes output prices more important to their real
incomes. Further, they tend to use more purchased intermediates, which increases the
leverage of an output price change on their net income. Finally, the share of the
17
population engaged in farming tends to decline, making farmers easier to organize.
Consistent with the theory of collection action (Olson 1971), commodities where
production is concentrated in particular regions or where processing networks lower the
cost of communication and organization are more likely to receive high rates of
protection.
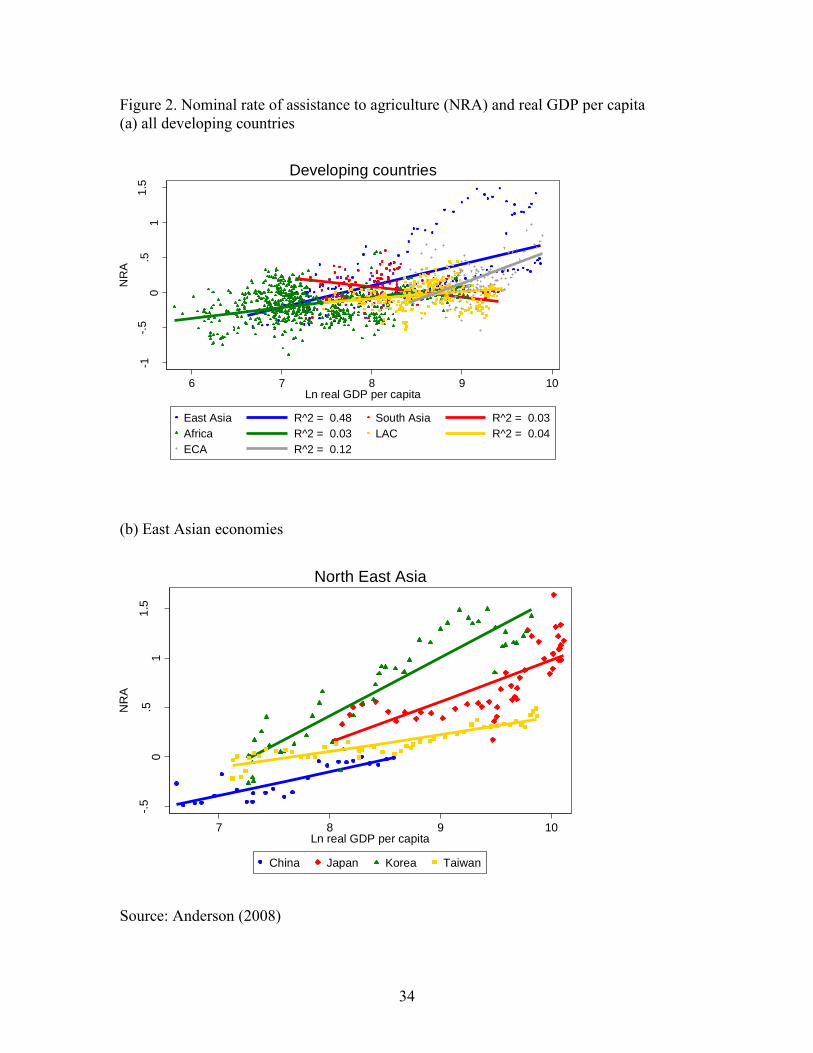
However, the relationship between incomes and agricultural protection rates is not
automatic, and appears to vary somewhat by region. Figure 2 plots the level of
agricultural protection against the log of the level of income for a wide range of countries.
The tendency for protection rates to increase with rising incomes is strongest in East Asia,
particularly Northeast Asia, perhaps partly because the sample contains countries which
have achieved relatively high levels of income, and partly because these economies have
relatively limited agricultural endowments and hence concerns about self-sufficiency in
key food products. What is clear from Figure 2(b) is that, despite China’s very different
political history, its pattern of protection is consistent with that of the other North-East
Asian economies, including – like the Republic of Korea and Taiwan (China) – a phase
of negative protection and a rising trend.4
To the extent that there are common factors driving the evolution of agricultural
protection in the four economies depicted in Figure 2(b), a key difference is the point at
which WTO disciplines began to affect agricultural protection levels. In Japan, protection
had grown seemingly without limit during its period of high economic growth, and only
towards the end of the sample is there a suggestion of a slowdown in the rate of growth.
In Korea, protection rates appear to have begun to plateau in the latter years, possibly
under the influence of the relatively mild WTO disciplines to which Korea was subject as
a member of the WTO. In China and Taiwan (China), the WTO disciplines negotiated at
accession contributed—as discussed above and in Ianchovichina and Martin (2004)—to
reducing protection to some degree. But more importantly in view of Figure 2, they have
introduced disciplines on future increases in protection in China.
There do not appear to be any respectable efficiency arguments for such
protection. One distributional argument is that agricultural protection increases in the
4 Results in Anderson, Hayami and Others (1986) point to a phase of negative protection in Japan at a much earlier stage. For a theoretical analysis as to why it should not be surprising for China’s polity to follow this path, see Shea 2006).
18
early stages of development partly in response to an emerging gap between rural and
urban incomes during the course of rural development (Hayami 2007), but protection is
inferior to many policy options that target directly such income differentials. Further, the
observed pattern of protection has the undesirable feature of taxing farmers in poor
countries, where their incomes are low relative to the rest of the economy, and
subsidizing them in rich countries, where the income and wealth levels of farmers are
frequently above national average levels (Gardner and Sumner 2007).
Re-assessing the longer term impact of WTO accession
In the light of Figure 2(b), the question arises as to how valuable WTO accession
commitments are in limiting China’s protection growth. When Japan joined the GATT in
1955, and Korea in 1967, few commitments to limit agricultural protection were made by
new members. Japan’s and Korea’s average nominal rates of agricultural protection at the
time of joining have been estimated recently to be 17 percent and 8 percent, respectively,
compared with more than 100 percent today (Hayami and Honma 2007). China’s average
agricultural protection at the time it joined in late 2001 was even closer to zero (Figure 1).
In assessing the impact of WTO accession on China’s agriculture, to what extent should
analysts take into account that binding its tariffs and subsidies at low levels potentially
foregoes the losses that would have occurred had there been no such bindings?
To obtain a better idea of the longer-run benefits of WTO accession, what is
needed is to project the rates of protection that might have prevailed in the absence of
WTO accession into the future (based on the estimates underlying Figure 2), and then to
evaluate the effects of lowering this protection to actual post-WTO rates through that
time period and discounting those increasing benefits back to the present.
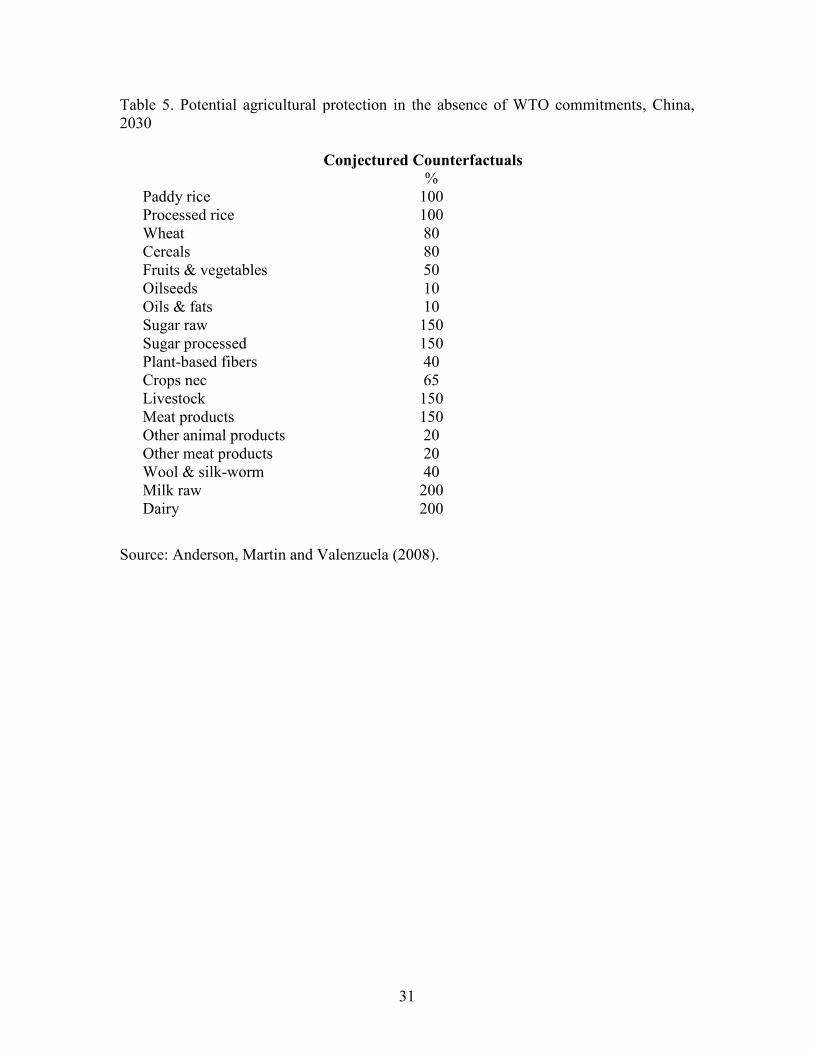
To make an initial assessment of the potential longer-term, advantages of China’s
WTO commitments, we begin by examining a scenario under which China’s protection
rates grow over the period to 2030 in a manner consistent with the international
experience. Based on this evidence, we estimate a potential configuration of protection
rates in the absence of the WTO agreement. These estimates are presented in Table 5.
These estimates tend to be higher in products such as dairy products, where China does
not have a comparative advantage, and where farmers are likely to become well
19
organized. They are also quite high on products such as livestock products, in line with
the experience of other North East Asian economies, even though China currently has a
strong comparative advantage in the more labor-abundant agricultural commodities.
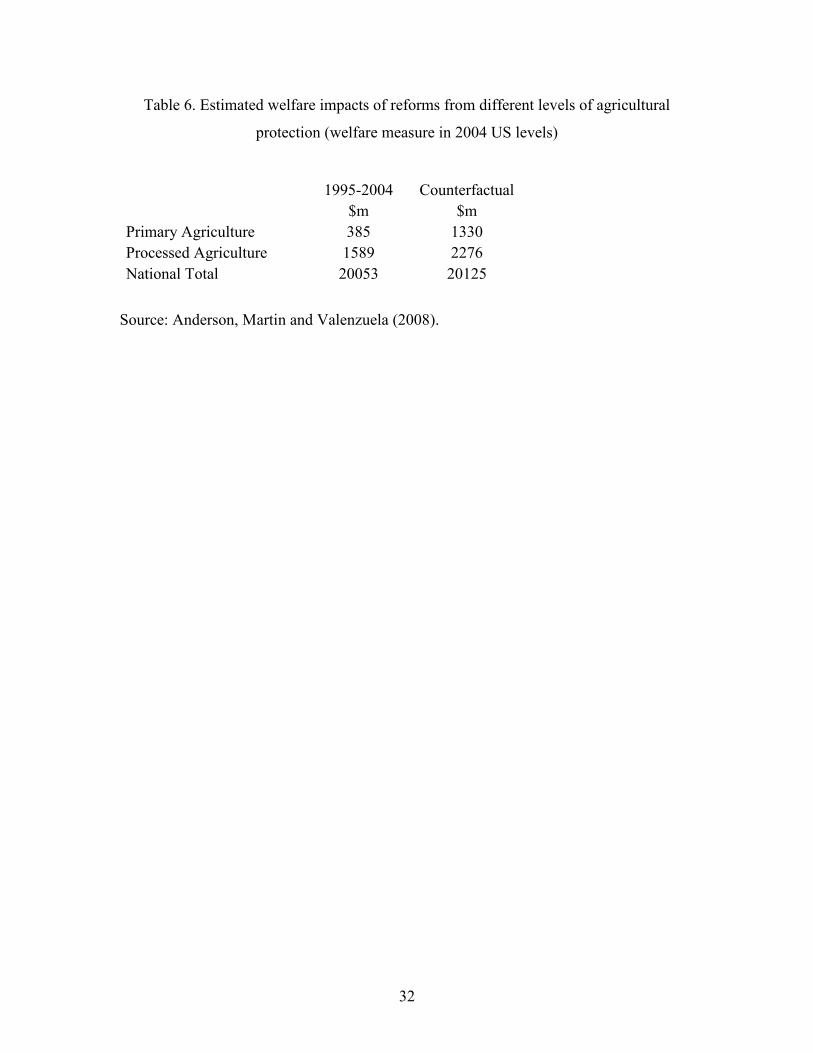
To gain a rough idea of the implications of agricultural trade reform we
considered two simple scenarios using the GTAP model of the global economy.5 In the
first of these simulations, we examined the implications of China’s reforms between
1995—the start of the serious liberalization in preparation for WTO accession—and 2004,
when trade policy for agriculture reached a much more liberal stance. From this point, we
considered the impact of raising protection to the levels postulated in Table 5. This gives
us two very crude estimates of the value of agricultural liberalization—one from an
historical benchmark dataset, and another from a counterfactual level of protection based
on projected future trends in protection. The results for economic welfare are presented
in Table 6.
From Table 6, it appears that the contribution of agricultural trade reform to the
overall welfare gain between 1995 and 2004 was relatively small. Agricultural
liberalization accounted for under 10 percent of the total gains from the entire package of
reforms in agriculture and non-agricultural tariffs. This reflects, in part, the small share of
trade in China’s agriculture, and its relatively small share in output, if not in employment.
When we consider the situation from the counterfactual identified in Table 5, the
importance of agricultural trade reform increases very substantially. In this situation,
close to 20 percent of the gains from trade reform come from reducing agricultural trade
distortions.
It is important to recall that the snapshot of protection in Table 5 would likely be
part of a secular change in the pattern of protection. If the pattern observed in other
countries were to be followed in China, then protection rates could go considerably
higher than indicated in Table 5. In this case, the costs of protection are likely to rise even
more rapidly, given that the cost of protection rises with the square of the rate of
protection. As shown in Table 5, we project that the cost of protection to primary
agriculture would increase by a factor of 3.5 with protection rising from its 1995-2004
5 We double the Armington elasticities to capture the long run nature of changes in protection.
20
counterfactual to our projected rates for 2030, while the cost for processed agriculture
would rise by a factor of one and a half.
The true costs of protection to agricultural staples are larger than they appear
because so much of it is provided in forms that create variations in protection over time.
As shown by (Francois and Martin 2007), changes in the square of the rate of protection,
or in the intertemporal variance of protection, have equiproportionate impacts on the cost
of protection. If we adjusted the cost of protection to primary agriculture for this factor as
well, the increase in the cost from the original estimate would be almost five fold.
VI. Conclusion
In this study, we first noted the different roles of the GATT/WTO system: (i) to develop
and enforce rules, and (ii) to provide a forum for negotiations on reducing trade barriers.
We noted the large asymmetries in the use of the trade liberalization function between
industrial and developing countries, and the much greater ambition of more recent rounds
relative to earlier rounds. For the Asia-Pacific region, it seems likely that the provision of
trade rules is particularly important, since many countries in this region are growing
rapidly and changing their export mixes in ways that are inevitably seen as disruptive by
established traders.
We surveyed the evidence from the burgeoning literature that uses the gravity
model to assess the impacts of GATT/WTO on trade. While the initial study by Rose
(2004a) found no significant results, two subsequent types of studies have found positive
results. Studies such as Subramanian and Wei (2007) have found large gains in trade for
countries and products where there has been substantial liberalization. Tomz, Goldstein
and Rivers (2007) have found smaller, but still statistically significant, gains when the
definition of participation is broadened beyond formal GATT members to include those
who participated informally under the GATT.
In our empirical analysis, we used the Subramanian and Wei (2007) database to
investigate whether formal membership in the multilateral trading system had an effect
on trade in the Asia-Pacific region. We found, like Subramanian and Wei, that
GATT/WTO membership alone was not significant. When we included a dummy for
countries in the region covered by PAFTAD, we found that these countries traded much
21
more than other countries. But when we added an interaction term between GATT/WTO
membership and the PAFTAD dummy, we found a strongly significant and economically
large effect. This may suggest that membership in the multilateral system has been
particularly important in promoting the growth of trade in the Asia-Pacific region.
In the final section of our paper, we focused on a potential prospective source of
economic gains from WTO membership—the potential for ruling out the rapid growth in
agricultural protection frequently associated with rapid growth in developing countries.
To illustrate the potential importance of this phenomenon, we use a case study of China.
The recent study by Huang, Liu, Martin and Rozelle (2007) provides information
on the trends in protection in China’s agriculture, highlighting the fact that most parts of
the sector have traditionally been taxed, rather than supported by policy. Related work
drawing on the range of international experience in Anderson (2008) has examined some
of the key trends in protection. Based on this, we create a projection of protection to
agriculture in China in the absence of WTO commitments. Given the relatively low rates
of protection prevailing in 1995, we find that the welfare benefits of agricultural reform
contributed a relatively small part of the overall welfare gain during this period. If
protection to agriculture in the absence of WTO commitments would have followed an
upward path similar to that in neighboring countries, however, then the relative
importance of agricultural trade reform would increase considerably.
22
Reference List
Abreu,M. "Trade in manufactures: the outcome of the Uruguay Round and developing country interests." The Uruguay Round and the developing countries. W.Martin and L.A.Winters, eds., 59-87. Cambridge: Cambridge University Press, 1996.
Anderson, K. "Lobbying Incentives and the Pattern of Protection in Rich and Poor Countries", Economic Development and Cultural Change 43(1995): 401-23.
Anderson,K. (ed.) Distortions to Agricultural Incentives: Global Perspective, ed. K. Anderson, London: Palgrave Macmillan and Washington DC: World Bank 2008 (forthcoming).
Anderson, K.,Y.Hayami, and Others. 1986. The Political Economy of Agricultural
Protection: East Asia inInternational Perspective. Boston: Allen and Unwin.
Anderson, K. and W. Martin. eds. (2006), Agricultural Trade Reform and the Doha Development Agenda. Basingstoke and Washington DC: Palgrave Macmillan and the World Bank. .
Anderson,K., W.Martin and E.Valenzuela ―Long Run Implications of WTO Accession
for Agriculture in China‖ in China's Agricultural Trade: Issues and Prospects, eds. C. Carter and I. Sheldon, London: CABI, 2008 (forthcoming).
Anderson,J. and E.van Wincoop "Gravity with gravitas: a solution to the border puzzle." American Economic Review 93(2003): 170-92.
Baldwin, R. E. (1986), "Toward More Efficient Procedures for Multilateral Trade Negotiations."Aussenwirtschaft, 41(Heft II/III): 379–94.
Brandão, A. and W. Martin. "Implications of agricultural trade liberalization for the developing countries." Agricultural Economics 8(1993): 313-43.
Felbermayr,G. and W.Kohler "Exploring the intensive and extensive margins of world trade." Review of World Economics 142(2006): 642-74.
----- "Does WTO membership make a difference at the extensive margin of world trade." Unpublished, 2007.
Francois, J. and W. Martin. ―Commercial policy, bindings and market access‖. European Economic Review 48(2004): 665-79, June.
Gardner, B. and D. Sumner. 2007. ―U.S. Agricultural Policy Reform in 2007 and
Beyond‖. In B. Gardner and D. Sumner, eds. The 2007 Farm Bill and Beyond. American Enterprise Institute, Washington DC.
23
Gowa,J. and S.-Y.Kim "An exclusive country club: the effects of the GATT on trade,
1950-1994." World Politics 57(2005): 453-78.
Hathaway, D., and M. Ingco. 1996. "Agricultural Liberalization and the Uruguay Round." In W. Martin and L.A. Winters, eds. The Uruguay Round and the Developing Countries. New York: Cambridge University Press.
Hayami, Y. 2007. ―An emerging agricultural problem in high-performing Asian
economies‖. World Bank Policy Research Working Paper 4312. Hayami, Y. and M.Honma. 2008. Ch. 2 in Distortions to Agricultural Incentives:
GLobal Perspective, ed. K. Anderson, London: Palgrave Macmillan and Washington DC: World Bank 2008 (forthcoming).
Heckman,J. "Sample selection bias as a specification error." Econometrica 47(1979):
153-61.
Helpman,E., M.Melitz, and Y.Rubinstein "Estimating trade flows: trading partners and trading volumes." Unpublished, 2007.
Hoekman,B. and C.Ozden (eds.) Trade Preferences and Differential Treatment of
Developing Countries. London:Edward Elgar Publishers, 2006.
Huang,Y., Y.Liu, W.Martin and S.Rozelle "China", Ch. 3 in Distortions to Agricultural
Incentives: Asia, eds. K. Anderson and W. Martin, Washington DC: World Bank 2008 (forthcoming).
Ianchovichina,E. and W.Martin "Impacts of China's accession to the World Trade Organization." World Bank Economic Review 18(2004): 3-29.
Kehoe, T. and K.Ruhl. 2003. ―How important is the new goods margin in international trade?‖ Federal Reserve Bank of Minneapolis Staff Report 324.
Lindert, P. 1991. ―Agriculture and the State”. In P. Timmer, ed. Historical Patterns of
Agricultural Protection. Ithaca NY: Cornell University Press.
Liu, X. "GATT/WTO promotes trade strongly: sample selection and model specification." Unpublished, 2007.
Martin,W. "Some development implications of WTO accession." The WTO and Economic Welfare. Z.Drabek, ed. 2007.
Martin,W. and P.Messerlin "Why is it so difficult? Trade liberalization under the Doha Agenda." Oxford Review of Economic Policy 23(2007): 347-66.
24
Martin,W. and C.Pham "Estimating the gravity model when zero trade flows are important." Unpublished, 2007.
Melitz, M.. "The impact of trade on intra-industry reallocations and aggregate industry productivity." Econometrica 71(6) (2003):1695-1725.
OECD 2007. OECD Agricultural Policies at a Glance. Paris: Organization for Economic
Cooperation and Development. Olson, M. 1971. The Logic of Collective Action. Cambridge MA.: Harvard University
Press. Pinstrup-Andersen, P., ed. 1988. Food Subsidies in Developing Countries: Cost, Benefits,
and Policy Options. Baltimore: Johns Hopkins University Press. Polaski, S. 2006. Winners and Losers: Impact of the Doha Round on Developing
Countries. Washington DC: Carnegie Endowment for International Peace. Rose,A. "Do we really know that the WTO really increases trade?" American Economic
Review 94(2004a): 98-114.
----- "Do WTO members have more liberal trade policy?" Journal of International Economics 63(2004b): 209-35.
----- "Does the WTO make trade more stable?" Open Economies Review 16(2005): 7-22.
Santos Silva,J. and S.Tenreyro "The log of gravity." The Review of Economics and Statistics 88(2006): 641-58.
Schmidhuber, J. 2001. ―Changes in China’s Agricultural Trade Policy Regime: Impacts on Agricultural Production, Consumption, Prices, and Trade’, in Organization for Economic Co-operation and Development‖. China’s Agriculture in the International Trading System. Paris: OECD Proceedings. April.
Shea, E.Y.P. 2006. ―An optimization model of China’s dual-track grain procurement policy‖. mimeo. Hong Kong Polytechnic University, Honk Kong.
Subramanian,A. and S.-J.Wei "The WTO promotes trade, strongly but unevenly." Journal of International Economics 72(2007): 151-75.
Tobin,J. "Estimation of relationships for limited dependent variables." Econometrica 26(1958): 24-36.
25
Tomz,M., J.Goldstein, and D.Rivers "Membership has its privileges: the impact of the GATT on international trade." American Economic Review 97(2007): 2005-18.
Winters,L.A. "Coherence and the WTO." Oxford Review of Economic Policy 23(2007): 461-80.
*******
26
Table 1. Dates selected Asia-Pacific economies joined the multilateral trading system Australia (1948) Malaysia (1957) Bangladesh (1972) Mongolia (1997) Bhutan New Zealand (1948) Burma (Myanmar) (1948) Pakistan (1948) Cambodia (2004) Papua N. Guinea (1994) Canada (1948) Philippines (1979) China (2001) Samoa Fiji (1993) Singapore (1973) Hong Kong (1986) Solomon Islands (1994) India (1948) Sri Lanka (1948) Indonesia (1950) Thailand (1982) Japan (1955) Tonga (2007) Kiribati United States (1948) Korea, South (R) (1967) Vanuatu Lao People’s Dem. Rep. Vietnam (2007)
Source: www.wto.org
27
Table 2. Looking for a "productivity" indicator of the Rounds
Dates Length Tariff cuts Round Number of GATT Members (months) [1] "productivity" All [3] G77 [4] 1 2 3 4 [2] 5 6 Geneva-I 1947 8 26.0 39.0 19 7 Annecy 1949 8 3.0 4.5 20 8 Torquay 1950-51 8 4.0 6.0 33 13 Geneva-II 1955-56 16 3.0 2.3 35 14 Dillon 1960-61 10 4.0 4.8 40 19 Kennedy 1963-67 42 37.0 10.6 74 44 Tokyo 1974-79 74 33.0 5.4 84 51 Uruguay 1986-94 91 38.0 5.0 125 88 [1] Average cuts in bound tariffs. Sources: Preeg (1970) Baldwin (1986) WTO (1994) WTO (2007). Import-weighted tariff cuts of industrial countries for industrial products (petroleum excluded) . The five first figures refer to the average tariff cuts of the United States only. [2] Average tariff cut per year of negotiations. [3] GATT Members at the end year of the negotiations (Source: WTO website). [4] G77 membership is taken as a proxy for defining "developing" GATT Members. Source: Martin and Messerlin (2007).
28
Table 3. Statistically significant impacts of GATT/WTO on trade, (percent)
% Subramanian and Wei (2007p162-9) Industrial ctry importer a WTO member 546
Industrial ctry importer & partner WTO mbrs 175
Ind Ctry importer from Ind Ctry 209 Ind Ctry importer from Dveloping Ctry 164 Ind Ctry & liberalized import 190 Devel Ctry & liberalized import 32 Gowa and Kim (2005) GATT participants 29 Industrial ctry GATT participants 113 Privileged group 292 Felbermayr and Kohler (2007, p32) Both WTO participants 31 One WTO participant 144 Tomz, Goldstein and Rivers (2007, p31) Both formal GATT participants 62 Both nonmember participants 75 One formal & one informal participant 141 Both participate & at least 1 from E Asia 97 Xuepeng Liu (2007, p19) Two GATT/WTO members 60 One GATT/WTO member 23 Helpman, Melitz and Rubinstein (2007, p27) Both WTO members 35
Source: Authors’ compilation
29
Table 4. The Impact of GATT/WTO on Trade of PAFTAD Economies, 1950 to 2000 OLS OLS OLS Heckman OLS HMR Explanatory Variables Ln_distance -1.218 ** -1.245** -1.251 ** -1.294 ** -0.420 ** -0.509 ** (-58.42) (-59.87) (-60.25) (-56.90) (-7.67) (-7.49) Language 0.326 ** (8.66) Border 0.196 * 0.221 * 0.206 * 0.251 * 0.090 0.112 * (2.26) (2.54) (2.38) (2.88) (1.13) (0.80) Common Colony 0.579 ** 0.703 ** 0.690 ** 0.702 ** 0.111 0.171 * (10.00) (12.46) (12.26) (12.39) (1.70) (2.42) Current Colony 0.875 ** 0.885 ** 0.887 ** 0.889 ** 1.407 ** 1.372 ** (4.47) (4.50) (4.27) (3.48) (5.42) (5.27) Ever Colony 1.323 ** 1.524 ** 1.529 ** 1.571 ** 0.981 ** 1.033 ** (14.84) (17.42) (17.41) (18.27) (11.79) (11.87) Common country 0.197 0.231 0.266 0.227 0.009 -0.021 Common currency
(0.30) 1.049 **
(9.53)
(0.34) 1.103 **
(9.89)
(0.40) 1.126 ** (10.13)
(0.34) 1.146 **
(9.98)
(0.001) 0.568 **
(4.88)
(-0.03) 0.627 **
(5.27) FTA 1.596 ** 1.625 ** 1.523 ** 1.409 ** 0.335 0.440 * (7.77) (7.65) (7.22) (6.54) (1.58) (2.03) FTA_WTO1 -0.227 -0.232 -0.095 ** -0.008 0.197 0.185 (-0.95) (-0.95) (-0.39) (-0.03) (0.83) (0.78) FTA_WTO2 -0.844 ** -0.872 ** -0.741 ** -0.757 ** -0.185 -0.180 (-4.04) (-4.05) (-3.46) (-3.45) (-0.91) (-0.88) GSP 0.454 ** 0.461 ** 0.468 ** 0.443 ** -0.113 ** -0.071 (16.13) (16.41) (16.84) (15.78) (-2.98) (-1.68) WTO_Bothin 0.098 * 0.076 -0.211 ** -0.249 ** -0.277 ** -0.274 ** (1.99) (1.55) (-3.78) (-4.12) (-4.60) (-4.55) WTO_Onein 0.011 -0.018 -0.134 * -0.168 * -0.056 * -0.066 PAFTAD1 PAFTAD2
(0.25) 1.573 ***
(3.43) 3.312 **
(3.61)
(-0.43) 1.585 **
(3.45) 3.312 **
(3.61)
(-2.65) 1.352 **
(2.91) 2.179 * (2.33)
(-3.05) -2.242 (0.001) -5.016 (0.001)
(-1.02) -0.968
(-0.001) -2.549
(-0.001)
(-1.20) -1.096
(-0.001) -2.817
(-0.001) WTO_Bothin_PAFTAD1 0.755 ** 0.771 ** 0.219 * 0.261 ** (8.37) (8.04) (2.24) (2.62) WTO_Bothin_ PAFTAD2 2.349 ** 2.378 ** 1.481 ** 1.569 ** (10.67) (10.08) (5.96) (6.25) WTO_Onein_ PAFTAD1 1.065 ** 1.087 ** 0.270 0.345 (4.95) (4.72) (1.12) (1.42) WTO_Onein_ PAFTAD2 0.414 ** 0.428 ** 0.085 0.112 (4.64) (4.52) (0.89) (1.17) Control for Sample Selection Bias No No No Yes No Yes
Inverse Mill’s Ratio ( *ˆji ) -0.017 0.402 *
Control for Firm (-0.22) (2.13) Heterogeneity No No No No Yes Yes
30
Table 4. The Impact of GATT/WTO on Trade of PAFTAD Economies, 1950 to 2000 OLS OLS OLS Heckman OLS HMR Explanatory Variables
*ˆjiz -4.267 ** 4.635 **
(-12.61) (12.70)
*ˆjiz 2 -0.600 ** -0.777 **
(-6.57) (-6.74)
*ˆjiz 3 0.027 ** 0.045 **
(2.62) (3.65) Constant 15.813 ** 15.985 ** 16.206 ** 20.140 5.914 6.538 (37.08) (37.42) (38.21) (0.001) (0.001) (0.001) Time Fixed Effects Yes Yes Yes Yes Yes Yes Exporter Fixed Effects Yes Yes Yes Yes Yes Yes Importer Fixed Effects Yes Yes Yes Yes Yes Yes No. of Obs. 76094 76094 76904 102147 76094 102147 R2 0.70 0.70 0.71 0.71 0.71 0.71
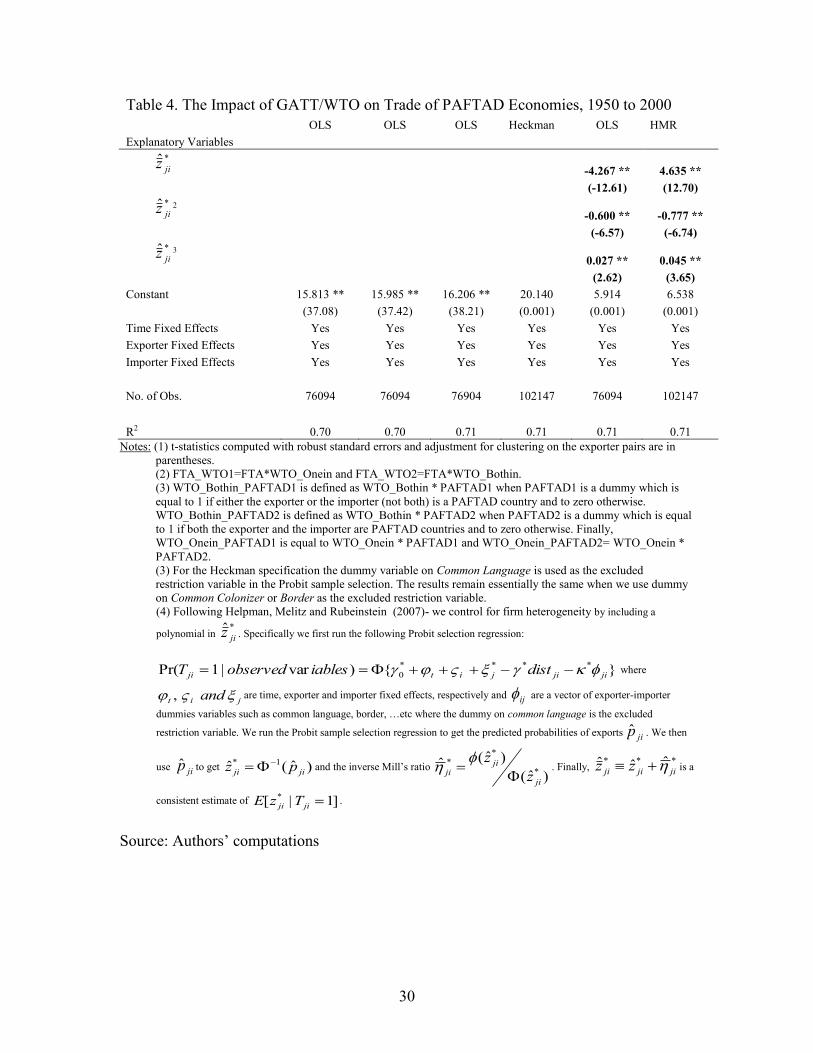
Notes: (1) t-statistics computed with robust standard errors and adjustment for clustering on the exporter pairs are in parentheses.
(2) FTA_WTO1=FTA*WTO_Onein and FTA_WTO2=FTA*WTO_Bothin. (3) WTO_Bothin_PAFTAD1 is defined as WTO_Bothin * PAFTAD1 when PAFTAD1 is a dummy which is equal to 1 if either the exporter or the importer (not both) is a PAFTAD country and to zero otherwise. WTO_Bothin_PAFTAD2 is defined as WTO_Bothin * PAFTAD2 when PAFTAD2 is a dummy which is equal to 1 if both the exporter and the importer are PAFTAD countries and to zero otherwise. Finally, WTO_Onein_PAFTAD1 is equal to WTO_Onein * PAFTAD1 and WTO_Onein_PAFTAD2= WTO_Onein * PAFTAD2.
(3) For the Heckman specification the dummy variable on Common Language is used as the excluded restriction variable in the Probit sample selection. The results remain essentially the same when we use dummy on Common Colonizer or Border as the excluded restriction variable.
(4) Following Helpman, Melitz and Rubeinstein (2007)- we control for firm heterogeneity by including a
polynomial in *ˆjiz . Specifically we first run the following Probit selection regression:
}{)var|1Pr( ****0 jijijitji distiablesobservedT where
jit and , are time, exporter and importer fixed effects, respectively and ij are a vector of exporter-importer
dummies variables such as common language, border, …etc where the dummy on common language is the excluded
restriction variable. We run the Probit sample selection regression to get the predicted probabilities of exports jip̂ . We then
use jip̂ to get )ˆ(ˆ 1*jiji pz and the inverse Mill’s ratio
)ˆ()ˆ(ˆ
*
**
ji
jiji z
z
. Finally, *** ˆˆˆjijiji zz is a
consistent estimate of ]1|[ * jiji TzE .
Source: Authors’ computations
31
Table 5. Potential agricultural protection in the absence of WTO commitments, China, 2030 Conjectured Counterfactuals
% Paddy rice 100 Processed rice 100 Wheat 80 Cereals 80 Fruits & vegetables 50 Oilseeds 10 Oils & fats 10 Sugar raw 150 Sugar processed 150 Plant-based fibers 40 Crops nec 65 Livestock 150 Meat products 150 Other animal products 20 Other meat products 20 Wool & silk-worm 40 Milk raw 200 Dairy 200
Source: Anderson, Martin and Valenzuela (2008).
32
Table 6. Estimated welfare impacts of reforms from different levels of agricultural
protection (welfare measure in 2004 US levels)
1995-2004 Counterfactual $m $m Primary Agriculture 385 1330 Processed Agriculture 1589 2276 National Total 20053 20125
Source: Anderson, Martin and Valenzuela (2008).
33
Figure 1. Nominal rates of assistance to agricultural and non-agricultural tradables, and relative rate of assistance,a China, 1981 to 2005
(percent)
-80
-60
-40
-20
0
20
40
60
1982
1985
1988
1991
1994
1997
2000
2003
NRA ag
NRA ag
RRA
a The relative rate of assistance is calculated as RRA = 100[(100+NRAag)/(100+NRAnonag) - 1],
where NRAag and NRAnonag are the nominal rates of assistance to agricultural and non-agricultural tradables, respectively
Source: Huang, Liu, Martin and Rozelle (2007)
34
Figure 2. Nominal rate of assistance to agriculture (NRA) and real GDP per capita (a) all developing countries
-1-.
50
.51
1.5
NR
A
6 7 8 9 10Ln real GDP per capita
East Asia R^2 = 0.48 South Asia R^2 = 0.03
Africa R^2 = 0.03 LAC R^2 = 0.04
ECA R^2 = 0.12
Developing countries
(b) East Asian economies
-.5
0.5
11
.5
NR
A
7 8 9 10Ln real GDP per capita
China Japan Korea Taiwan
North East Asia
Source: Anderson (2008)