Embed Size (px)
Citation preview
i
Effects of frozen storage on quality of Atlantic
mackerel (Scomber scombrus) caught in Icelandic
Waters.
Improving mackerel products in order to increase their value
Andri Thorleifsson
May 2015
Supervisor:
Prof. Sigurjón Arason
Dr. Magnea Karlsdóttir
ii
Effects of frozen storage on quality of Atlantic
mackerel (Scomber scombrus) caught in Icelandic
Waters.
Improving mackerel products in order to increase their value
Thesis for the degree of Master of Science in A thesis in fulfilment of the
requirement of the degree of Master of Science in Food Science (90 ECTS units)
iii
DECLARATION
I hereby declare that this thesis is based on my own observations, is written by me and has
not been in part or as a whole submitted before to a higher academic degree.
YFIRLÝSING
Hér með lýsi ég því yfir að ritgerð þessi er byggð á mínum eigin athugunum, er samin af mér og hefur hvorki að hluta né í heild verið lögð fram áður til hærri gráðu.
Ritgerð þessi er til meistaragráðu í matvælafræðifræði og er óheimilt að afrita ritgerðina á nokkurn hátt nema með leyfi rétthafa.
Bergen 28.05 2014
__________________________
Andri Þorleifsson
iv
ABSTRACT
Mackerel (Scomber scombrus), has in the resent years, become one of the most valuable fish
spies in Iceland. Utilizing this recourse effectively has create many challenges for Icelandic
fish processors. One of those challenges is stopping or diminishing the spoilage rate during
frozen storage. The main objective of this project was to study seasonal variation and the
influence of frozen storage (-27°C for up to 4 months) on quality degradation of headed and
gutted (H/G) mackerel with emphasise on lipid oxidation and hydrolysis. Mackerel samples
were collected five times, during the fishing season, from late June to beginning of September,
all from the vessel Heimaey VE-1. Quality inspections and frozen storage of the samples were
done at fish processing plant belonging to Isfelag HF. Quality inspections of the raw material
and final products were carried out using the same methods used at this plant to reflect
common practices in the Icelandic processing plants. Samples were stored in cold storage (-
27°C +/- 2°C), used by Isfelag for all its products.
The biological stability of initial raw material was evaluated in term of quality parameters,
TVB-N measurements conducted to evaluate the freshness and proximate content measured
to clarify the seasonal variation of the mackerel. To explore the oxidation stability of the
mackerel, traditional methods including peroxide value (PV), thiobarbituric acid reactive
substance (TBARS) and fluorescence method were used to determine the primary, secondary
and tertiary lipid oxidation products respectively. Lipid hydrolysis (free fatty acid) was also
measured to evaluate enzymatic activity.
Results showed, as confirmed by numerous other analyses, poor condition of the mackerel
early in the season. Later on in the season biological stability improved considerable.
Peroxide values diminished during 4 month frozen storage for all samples except the one from
the beginning of the season, late June. FFA, TBARS and fluorescene increased in all samples
during 4 months frozen storage. Oxidation rate was higher in fish with higher lipid content
(July/August) indicating that spoilage rate of the mackerel was more influenced by lipid
content than biological stability during frozen storage at (-27°C +/- 2°C).
v
ACKNOWLEDGEMENTS
This study was conducted at local laboratorium Rannsóknarþjónusta Vestmannaeyja, Isfelag
hf. in Vestmannaeyjar and Matis ltd. Icelandic Food and Biotech R&D (Matís ohf. Reykjavik).
The raw material came from Isfelag Vestmannaeyja hf. Analyses were made at
Rannsóknarþjónusta Vestmannaeyja and Matis ohf. I thank them all.
vi
TABLE OF CONTENT
DECLARATION .......................................................................................................................................... iii
YFIRLÝSING .............................................................................................................................................. iii
ABSTRACT ................................................................................................................................................ iv
ACKNOWLEDGEMENTS ............................................................................................................................ v
TABLE OF CONTENT ................................................................................................................................. vi
LIST OF TABLES ......................................................................................................................................... x
LIST OF FIGURES ...................................................................................................................................... xi
1. INTRODUCTION ................................................................................................................................. 1
2. LITERATURE REVIEW ........................................................................................................................... 3
2.1 THE MACKEREL .................................................................................................................................. 3
2.1.1. BIOLOGY OF MACKEREL ................................................................................................................ 3
2.1.2 DISTRIBUTION ................................................................................................................................. 4
2.1.3 FISHING METHODS FOR MACKEREL .............................................................................................. 6
2.1.4 PRODUCTION OF HEADED AND GUTTTED MACKEREL (H/G) ......................................................... 8
2.2 SUPPLY OF ATLANTIC MACKEREL ................................................................................................... 10
2.3 MARKETS FOR ATLANTIC MACKEREL ............................................................................................. 12
2.4. MACKEREL FOR HUMAN CONSUMPTION ...................................................................................... 15
2.4.1 SMOKED MACKEREL .................................................................................................................... 15
2.4.2 CANNING OF MACKEREL ............................................................................................................. 22
2.4.3 MACKEREL PATE .......................................................................................................................... 25
vii
2.4.4 SALTED MACKEREL ...................................................................................................................... 25
2.4.5 MARINATED ................................................................................................................................. 26
2.5 THE STRUCTURE AND COMPOSITION OF MACKEREL ..................................................................... 26
2.5.1 CHEMICAL COMPOSITION OF ATLANTIC MACKEREL ................................................................... 26
2.5.2 SEASONAL VARIATIONS IN LIPID CONTENT OF ATLANTIC MACKEREL ......................................... 27
2.5.3 LIPID ............................................................................................................................................. 29
2.5.4 FISH MUSLES OF ATLANTIC MACKEREL ........................................................................................ 31
2.6 SPOILAGE OF FRESH FISH ................................................................................................................ 33
2.6.1: AUTOLYTIC ENZYMATIC SPOILAGE ............................................................................................. 35
2.6.2 OXIDATIVE SPOILAGE ................................................................................................................... 36
2.6.3 LIPID HYDROLYSIS ......................................................................................................................... 39
2.7 EFFECTS OF FREEZING AND STORAGE ON ATLANTIC MACKEREL ................................................... 40
2.8 STUDY OBJECTIVES .......................................................................................................................... 43
3. MATERIALS AND METHODS .............................................................................................................. 44
3.1 EXPERIMENTAL DESIGN ................................................................................................................... 44
3.2 RAW FISH AND SAMPLING .............................................................................................................. 45
3.3. PROXIMATE ANALYSIS .................................................................................................................... 46
3.3.1 WATER CONTENT ......................................................................................................................... 46
3.3.2. LIPID CONTENT ............................................................................................................................ 46
3.3.3. PROTEIN CONTENT ...................................................................................................................... 46
3.4 OXIDATIVE STATUS .......................................................................................................................... 46
3.4.1 LIPID HYDROPEROXIDE VALUES (PV) .......................................................................................... 46
viii
3.4.2 THIOBARBITURIC ACID REACTIVE SUBSTANCE (TBARS) ............................................................... 47
3.4.3 FLUORESCENCE SHIFT RATIO (δF) ................................................................................................ 47
3.5 LIPID HYDROLYSIS (FFA)................................................................................................................... 47
3.6 TOTAL VOLATILE NITROGEN BASES (TVB-N) ................................................................................... 48
3.7 STATISTICAL ANALYSIS ..................................................................................................................... 48
4 RESULTS ............................................................................................................................................ 49
4.1 FRESHLY CAUGHT MACKEREL .......................................................................................................... 49
4.1.1 RAW MATERIAL CONDITION ........................................................................................................ 49
4.1.2 CONDITION OF THE FINAL PRODUCT ........................................................................................... 51
4.1.2 CHEMICAL COMPOSITION OF MACKEREL .................................................................................... 52
4.1.3 TVB-N ............................................................................................................................................ 52
4.2 LIPID OXIDATION ............................................................................................................................. 53
4.2.1 PEROXIDE VALUE (PV) .................................................................................................................. 53
4.2.2 TBARS ........................................................................................................................................... 54
4.2.3 FLUORENCE SHIFT RATIO ............................................................................................................. 55
4.3 LIPID HYDROLYSIS ............................................................................................................................ 56
4.4 CORRELATIONS ................................................................................................................................ 57
5 DISCUSSIONS ...................................................................................................................................... 59
5.1 RAW MATERIAL AND FINAL PRODUCT ............................................................................................ 59
5.2 FINAL PRODUCT (H/G MACKEREL) .................................................................................................. 60
5.3 CHEMICAL COMPOSITION AND TVB-N ............................................................................................ 61
5.4 LIPID OXIDATION ............................................................................................................................. 61

ix
5.5 LIPID HYDROLYSIS - FREE FATTY ACIDS (FFA) .................................................................................. 63
6 CONCLUSION ...................................................................................................................................... 65
7. REFERENCES...................................................................................................................................... 66
APPENDIX A ........................................................................................................................................... 78
APPENDIX B ........................................................................................................................................... 79
APPENDIX C ........................................................................................................................................... 82
APPENDIX D ........................................................................................................................................... 83
x
LIST OF TABLES
Table 2.1: Brine strength vs. brining time (Keay 2001)…………………………..……………………………18
Table 2.2: Chemical composition of Atlantic mackerel filets per 100g/eatable part from
mackerel caught in the fishing seasons in Iceland (sommer) and Norway (winter)
(average). (Ísgem 2011, Nifes 2006)…………………………………………………………………………27
Table 2.3. The FA present in highest concentrations in the lipids extracted from the meat of
thawed mackerel stored at 0–2 °C (Mean value ± SD characterizing samples from two
batches of thawed fish (Stolyhwo et. al. 2004)………………………………………………………….31
Table 2.4: Summary of changes in chilled or frozen fish (FAO 2005 as cited by Ghaly et. al.
2010)……………………………………………………………………………………………………………………….36
Table 3.1: Dates of samples collection….………………………………………………………………………………45
Table 4.1: Size group, weight of sample, tank, temperature when landed, sea temperature,
age of raw material, haul time, fishing ground and average size………………………………..49
Table 4.2: Quality of raw material when landed at grading station (average values from
several samples)………………………………………………………………………………………………………50
Table 4.3: Quality parameters of H/G mackerel before freezing (average values from several
samples)………………………………………………………………………………………………………………..……….…51
Table 4.4: Total volatile basic nitrogen (TVB-N/100g) for fresh mackerel…………………………..…57
Table 4.5: Correlation between oxidation products, hydrolysis, water and lipid………………..…58
Table B.1: Method of finding out if the mackerel is soft or firm…………………………………………79
xi
LIST OF FIGURES
Figure 2.1: Distribution of Atlantic mackerel (FAO 2015)………………………………………………………..5
Figure 2.2: Mid water trawl for mackerel fishing (Fisheries and Oceans Canada 2013)……………7
Figure 2.3: Expecting chilling down figure for RWS system. (Thorsteinsson et. al. 2003)…………8
Figure 2.4: Flow diagram of mackerel production at Isfelag and the temperature flow during
The production………………………………………………………..………………………………………………10
Figure 2.5: World catch of Atlantic Mackerel 2000-2010 (FAO 2014)…………………………………….11
Figure 2.6: Fishing of Atlantic mackerel in Europe divided by nations, 2008-2012 (FAO 2014)11
Figure 2.7: Allocation of mackerel products from Icelandic processors (Hagstofa 2014)……..12
Figure 2.8: Allocation of mackerel products from Norwegian processors (Statistisk
sentralbyra 2014)………………………………………………………………………………………………….…13
Figure 2.9: Average price (USD/kg.) mackerel products from Iceland and Norway (Statistisk
sentralbyra 2014, Hagstofa 2014)…………………………………………………………………………….14
Figure 2.10 The flow sheet of hot smoking of Atlantic mackerel in mild conditions (Stolyhwo
et. al. 2004)…………….....……………………….…………………………………………………………………..16
Figure 2.11: Whole mackerel ready for smoking (Keay 2001)……………………………………………….18
Figure 2.12. Steps included in the canned fish manufacture (Aubourg 2001)…………………….….23
Figure 2.13: Seasonal variation in the chemical composition mackerel fillets (Scomber
scombrus) (Huss 1995). ……………………………………………………………………………………....….28
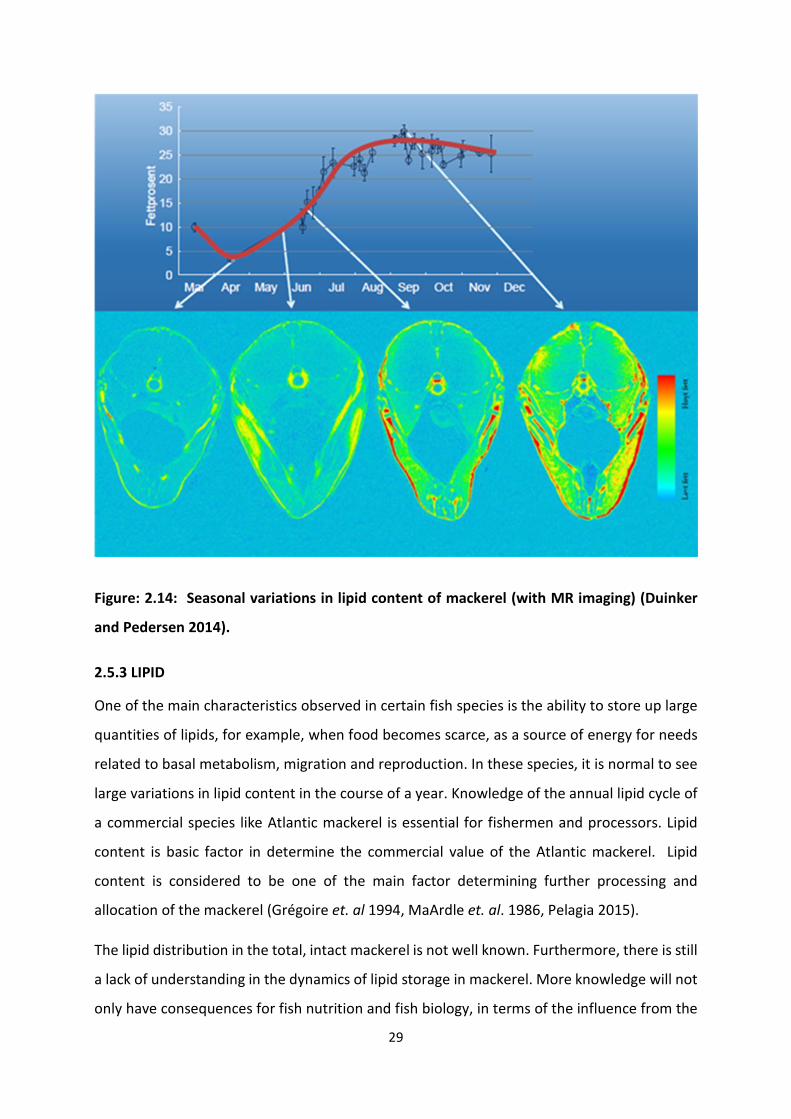
Figure: 2.14: Seasonal variations in lipid content of mackerel (with MR imaging) (Duinker and
Pedersen 2014)……………………………………………………….……………………………………………….29
Figure 2.15: Dark and white muscle in fatty fish (Huss 1995)…………………………………………….….32
Figure 2.16 Distribution of the total lipid various parts of the body of mackerel of Norwegian
origin (Huss 1995)………………………………………..…………………………………………………………..32
Figure 2.17. Primary hydrolytic reactions of triglycerides and phospholipids. Enzymes: PL1 &
PL2 phospholipases;TL, triglyceride lipase (Huss 1995)………………………………………………39
Figure 2.18: Example of oxidation and breakdown of lipid and different analyses methods. 1°
oxidation is analysed as PV (peroxide value). 2° oxidation is measured by TBA. 3°
oxidation can be measured by fluorescence (Jonsdottir et. al. 2008)…………………………40
Figure 2.19: Quality-related changes in fish muscle during frozen storage (Burgaard
2010)…………………………………………………………………………………………………………………….…43
xii
Figure 3.1: Experimental design of the study. (Abbreviations: FFA = free fatty acids, PV =
peroxide value, TBARS= thiobarbituric acid value, δF= Fluorescence shift ratio
measurements. TVB-N = total volatile nitrogen)..........................................................44
Figure 4.1: Influence of catching time of Atantic mackerel caught in Icelandic water from
June-September 2012..................................................................................................52
Figure 4.2: Changes in peroxide values for all samples after 1 month and after 4 months of
storage at -27°C…………………………………………………………..……………………………………………53
Figure 4.3: TBARS values (µmol of MDA/ kg muscle) obtained from mackerel stored at -27 °C
for 1 month and 4 months………....…………………………………………………………………………….54
Figure 4.4: Changes in fluorescence values for all samples 1 month and 4 mounts in storage
at -27°C…………………………………………………………….………………………………………………………55
Figure 4.5: Changes in free fatty acid values (g FFA/100 g lipids) for all samples 1 month and
4 months in storage at -27 °C. ………………………………………………………………..……………….56
Figure A1: Fishing grounds were different samples were caught. Sample 1 (late June) and 2
(late July) south of Grindavik, sample 3 (middel August) and 4 (late August) east of
Djupivogur and sample 5 (beginning September) east of Seydisfjordur……………………..77
Figure B.1: Evaluation of the feed content in mackerel stomach………………………………………….79
Figure B.2: Typical skin damages on mackerel, most often due to catching………………………….79
Figure B.3: Grading of peritoneum, 0 Peritoneum strong and firm, 1 peritoneum loose when
touched, and 2 peritoneum is damages or none existing (SINTEF 2012)…......…………...80
Figure D.1: Temperature in cold storage were all the samples used in this study where
Storage…………………………………………………………………………………………………………………….83
1
1. INTRODUCTION
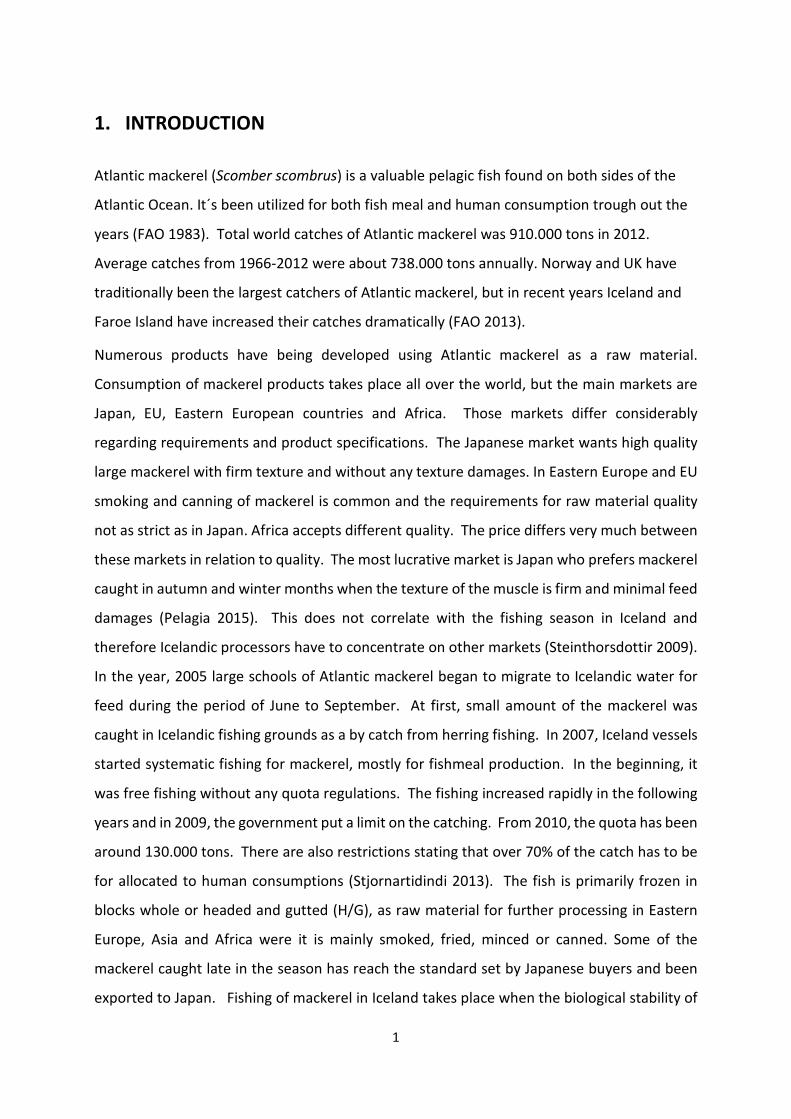
Atlantic mackerel (Scomber scombrus) is a valuable pelagic fish found on both sides of the
Atlantic Ocean. It´s been utilized for both fish meal and human consumption trough out the
years (FAO 1983). Total world catches of Atlantic mackerel was 910.000 tons in 2012.
Average catches from 1966-2012 were about 738.000 tons annually. Norway and UK have
traditionally been the largest catchers of Atlantic mackerel, but in recent years Iceland and
Faroe Island have increased their catches dramatically (FAO 2013).
Numerous products have being developed using Atlantic mackerel as a raw material.
Consumption of mackerel products takes place all over the world, but the main markets are
Japan, EU, Eastern European countries and Africa. Those markets differ considerably
regarding requirements and product specifications. The Japanese market wants high quality
large mackerel with firm texture and without any texture damages. In Eastern Europe and EU
smoking and canning of mackerel is common and the requirements for raw material quality
not as strict as in Japan. Africa accepts different quality. The price differs very much between
these markets in relation to quality. The most lucrative market is Japan who prefers mackerel
caught in autumn and winter months when the texture of the muscle is firm and minimal feed
damages (Pelagia 2015). This does not correlate with the fishing season in Iceland and
therefore Icelandic processors have to concentrate on other markets (Steinthorsdottir 2009).
In the year, 2005 large schools of Atlantic mackerel began to migrate to Icelandic water for
feed during the period of June to September. At first, small amount of the mackerel was
caught in Icelandic fishing grounds as a by catch from herring fishing. In 2007, Iceland vessels
started systematic fishing for mackerel, mostly for fishmeal production. In the beginning, it
was free fishing without any quota regulations. The fishing increased rapidly in the following
years and in 2009, the government put a limit on the catching. From 2010, the quota has been
around 130.000 tons. There are also restrictions stating that over 70% of the catch has to be
for allocated to human consumptions (Stjornartidindi 2013). The fish is primarily frozen in
blocks whole or headed and gutted (H/G), as raw material for further processing in Eastern
Europe, Asia and Africa were it is mainly smoked, fried, minced or canned. Some of the
mackerel caught late in the season has reach the standard set by Japanese buyers and been
exported to Japan. Fishing of mackerel in Iceland takes place when the biological stability of
2
the fish is poor due to seasonal variations in lipid content (Huss 1995). The fish migrates to
Icelandic waters right after spawning with very low lipid content. It starts heavy feeding
resulting in rapid increase in lipid content. It store the lipid in the muscle something that
influence the texture in negative way (Sveinbjornson et. al. 2008; Hagstofa 2014; Arason et.
al. 2010).
Processing of mackerel products has become very important for the Icelandic fishing industry.
Export value of mackerel products were about 157, 3 million USD, in 2013 making mackerel
one of the most valuable fish spies in Iceland (Hagstofa 2014).
Mackerel is a highly perishable commodity recording considerable losses in quality before
consumption. Many factors influence spoilage of mackerel. Ambient temperature, age of raw
material before processing, processing- and storage conditions. Biological factors like
seasonal variations in lipid content and sea temperature. Storage time and temperature are
the major factors implicated in the loss of quality and shelf life of fatty fishes like Atlantic
mackerel (Huss 1995).
The freezing of fish is an effective way of long-term preservation. During frozen storage,
spoiling rate diminished. For fatty fish like mackerel, controlling the lipid oxidation is vital.
Best way of doing that is by freezing the fish before damages begins and keeping the
temperature as low as possible from catching until final storage (Huss 1995). It is important to
understand how freezing rate and freezing time alter the quality of H/G mackerel.
3
2. LITERATURE REVIEW
2.1 THE MACKEREL
2.1.1. BIOLOGY OF MACKEREL
Atlantic mackerel (Scomber scombrus) is a pelagic fish belonging to the family of scombridae.
It can be found in the northeast Atlantic from Norway to Morocco and the Canaries, and in
the Mediterranean and Black Seas. In the North West Atlantic, it occurs from Labrador to
North Carolina (FAO 1983). One characteristics of mackerel are sleek, compact and
streamlined bodies who is designed for fast swimming. Male and female mackerel have very
similar growth rates (Scott and Scott 1989). The fish is a powerful swimmer who lives for most
parts in large groups offshore. It can be 25 years old and the largest individuals can be 60 cm
long and weighing about 3 kg. (Ástþórsson et. al. 2010). The mackerel has the habit of
gathering in dense schools of many thousands individuals (Bigelow and Schroeder 1953).
Mackerel feeds on variety of pelagic animals, mostly planktonic crustaceans, fish eggs, and
fish juveniles (Jónsson 1983).
Atlantic mackerel reaches sexual maturity at the age of 2 to 3, then around 30 cm long
(Ástþórsson et. al. 2010). Mackerel are a swift-moving fish, swimming with very short
sidewise movements of the rear part of the body and of the powerful caudal fin. When caught
they beat a rapid tattoo with their tails on the bottom of the boat until exhausted. In addition,
they require so much oxygen for their vital processes that when the water is warm (hence its
oxygen content low) they must keep swimming constantly, to bring sufficient flow of water to
their gill filaments, or else they die (Bigelow and Schroeder 1953). There is no swim bladder
in the Atlantic mackerel (FAO 2013).
The Atlantic Mackerel is typically an open ocean fish with voracious feeding habits. They travel
in schools that often contain thousands of fish. The swift swimming mackerel has a
streamlined body and swims at high speeds for extended periods searching for food. All
individuals within a specific school tend to be the same size. Since cruising speed increases
significantly with age and size, scientists believe that conformity of body size within a specific
school is necessary to allow all fish to maintain identical swimming speeds (FAO 2013).
4
Mackerel do not resort to any particular breeding grounds, but shed their eggs wherever their
wandering habits have chanced to lead them when the sexual products ripen. It follows from
this, and from the fact that mackerel vary so widely in abundance over periods of years that
the precise localities of greatest egg production expected to vary from year to year, depending
on the local concentrations of the fish (Bigelow and Schroeder 1953)
The mackerel is a moderately prolific fish; females of medium size may produce as many as
400,000 to 500,000 eggs in the aggregate, according to various estimates, with 546,000
reported for one weighing 17/8 pounds. However, it is seldom that as many as 50,000 are set
free at any one time, and often many fewer, for the members of a given school spawn over a
considerable period. The eggs are 0.97 to 1.38 mm. in diameter, with one large oil globule,
and drift suspended in the water, chiefly shallow sea than the 5-fathom level. The rate of
development depended by the temperature of the water. Incubation takes about 150 hours
at 54° (12,2°C); 115-95 hours at 57°-61° (13,9°C – 16,1°C); about 70 hours at 64°-65° (17,8°C-
18,3°C); and about 50 hours at 70°(21,1°C); with normal development limited to temperatures
between about 52° (11,1° C.) and 70° (21,1° C.) (Bigelow and Schroeder 1953).
2.1.2 DISTRIBUTION
The Atlantic mackerel occurs from the northeast coast of USA, up to Newfoundland Island on
the west side of the Atlantic Ocean (Figure 2.1). On the eastern side it is found off Morocco,
in the Mediterranean sea and all the way up to the Barents Sea, although only occasionally.
Three stocks are in the northeast Atlantic. The southern stock in Spanish and Portuguese
waters, the western stock in the Bay of Biscay and around Ireland and the third stock spawns
in the North Sea (Ástþórsson et. al. 2009).
5
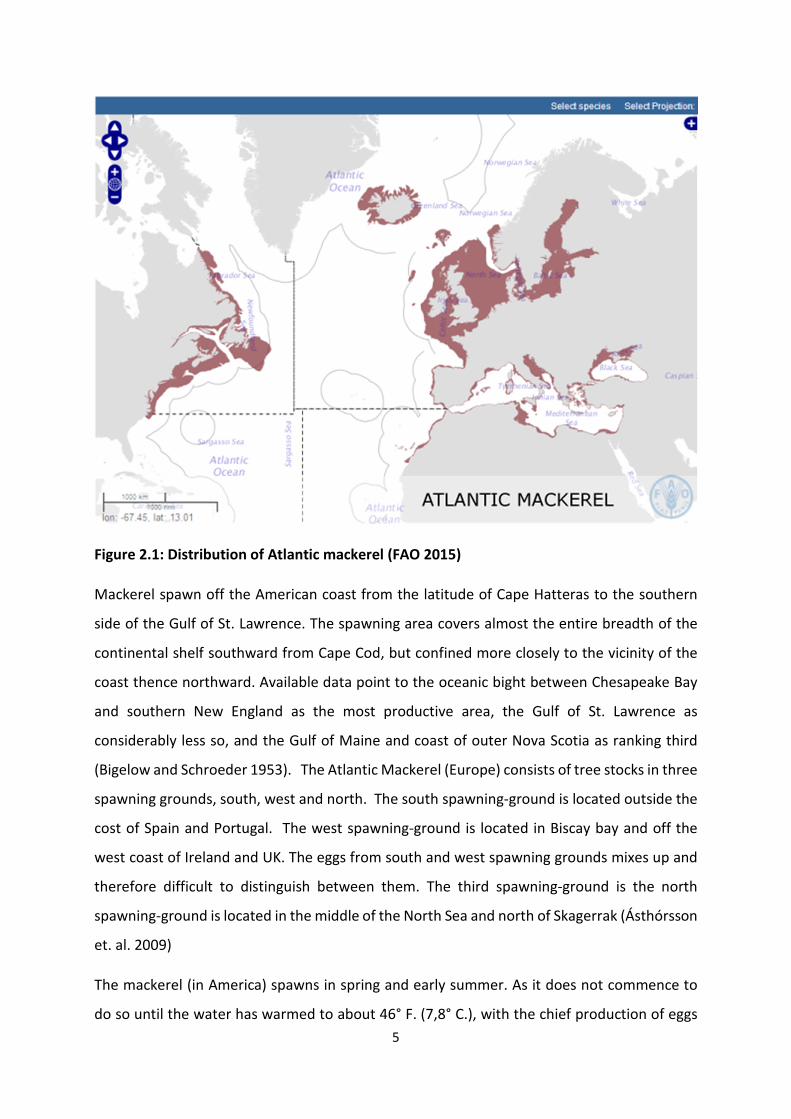
Figure 2.1: Distribution of Atlantic mackerel (FAO 2015)
Mackerel spawn off the American coast from the latitude of Cape Hatteras to the southern
side of the Gulf of St. Lawrence. The spawning area covers almost the entire breadth of the
continental shelf southward from Cape Cod, but confined more closely to the vicinity of the
coast thence northward. Available data point to the oceanic bight between Chesapeake Bay
and southern New England as the most productive area, the Gulf of St. Lawrence as
considerably less so, and the Gulf of Maine and coast of outer Nova Scotia as ranking third
(Bigelow and Schroeder 1953). The Atlantic Mackerel (Europe) consists of tree stocks in three
spawning grounds, south, west and north. The south spawning-ground is located outside the
cost of Spain and Portugal. The west spawning-ground is located in Biscay bay and off the
west coast of Ireland and UK. The eggs from south and west spawning grounds mixes up and
therefore difficult to distinguish between them. The third spawning-ground is the north
spawning-ground is located in the middle of the North Sea and north of Skagerrak (Ásthórsson
et. al. 2009)
The mackerel (in America) spawns in spring and early summer. As it does not commence to
do so until the water has warmed to about 46° F. (7,8° C.), with the chief production of eggs
6
taking place in temperatures of, say, 48° to 57° (8,9°C-13,9°C), the spawning season is
progressively later, following the coast from south to north. Thus, the chief production starts
in Chesapeake Bay in the middle of April and ends in the southern side of the Gulf of St.
Lawrence, where eggs have been taken from early June to mid-August (Bigelow and Schroeder
1953).
The Mackerel on the East side spawns from February to July depending on areas. In the south
in April-May, in the west area May-June and in the north in June. When spawning occur the
temperature on the surface of the ocean is lower than when its peeks. Therefore the
spawning occurs, most often, in deeper waters at the beginning of the spawning season
(Iversen 2004). When spawning is finished, the mackerel travels to look for food. Mackerels
belonging to the south- and west stocks travel north to the Norway Sea and North Sea. South
of Faroe Islands the main schools divides into to one that goes east of the Island and one that
goes west of the Islands. The one that goes west is probably the one found in Icelandic waters.
The one that goes east divides and goes to Northern North Sea and south-west Norway Sea
(Ástþórsson et. al. 2009, FAO 2011)
The mackerel does not spawn in Icelandic waters, as far as we know, but migrates there
occasionally throughout the country. It seems clear from archives that this happens regularly
as large amount of mackerel were reported for many years in a row around 1900, and during
the warm period from 1926 to 1945 and sporadically in between and after. It is also clear that
it is now mass migrating into the Icelandic EEZ due to the current warm oceanic conditions
(Ástþórsson et. al 2009). The mackerel in Icelandic waters is originated from the East Atlantic
Ocean.
2.1.3 FISHING METHODS FOR MACKEREL
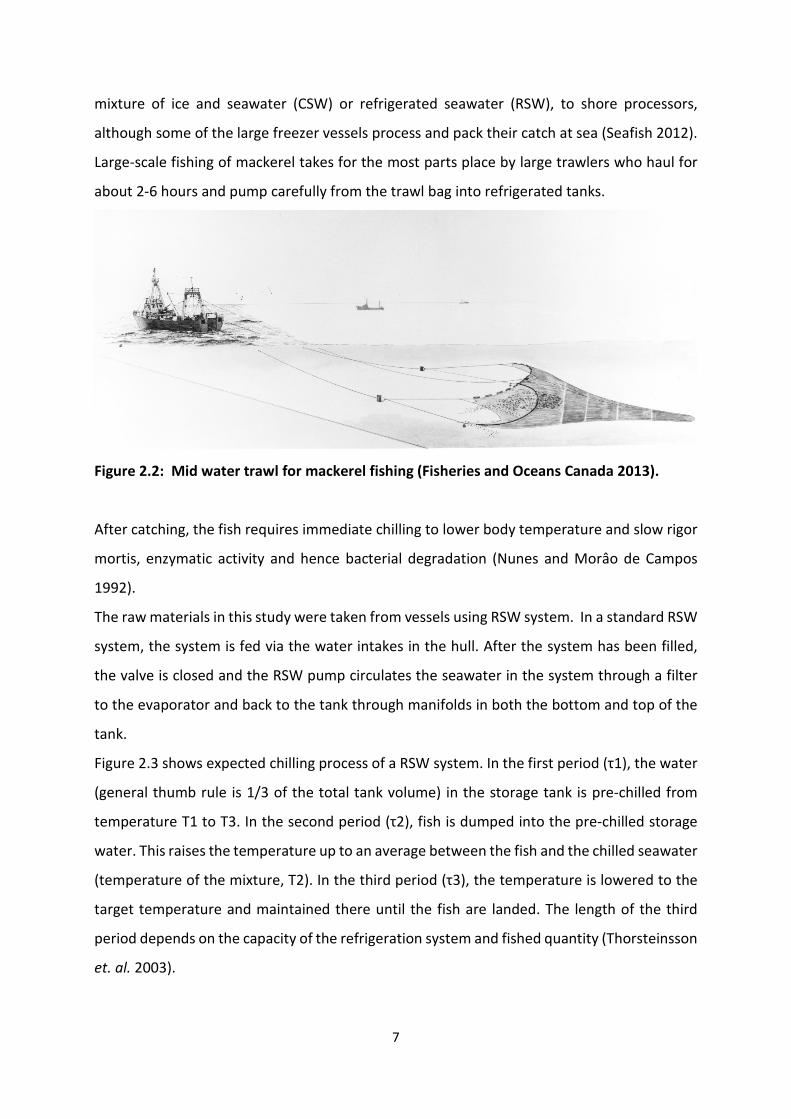
Most mackerel fisheries target large shoals offshore using mid water trawls1 (Figure 2.2), pair
trawls or purse seines. The adoption of dual and triple frequency sonar technology on some
vessels has enabled skippers to differentiate between pelagic species. In inshore areas, small
vessels use hand lines and gillnets, including a substantial Spanish fleet (4,950 vessels in 2009)
and hand line fleets off the South West coast of England and coast of Scotland. Most mackerel
caught in European waters, including Icelandic waters, are landed fresh, chilled with ice, using
1 Mid-water trawls are used in large scale Icelandic mackerel fishing.
7
mixture of ice and seawater (CSW) or refrigerated seawater (RSW), to shore processors,
although some of the large freezer vessels process and pack their catch at sea (Seafish 2012).
Large-scale fishing of mackerel takes for the most parts place by large trawlers who haul for
about 2-6 hours and pump carefully from the trawl bag into refrigerated tanks.
Figure 2.2: Mid water trawl for mackerel fishing (Fisheries and Oceans Canada 2013).
After catching, the fish requires immediate chilling to lower body temperature and slow rigor
mortis, enzymatic activity and hence bacterial degradation (Nunes and Morâo de Campos
1992).
The raw materials in this study were taken from vessels using RSW system. In a standard RSW
system, the system is fed via the water intakes in the hull. After the system has been filled,
the valve is closed and the RSW pump circulates the seawater in the system through a filter
to the evaporator and back to the tank through manifolds in both the bottom and top of the
tank.
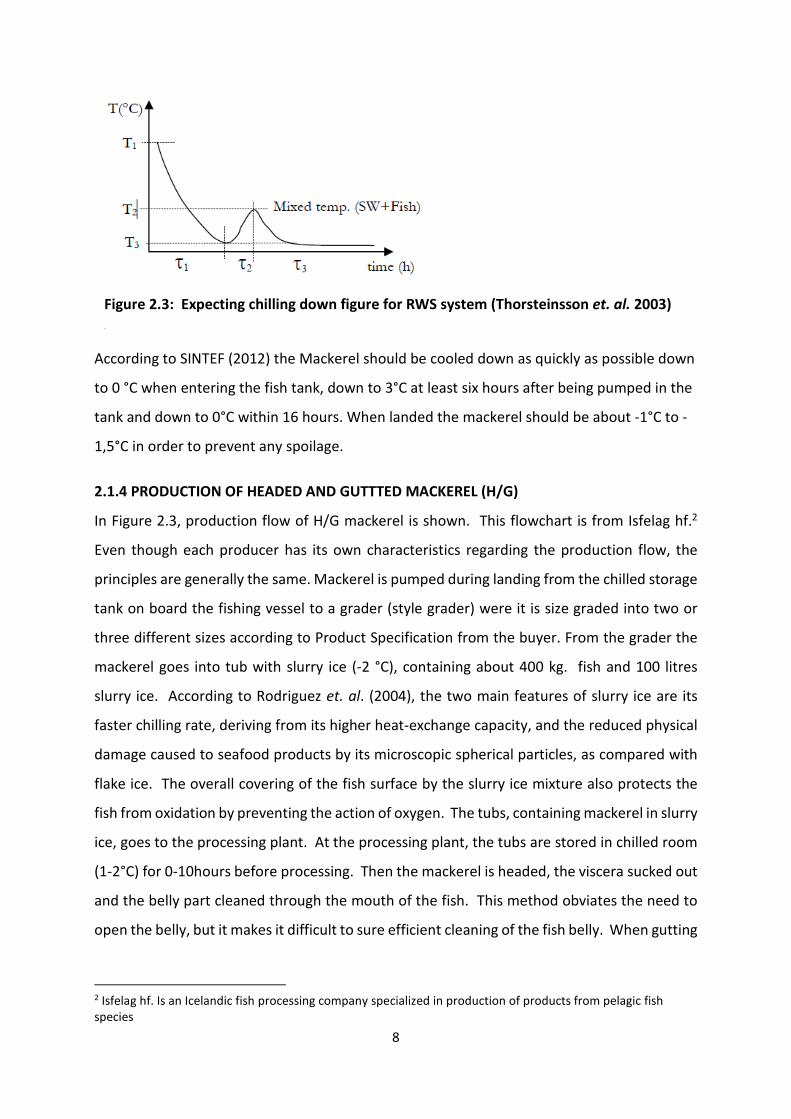
Figure 2.3 shows expected chilling process of a RSW system. In the first period (τ1), the water
(general thumb rule is 1/3 of the total tank volume) in the storage tank is pre-chilled from
temperature T1 to T3. In the second period (τ2), fish is dumped into the pre-chilled storage
water. This raises the temperature up to an average between the fish and the chilled seawater
(temperature of the mixture, T2). In the third period (τ3), the temperature is lowered to the
target temperature and maintained there until the fish are landed. The length of the third
period depends on the capacity of the refrigeration system and fished quantity (Thorsteinsson
et. al. 2003).
8
According to SINTEF (2012) the Mackerel should be cooled down as quickly as possible down
to 0 °C when entering the fish tank, down to 3°C at least six hours after being pumped in the
tank and down to 0°C within 16 hours. When landed the mackerel should be about -1°C to -
1,5°C in order to prevent any spoilage.
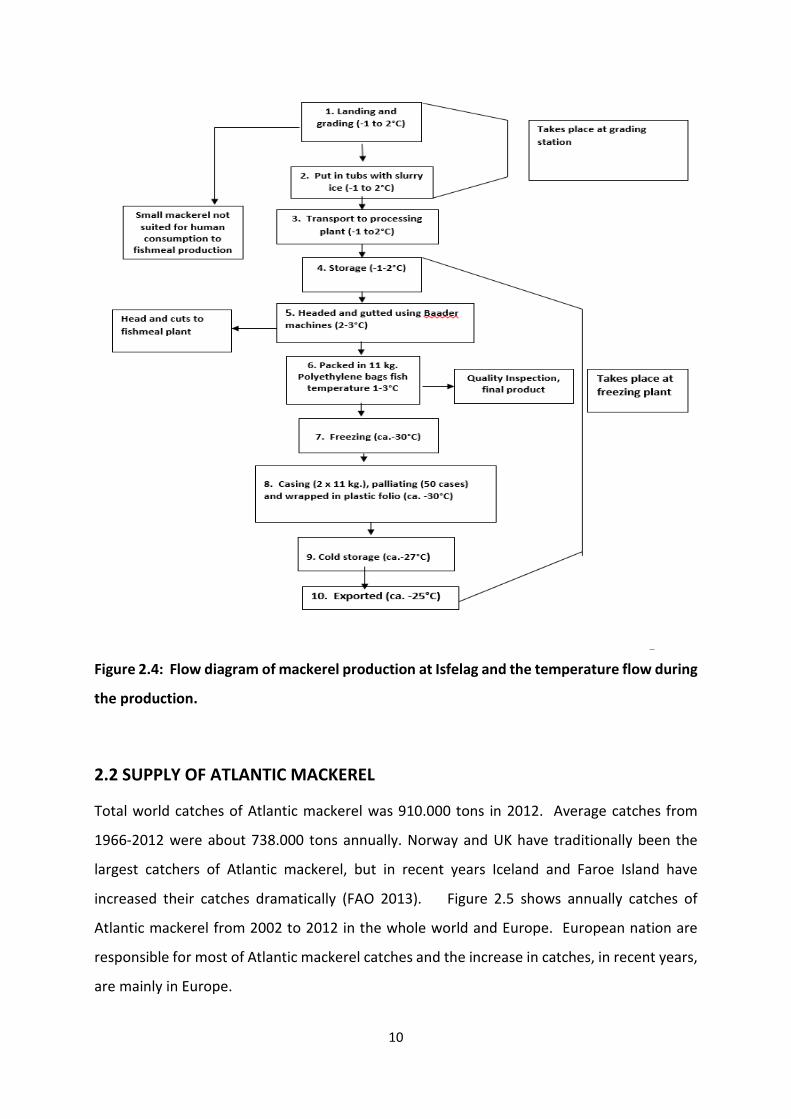
2.1.4 PRODUCTION OF HEADED AND GUTTTED MACKEREL (H/G)
In Figure 2.3, production flow of H/G mackerel is shown. This flowchart is from Isfelag hf.2
Even though each producer has its own characteristics regarding the production flow, the
principles are generally the same. Mackerel is pumped during landing from the chilled storage
tank on board the fishing vessel to a grader (style grader) were it is size graded into two or
three different sizes according to Product Specification from the buyer. From the grader the
mackerel goes into tub with slurry ice (-2 °C), containing about 400 kg. fish and 100 litres
slurry ice. According to Rodriguez et. al. (2004), the two main features of slurry ice are its
faster chilling rate, deriving from its higher heat-exchange capacity, and the reduced physical
damage caused to seafood products by its microscopic spherical particles, as compared with
flake ice. The overall covering of the fish surface by the slurry ice mixture also protects the
fish from oxidation by preventing the action of oxygen. The tubs, containing mackerel in slurry
ice, goes to the processing plant. At the processing plant, the tubs are stored in chilled room
(1-2°C) for 0-10hours before processing. Then the mackerel is headed, the viscera sucked out
and the belly part cleaned through the mouth of the fish. This method obviates the need to
open the belly, but it makes it difficult to sure efficient cleaning of the fish belly. When gutting
2 Isfelag hf. Is an Icelandic fish processing company specialized in production of products from pelagic fish species
Figure 2.3: Expecting chilling down figure for RWS system (Thorsteinsson et. al. 2003)

9
fish, it is important to thoroughly wash it to remove traces of blood and debris, and to wash
bacteria and intestinal content out of the gut cavity, skin, and gills of the fish (Borderias and
Sánchez-Alonso 2011). The H/G mackerel is then packed in plastic polyethylene bags, about
11 kg and about 500 ml of seawater is added for faster freezing. The bags go into plate freezers
for about 4 hours setting the temperature down to about -30°C. It is important that the
processing time is as short as possible to prevent fluctuations in temperature of the fish.
As shown on the diagram (Figure 2.4), the temperature in the mackerel changes during the
process. During optimal conditions the processing time itself is about 10 minutes that is from
the time the mackerel goes through heading and gutting and until it is packed in plastic bag
and placed in the plate freezers. Freezing in plate freezers takes about 4 hours or until its core
temperature reach -30°C. After casing, the product is stored at -27°C until they are exported.
During transportation to the market, the temperature remains at about -25°C. However, the
customer often stores the mackerel at -18°C. Mainly because on packaging is written store
below -18°C.
10
Figure 2.4: Flow diagram of mackerel production at Isfelag and the temperature flow during
the production.
2.2 SUPPLY OF ATLANTIC MACKEREL
Total world catches of Atlantic mackerel was 910.000 tons in 2012. Average catches from
1966-2012 were about 738.000 tons annually. Norway and UK have traditionally been the
largest catchers of Atlantic mackerel, but in recent years Iceland and Faroe Island have
increased their catches dramatically (FAO 2013). Figure 2.5 shows annually catches of
Atlantic mackerel from 2002 to 2012 in the whole world and Europe. European nation are
responsible for most of Atlantic mackerel catches and the increase in catches, in recent years,
are mainly in Europe.

11
Figure 2.5: World catch of Atlantic mackerel 2000-2010 (FAO 2014)
Traditionally UK and Norway are the main fishing nations of Atlantic mackerel in Europe, and
also in the world. Figure 2.6 shows fishing of Atlantic mackerel divided by nations from 2008
to 2012. Norway is the leading fishing nation followed by UK. Iceland and Faroe Islands have
increased its fishing since the mackerel started to migrate into their fishing areas.
Figure 2.6: Fishing of Atlantic mackerel in Europe divided by nations, 2008-2012 (FAO 2014)
0
100000
200000
300000
400000
500000
600000
700000
800000
900000
1000000
2002 2003 2004 2005 2006 2007 2008 2009 2010 2011 2012
Europe
World
0
50000
100000
150000
200000
250000
Russland Faroe Islands Iceland Ireland Norway UK Others
2008
2009
2010
2011
2012
12
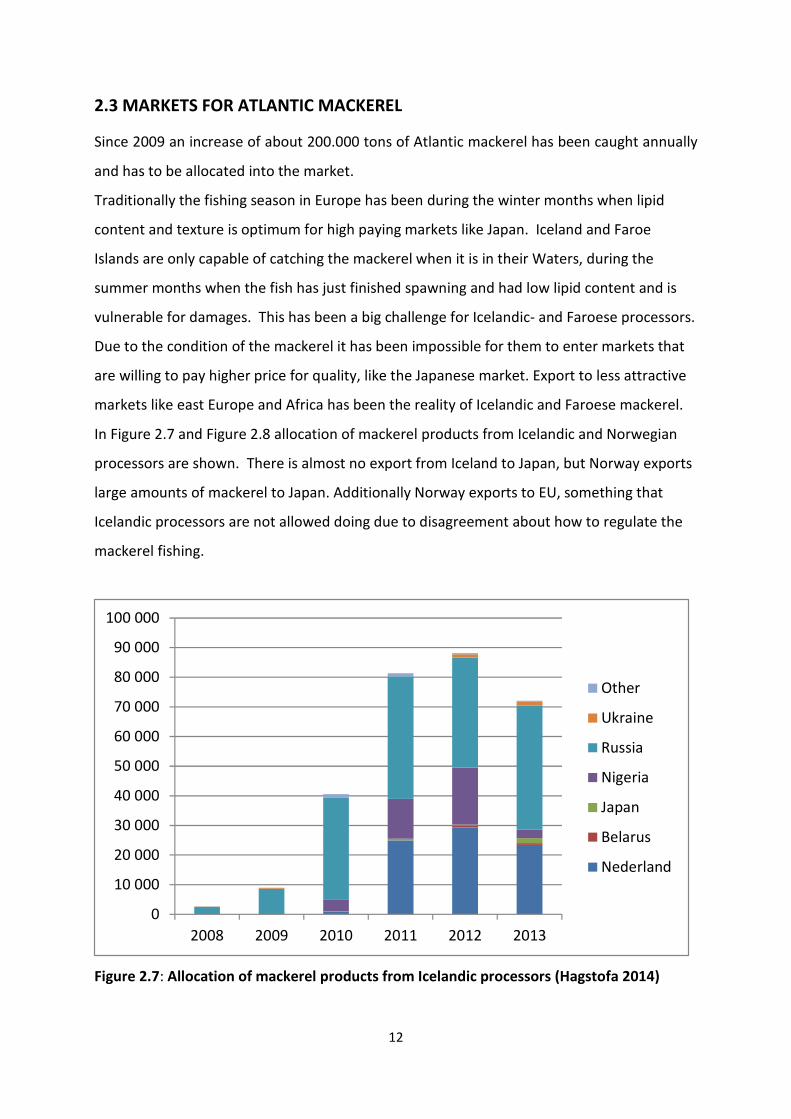
2.3 MARKETS FOR ATLANTIC MACKEREL
Since 2009 an increase of about 200.000 tons of Atlantic mackerel has been caught annually
and has to be allocated into the market.
Traditionally the fishing season in Europe has been during the winter months when lipid
content and texture is optimum for high paying markets like Japan. Iceland and Faroe
Islands are only capable of catching the mackerel when it is in their Waters, during the
summer months when the fish has just finished spawning and had low lipid content and is
vulnerable for damages. This has been a big challenge for Icelandic- and Faroese processors.
Due to the condition of the mackerel it has been impossible for them to enter markets that
are willing to pay higher price for quality, like the Japanese market. Export to less attractive
markets like east Europe and Africa has been the reality of Icelandic and Faroese mackerel.
In Figure 2.7 and Figure 2.8 allocation of mackerel products from Icelandic and Norwegian
processors are shown. There is almost no export from Iceland to Japan, but Norway exports
large amounts of mackerel to Japan. Additionally Norway exports to EU, something that
Icelandic processors are not allowed doing due to disagreement about how to regulate the
mackerel fishing.
Figure 2.7: Allocation of mackerel products from Icelandic processors (Hagstofa 2014)
0
10 000
20 000
30 000
40 000
50 000
60 000
70 000
80 000
90 000
100 000
2008 2009 2010 2011 2012 2013
Other
Ukraine
Russia
Nigeria
Japan
Belarus
Nederland

13
Figure 2.8: Allocation of mackerel products from Norwegian processors (Statistisk
sentralbyra 2014).
Figure 2.7 shows that Russia is the main market for Icelandic mackerel. Only 2,4% are
exported to the lucrative Japanese market in 2013. In comparison Norway exports 21% of its
mackerel to Japan (Figure 2.8).
It has to be noted that these export figures do not reflect the consumption in each import
nation. Mackerel exported to Netherland are often stored in Rotterdam for further export
to Africa and mackerel exported to Lithuania are further processed for other markets like
Germany.
Figure 2.9 shows the average price (USD) of Icelandic and Norwegian mackerel. The
difference between average price (USD/kg.) of mackerel products from Iceland and Norway
was 23.6% in 2009 when it was lowest and 35, 5% when it was highest in 2010. The trend
from 2010 was that the difference was declining, but in 2013 it increased again.
0
50000
100000
150000
200000
250000
300000
350000
Tonn Tonn Tonn Tonn Tonn Tonn Tonn
2007 2008 2009 2010 2011 2012 2013
East Europe others
UA Ukraina
TR Tyrkia
KR Sør-Korea
RU Russland
NG Nigeria
CN Kina
JP Japan
Africa-other
EU-other

14
23, 6% 35, 5% 32, 8% 23, 9% 26, 1%
Figure 2.9: Average price (USD/kg.) mackerel products from Iceland and Norway (Statistisk
sentralbyra 2014, Hagstofa 2014).
There are different product requirements and uses of Atlantic mackerel in the main markets
as shown below (Gustafsson 2013, Pelagia 2014):
Russia: Lipid content and texture are not important for the Russian market. Price is very
important. Some feed content is also tolerated. The Russians prefer whole frozen and H/G
mackerel. The mackerel is used for further processing, smoking and canning. Minimum lipid
content for smoking (15%), low lipid products goes to canning. UK used to be large exporter
of mackerel to the Russian market, but in recent years Iceland has “taken over” mainly
because of H/G mackerel suited for smoking.
Vest Africa: Low quality market. Prefer small whole mackerel, because it cheaper. Bad
texture and some feed content accepted. Mackerel is mainly used because it is a good
source of protein, rather than delicatessen. The mackerel is mainly grilled or cooked before
consumption.
Japan: High quality market. Prefer large whole mackerel (600+) with high lipid content, firm
texture, low feed, and no damages. Have to be blast frozen because contact freezing will
damage the mackerel. Only mackerel caught in the winter season is accepted. Most of the
mackerel is further processed in Japan, filleted and grilled for most parts, but also used for
sushi.
0
0,5
1
1,5
2
2009 2010 2011 2012 2013
Iceland
Norway
Differance
15
East Europe. Buy H/G and whole mackerel as a raw material mainly for further processing
like canning and smoking, Poland and Lithuania are the main markets for further processing.
In general low fat mackerel caught early in the season is suited for canning, for smoking and
marinating the lipid content has to be over 20%, but lower than 26%. Soft mackerel and
some feed content are accepted.
Turkey: Buy whole frozen mackerel of low quality for further processing like canning.
China: For the most parts buy mackerel for further processing and export to Japan. The
processing costs are lower in China compered to Japan. There are same quality- and raw
material requirements as in Japan.
2.4. MACKEREL FOR HUMAN CONSUMPTION
2.4.1 SMOKED MACKEREL
One can divide the fish smoking process in two basic categories: cold smoking and hot
smoking. In the cold smoking processing the smoking of the product takes place at a
temperature up to 33 °C. In this way, one avoids the intense thermal processing and nutrients’
structure is preserved. The consequence will be cold smoking does not provide adequate
protection against harmful microorganisms and further processing is required prior to
consumption. During cold smoking procedure the fish muscle is not cooked and no protein
coagulation is taking place. Although for the majority of cold-smoked foods further thermal
processing is required before consumption, smoked salmon is directly consumed (Bannerman
1980). The cold smoking involves three consecutive steps: salting, drying and smoking at
temperature lower or equal to 30 °C (Montero et. al. 2003). Cold smoked mackerel product
in Russia has 2-3 days shelf life. In most cases cold smoked mackerel are canned before
consumption (Isfelag 2011).
During hot smoking temperature of the product may reach up to 70–80 °C. The above process
results in cooking of the fish thus making it suitable for direct consumption (Bannerman 1980).
16
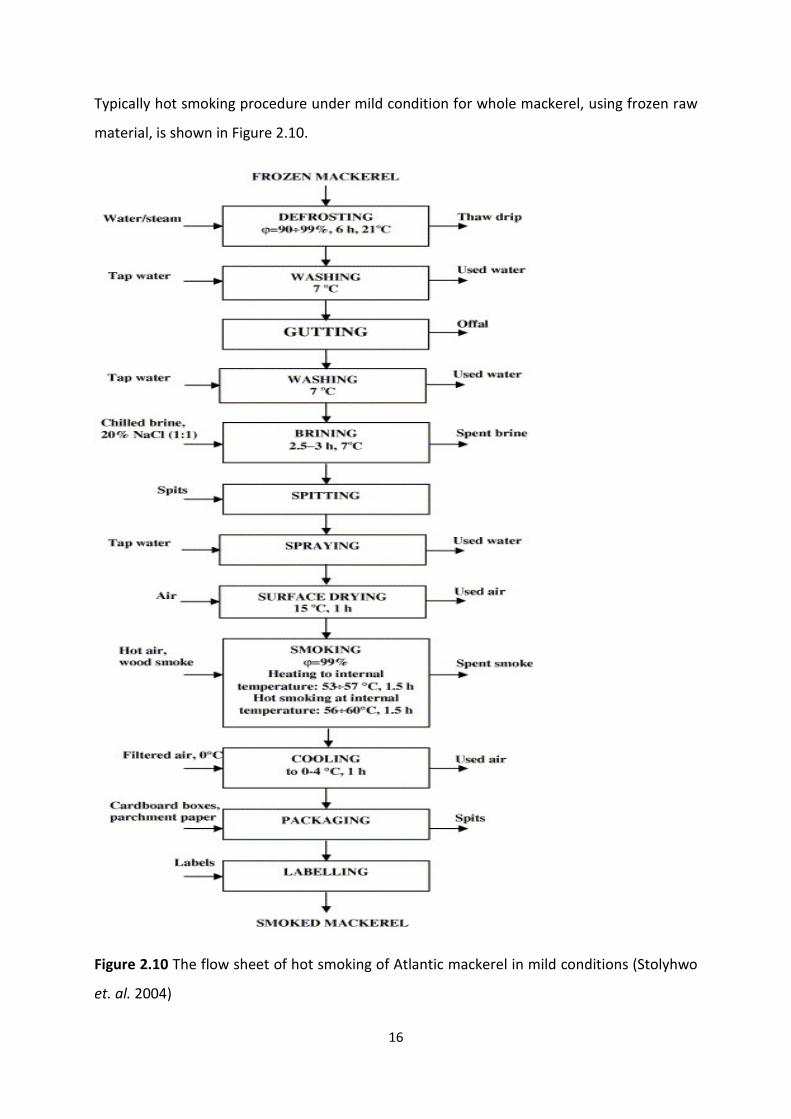
Typically hot smoking procedure under mild condition for whole mackerel, using frozen raw
material, is shown in Figure 2.10.
Figure 2.10 The flow sheet of hot smoking of Atlantic mackerel in mild conditions (Stolyhwo
et. al. 2004)
17
For a product of good eating quality, mackerel with a lipid content of at least 10 per cent is
preferred for smoking. The smoked product can be whole gutted fish, with or without the
head on, or fillets (Keay 2001).
The first step is defrosting the frozen mackerel by air or water. With 21°C running water
defrosting takes about 6 hours (Stolyhwo et. al. 2004). Fishes processed to produce smoked
products should always be fresh because the use of stale fishes can have a negative impact on
final product quality (Bannerman 1980).
Second step is washing and gutting the mackerel and then wash it again after gutting. For
smoked whole fish, one guts the mackerel first, or headed and gutted, as required, the gut
cavity cleaned and the black belly wall lining removed. For hot smoked fillets, single fillets with
skin left on are cut from the whole fish (Keay 2001).
The third step is brining. Prior to hot smoking, fishes are immersed in brine (usually 80 °) to
get the necessary flavour. Higher brine concentration can also be applied for a shorter period,
but it can cause spotting on fish skin due to salt crystallization (Bannerman 1980). Brining
requires some care. In order to minimize the risk of food poisoning organisms growing in the
finished product it is recommended that the salt concentration in the water phase of the
product should be at least 3%; this concentration expressed in terms of water plus the solid
components of the flesh is less than 3 %. To measure the salt concentration in the water phase
it is also necessary to measure the water content of the product. A salt concentration of 3%
does not render hot smoked mackerel unacceptably salty to the consumer according to Keay
2001).
According to (Keay 2001) the rate of uptake of salt during brining depends principally on the
size of the fish; large fish take longer to brine than small ones. Thus to achieve a reproducible
uptake of salt all the fish in a batch should be of about the same weight
A gutted mackerel of average size and fat content has to remain in the usual 80° brine for 5
hours before the salt concentration reaches the recommended 3 per cent, making it difficult
to complete the whole process of gutting, brining and smoking in a normal working day. As an
alternative, the use of a weaker brine for a much longer period allows the fish to lie in brine
overnight. In table 2.1 is a guide following brining conditions, give a satisfactory product.

18
Table 2.1: Brine strength vs. brining time (Keay 2001).
Weight of headed, gutted fish
g Brine strength Brining time
200 40° 17 hours
300 45° 17 hours
400 50° 17 hours
Mackerel fillets take a much shorter time to brine; an average fillet takes about 3 minutes in
80° brine.
Forth step is spitting, spraying and surface drying.
Figure 2.11: Whole mackerel ready for smoking (Keay 2001).
Brined whole fish can be tied by the tails in pairs and hung over tender rods for smoking, or
hung individually by the tails in keyhole slots cut in metal frames designed for the purpose as
shown in the drawing (Figure 2.11). For mackerel with heads on spear can be plugged through
the eyes. Fillets are laid on trays made of nylon coated or stainless steel wire mesh. Trays are
loaded on trolleys which when fully loaded can be left to drain for 1-2 hours or wheeled
directly into the kiln without draining. In kilns with more than one trolley, the first loaded
trolley should be placed at the air outlet end, and the last loaded trolley at the air inlet end
(Keay 2001).
The fifth step is the smoking process. The smoking procedure for whole mackerel in a
mechanical kiln is as follows. With the kiln thermostat first set at 30°C, the air inlet half to
19
three quarters open, and the main fan and chimney fan on, the smoke producer is made to
produce maximum smoke, the recirculation damper being set to balance the smoke pressure
in the kiln. This pre drying and smoking period takes ¾-1 hour, during which time surplus
moisture dries off the surface of the fish, and the skins begin to set. The thermostats are then
reset at 50°C, the air inlet reduced to a quarter open, and the smoke pressure balanced by
resetting the recirculation damper. Temperature and humidity in the kiln begin to rise, and
the fish start to cook; high humidity prevents excessive weight loss. Once the temperature
reaches 50°C it stays like that for ½ hour. The skin of the fish now feels firm and colour begins
to develop. For the final cooking stage, the order of the trolleys is reversed and each trolley is
reversed; in a single trolley kiln, the trolley is reversed. The thermostats are reset at 80°C, the
air inlet closed and the recirculation damper opened only just enough to relieve any
backpressure on the smoke producer. By the time the kiln temperature reaches 80°C, small
mackerel will need a further 40-45 minutes to complete the process; larger fish need about
75 minutes. As a rough guide, the whole smoking process should take about 3 hours. The fish
attain a dark golden brown colour, and the skin is dry with a silky sheen. The flesh should be
completely cooked; the thickest part of the flesh at the shoulders of a whole fish should be
opaque, with no jellylike flakes. (Keay 2001). In the hot-smoking process, products are
exposed to a wide range of temperatures (40–100 °C) while the temperature of the central
point of the food can reach up to 85 °C. According to (Ünlüsayin et. al. 2006), the rate of
deposition of different compounds depends upon the temperature, moisture, flow rate and
density of the smoke, the water solubility and volatility of the particular compounds, as well
as the properties of the fish surface. For example, increase in moisture and temperature can
decrease the deposition rates while increase of flow rate and density of smoke causes the
appearance of increased deposition rates. In the case of temperature, there is always an
optimum value that has to be defined to achieve the highest deposition rates. It has also been
demonstrated that many smoke substances can interact with substances in the surface of the
smoked fish increasing their deposition rates.
The sixth step is cooling of the mackerel after the smoking proses. The purpose of this is to
get the temperature of the product down to 0-4°C prior to packing. After hot smoking, the
temperature of the product can be reduced by diverting the smoke to another point of the
system and replacing it with air of decreased temperature for a period of 20 min. Another
20
well-applied method is the cooling of full trolleys in a low temperature room. This is vital
because fish products stored without any prior cooling can be contaminated by moulds.
(Bannerman 1980)
Seventh and final step is packing, labelling and storing. Several packaging materials such as
cardboard, polyethylene as well as VP conditions can be used for packaging food products.
One day after packaging, products obtain the desirable organoleptic characteristics. Hot-
smoked foods can be effectively preserved at −30 °C for more than 6 months (Bannerman
1980).
Several factors can affect the effectiveness of the smoking method. The most important ones
are raw material handling, temperature during the process, a w3, smoke characteristics and
duration of smoking (Goulas and Kontominas 2005). Hot-smoking process combines
satisfactorily thermal processing, which results in heating and drying, with smoking, thereby
creating unfavourable conditions for the growth of harmful microorganisms and minimizing
the rate of oxidative reactions (Arvanitoyannis and Kotsanopoulos 2011).
The preservation of the food is guaranteed by the antioxidant and antimicrobial properties of
certain molecules (Cornu et. al., 2006). For example, phenolic compounds generated by the
combustion combined with the temperature and the conditions of smoking can reduce the
microbiological development and the oxidation (Kjällstrand and Petersson 2001). Substances
like formaldehyde and phenols are released during burning of woods imparting to smoking its
preservative properties. Thanks to these substances, smoking procedure inhibits the growth
of many microorganisms and limits the oxidative reactions (Muratore et. al. 2007). According
to Varlet et. al. (2007), Phenolic compounds generated by the combustion combined with the
temperature and the conditions of smoking can reduce the microbiological development and
the oxidation. In the smoking process woods like ivory are often used for the flavouring of the
food and the typical organoleptic qualities that this process confers to the smoked food.
According to US Food and Drug Administration (US FDA), product’s temperature must reach
62.8 °C and should be kept under these conditions for 30 min. In this way, food pasteurization
takes place thereby protecting it against harmful microorganisms (Huang et. al. 2002).
3 Water activity

21
According to study made by Jónsson and Sveinþórsdóttir 2011, the yield from frozen raw
material after brining and smoking was calculated to 84% and the composition of hot smoked
Atlantic mackerel was; Water 53,4%, Protein 19,9%, Lipid 26,7% Ash 1,2%, Salt 0,18% %.
The composition of lipids in smoked products depends primarily on their contents and state
in the fish used for smoking. The conditions and time of chilling and frozen storage of fish
affect the rate of oxidation (Kolakowska et. al. 1998). Further factors influencing the state of
lipids are the preparation of the raw material for smoking, the smoking itself, and storage of
the products. Brining, drying, heating, and the reactivity of smoke components may have an
impact on the rate of lipid changes by affecting the tissue enzymes involved in oxidation
reactions, as well as by generating and changing the stability of radicals. During brining, the
fish meat takes up the required quantity of salt, but also some cations present as impurities,
that may have pro oxidative activity. The reaction rate of peroxidation of FA may also increase
due to drying and heating in the initial stages of the process, when the concentrations of
phenolic smoke antioxidants in the meat are still low. The extent of loss of moisture and the
duration and temperature of heating may also be important (Kolakowska et. al. 2003)
Smoking is applied to produce products that preserve organoleptic characteristics at higher
levels and increase the shelf life of products, thus enhancing their acceptability by consumers.
The qualitative characteristics of Atlantic mackerel treated with hot-smoking procedure at 60
°C were evaluated by (Kolodziejska et al. 2002) the NaCl content was about 14–27 g kg−1 of
flesh. Immediately after packaging, the aerobic plate count was 0–0.48 cfu cm−2 of skin surface
and 10–240 cfu g−1 of meat (1.9-log cycle decreased compared to raw product preserved
under refrigerated conditions). At 2 °C, no changes were observed for a 3-week period. After
2 weeks of storage at 8 °C, microbial levels of the flesh were about 1.8 × 10²–1.6 × 10⁷ g−1. Skin
microbial populations remained stable for 21 days at both 2 °C and 8 °C. During storage, colour
values decreased from 4.4 to 3.5 at 2 °C and 8 °C, while rancid off-odour increased from 1.0
to 1.3 at 2 °C and from 1.0 to 2.0 at 8 °C, respectively (values presented in a five-point scale).
Özogul and Balikci (2011) investigated the effects of hot smoking in combination with
marinating and VP (vacuum packing), on the qualitative characteristics of mackerel (Scomber
scombrus) stored at 4 °C. It was proved that sensorial properties of all samples (with or
without dill leaves) were degraded during storage. After storage, samples were still of
22
acceptable quality, according to panellists. Total volatile basic nitrogen (TVB-N) level was
estimated at 24.14 mg/100 g at the start of the experiment, and several fluctuations were
observed throughout storage period. TVB level was characterized by significant (p < 0.05)
enhancement for all samples while the level of fatty acids was enhanced from 2.46 to 7.43.
Neither Escherichia coli nor S. aureus was isolated during the whole storage period, while total
viable counts (TVC) were maintained at decreased levels (<106 log cfu g−1). It was finally
demonstrated that the shelf life of products was 9 months and smoking in combination with
marinating and VP preserved effectively the quality of the fish. Smoking process has the
advantage of enriching the fish flesh with various antimicrobial and antioxidants thereby
imparting a special flavour and aroma to the product (Munasinghe et. al. 2003)
2.4.2 CANNING OF MACKEREL
Canning belongs to the most important means of fish preservation (Aitken and Connell 1979;
Horner 1997). Many marine fish species produce excellent canned products, supporting an
important role in the field of human nutrition and an annual export value around 2 million
tons in the latest years (FAO 2013). Some marine species do not adapt to canning because the
flesh disintegrates under the severe thermal processing conditions. This is the case with some
lean fish, with their delicate flavour and structure, which are rendered virtually unmarketable
by conventional canning processes (Aubourg 2001). Mackerel may be canned as steaks, as
fillets in a variety of sauces, or as a cold smoked product (Keay 2001). Canning takes place
using several steps shown in Figure 2.12.
The raw fish can be either frozen or fresh. Frozen mackerel is thawed up by same method as
when smoking (Figure 2.10). Since most species used for canning occur in glut quantities,
canneries often store the raw material before it is canned. Many of the problems with canned
fish have to do with the quality of the raw material, which continuously changes during
storage prior to processing. Two main strategies have been employed in countries where a
developed technology is available, namely chilled and frozen storage.
As a result, the quality of canned fish will also depend largely on the adequacy of the methods
used to hold the raw material (Aubourg 2001).

23
Figure 2.12. Steps included in the canned fish manufacture (Aubourg 2001).
The precooking method of canning cooking is accomplished using steam, oil, hot air, or smoke
for 1.5 to 10 hours, depending on fish size. Precooking removes the fish oils and coagulates
the protein in the fish to loosen the meat
As with any other treatment, canning should be to retain as much as possible of all the
nutritional constituents present in the initial matter to serve human nutrition. The extensive
24
heat treatment involved in the cooking and sterilization steps substantially alters the nature
of the raw material so that, in effect, a product with different characteristics is formed. Thus,
both enzymes and bacteria should be permanently inactivated by heat and, provided
reinfection does not occur and no negative interaction with the container is produced, heat
processed fish keeps for a very long time.
Canned mackerel steaks are prepared in the following way. The whole fish is headed and
gutted, and the belly cavity cleaned out. The black skin is removed from the belly wall, and
traces of blood along the backbone are brushed away. The fish are then cut into steaks of a
length to suit the pack; for example, steaks 6-7 cm long are suitable for a 220 g cylindrical can.
The pieces are packed vertically in the can to give a product that resembles a middle cut steak
of a larger fish like tuna or salmon. After adding 3 g of salt, the can is closed and heat processed
for 90 minutes at 115°C. Vegetable oil, mackerel oil or tomato sauce can be added to the can
before closing, or the pack can be left dry to suit particular markets. The finished cans should
be stored for about 1 month before labelling and distribution; there is no further significant
change in flavour or texture during storage after that time (Keay 2001).
Mackerel fillets or pieces for canning in a sauce are first soaked in saturated brine for 6
minutes, then packed into 200 g oval or ring-pull cans and steamed for 10 minutes. Any liquor
in the can is then poured off, the can is filled with hot sauce, closed and heat processed for
about 60 minutes at 115°C, the time depending on the ratio of fish to sauce. Variety of sauces
are used; port, cider and sweet-and-sour sauces are acceptable during trials (Keay 2001).
During the canning process, cooking reduces excess moisture, so that the total exudate
released in the canned product is minimum, the sensory, physical and chemical qualities of
the product are improved and the shelf life is prolonged. After cooking and before being
placed in cans, the fish is chilled in canneries by allowing it to stand at room temperature (12–
18 °C), usually overnight. The length of cooking depends on fish weight and initial
temperature (Pérez-Martín et. al. 1989). After processing, a relative increase in lipid content
occur due to water loss (Gallardo et. al., 1989; García Arias et. al., 1994). Losses in moisture
increase with the previous chill time, and fish having medium fat content lose more weight
and moisture than those with higher fat content (Joshi and Saralaya 1982). Damage pathways
have been observed during the cooking treatment concerning the nutritional and sensory
25
qualities, especially if over-processing is carried out according to Cheftel and Cheftel 1976 and
Pigott and Tucker 1990, they also found out that heat degradation of nutrients, oxidation of
vitamins and lipids, leaching of water-soluble vitamins, minerals and proteins and toughening
and drying of fragile protein fish.
2.4.3 MACKEREL PATE
According to Keay 2001 a delicious pate can be made from the flesh of hot smoked mackerel.
The flesh is taken off the whole smoked fish, and all bones are carefully removed. For
commercial production, this can be done satisfactorily in a mechanical separator. The flesh is
mixed with softened or melted butter in a high-speed blender, using seven parts by weight of
fish to three parts of butter. When the mixture is of smooth consistency, flavouring or spices
are often added if required; for example, lemon juice and pepper can be used. Manufacturers
can readily devise their own variations on the basic recipe. Some white fish flesh is sometimes
added to compensate for variations in the fat content of the mackerel flesh in the mix.
The product is not sterile, and should not be kept more than 1 day at ambient temperature,
or more than 5 days at 0-2°C. The pate can be frozen and cold stored in suitable containers,
or it may be canned after adding a stabilizer.
2.4.4 SALTED MACKEREL
Quantities of mackerel were at one time pickle cured in barrels for export, and small amounts
are still occasionally packed in this way.
Fresh mackerel are split along the back, and opened with a jerk to break the ribs. Guts, gills
and any protruding bones are removed, and blood is washed away from the backbone. The
fish are soaked in fresh water for up to 2 hours, rinsed, drained and then dipped in dry salt.
The fish are packed in barrels in circular fashion with tails to the centre, and salt is sprinkled
on each layer. The first two or three layers are packed skin downwards, and succeeding layers
skin upwards. About 1 kg salt to 3 kg fat mackerel or 4 kg lean mackerel is required throughout
the pack. When the barrel is full it is closed, laid on its side, topped up with brine through the
bung and left for 10-12 days, further brine being added if required to keep the barrel full. The
fish are usually graded and repacked for shipment; the fish are repacked in the barrel in the
26
same way, but with less salt, about 1 kg salt to 6 kg fish. The barrels are topped up with 95°
brine, the bungs are closed and the barrels set on end for labelling and dispatch. Fillets of
mackerel can be pickle cured in barrels in the same manner as split mackerel. (Keay 2001)
2.4.5 MARINATED
Marinating, a food-preservation technique, is based on treatment of muscles with solutions
containing salt, spices, curds, lemon juice, etc., and provides high sensory acceptability to a
variety of meat products (Yashoda et. al. 2005). Marinated fish is treated with acids (acetic or
citric), salt, sugar, spices and oil in order to improve the flavours and textural properties of the
seafood (Hwang and Tamplin 2005). Marinating process slows down the bacterial and enzyme
activity and provides taste, tenderness, textural and structural changes with a prolonged shelf
life (Sallam et. al. 2007).
I Japan mackerel fillets are marinated in different way making numerous products. One of
these products is Shimesaba with annual production of 5-6000 tons. For making this product
mackerel fillets are cured in 10% brine for 1 day and then soaked in marinade broth for 1 day.
The broth contains different ingredients distinguished to each individual manufacturer often
though containing 30% vinegar (Furutani et. al. 2013)
2.5 THE STRUCTURE AND COMPOSITION OF MACKEREL
2.5.1 CHEMICAL COMPOSITION OF ATLANTIC MACKEREL
As with many animal products, fish and fishery products contain water, proteins and other
nitrogenous compounds, lipids, carbohydrates, minerals and vitamins. However, the chemical
composition of fish varies greatly from one species and one individual fish to another
depending on age, sex, environment and season (Huss 1995). What characterize pelagic fish
species as Atlantic mackerel, are huge variations in compositional parameters depending on
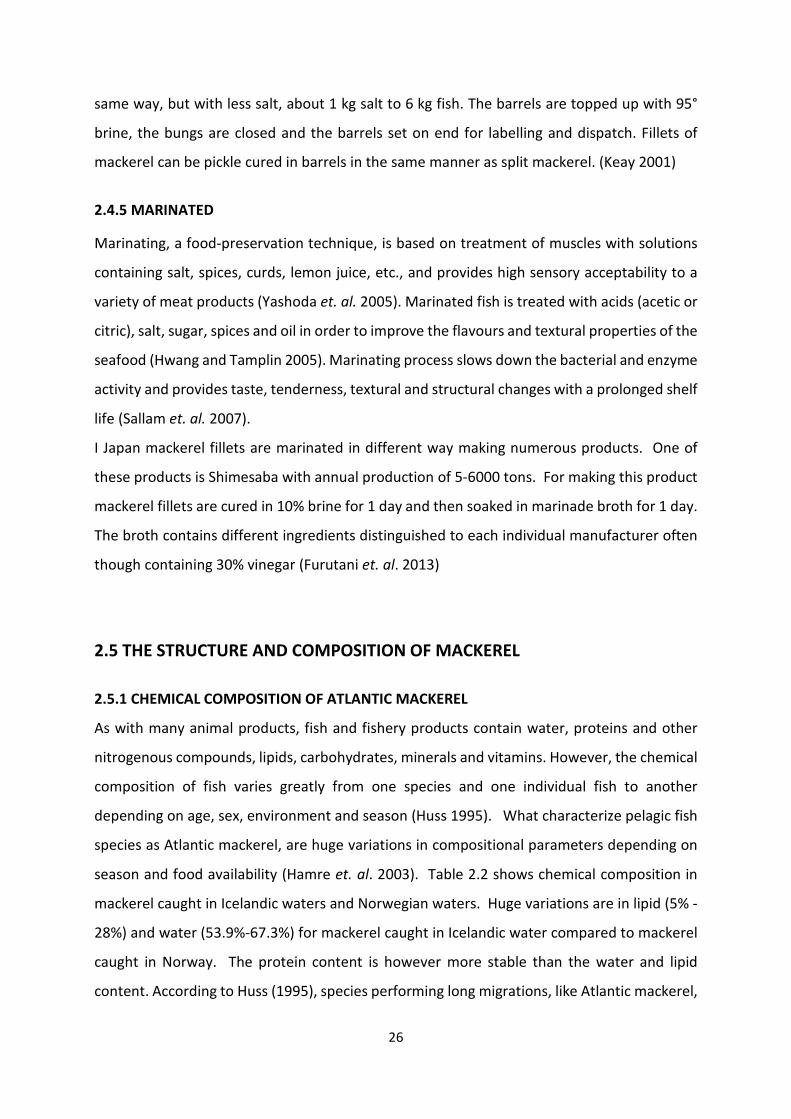
season and food availability (Hamre et. al. 2003). Table 2.2 shows chemical composition in
mackerel caught in Icelandic waters and Norwegian waters. Huge variations are in lipid (5% -
28%) and water (53.9%-67.3%) for mackerel caught in Icelandic water compared to mackerel
caught in Norway. The protein content is however more stable than the water and lipid
content. According to Huss (1995), species performing long migrations, like Atlantic mackerel,
27
before they reach specific spawning grounds may utilize protein in addition to lipids for
energy, thus depleting both the lipid and protein reserves, resulting in a general reduction of
the biological condition of the fish. According to Braekkan and Boge (1962) amino acid,
composition of mackerel muscle protein is similar to other common commercial fish spices,
except the content of histidine where it is about twice as high (4.5%).
The chemical composition of mackerel, like most fish species, relates closely to feed intake,
migratory swimming and changes in connection with spawning. The single factors having the
most pronounced impact on the chemical composition is probably the feed composition (Huss
1995).
Table 2.2: Chemical composition of Atlantic mackerel filets per 100g/eatable part from
mackerel caught in the fishing seasons in Iceland (summer) and Norway (winter) (average).
(Ísgem 2011, Nifes 2006)
Iceland Norway
Nutrient 100 g/eatable part
Range 100 g/eatable part
Range
Protein total 19,6 18,4 – 21 16,9 15,7-17,6
lipid total 18,8 10,5– 24,2 32 30-34
Saturated 4,5 10 12-14
Carbohydrate 0 0
Water 60,1 53,9-67,3 51 49-53
Minerals 1,2 1,1-1,6 0,9 08-1,1
2.5.2 SEASONAL VARIATIONS IN LIPID CONTENT OF ATLANTIC MACKEREL
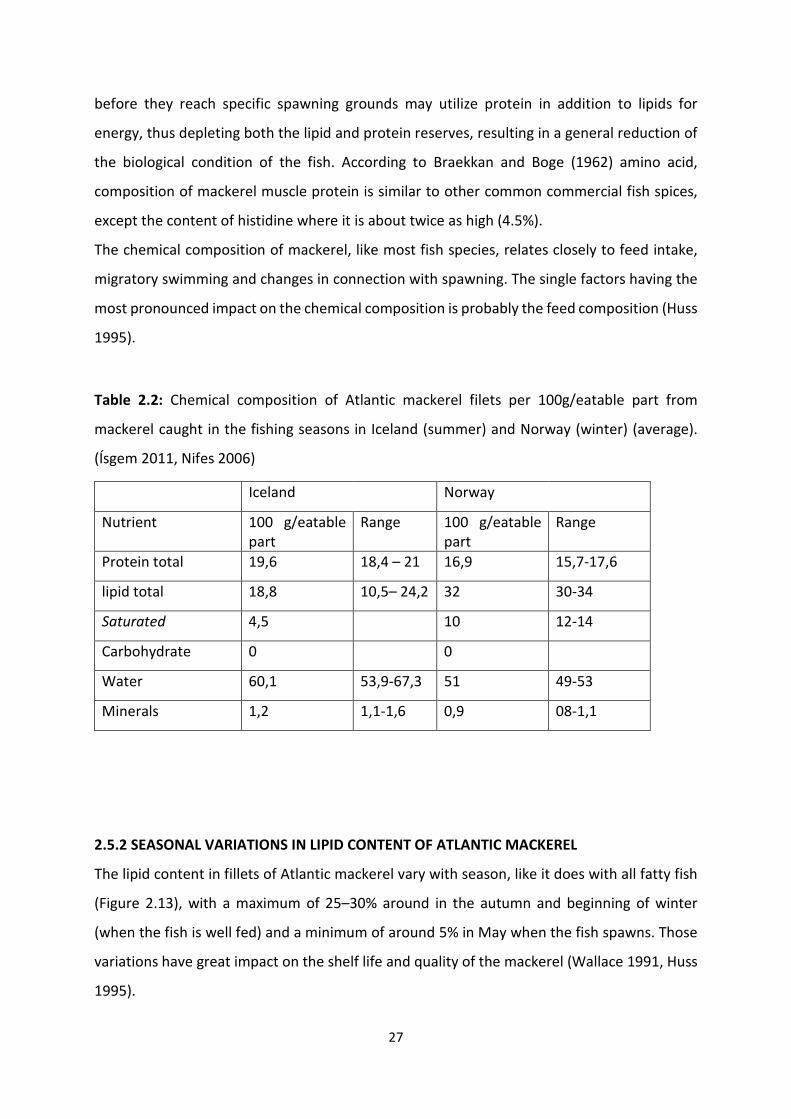
The lipid content in fillets of Atlantic mackerel vary with season, like it does with all fatty fish
(Figure 2.13), with a maximum of 25–30% around in the autumn and beginning of winter
(when the fish is well fed) and a minimum of around 5% in May when the fish spawns. Those
variations have great impact on the shelf life and quality of the mackerel (Wallace 1991, Huss
1995).
28
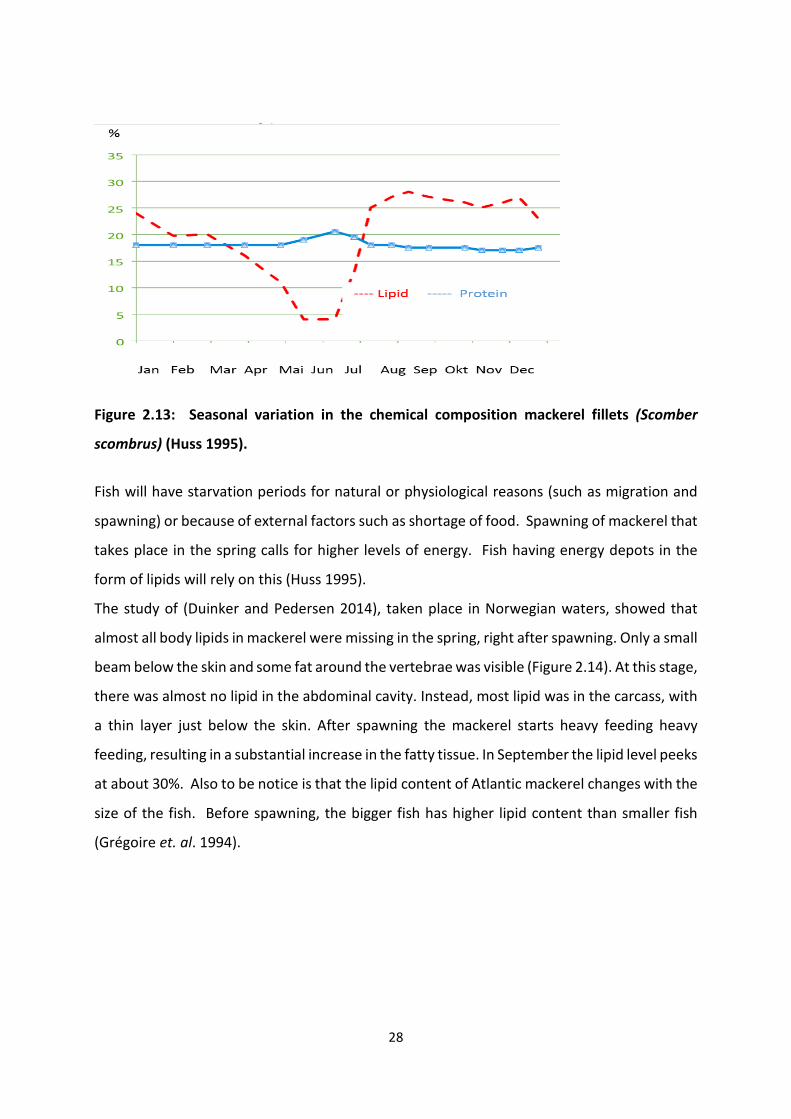
Figure 2.13: Seasonal variation in the chemical composition mackerel fillets (Scomber
scombrus) (Huss 1995).
Fish will have starvation periods for natural or physiological reasons (such as migration and
spawning) or because of external factors such as shortage of food. Spawning of mackerel that
takes place in the spring calls for higher levels of energy. Fish having energy depots in the
form of lipids will rely on this (Huss 1995).
The study of (Duinker and Pedersen 2014), taken place in Norwegian waters, showed that
almost all body lipids in mackerel were missing in the spring, right after spawning. Only a small
beam below the skin and some fat around the vertebrae was visible (Figure 2.14). At this stage,
there was almost no lipid in the abdominal cavity. Instead, most lipid was in the carcass, with
a thin layer just below the skin. After spawning the mackerel starts heavy feeding heavy
feeding, resulting in a substantial increase in the fatty tissue. In September the lipid level peeks
at about 30%. Also to be notice is that the lipid content of Atlantic mackerel changes with the
size of the fish. Before spawning, the bigger fish has higher lipid content than smaller fish
(Grégoire et. al. 1994).
29
Figure: 2.14: Seasonal variations in lipid content of mackerel (with MR imaging) (Duinker
and Pedersen 2014).
2.5.3 LIPID
One of the main characteristics observed in certain fish species is the ability to store up large
quantities of lipids, for example, when food becomes scarce, as a source of energy for needs
related to basal metabolism, migration and reproduction. In these species, it is normal to see
large variations in lipid content in the course of a year. Knowledge of the annual lipid cycle of
a commercial species like Atlantic mackerel is essential for fishermen and processors. Lipid
content is basic factor in determine the commercial value of the Atlantic mackerel. Lipid
content is considered to be one of the main factor determining further processing and
allocation of the mackerel (Grégoire et. al 1994, MaArdle et. al. 1986, Pelagia 2015).
The lipid distribution in the total, intact mackerel is not well known. Furthermore, there is still
a lack of understanding in the dynamics of lipid storage in mackerel. More knowledge will not
only have consequences for fish nutrition and fish biology, in terms of the influence from the
30
prey composition on the fatty acid composition in the fish, but also for technological
development used for fish localization and for the measurement of fish quantity and quality
(Fjermestad et. al. 2000).
There are several lipid studies on mackerel. These have mainly focused on the lipid content
of the fillet and the consequences of this content on the quality of the final fish product as
experienced by the consumer, and on the fatty acid oxidation in the red and the white muscle
(Fjermestad et. al. 2000, Wallace 1991 and Gregoire et. al. 1994). It is clear that the maturity
and fish size have effects on the lipid content of the fillet (Wallace 1991). The lipid content in
the fillet inversely correlate to the growth of the gonads. Furthermore, the maximum lipid
content is expected to vary from year to year (Gregoire et. al. 1994). It is also known that
different taxonomic groups within the planktonic food web retain DHA (docosahexaenoic
acid) differently, that EPA (eicosapentaenoic acid) is highly retained in zooplankton, whereas
in fish DHA is highly retained (Kainz et. al. 2004).
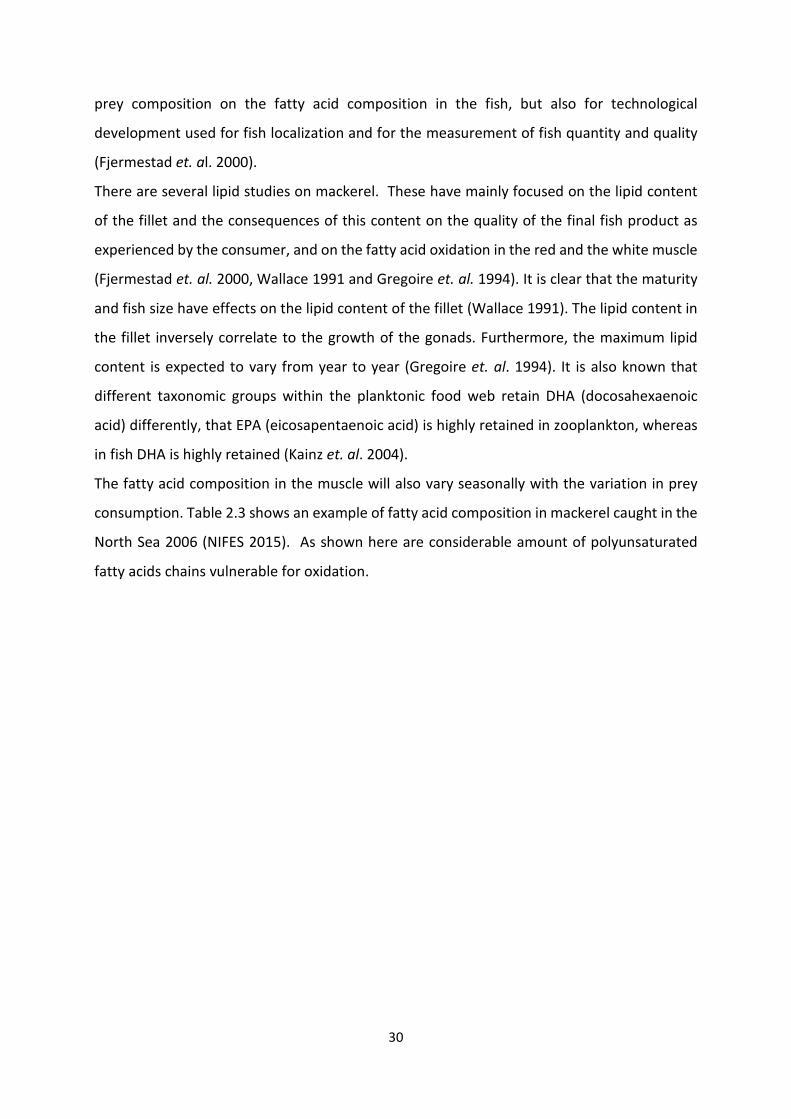
The fatty acid composition in the muscle will also vary seasonally with the variation in prey
consumption. Table 2.3 shows an example of fatty acid composition in mackerel caught in the
North Sea 2006 (NIFES 2015). As shown here are considerable amount of polyunsaturated
fatty acids chains vulnerable for oxidation.
31
Table 2.3. Fatty acid in mackerel with 32% lipid content in the North Sea 2006 (NIFES 2015).
Fatty acid Unit Mean Range
14:0 mg/100g 2420 2197-2870
14:1n-9 mg/100g <1 <1-<1
15:0 mg/100g 153 141-180
16:0 mg/100g 3586 3232-4055
16:1n-7 mg/100g 1056 931-1223
16:1n-9 mg/100g 57 46-64
16:2n-4 mg/100g 92 73-112
16:3n-3 mg/100g <1-56
16:4n-3 mg/100g 127 92-154
17:0 mg/100g 94 81-116
18:0 mg/100g 574 519-652
18:1n-11 mg/100g 116 89-167
18:1n-7 mg/100g 454 387-544
18:1n-9 mg/100g 2425 1981-2898
18:2n-6 mg/100g 521 479-588
18:3n-3 mg/100g 578 525-674
18:4n-3 mg/100g 1908 1736-2403
20:0 mg/100g <1-44
20:1n-11 mg/100g 264 204-330
20:1n-7 mg/100g <1-42
20:1n-9 mg/100g 2988 2634-3686
20:2n-6 mg/100g 93 74-107
20:3n-3 mg/100g 55 39-64
20:3n-6 mg/100g <1-44
20:4n-3 mg/100g 401 363-442
20:4n-6 mg/100g 133 112-150
20:5n (EPA) mg/100g 2349 1937-2763
22:0 mg/100g <1 <1-<1
22:1n-11 mg/100g 4776 4248-6110
22:1n-9 mg/100g 263 240-300
22:5n-3 (DPA mg/100g 381 299-442
22:6n-3 (DHA) mg/100g 3741 3338-4346
24:0 mg/100g <1 <1-<1
24:1n-9 mg/100g 442 391-519
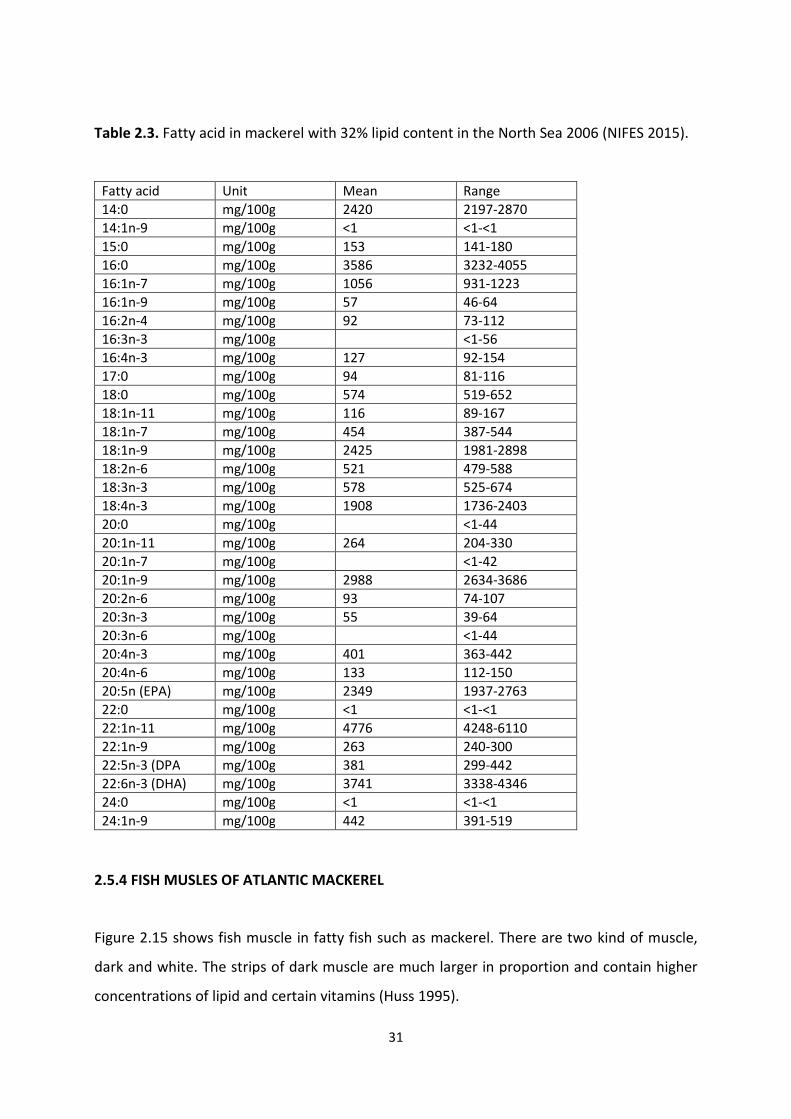
2.5.4 FISH MUSLES OF ATLANTIC MACKEREL
Figure 2.15 shows fish muscle in fatty fish such as mackerel. There are two kind of muscle,
dark and white. The strips of dark muscle are much larger in proportion and contain higher
concentrations of lipid and certain vitamins (Huss 1995).
32
Figure 2.15: Dark and white muscle in fatty fish (Huss 1995).
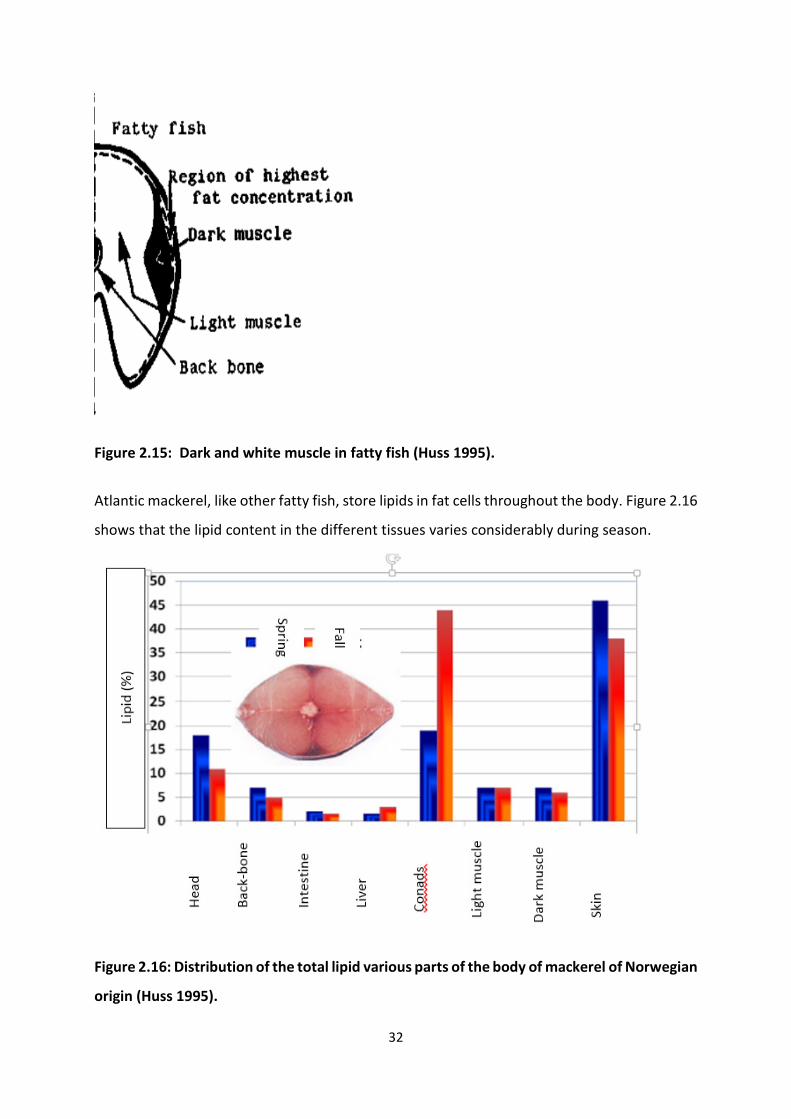
Atlantic mackerel, like other fatty fish, store lipids in fat cells throughout the body. Figure 2.16
shows that the lipid content in the different tissues varies considerably during season.
Figure 2.16: Distribution of the total lipid various parts of the body of mackerel of Norwegian
origin (Huss 1995).
33
According to Huss (1995), the lipid cells making up the lipid depots in fatty species are typically
located in the subcutaneous tissue, in the belly flap muscle and in the muscles moving the fins
and tail.
Lipid depots are also typically found spread throughout the muscle structure. The
concentration of lipid cells appears to be highest close to the myocommata and in the region
between the light and dark muscle (Kiessling et al. 1991). The dark muscle contains some
triglycerides inside the muscle cells, as this muscle is able to metabolize lipids directly as
energy. The corresponding light muscle cells are dependent on glycogen as a source of energy
for the anaerobic metabolism.
2.6 SPOILAGE OF FRESH FISH
According to Hayes 1985 spoilage can be defined as a change in fish or fish products that
renders them less acceptable, unacceptable or unsafe for human consumption. As soon as a
fish dies, spoiling process begins. It starts with Rigor mortis. Rigor mortis is the process
through which fish loses its flexibility due to stiffening of fish mussels, when this process starts
and finish is related to factors like temperature and fish species. Often it start few hours after
death (Adebowale et al. 2008). Most fish species degrade because of digestive enzymes and
lipases, microbial spoilage from surface bacteria and oxidation (AMEC 2003).
Atlantic mackerel is seldom gutted at sea; they therefore spoil quickly unless they are chilled
immediately after catching and kept chilled. Furthermore fresh mackerel is more delicate for
handling because the muscle is soft and fatty and the skin is not thick. According to various
studies shelf life of fresh cooled mackerel is 5-7 days (Xing et. al. 1993) up to 9 days in ice
(Jhaveri et. al. 1982) and 6–9 days for mackerel depending on the ice: fish ratio (Bennour et
al. 1991). It is possible to increase the shelf life with undercooling (-2°C) and MAP or up to 21
days (Hong et. al. 1996).
The lipid content is also very vital. Mackerel with a lipid content of about 10% will develop off
odours after 1-2 days at 10°C, will be soft and spoiling rapidly after 3 days, and will be putrid
after 5-6 days (Keay 2001). Fish with high lipid content spoil even faster. Storage of fish caught
during heavy feeding and or spawning seasons show wide variations in spoilage rate. Heavily
feeding fish tend to be more susceptible to autolytic tissue degradation than the petite
34
feeders. The type of feed /food on which fish is feeding on may similarly have an effect on
their spoilage rate during storage. Findings show that non-feeding fish have low levels of
bacteria in the intestines as compared to the heavily feeding fish. In this sense, previous
research has unveiled an important endogenous pro-oxidant activity (Huss 1995; Decker and
Hultin 1990 and Saeed and Howell 2001) and quality loss during frozen storage (Jia et. al. 1996)
and further processing (Zotos et. al. 1995).
Fishing technique, fishing area, handling practices, preservation, storage time, temperature,
and qualitative and quantitative composition of fish micro flora also affect the quality and
shelf life (Connell 1990; Burt and Hardy 1992; Gram and Huss 1996; Olafsdottir et al. 1997).
During fish spoilage, there is a breakdown of various components and the formation of new
compounds. These new compounds are responsible for the changes in odour, flavour and
texture of the fish meat. This represents a major concern of the freshness of saleable products
and the breakdown of proteins and lipids (Mahmoud et. al. 2006). After capture, it is
important to get the temperature of the mackerel down to -2°C-0°C on board the vessel. The
time from catching and until the mackerel is frozen should not excide 24hours. Mackerel with
a high lipid content should preferably be frozen within 12 hours from capture to prevent
spoilage. Stale or noticeably spoiled mackerel is not suited for processing. The signs of stale
fish are as follows: Eyes are sunken, cloudy and discoloured red or brown. The skin has lost
bloom, and its colours have lost intensity and brilliance, giving a washed out appearance. Gills
are dark red or brown, and a dark blood red mucus oozes from the gill covers. The odour of
the gills and body is sour, sweaty or strongly oily; sometimes a smell of ammonia is also
present (Keay 2001).
Fish quality (freshness) is often assessed by sensory methods based on changes in appearance,
odour, colour, flavour and texture. Other analyses are also used like total volatile base
nitrogen (TVB-N) who is one of the most widely used parameter to evaluate fish freshness and
quality. It represents the sum of ammonia, dimethylamine (DMA), trimethylamine (TMA) and
others basic nitrogenous compounds volatile under the analysis conditions. The TVB-N value
is index and generally used to determine the stage of freshness of fish (along with TMA). A
level of 35-40 mg N/100g of fish muscle is in general regarded as the limit of acceptability,
beyond which the fish can be regarded as spoiled (Lakshmanan 2000). In freshly caught fish,
35
TVB-N content is generally lower than10 mg/100g and does not exceed 15 mg/100g with the
exception of most pelagic fish species. Sardine, mackerel and albacore tuna have been
reported to contain 16-18 mg/100g , 18-20 mg/100g about 30 mg/100 g TVB-N respectively
(El Marrakci et. al. 1990; Malle et. al. 1983; Pérez-Villarreal and Pozo 1990).
2.6.1: AUTOLYTIC ENZYMATIC SPOILAGE
In Atlantic mackerel, the digestive enzymes are very active and begin to attack the walls of the
digestive tract soon after capture. This makes the tissues even more susceptible to rupture by
rough handling (Huss 1995; Stansby and Lemon 1941). Table 2.4 summarize enzymes in the
digestive system of fish, their effects and prevention. The digestive enzymes cause extensive
autolysis. It results in meat softening, rupture of the belly wall and drain out of the blood
water, which contains both protein and oil (FAO 2005). Most of the impact is on textural
quality along with the production of hypoxanthine and formaldehyde. Hansen et. al. (1996)
stated that autolytic enzymes reduced textural quality during early stages of deterioration but
did not produce the characteristic spoilage of off-odours and off-flavours. This indicates that
autolytic degradation can limit shelf life and product quality even with relatively low levels of
spoilage - organisms. When the belly of mackerel is full of feed the belly is very susceptible
to tissue degradation and may produce the condition known as "belly burst” when the nape
area of the fish takes on a brown discoloration (Bonnell 1994).
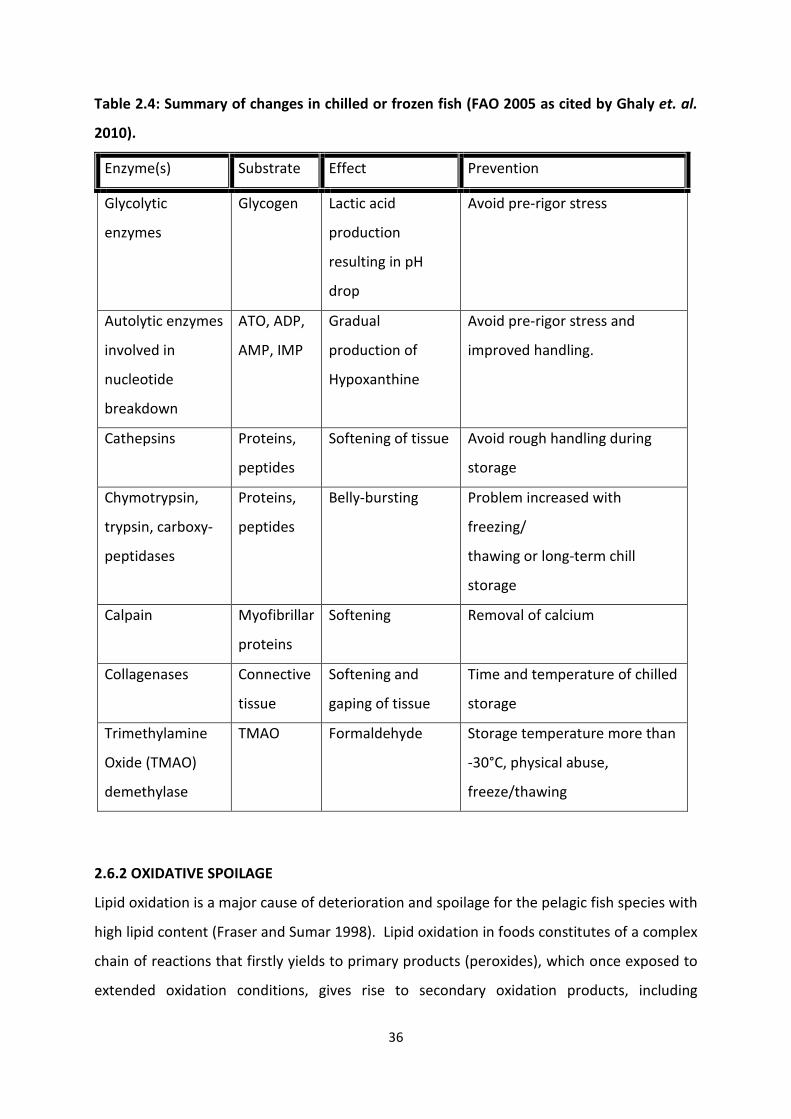
36
Table 2.4: Summary of changes in chilled or frozen fish (FAO 2005 as cited by Ghaly et. al.
2010).
Enzyme(s) Substrate Effect Prevention
Glycolytic
enzymes
Glycogen Lactic acid
production
resulting in pH
drop
Avoid pre-rigor stress
Autolytic enzymes
involved in
nucleotide
breakdown
ATO, ADP,
AMP, IMP
Gradual
production of
Hypoxanthine
Avoid pre-rigor stress and
improved handling.
Cathepsins Proteins,
peptides
Softening of tissue Avoid rough handling during
storage
Chymotrypsin,
trypsin, carboxy-
peptidases
Proteins,
peptides
Belly-bursting Problem increased with
freezing/
thawing or long-term chill
storage
Calpain Myofibrillar
proteins
Softening Removal of calcium
Collagenases Connective
tissue
Softening and
gaping of tissue
Time and temperature of chilled
storage
Trimethylamine
Oxide (TMAO)
demethylase
TMAO Formaldehyde Storage temperature more than
-30°C, physical abuse,
freeze/thawing
2.6.2 OXIDATIVE SPOILAGE
Lipid oxidation is a major cause of deterioration and spoilage for the pelagic fish species with
high lipid content (Fraser and Sumar 1998). Lipid oxidation in foods constitutes of a complex
chain of reactions that firstly yields to primary products (peroxides), which once exposed to
extended oxidation conditions, gives rise to secondary oxidation products, including
37
aldehydes, ketones, epoxides, hydroxyl compounds, oligomers and polymers. Most of these
secondary oxidation products produce undesirable sensorial and biological effects (Marquez-
Ruiz et. al. 2007 and Kanner 2007). Therefore, its control is a fundamental issue.
A free radical process is the basic mechanism upon which lipid oxidation proceeds. The
following three stages characterize this process.
I. Initiation: formation of fatty acid radicals
An alkyl radical (L•) is formed due to the abstraction of hydrogen (H) from a fatty acid (L),
reaction 1. Initiators (In) react by binding a hydrogen atom from an unsaturated lipid leading
to formation of a free radical (McClements and Decker 2007). Reactive oxygen species (ROS)
and other pro-oxidants such as transition metals, ionizing radiation or light and elevated
temperature are responsible for initiation of oxidation reactions (Damodaran 2008).
In• + LH → InH + L• (1)
II. Propagation: fatty acid radical reaction.
An oxygen molecule reacts binding to the fatty acid radical leading to formation of peroxyl---
fatty acid radical (LOO•, see reaction 2). Covalent bonds of unsaturated fatty acids are weak
and susceptible to react with the peroxyl radicals. The reaction between unsaturated fatty
acids and peroxyl radicals leads to the formation of fatty acid hydroperoxyl (LOOH, see
reaction 3) and fatty acid radical (McClements and Decker 2007).
L•+ O2→LOO• (2)
LOO• + LH → LOOH + L• (3)
III. Termination: the combination of two fatty acid radicals leads to the formation of non-
radical products.
Reactions between peroxyl and alkoxyl radicals take place under atmospheric conditions while
reactions between alkyl radicals lead to the formation of fatty acid dimers under low oxygen
levels (McClements and Decker 2007).
LOO• + LOO• → LOOL + O2 (4)
•L• + LOO• → LOOL (5)
•L• + L• → LL (6)
38
Oxidation typically involves the reaction of oxygen with the double bonds of fatty acids. Fish
lipids contain high amount of polyunsaturated fatty acids (PUFAs) and are therefore, are highly
susceptible to oxidation. Molecular oxygen needs to be activated in order to allow oxidation
to occur, but transition metals are primary activators of molecular oxygen (Hultin 1994).
The first compounds formed during the oxidation process are peroxides, especially
hydroperoxides; hence, they are called primary oxidation products. Hydroperoxides usually
suffer further oxidation turning into secondary oxidation products. The wide variety of
secondary oxidation products includes aldehydes, ketones, epoxides, hydroxy compounds,
oligomers and polymers. Among them, both volatile and non-volatile compounds can be
found, such as hexanal and malondialdehyde (MDA) as main representatives, respectively.
Shahidi and Spurvey (1996) illustrated that over time there was generally an increase in
thiobarbituric acid reactive substances (TBARS) value of fresh mackerel. This is attributed to
the fact that during storage oxidation continues lipid hydroperoxides breakdown and produce
secondary oxidation products.
Studies indicate that during food processing storage fluorescent compounds are formed as a
result of reaction of primary and secondary oxidation products with biological amino
compounds (Leake and Karel 1985).
Analysis of these products by using their fluorescent properties is an alternative method of
assessing lipid oxidation (Aubourg 1999). Fluorescence is a rapid and sensitive method for
detecting lipid oxidation. It involves the formation of covalent bonds. These bonds are strong
and resistant to the action of solvents. The structure of the fluorescent compounds will vary
depending on the Iipid and protein groups involved. Biological amines may react with lipid
hydroperoxides and aldehydes (reactions 1 and 2). Both these reactions produce a Schiff base,
which fluoresces and can be measured. The conjugated double bond system is enlarged if this
reaction occurs several times (reaction 3).
Reaction 1: R-CHR’-OOH + R’’-NH2 --�R-OH + R'-CH=N-R"
(lipid hydroperoxide) (primary amine) (Schiff base)
Reaction 2: R-CHO + R'-NH2 --->R-CHOH-NHR' � R-CH=N-R'
(aldehyde) (primary amine) (Schiff base)

39
Reaction 3: R-CH2-CH=N-R' + R’’-CHO � R-C=CH-R"
(Schiff base) (aldehyde) I
CH=N-R'
(conjugated Schiff base)
2.6.3 LIPID HYDROLYSIS
Progressive lipid hydrolysis is shown as free fatty acids FFA. FFAs are either important from
the point of view of oxidation products or have been reported to have a direct sensory
impact. In figure 2.17 lipid hydrolysis were FFA are formed is shown. Triglyceride in the
depot fat is cleaved by enzyme (triglyceride lipase) originating from the digestive tract (HUSS
1995).
Figure 2.17. Primary hydrolytic reactions of triglycerides and phospholipids. Enzymes: PL1 &
PL2 phospholipases;TL, triglyceride lipase (Huss 1995)
In Figure 2.18, examples of rate of oxidation and breakdown of lipid are shown in relation with
time and different analysis method.
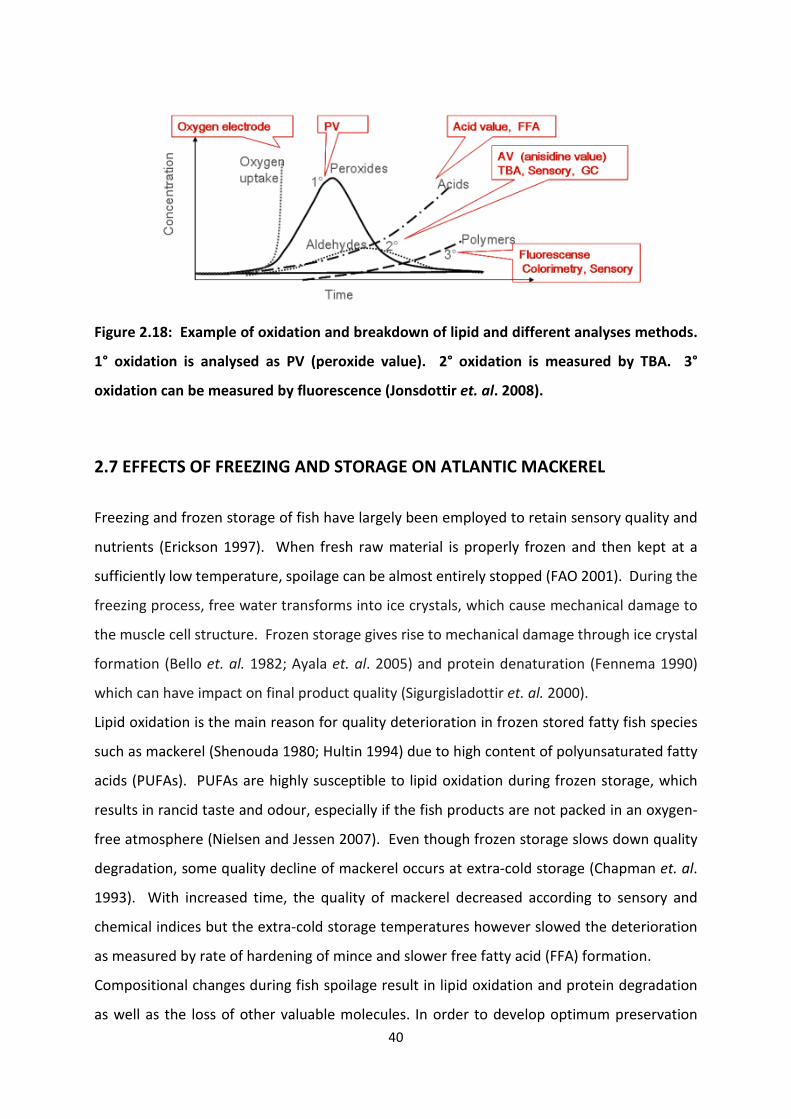
40
Figure 2.18: Example of oxidation and breakdown of lipid and different analyses methods.
1° oxidation is analysed as PV (peroxide value). 2° oxidation is measured by TBA. 3°
oxidation can be measured by fluorescence (Jonsdottir et. al. 2008).
2.7 EFFECTS OF FREEZING AND STORAGE ON ATLANTIC MACKEREL
Freezing and frozen storage of fish have largely been employed to retain sensory quality and
nutrients (Erickson 1997). When fresh raw material is properly frozen and then kept at a
sufficiently low temperature, spoilage can be almost entirely stopped (FAO 2001). During the
freezing process, free water transforms into ice crystals, which cause mechanical damage to
the muscle cell structure. Frozen storage gives rise to mechanical damage through ice crystal
formation (Bello et. al. 1982; Ayala et. al. 2005) and protein denaturation (Fennema 1990)
which can have impact on final product quality (Sigurgisladottir et. al. 2000).
Lipid oxidation is the main reason for quality deterioration in frozen stored fatty fish species
such as mackerel (Shenouda 1980; Hultin 1994) due to high content of polyunsaturated fatty
acids (PUFAs). PUFAs are highly susceptible to lipid oxidation during frozen storage, which
results in rancid taste and odour, especially if the fish products are not packed in an oxygen-
free atmosphere (Nielsen and Jessen 2007). Even though frozen storage slows down quality
degradation, some quality decline of mackerel occurs at extra-cold storage (Chapman et. al.
1993). With increased time, the quality of mackerel decreased according to sensory and
chemical indices but the extra-cold storage temperatures however slowed the deterioration
as measured by rate of hardening of mince and slower free fatty acid (FFA) formation.
Compositional changes during fish spoilage result in lipid oxidation and protein degradation
as well as the loss of other valuable molecules. In order to develop optimum preservation

41
techniques for these compounds, understanding of the mechanism responsible for their
degradation is essential. Some deterioration of the frozen product takes place during frozen
storage (Figure 2.19), but the changes are so small under the right conditions that to the
ordinary consumer the thawed product is indistinguishable from fresh after many months in
store. The lower the holding temperature, the longer is the period of safekeeping; hence,
temperature of storage is the most important single factor affecting the storage life of frozen
fish (FAO 2001).
Various other factors affect the quality of fish products after freezing and frozen storage.
Factors like fish species, temperature when caught, handling on-board vessel, the biological
status of the fish, temperature of the pre-rigor storage, freezing rate, frozen storage
temperature and time, temperature fluctuations, thawing procedure and prevention against
oxidation (light and oxygen) (Sørensen et. al. 1995; Sigholt et. al. 1997; Erikson et. al. 1997;
Kristoffersen et. al. 2006; Nielsen and Jessen 2007).
The frozen storage of Atlantic mackerel (Scomber scombrus) is limited by lipid damage causing
sensory quality losses, an important drawback to its commercialisation.
During freezing, damage pathways are inhibited, undesirable reactions associated with lipids
and proteins have shown to occur, leading to detrimental changes in nutritional and sensory
properties (Sikorski and Kolakowska 1994; Erickson 1997). Ke et. al. 1977 showed kinetic
variations in lipid oxidation in various parts of mackerel stored at −15, −30 and −40°C. By
measuring the changes of POV and of TBA molar values as a function of time. Oxidation
developed in the skin sample (subcutaneous fat) was eight times faster in TBA change than in
the white and dark muscles from mackerel held at −15°C for two months. This rapid
development of rancidity in the skin inhibited effectively by lowering the frozen storage
temperature to −40°C, where relatvely the degree of lipid oxidation in the dark muscle was
of the same order of magnitude. The in vitro rate of autoxidation at -60°C for the lipids
extracted from skin and the fillet muscle showed an unusual difference, which indicated that
unknown pro−oxidatve substances in mackerel skin were fat solvent extractable. The actvity
of the unknown compounds in the skin was also temperature dependent even in the frozen
state, but could be mitigated effectively by lowering temperature to −40°C. Lipid hydrolysis in
mackerel was also retarded completely when the fish were stored at −40° C.
The slight variation in fatty acid between mackerel skin and meat samples did not seem
adequate to explain the rapid oxidation in skin lipids. Thus it is believed that the skin lipids
42
one or more fat-solvent-extractable prooxidants, alone or associated with trace metals, were
present and were responsible for the high susceptibility to oxidation found for this lipid.
According to Nair et. al. 1987, mackerel could be preserved safely under frozen storage (–23
°C) for a period of 23–24 weeks. Measurement of sensory, chemical and physical changes
have shown that deterioration of fish quality continues to some extent during frozen storage,
since undesirable changes associated with lipids and proteins occur. Studies on frozen fish
have shown four different pathways of damage which lead to nutritional and sensory losses
(Shenouda 1980; Haard 1992; Mackie 1993; Xiong 1997; Erickson 1997). The muscle becomes
harder, more fibrous, and less elastic and loses its water holding capacity.
Toughening texture develops in edible muscle. As a result, proteins become more prone to
damage and essential amino acids are more susceptible to loss. Endogenous enzymes (lipases,
phospholipases; lipoxygenases, peroxidases) are still active during the frozen storage,
especially if light or other catalysts (heme groups, transition metals) are present. As a result,
loss of essential fatty acids are produced and a wide range of lipid oxidation and hydrolysis
compounds are produced, most of them relatively small molecules, that are susceptible to
interaction with fish constituents leading to a lowering in nutritional and sensory values of the
product. An endogenous enzyme (TMAO dimethylase) catalyses this degradation. DMA
produces detrimental odour and flavour and FA facilitates protein crosslinking, so that protein
denaturation resulting in toughening of texture. Unaltered myoglobin reportedly are highly
responsible for the bright of white muscle in good quality fish. During frozen storage, this
protein oxidizes to metmyoglobin, leading to important sensory quality losses of the fish
product by means of a browning development in muscle (Aubourg 2001).
Frozen (–25 °C) stored mackerel also showed a decrease in gel-forming capacity and jelly
strength (Nishimoto and Koreeda 1979).
Jian et. al. 1987 studied the effect of free amino acids on denaturation of mackerel proteins
during frozen (–20 °C) storage. Their conclusion was that the NH3 group of free amino acids
(histidine, lysine, taurine, glycine, proline and glutamic acid) interacted with carbonyl groups
on protein, so that in the case of histidine, lysine and taurine protein denaturation increased.
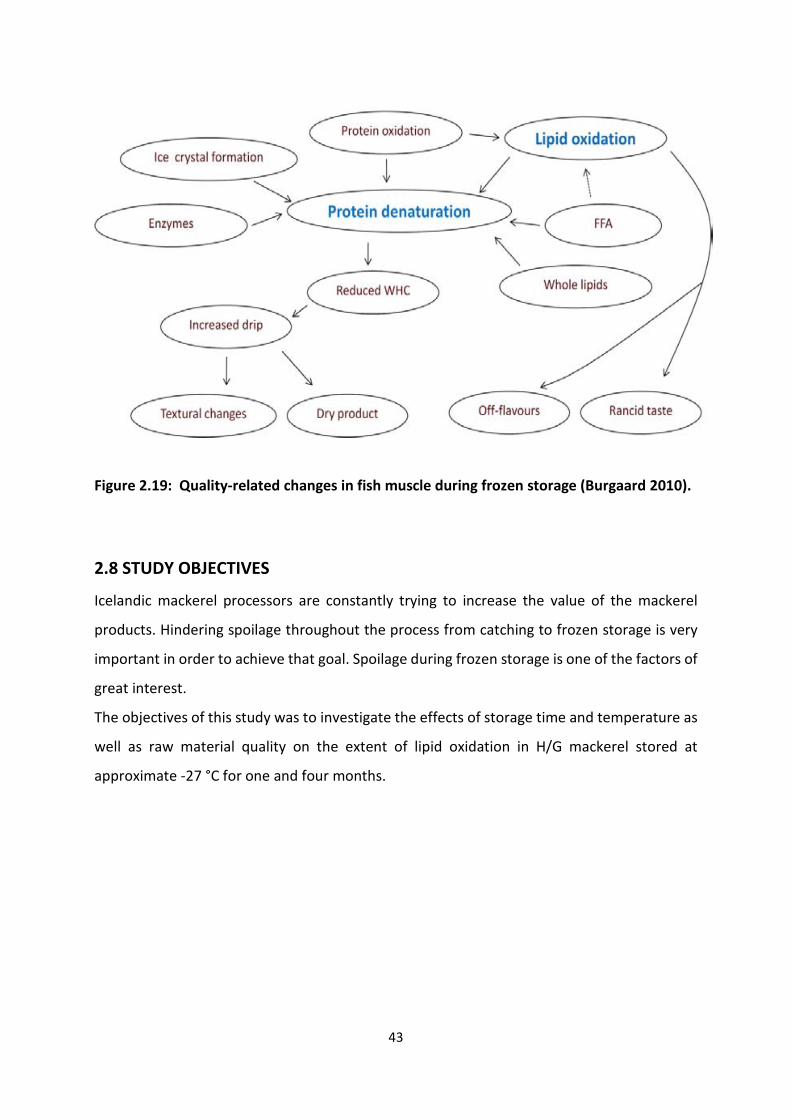
43
Figure 2.19: Quality-related changes in fish muscle during frozen storage (Burgaard 2010).
2.8 STUDY OBJECTIVES
Icelandic mackerel processors are constantly trying to increase the value of the mackerel
products. Hindering spoilage throughout the process from catching to frozen storage is very
important in order to achieve that goal. Spoilage during frozen storage is one of the factors of
great interest.
The objectives of this study was to investigate the effects of storage time and temperature as
well as raw material quality on the extent of lipid oxidation in H/G mackerel stored at
approximate -27 °C for one and four months.
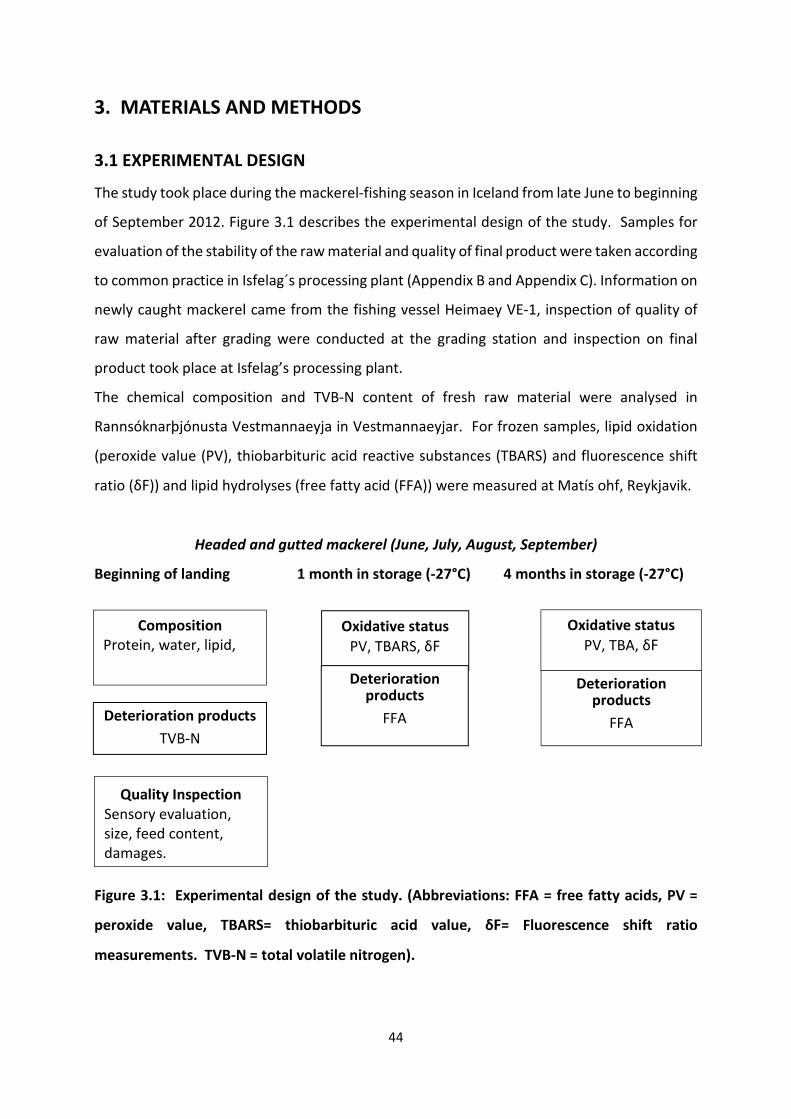
44
3. MATERIALS AND METHODS
3.1 EXPERIMENTAL DESIGN
The study took place during the mackerel-fishing season in Iceland from late June to beginning
of September 2012. Figure 3.1 describes the experimental design of the study. Samples for
evaluation of the stability of the raw material and quality of final product were taken according
to common practice in Isfelag´s processing plant (Appendix B and Appendix C). Information on
newly caught mackerel came from the fishing vessel Heimaey VE-1, inspection of quality of
raw material after grading were conducted at the grading station and inspection on final
product took place at Isfelag’s processing plant.
The chemical composition and TVB-N content of fresh raw material were analysed in
Rannsóknarþjónusta Vestmannaeyja in Vestmannaeyjar. For frozen samples, lipid oxidation
(peroxide value (PV), thiobarbituric acid reactive substances (TBARS) and fluorescence shift
ratio (δF)) and lipid hydrolyses (free fatty acid (FFA)) were measured at Matís ohf, Reykjavik.
Headed and gutted mackerel (June, July, August, September)
Beginning of landing 1 month in storage (-27°C) 4 months in storage (-27°C)
Figure 3.1: Experimental design of the study. (Abbreviations: FFA = free fatty acids, PV =
peroxide value, TBARS= thiobarbituric acid value, δF= Fluorescence shift ratio
measurements. TVB-N = total volatile nitrogen).
Oxidative status
PV, TBARS, δF
Composition Protein, water, lipid,
Oxidative status
PV, TBA, δF
Quality Inspection Sensory evaluation, size, feed content, damages.
Deterioration products
TVB-N
Deterioration products
FFA
Deterioration products
FFA
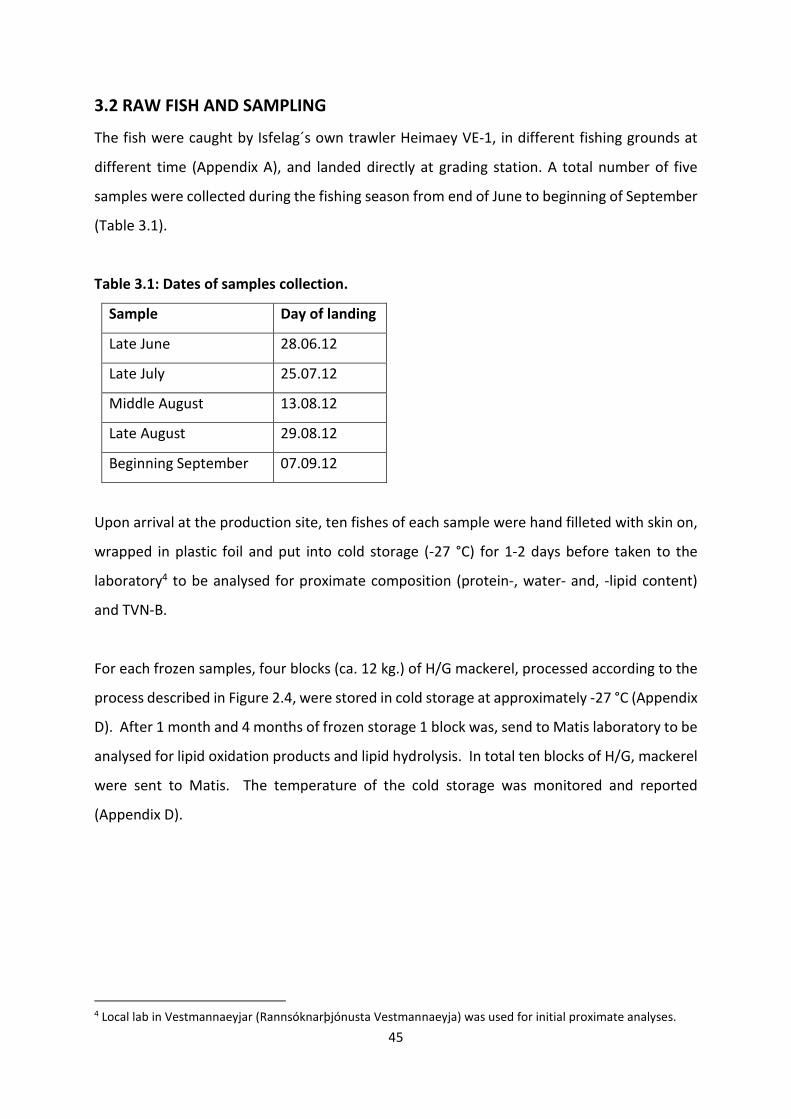
45
3.2 RAW FISH AND SAMPLING
The fish were caught by Isfelag´s own trawler Heimaey VE-1, in different fishing grounds at
different time (Appendix A), and landed directly at grading station. A total number of five
samples were collected during the fishing season from end of June to beginning of September
(Table 3.1).
Table 3.1: Dates of samples collection.
Sample Day of landing
Late June 28.06.12
Late July 25.07.12
Middle August 13.08.12
Late August 29.08.12
Beginning September 07.09.12
Upon arrival at the production site, ten fishes of each sample were hand filleted with skin on,
wrapped in plastic foil and put into cold storage (-27 °C) for 1-2 days before taken to the
laboratory4 to be analysed for proximate composition (protein-, water- and, -lipid content)
and TVN-B.
For each frozen samples, four blocks (ca. 12 kg.) of H/G mackerel, processed according to the
process described in Figure 2.4, were stored in cold storage at approximately -27 °C (Appendix
D). After 1 month and 4 months of frozen storage 1 block was, send to Matis laboratory to be
analysed for lipid oxidation products and lipid hydrolysis. In total ten blocks of H/G, mackerel
were sent to Matis. The temperature of the cold storage was monitored and reported
(Appendix D).
4 Local lab in Vestmannaeyjar (Rannsóknarþjónusta Vestmannaeyja) was used for initial proximate analyses.
46
3.3. PROXIMATE ANALYSIS
3.3.1 WATER CONTENT
Water content was determined by drying the samples (ISO 1983). The mackerel fillets was
mixed well and about 5 g of the grounded samples weighed accurately into a pre weighted
porcelain bowl, containing sea sand and a glass rod. The glass rod was used to mix the sample
and the sand in order to increase the surface prior to drying. Then the sample was dried at
100°C for 4 hours. After drying the porcelain bowl was closed with the lid and the sample
allowed cooling in a desiccator, prior to weighing. The water content corresponds to the
weight loss and was given as percentage of the initial sample weight.
3.3.2. LIPID CONTENT
Lipid content was determined according to the Soxhlet method, ISO 6492:1999 (ISO 1999).
3.3.3. PROTEIN CONTENT
The protein content was determined by using the Kjeldahl method ISO 5983-2:2005 (ISO
2005).
3.4 OXIDATIVE STATUS
3.4.1 LIPID HYDROPEROXIDE VALUES (PV)
Lipid hydroperoxides was determined with a modified version of the ferric thiocyanate
method (Santha and Decker 1994). Total lipids were extracted from 5.0 g of samples with 10
mL ice-cold chloroform: methanol (1:1) solution, containing 500 ppm BHT to prevent further
peroxidation during the extraction process. Sodium chloride (0.5 N) was added (5.0 mL) in to
the mixture and homogenized for 5 sec before centrifuging at 5100 rpm for 5 min (TJ-25
Centrifuge, Beckmann Coulter, USA). The chloroform layer was collected (500 µL) and
completed with 500 µL chloroform: methanol solution. A total amount of 5 µL of mixture
(1:1) of ammonium thiocyanate (4M) and ferrous chloride (80 mM) was added and
vortexed. The samples were incubated at room temperature for 10 min and red at 500 nm
(Tecan Sunrise, Austria). A standard curve was prepared using cumene hydroperoxides. The
results were expressed as µmol lipid hydroperoxides per g of samples.
47
3.4.2 THIOBARBITURIC ACID REACTIVE SUBSTANCE (TBARS)
A modified method of Lemon (1975) was used for measuring TBARS. A sample (5.0 g) was
homogenized with 10.0 mL of trichloroacetic acid (TCA) extraction solution (7.5% TCA, 0.1%
propyl gallate and 0.1% ethylenediaminetetraacetic acid mixture prepared in ultra-pure
water) using a homogenizer at maximum speed for 5 seconds (Ultra-Turrax T-10 basic, IKA,
Germany) and centrifuged at 5100 rpm for 20 min (TJ-25 Centrifuge, Beckmann Coulter, USA).
0.1 mL supernatant was collected and mixed with 0.9 mL of thiobarbituric acid (0.02 M) and
heated in a water bath at 95°C for 40 min. The samples were cooled down on ice and
immediately loaded into 96-wells microplates (NUNC A/S Thermo Fisher Scientific, Roskilde,
Denmark) for reading at 530 nm (Tecan Sunrise, Austria). A standard curve was prepared using
TEP. The results were expressed as µmol of malomaldehyde diethylacetal per g of samples.
3.4.3 FLUORESCENCE SHIFT RATIO (δF)
Fluorescence measurements (Perkin Elmer LS 50B) were made at 393/463 and 327/415 nm
excitation/emission maxima, according to other researchers (Aubourg et al. 1997; Aubourg et
al. 1998; Aubourg 1999a; Aubourg 1999b; Aubourg 2001). The excitation and emission slit was
set at 2.5 nm. The relative fluorescence (RF) was calculated as RF=F/Fst, where F is the sample
fluorescence intensity at each excitation/emission maximum and Fst is the fluorescence
intensity of a quinine sulphate solution (1 µg/mL in 0.05M H2SO4) at the corresponding
wavelength. The fluorescence shift (δF) was calculated as the ratio between the two RF values,
i.e. δF =RF393/463nm / RF327/415nm, and was analysed on the organic phase resulting from the lipid
extraction (Bligh and Dyer 1959).
3.5 LIPID HYDROLYSIS (FFA)
Free fatty acids (FFA) were determined on the TL extract resulting from the Bligh and Dyer
(1959) extraction. Measurements were conducted according to Lowry and Tinsley (1976), with
modifications from Bernardez et. al. (2005). The FFA concentration was calculated as
micromolar oleic acid based on standard curve spanning a 2-22 µmol range. Results were
expressed as grams FFA per 100 g of lipids.
48
3.6 TOTAL VOLATILE NITROGEN BASES (TVB-N)
The method of Malle and Tao (1987) was used for total volatile bases (TVB-N) and
trimethylamine (TMA) measurements. TVB-N was measured by steam distillation (Struer TVN
distillatory, STRUERS, Copenhagen) and titration, after extracting the fish muscle with 7.5%
aqueous trichloroacetic acid solution. The distilled TVB-N was collected in boric acid solution
and then titrated with sulphuric acid solution. The results were expressed as mg TVB-N/100 g
muscle.
3.7 STATISTICAL ANALYSIS
Statistical analyses were performed by Microsoft Office Excel 2010 (Microsoft Inc., Redmond,
Wash., U.S.A.).
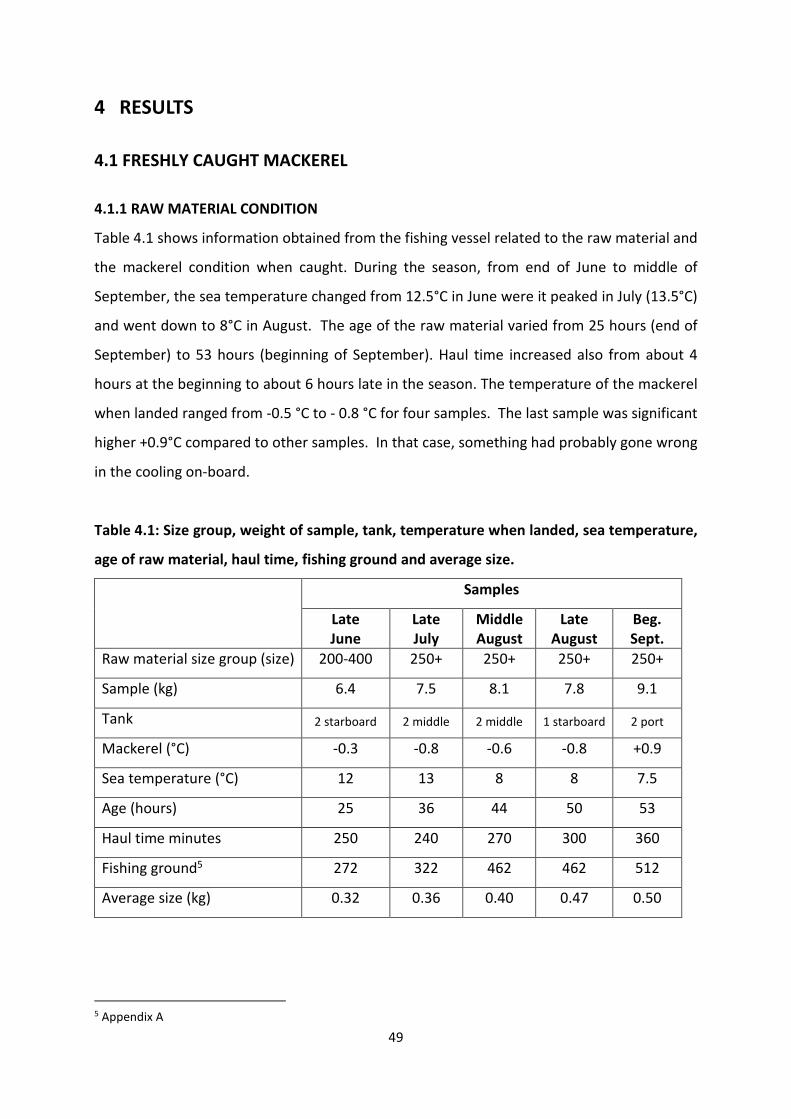
49
4 RESULTS
4.1 FRESHLY CAUGHT MACKEREL
4.1.1 RAW MATERIAL CONDITION
Table 4.1 shows information obtained from the fishing vessel related to the raw material and
the mackerel condition when caught. During the season, from end of June to middle of
September, the sea temperature changed from 12.5°C in June were it peaked in July (13.5°C)
and went down to 8°C in August. The age of the raw material varied from 25 hours (end of
September) to 53 hours (beginning of September). Haul time increased also from about 4
hours at the beginning to about 6 hours late in the season. The temperature of the mackerel
when landed ranged from -0.5 °C to - 0.8 °C for four samples. The last sample was significant
higher +0.9°C compared to other samples. In that case, something had probably gone wrong
in the cooling on-board.
Table 4.1: Size group, weight of sample, tank, temperature when landed, sea temperature,
age of raw material, haul time, fishing ground and average size.
5 Appendix A
Samples
Late June
Late July
Middle August
Late August
Beg. Sept.
Raw material size group (size) 200-400 250+ 250+ 250+ 250+
Sample (kg) 6.4 7.5 8.1 7.8 9.1
Tank 2 starboard 2 middle 2 middle 1 starboard 2 port
Mackerel (°C) -0.3 -0.8 -0.6 -0.8 +0.9
Sea temperature (°C) 12 13 8 8 7.5
Age (hours) 25 36 44 50 53
Haul time minutes 250 240 270 300 360
Fishing ground5 272 322 462 462 512
Average size (kg) 0.32 0.36 0.40 0.47 0.50
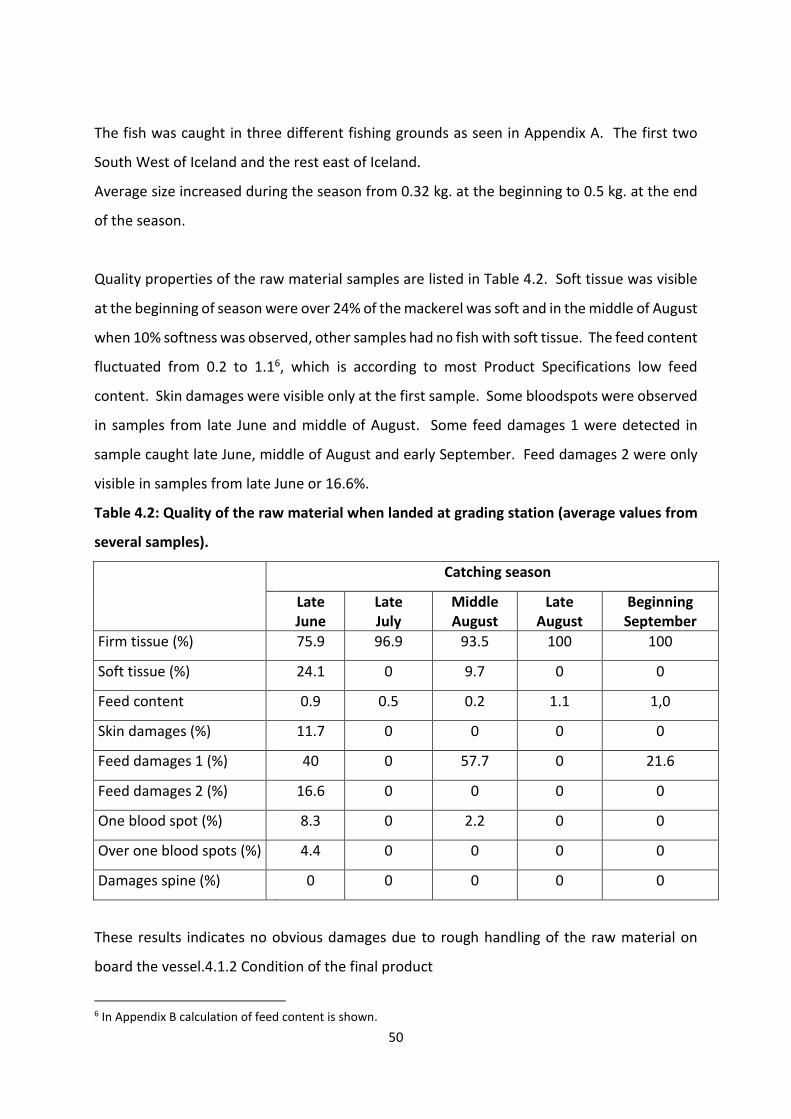
50
The fish was caught in three different fishing grounds as seen in Appendix A. The first two
South West of Iceland and the rest east of Iceland.
Average size increased during the season from 0.32 kg. at the beginning to 0.5 kg. at the end
of the season.
Quality properties of the raw material samples are listed in Table 4.2. Soft tissue was visible
at the beginning of season were over 24% of the mackerel was soft and in the middle of August
when 10% softness was observed, other samples had no fish with soft tissue. The feed content
fluctuated from 0.2 to 1.16, which is according to most Product Specifications low feed
content. Skin damages were visible only at the first sample. Some bloodspots were observed
in samples from late June and middle of August. Some feed damages 1 were detected in
sample caught late June, middle of August and early September. Feed damages 2 were only
visible in samples from late June or 16.6%.
Table 4.2: Quality of the raw material when landed at grading station (average values from
several samples).
Catching season
Late
June Late July
Middle August
Late August
Beginning September
Firm tissue (%) 75.9 96.9 93.5 100 100
Soft tissue (%) 24.1 0 9.7 0 0
Feed content 0.9 0.5 0.2 1.1 1,0
Skin damages (%) 11.7 0 0 0 0
Feed damages 1 (%) 40 0 57.7 0 21.6
Feed damages 2 (%) 16.6 0 0 0 0
One blood spot (%) 8.3 0 2.2 0 0
Over one blood spots (%) 4.4 0 0 0 0
Damages spine (%) 0 0 0 0 0
These results indicates no obvious damages due to rough handling of the raw material on
board the vessel.4.1.2 Condition of the final product
6 In Appendix B calculation of feed content is shown.

51
4.1.2 CONDITION OF THE FINAL PRODUCT
Quality parameters of the mackerel after it was processed (headed and gutted) and before it
was packed and frozen are listed in Table 4.3. The fish temperature was similar for all samples
ranging from 1.4°C to 1.9°C, indicating that cooling was adequate during the production
process. Soft texture was measured in sample from late August 6.5 %. The other samples had
soft tissue under 1.9%. Average size was similar for the last four samples 0.3 – 0.34 kg., but in
the first sample average size was considerable lower or 0.23 kg. Some damages and fish with
gut were observed in all the samples but middle of August were no bad gut removal was
observed and only 0.25 % damages.
Quality ratio is a grade given to each lot number. If there is no remarks the quality ratio is
100%. Every remarks deducts the grade. Quality ratio of four of the samples were (95.96 5 to
99.75%) which is good. Late August did only get quality ratio of 91.19%, mainly because of
6.5% fish with soft texture.
Table 4.3: Quality parameters of H/G mackerel before freezing (average values from several
samples).
Catching season
Late June
Late July
Middle August
Late August
Beginning September
H/G mackerel 200-400 250+ 300+ 250+ 250+
Temperature °C 1.6 1.9 1.8 1.6 1.4
Average size (kg) 0.23 0.32 0.34 0.3 0.34
Soft texture % 1.43 1.88 0 6.5 1.2
Firm texture % 98.57 98.2 100 93.5 100
Cutting defects % 0 0 0 0 0
Damaged % 1.14 0.61 0.25 1.5 0.25
Bad gut removal % 1.47 0.29 0 0.81 0.87
Quality ratio 95.96 97.22 99.75 91.19 97.68

52
4.1.2 CHEMICAL COMPOSITION OF MACKEREL
The chemical composition of the mackerel fillets varied considerably from late June until
middle of September (Figure 4.1). The lipid content increased from 15.1% in late June and
peaked at 32.9% in late July, and at the end of the season, it was 25.2%. Water content was
65.3% in late June, had its lowest level in late July 51.5%. The correlation between water and
lipids was measured -0.9982. Protein value changed from 15.6% at the lowest in middle of
July and up to 19.1% in late August. Results from other studies shows similar results (Arason et. al.
2010).
Figure 4.1: Influence of catching time of Atantic mackerel caught in Icelandic water from June-September 2012
4.1.3 TVB-N
TVB-N values of fresh mackerel varied from 15.8 to 19.1 TVB/100g (Table 4.4). The highest
value was observed in late August and the lowest in middle of August.
0
10
20
30
40
50
60
70
Late June Late July Middle August Late August Beg. September
Lipid Protein Water
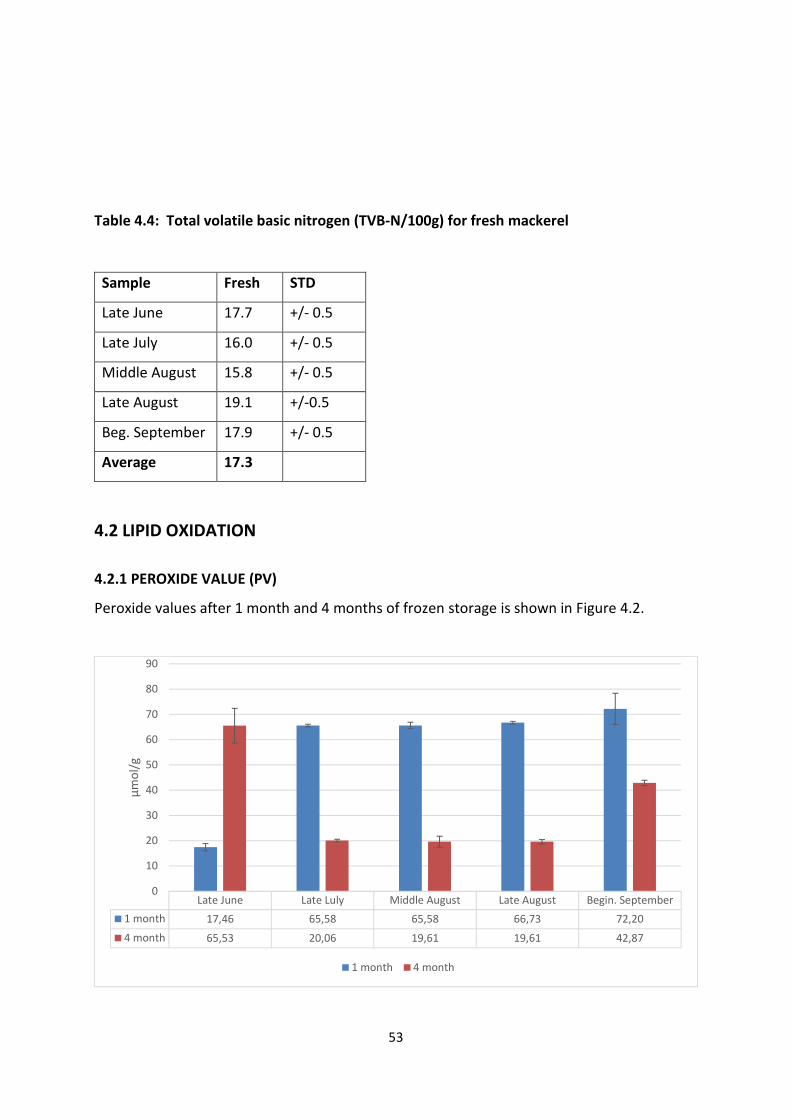
53
Table 4.4: Total volatile basic nitrogen (TVB-N/100g) for fresh mackerel
4.2 LIPID OXIDATION
4.2.1 PEROXIDE VALUE (PV)
Peroxide values after 1 month and 4 months of frozen storage is shown in Figure 4.2.
Late June Late Luly Middle August Late August Begin. September
1 month 17,46 65,58 65,58 66,73 72,20
4 month 65,53 20,06 19,61 19,61 42,87
0
10
20
30
40
50
60
70
80
90
µm
ol/
g
1 month 4 month
Sample Fresh STD
Late June 17.7 +/- 0.5
Late July 16.0 +/- 0.5
Middle August 15.8 +/- 0.5
Late August 19.1 +/-0.5
Beg. September 17.9 +/- 0.5
Average 17.3
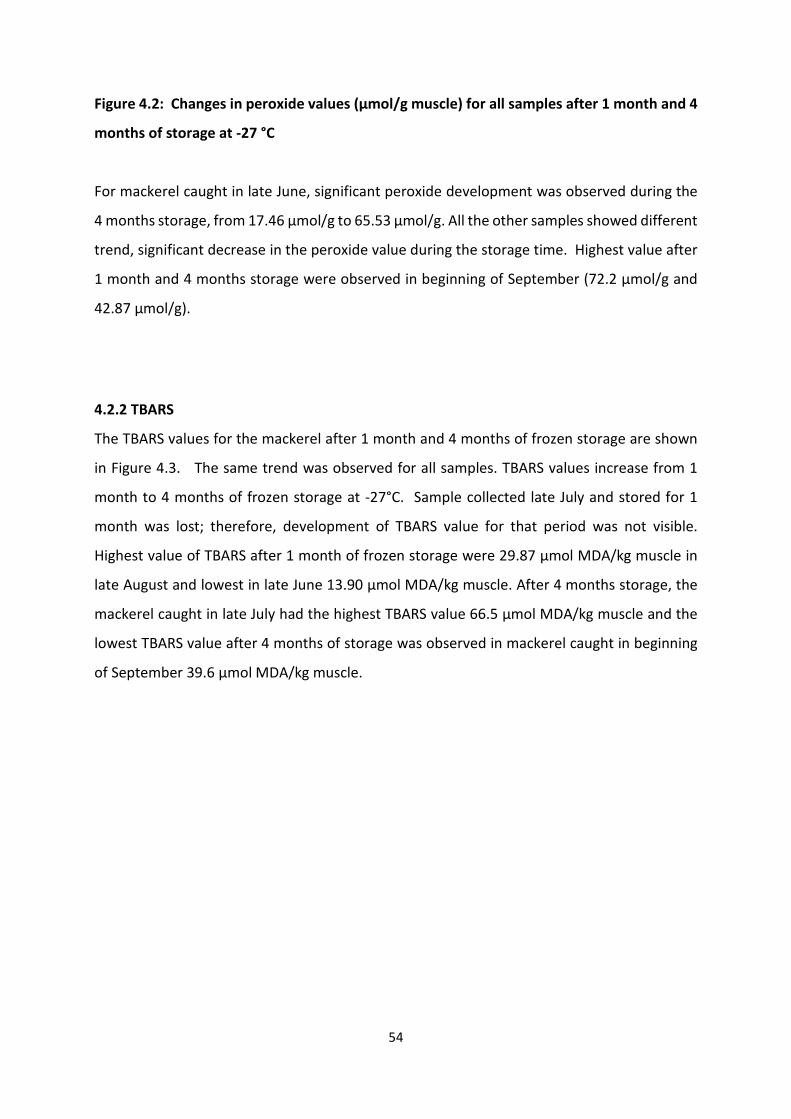
54
Figure 4.2: Changes in peroxide values (μmol/g muscle) for all samples after 1 month and 4
months of storage at -27 °C
For mackerel caught in late June, significant peroxide development was observed during the
4 months storage, from 17.46 µmol/g to 65.53 µmol/g. All the other samples showed different
trend, significant decrease in the peroxide value during the storage time. Highest value after
1 month and 4 months storage were observed in beginning of September (72.2 µmol/g and
42.87 µmol/g).
4.2.2 TBARS
The TBARS values for the mackerel after 1 month and 4 months of frozen storage are shown
in Figure 4.3. The same trend was observed for all samples. TBARS values increase from 1
month to 4 months of frozen storage at -27°C. Sample collected late July and stored for 1
month was lost; therefore, development of TBARS value for that period was not visible.
Highest value of TBARS after 1 month of frozen storage were 29.87 µmol MDA/kg muscle in
late August and lowest in late June 13.90 µmol MDA/kg muscle. After 4 months storage, the
mackerel caught in late July had the highest TBARS value 66.5 µmol MDA/kg muscle and the
lowest TBARS value after 4 months of storage was observed in mackerel caught in beginning
of September 39.6 µmol MDA/kg muscle.
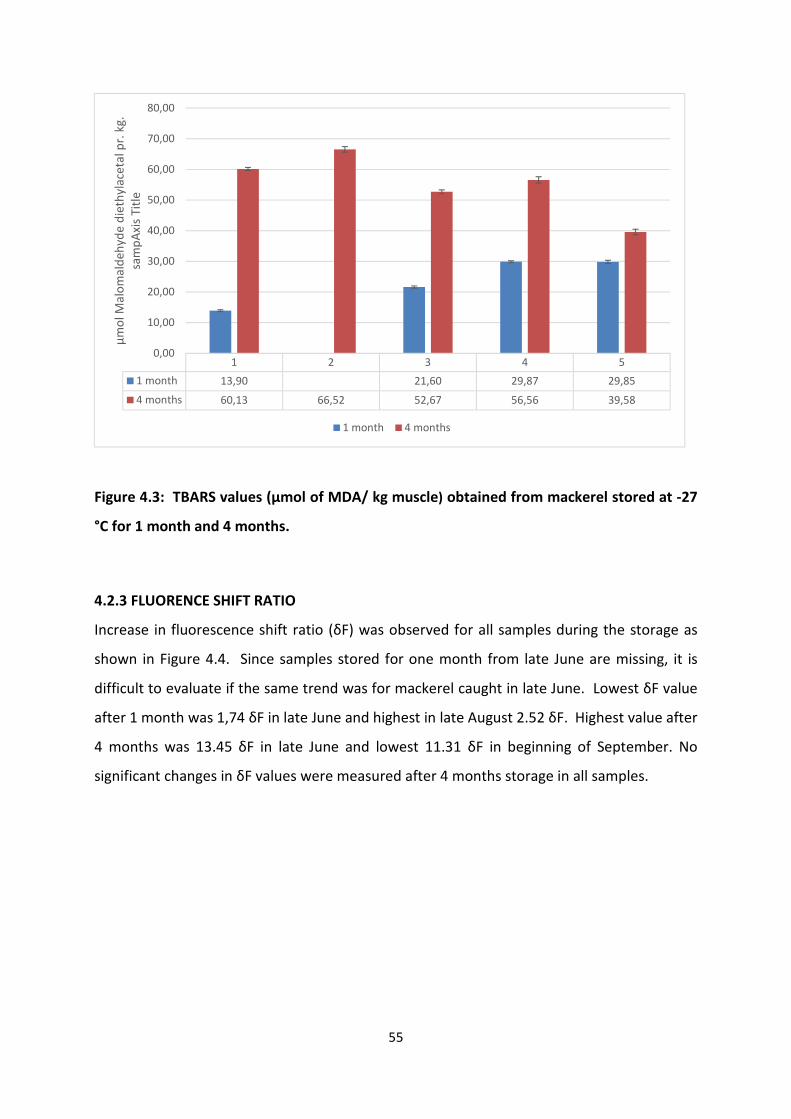
55
Figure 4.3: TBARS values (µmol of MDA/ kg muscle) obtained from mackerel stored at -27
°C for 1 month and 4 months.
4.2.3 FLUORENCE SHIFT RATIO
Increase in fluorescence shift ratio (δF) was observed for all samples during the storage as
shown in Figure 4.4. Since samples stored for one month from late June are missing, it is
difficult to evaluate if the same trend was for mackerel caught in late June. Lowest δF value
after 1 month was 1,74 δF in late June and highest in late August 2.52 δF. Highest value after
4 months was 13.45 δF in late June and lowest 11.31 δF in beginning of September. No
significant changes in δF values were measured after 4 months storage in all samples.
1 2 3 4 5
1 month 13,90 21,60 29,87 29,85
4 months 60,13 66,52 52,67 56,56 39,58
0,00
10,00
20,00
30,00
40,00
50,00
60,00
70,00
80,00µ
mo
l Mal
om
ald
ehyd
e d
ieth
ylac
etal
pr.
kg.
sa
mp
Axi
s Ti
tle
1 month 4 months
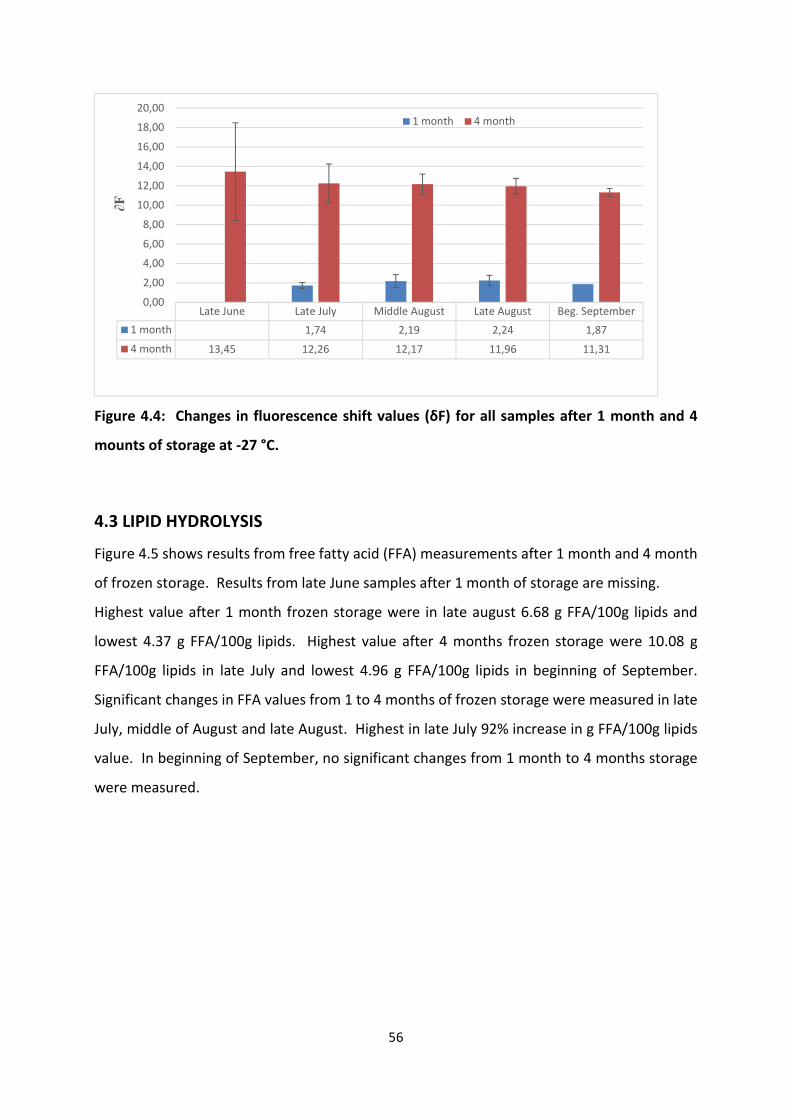
56
Figure 4.4: Changes in fluorescence shift values (δF) for all samples after 1 month and 4
mounts of storage at -27 °C.
4.3 LIPID HYDROLYSIS
Figure 4.5 shows results from free fatty acid (FFA) measurements after 1 month and 4 month
of frozen storage. Results from late June samples after 1 month of storage are missing.
Highest value after 1 month frozen storage were in late august 6.68 g FFA/100g lipids and
lowest 4.37 g FFA/100g lipids. Highest value after 4 months frozen storage were 10.08 g
FFA/100g lipids in late July and lowest 4.96 g FFA/100g lipids in beginning of September.
Significant changes in FFA values from 1 to 4 months of frozen storage were measured in late
July, middle of August and late August. Highest in late July 92% increase in g FFA/100g lipids
value. In beginning of September, no significant changes from 1 month to 4 months storage
were measured.
Late June Late July Middle August Late August Beg. September
1 month 1,74 2,19 2,24 1,87
4 month 13,45 12,26 12,17 11,96 11,31
0,00
2,00
4,00
6,00
8,00
10,00
12,00
14,00
16,00
18,00
20,00∂F
1 month 4 month
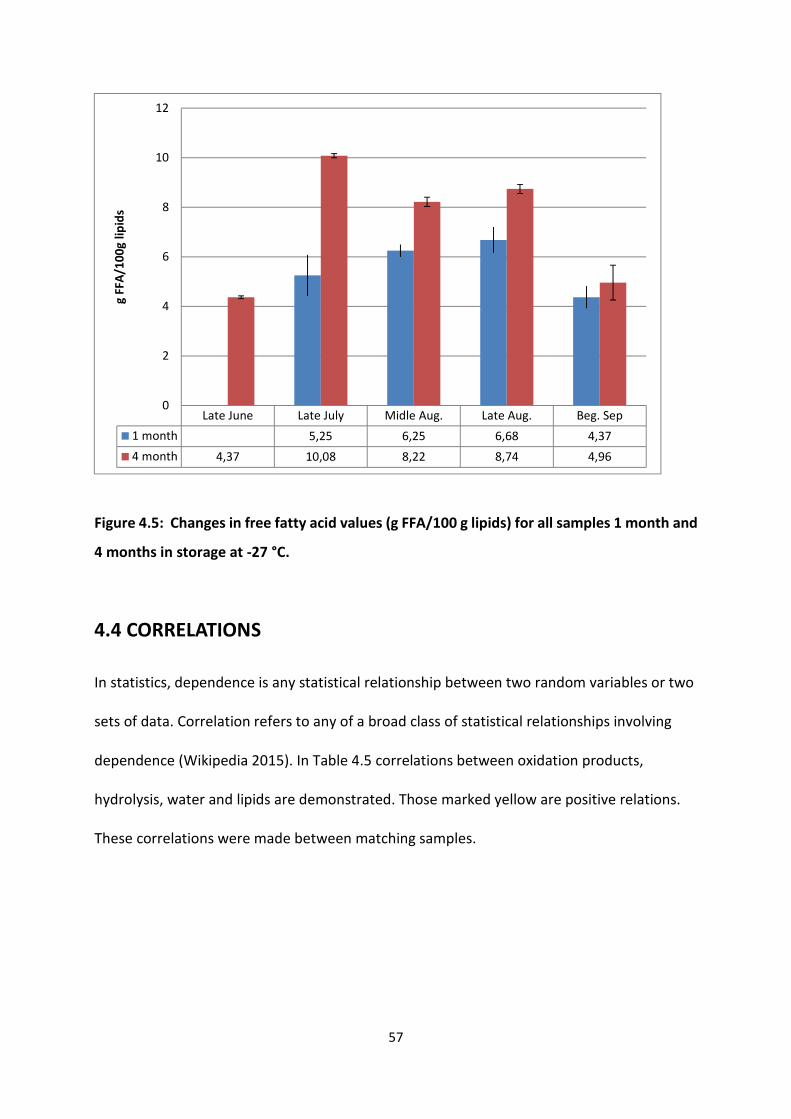
57
Figure 4.5: Changes in free fatty acid values (g FFA/100 g lipids) for all samples 1 month and
4 months in storage at -27 °C.
4.4 CORRELATIONS
In statistics, dependence is any statistical relationship between two random variables or two
sets of data. Correlation refers to any of a broad class of statistical relationships involving
dependence (Wikipedia 2015). In Table 4.5 correlations between oxidation products,
hydrolysis, water and lipids are demonstrated. Those marked yellow are positive relations.
These correlations were made between matching samples.
Late June Late July Midle Aug. Late Aug. Beg. Sep
1 month 5,25 6,25 6,68 4,37
4 month 4,37 10,08 8,22 8,74 4,96
0
2
4
6
8
10
12g
FFA
/10
0g
lipid
s
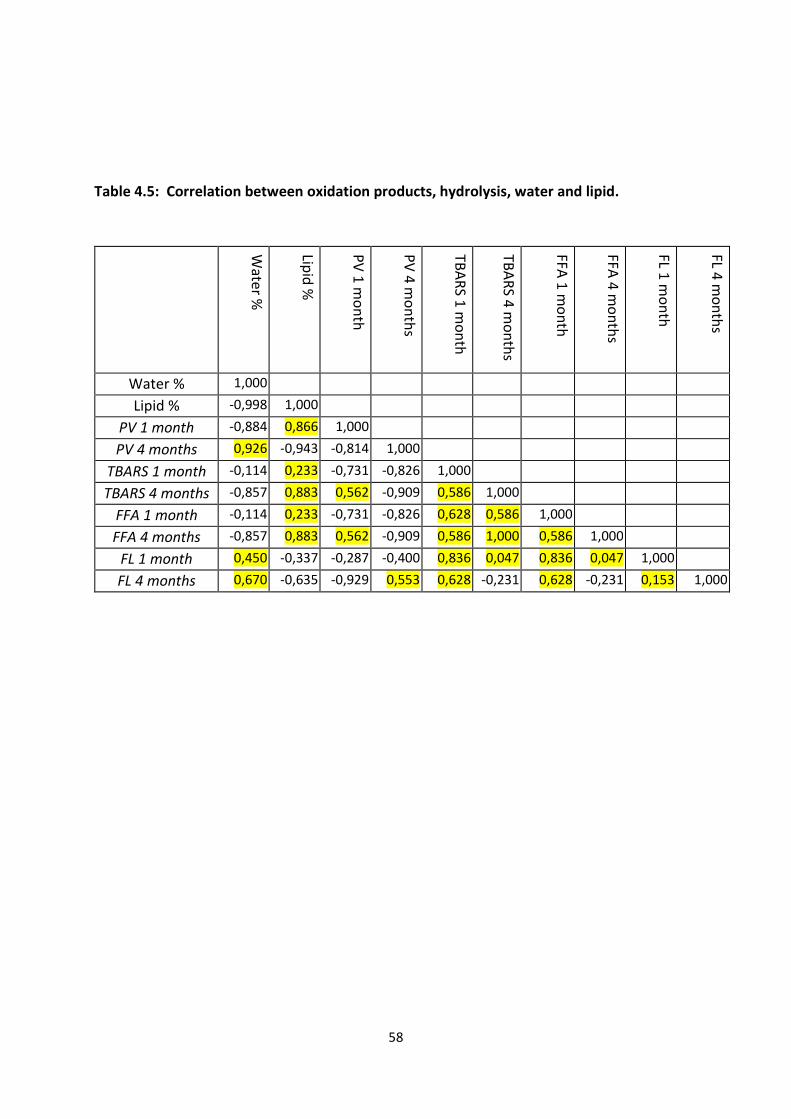
58
Table 4.5: Correlation between oxidation products, hydrolysis, water and lipid.
Water %
Lipid
%
PV
1 mo
nth
PV
4 mo
nth
s
TBA
RS 1
mo
nth
TBA
RS 4
mo
nth
s
FFA 1
mo
nth
FFA 4
mo
nth
s
FL 1 m
on
th
FL 4 m
on
ths
Water % 1,000
Lipid % -0,998 1,000
PV 1 month -0,884 0,866 1,000
PV 4 months 0,926 -0,943 -0,814 1,000
TBARS 1 month -0,114 0,233 -0,731 -0,826 1,000
TBARS 4 months -0,857 0,883 0,562 -0,909 0,586 1,000
FFA 1 month -0,114 0,233 -0,731 -0,826 0,628 0,586 1,000
FFA 4 months -0,857 0,883 0,562 -0,909 0,586 1,000 0,586 1,000
FL 1 month 0,450 -0,337 -0,287 -0,400 0,836 0,047 0,836 0,047 1,000
FL 4 months 0,670 -0,635 -0,929 0,553 0,628 -0,231 0,628 -0,231 0,153 1,000

59
5 DISCUSSIONS
5.1 RAW MATERIAL AND FINAL PRODUCT
The biological stability was very poor in the beginning of the season when the mackerels were
recovering from spawning and got better later in the season. This is as according to numerous
studies (Huss 1995; Asthorsson et. al 2009; Sveinbjornsson et. al. 2008). The results from this
study confirms that. The raw material from late June had significant feed damages and also
skin damages.
The raw material used in this study came from the same fishing vessel. Fishing technique,
handling on-board, landing, cooling practice etc. were therefore very similar for all the
samples. One can assume that these factors are more or less constant and do not explain the
differences in raw material properties, except when the cooling om board the vessel failed in
the last sample. Biological factors are more likely to be responsible for observed variations in
the quality of the raw material. It is important to notice that even when samples are taken
from the same haul and tank the quality of the individual fishes can vary considerable. The
first fishes entering the troll bag are in risk of getting crushed by fishes that enters later. That
will result in quality reduction. Those fishes are also likely to die before being pumped on
board and hence the spoilage rates are therefore already taken place. That depends on the
hauling time and -speed for most parts. Haul size will also affect the quality. Unfortunately,
that information was not available for this study. According to Isfelags requirements, limits
are regarding haul sizes and time in order to avoid spoilage of fish in the troll bag. Therefor it
can be assumed that to long hauling time and large hauls are not causing damages to the fish.
But as observed the hauling time increased throughout the season parallel with better the
mackerel getting stronger after being weak due to spawning. Something that is also according
to Isfelag’s requirements.
In late June the average size of the fish was much lower than later on in the season and the
sea temperature high. According to Huss 1995, size and temperature are important factors
affecting spoilage rate of mackerel. The average size of the mackerel was smallest for sample
taken at the beginning of the season and the temperature of the sea was higher compared to
later in the season. In general, smaller fish spoils faster than larger and spoiling rate increases
with higher temperature.
60
As mentioned numerous times in this study temperature affects the spoiling rate significantly.
The higher the seas temperature the longer the cooling down time. Temperature log showing
how long time it took to cool down the fish to acceptable level was not available in this study
so we cannot make any conclusions based on that.
5.2 FINAL PRODUCT (H/G MACKEREL)
For samples taken late July, middle of August and beginning of September, final product
inspection showed results that reflected the raw material quality.
For late August final inspection showed lesser quality than indicated by the raw material
inspection. That suggests that from the time of landing until it was processed spoilage took
place in sample taken late August. One explanation for that is that on late August, the highest
feed content was observed in the raw material something that affects the spoiling rate. In
Isfelag all graded mackerel are put in tubs containing cooled brine, about -2 °C. The purpose
of this brine is to keep the temperature of the fish as low as possible prior to processing.
Eventually the temperature of the brine, and the fish, will increase, because the surrounding
temperature is higher than -2°C. If the time from landing/grading and processing is to long
spoilage will occur in the mackerel even though it is stored at low temperature. Temperature
of the final product in the late August sample does not indicate that this happened so one
must assume feed content is to blame.
During the process, removal of soft mackerel takes place to avoid soft mackerel from being
packed and further exported. Low concentration of soft mackerel in late June final product
compared to raw material inspection indicates that the removal process was successful. High
concentration of soft mackerel in late August indicates that the removal process failed.
However it is very difficult to remove all soft mackerel specially if it abundant in production.
The temperature of the fish caught in the beginning of September was much when landed
than in any of the other samples. That indicates that something failed during the cooling on
board. Even so that did not reflect on the final product. Suggesting that at the end of the
season the mackerel is not as vulnerable as at the beginning.
61
5.3 CHEMICAL COMPOSITION AND TVB-N
Great variations in lipid and water content were observed as expected. Difference in protein
content was a bit surprising. Reason for that were probably individual fish to fish variations.
Seasonal variation in the lipid and water content was most likely due to changes associated
with feeding and spawning of the mackerel. These results were however not entirely in
agreement with previous studies (Huss 1995; Matis 2008) where the lipid content peaked in
August. Different fishing grounds and individual variation in lipid content can explain this.
The freshness of raw material was measured by TVB-N. TVB-N is considered as useful
parameter although it does not fully satisfy sanitarians. The samples taken were within the
limit of what is acceptable (18-20 mg/100g) for human consumption of mackerel (Malle et al.
1983). The highest values were measured in the two samples from August, when the biological
stability was higher than at the beginning of the season. That is probably because the fish in
the August samples were 50-53 hours old when processed and analysed compared to 25-44
hours for samples taken earlier in the season. According to El Marrakcni et. al. 1990 TVN – B
values in mackerel increases slightly during storage.
It is common practice to extent the mackerel fishing time at the end of the season when the
fish is firmer and not as vulnerable. Keeping up the same fishing practice throughout the
season would bring even better raw material quality later on in the season.
5.4 LIPID OXIDATION
Peroxide value (PV) - Primary oxidation products
Significant increase in PV was observed from 1 month to 4 months of frozen storage for
samples collected in late June. That is a clear indication of that the primary oxidation had not
reached its peak. However, considerable decrease occurred in all other samples. So it seems
that sample from late June were not as oxidized as the others. One explanation for the
increase in peroxide values can be related to the low lipid content in the late June sample
compared to the other samples. It was positive correlation (0,866) between lipid content and
PV oxidation after 1 month storage. No correlation was observed between lipid content and

62
PV after 4 months of storage. The lipid content was measured 15.1% in the beginning of the
season (late June), resulting in the lowest content of all the samples. Aubourg et. al. (2005)
observed that the lipid content of mackerel has an important effect on lipid oxidation
development. Mackerel fillet (white muscle) from fish caught in November (lipid content 6.5-
10%) showed significant higher changes in peroxide value after 4 moth of storage at -20 °C
compared to mackerel fillets from fish caught in May (lipid content 1-3.5%).
There was a negative correlation between PV values measured after 1 month and 4 month of
storage (-0,943).
Peroxide value measurements alone are not reliable in assessing the oxidation of highly
unsaturated oils such as fish oils. This is because the peroxides initially formed are unstable
and react quickly to form secondary oxidation products. For those reason the peroxide value
should be used in conjunction with other methods (Saeed and Howell 2002).
Thiobarbituric reactive substances (TBARS) – Secondary oxidation product
Significant increase in TBARS during storage was observed for all sampling groups. For all
samples, but late June, value of TBAR increased after 4 months storage when PV values
decreased. Due to continuous lipid hydroperoxide breakdown resulting in production of
secondary oxidation products. Highest values of TBAR after 4 months storage were observed
in late July when lowest values of peroxide were measured, indicating that formation of
secondary products were further in the process. There was a positive correlation between
Lipid content and TBAR after 1 month (0,233) and after 4 months (0,883) of storage. In that
correlation calculation, late June after 1 month is not present and therefore not included.
The results for TBARS for this study were similar compared to other studies, where significant
increase was observed after 4 months of storage of Atlantic mackerel at -5°C, -10°C, -18°C, -
20°C and -30°C (Saeed and Howell 2002; Aubourg et. al. 2005, Popelka et. al. 2012, Aubourg
and Gallardo 2004).
Relatively high value of TBARS and PV after 4 month of storage in late June could indicate that
despite production of secondary oxidation products amount of hydroperoxide still remained
relatively high.
Fluorescence shift ratio (δF) – Tertiary oxidation products
63
Positive correlation between lipid content and fluorescence was observed after 1 and 4 moths
of storage (0.45) and (0.67) respectively. Sample from storage after one months I late June
are missing so it is not possible to compare low lipid content sample with those who have
higher content after 1 month of frozen storage.
Result of comparable samples showed that storage time significantly affected the formation
of tertiary oxidation products during four month storage. All the samples showed similar
fluorescence values after 1 month and 4 months storage. According to previous studies
(Aubourg et. al. (2005) fluorescence values for mackerel with high lipid values (caught in
November) was low after one month of frozen storage and then increased during storage to
the highest level after 4 months of storage. On other hand low lipid mackerel (caught in May)
had higher fluorescence values after 1 month frozen storage and the increased slightly after 4
month storage. They argued that difference in nucleophilic compounds composition in the
mackerel white muscle between May and November might be responsible for this.
5.5 LIPID HYDROLYSIS - FREE FATTY ACIDS (FFA)
Results for FFA showed that storage time led to an increase in FFA values. Most increase was
measured in late July when lipid content was highest. There was a positive correlation
between lipid content and FFA after 1 month storage (0,233) and after 4 months storage
(0,883).
Results from Aubourg (2005) and Aubourg and Gallardo (2005), showed increase in FFA
content for the first 4 months (13 g FFA/100g lipids) for mackerel caught in May and then
slight decrease. For mackerel caught in November the FFA acid values changes very little. This
mackerel was stored at -20°C and -18°C. According to Stodolnik et. al. (2005) mackerel caught
in September had FFA content of below 1 gFFA/100g lipids for the first 4 months in storage at
-20°C.
There was a positive correlation between FFA after 1 month of storage and 4 months of
storage.
Compared with this study the difference can be because of higher temperature (-20°C) the
FFA content increases sharper and there are higher values. Hwang and Regenstein (1988)
found the temperature to be the only factor affecting hydrolytic rancidity in mackerel fillets.

64
According to studies made by Matis quality of mackerel diminish when FFA exceed 3-4%. All
values in this study were over 4%, indicating that the overall quality of this mackerel was not
good after 4 months of storage.

65
6 CONCLUSION
As expected, quality deterioration in form of lipid hydrolyses and oxidation took place in
headed and gutted Atlantic mackerel during stored at about -27⁰C for 4 months. The oxidation
development varies, like the composition of the fish, throughout the season. Mackerel caught
in July and August surpassed the phase of lipid oxidation faster, during frozen storage,
compared to mackerel caught in June and September and had therefore higher oxidation rate.
Higher lipid content in July and August mackerel was probably the main reason for that.
Samples from the beginning of the season, when the mackerel had low lipid content and at
the end of the season when the lipid content started to diminish after reaching its peak, had
lowest oxidation rate and hence higher shelf life. According to this study it is reasonable to
conclude that lipid content is the main contributor to quality declining in Atlantic mackerel
during frozen storage other factors are less important.
Still lipid content is vital for allocation of the mackerel. Higher lipid content means access to
markets who pay higher prices. Icelandic mackerel processors should therefore focus their
fishing on August and September when the lipid content is optimal and they can maximise the
value of the mackerel products. They should also consider lowering the frozen storage
temperature in order to improve the shelf life and quality of the product.
66
7. REFERENCES
Adebowale, B.A., L.N. Dongo, C.O. Jayeola and S.B. Orisajo, (2008). Comparative quality
assessment of fish (Clarias gariepnius) smoked with cocoa pod husk and three other
different smoking materials. J. Food Technol., 6: 5-8. DOI: 10.3923/jftech.2008.5.8.
Aitken, A. and Connell J. (1979). Fish. In: Priestley R. (ed.), Effects of Heating on Food Stuffs.
London: Applied Science Publishers Ltd. pp. 219–254.
AMEC (2003). Management of wastes from Atlantic seafood processing operations. AMEC
Earth and Environmental Limited, Dartmouth, Nova Scotia, Canada.
http://aczisc.dal.ca/nparpt.pdf
Arason, S., Thorvaldsson, L., Palsson, G. and Sveinthorsdottir, R. (2010): Vinnsla til aukinna
verðmæta. Málstofa um makríl – veiða og vinnslu. Matis ohf. 2010.
Arvanitoyannis, I. S. and Kotsanopoulos, K. V. (2011). Smoking of Fish and Seafood: History,
Methods and Effects on Physical, Nutritional and Microbiological Properties. Food
Bioprocess Technology (2012) 5:831–853
Aubourg, S., C. G. Sotelo, and Perez-Martin, R. (1997). "Quality assessment of sardines during
storage by measurement of fluorescent compounds." Journal of Food Science 62(2):
295-298, 304.
Aubourg, S., C. G. Sotelo, et al. (1998). "Assessment of quality changes in frozen Sardine
(Sardina pilchardus) by fluorescence detection." JAOCS 75(5).
Aubourg, S. P. (1999a). "Lipid damage detection during the frozen storage of an
underutilized fish species." Food Research International 32(7): 497-502.
Aubourg, S. P. (1999a). "Recent advances in assessment of marine lipid oxidation by using
fluorence. “JAOCS 76(4): 409-419.
Aubourg, S. (2001). "Fluorescence study of the pro-oxidant effect of free fatty acids on
marine lipids." J Sci Food Agric 81: 385-390.
Aubourg, S. and Gallardo J. (2004). Effect of brine freezing on the rancidity development
during the frozen storage of small pelagic fish species Received: 1 June 2004 /
Revised: 16 August 2004 / Published online: 24 November 2004. Springer-Verlag
2004.
Aubourg S, Rodríguez A and Gallardo J., (2005). Rancidity development during frozen
67
storage of mackerel (Scomber scombrus): effect of catching season and commercial
presentation. Eur J Lipid Sci. Technology 107:316-323.
Ayala M.D., Albors O.L, Blanco, A., Alcazar A.G., Abellan E., Zaroz, G.R. Gil, F. (2005).
Structural and ultra-structural changes on muscle tissue of sea bass, Dicentrarchus
labrax L., after cooking and freezing. Aquaculture, 250, 215-231.
Ástþórsson, Ó.S., Sigurðsson, Þ. and Sveinbjörnsson, S. (2009). Mackerel in Icelandic
Waters. Environmental conditions in Icelandic waters 2009. Hafrannsóknarstofnun
Íslands, Reykjavík 2010 p. 25-32.
Bannerman, A. Mc. K. (1980). Hot smoking of fish. Torry research advisory note #82. Torry
Research Station. Aberdeen: Ministry of Agriculture, Fisheries and Food.
Bello, R.A., Luft, J.H., Piggot, G.M. (1982). Ultra structural-study of skeletal fish muscle after
freezing at different rates. Journal of Food Science, 47, 1389-1394.
Bennour M., El Marrakchi A., Bouchriti N., Hamama A. and El Ouadaa M. (1991). Chemical
and microbiological assessments of mackerel (Scomber scombrus) stored in ice.
Journal of Food Protection 54: 784, 789–792.
Bernardez, M., L. Pastoriza, Sampedro, G., Herrera, J. R. and Cabo, M. (2005). "Modified
method for the analysis of free fatty acids in fish." J. Agric. Food Chem. 53: 1903-
1906.
Bigelow, H. B. and W. C. Schroeder (1953). Fishes of the Gulf of Maine. Rev. ed. Washington
(DC): US Government Printing Office. Fishery Bulletin no. 74 of the Fish and Wildlife
Service, US Department of the Interior. P. 317.
BIM (2006). Mackerel (Scomber scombrus) Quality Guide. Bord Iascaigh Mhara. Irish
Fisheries board, 2006.
Bligh, E. G. and W. J. Dyer (1959). "A rapid method of total extraction and purification.
Can. J. Biochem. Physiol. 37: 911-917.
Bonnell, A. D. (1994). Raw material quality. In Quality Assurance in Seafood Processing A
Practical Guide. CA. D. Bonnell, ed.) pp. 54-76. Chapman & Hall. New York.
Borderias A. J. and Sánchez-Alonso I. (2011). First Processing Steps and the Quality of Wild
and Farmed Fish. J Food Sci. 2011 January; 76(1): R1–R5.
Braekkan, O. R., and Boge, G. (1962). A comparative study of amino acids in the muscle of
different species of fish. Fiskeridir. (Norw.) Skr. Ser. Teknol. Unders. 4: 1-19.
Brix, O. Apablaza P., Taxt A. and Grüner R. (2009). Chemical shift based MR imaging and
68
gas chromatography for quantification and localization of fat in Atlantic mackerel.
Journal of Experimental Marine Biology and Ecology Volume 376, Issue 2, 15 August
2009, Pages 68–75
Burgaard M. G. (2010). Effect of frozen storage temperature on quality-related changes in
fish muscle. Changes in physical, chemical and biochemical quality indicators during
short- and long-term storage. DTU 2010.
Burt, J. R. and Hardy, R. (1992). Composition and deterioration of pelagic fish. In: Pelagic
fish- the resources and its exploitation. J. R. Burt, r. hardy, K. J. While (eds). Fishing
News Books: 115-141.
Chapman, K. W., Sagi, I., Hwang, K. T. and Regenstein, J. M. (1993). Extra-Cold Storage of
Hake and Mackerel Fillets and Mince. Journal of Food Science, 58: 1208–1211.
Cheftel, J. and Cheftel, H. (1976). Introducción a la Bioquímica y Tecnología de Alimentos. Vol.
1. Zaragoza, Spain: Acribia. pp. 65–97.
Connell, J. J. (1990). Control of fish quality 3rd Ed. (Oxford: Fishing News Books). pp: 1-227.
Cornu, M., Beaufort, A., Rudelle, S., Laloux, L., Bergis, H. and Miconnet, N. (2006). Effet of
temperature, water-phase salty and phenolic contents on Listeria monocytogenes
growth rates on cold-smoked salmon and evaluation of secondary models.
International Journal of Food Microbiology, 106
Damodaran, S. (2008). Amino Acids, Peptides and Proteins. In: Damodaran, S., Fennema,O.
R. & Parkin, K. (eds.). Fenemma's Food Chemistry. Boca Raton, Florida: CRC Press.
Decker, E. and Hultin, H. (1990). Factors influencing catalysis of lipid oxidation by the
soluble fraction of mackerel muscle. J Food Sci 55:947-950, 953.
Duinker, A. and Pedersen, M. (2014): Fettavleiring, tekstur og struktur I makrell fra juni til
November. Prosjektrapport FHF prosjekt #900786
El Marrakchi, A., Bennour, M. Bouchriti, N., Hamama, A. and Tagafait, H. (1990). Sensory,
chemical and microbiological assessments of Moroccan sardines (Sardina pilchardus)
stored on ice. J. Food Protect. 53: 600-60.
Erickson, M. (1997). Antioxidants and their application to frozen foods. In: Erickson M, Hung
Y-C (eds) Quality in frozen food. Chapman and Hall, New York, pp 233–263.
Erikson, U., Beyer, A.R., and Sigholt, T. (1997). Muscle high-energy phosphates and stress
affect K-value during ice storage of Atlantic salmon (salma salar). Journal of Food
Science, 62(1): 43-47.
69
FAO (1983). Species Catalogue. Vol. 2. Scombrids of the world. An annotated and illustrated
catalogue of Tunas, Mackerels, Bonitos and related species known to date.Collette,
B.B. & C.E. Nauen 1983. FAO Fish. Synop. (125) Vol.2:137.
FAO (2001). Cold Storage of Frozen Fish. Ministry of Technology. Torry Research Station.
Torry advisory note no. 28.
FAO (2005). Fisheries and Aquaculture topics. Quality of fish and fish products. Topics Fact
Sheets. Text by Lahsen Ababouch. In: FAO Fisheries and Aquaculture
Department [online].
FAO (2013). Fisheries and Aquaculture Information and Statistics Service - 25/10/2013
Fao (2015). Aquatic species distribution map of Scomber scombrus.
Fennema, O. R. (1990). Comparative water holding properties of various muscle foods.
Journal of Muscle Foods, 1: 363–381.
Fjermestad, A., Hemre, G. I., Holm, J. C., Totland, G. K. and Frøyland, L. (2000). Effects of
different dietary fat levels in cage-fed Atlantic mackerel (Scomber scombrus).
European Journal of Science and Technology. Volume 102, Issue 4, pages 282-286,
April 2000.
Fisheries and Oceans Canada (2013). ARCHIVED – Fishing Gear Types. www.dfo-mpo.gc.ca
Fraser, O. and Sumar, S. (1998). Compositional changes and spoilage in fish - an
introduction", Nutrition & Food Science, Vol. 98 Issue 5, pp.275 - 279
Furutani, A., Matsubara, H., Ishikawa, S. and Satomi, M. (2013). Behavior of histamine-
producing bacteria in shimesaba, raw mackerel salted and marinated in vinegar
during processing and storage at various temperatures. Fisheries Science July
2013, Volume 79, Issue 4, pp 725-733
Gallardo, J., Aubourg, S. and Pérez-Martín, R. (1989). Lipid classes and their fatty acids at
different loci of albacore (Thunnus alalunga): Effects of precooking. Journal of
Agriculturaland Food Chemistry 37: 1060–1064.
García-Arias, T., Sánchez-Muniz, J., Castrillón, A. and Navarro, P. (1994). White tuna canning,
total fat, and fatty acid changes during processing and storage. Journal of Food
Composition and Analysis 7: 119–130.
Ghaly A. E., Dave D., Budge S. and Brooks M. (2010). American Journal of Applied Sciences
7 (7): 859-877, 2010 ISSN 1546-9239
Goulas, A. E. and Kontominas, M. G. (2005). Effect of salting and smoking-method on the
70
keeping quality of chub mackerel (Scomber japonicus): biochemical and sensory
attributes. Food Chemistry, 93, 511–520
Gram, L. and Huss, H. H. (1996). Microbiological spoilage of fish and fish products.
International Journal of Food Microbiology 33: 121-137.
Grégoire, F., Dionne, H. and Lévesque, C. (1994). Fat content of Atlantic mackerel (Scomber
scombrus L.) in 1991 and 1992. Canadian Industry Report of Fisheries and Aquatic
Sciences 220 ix + 69 p.
Gustafsson, O. (2013). Markaðirmakríl afurða, samkeppnistaða og tækifæri Íslands.
Lokaverkefni (BSc) sjavarutvegsbraut, Haskolinn a Akureyri, Vidskipta- og
Raunvisindadeild
Haard, N. (1992). Biochemical reactions in fish muscle during frozen storage. In: Bligh E. (ed.),
Seafood Science and Technology. Oxford, UK: Fishing News Books.
Hagstofa (2014). Export and export production of marine products 2012. Hagstofa Islands,
Hagtidindi 2013:2, 20. June 2013.
Hamre K., Lie O. and Sandnes K. (2003). Seasonal development of nutrient composition,
lipid oxidation and colour of fillets from Norwegian spring\spawning herring (Clupea
harengus L.) Food Chem. 2003, 82 (3) 441-446.
Hansen, T.L., Gill T., Rontved, S. D. and Huss, H. H. (1996). Importance of autolysis and
microbiological activity on quality of cold-smoked salmon. Food Res. Int., 29: 181-
186.
Hayes, P. R. (1985). Food Microbiology and Hygiene. Second Edition. Chapman and Hall,
London.
Hong, L.C., Leblanc, Z.J. Hawrish, Z.J. og Hardin R.T., (1996). Quality of Atlantic mackerel
(Scomber scombrus L.) fillets during modified atmosphere storage. Journal of Food
Science, volume 61, n. 3. 646-651.
Horner, W. (1997). Canning of fish and fish products. In: Hall G. (ed.), Fish Processing
Technology. 2nd edn. London: Blackie Academic and Professional, Chapman and Hall.
pp. 119–159.
Huang, Y., Cavinato, A. G., Mayes, D. M., Bledsoe, G. E., & Rasco, B. A. (2002). Nondestructive
prediction of moisture and sodium chloride in cold smoked Atlantic salmon (Salmo
salar). Journal of Food Science, 67(7), 2543–2547.
71
Hultin, H. O. (1994). Oxidation of lipids in seafood. Seafoods: Chemistry, Processing
Technology and Quality pp 49-74.
Huss, H. H. (1995). Quality and quality changes in fresh fish. FAO Fisheries Technical Paper-
348, FAO 1995.
Hwang, K.T. and Regenstein, J. M. (1988). Protection of menhaden monce lipid from
rancidity during frozen storage. J. Food Sci 54:1120-1124.
Hwang, C., and Tamplin, M. L. (2005). The influence of mayonnaise, pH and storage
temperature on the growth of Listeria monocytogenis in seafood salad. International
Journal of Food Microbiology, 102, 277–285.
Isfelag (2011). Trip to Russia April 2011
Isgem (2013): The Icelandic Food Composition Database. www.matis.is/ISGEM/en/
ISO (1983). 6496. Animal feeding stuffs - Determination of moisture content, 1st ed.
International Organization for Standardization, Geneva.
ISO (1999). ISO 6492:1999 (E). Animal feedings stuffs. Determination of fat. International
Organization for Standardization, Geneva.
ISO (2005). ISO 5983-2:2005. Animal feeding stuffs -- Determination of nitrogen content
and calculation of crude protein content -- Part 2: Block digestion/steam distillation
method. International Organization for Standardization, Geneva.
Iversen, S.A. (2004). Mackerel and Horse mackerel. In H.R. Skjoldal et al (eds) The Norwegian
Sea Ecosystem. Tapir Academic Press, Trondheim, Norway pp. 289-300
Jhaveri, S. N., Leu, A. og Constantinides, S.M. (1982). Atlantic mackerel (Scomber scombrus):
Shelf life in ice. Journal of Food Science, volume 47, 1808-1810.
Jia, T., Kelleher, S., Hultin, H., Petillo, D., Maney, R. and Krzynovek, J. (1996). Comparison
of quality loss and changes in the glutathione antioxidant system in stored mackerel
and bluefish muscle. J. Agric. Food Chem. 44, 1195-1201.
Jian, S., Tsao, C. and Lee, T. (1987). Effect of free amino acids on the denaturation of mackerel
myofibrillar proteins in vitro during frozen storage at –20 °C. Journal of Agricultural and
Food Chemistry 35: 28–33
Jonsdottir R., Bragadottir M. and Olafsdottir G. (2008). Oxun í fiskvöðva-Hlutverk
fosfólípíða, próteina, andoxunarefna og áhrif suðu á oxun í fiskvöðva. Skýrsla Matís
08-08, April 2008, Reykjavik, Iceland.
Joshi, V. and Saralaya, K. (1982). Studies on the effect of precooking in sardine canning: V.
72
Factors influencing the precooking effect. Mysore Journal of Agricultural Science 16:
338–345
Jónsson, Á. and Sveinþórsdóttir, R. (2011). Fullvinnsla á makríl / Full processing of
mackerel. Skýrsla Matís 31-11, 32 s.
Hagstofa 2014: Afli eftir fisktegund, kvótaflokki skipa, veiðarfærum, janúar 2000-júní 2014.
Hagstofa.is.
Kainz, M., Arts, M. T. and Mazumder, A. (2004). Essential fatty acids within the planktonic
food web and its ecological role for higher trophic levels. Limnol. Oceanogr, 49, 1784–
1793
Kanner, J. (2007). Dietary advanced lipid oxidation endproducts are risk factors to human
health. Mol. Nutr. Food Res., 51:1094–101.
Ke, P.J, Ackman, R. G., Linke, B. A. and Nash, M. (1977). Differential lipid oxidation in various
parts of frozen mackerel. International Journal of Food Science & Technology. Volume
12, Issue 1, pages 37–47, February 1977
Keay, J. K. (2001): Handling and Processing Mackerel, Ministry of Agriculture, Fisheries and
Food, Torry Advisory note No. 66
Kiessling, A., T. Aasgaard, T. Storebakken, L. Johansson and K.-H. Kiessling (1991). Changes
in the structure and function of the epaxial muscle of rainbow trout (Oncorhynchus
mykiss) in relation to ration and age. 111. Chemical composition. Aquaculture 93, 373-
387.
Kjällstrand, J. and Petersson, G. (2001). Phenolic antioxidants in wood smoke. Science of the
Total Environment, 277 (2001), pp. 69–75
Kolakowska Α., I. Macur, A. Pankiewicz, M. Szczygielski, (1998). Smoked mackerel as a
source of polyunsaturated fatty acids]. In: Evening Primorose Seed Oil and Other Oils
Containing n-6 and n-3 Acids in Prevention and Treatment] [Stołychwo A. (ed.)].
Conference proceeding, Sulejów 15-16 May 71-78.
Kolakowska, A., Olley, J. and Dunstan, G.A. (2003). Fish Lipids. In Sikorski, Z. E. and
Kolakowska, A. (Eds). Chemical and Functional Properties of Food Lipids. Boca Raton:
CRC Press.
Kolodziejska, I., Niecikowska, C., Januszewska, E., & Sikorski, Z. E. (2002). The microbial and
sensory quality of mackerel hot smoked in mild conditions. Lebensmittel-Wissenschaft
73
und-Technologie, 35, 87–92.
Kristoffersen, S., Tobiassen, T., Esaiassen, M., Olsson, G.B., Godvik, L.A., Seppola, M.A.,
and Olsen, R.L. (2006). Aquaculture Research, 37(15): 1556-1564.
Lemon, D. W. (1975). "An improved TBA test for rancidity." New Series Circular No. 51,
Halifax Laboratory, Halifax, Nova Scotia.
Lowry, R. and I. Tinsley (1976). "Rapid colorimetric determination of free fatty acids."
JAOCS 53(470-472).
Mackie, I. (1993). The effects of freezing on flesh proteins. Food Reviews International 9: 575–
610.
Mahmoud, B.S.M., K. Yamazaki, Miyashita K., Shin I.I. and Suzuki T., (2006). A new
technology of fish preservation by combined treatment with electrolysed NaCl
solutions and essential oil compounds. Food Chem., 99: 656-662.
Malle, P., Nowogrocki, G. and Tailliez, R. (1983). Corrélation entre l'indice d'altération et
l'azote basique volatil total pour divers poissons marins. Sciences des Aliments, 3
311-322.
Malle P. and S. H. Tao (1987). "Rapid quantitative determination of trimethylamine using
steam distillation." J Food Protect 50(9): 756-760
McArdle, E., E. Barnwall and F. Nolan. 1986. Length-weight relationships, fat content and
Parasitic infestation of Irish mackerel. Ireland Dept. of Tourism, Fisheries and
Forestry.8 P.
McClements, J. & Decker, E. A. (2007). Lipids. In: Damodaran,S., Fennema, O. R. & Parkin, K.
(eds.) Fenemma's Food Chemistry. Boca Raton, Florida: CRC Press.
Montero, P., Gómez-Guillén, M. C., & Borderias, A. J. (2003). Influence of salmon provenance
and smoking process on muscle functional characteristics. Journal of Food Science,
68(4), 1155–1160.
Munasinghe, D. M. S., Ichimaru, K., Ryuno, M., Ueki, N., Matsui, T., Sugamoto, K., et al.
(2003). Lipid peroxidation-derived hepatotoxic aldehydes, 4-hydroxy-2 E-hexenal in
smoked fish meat products. Fisheries Science, 69, 189–194.
Nair, P., George, C., Thampuran, N., Perigreen, P. and Gopakumar, K. (1987). Studies on
frozen storage characteristics of individually quick frozen and block frozen mackerel.
Fishery Technology 24: 103–108.

74
Nielsen, J. and Jessen, F. (2007). Quality of Frozen Fish. In: Handbook of Meat, Poultry and
Seafood Quality. Nollet, L. M. L. (Ed.) Blackwell Publishing, Iowa. pp. 577-586.
Nifes (2015): Seafood data nutrients. nifes.no
Nunes, M., Batista I., Morâo de Campos, R. (1992). Physical, chemical and sensory analysis
of sardine (Sardina pilchardus) stored in ice Journal of the Science of Food and
Agriculture, 59 (1992), pp. 37–43.
Olafsdottir G., Martinsdottir E., Oehlenschläger J., Dalgaard P., Jensen B., Undeland I.,
Mackie, I. M., Henehan, G. and Nilsen H. (1997). Methods to evaluate fish freshness
in research and industry. Trends in Food Science and Technology, 8 (1997), pp. 258–
265.
Özogul, Y. and Balikci, E. (2011). Effect of various processing methods on quality of mackerel
(Scomber scombrus). Food and Bioprocess Technology.
Pelagia AS (2014). pelagia.com
Pérez-Martín, R., Banga, J., Sotelo, C., Aubourg, S. and Gallardo, J. (1989). Prediction of
precooking times for albacore (Thunnus alalunga) by computer simulation. Journal of
Food Engineering 10: 83–95.
Pérez-Villarreal B. and Pozo R. (1990). Chemical composition and ice spoilage of albacore
(Thunnus alalunga). Journal of Food Science, 55 678-682.
Pigott, G. and Tucker, B. (1990). Seafood. Effects of Technology on Nutrition. New York and
Basel: Marcel Dekker, Inc. pp. 104–135.
Popelka P., Luptáková O., Marcinčák S., Nagy J., Mesarčová L. and Nagyová A. (2012). The
effect of glaze and storage temperature on the quality of frozen mackerel fillets. ACTA
VET. BRNO 2012, 81: 397–402.
Rodriguez, O., Velazquez, J., Pineiro, C., Gallardo, J. and Aubourg, S. (2004). Effects of
storage in slurry ice on the microbial, chemical and sensory quality and on the shelf life
of farmed turbot (Psetta maxima). Food chemistry. Volume 95, Issue 2, March 2006,
Pages 270-278.
Saeed, S. and Howell, N. (2001). 12-lipoxygenase activity in the muscle tissue of Atlantic
mackerel (Scomber scombrus) and its prevention by antioxidants. J Sci Food Agric
81:745-750.
Saeed, S. and Howel, N. (2002). Effect of lipid oxidation and frozen storage on muscle

75
proteins of Atlantic mackerel (Scomber scombrus). J Sci Food Agric. 2002, 82, 579-
586.
Sallam, K. I., Ahmed, A. M., Elgazzar, M. M., & Eldaly, E. A. (2007). Chemical quality and
sensory attributes of marinated Pacific saury (Cololabis saira) during vacuum-packaged
storage at 4 °C. Food Chemistry, 102, 1061–1070
Santha, N. C. and Decker E. A. (1994). "Rapid, sensitive, iron-based spectrophotometric
methods for determination of peroxide values of food lipids." Association of Official
Analytical Chemists International 77: 421-424.
Seafish (2012). Responsible Sourcing Guide: Mackerel. Version 5 – January 2012, Origin Way,
Europarc, Grimsby.
Scott, W.B, and Scott, M. G. (1989). Atlantic Fishes of Canada. Copeia, Vol. 1989, No. 3 pp.
812-814.
Shahidi, F. and Spurvey, S. A. (1996). Oxidative stability of fresh and heat-processed dark
and light muscles of mackerel (Scomber scombrus). Journal of Food Lipids. Volume 3,
Issue 1, pages 13–25, March 1996.
Shenouda, S. (1980). Theories of protein denaturation during frozen storage of fish flesh.
Advances in Food Research 26: 275–311.
Sigholt, T., Erikson, U., Rustad, T., Johansen, S., Nordtvedt, T.S., and Seland, A. (1997).
Handling Stress and Storage Temperature Affect Meat Quality of Farmed raised
Atlantic salmon (Salmo Salar). Journal of Food Science, Volume 62, Issue 4. Pages 898-
905.
Sigurgisladottir, S., Ingvarsdottir, H. Þ., Torrissen, O. J, Cardinal, M and Hafsteinsson, H.
(2000). Effects of freezing/thawing on the microstructure and the texture of smoked
Atlantic salmon (Salmo salar). Food Research International, 33: 857-865.
Sikorski, Z. and Kolakowska, A. (1994). Changes in protein in frozen stored fish in
Sikorski Z, Sun Pan B (Eds.) Seafood proteins, pp. 99-112. Chapman and Hall, New York,
USA.
SINTEF (2012). http://fhl.no/book/Makrell/index.html. Kvalitetshåndbok for pelagisk fisk.
Sørensen, N.K., Brataas, R., Nyvold, T.E. and Lauritzen, K. (1995). Influence of early
processing (pre-rigor) on fish quality. In: Seafood from producer to consumer,
integrated approach to quality. Luten, J. B., Børresen, T. and Oehlenschläger, J. (Ed.)
Elsevier Science B.V., Amsterdam. pp. 253-263.
76
Stansby, M. E. and Lemon, J. M. (1941). Studies on the handling of fresh mackerel, Scomber
scombrus. U.S. Fish. Wildl. Sen'. Res. Rep. 1: 1-46.
Steinthorsdottir, R., (2009). Veiðar, flokkun, vinnsla og markaðir fyrri makríl veiddan
af uppsjávarskipum –Markaðir. Matis Report 2009.
Stjornartidindi (2013). Reglugerð Nr. 327/2013, um stjórn makrílveiða íslenskra fiskiskipa
árið 2013. Atvinnuvega- og nýsköpunarráðuneytið 2013.
Stodolnik, L., Stawicka, A., Szczepanik, G. and Aubourg, S. P. (2005): Rancidity inhibition
study in frozen whole mackerel (Scomber scombrus) following flaxseed (Linum
usitatissimum) extract treatment. Grasas y Aceites 198 Vol. 56. Fasc. 3 (2005), 198-
204.
Stolyhwo, A., Kolodziejska, I. and Sikorski, Z. E. (2004). Long chain polyunsaturated fatty acids
in smoked Atlantic mackerel and Baltic sprats. Food Chemistry, Volume 94, Issue 4
March 2006 P. 589-595
Sveinbjornsson, S., Guðmundsdóttir, Á. and Sigurdsson. (2008). "Makríl í NA-Atlantshafi." In
http://www.hafro.is/malstofa_video/2008/malstofa-31okt08.wmv.
Thorsteinsson, J. A., Jensson, P. Condra, T. and Valdimarsson, P. (2003): Transient
simulation of refrigerated and chilled seawater system. Aalborg University Institute of
Energy Technology 9100 Aalborg, Denmark. University of Iceland Department of
Mechanical and Industrial Engineering 107 Reykjavik Iceland.
Ünlüsayin, M., Kaleli, S., Bilgin, Ş., İzci, L., & Günlü, A. (2006). Effect of hot-smoked rainbow
trout (Oncorhynchus mykiss) diets on the protein levels of liver tissue in rats (original
paper). Annals of Nutrition and Metabolism, 50, 1–6.
Zotos, A., Hole, M. and Smith, G. (1995). The effect of frozen storage of mackerel (Scomber
scombrus) on its quality when hot-smoked. J Sci Food Agric 67:43-48.
Varlet, E., Prost C. & Serot T. (2007). Volatile aldehydes in smoked fish: Analysis methods,
occurence and mechanisms of formation. Food Chemistry Volume 105, Issue 4, 2007,
Pages 1536-1556
Wallace, P. D., 1991: Seasonal variation in fat content of mackerel (Scomber scombrus L.)
caught in the English Channel. Fisheries Research Technical Report (1991), p. 91
Wikipedia 2015: Correlation and dependence. Wikipedia.org
Yashoda, K. P., Rao, R. J., Mahendrakar, N. S., & Rao, D. N. (2005). Marination of sheep
77
muscles under pressure and its effect on meat texture quality. Journal of Muscle Foods,
16, 184–191.
Xing, Y., Yoo, Y., Kelleher, S.D., Nawar, W. W., og Hultin, H. O., 1993. Lack changes in fatty
acid composition of mackerel and cod during iced and frozen storage. Journal of Food
Lipids, 1. 1-14.
Xiong, Y. (1997). Protein denaturation and functionality losses. In: Erickson M. and Hung Y.-C.
(eds), Quality in Frozen Food. New York: Chapman and Hall. pp. 111–140.
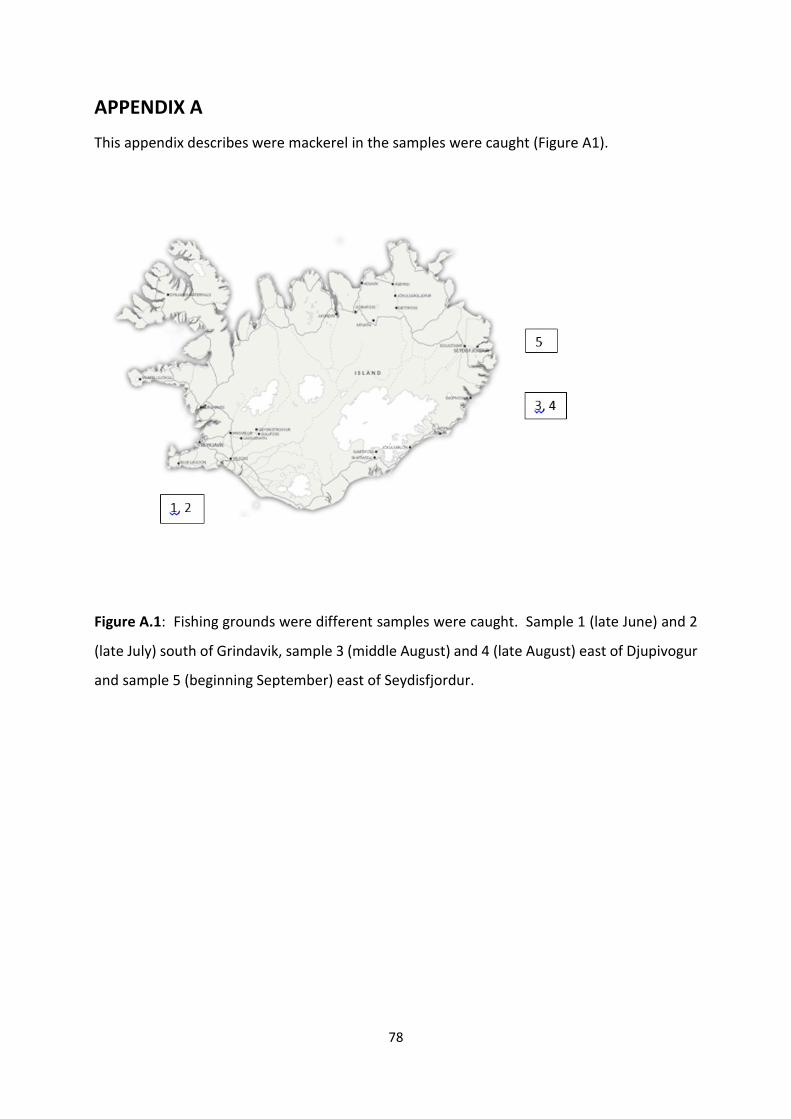
78
APPENDIX A
This appendix describes were mackerel in the samples were caught (Figure A1).
Figure A.1: Fishing grounds were different samples were caught. Sample 1 (late June) and 2
(late July) south of Grindavik, sample 3 (middle August) and 4 (late August) east of Djupivogur
and sample 5 (beginning September) east of Seydisfjordur.
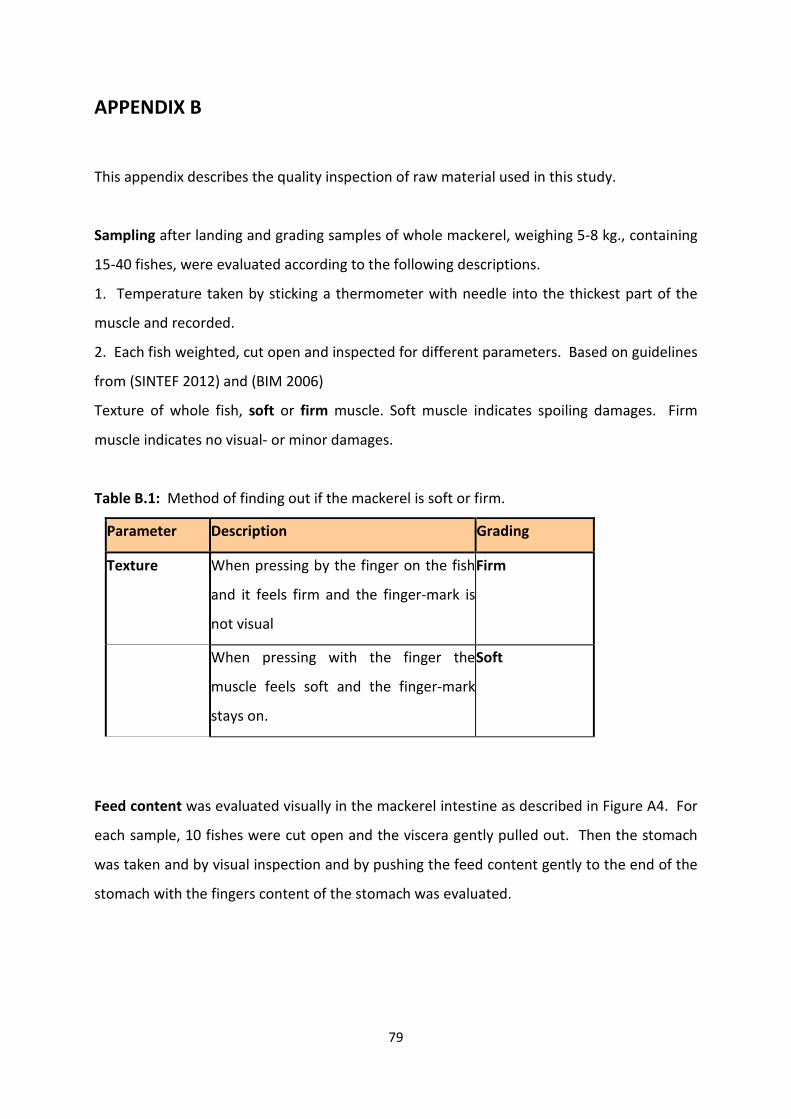
79
APPENDIX B
This appendix describes the quality inspection of raw material used in this study.
Sampling after landing and grading samples of whole mackerel, weighing 5-8 kg., containing
15-40 fishes, were evaluated according to the following descriptions.
1. Temperature taken by sticking a thermometer with needle into the thickest part of the
muscle and recorded.
2. Each fish weighted, cut open and inspected for different parameters. Based on guidelines
from (SINTEF 2012) and (BIM 2006)
Texture of whole fish, soft or firm muscle. Soft muscle indicates spoiling damages. Firm
muscle indicates no visual- or minor damages.
Table B.1: Method of finding out if the mackerel is soft or firm.
Parameter Description Grading
Texture When pressing by the finger on the fish
and it feels firm and the finger-mark is
not visual
Firm
When pressing with the finger the
muscle feels soft and the finger-mark
stays on.
Soft
Feed content was evaluated visually in the mackerel intestine as described in Figure A4. For
each sample, 10 fishes were cut open and the viscera gently pulled out. Then the stomach
was taken and by visual inspection and by pushing the feed content gently to the end of the
stomach with the fingers content of the stomach was evaluated.
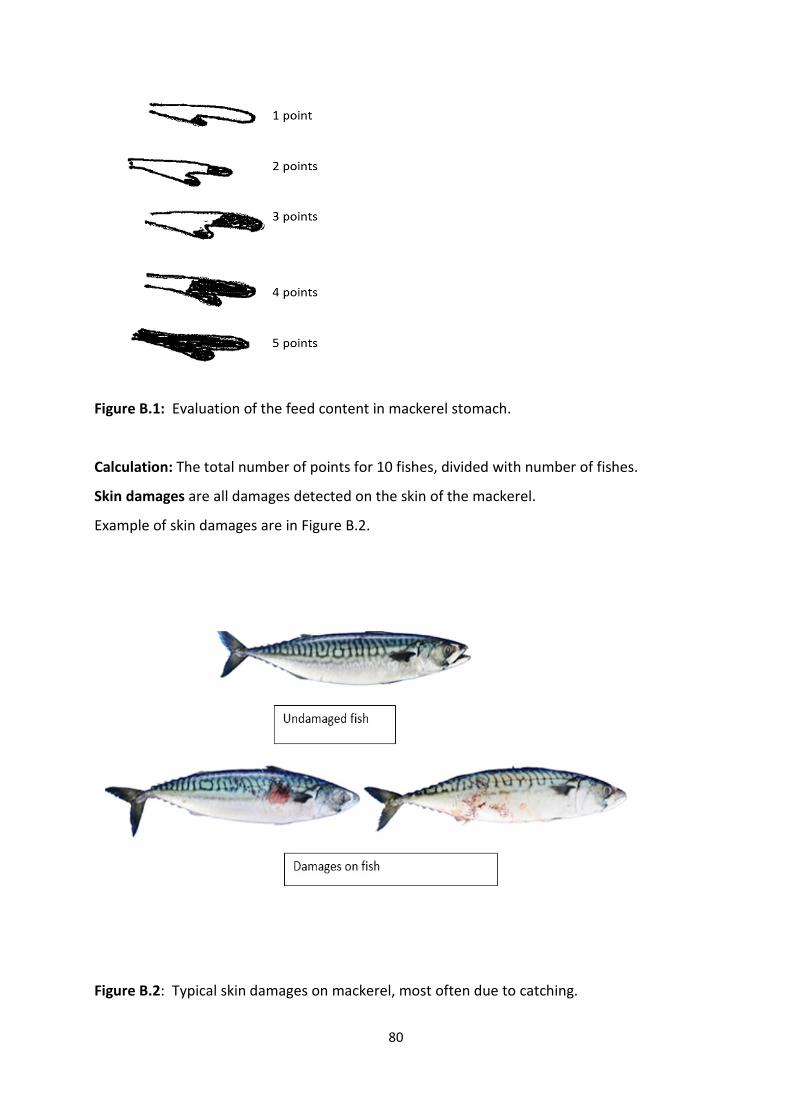
80
Figure B.1: Evaluation of the feed content in mackerel stomach.
Calculation: The total number of points for 10 fishes, divided with number of fishes.
Skin damages are all damages detected on the skin of the mackerel.
Example of skin damages are in Figure B.2.
Figure B.2: Typical skin damages on mackerel, most often due to catching.

81
Feed damages are visual by cutting the fish open and inspect the muscle as shown in Figure
B.3.
0:
1:
2:
Figure B.3: Grading of peritoneum, 0 Peritoneum strong and firm, 1 peritoneum loose when
touched, and 2 peritoneum is damages or none existing (SINTEF 2012).
Blood spots and damages spine are indication of rough handling during fishing.
82
APPENDIX C
This appendix describes the quality inspection of fully processed H/G mackerel used in this
study.
Sampling: Sample contains a whole block of mackerel (11 kg.). Samples were taken at the
end of the production line (packing)
Temperature, average size, texture (soft and firm) were analysed using same method
described in Appendix 2. Cutting defects, damaged and bad gut removal are all defects due
to processing. Most occurring in the cutting machines.
Quality ratio was calculated by adding all the defects together, minus 100. For example quality
ratio of 95% means that 95 % of the sample has no defects.
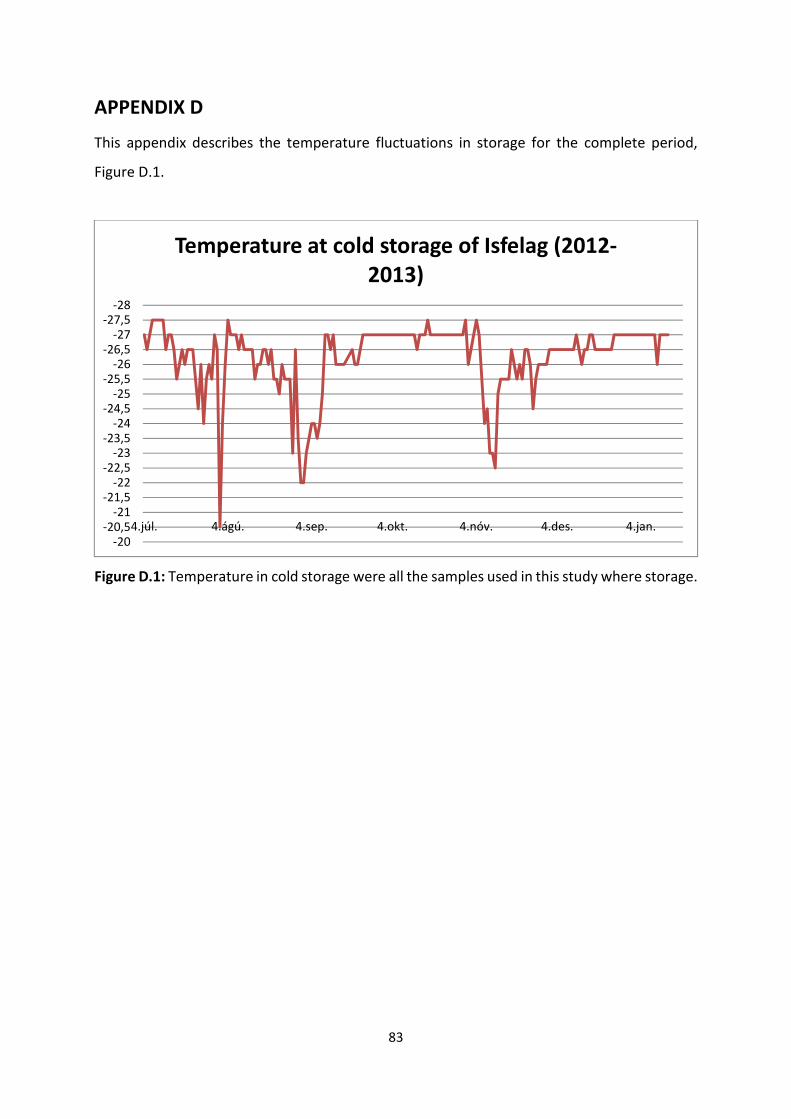
83
APPENDIX D
This appendix describes the temperature fluctuations in storage for the complete period,
Figure D.1.
Figure D.1: Temperature in cold storage were all the samples used in this study where storage.
-28-27,5
-27-26,5
-26-25,5
-25-24,5
-24-23,5
-23-22,5
-22-21,5
-21-20,5
-204.júl. 4.ágú. 4.sep. 4.okt. 4.nóv. 4.des. 4.jan.
Temperature at cold storage of Isfelag (2012-2013)