Embed Size (px)
Citation preview

Effects of Forced Uncoupling Protein 1 Expression in 3T3-L1 Cells on Mitochondrial
Function and Lipid Metabolism
Yaguang Si1, Santhosh Palani2, Arul Jayaraman2, Kyongbum Lee3
1Department of Biology, Tufts University, Medford, MA 02155, 2Department of Chemical
Engineering, Texas A&M University, College Station, TX 77843, and 3Department of Chemical
and Biological Engineering, Tufts University, Medford
Running Title: UCP1 expression in white adipocytes
Address correspondence to: Kyongbum Lee, Department of Chemical and Biological
Engineering, Tufts University, 4 Colby Street, Room 142, Medford, MA 02155; Tel. 617-627-
4323; Fax 617-627-3991; E-Mail: [email protected]
Abbreviations: WAT, white adipose tissue; BAT, brown adipose tissue; UCP, uncoupling protein;
TNF-α, tumor necrosis factor-α; IL-6, interleukin-6, TG, triglyceride; PPAR, peroxisome
proliferator-activated receptor; PGC, peroxisome proliferator-activated receptor γ co-activator;
CS, calf serum; IBMX, isobutylmethylxanthine; DEX, dexamethasone; GPDH, glycerol-3-
phosphate dehydrogenase; TMRM, trimethylrhodamine; MMP, mitochondrial membrane
potential; KRB, Krebs-Ringer buffer; OUR, oxygen uptake rate.
1
by guest, on July 23, 2018w
ww
.jlr.orgD
ownloaded from

ABSTRACT
Obesity-related increase in body fat mass is a risk factor for many diseases, including type 2
diabetes. Controlling adiposity by targeted modulation of adipocyte enzymes could offer an
attractive alternative to current dietary approaches. Brown adipose tissue (BAT), which is
present in rodents but not in adult humans, expresses the mitochondrial uncoupling protein 1
(UCP1) that promotes cellular energy dissipation as heat. Here, we report on the direct metabolic
effects of forced UCP1 expression in white adipocytes derived from a murine (3T3-L1)
preadipocyte cell line. After stable integration, the ucp1 gene product was continuously
expressed during differentiation, and reduced the total lipid accumulation by ca. 30 % without
affecting other adipocyte markers, such as cytosolic glycerol-3-phosphate dehydrogenase activity
and leptin production. The expression of UCP1 also decreased glycerol output and increased
glucose uptake, lactate output, and the sensitivity of cellular ATP content to nutrient removal.
However, oxygen consumption and β-oxidation were minimally affected. Taken together, our
results suggest that the reduction in intracellular lipid by constitutive expression of UCP1 reflects
a down-regulation of fat synthesis, rather than an up-regulation of fatty acid oxidation.
Key words: uncoupling protein, adipocyte metabolic profile, glucose starvation, cellular ATP
content
2
by guest, on July 23, 2018w
ww
.jlr.orgD
ownloaded from
INTRODUCTION
Obesity and type 2 diabetes have rapidly become leading health problems in the U.S (1). Solid
epidemiological data have established a positive correlation between the two diseases, which has
also been corroborated by molecular evidences (2). While the etiology of type 2 diabetes is
multi-factorial, it is generally agreed that a reduction in the sensitivity of muscle, liver, and
adipose tissue to insulin contributes to disease onset and progression (3). In vivo studies on
obesity have shown that systemic insulin resistance is often preceded by the expansion of body
fat mass (4), particularly intra-abdominal adiposity (5). In recent years, a growing number of
adipocyte-derived metabolic hormones have been identified, notably resistin (6) and adiponectin
(7), whose imbalance in obesity likely plays a role in the development of insulin resistance.
Other biochemical events and factors include over-production of pro-inflammatory cytokines
such as tumor necrosis factor-α (TNF-α) (8) and interleukin-6 (IL-6) (9) and elevation of
circulating free fatty acids (FFAs) (10-12). Increasing evidences link high plasma levels of TNF-
α and FFA to hyperglycemia as well as a hypertrophy of the white adipose tissue (WAT) (13),
which results from the progressive accumulation of intracellular lipids (triglyceride, TG). In
obese individuals, circulating FFAs are derived primarily from the lipolysis of TG stored in
white adipocytes (14).
Although it shares many features with the WAT, brown adipose tissue (BAT) is
specialized for adaptive thermogenesis, and expresses high levels of fatty acid oxidation
enzymes and mitochondrial respiratory chain components. In particular, the mitochondrial
respiratory uncoupling protein 1 (UCP1) is enriched in BAT, while it is minimally present in
WAT (15). UCP1 is thought to dissipate the mitochondrial membrane potential, partially
uncouple substrate oxidation and oxidative phosphorylation, and promote the dissipation of
3
by guest, on July 23, 2018w
ww
.jlr.orgD
ownloaded from
cellular biochemical energy as heat. Brown fat is present throughout life in rodents, but
disappears shortly after birth in larger mammals, including humans. Recent studies have shown
that UCP1 may be ectopically induced to express in WAT, and thus could be exploited to
increase the capacity to oxidize fatty acids in white adipocyte, and thereby regulate body fat
mass in humans. Induction of UCP1 expression in white adipocytes has been achieved both in
vivo and in vitro. For example, the fat-specific ap2 promoter has been used to construct
transgenic mice that constitutively express UCP1 in both BAT and WAT (16). These mice were
resistant to genetic obesity and carried WAT cells with an increased mitochondrial content.
Zucker diabetic fatty rats injected with an adenoviral vector carrying rat leptin cDNA exhibited
mitochondrial biogenesis and increased expression of peroxisome proliferator-activated receptor
γ coactivator-1α (PGC-1α), UCP1, and UCP2 in the WAT (17). In vitro expression of PGC-1α in
white adipocytes not only induced UCP1 expression, but also stimulated mitochondrial
biogenesis and the expression of mitochondrial enzymes of the respiratory chain (18). Silencing
of the co-repressor protein RIP140 (19) in cultured white adipocytes reduced the expression of
lipogenic enzymes and increased the expression of enzymes involved in energy dissipation,
including UCP1.
Together, these findings suggested that UCP1 could be an integral component of
cellular energy control, and that mechanisms of coordinated regulation may exist for UCP1 and
other enzymes of oxidative metabolism in white adipocytes. On the other hand, the specific role
of UCP1 remains to be fully elucidated. In this paper, we report on the direct metabolic effects
of forced UCP1 expression in white adipocytes. The metabolic phenotype observed in this study,
in particular the reduced accumulation of TG, is consistent with the energy dissipative function
4
by guest, on July 23, 2018w
ww
.jlr.orgD
ownloaded from
of UCP1 of previous reports. Our data also suggest that the reduction in TG reflects a down-
regulation of fat synthesis, rather than an up-regulation of fatty acid oxidation.
METHODS
Materials - 3T3-L1 cells were obtained from ATCC (Manassas, VA). Tissue culture reagents
including Dulbecco's modified Eagle's Medium (DMEM), calf serum (CS), fetal bovine serum
(FBS), human insulin, and penicillin/streptomycin were purchased from Invitrogen (Carlsbad,
CA). 2-deoxy-D-[1-14C]glucose and [U-14C]palmitate were purchased from PerkinElmer
(Wellesley, MA). Unless otherwise noted, all other chemicals were purchased from Sigma (St.
Louis, MO).
Plasmid construction - Plasmids pRevTet-Off and pRevTRE were purchased from BD
Biosciences (Mountain View, CA). Plasmid pCMV-Sport6-UCP1 containing the full length
cDNA for mouse ucp1 was purchased from Invitrogen (Carlsbad, CA). The ucp1 cDNA was
excised from pCMV-Sport6-UCP1 by Sal I and Xba I digestion, and subcloned into the Sal I and
Xba I sites of plasmid pSP72 (Promega, Madison, WI) to generate pSP72-UCP1. The UCP1
cDNA was subsequently excised out of pSP72-UCP1 by Sal1 and Cla1 digestion and cloned into
the Sal I and Cla I sites of pRevTRE to generate pRevTRE-UCP1.
Electroporation of 3T3-L1 preadipocytes - The pRevTet-Off and pRev-TRE-UCP1 plasmids
were sequentially introduced into 3T3-L1 preadipocytes by electroporation. Approximately 10µg
of linearized plasmid (using Sca I for pRevTet-Off and BsaA I for pRev-TRE-UCP1) was used
for each electroporation. Passage 2 preadipocytes (2.5×10⁶) were trypsinized and first
5
by guest, on July 23, 2018w
ww
.jlr.orgD
ownloaded from

electroporated with pRevTet-Off at 950µF, 240V in a 0.4 mm cuvette using a Bio-Rad Gene
Pulser II (Hercules, CA). After a 10 min recovery at room temperature, the cells were seeded
into four T-75 flasks and incubated at 37 ºC. After 48 hrs, 700 μg/mL of G418-sulfate was
applied as selection pressure and the cells were incubated for 8 days to select for 3T3-L1
preadipocytes that had pRevTet-Off stably integrated into the genome. All surviving cells were
pooled, cultivated in a T-75 flask, and electroporated again with either linearized pRevTRE-
UCP1 or pRevTRE-null (control) using the same electroporation and selection conditions as
described above, except that 200 µg/mL of hygromycin was used to select for cells that
contained either pRevTRE-UCP1 or pRevTRE-null in addition to pRevTet-Off.
Cell culture and differentiation - The double-stable integrated preadipocytes were plated onto
24-well plates and expanded in preadipocyte growth medium consisting of DMEM (high-glucose,
4.5 g/L) supplemented with CS (10 % v/v), penicillin (200 U/ml), and streptomycin (200 μg/ml).
During this period, medium was replenished every other day. On day 2 post-confluence, the cells
were induced to differentiate using an adipogenic cocktail (1 µg/ml insulin, 0.5 mM
isobutylmethylxanthine, IBMX, and 1 μM dexamethasone, DEX) added to a basal medium
(DMEM with 10 % FBS and penicillin/streptomycin). After 48 hrs, the first induction medium
was replaced with a second induction medium consisting of the basal adipocyte medium
supplemented with only insulin. After another 48 hrs, the second induction medium was replaced
with the basal adipocyte medium. Medium was replenished every other day through day 9 post-
induction. On day 10 post-induction, glucose and serum were withdrawn for 48 hrs from a
randomly selected subset of control and UCP1-expressing cultures. The remaining cultures were
fed the basal adipocyte medium with 1% bovine serum albumin. Following this starvation period,
6
by guest, on July 23, 2018w
ww
.jlr.orgD
ownloaded from
all cultures were re-fed the basal adipocyte medium. The cultures were maintained in this
medium for another 48 hrs, at which time the cultures were terminated.
Microscopy - At the indicated time points, cellular morphology was recorded using phase-
contrast microscopy (Nikon-US, Melville, NY). The images were analyzed using the SimplePCI
software package (Compix Inc., Cranberry Township, PA). Intracellular lipid droplets were
visualized by staining with Oil Red O as described previously (20).
Real-time RT PCR - Total RNA was isolated using the RNeasy Mini Kit from QIAGEN
(Valencia, CA). The amount of extracted RNA was quantified with the RiboGreen RNA assay
kit from Invitrogen (Carlsbad, CA). Reverse transcription was performed on a PTC-100
Programmable Thermal Controller (MJ Research, Waltham, MA) using the High-Capacity
cDNA Archive Kit (Applied Biosystems, Foster City, CA) with random primers. The UCP1,
UCP2, glycerol-3-phosphate dehydrogenase (EC 1.1.1.8, GPDH) mRNA and 18S rRNA levels
were determined using the TaqMan Gene Expression assay (Applied Biosystems, Foster City,
CA). UCP1 and UCP2 mRNA and 18S rRNA were detected and amplified using pre-designed
primers and probe sets (Assay on Demand, Applied Biosystems). For GPDH mRNA, the
following customized primers and probe were used: 5’-GGTGGACACAGTGGAGATCTG-3’
forward primer, 5’-AGCCAAGCCCATCACAGAAG-3’ reverse primer, and 5’-
CCACTATATTCTTCAAGGCCC-3’ probe. All gene expression data were normalized to the
18S rRNA contents in corresponding samples (21).
7
by guest, on July 23, 2018w
ww
.jlr.orgD
ownloaded from
Western blot – De novo differentiated adipocytes grown in T25 flasks were trypsinized at day 10
post-induction and collected by centrifugation at 800 g for 10 min at room temperature.
Mitochondria was extracted using the Pierce (Rockford, IL) mitochondrial extraction kit.
Adipocytes were lysed and differentially centrifuged to separate the nucleus, cytosol and
mitochondrial fractions according to the manufacturer's protocols. Thirty micrograms of
mitochondrial proteins were separated on 12% SDS-PAGE and transferred onto nitrocellulose
membranes using standard protocols. A goat anti-UCP1 antibody (1:250 dilution) was used as
the primary antibody along with a donkey anti-goat secondary antibody (1:5000 dilution). Both
antibodies were purchased from Santacruz Biotechnology (Santa Cruz, CA). The blot was
developed using the Supersignal Femto West reagent (Pierce, IL) and captured on a Versadoc
imager (Bio-Rad).
GPDH enzyme activity and leptin - GPDH activities were measured in situ based on the method
of Sottile and Seuwen (22) by monitoring the rate of change of NADH UV absorbance at 340 nm
in a microplate reader (VERSAmax, Molecular Devices). Activities were normalized with
respect to the total protein content (BCA Protein Assay, Pierce) of the corresponding cell
samples. Spent medium samples were analyzed for leptin by Enzyme-Linked Immunosorbent
Assay (ELISA) (DuoSet ELISA Development System, R&D Systems, Minneapolis, MN).
Mitochondrial membrane potential measurement and MitoTracker Green staining - The
polarization of the mitochondrial membrane in the control and UCP-1 expressing cells were
determined using trimethylrhodamine (TMRM, Invitrogen). Cells were incubated with 0.5 μM
TMRM for 15 min at 37°C and then rinsed once with pre-warmed Hank’s balanced salt solution
8
by guest, on July 23, 2018w
ww
.jlr.orgD
ownloaded from
(HBSS). After removing the HBSS, the culture plates were then immediately placed in a
temperature controlled fluorescence plate reader (Molecular Devices Gemini EX, Sunnyvale,
CA). TMRM fluorescence was measured at 544/590 nm excitation/emission wavelengths. The
membrane potential measurements were performed at various times during the glucose
withdrawal-addition experiment as indicated in the Results section. The fluorescence reading for
each well was normalized by the total DNA content of each well. On day 10-post induction, cells
were incubated with 200 nM MitoTracker Green FM (Invitrogen) added to the culture medium.
After a 60-min incubation at 37 °C, the cells were washed once with 1x PBS. Fluorescence was
measured immediately after the wash at 490/516 nm excitation/emission.
Metabolite assays - Metabolite measurements were performed both on cell lysates and spent
medium samples. Cells were lysed in situ with an SDS buffer solution. TG levels were measured
using a commercially available assay (Sigma) that is based on the release of glycerol from TG by
lipoprotein lipase. Cellular ATP was measured using a luminescence assay kit (Promega,
Madison, WI) that is based on the ATP-dependent activity of luciferase. Spent medium samples
were collected during the cell culture at various times as indicated in the Results section.
Immediately after collection, medium samples were briefly centrifuged to remove any cell
debris. Glucose and lactate concentrations were measured using enzymatic assays based on the
methods of Trinder (23) and Loomis (24), respectively. Free glycerol (unbound to TG) was
measured by substituting water for the LPL in the assay reagent mixture. All metabolite data
were normalized by the corresponding sample DNA content, which was measured using either
9
by guest, on July 23, 2018w
ww
.jlr.orgD
ownloaded from

the Hoechst or PicoGreen (Invitrogen) dye. The PicoGreen dye method was applied to samples
used for the ATP measurements, because the Hoechst dye interfered with the luminescence assay.
Oxygen uptake – Rates of oxygen consumption were determined using a commercially available
biosensor (BD Biosciences) based on the oxygen-sensitive quenching of ruthenium fluorescence.
At the time of measurement (day 10 post-induction), differentiated pRev control or UCP1 cells
were transferred to 96-well plates with a gas permeable and hydrophobic matrix embedding the
fluorescent compound attached to the bottom. Fluorescence readings were taken in a temperature
controlled plate reader (Gemini EX, Molecular Devices) at 10-min intervals for 720 min at
excitation and emission wavelengths of 485 and 630 nm. Prior to the cell transfer, each plate was
pre-read to determine the baseline fluorescence. Positive controls were established by treating
the pRev control adipocytes with 10 or 100 nM FCCP. Sample readings were “double-
normalized” first by dividing by the blank plate and then medium control well readings as
suggested by Guarino et al. (25). The normalized sample readings were converted into oxygen
consumption rates per manufacturer’s instructions and normalized by the corresponding DNA
content.
Glucose uptake and fatty acid oxidation – Rates of glucose transport and β-oxidation were
estimated using radioisotope labeled tracers. The glucose assay was based on the method of
Collins et al. (26) with modifications. Briefly, differentiated pRev or UCP1 expressing cells in
24-well plates were incubated in a serum-free medium without glucose for 1.5 hrs. The cells
were washed three times and then incubated in KRB-HEPES buffer with or without 1 μg/ml
insulin. After 15 min, 0.1 μCi of [1-14C]2-deoxy-D-glucose was added per well. After a labeling
10
by guest, on July 23, 2018w
ww
.jlr.orgD
ownloaded from

period of 15 min at 37°C, cells were washed three times with PBS and lysed with an SDS buffer
solution. The cell lysates were added to scintillation vials with 10 ml scintillation fluid (Ultima
Gold, PerkimElmer). Radioactivity was measured using a liquid scintillation counter (Tri-Carb
1500, Packard Instruments). For the fatty acid assay, a CO2 evolution-capture system was
assembled as described by (27) with modifications. Adipocytes in 24-well plates were pre-
labeled with 0.5 μCi/well of [U-14C]palmitic acid in 2 % FFA-free BSA-KRH buffer. After 30
min, the cells were washed three times and then incubated in the BSA-KRH buffer. The culture
plate was then quickly sealed with a rubber gasket. A 24-well filter plate (Unifilter, Perkin
Elmer) was inverted and placed on top of the sealed culture plate such that each well of the filter
plate was centered over a hole (5 mm diameter) in the gasket and aligned with a well of the
bottom culture plate. Each top well contained a filter paper pre-soaked with the CO2 trap solution
(β-phenethylamine). The entire assembly was sealed with foam tape. A weight was placed on top
to further reduce the potential for leakage. After 2 hrs at 37 °C, 200 μL of 10 N H2SO4 was
added to each well. After an overnight incubation (12 hrs) at room temperature, the filters were
excised from the top plate and placed in scintillation vials. The vials were completely filled with
scintillation fluid and counted for radioactivity.
Statistics - The number of repeats with different population of cells was at least three for all
experiments. The number of technical replicates per experiment is indicated in the figure
legends. Comparisons between two experimental groups were performed using ANOVA. Group
means were deemed to be statistically significantly different when p < 0.05.
RESULTS
11
by guest, on July 23, 2018w
ww
.jlr.orgD
ownloaded from

Effect of forced UCP1 expression on adipocyte differentiation. To study the direct effects of the
brown adipocyte protein UCP1 on white adipocyte metabolism, we stably integrated the ucp1
gene into 3T3-L1 preadipocytes, which were then subsequently induced to differentiate using a
standard adipogenic cocktail (28). These modified cells expressed significantly more ucp1
mRNA (Figure 1A) than the control cells that had a blank plasmid (pRevTRE-null) stably
integrated by electroporation. The expression of UCP1 protein in the mitochondria was also
confirmed by Western blot analysis (Figure 1B). As expected, UCP1 was not detected in the
control cells. The forced expression of UCP1 did not significantly alter the mRNA level (Figure
1A) or enzyme activity (Figure 1C) of cytosolic GPDH, an adipocyte differentiation marker
whose expression is induced by the activation of adipocyte-enriched transcription factors, such
as PPAR-γ (peroxisome proliferators-activated receptor γ) (29). UCP1 expression also had no
significant effect on the expression of ucp2 mRNA (Figure 1A), which is the dominant
uncoupling protein in WAT (30). Analysis of the spent adipocyte culture medium for the
adipocyte-specific hormone leptin (31) showed no significant differences between UCP1-
expressing and control cells (Figure 1D). The expression level and activity of GPDH increased
significantly (p < 0.05) with terminal differentiation of either the control or UCP1-expressing
preadipocytes. Taken together, these results suggested that the UCP1 forced expression did not
result in an obvious impairment of differentiation.
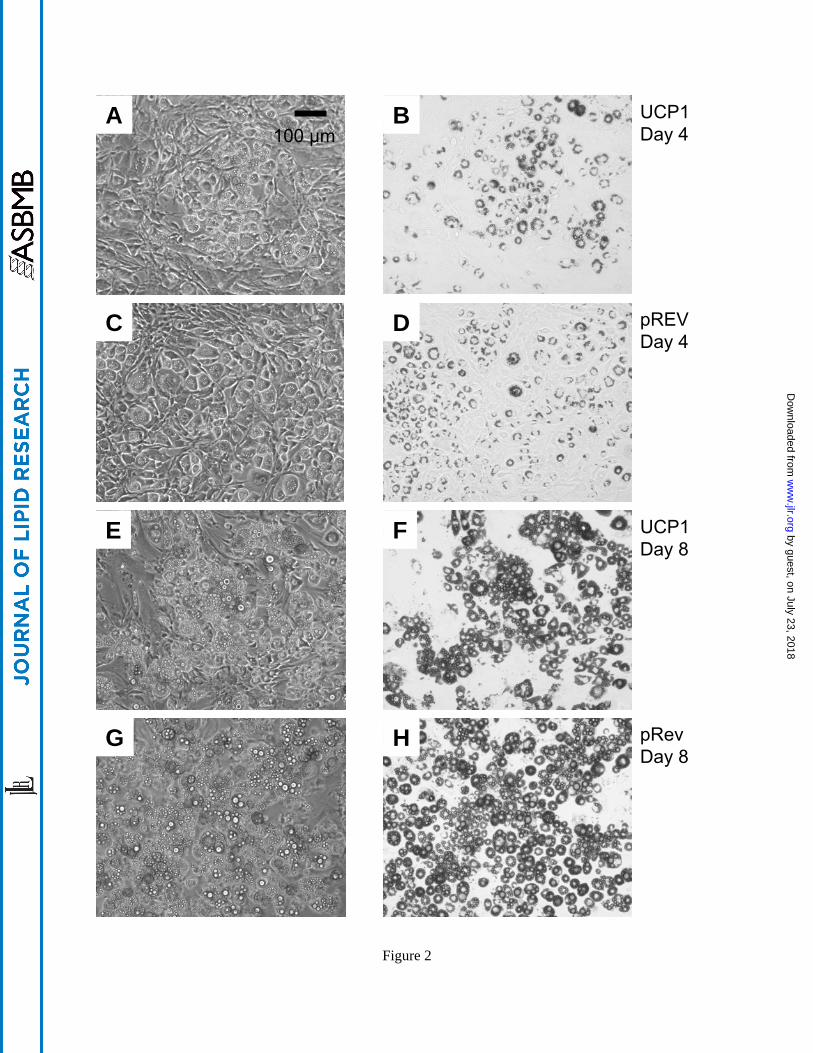
Reduced adipocyte lipid storage. Morphological assessment by microscopy showed gross
differences between the UCP1-expressing (Figures 2A, B, E, and F) and control cells (Figures
2C, D, G, and H). Consistent with the established phenotype of 3T3-L1 cells (28), the control
cells exhibited round shapes and contained visible lipid droplets by day 4 following induction
12
by guest, on July 23, 2018w
ww
.jlr.orgD
ownloaded from
with the insulin/DEX/IBMX cocktail. While the UCP1 cells were also round, Oil-Red O stained
images (Figures 2F and H) showed that by day 8 post-induction, a noticeably smaller fraction of
the culture contained visible lipid droplets. To quantify the reduction in lipid accumulation, the
TG contents of UCP1 and control cells were measured using an enzymatic assay. On day 10
post-induction, cells were subjected to a 2-day treatment with glucose-free medium, after which
they were re-fed the basal adipocyte medium with 4.5 g/L of glucose. As shown in Figure 3, the
UCP1 cells contained significantly less TG (p < 0.05) than the control cells throughout the
duration of the experiment. The TG content (expressed as g-glycerol/g-DNA) of both cultures
declined during the glucose deprivation period, from 1.57 ± 0.24 and 0.91 ± 0.11 at 24 hrs to
1.30 ± 0.24 and 0.86 ± 0.32 at 48 hrs for the control and UCP1 cells, respectively. Re-feeding the
cells with the high-glucose medium increased the TG content of the control and UCP1 cells to
1.84 ± 0.30 and 1.29 ± 0.23 at 72 hrs, respectively. These amounts were significantly larger (p <
0.05) than the corresponding 48-hr values, and remained approximately stable during the
subsequent 24 hrs.
Reduced oxidative phosphorylation. To explore the biochemical basis for the decrease in TG
upon UCP1 expression, we performed a series of metabolic comparisons between the control and
UCP1 adipocytes. We first tested for the native activity of the uncoupling protein by assessing
the mitochondrial membrane potential (MMP) and cellular ATP content. In brown adipocytes,
UCP1 facilitates proton conductance across the inner mitochondrial membrane and thereby
favors energy dissipation as heat. The MMP and ATP levels were monitored over the course of a
2-day glucose deprivation/2-day re-feeding period to also assess the potential contribution of
non-mitochondrial pathways, particularly glycolysis, to cellular ATP content. Comparing UCP1
13
by guest, on July 23, 2018w
ww
.jlr.orgD
ownloaded from
adipocytes to control cells, no significant differences in TMRM fluorescence were observed at
any point during the course of the experiment (Figure 4A). The ATP content (expressed as
mmol/g-DNA) of both the control and UCP1 cells decreased during the starvation period and
leveled off after the medium glucose was re-introduced (Figure 4B). However, the decrease in
ATP was significantly greater for the UCP1 cells, reaching 45 % of the initial (start of glucose-
withdrawal) value by 60 hrs, compared to almost 60 % for the control cells. These data indicated
that the ability of UCP1-expressing cells to maintain ATP levels similar to the control cells
depended more on glucose availability.
When glucose, and hence glycolysis is no longer available, the most likely source of ATP
is the TCA cycle with fatty acid derived acetyl-CoA as input. The larger reduction in ATP for the
UCP1 cells during the glucose withdrawal suggested that oxidative phophorylation via the TCA
cycle was less efficient and/or active compared to the control cells. To compare TCA-cycle
driven substrate oxidation in the UCP1 and control adipocytes, we determined their relative rates
of oxygen consumption using a fluorescence-based sensor-culture plate. Plots of oxygen uptake
rate (OUR) vs. time (Figure 5A) showed similar rates for the UCP1-expressing and control cells.
As expected, short-term treatment with the chemical uncoupler FCCP increased oxygen
consumption in a dose-dependent manner. A comparison of mitochondrial content using a
fluorescent stain showed no significant difference between UCP1-expressing and control
adipocytes (Figure 5B).
Metabolic profile. To further investigate the increased dependence on anaerobic pathways for
ATP maintenance by the UCP1-expressing cells, we measured glucose uptake, lactate output,
glycerol output, and fatty acid oxidation. Statistically significant differences were observed for
14
by guest, on July 23, 2018w
ww
.jlr.orgD
ownloaded from
glucose, lactate, and glycerol measurements before, during, and after the glucose deprivation.
Prior to the starvation period, the UCP1 cells consumed glucose at a significantly higher rate (in
g-glucose/g-DNA-hr) of 0.60 ± 0.18 compared to 0.25 ± 0.17 for the control cells (Figure 6A,
insert). Upon re-exposure to the basal culture medium, the net uptake rates of glucose sharply
increased for both the UCP1 and control cells, peaking at 7.17 ± 1.11 and 5.86 ± 1.02,
respectively, at 6 hrs following the re-feeding. The glucose uptake rates steadily declined
thereafter, but remained 3 ~ 7-fold higher than the pre-starvation levels by day 2 of the re-
feeding. Radioisotope-labeled tracer experiments with [1-14C]2-deoxy-D-glucose showed that
the increase in medium glucose consumption was not due to differences in glucose transporter
activity. Neither basal nor insulin-stimulated uptake of the non-metabolized glucose analog was
statistically significantly different between the UCP1-expressing and control cells (Figure 6B).
The fold-increase in glucose uptake upon insulin stimulation was ca. 2, consistent with data
reported by others (32). The trends for lactate output were similar to the glucose uptake trends,
increasing sharply upon re-feeding, with a significantly larger, 1.4-fold increase by the UCP1
cells over the control cells by 72 hrs (Figure 6C).
As TG accumulation results from a net difference in synthesis and breakdown, we also
examined indicators for FFA release and oxidation. The rates of glycerol release into the medium
were measured to determine whether the UCP1 cells have a higher rate of lipolysis than the
control cells, as adipocytes normally cannot recycle the free glycerol derived from TG
breakdown. The glycerol output rates of the UCP1 cells remained significantly lower than those
of the control cells throughout the course of these experiment (Figure 6D), approximately
proportional to their respective TG contents (Figure 3), indicating that the higher glucose
utilization by the UCP1 cells was not correlated with a higher turnover between TG and FFAs.
15
by guest, on July 23, 2018w
ww
.jlr.orgD
ownloaded from
Finally, we compared the relative rates of β-oxidation to determine whether the reduction in TG
accumulation could be explained by increased intracellular breakdown of FFAs. Radioisotope-
labeled tracer experiments with [U-14C]palmitate showed no significant difference between the
relative rates of fatty acid oxidation, suggesting that enhanced lipolysis was unlikely to account
for the observed difference in TG accumulation (Figure 6E).
DISCUSSION
In this work, we have succeeded in forcibly expressing UCP1 in an established in vitro
model for adipogenesis. Following differentiation by a standard chemical cocktail, the UCP1-
expressing cells accumulated significantly less TG than null-plasmid containing control cells,
while no significant differences were observed for the following adipocyte differentiation
markers: leptin secretion, GPDH gene expression and GPDH enzyme activity. To explore the
metabolic basis for the reduced TG accumulation, we have characterized the response of the
UCP1 cells to a simple nutritional stress, i.e. starvation. The metabolic profiles determined in this
study suggested that attenuation in TG loading may result from an increased demand for carbon
flux through glycolysis, as opposed to an up-regulation of TG breakdown and fatty acid
oxidation. When glucose was withdrawn, stored TG was consumed as fuel in both the UCP1-
expressing and control cells, as indicated by the significant reduction in their intracellular TG
contents (Figure 3). During the period without medium glucose, lipogenesis should be minimal,
and the products of lipolysis and β-oxidation are likely oxidized through the TCA cycle. Thus,
starvation increases the dependence of cellular ATP maintenance on oxidative phosphorylation,
whose lowered efficiency should lead to a larger decrease in ATP content in UCP1-expressing
cells, consistent with our findings (Figure 4B). When provided with medium glucose, the UCP1-
16
by guest, on July 23, 2018w
ww
.jlr.orgD
ownloaded from
expressing cells maintained similar ATP levels as the control cells, while consuming more
glucose for glycolysis, again pointing to a down-regulation of mitochondrial ATP production.
Based on these results, one potential explanation for the reduction in TG synthesis
involves an inhibition of the ATP-dependent pyruvate carboxylase, which would decrease the
mitochondrial pool of oxaloacetate and citrate and thereby suppress the activity of the malate
cycle, which in adipocytes supplies a quantitatively significant fraction of the NADPH needed
for de novo fatty acid synthesis (33, 34). Another possibility is that the lowered phosphorylation
efficiency drains carbon flux away from storage (lipogenesis) towards the fueling pathways
(glycolysis and TCA cycle). These hypotheses warrant further investigation in future studies
involving the quantification of metabolic fluxes in intact cells, for example, using isotopic
tracers.
The expression of UCP1 in WAT has been the subject of a number of both in vivo (16,
35-39) and in vitro (17, 19) studies. Many of these studies have used various upstream factors for
the gene expression and thus cannot be directly compared to this work. The most similar model
system involved the expression of the ucp1 gene from the ap2 promoter in transgenic mice,
which resulted in a targeted increase of UCP1 in WAT (16). In white adipocytes isolated from
the ap2-ucp1 mice, noradrenaline-stimulated lipolysis was impaired (40), and the attenuation in
lipid accumulation was mainly due to a decrease in FA synthesis (34), which agrees with the
findings of this study. On the other hand, the OUR of an incubation of epididymal fat of ap2-
ucp1 transgenic mice showed a significant increase compared to controls (41). An increase in
oxygen uptake has also been reported for direct, forced expression of UCP1 in HeLa cells (42).
In this work, we found that the OUR was not significantly affected by the forced, constitutive
expression of UCP1. A likely reason for this apparent discrepancy is that the aforementioned
17
by guest, on July 23, 2018w
ww
.jlr.orgD
ownloaded from

studies used different experimental parameters. Oxygen uptake data on ap2-ucp1 adipocytes
were obtained using fat tissue fragments freshly isolated from 9-mo-old mice. In addition to the
confounding influences of in vivo development and tissue heterogeneity, the fat fragments had
been conditioned in plasma containing glucose as well as other nutrients, including FFAs,
whereas the cultured adipocytes used in this study relied solely on medium glucose as nutrient
fuel. Thus, the ap2-ucp1 adipocytes could have contained a larger pool of FFAs available for β-
oxidation, allowing full compensation for the respiratory uncoupling through an increased supply
of acetyl-CoA units. Measurements of oxygen uptake by UCP1-expressing HeLa cells were
performed 6 hrs after induction of gene expression, whereas this study was carried out with a
stable cell line that constitutively expressed UCP1 after several weeks of selection and culture.
Sufficient time had passed for the engineered adipocytes to undergo long-term metabolic
adaptations, for example by adjusting the activities of glycolytic enzymes. A number of different
cell types have been shown to respond to persistent respiratory uncoupling by first up-regulating
glucose consumption and anaerobic ATP synthesis, and then down-regulating oxidative
phosphorylation. For example, treatment with rotenone (43), cyanide (44), DNP (33, 34, 45), and
hypoxia (46) resulted in an up-regulation of glucose uptake. In tumor cells, a prolonged
treatment with FCCP also brought about an inhibition of mitochondrial respiration (47).
Finally, the TMRM measurements of this study did not point to significant differences in
the mitochondrial membrane potential (MMP) of the UCP1-expressing and control cells,
although a putative direct function of UCP1 is to facilitate the influx of protons across the inner
mitochondrial membrane. Assuming that UCP1 functions similarly in 3T3-L1 adipocytes as it
does in brown adipocytes, it should decrease the MMP, at least in the short term. A decrease in
MMP should lower ATP synthesis and/or caused the reversal of the ATP synthase (48-50), both
18
by guest, on July 23, 2018w
ww
.jlr.orgD
ownloaded from
of which would impair the mitochondrial ATP generation. A reversal of the synthase activity
would lead to ATP hydrolysis and transport of protons out of the inner mitochondria. This proton
efflux, which contributes to the membrane gradient at the expense of ATP, could explain the
apparent lack of difference between the MMP of UCP1-expressing and control cells (Fig 4A).
Brown adipocytes can compensate for the decrease in MMP by up-regulating β-oxidation and the
TCA cycle to generate extra NADH and FADH2 for electron transport and oxidative
phosphorylation. This was likely not the case here, as the OUR data (Fig 5A) did not support an
increase in aerobic metabolism of the UCP1-expressing 3T3 -L1 adipocytes. One explanation is
that mature adipocytes have only a limited capacity to oxidize their fat stores (51). Instead, the
UCP1-expressing white adipocytes may instead up-regulate glycolysis to supplement ATP
production. This type of compensation may be especially effective when an abundance of
medium glucose allows a trade-off between the ATP yield (higher for oxidative phosphorylation)
in favor of the production rate (higher if both aerobic and anaerobic pathways are used) (52).
Several earlier studies on the impairment of mitochondrial metabolism have also noted that
glycolytic ATP generation is critical to cell survival (53-55).
Long-term, the lower ATP yield incurred through an increased utilization of glycolysis
may eventually prevent the UCP1-expressing white adipocytes from completely compensating
for the reduced mitochondrial supply of ATP. This could force the UCP1 cells to adapt by down-
regulating of ATP-utilizing pathways. Brand and co-workers (56) have suggested that there
exists a hierarchy of responses by the different energy-consuming reactions to changes in energy
supply, where the pathways of macromolecular biosynthesis are the most sensitive to limited
ATP supply Our own observations suggested that the UCP1-expressing preadipocytes grew more
slowly than the control cells (unpublished data)
19
by guest, on July 23, 2018w
ww
.jlr.orgD
ownloaded from

In summary, the findings in this study suggest that the major direct effect of UCP1 on
white adipocyte metabolism is to reduce TG accumulation through a down-regulation of several
energy and carbon flux requiring processes. We hypothesize that the chronic over-expression
expression of UCP1 brought about an increase in the relative contribution of glycolysis to total
ATP production. The findings in this study provide further evidence that the specific induction of
a single adipocyte protein, UCP1, could provide a potential approach for controlling adipose
tissue fat accumulation. Prospectively, this approach may offer clinically useful features, as
simultaneous reduction in body adiposity and blood glucose are desired outcomes of therapies
for obesity-related diabetes.
ACKNOWLEDGEMENTS
The authors gratefully acknowledge Dr. Joseph Platko for his assistance with electroporation,
Andrew Wood for his help with the Oil Red O stains, and Diah Bramono for her technical
support of the real-time RT-PCR equipment. The authors thank Dr. Gregory Stephanopoulos and
Keith Tyo for the use of facilities in performing the radioactive tracer experiments. This work
was supported by grants from the NIH (1 R21 DK67228-01) and the Tufts University Faculty
Research Fund to KL, and the Texas Engineering Experiment Station to AJ.
20
by guest, on July 23, 2018w
ww
.jlr.orgD
ownloaded from
REFERENCES
1. Wickelgren, I. 1998. Obesity: how big a problem? Science 280: 1364-1367. 2. Scheen, A. J. 2000. From obesity to diabetes: why, when and who? Acta Clin Belg 55: 9-15. 3. Saltiel, A. R. 2001. New Perspectives into the Molecular Pathogenesis and Treatment of Type 2 Diabetes. Cell 104: 517. 4. Colditz, G. A., W. C. Willett, M. J. Stampfer, J. E. Manson, C. H. Hennekens, R. A. Arky, and F. E. Speizer. 1990. Weight as a risk factor for clinical diabetes in women. Am J Epidemiol 132: 501-513. 5. Kissebah, A. H., and G. R. Krakower. 1994. Regional adiposity and morbidity. Physiol Rev 74: 761-811. 6. Steppan, C. M., S. T. Bailey, S. Bhat, E. J. Brown, R. R. Banerjee, C. M. Wright, H. R. Patel, R. S. Ahima, and M. A. Lazar. 2001. The hormone resistin links obesity to diabetes. Nature 409: 307-312. 7. Yamauchi, T., J. Kamon, H. Waki, Y. Terauchi, N. Kubota, K. Hara, Y. Mori, T. Ide, K. Murakami, N. Tsuboyama-Kasaoka, O. Ezaki, Y. Akanuma, O. Gavrilova, C. Vinson, M. L. Reitman, H. Kagechika, K. Shudo, M. Yoda, Y. Nakano, K. Tobe, R. Nagai, S. Kimura, M. Tomita, P. Froguel, and T. Kadowaki. 2001. The fat-derived hormone adiponectin reverses insulin resistance associated with both lipoatrophy and obesity. Nat Med 7: 941-946. 8. Hotamisligil, G. S., N. S. Shargill, and B. M. Spiegelman. 1993. Adipose expression of tumor necrosis factor-alpha: direct role in obesity-linked insulin resistance. Science 259: 87-91. 9. Pickup, J. C., M. B. Mattock, G. D. Chusney, and D. Burt. 1997. NIDDM as a disease of the innate immune system: association of acute-phase reactants and interleukin-6 with metabolic syndrome X. Diabetologia 40: 1286-1292. 10. Boden, G. 1997. Role of fatty acids in the pathogenesis of insulin resistance and NIDDM. Diabetes 46: 3-10. 11. Charles, M. A., E. Eschwege, N. Thibult, J. R. Claude, J. M. Warnet, G. E. Rosselin, J. Girard, and B. Balkau. 1997. The role of non-esterified fatty acids in the deterioration of glucose tolerance in Caucasian subjects: results of the Paris Prospective Study. Diabetologia 40: 1101-1106. 12. Paolisso, G., P. A. Tataranni, J. E. Foley, C. Bogardus, B. V. Howard, and E. Ravussin. 1995. A high concentration of fasting plasma non-esterified fatty acids is a risk factor for the development of NIDDM. Diabetologia 38: 1213-1217. 13. Yin, W., D. Liao, Z. Wang, S. Xi, K. Tsutsumi, T. Koike, J. Fan, G. Yi, Q. Zhang, Z. Yuan, and K. Tang. 2004. NO-1886 inhibits size of adipocytes, suppresses plasma levels of tumor necrosis factor-[alpha] and free fatty acids, improves glucose metabolism in high-fat/high-sucrose-fed miniature pigs. Pharmacological Research 49: 199. 14. Bergman, R. N., and S. D. Mittelman. 1998. Central role of the adipocyte in insulin resistance. J Basic Clin Physiol Pharmacol 9: 205-221. 15. Nicholls, D. G., and R. M. Locke. 1984. Thermogenic mechanisms in brown fat. Physiol Rev 64: 1-64. 16. Kopecky, J., G. Clarke, S. Enerback, B. Spiegelman, and L. P. Kozak. 1995. Expression of the mitochondrial uncoupling protein gene from the aP2 gene promoter prevents genetic obesity. J Clin Invest 96: 2914-2923.
21
by guest, on July 23, 2018w
ww
.jlr.orgD
ownloaded from
17. Orci, L., W. S. Cook, M. Ravazzola, M. Y. Wang, B. H. Park, R. Montesano, and R. H. Unger. 2004. Rapid transformation of white adipocytes into fat-oxidizing machines. Proc.Natl.Acad.Sci.U.S.A 101: 2058. 18. Tiraby, C., G. Tavernier, C. Lefort, D. Larrouy, F. Bouillaud, D. Ricquier, and D. Langin. 2003. Acquirement of brown fat cell features by human white adipocytes. J Biol Chem. 278: 33370. 19. Christian, M., E. Kiskinis, D. Debevec, G. Leonardsson, R. White, and M. G. Parker. 2005. RIP140-targeted repression of gene expression in adipocytes. Mol Cell Biol 25: 9383-9391. 20. Hauner, H., T. Skurk, and M. Wabitsch. 2001. Cultures of human adipose precursor cells. In Adipose tissue protocols. G. Ailhaud, editor. Humana Press, Totowa, N.J. xiii, 334 p. 21. Schmittgen, T. D., and B. A. Zakrajsek. 2000. Effect of experimental treatment on housekeeping gene expression: validation by real-time, quantitative RT-PCR. J Biochem Biophys Methods 46: 69-81. 22. Sottile, V., and K. Seuwen. 2001. A high-capacity screen for adipogenic differentiation. Anal Biochem 293: 124-128. 23. Trinder, P. 1969. Determination of blood glucose using an oxidase-peroxidase system with a non-carcinogenic chromogen. J Clin Pathol 22: 158-161. 24. Loomis, M. E. 1961. An enzymatic fluorometric method for the determination of lactic acid in serum. J Lab Clin Med 57: 966. 25. Guarino, R. D., L. E. Dike, T. A. Haq, J. A. Rowley, J. B. Pitner, and M. R. Timmins. 2004. Method for determining oxygen consumption rates of static cultures from microplate measurements of pericellular dissolved oxygen concentration. Biotechnol Bioeng 86: 775-787. 26. Yu, Y. H., and H. Zhu. 2004. Chronological changes in metabolism and functions of cultured adipocytes: a hypothesis for cell aging in mature adipocytes. Am J Physiol Endocrinol Metab 286: E402-410. 27. Collins, C. L., B. P. Bode, W. W. Souba, and S. F. Abcouwer. 1998. Multiwell 14CO2-capture assay for evaluation of substrate oxidation rates of cells in culture. Biotechniques 24: 803-808. 28. Green, H., and O. Kehinde. 1975. An established preadipose cell line and its differentiation in culture. II. Factors affecting the adipose conversion. Cell 5: 19-27. 29. Patsouris, D., S. Mandard, P. J. Voshol, P. Escher, N. S. Tan, L. M. Havekes, W. Koenig, W. Marz, S. Tafuri, W. Wahli, M. Muller, and S. Kersten. 2004. PPAR{alpha} governs glycerol metabolism. J. Clin. Invest. 114: 94-103. 30. Ricquier, D., and F. Bouillaud. 2000. The uncoupling protein homologues: UCP1, UCP2, UCP3, StUCP and AtUCP. Biochem J 345 Pt 2: 161-179. 31. Rentsch, J., and M. Chiesi. 1996. Regulation of ob gene mRNA levels in cultured adipocytes. FEBS Letters 379: 55. 32. Lin, Y., A. H. Berg, P. Iyengar, T. K. Lam, A. Giacca, T. P. Combs, M. W. Rajala, X. Du, B. Rollman, W. Li, M. Hawkins, N. Barzilai, C. J. Rhodes, I. G. Fantus, M. Brownlee, and P. E. Scherer. 2005. The hyperglycemia-induced inflammatory response in adipocytes: the role of reactive oxygen species. J Biol Chem 280: 4617-4626. 33. Rognstad, R., and J. Katz. 1969. The effect of 2,4-dinitrophenol on adipose-tissue metabolism. Biochem J 111: 431.
22
by guest, on July 23, 2018w
ww
.jlr.orgD
ownloaded from
34. Rossmeisl, M., I. Syrovy, F. Baumruk, P. Flachs, P. Janovska, and J. Kopecky. 2000. Decreased fatty acid synthesis due to mitochondrial uncoupling in adipose tissue. Faseb J 14: 1793-1800. 35. Cabrero, A., G. Llaverias, N. Roglans, M. Alegret, R. Sanchez, T. Adzet, J. C. Laguna, and M. Vazquez. 1999. Uncoupling protein-3 mRNA levels are increased in white adipose tissue and skeletal muscle of bezafibrate-treated rats. Biochem Biophys Res Commun 260: 547-556. 36. Emilsson, V., J. O'Dowd, S. Wang, Y. L. Liu, M. Sennitt, R. Heyman, and M. A. Cawthorne. 2000. The effects of rexinoids and rosiglitazone on body weight and uncoupling protein isoform expression in the Zucker fa/fa rat. Metabolism 49: 1610-1615. 37. Fukui, Y., S. Masui, S. Osada, K. Umesono, and K. Motojima. 2000. A new thiazolidinedione, NC-2100, which is a weak PPAR-gamma activator, exhibits potent antidiabetic effects and induces uncoupling protein 1 in white adipose tissue of KKAy obese mice. Diabetes 49: 759-767. 38. Matsuda, J., K. Hosoda, H. Itoh, C. Son, K. Doi, I. Hanaoka, G. Inoue, H. Nishimura, Y. Yoshimasa, Y. Yamori, H. Odaka, and K. Nakao. 1998. Increased adipose expression of the uncoupling protein-3 gene by thiazolidinediones in Wistar fatty rats and in cultured adipocytes. Diabetes 47: 1809-1814. 39. Wilson-Fritch, L., S. Nicoloro, M. Chouinard, M. A. Lazar, P. C. Chui, J. Leszyk, J. Straubhaar, M. P. Czech, and S. Corvera. 2004. Mitochondrial remodeling in adipose tissue associated with obesity and treatment with rosiglitazone. J Clin Invest 114: 1281-1289. 40. Flachs, P., J. Novotny, F. Baumruk, K. Bardova, L. Bourova, I. Miksik, J. Sponarova, P. Svoboda, and J. Kopecky. 2002. Impaired noradrenaline-induced lipolysis in white fat of aP2-Ucp1 transgenic mice is associated with changes in G-protein levels. Biochem J 364: 369-376. 41. Kopecky, J., M. Rossmeisl, Z. Hodny, I. Syrovy, M. Horakova, and P. Kolarova. 1996. Reduction of dietary obesity in aP2-Ucp transgenic mice: mechanism and adipose tissue morphology. Am J Physiol 270: E776-786. 42. Li, B., J. O. Holloszy, and C. F. Semenkovich. 1999. Respiratory uncoupling induces delta-aminolevulinate synthase expression through a nuclear respiratory factor-1-dependent mechanism in HeLa cells. J Biol Chem 274: 17534-17540. 43. Bashan, N., E. Burdett, A. Guma, R. Sargeant, L. Tumiati, Z. Liu, and A. Klip. 1993. Mechanisms of adaptation of glucose transporters to changes in the oxidative chain of muscle and fat cells. Am J Physiol 264: C430-440. 44. Mercado, C. L., J. N. Loeb, and F. Ismail-Beigi. 1989. Enhanced glucose transport in response to inhibition of respiration in Clone 9 cells. Am J Physiol 257: C19-28. 45. Kang, J., E. Heart, and C. K. Sung. 2001. Effects of cellular ATP depletion on glucose transport and insulin signaling in 3T3-L1 adipocytes. Am J Physiol Endocrinol Metab 280: E428-435. 46. Zhang, J. Z., A. Behrooz, and F. Ismail-Beigi. 1999. Regulation of glucose transport by hypoxia. Am J Kidney Dis 34: 189-202. 47. Gabai, V. L. 1993. Inhibition of uncoupled respiration in tumor cells. A possible role of mitochondrial Ca2+ efflux. FEBS Lett 329: 67-71. 48. Jennings, R. B., K. A. Reimer, and C. Steenbergen. 1991. Effect of inhibition of the mitochondrial ATPase on net myocardial ATP in total ischemia. J Mol Cell Cardiol 23: 1383-1395. 49. St-Pierre, J., M. D. Brand, and R. G. Boutilier. 2000. Mitochondria as ATP consumers: cellular treason in anoxia. Proc Natl Acad Sci U S A 97: 8670-8674.
23
by guest, on July 23, 2018w
ww
.jlr.orgD
ownloaded from

50. Vinogradov, A. D. 2000. Steady-state and pre-steady-state kinetics of the mitochondrial F(1)F(o) ATPase: is ATP synthase a reversible molecular machine? J Exp Biol 203: 41-49. 51. Wang, T., Y. Zang, W. Ling, B. E. Corkey, and W. Guo. 2003. Metabolic Partitioning of Endogenous Fatty Acid in Adipocytes. Obesity Research 11: 880. 52. Pfeiffer, T., S. Schuster, and S. Bonhoeffer. 2001. Cooperation and competition in the evolution of ATP-producing pathways. Science 292: 504-507. 53. Gajewski, C. D., L. Yang, E. A. Schon, and G. Manfredi. 2003. New insights into the bioenergetics of mitochondrial disorders using intracellular ATP reporters. Mol Biol Cell 14: 3628-3635. 54. Nieminen, A. L., A. K. Saylor, B. Herman, and J. J. Lemasters. 1994. ATP depletion rather than mitochondrial depolarization mediates hepatocyte killing after metabolic inhibition. Am J Physiol 267: C67-74. 55. Snyder, J. W., J. G. Pastorino, A. P. Thomas, J. B. Hoek, and J. L. Farber. 1993. ATP synthase activity is required for fructose to protect cultured hepatocytes from the toxicity of cyanide. Am J Physiol 264: C709-714. 56. Buttgereit, F., and M. D. Brand. 1995. A hierarchy of ATP-consuming processes in mammalian cells. Biochem J 312 (Pt 1): 163-167.
24
by guest, on July 23, 2018w
ww
.jlr.orgD
ownloaded from

FIGURE LEGENDS Fig. 1. A, Normalized, relative gene expression levels of UCP1 (n = 6), GPDH (n = 3) and UCP2
(n = 7). Values indicate fold-changes with respect to the pRev controls as determined from real-
time RT-PCR iteration counts for which the corresponding melt curves peaked above set
threshold. Normalization was performed with respect to 18S rRNA. PA, day 2 post-confluent
preadipocytes; Day8, day 8 post-induction. B, Chemiluminescence based Western blot detection
of UCP1. Only the portions corresponding to MW of ca. 36 kDa are shown. Lane 1,
mitochondrial fraction of null plasmid transfected control cells (pRev); lane 2, mitochondrial
fraction of UCP1 transfected cells C, Enzyme activity of GPDH determined in situ (n = 5). D,
Total leptin secreted per well between day 6 and 8 post-induction (n = 5). UCP1 and pRev refer
to cultures of cells transfected with the target gene and null plasmid, respectively. Data shown
are means ± SD with the indicated number of replicates.
Fig. 2. Phase contrast (A, C, E, and G) and Oil-Red O stained (B, D, F, and H) images of UCP1
and control (pRev) cells on day 4 and 8 post-induction. Times and cell types are as indicated in
the figure annotation. See also Fig. 1 caption.
Fig. 3. Effects of forced UCP1 expression on intracellular TG content (n = 12). The starvation
period was from time zero to 48 hrs. Data shown are means ± SD. See also Fig. 1 caption for
explanation of legend symbols. *, statistically significantly different from control (pRev) at p <
0.05. #, statistically significant different from the initial value (24 hrs) of each respective cell
type at p < 0.05.
25
by guest, on July 23, 2018w
ww
.jlr.orgD
ownloaded from
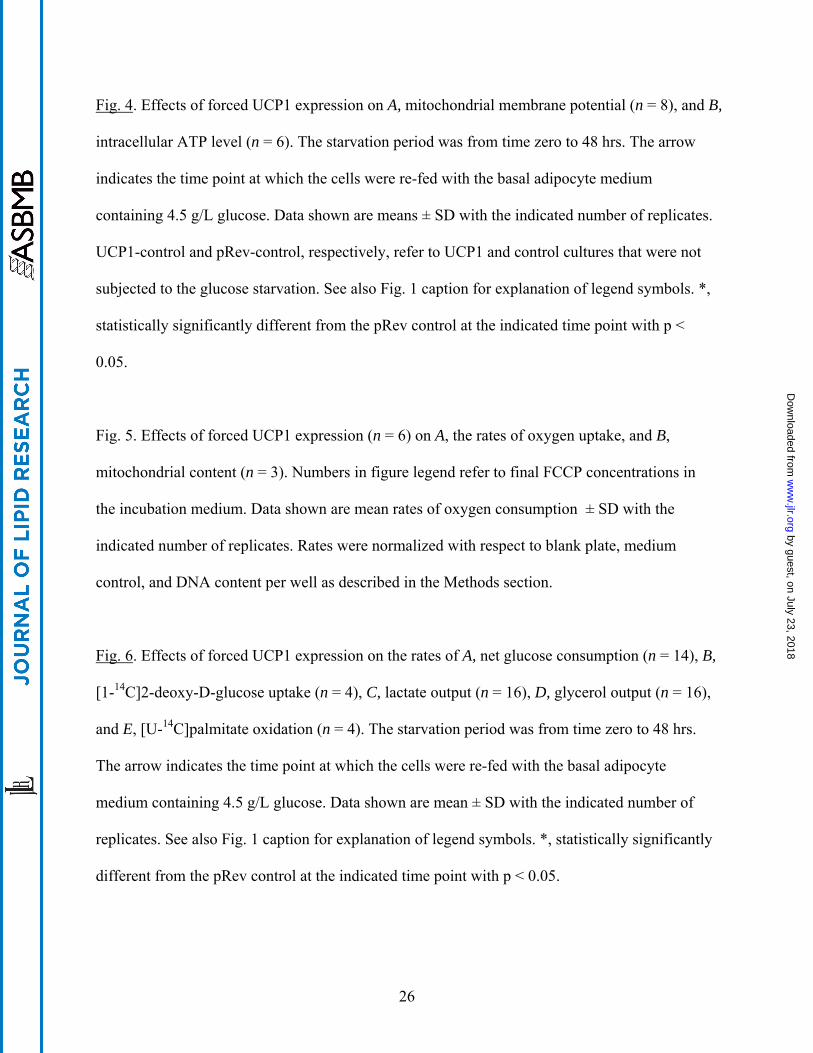
Fig. 4. Effects of forced UCP1 expression on A, mitochondrial membrane potential (n = 8), and B,
intracellular ATP level (n = 6). The starvation period was from time zero to 48 hrs. The arrow
indicates the time point at which the cells were re-fed with the basal adipocyte medium
containing 4.5 g/L glucose. Data shown are means ± SD with the indicated number of replicates.
UCP1-control and pRev-control, respectively, refer to UCP1 and control cultures that were not
subjected to the glucose starvation. See also Fig. 1 caption for explanation of legend symbols. *,
statistically significantly different from the pRev control at the indicated time point with p <
0.05.
Fig. 5. Effects of forced UCP1 expression (n = 6) on A, the rates of oxygen uptake, and B,
mitochondrial content (n = 3). Numbers in figure legend refer to final FCCP concentrations in
the incubation medium. Data shown are mean rates of oxygen consumption ± SD with the
indicated number of replicates. Rates were normalized with respect to blank plate, medium
control, and DNA content per well as described in the Methods section.
Fig. 6. Effects of forced UCP1 expression on the rates of A, net glucose consumption (n = 14), B,
[1-14C]2-deoxy-D-glucose uptake (n = 4), C, lactate output (n = 16), D, glycerol output (n = 16),
and E, [U-14C]palmitate oxidation (n = 4). The starvation period was from time zero to 48 hrs.
The arrow indicates the time point at which the cells were re-fed with the basal adipocyte
medium containing 4.5 g/L glucose. Data shown are mean ± SD with the indicated number of
replicates. See also Fig. 1 caption for explanation of legend symbols. *, statistically significantly
different from the pRev control at the indicated time point with p < 0.05.
26
by guest, on July 23, 2018w
ww
.jlr.orgD
ownloaded from

A B
C D
1 2
36 kDa
Figure 1
by guest, on July 23, 2018w
ww
.jlr.orgD
ownloaded from
B
C D
G
E F
H
A UCP1Day 4
pREVDay 4
UCP1Day 8
pRevDay 8
100 μm
Figure 2
by guest, on July 23, 2018w
ww
.jlr.orgD
ownloaded from

**
*,##
Figure 3
# #
*,#
by guest, on July 23, 2018w
ww
.jlr.orgD
ownloaded from

0
0.5
11.5
2
2.5
0 96
*
*
*
*
*
A B
C
Figure 6
D
E
*
*
*
* *
*
by guest, on July 23, 2018w
ww
.jlr.orgD
ownloaded from


![ANTICANCER, ANTIBACTERIAL, AND ANTIFUNGAL ACTIVITIES … · removal), chemotherapy and radiation therapy.[11],[12] The third type of cell lines is 3T3-L1 cell line (ATCC® CL-173™)](https://img.pdfslide.us/doc/110x75/5f01b0667e708231d400922e/anticancer-antibacterial-and-antifungal-activities-removal-chemotherapy-and.jpg)