Embed Size (px)
Citation preview
Evgeny Krakow
Uppsats för avläggande av naturvetenskaplig magisterexamen i Miljövetenskap 30 hp Institutionen för växt- och miljövetenskaper, Göteborgs universitet Juni 2010
Effects of fly ash and stablized ash on wheat, Daphnia magna, radish and lettuce in laboratory tests
Summary Increasing use of biofuels, especially logging residues, will contribute to acidification and loss of nutrients, unless wooden ash is returned to the forest. Wooden ash contains valuble nutrients and alkalies, but also potentially toxic heavy metals.The aim of this study has been to investigate the toxicity and to identify the toxic agents in fresh and stabilized fly ash originating from combustion of biofuels at Västermalmsverket, Falun.Ash toxicity was tested using a growth test on wheat (Triticum aestivum). The toxicity of leacahate was determined for Daphnia magna and seeds of lettuce (Lactuca sativa) and raddish (Raphanus sativus). Chemical analysis of leachate was made along with a TIE procedure to identify its chemical composition and the toxic agents. Soils pH increased with time and amount of added wooden ash, probably due to presence of alkali metal hydroxides in leachate. Ash leachates were toxic to Daphnia magna at doses exceeding 24 tons of ash per hectare. Statistical analyses showed a significant dependency of toxicity on ash type, number of sampling week, exposure time in hours and ash +week. Fresh fly ash was more toxic to daphnids than stabilized ash, and both ashes showed the highest toxicity at the beginning of the sampling period. Growth of wheat was not negatively affected by moderate ash concentrations. Seeds of radish and lettuce were less sensitive to leachate toxicity than Daphnia magna. Attempts were made to identify substances responsible for leachate toxicity by performing a TIE with columns neutralizing lipophilic compounds, cations and anions. However, none of the tests showed any clear results. Chemical anlysis of ash leachate showed significantly elevated concentrations of copper, magnesium, manganese and sulphate compared to controll. Samples with the highest concentrations were also most toxic to Daphnia.
Key words: wooden ash, biofuels, ash recycling, toxicity, Daphnia, growth test, metal, Raphanus, Lactuca, TIE, root elongation, Triticum.
Sammanfattning Ökad användning av biobränslen, i synnerhet avverkningsrester, kan bidra till försurningen och förlusten av näringsämnen om askan inte återförs till skogsmarken. Vedaskan har alkaliska egenskaper och är rik på näringsämnen, men innehåller även potentiellt toxiska tungmetaller. Syftet med denna studie har varit att undersöka toxiciteten och identifiera de toxiska komponenterna hos lakvattnet från flygaska och stabiliserad aska som uppstår vid förbränning av biobränslen. Askans toxicitet undersöktes med tillväxttester med vete (Triticum aestivum). Lakvattnet testades på Dapnia magna samt frön av sallad (Lactuca
sativa) och rädisa (Raphanus sativus). TIE användes för att identifiera de toxiska elementen. Markens pH steg med tiden och med ökade koncentrationer av aska, troligtvis på grund av ökade halter av alkaliska metalhydroxider i lakvattnet. Lakvattnet var toxisk för D. magna vid doser överstigande 24 ton per hektar. Statistisk analys (ANOVA) visade att toxiciteten var signifikant kopplad till typen av aska, provtagningsveckan, exponeringstiden i timmar samt asktypen –provtagningveckan. Flygaskan var mer toxisk för D. magna än den stabiliserade aska och både typer av aska var mer toxiska i början av provtagningsperioden. Tillväxten av vete påverkades inte negativt av askkoncentrationen på upp till 24 ton per hektar. Sallads–och rädisfrön visade sig vara mindre känsliga för lakvattnets toxicitet jämfört med D. magna. Försök gjordes att identifiera de toxiska komponenterna i lakvattnet genom att använda TIE med selektiva kolonner som absorberade lipofila ämnen, metaliska anjoner respektive katjoner. TIE-testerna gav dock inga entydiga svar. Kemisk analys av lakvattnet från askan visade på förhöjda halter av koppar, magnesium, mangan och sulfat jämfört med kontrollerna. Proverna med de högsta metall– och sulfatkoncentrationerna var även mest toxiska för Daphnia. Nyckelord: biobränslen, askåterföring, bioaskan, toxicitet, tillväxttest, metaller, rotförlängning, Daphnia, Raphanus, Lactuca, Triticum, TIE.
Table of contents Summary................................................................................................................................1 Sammanfattning .....................................................................................................................2 Table of contents ....................................................................................................................3 1 Introduction .........................................................................................................................1
1.1 Renewable energy.........................................................................................................1 1.2 Ashes and recycling ......................................................................................................2 1.3 Characteristics of wooden ash .......................................................................................3 1.4 Stabilization of wooden ash ..........................................................................................3 1.5 Effects of wooden ash on soil and plants .......................................................................4 1.6 Aim of the present study ...............................................................................................4
2 Materials and methods.........................................................................................................4 2.1 Origins and chemical composition of wooden ash .........................................................4 2.2 Growth test with wheat (Triticum aestivum) .................................................................5 2.3 Collection of ash leachate .............................................................................................6 2.4 Identification of samples ...............................................................................................6 2.4 Immobility of Daphnia magna.......................................................................................6 2.5 Germination and root elongation of lettuce (Lactuca sativa) and raddish (Raphanus sativus) seeds......................................................................................................................6 2.6 TIE – toxicity identification procedure..........................................................................7 2.7 Statistical analysis.........................................................................................................7 2.8 Chemical analysis .........................................................................................................7
3 Results.................................................................................................................................7 3.1 Variation of pH.............................................................................................................8 3.3 Growth rate of Triticum aestivum .................................................................................9 3.4 Immobility of Daphnia magna.....................................................................................11 3.5 Germination and growth of Lactuca sativa ..................................................................15 3.6 Germination and growth of Raphanus sativus .............................................................18 3.7 TIE of leachate............................................................................................................20 3.8 Chemical analysis .......................................................................................................21
4 Discussion .........................................................................................................................22 4.1 Effect on pH ...............................................................................................................22 4.2 Effect on wheat growth ...............................................................................................23 4.3 Effect on D. magna .....................................................................................................23 4.4 Effect on R. sativa and L. sativus ................................................................................23 4.5 Chemical analysis .......................................................................................................23
5 Conclusions.......................................................................................................................24 Acknowledgements ..............................................................................................................24 6 References.........................................................................................................................25 Annex A. Primary data from week 1.....................................................................................28 Annex B. Primary data from week 2 .....................................................................................30 Annex C. Primary data from week 3 .....................................................................................31 Annex D. Primary data from week 4.....................................................................................32 Annex E. Primary data on wheat growth...............................................................................33 Annex F. Data from ANOVA for effects on Daphnia ...........................................................34
1
1 Introduction Annually, 1.3 millions of tonnes of ash are produced in Sweden, mainly as byproducts in heat and power generation (Värmeforsk 2008). Ash contains important nutrients and trace elements essential for plants growth, but also a small amount of heavy metals. The challenge is to close the cycle, to use the ash as a source of nutrients to increase growth without causing harmful effects on enviroment.
1.1 Renewable energy
The definition of sustainable development is that it “meets the needs of the present without compromising the ability of future generations to meet their own needs” (UN, 1987). Implementation of this vision in Swedish environmental policies is manifested by the decision of the Parliament to solve or minimize all the greatest national environmental problems within one generation. This visionary goal of the sustainable society is characterized by 16 National Environmental Objectives, of which all but one should be reached by 2020. The only exception is goal 1 “Reduced Climate Impact” which should be achieved by 2050 (Miljömålsrådet, 2010). This objective is accompanied with ambitions of European Union to cut its emissions of greenhouse gases by 20% by 2020 compared to 1990 in order to halt climate change. According to EU’s goals Swedish national emissions which are not part of Emission Trading Scheme (ETS) for example from transportation, agriculture and household are bond to decrease by 17% by 2020 compared to 1990 (Swedish Energy Agency, 2009). One of the adopted action plans to achieve these reduction considers an increase of the total amount of renewable energy to 50 % of the total energy supply by 2020. Renewable energy already contributes for 44.1% of the total 170 TWh used 2008, an increase from 33.9% in 1990 (Swedish Energy Agency, 2009). Biofuels contributed up to 20 % of the total energy supply in Sweden 2008. Biofuels are produced from the following organic fuels:
• Unprocessed wood: energy forest, bark, shavings, logging residues • Processed wood: pellet, briquettes • White and black liquors from pulp mills • Biofuels from crops such as corn • Peat • Biogas • Ethyl Alcohol
Processed and unprocessed wood products are used as fuel in a variety of different sectors, like forest industry, pulp industry, district heating and power generation. Wood products contributed up to 25.5 TWh to heat production 2008, a 5-fold increase since 1990. Biofuel’s part of the total energy supply is increasing by 3-4 TWh annually (Swedish Energy Agency, 2009). The goal of 50 % of energy coming from renewable sources can be achieved by the increasing use of biofuels, primarily wood products. Calculations show a potential resource of 130 TWh
2
wood products compared to 50 TWh which are used today. The main part of those resources (64TWh) might be provided logging residues (Parikka, 1997)
1.2 Ashes and recycling
Increased removal of logging residues from forests is not unproblematic as it may enhance such problems as acidification, enrichment of heavy metals and depletion of nutrients in soil as well as removing vital habitats for many species (Dahlberg, Stockland, 2004). Trees take up nutrients from soil as positively charged ions of K, Mg, Ca, leaving hydrogen ions in return, and a hydroxyl ions for the negatively charged ones. Since the uptakes of positively charged ions are greater than that of anions the soil will gradually undergo a natural acidification. Balance will be restored when dead wood is decomposed, because most of the hydrogen ions will be depleted during the process and nutrients return to the soil. Logging is disturbing this balance by removing the nutrients, especially when residues with high content of nutrients are removed. The increased use of logging residues as biofuels will put an additional stress on forest ecosystem. Studies have shown a decrease in pH by 0.0-0.4 units (Egnell et al., 1998) and the soil base ion saturation down by 10-20 % with residues removed (Olsson et al., 1996). Removing biomass from forest has lead to a decrease in forest growth, probably due to limitation of nitrogen supply (Egnell, Valinger, 2003; Egnell, Leijon 1999). Compensation measures need to be taken to counter the net losses of nutrients (Akselsson, 2005) In the recommendations from Swedish Forest Agency is stated: “Removal of logging residues should be compensated with bioash if:
• Total removal of other tree parts than stem are corresponding to more than half ton of
ash per hectare and
• The greatest part of needles is not left equally spread on the ground
• Ash should always be added even if removal equivalent is below half ton per hectare when done on strongly acidified soils or when forest is grown on a peat land.
Recommendations also point out the need to treat the ash in order to increase its stability. The benchmark is that ash should dissolve in 5-25 years.
• Ash should be stabilized to avoid damage on sensitive species Recommendations also set the upper limit on the total amount of ash added to the forest during a certain time:
• To avoid unwanted effects should no more than 3 tons DS ash per hectare be added during a 10 –year period and no more than 6 tons per hectare during a life cycle of
the forest. • The addition of heavy metals with bioash should not exceed the amount which is
removed with logging residues. Required upper and lower limits of nutrients and metal concentrations in ash are corresponding to the concentration of these subjects in the tree parts and on empirical knowledge from previous spreading of wooden ash. Small deviations from those limits are accepted if the source is proven to be from the combustion of biofuels (Skogsstyrelsen, 2008).
3
1.3 Characteristics of wooden ash
More than 80 % of wooden ash is composed of particles <1.0 mm, and the rest of non-incinerated wood (Etiegni et al., 1991a; Etiegni, Campbell, 1991). Bulk density varies from 0, 27 g cm-3 for wooden ash (Huang et al., 1992) to 0, 51 g cm-3 for ash from pulp and paper waste (Muse, Mitchell, 1995). The most abundant elements in wooden ash are Ca, K, and Mg which are particularly present in ash as oxides, hydroxides, carbonates and bicarbonates (Someswhar 1996). High combustion temperatures oxides C and N into gaseous forms, leaving only small quantities in the ash. Alkalinity of wooden ash depends on its content of oxides, hydroxides, bicarbonates and carbonates. Ratio of these substances depends on combustion temperature. Carbonates and bicarbonates dominate at temperatures up to 500oC while oxide formation is predominant above 1000oC, an operational temperature for the majority of commercial boilers (Etiegni, Campbell, 1991).
1.4 Stabilization of wooden ash
In order to avoid a rapid release of nutrients and potentially toxic compounds it is desirable to stabilize the ash before its release into the ecosystem. This can be achieved by forming large agglomerates or transforming ash’s content into minerals with low water solubility (Steenari, Lindqvist 1997). Wood ash with a low (<10 %) percentage of unburned material can spontaneously form large agglomerates when wetted, in so called self-hardening process transforming calcium (CaO) into portlandite (Ca (OH)2). (1) CaO + H2O→Ca (OH) 2 In contact with atmospheric CO2 portlandite transforms into calcite, a process known as carbonization: (2) Ca (OH) 2+ CO2→Ca CO3 + H2O Further reactions leads to formation of gypsum and ettringite: (3) CaSO4+ 2 H2O→ CaSO4* 2 H2O (4) Ca3Al2O6+ 3 CaSO4* 2 H2O+ 26 H2O→Ca6 Al2 (SO4) 3(OH)12*26 H2O Altogether, self hardening of ash significantly lowers its water solubility; calcite is for instance 100 times less soluble in water than calcium oxide. These factors will contribute to slower leaching rate of metals and other potential toxic compounds from stabilized ash. In addition with a lower alkali effect and a more moderate change in soil pH (Steenari et al., 1999) decreased toxicity of stabilized ash compared to untreated ash could be expected.
4
1.5 Effects of wooden ash on soil and plants
Effects of addition of wooden ash to soil are increased respiration and microbial activity (Shahid et al., 2002; Fritze et al., 1993), increasing pH (Mandre et al., 2006; Perkiömäki, Fritze, 2002; Arvidsson, Lundkvist, 2003). Addition of wooden ash increases P, Ca, Mg and especially K in soil (Unger and Fernandez, 1990; Ohno, Erich, 1990; Meiwes, 1995). Plants have been shown to benefit from nutrients in wooden ash. Studies on among others oat (Avena sativa L.), winter wheat (Triticum aestivum L.) and corn (Zea mays L.) showed increasing yield and growth (Erich, 1991; Huang et al., 1992; Krejsl, Scanlon, 1996). Studies on trees have not given any conclusive answers,and positive as well as negative effects have been observed (Ferm et al., 1992). The mainly factors behind increased growth are attributed to be higher availability of K, P and B in soil, while negative effects depend on decreased supply of N (Bramryd, Fransman, 1995). Addition of ash from biofuels can sometimes increase growth rate when spread in growing forest. This is especially the case in nutrient rich soils (Jacobson, 2003; Thelin, 2006). Several differences between effects of fly ash and stabilized ash have been shown. Stabilized ash doesn’t increase pH as much as fly ash (Kahl et al., 1996). Release of Mn and Zn is lower in stabilized ash compared to fly ash (Steenari et al., 1999). Respiration and concentrations of Ca and Mg increase more rapidly with addition of fly ash compared to stabilized ash (Perkiömäki,Fritze, 2002)
1.6 Aim of the present study
The aim of this study was to determine leachability and possible toxic effects of metals and other compounds from stabilized and fresh fly ash.
2 Materials and methods
2.1 Origins and chemical composition of wooden ash
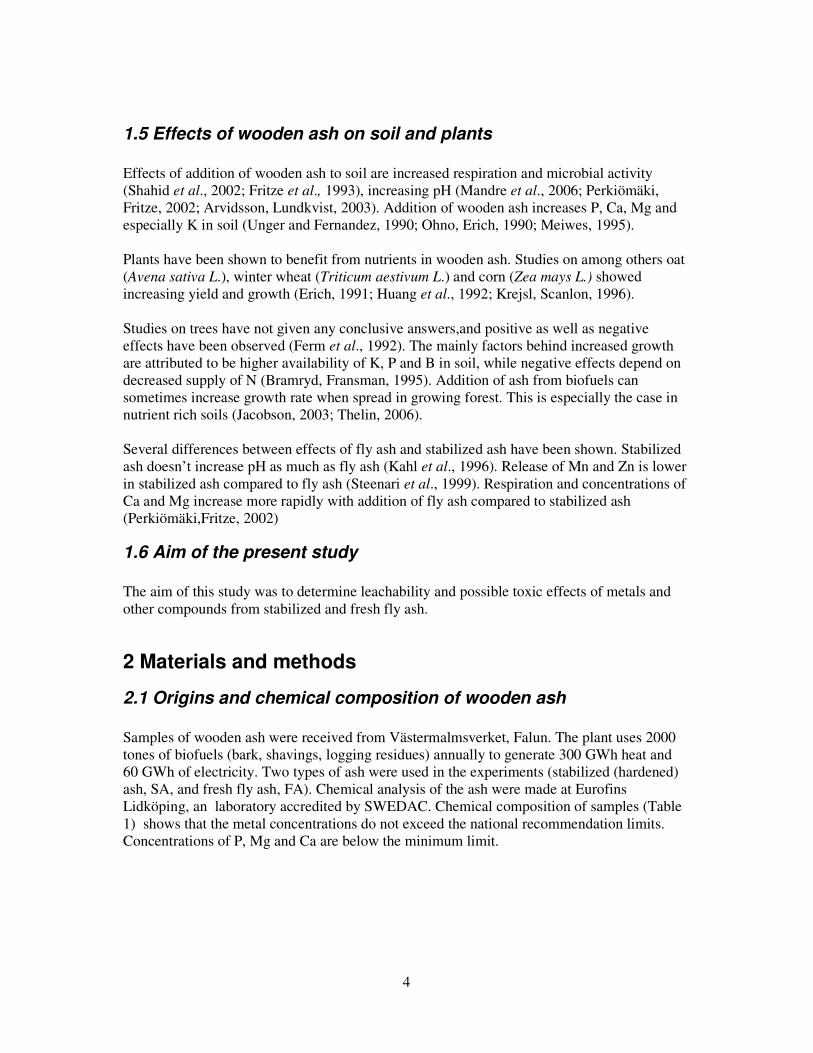
Samples of wooden ash were received from Västermalmsverket, Falun. The plant uses 2000 tones of biofuels (bark, shavings, logging residues) annually to generate 300 GWh heat and 60 GWh of electricity. Two types of ash were used in the experiments (stabilized (hardened) ash, SA, and fresh fly ash, FA). Chemical analysis of the ash were made at Eurofins Lidköping, an laboratory accredited by SWEDAC. Chemical composition of samples (Table 1) shows that the metal concentrations do not exceed the national recommendation limits. Concentrations of P, Mg and Ca are below the minimum limit.
5
Variable Unit Ash Flower pot soil Limit values
min max
pH - 10,7 6 - - Conductivity mS m-1 1617 40 - - Cl % TS 0.29 - - - S % TS 1.4 - - - Al mg kg-1 Ts 22700 - - - Al2O3 mg kg-1 Ts 43000 - - - Fe mg kg-1 Ts 6900 39 - - Fe2O3 mg kg-1 Ts 9900 - - - MgO mg kg-1 Ts 21000 - - - Mg mg kg-1 Ts 12400 1670 20000 - K mg kg-1 Ts 45500 - 30000 - Ca mg kg-1 Ts 124000 - 12500 - P mg kg-1 Ts 8200 700 10000 - P2O5 mg kg-1 Ts 19000 - - Mn mg kg-1 Ts 9300 24 - - MnO2 mg kg-1 Ts 15000 - - - As mg kg-1 Ts 13 - - 30 Pb mg kg-1 Ts 56 - - 300 Co mg kg-1 Ts 7,3 - - - Cd mg kg-1 Ts 5,9 - - 30 Cu mg kg-1 Ts 70 19 - 400 Hg mg kg-1 Ts 0,21 - - 3 Cr mg kg-1 Ts 43 - - 100 Ni mg kg-1 Ts 18 - - 70 Zn mg kg-1 Ts 1400 11 - 7000 N mg kg-1 Ts - 1400 - - B mg kg-1 Ts 150 - - 500 V mg kg-1 Ts 14 - - 70
Table 1. Chemical composion of ash and flower pot soil, compared to recommended Swedish limit values.
2.2 Growth test with wheat (Triticum aestivum)
Tests on spring wheat ( Triticum aestivum) were used to determine the impact of wooden ash on growth rate. Five seeds of wheat were placed in each of the plastic pots filled with flower pot soil at a depth of 1 cm, and covered either by stabilized or fresh fly ash. The amount of ash corresponded to the addition of 3, 6, 12, 24, 48 and 96 tons of wooden ash per hectare, which should be compared to limits of 3 tons per hectare recommended by Swedish Forest Agency. There were four replicates for each concentration and four negative replicates were made with no addition of ash. The number of seeds that germinated in each pot was recorded, and 7 days after germination all but the tallest plant in each pot were removed. The remaining plants were left to grow for
6
additional 4 weeks, then harvested and measured for root and shoot length. During this period temperature ranged between 20-25oC. Light intensity ranged between 600-900 lux. Light regime was 16 hours of light and 8 hours of darkness. Irrigation was made with deionized water on Monday, Wednesday and Friday using a spray bottle. 100 ml of water was added to each pot on every occasion.
2.3 Collection of ash leachate
Underneath each pot a plastic breaker was placed in order to collect the leachate. A filter paper was placed at the bottom of each pot, preventing contamination of leachate by soil particles. Leachate was collected once a week for 4 weeks and tested for toxicity on Daphnia
magna (water fleas), Lactuca sativa (lettuce) and Raphanus sativus (radish).
2.4 Identification of samples
Every pot and its leachate were codified in order to facilitate identification of the test parameters specific for each pot. The name of each replicate begins with digits; 3, 6, 12, 24, 48 or 96 which correspondes to the amount of ash in tones added to one hectare. Letters SA (stabilized ash) and FA (fresh fly ash) describes the structural properties of the ash. Last digits; 1,2,3 or 4 represent the number of the replicate.
2.4 Immobility of Daphnia magna
Dapnia magna was used in bioassay to determine possible acute toxicity tested with 50 ml leachate according to standardized procedures (ISO 1996). Each leachate sample was tested in a Petri dish with 10 newborn neonate of D. magna. The number of immobilized daphnids was recorded after 24 and 48 hours. A positive control test using potassium dichromate (K2Cr7O7) was also made. The 24 EC50 value of potassium dichromate for Daphnia magna was determined in each test run.
2.5 Germination and root elongation of lettuce (Lactuca sativa) and raddish (Raphanus sativus) seeds.
Tests on seed germination and root elongation of different seeds were performed to evaluated the effect of ash leachate on the early development of plants. Radish and lettuce were used because they are known to be sensetive to metal contamination (Beltrami et al., 1999; Renoux et al., 2001). Five seeds of Latuca sativa (Econova garden, KRAV, No: 8355) and Raphanus sativus (Econova, Weibull Trädgård AB, No: 8363) respectively were put on a 90 mm filter paper ,(Munktell Filter Paper, ash content 0,007 %) and put into a Petri dish with 5 ml of leachates. The number of germinated seed as well as root elongation after 96 hours were recorded. Deionized water was used in negative controls (Beltrami et al., 1989).
7
2.6 TIE – toxicity identification procedure
TIE – toxicity identification evaluation was used to identify the toxic compounds causing the toxic effect in Daphnia tests (Norberg-King et al., 1991). Samples with the two highest leachate concentrations were poured into 5 out of 6 wells on a Nunc plate after the following TIE treatments:
• QMA-resin filtering which reduces toxicity of negative ions. • CM –resin filtering which reduces toxicity of positive ions. • C18 –resin filtering which reduces toxicity of lipophilic compounds. • One sample left untreated. • Control with SRW water.
After 1 hour 5 newborn Dapnia magna were added to each well. Immobility of daphnids in each sample was determined after 24 hours and compared to the untreated one.
2.7 Statistical analysis
Moving average method was used for determination of 24- and 48- hours EC50 for Daphnia
magna. Differences in toxicity due to ash type, number of sampling week, exposure time in hours, ash –week, ash –time, and week-hours was tested by analysis of variances (ANOVA) using a statistical software ( Crunch ver. 4, Crunch, Software Corp., Oakland, USA)
2.8 Chemical analysis
ICP-OES (Inductively Coupled Plasma Optical Emission Spectrometry) was used to determine concentration of metals and trace elements in leachate water (PE/Sciex ELAN 6000). Ion chromatografy was used to analyse concentrations of negative ions as chloride and sulphate in leachate water (ICS-90, Dionex, IonPac AS4A-SC 4 mm column).
3 Results The effects from wooden ash on pH in soil’s leachate as well as the concentration of metals are presented. Toxicity of ash is shown on growth rate of Triticum aestivum, immobilization of Daphnia magna together with germination and root elongation of seeds from Lactuca
sativa and Raphanus sativus. Results of TIE of leachates are shown in Table 2.
8
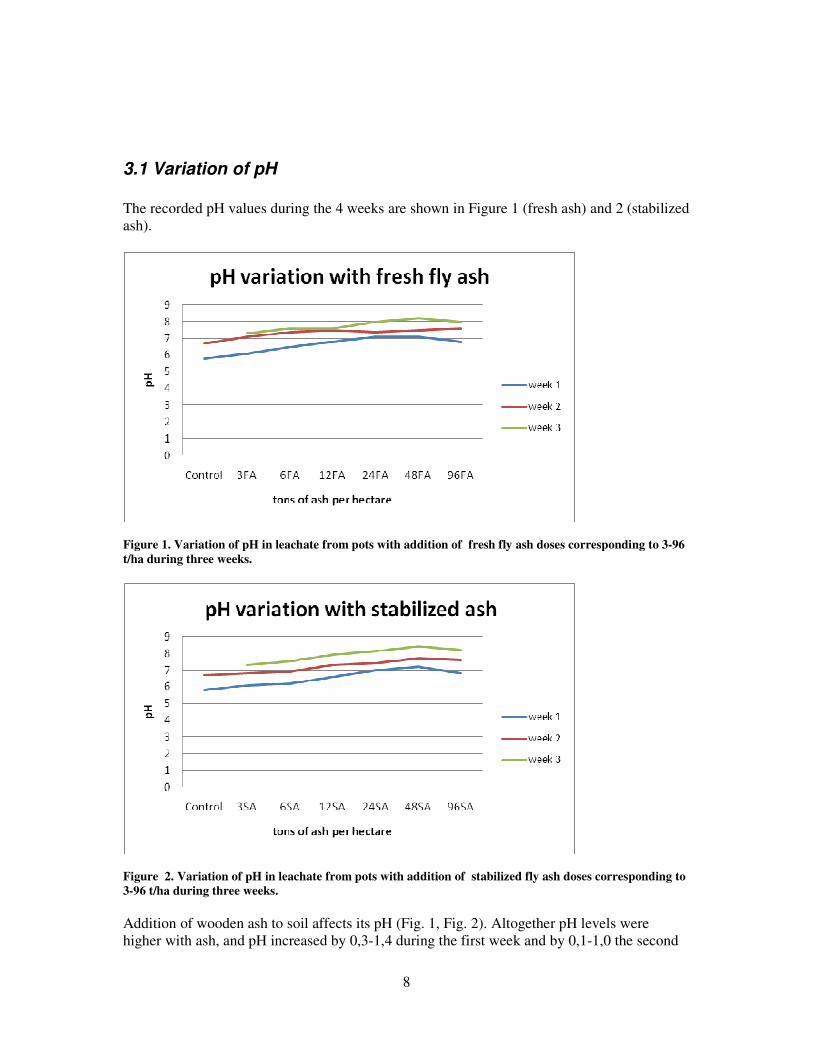
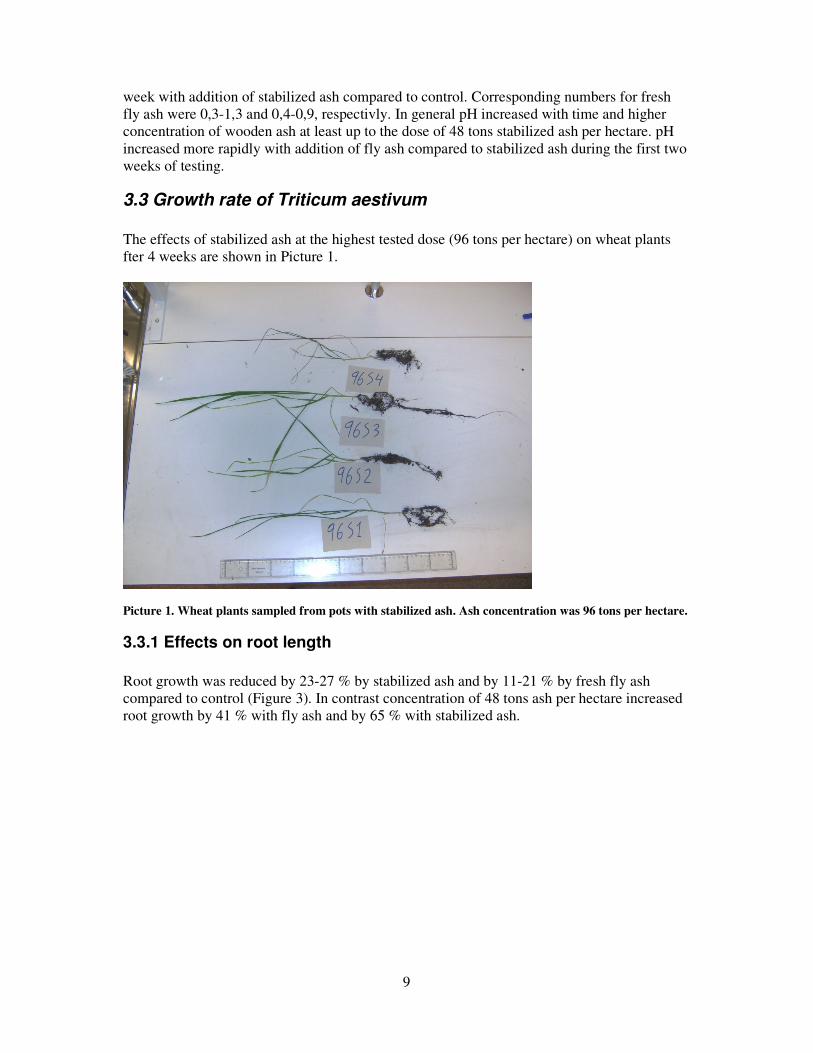
3.1 Variation of pH
The recorded pH values during the 4 weeks are shown in Figure 1 (fresh ash) and 2 (stabilized ash).
Figure 1. Variation of pH in leachate from pots with addition of fresh fly ash doses corresponding to 3-96
t/ha during three weeks.
Figure 2. Variation of pH in leachate from pots with addition of stabilized fly ash doses corresponding to
3-96 t/ha during three weeks.
Addition of wooden ash to soil affects its pH (Fig. 1, Fig. 2). Altogether pH levels were higher with ash, and pH increased by 0,3-1,4 during the first week and by 0,1-1,0 the second
9
week with addition of stabilized ash compared to control. Corresponding numbers for fresh fly ash were 0,3-1,3 and 0,4-0,9, respectivly. In general pH increased with time and higher concentration of wooden ash at least up to the dose of 48 tons stabilized ash per hectare. pH increased more rapidly with addition of fly ash compared to stabilized ash during the first two weeks of testing.
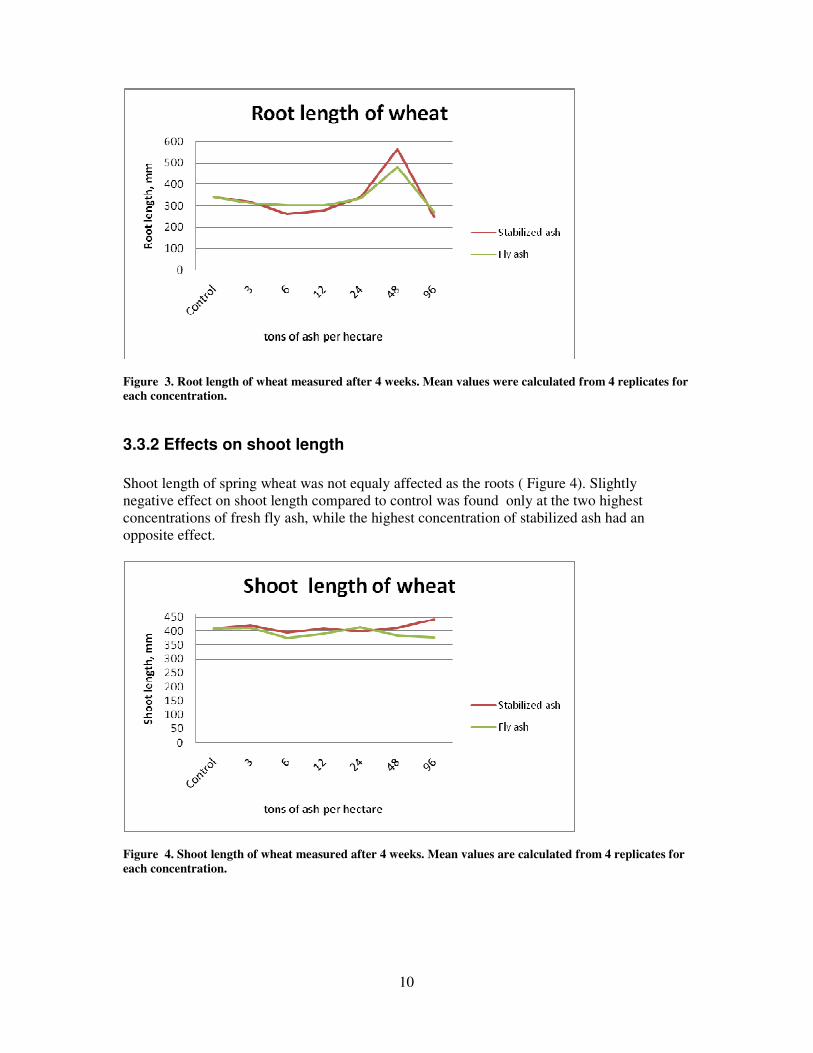
3.3 Growth rate of Triticum aestivum
The effects of stabilized ash at the highest tested dose (96 tons per hectare) on wheat plants fter 4 weeks are shown in Picture 1.
Picture 1. Wheat plants sampled from pots with stabilized ash. Ash concentration was 96 tons per hectare.
3.3.1 Effects on root length
Root growth was reduced by 23-27 % by stabilized ash and by 11-21 % by fresh fly ash compared to control (Figure 3). In contrast concentration of 48 tons ash per hectare increased root growth by 41 % with fly ash and by 65 % with stabilized ash.
10
Figure 3. Root length of wheat measured after 4 weeks. Mean values were calculated from 4 replicates for
each concentration.
3.3.2 Effects on shoot length
Shoot length of spring wheat was not equaly affected as the roots ( Figure 4). Slightly negative effect on shoot length compared to control was found only at the two highest concentrations of fresh fly ash, while the highest concentration of stabilized ash had an opposite effect.
Figure 4. Shoot length of wheat measured after 4 weeks. Mean values are calculated from 4 replicates for
each concentration.
11
3.4 Immobility of Daphnia magna
Wooden ash leachate was toxic to newborn daphnids ( Figure 5 and 6). In general the toxicity increased with concentration and decreased with time.
Figure 5. Percentage of immobilized daphnids. Leachate was taken once a week from pots with stabilized
ash. Values are showed as percentage of immobilized daphnids in 4 replicates.
Figure 6. Percentage of immobilized daphnids. Leachate was taken once a week from pots with fly ash.
Values are calculated as total proportion of immobilized daphnids in 4 replicates.
12
3.4.1 Immobility after 24 hours
Fresh fly ash was more toxic than stabilized ash.Toxicity appeared at doses of 12 tons of fly ash per hectare during the first week of sampling, 24 tons the second week and 48 tons third week. Toxicity of leachate from stabilized wooden ash was lower compared to fresh fly ash. The toxic effect starts to increase above a concentration of 24 tons of stabilized ash per hectare during first week and at 48 tons all other weeks, however at a slower rate than for fresh ash..
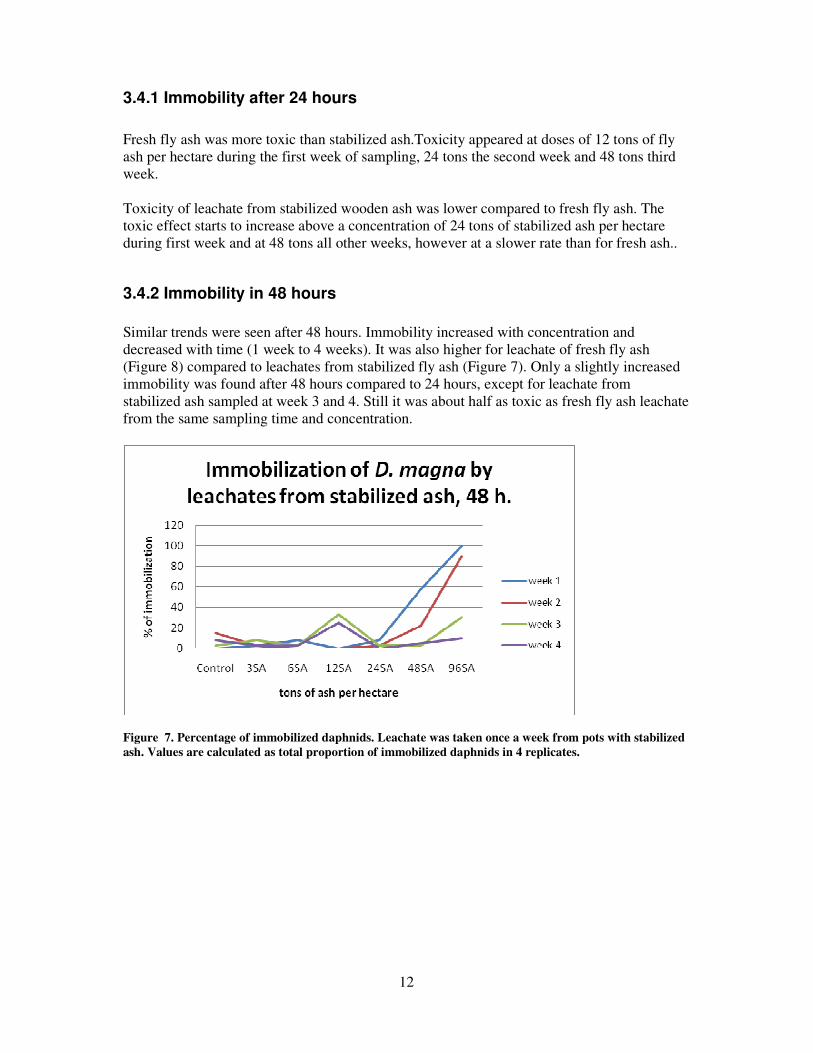
3.4.2 Immobility in 48 hours
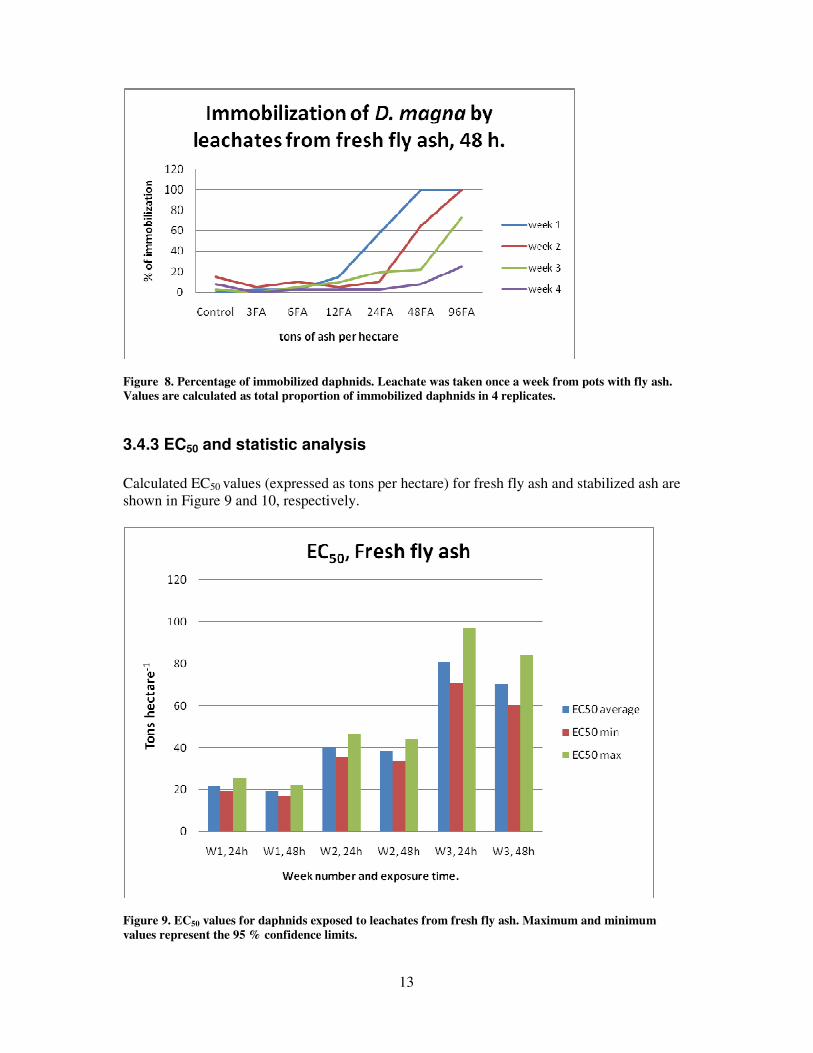
Similar trends were seen after 48 hours. Immobility increased with concentration and decreased with time (1 week to 4 weeks). It was also higher for leachate of fresh fly ash (Figure 8) compared to leachates from stabilized fly ash (Figure 7). Only a slightly increased immobility was found after 48 hours compared to 24 hours, except for leachate from stabilized ash sampled at week 3 and 4. Still it was about half as toxic as fresh fly ash leachate from the same sampling time and concentration.
Figure 7. Percentage of immobilized daphnids. Leachate was taken once a week from pots with stabilized
ash. Values are calculated as total proportion of immobilized daphnids in 4 replicates.
13
Figure 8. Percentage of immobilized daphnids. Leachate was taken once a week from pots with fly ash.
Values are calculated as total proportion of immobilized daphnids in 4 replicates.
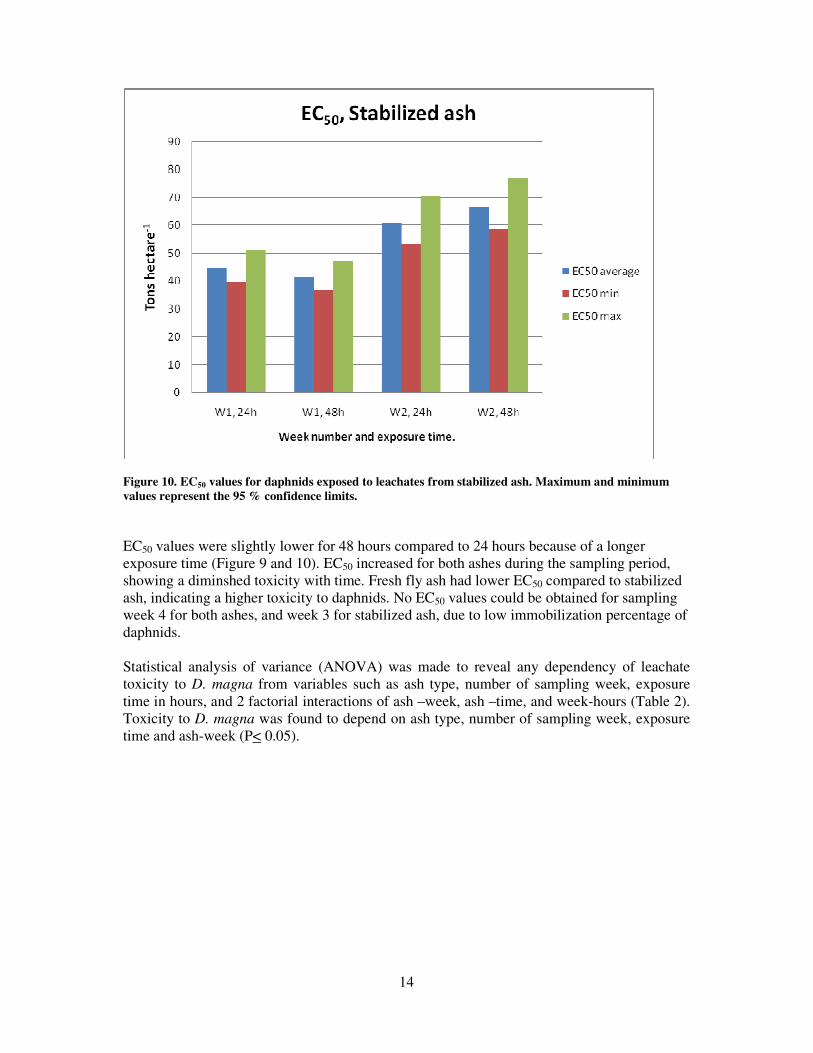
3.4.3 EC50 and statistic analysis
Calculated EC50 values (expressed as tons per hectare) for fresh fly ash and stabilized ash are shown in Figure 9 and 10, respectively.
Figure 9. EC50 values for daphnids exposed to leachates from fresh fly ash. Maximum and minimum
values represent the 95 % confidence limits.
14
Figure 10. EC50 values for daphnids exposed to leachates from stabilized ash. Maximum and minimum
values represent the 95 % confidence limits.
EC50 values were slightly lower for 48 hours compared to 24 hours because of a longer exposure time (Figure 9 and 10). EC50 increased for both ashes during the sampling period, showing a diminshed toxicity with time. Fresh fly ash had lower EC50 compared to stabilized ash, indicating a higher toxicity to daphnids. No EC50 values could be obtained for sampling week 4 for both ashes, and week 3 for stabilized ash, due to low immobilization percentage of daphnids. Statistical analysis of variance (ANOVA) was made to reveal any dependency of leachate toxicity to D. magna from variables such as ash type, number of sampling week, exposure time in hours, and 2 factorial interactions of ash –week, ash –time, and week-hours (Table 2). Toxicity to D. magna was found to depend on ash type, number of sampling week, exposure time and ash-week (P< 0.05).
15
Source of variation DF
Sums of squares
based on unique
variance
SS (U)
MSS F P
Between Subjects 15 205752
A (ASH) 1 16002 16002 10668 0,0000
W (WEEK) 3 168043 56014 37343 0,0000
H (HR) 1 49 49 33 0,0106
AW 3 21642 7214 4809 0,0000
AH 1 0 0 0 1,0000
WH 3 11 4 2 0,2523
Error 1 3 5 2 0
Table 2. ANOVA, analysis of variance.
3.5 Germination and growth of Lactuca sativa
3.5.1 Effect on seed germination
Ash leachate produced a variable effect on seeds of Lactuca sativa. During the first week of sampling leachate reduced the germination rate of seeds to 83 % compared to 95 % in control group, and 100 % in reference solution (deionized water). This effect was most obvious at high concentrations, germination rate of seeds in leachate from 96 tons of stabilized ash per hectare was 30 % and the corresponding figure was10 % for fly ash. No significant effect on seed germination was observed during any of the other weeks.
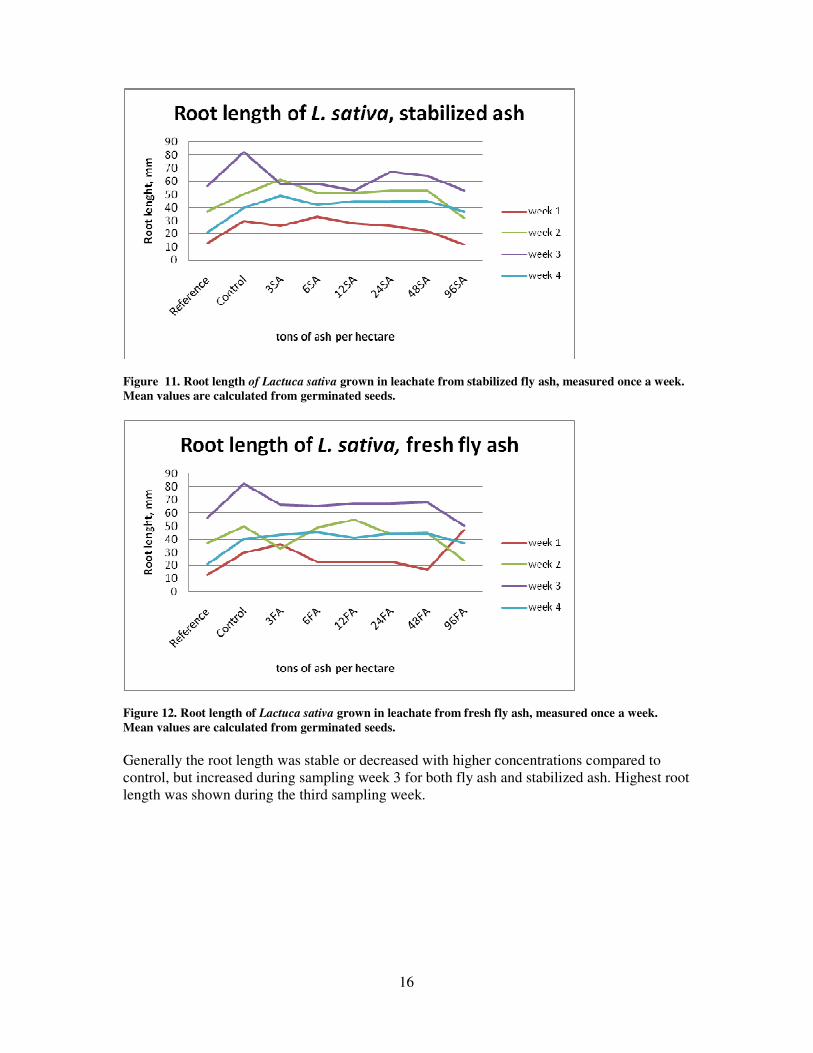
3.5.2 Effect on root length
Effect of leachate on root elongation of Lactuca sativa varied with time and concentration (Figure 11 and 12).
16
Figure 11. Root length of Lactuca sativa grown in leachate from stabilized fly ash, measured once a week.
Mean values are calculated from germinated seeds.
Figure 12. Root length of Lactuca sativa grown in leachate from fresh fly ash, measured once a week.
Mean values are calculated from germinated seeds.
Generally the root length was stable or decreased with higher concentrations compared to control, but increased during sampling week 3 for both fly ash and stabilized ash. Highest root length was shown during the third sampling week.
17
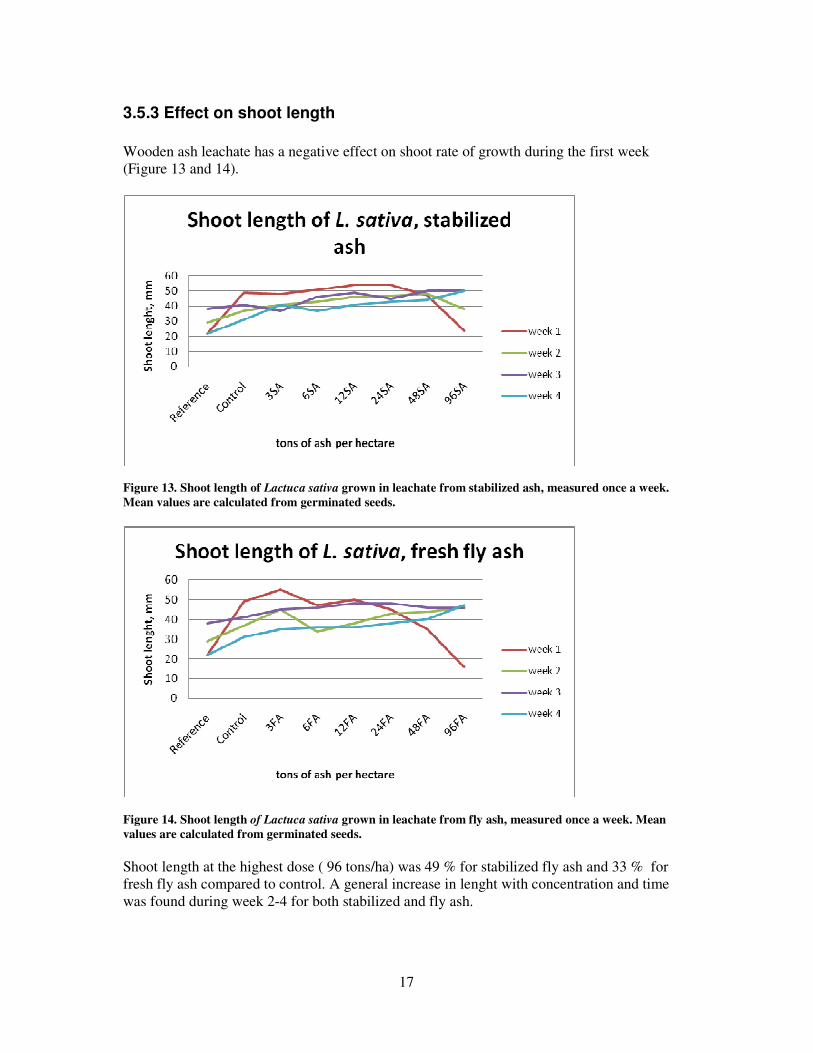
3.5.3 Effect on shoot length
Wooden ash leachate has a negative effect on shoot rate of growth during the first week (Figure 13 and 14).
Figure 13. Shoot length of Lactuca sativa grown in leachate from stabilized ash, measured once a week.
Mean values are calculated from germinated seeds.
Figure 14. Shoot length of Lactuca sativa grown in leachate from fly ash, measured once a week. Mean
values are calculated from germinated seeds.
Shoot length at the highest dose ( 96 tons/ha) was 49 % for stabilized fly ash and 33 % for fresh fly ash compared to control. A general increase in lenght with concentration and time was found during week 2-4 for both stabilized and fly ash.
18
3.6 Germination and growth of Raphanus sativus
3.6.1 Effect on seed germination
Germination rate of Raphanus sativus seeds grown in leachates during the first week was the same for control and reference solution (90 %). Growth rate for seeds in leachate improved slightly during the sampling weeks, while it varied for control and reference solutions.
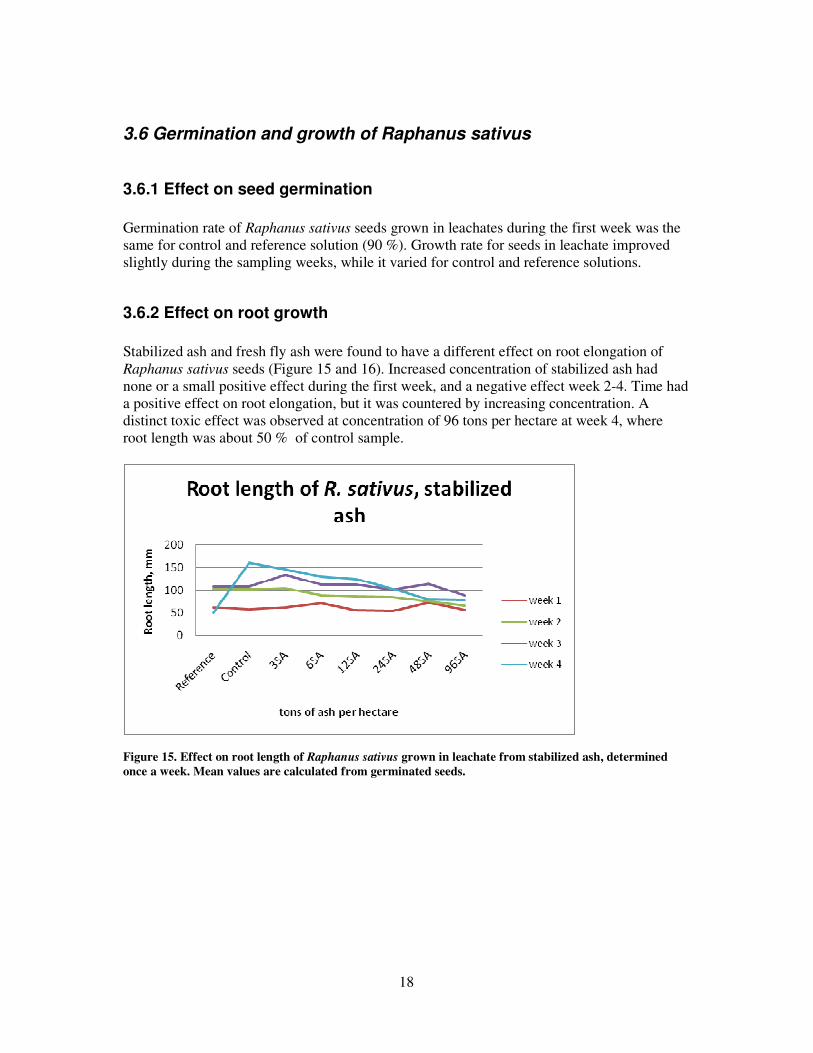
3.6.2 Effect on root growth
Stabilized ash and fresh fly ash were found to have a different effect on root elongation of Raphanus sativus seeds (Figure 15 and 16). Increased concentration of stabilized ash had none or a small positive effect during the first week, and a negative effect week 2-4. Time had a positive effect on root elongation, but it was countered by increasing concentration. A distinct toxic effect was observed at concentration of 96 tons per hectare at week 4, where root length was about 50 % of control sample.
Figure 15. Effect on root length of Raphanus sativus grown in leachate from stabilized ash, determined
once a week. Mean values are calculated from germinated seeds.
19
Figure 16. Effects on root length of Raphanus sativus grown in leachate from fresh fly ash, determined
once a week. Mean values are calculated from germinated seeds.
Also fresh fly ash leachate had a toxic effect on root elongation, but only during the first two weeks of sampling (Figure 16). Effects occurred at concentrations exceeding 24 tons per hectare week 1 and 48 tons week 2. Increasing concentration of leachate durign week 3 and 4 did not exhibit any obvious trends.
3.6.3 Effect on shoot growth
Low doses of stabilized ash and fresh fly ash leachate showed generally a positive effect on shoot growth (Figure 17 and 18)
Figure 17. Effect on shoot length of Raphanus sativus grown in leachate from stabilized ash, determined
once a week. Mean values are calculated from germinated seeds.
20
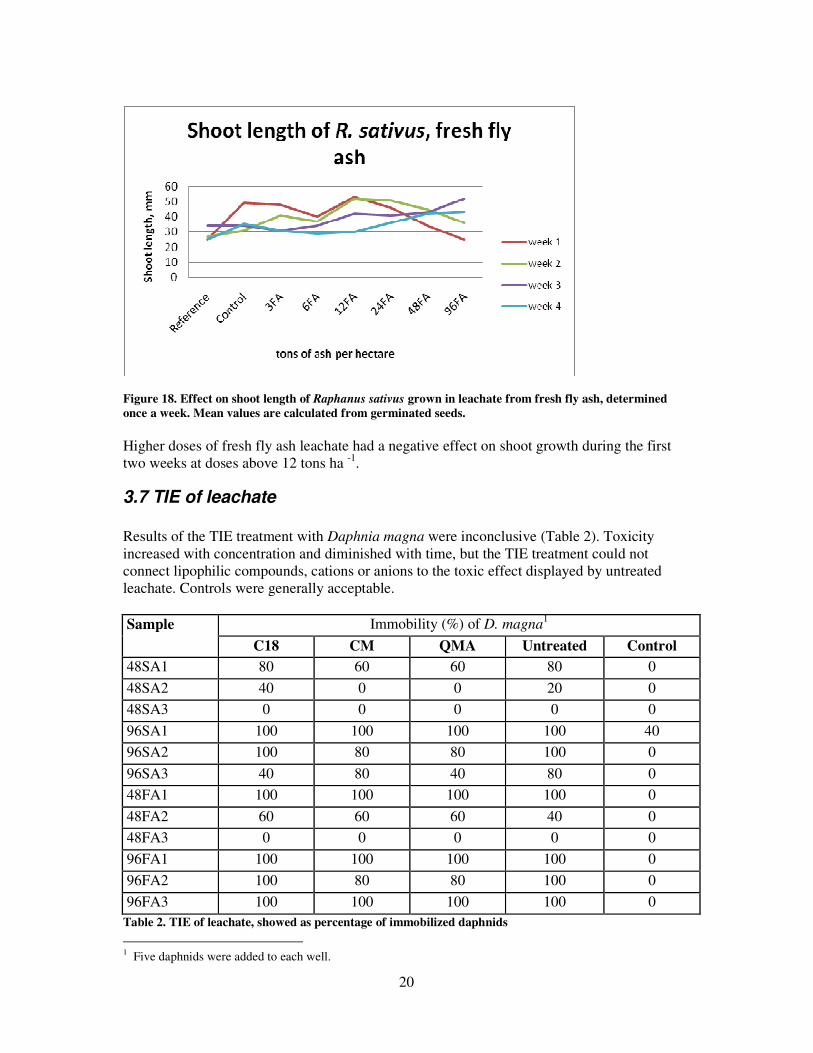
Figure 18. Effect on shoot length of Raphanus sativus grown in leachate from fresh fly ash, determined
once a week. Mean values are calculated from germinated seeds.
Higher doses of fresh fly ash leachate had a negative effect on shoot growth during the first two weeks at doses above 12 tons ha -1.
3.7 TIE of leachate
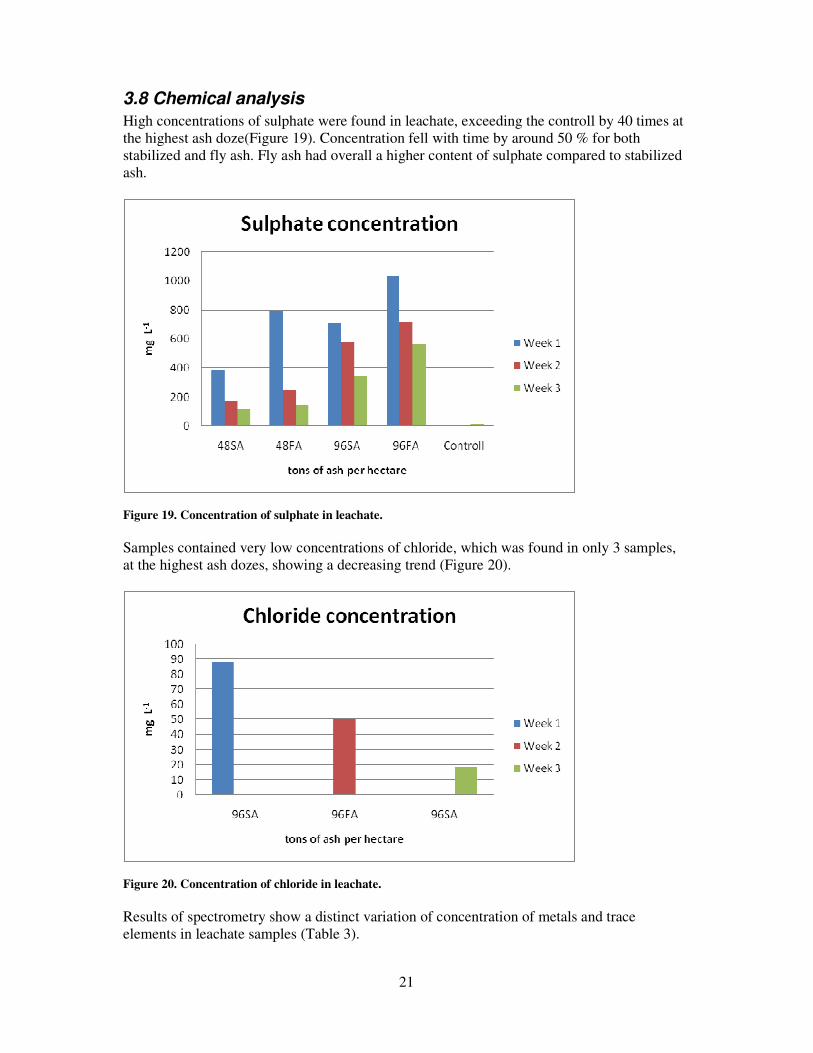
Results of the TIE treatment with Daphnia magna were inconclusive (Table 2). Toxicity increased with concentration and diminished with time, but the TIE treatment could not connect lipophilic compounds, cations or anions to the toxic effect displayed by untreated leachate. Controls were generally acceptable.
Immobility (%) of D. magna1 Sample
C18 CM QMA Untreated Control
48SA1 80 60 60 80 0
48SA2 40 0 0 20 0
48SA3 0 0 0 0 0
96SA1 100 100 100 100 40
96SA2 100 80 80 100 0
96SA3 40 80 40 80 0
48FA1 100 100 100 100 0
48FA2 60 60 60 40 0
48FA3 0 0 0 0 0
96FA1 100 100 100 100 0
96FA2 100 80 80 100 0
96FA3 100 100 100 100 0 Table 2. TIE of leachate, showed as percentage of immobilized daphnids
1 Five daphnids were added to each well.
21
3.8 Chemical analysis
High concentrations of sulphate were found in leachate, exceeding the controll by 40 times at the highest ash doze(Figure 19). Concentration fell with time by around 50 % for both stabilized and fly ash. Fly ash had overall a higher content of sulphate compared to stabilized ash.
Figure 19. Concentration of sulphate in leachate.
Samples contained very low concentrations of chloride, which was found in only 3 samples, at the highest ash dozes, showing a decreasing trend (Figure 20).
Figure 20. Concentration of chloride in leachate.
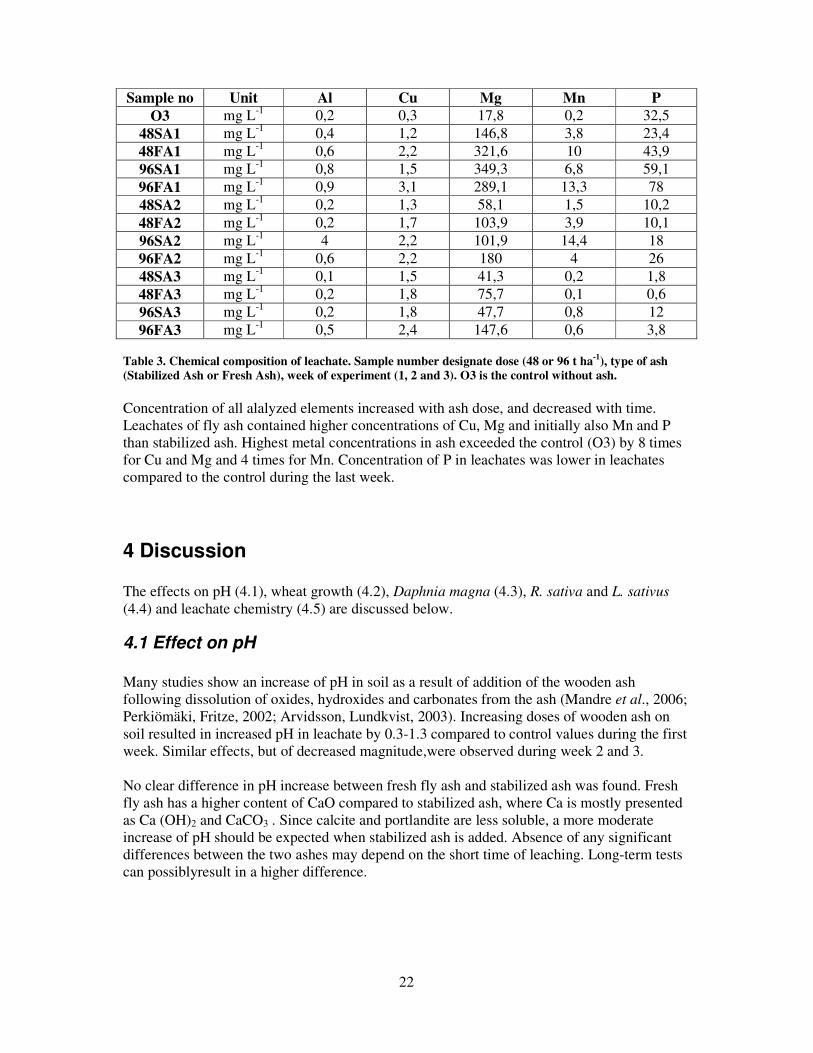
Results of spectrometry show a distinct variation of concentration of metals and trace elements in leachate samples (Table 3).
22
Sample no Unit Al Cu Mg Mn P
O3 mg L-1 0,2 0,3 17,8 0,2 32,5 48SA1 mg L-1 0,4 1,2 146,8 3,8 23,4 48FA1 mg L-1 0,6 2,2 321,6 10 43,9 96SA1 mg L-1 0,8 1,5 349,3 6,8 59,1 96FA1 mg L-1 0,9 3,1 289,1 13,3 78 48SA2 mg L-1 0,2 1,3 58,1 1,5 10,2 48FA2 mg L-1 0,2 1,7 103,9 3,9 10,1 96SA2 mg L-1 4 2,2 101,9 14,4 18 96FA2 mg L-1 0,6 2,2 180 4 26 48SA3 mg L-1 0,1 1,5 41,3 0,2 1,8 48FA3 mg L-1 0,2 1,8 75,7 0,1 0,6 96SA3 mg L-1 0,2 1,8 47,7 0,8 12 96FA3 mg L-1 0,5 2,4 147,6 0,6 3,8
Table 3. Chemical composition of leachate. Sample number designate dose (48 or 96 t ha-1
), type of ash
(Stabilized Ash or Fresh Ash), week of experiment (1, 2 and 3). O3 is the control without ash.
Concentration of all alalyzed elements increased with ash dose, and decreased with time. Leachates of fly ash contained higher concentrations of Cu, Mg and initially also Mn and P than stabilized ash. Highest metal concentrations in ash exceeded the control (O3) by 8 times for Cu and Mg and 4 times for Mn. Concentration of P in leachates was lower in leachates compared to the control during the last week.
4 Discussion
The effects on pH (4.1), wheat growth (4.2), Daphnia magna (4.3), R. sativa and L. sativus (4.4) and leachate chemistry (4.5) are discussed below.
4.1 Effect on pH
Many studies show an increase of pH in soil as a result of addition of the wooden ash following dissolution of oxides, hydroxides and carbonates from the ash (Mandre et al., 2006; Perkiömäki, Fritze, 2002; Arvidsson, Lundkvist, 2003). Increasing doses of wooden ash on soil resulted in increased pH in leachate by 0.3-1.3 compared to control values during the first week. Similar effects, but of decreased magnitude,were observed during week 2 and 3. No clear difference in pH increase between fresh fly ash and stabilized ash was found. Fresh fly ash has a higher content of CaO compared to stabilized ash, where Ca is mostly presented as Ca (OH)2 and CaCO3 . Since calcite and portlandite are less soluble, a more moderate increase of pH should be expected when stabilized ash is added. Absence of any significant differences between the two ashes may depend on the short time of leaching. Long-term tests can possiblyresult in a higher difference.
23
4.2 Effect on wheat growth
Wooden ash had only an insignificant negative effect on root growth for concentrations up to 24 tons per hectare. Increasing concentrations lead to doubling of root length, only to return to previous levels as concentration exceeded 48 tons per hectare. Since no corresponding effects were observed on the shoot length, this is difficult to interprete. Previous studies has demonstrated a generally positive effect of wooden ash on plants growth, among them wheat (Erich, 1991; Huang et al., 1992; Krejsl, Scanlon, 1996). Absence of such effects during these tests might depend on a too short growth period. It may also result from chemical characteristics of soil used in pot tests. The soil was already nutrient rich, therefore removing this limiting factor to plants growth. Additional nutrients from the ash were then redundant.
4.3 Effect on D. magna
Bioassays showed a toxic effect of wooden ash on Daphnia magna. Immobility increased with concentration, exposure time, but decreased for each sampling week. Fresh fly ash was more toxic than stabilized ash. A slightly decreased EC50 values for 48 hours compared to 24 hours of exposure were expected considering the longer time daphnids were exposed to leachate. EC50 values are also in all aspects lower for fresh fly ash in comparison to stabilized ash, indicating higher toxicity to D. magna. EC50 of both ashes increased during sampling weeks. This means that toxic constituents leached easily, and especially from the fresh ash. Since no difference in pH was shown between fresh fly ash and stabilized ash there must be some other source of toxicity. TIE were made in order to reveal if cations, anions or lipophilic compounds could be connected to the leachate toxicity, but failed to give any clear answers.
4.4 Effect on R. sativa and L. sativus
Radish and lettuce seeds were not as sensitive as daphnids to leachate toxicity. Usualy an insignificant negative effect on shoot length was observed during the first sampling week. Root length showed no general trends in response to increasing concentrations or sampling weeks, except a slightly increasing root length during week 2 to 4 compared to week 1.
4.5 Chemical analysis
Chemical analysis revealed high concentrations of several metals and sulphate in leachates, often many times higher than control sample. This must be a consequence of the high content of sulphur and metals in wooden ash subsequently leached out by watering. Concentrations of metals and sulphur were lower in leachates from stabilized ash compared to fresh fly ash, which is in line with previous research (Steenari et al., 1999).
24
High metal and sulphur concentrations in leachate might also explain the initially high toxicity to daphnids during the first two sampling weeks. Ash doses which had the highest toxicity on D. magna were also shown to have the highest concentrations of metals and sulphate. Presence of both positive and negative ions in leachate may also had disrupted TIE. Either metals or sulphate could cause immobilization, since none of the filters could remove both cations and anions simultaneously.
5 Conclusions Results from bioassays with stabilized and fresh wooden ash on Daphnia magna, Triticum
aestivum and seeds of Raphanus sativus and Lactuca sativa have showed the following:
• Growth of wheat was not negativly affected by ash concentrations of up to 24 tons per hectare.
• Wooden ash increase pH in soil from 0,1 to 1,4 in proportion to ash dose. • Leachates were toxic to daphnids at doses exceeding 24 tons per hectare. EC50 values
for leachates from fresh fly ash were lower in comparison to stabilized ash which indicates higher toxicity.
• EC50 for 24 hours exposure time was slightly higher for both ashes compared to 48 hours, which means that toxicity increased with exposure time.
• Toxicity of both ashes to daphnids decreased for every week, which sugestest that leaching of toxic components was initially rapid.
• Analysis of variance (ANOVA) showed a significant relationship between toxicity of ash to daphnids and variables such as ash type (fresh or stabilized), number of sampling weeks (1-4), exposure time in hours (24 and 48) and ash type+week.
• Effects of ash leachates on radish and lettuce seeds were not as distinct as on daphnids. Negative effects were observed on root and shoot length during the first week of sampling.
• Attempts were made to identify substances responsible for toxicity by performing a TIE with columns neutralizing lipophilic compounds, cations and anions. However, none of the tests showed any clear results.
Acknowledgements A lot of people have a share in this work, some directly, by guiding me through the whole process and giving me valuable ideas and recommendations. Others by releaving me of some of my daily duties as coaching, cooking et al or simply giving me a kick in the butt whenever I needed one. Thank you all. First of all I would like to thank my suprevisor Göran Dave for his support, advices and of course his great patience, especially with my constant lateness! Thanks to Britt-Marie Steenari for useful hints and approaches in the search for the toxic agents. Also a big hug to Vivian Aldén for assisting me with laboratory procedures. Thanks to Arvid Ödegård Jensen, Dongmei Zhao and Kristian Larsson for helping me with chemical analyses.
25
Last but not least I would like to thank Elisabet Sjökvist, Yelena Manakova and Boris Krakov for pre reading and commenting on this thesis.
6 References Akselsson, C. 2005. Regional nutrient budgets in forest soils in a policy perspective. Doctoral thesis. Department of Chemical Engineering, Lund University, Lund. Arvidsson, H., Lundkvist, H., 2003. Effects of crushed wood ash on soil chemistry in young
Norway spruce stands. Forest Ecology and Management. 176, 121-132. Bramryd, T., Fransman, B., 1995. Silvicultural uses of wood ashes –effects on the nutrient
and heavy metal balance in a pine (Pinus sylvestris L.) forest soil. Water Air Soil Pollut. 85, 1039-1044. Beltrami, M., Rossi, D., Baudo, R. 1999. Phytotoxicity assessment of Lake Orta sediments. Aquatic Ecosystem Health and Management 2:391-401. Dahlberg, A., Stokland, J., N., 2004. Vedlevande arters krav på substrat –sammanställning
och analys av 3600 arter. Rapport 2004:7 Skogsstyrelsen, Jönköping. Egnell. G., Leijon, B. 1999. Survival and growth of planted seedlings of Pinus sylvestris and
Picea abies after different levels of biomass removal in clear-felling. Scandinavian Journal of Forest Research 14: 303-311. Egnell, G., Nohrstedt, H., O., Weslien, J., Westling, O., Örlander, G. 1998. Miljökonsekvensbeskrivning (MKB) av skogsbränsleuttag, asktillförsel och övrig
näringskompensation. Rapport 1998:1 Skogsstyrelsen, Jönköping. Egnell, G., Valinger, E. 2003. Survival, growth and growth allocation of planted Scots pine
trees after different levels of biomass removal in clear-felling. Forest Ecology and Management 177: 65-74. Energimyndigheten, 2009. Energiläget 2009. Statens energimyndighet. ET 2009:28 Erich, M. S., Ohno, T., 1992b. Phosphorus availability to corn from wood ash amended soils. Water Air Soil Pollut. 64, 475-485. Etiegni, L., Campbell, A.G. 1991. Physical and chemical characteristics of wood ash. Biores. Technol. 37, 173-178. Etiegni, L., Campbell, A.G., Mahler, R.L., 1991a. Evaluation of wood ash disposal on
agricultural land. I. Potential as soil additive and liming agent. Commun. Soil Sci. Plant Anal. 22, 243-256. Ferm, A., Hokkanen, T., Moilanen, M., Issakainen, J., 1992. Effects of wood bark ash on the
growth and nutrition of a Scots pine afforestation in central Finland. Plant and Soil 147, 305-316.
26
Fritze, H., Smolander, A., Levula, T., Kitunen, V., Mälkönen, E., 1994. Wood-ash
fertilization and fire treatments in a Scots pine forest stand: Effects on the organic layer,
microbial biomass, and microbial activity. Bio Fertil Soils, 17:57-63. Huang, H., Capmbell, A.G., Folk, R., Mahler, R. L., 1992. Wood ash as a soil additive and
liming agent for wheat. Field studies. Commun. Soil Sci. Plant Anal. 23, 25-33. ISO, 1996. Water quality –determination of the inhibition of the mobility of Dapnia magna
Straus ( Cladocera, Crustacea) –acute toxicity test. ISO 6341:1996. International Organisation for Standardisation, Geneva, Switzerland. Jacobson, S. 2003. Addition of stabilized wood ashes to Swedish coniferous stands on mineral
soils –Effects on stem growth and needle nutrioent concentrations. Silva Fennica 37: 437-450. Kahl, J., S., Fernandez, I., J., Rustad, L., E., Peckenam, J., 1996. Threshold application rates
of wood ash to an acidic forest soil. J. Environ. Qual. 25, 220-227. Krejsl, J., A., Scanlon, T., M., 1996. Evaluation of beneficial use of wood-fired boiler ash on
oat and bean growth. J. Environ. Qual. 25, 950-954. Mandre, M., Pärn, H., Ots, K., 2006. Short-term effects of wood ash on the soil and the lignin
concentration and growth of Pinus sylvestris L. Forest Ecology and Management. 223, 349-357. Meiwes, K., J., 1995. Application of lime and wood ash to decrease acidification of forest
soils. Water Air Soil Pollut. 85, 143-152. Miljömålsrådet, 2010. Hämtad 2010-03-04 från: http://www.miljomal.nu/Undre-meny/Om-Miljomalsradet/ Muse, J.K. Mitchell, C. C., 1995. Paper mill boiler-ash and lime by-products as soil liming
materials. Agron. J. 87, 432-438. Ohno, T., Erich, M., S., 1990. Effect of wood ash application on soil pH and soil test nutrient
levels. Agric. Ecosyst. Environ. 32, 223-239. Olsson, B., A., Bengtsson, J., Lundkvist H. 1996. Effects of different forest harvest intensities
on the pools of exchangable cations in coniferous forest soils. Forest Ecology and Management 84:135-137. Parikka, M. 1997. Biosims - a method for the estimation of woody biomass
for fuel in Sweden. Swedish Universityof Agricultural Sciences. Doktorsavhandling Silvestria
no. 27. Uppsala
Perkiömäki, J., Fritze, H., 2002. Short and long-term effects of wood ash on the boreal forest
humus microbial community. Soil Biology & Biochemistry 34, 1343-1353. Renoux, A. Y., Tyagi, R. D., Samson, R. 2001. Assesment of toxicity reduction after metal
removal in bioleached sewage sludge. Water Research, 35:1415-1424.
27
Mahmood, S., Finlay, R. D., Fransson, A-M., Wallander, H., 2003. Effects of hardened wood
ash on microbial activity, plant growth and nutrient uptake by ectomycorrhizal spruce
seedlings. FEMS, Microbiology Ecology. 43, 121-131. Norberg-King, T., D. Mount, E. Durhan, G. Ankley, L. Burkhard, J. Amato & L. Anderson-Carnahan, 1991. Methods for aquatic toxicity identification evaluations: Phase I Toxicity
Characterization Procedures. (Second Edition), EPA-600/6-91/003, U.S. Environmental Protection Agency, Duluth, MN. Someshwar, A. V., 1996. Wood ash and combination wood-fired boiler ash characterization. J. Environ. Qual. 25, 962-972. Skogsstyrelsen 2008. Rekommendationer vid uttag av avverkningsrester och askåterföring.
Meddelande 2008*2. Skogsstyrelsens förlag. Steenari, B.-M., Karlsson, L. G., Lindqvist, O., 1999. Evaluation of the leaching
characteristics of wood ash and the influence of ash agglomeration. Biomass and Bioenergy. 16, 119-136. Steenari, B.-M., Lindqvist, O., 1997. Stabilization of biofuel ashes for recycling to forest soil.
Biomass and Bioenergy. 13, 39-50 Steenari, B.-M., Schelander, S., Lindqvist, O., 1999. Chemical and leaching characteristics of
ash from combustion of coal, peat and wood in a 12 MW CFB – a comparative study. Fuel. 78, 249-258. Thelin, G. 2006. Askåterföring till gran- och bokbestånd – effekter på näring, tillväxt,
kvävedynamik och kolbalans. Rapport 965. Värmeforsk, Stockholm. UN, 1987. Report of the World Commission on Environment and Development. General Assembly Resolution 42/187. Hämtad 2010-05-10 från: http://www.un.org/documents/ga/res/42/ares42-187.htm Unger, Y., L., Fernandez, I., J., 1990. The short-term effects of wood-ash amendmend on
forest soils. Water Air Soil Pollut. 49, 299-314. Värmeforsk, 2008. Miljövänlig användning av askor 2009-2011 – Sammanfattning. Hämtad 2010-05-03 från: http://www.askprogrammet.com/inbjudan2009-11.htm.
28
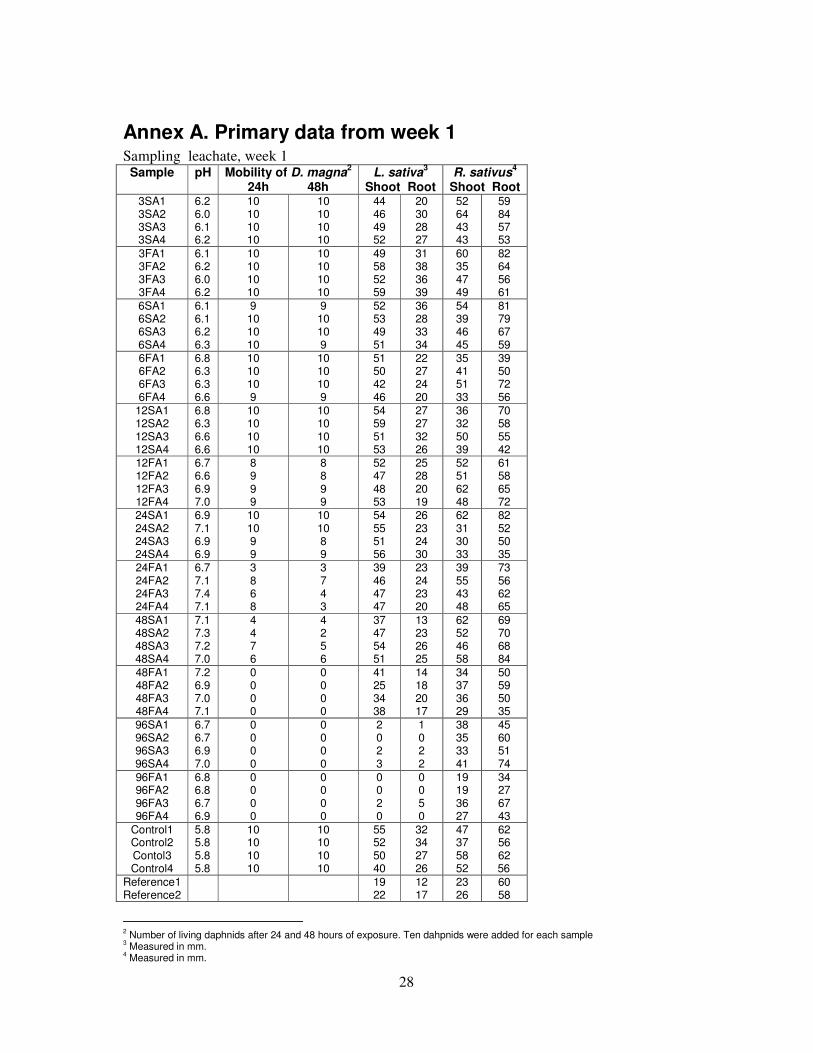
Annex A. Primary data from week 1 Sampling leachate, week 1 Sample pH Mobility of D. magna
2
24h 48h L. sativa
3
Shoot Root R. sativus
4
Shoot Root 3SA1 3SA2 3SA3 3SA4
6.2 6.0 6.1 6.2
10 10 10 10
10 10 10 10
44 46 49 52
20 30 28 27
52 64 43 43
59 84 57 53
3FA1 3FA2 3FA3 3FA4
6.1 6.2 6.0 6.2
10 10 10 10
10 10 10 10
49 58 52 59
31 38 36 39
60 35 47 49
82 64 56 61
6SA1 6SA2 6SA3 6SA4
6.1 6.1 6.2 6.3
9 10 10 10
9 10 10 9
52 53 49 51
36 28 33 34
54 39 46 45
81 79 67 59
6FA1 6FA2 6FA3 6FA4
6.8 6.3 6.3 6.6
10 10 10 9
10 10 10 9
51 50 42 46
22 27 24 20
35 41 51 33
39 50 72 56
12SA1 12SA2 12SA3 12SA4
6.8 6.3 6.6 6.6
10 10 10 10
10 10 10 10
54 59 51 53
27 27 32 26
36 32 50 39
70 58 55 42
12FA1 12FA2 12FA3 12FA4
6.7 6.6 6.9 7.0
8 9 9 9
8 8 9 9
52 47 48 53
25 28 20 19
52 51 62 48
61 58 65 72
24SA1 24SA2 24SA3 24SA4
6.9 7.1 6.9 6.9
10 10 9 9
10 10 8 9
54 55 51 56
26 23 24 30
62 31 30 33
82 52 50 35
24FA1 24FA2 24FA3 24FA4
6.7 7.1 7.4 7.1
3 8 6 8
3 7 4 3
39 46 47 47
23 24 23 20
39 55 43 48
73 56 62 65
48SA1 48SA2 48SA3 48SA4
7.1 7.3 7.2 7.0
4 4 7 6
4 2 5 6
37 47 54 51
13 23 26 25
62 52 46 58
69 70 68 84
48FA1 48FA2 48FA3 48FA4
7.2 6.9 7.0 7.1
0 0 0 0
0 0 0 0
41 25 34 38
14 18 20 17
34 37 36 29
50 59 50 35
96SA1 96SA2 96SA3 96SA4
6.7 6.7 6.9 7.0
0 0 0 0
0 0 0 0
2 0 2 3
1 0 2 2
38 35 33 41
45 60 51 74
96FA1 96FA2 96FA3 96FA4
6.8 6.8 6.7 6.9
0 0 0 0
0 0 0 0
0 0 2 0
0 0 5 0
19 19 36 27
34 27 67 43
Control1 Control2 Contol3 Control4
5.8 5.8 5.8 5.8
10 10 10 10
10 10 10 10
55 52 50 40
32 34 27 26
47 37 58 52
62 56 62
56
Reference1 Reference2
19 22
12 17
23 26
60 58
2 Number of living daphnids after 24 and 48 hours of exposure. Ten dahpnids were added for each sample
3 Measured in mm.
4 Measured in mm.

29
Reference3 Reference4
23 24
12 12
25 24
61 72
30
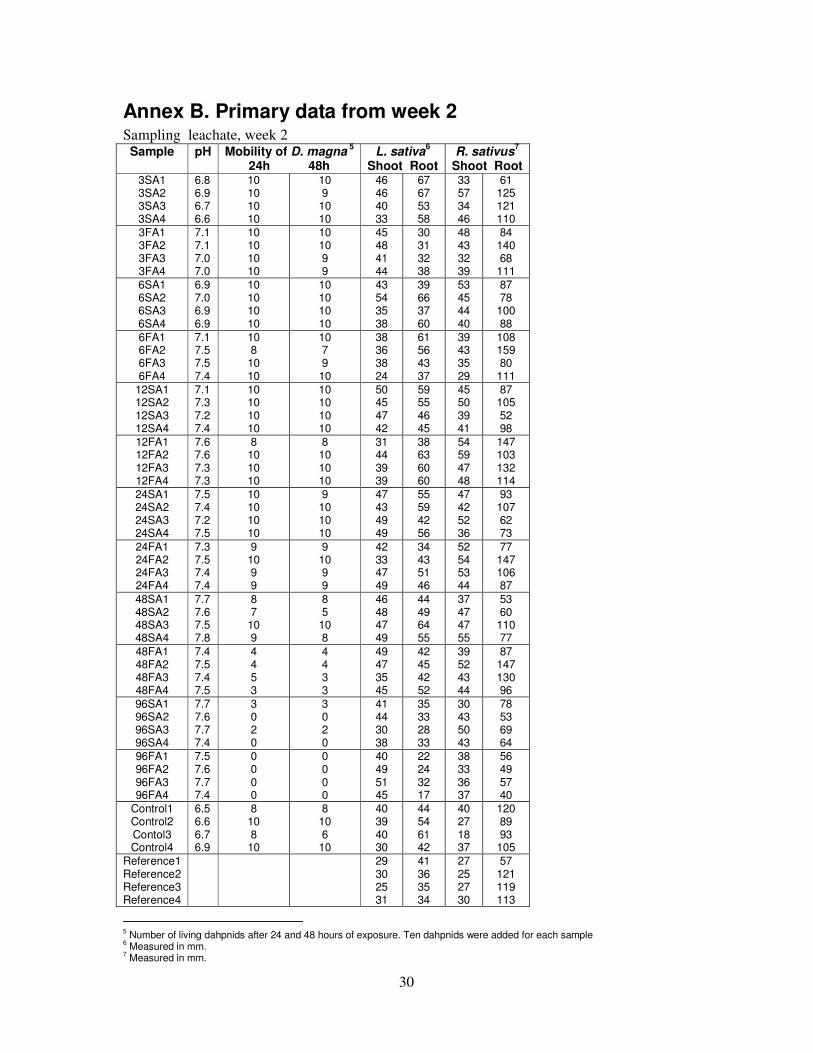
Annex B. Primary data from week 2 Sampling leachate, week 2 Sample pH Mobility of D. magna
5
24h 48h L. sativa
6
Shoot Root R. sativus
7
Shoot Root 3SA1 3SA2 3SA3 3SA4
6.8 6.9 6.7 6.6
10 10 10 10
10 9
10 10
46 46 40 33
67 67 53 58
33 57 34 46
61 125 121 110
3FA1 3FA2 3FA3 3FA4
7.1 7.1 7.0 7.0
10 10 10 10
10 10 9 9
45 48 41 44
30 31 32 38
48 43 32 39
84 140 68
111
6SA1 6SA2 6SA3 6SA4
6.9 7.0 6.9 6.9
10 10 10 10
10 10 10 10
43 54 35 38
39 66 37 60
53 45 44 40
87 78
100 88
6FA1 6FA2 6FA3 6FA4
7.1 7.5 7.5 7.4
10 8
10 10
10 7 9
10
38 36 38 24
61 56 43 37
39 43 35 29
108 159 80
111
12SA1 12SA2 12SA3 12SA4
7.1 7.3 7.2 7.4
10 10 10 10
10 10 10 10
50 45 47 42
59 55 46 45
45 50 39 41
87 105 52 98
12FA1 12FA2 12FA3 12FA4
7.6 7.6 7.3 7.3
8 10 10 10
8 10 10 10
31 44 39 39
38 63 60 60
54 59 47 48
147 103 132 114
24SA1 24SA2 24SA3 24SA4
7.5 7.4 7.2 7.5
10 10 10 10
9 10 10 10
47 43 49 49
55 59 42 56
47 42 52 36
93 107 62 73
24FA1 24FA2 24FA3 24FA4
7.3 7.5 7.4 7.4
9 10 9 9
9 10 9 9
42 33 47 49
34 43 51 46
52 54 53 44
77 147 106 87
48SA1 48SA2 48SA3 48SA4
7.7 7.6 7.5 7.8
8 7
10 9
8 5
10 8
46 48 47 49
44 49 64 55
37 47 47 55
53 60
110 77
48FA1 48FA2 48FA3 48FA4
7.4 7.5 7.4 7.5
4 4 5 3
4 4 3 3
49 47 35 45
42 45 42 52
39 52 43 44
87 147 130 96
96SA1 96SA2 96SA3 96SA4
7.7 7.6 7.7 7.4
3 0 2 0
3 0 2 0
41 44 30 38
35 33 28 33
30 43 50 43
78 53 69 64
96FA1 96FA2 96FA3 96FA4
7.5 7.6 7.7 7.4
0 0 0 0
0 0 0 0
40 49 51 45
22 24 32 17
38 33 36 37
56 49 57 40
Control1 Control2 Contol3 Control4
6.5 6.6 6.7 6.9
8 10 8
10
8 10 6
10
40 39 40 30
44 54 61 42
40 27 18 37
120 89 93
105
Reference1 Reference2 Reference3 Reference4
29 30 25 31
41 36 35 34
27 25 27 30
57 121 119 113
5 Number of living dahpnids after 24 and 48 hours of exposure. Ten dahpnids were added for each sample
6 Measured in mm.
7 Measured in mm.
31
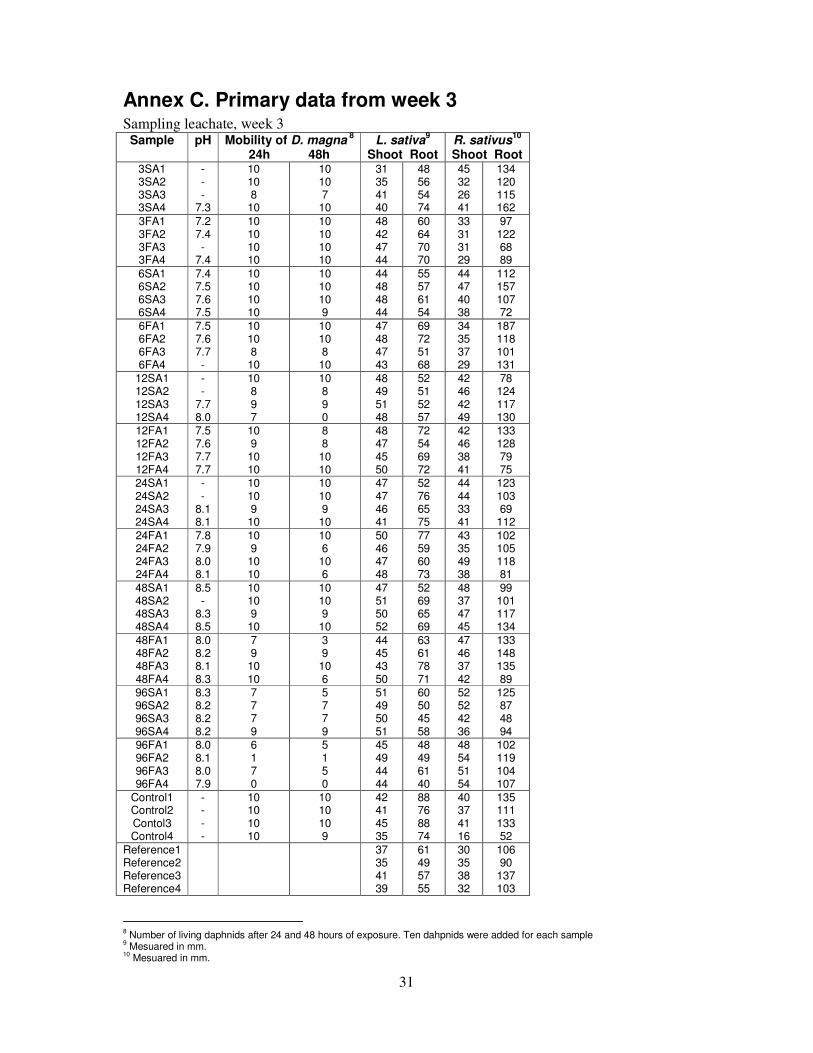
Annex C. Primary data from week 3 Sampling leachate, week 3 Sample pH Mobility of D. magna
8
24h 48h L. sativa
9
Shoot Root R. sativus
10
Shoot Root 3SA1 3SA2 3SA3 3SA4
- - -
7.3
10 10 8
10
10 10 7
10
31 35 41 40
48 56 54 74
45 32 26 41
134 120 115 162
3FA1 3FA2 3FA3 3FA4
7.2 7.4 -
7.4
10 10 10 10
10 10 10 10
48 42 47 44
60 64 70 70
33 31 31 29
97 122 68 89
6SA1 6SA2 6SA3 6SA4
7.4 7.5 7.6 7.5
10 10 10 10
10 10 10 9
44 48 48 44
55 57 61 54
44 47 40 38
112 157 107 72
6FA1 6FA2 6FA3 6FA4
7.5 7.6 7.7 -
10 10 8
10
10 10 8
10
47 48 47 43
69 72 51 68
34 35 37 29
187 118 101 131
12SA1 12SA2 12SA3 12SA4
- -
7.7 8.0
10 8 9 7
10 8 9 0
48 49 51 48
52 51 52 57
42 46 42 49
78 124 117 130
12FA1 12FA2 12FA3 12FA4
7.5 7.6 7.7 7.7
10 9
10 10
8 8
10 10
48 47 45 50
72 54 69 72
42 46 38 41
133 128 79 75
24SA1 24SA2 24SA3 24SA4
- -
8.1 8.1
10 10 9
10
10 10 9
10
47 47 46 41
52 76 65 75
44 44 33 41
123 103 69
112
24FA1 24FA2 24FA3 24FA4
7.8 7.9 8.0 8.1
10 9
10 10
10 6
10 6
50 46 47 48
77 59 60 73
43 35 49 38
102 105 118 81
48SA1 48SA2 48SA3 48SA4
8.5 -
8.3 8.5
10 10 9
10
10 10 9
10
47 51 50 52
52 69 65 69
48 37 47 45
99 101 117 134
48FA1 48FA2 48FA3 48FA4
8.0 8.2 8.1 8.3
7 9
10 10
3 9
10 6
44 45 43 50
63 61 78 71
47 46 37 42
133 148 135 89
96SA1 96SA2 96SA3 96SA4
8.3 8.2 8.2 8.2
7 7 7 9
5 7 7 9
51 49 50 51
60 50 45 58
52 52 42 36
125 87 48 94
96FA1 96FA2 96FA3 96FA4
8.0 8.1 8.0 7.9
6 1 7 0
5 1 5 0
45 49 44 44
48 49 61 40
48 54 51 54
102 119 104 107
Control1 Control2 Contol3 Control4
- - - -
10 10 10 10
10 10 10 9
42 41 45 35
88 76 88 74
40 37 41 16
135 111 133 52
Reference1 Reference2 Reference3 Reference4
37 35 41 39
61 49 57 55
30 35 38 32
106 90
137 103
8 Number of living daphnids after 24 and 48 hours of exposure. Ten dahpnids were added for each sample
9 Mesuared in mm.
10 Mesuared in mm.
32
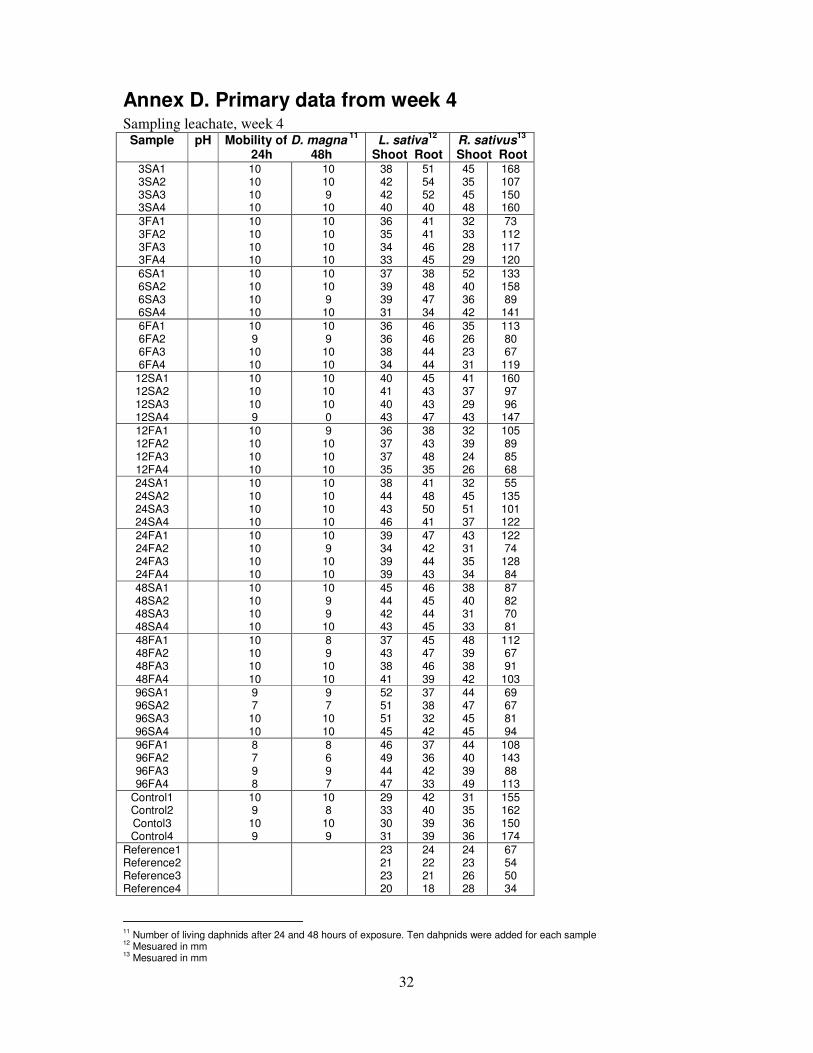
Annex D. Primary data from week 4 Sampling leachate, week 4 Sample pH Mobility of D. magna
11
24h 48h L. sativa
12
Shoot Root R. sativus
13
Shoot Root 3SA1 3SA2 3SA3 3SA4
10 10 10 10
10 10 9 10
38 42 42 40
51 54 52 40
45 35 45 48
168 107 150 160
3FA1 3FA2 3FA3 3FA4
10 10 10 10
10 10 10 10
36 35 34 33
41 41 46 45
32 33 28 29
73 112 117 120
6SA1 6SA2 6SA3 6SA4
10 10 10 10
10 10 9 10
37 39 39 31
38 48 47 34
52 40 36 42
133 158 89
141
6FA1 6FA2 6FA3 6FA4
10 9 10 10
10 9 10 10
36 36 38 34
46 46 44 44
35 26 23 31
113 80 67
119
12SA1 12SA2 12SA3 12SA4
10 10 10 9
10 10 10 0
40 41 40 43
45 43 43 47
41 37 29 43
160 97 96
147 12FA1 12FA2 12FA3 12FA4
10 10 10 10
9 10 10 10
36 37 37 35
38 43 48 35
32 39 24 26
105 89 85 68
24SA1 24SA2 24SA3 24SA4
10 10 10 10
10 10 10 10
38 44 43 46
41 48 50 41
32 45 51 37
55 135 101 122
24FA1 24FA2 24FA3 24FA4
10 10 10 10
10 9 10 10
39 34 39 39
47 42 44 43
43 31 35 34
122 74
128 84
48SA1 48SA2 48SA3 48SA4
10 10 10 10
10 9 9 10
45 44 42 43
46 45 44 45
38 40 31 33
87 82 70 81
48FA1 48FA2 48FA3 48FA4
10 10 10 10
8 9 10 10
37 43 38 41
45 47 46 39
48 39 38 42
112 67 91
103 96SA1 96SA2 96SA3 96SA4
9 7 10 10
9 7 10 10
52 51 51 45
37 38 32 42
44 47 45 45
69 67 81 94
96FA1 96FA2 96FA3 96FA4
8 7 9 8
8 6 9 7
46 49 44 47
37 36 42 33
44 40 39 49
108 143 88
113
Control1 Control2 Contol3 Control4
10 9 10 9
10 8 10 9
29 33 30 31
42 40 39 39
31 35 36 36
155 162 150 174
Reference1 Reference2 Reference3 Reference4
23 21 23 20
24 22 21 18
24 23 26 28
67 54 50 34
11
Number of living daphnids after 24 and 48 hours of exposure. Ten dahpnids were added for each sample 12
Mesuared in mm 13
Mesuared in mm
33
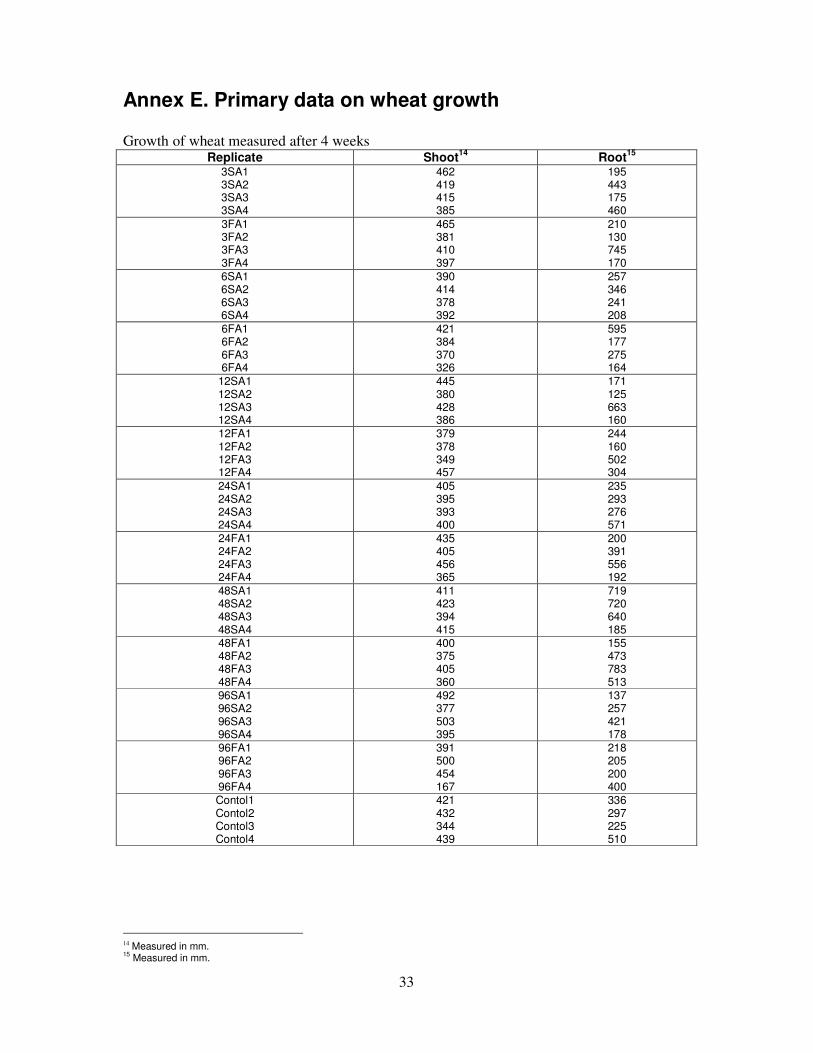
Annex E. Primary data on wheat growth Growth of wheat measured after 4 weeks
Replicate Shoot14
Root15
3SA1 3SA2 3SA3 3SA4
462 419 415 385
195 443 175 460
3FA1 3FA2 3FA3 3FA4
465 381 410 397
210 130 745 170
6SA1 6SA2 6SA3 6SA4
390 414 378 392
257 346 241 208
6FA1 6FA2 6FA3 6FA4
421 384 370 326
595 177 275 164
12SA1 12SA2 12SA3 12SA4
445 380 428 386
171 125 663 160
12FA1 12FA2 12FA3 12FA4
379 378 349 457
244 160 502 304
24SA1 24SA2 24SA3 24SA4
405 395 393 400
235 293 276 571
24FA1 24FA2 24FA3 24FA4
435 405 456 365
200 391 556 192
48SA1 48SA2 48SA3 48SA4
411 423 394 415
719 720 640 185
48FA1 48FA2 48FA3 48FA4
400 375 405 360
155 473 783 513
96SA1 96SA2 96SA3 96SA4
492 377 503 395
137 257 421 178
96FA1 96FA2 96FA3 96FA4
391 500 454 167
218 205 200 400
Contol1 Contol2 Contol3 Contol4
421 432 344 439
336 297 225 510
14 Measured in mm. 15
Measured in mm.
34
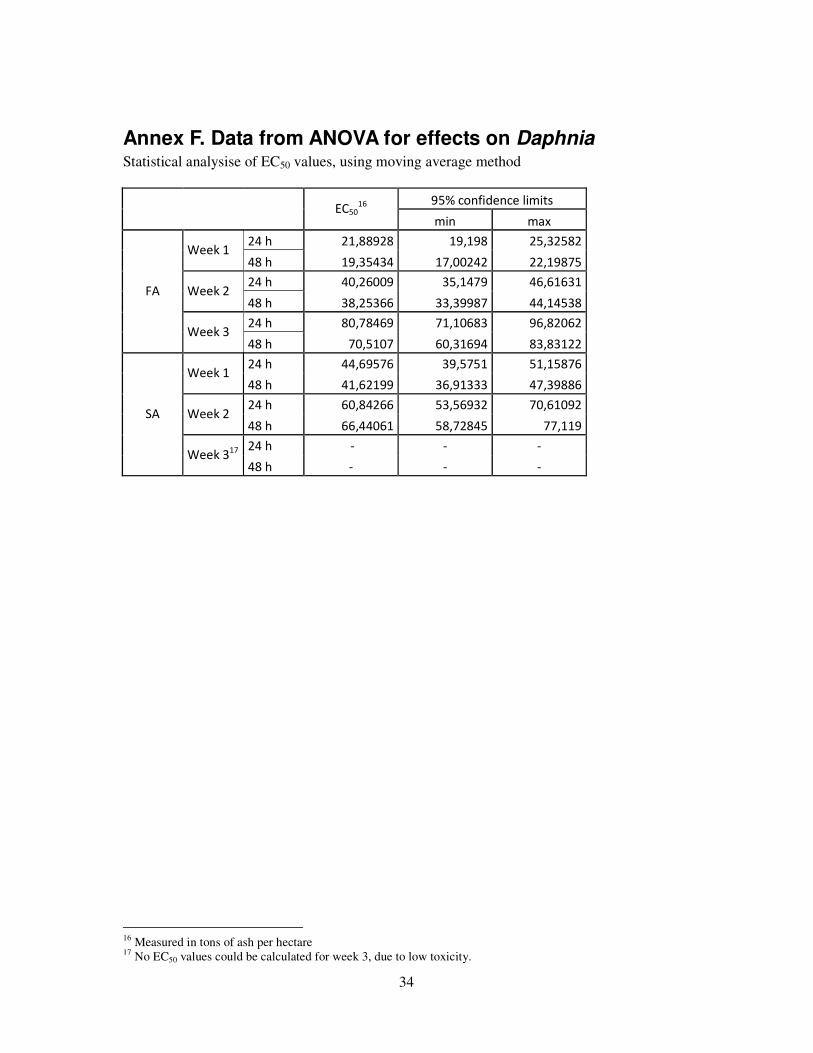
Annex F. Data from ANOVA for effects on Daphnia Statistical analysise of EC50 values, using moving average method
95% confidence limits
EC50
16
min max
24 h 21,88928 19,198 25,32582 Week 1
48 h 19,35434 17,00242 22,19875
24 h 40,26009 35,1479 46,61631 Week 2
48 h 38,25366 33,39987 44,14538
24 h 80,78469 71,10683 96,82062
FA
Week 3 48 h 70,5107 60,31694 83,83122
24 h 44,69576 39,5751 51,15876 Week 1
48 h 41,62199 36,91333 47,39886
24 h 60,84266 53,56932 70,61092 Week 2
48 h 66,44061 58,72845 77,119
24 h - - -
SA
Week 317
48 h - - -
16 Measured in tons of ash per hectare 17 No EC50 values could be calculated for week 3, due to low toxicity.


![dpv-uk.com · PDF fileEndure of Thermal shock. ... Ash Silo wz Pneumatic Ash Handling System Layout Chimney Pressue Pump Ash Silo czX-Ð] cz ESP Ash Silo ESP Ash](https://img.pdfslide.us/doc/110x75/5abd4e267f8b9a7e418b6dff/dpv-ukcom-of-thermal-shock-ash-silo-wz-pneumatic-ash-handling-system-layout.jpg)