Embed Size (px)
Citation preview
THESIS
EFFECTS OF FERAL HORSE HERDS ON PLANT COMMMUNITIES ACROSS A PRECIPITATION GRADIENT
Submitted by
Lauren Baur
Graduate Degree Program in Ecology
In partial fulfillment of the requirements
For the Degree of Master of Science
Colorado State University
Fort Collins, Colorado
Fall 2016
Master’s Committee:
Advisor: Melinda D. Smith
Kathryn A. Schoenecker Paul Meiman

Copyright by Lauren Baur 2016
All Rights Reserved
ii
ABSTRACT
EFFECTS OF FERAL HORSE HERDS ON PLANT COMMMUNITIES ACROSS A PRECIPITATION GRADIENT
Feral horse herds in the western United States are managed with the goal of maintaining “a
thriving natural ecological balance” with their environment. Because rangeland ecology is complex and
grazers such as horses can have different effects under different environmental conditions, more data
are needed to better inform Appropriate Management Levels and other management decisions. We
used long-term grazing exclosures and fenceline contrasts to evaluate the impacts of feral horses on
plant communities at five sites across the western United States. These sites ranged from 229 to 413
mm mean annual precipitation and represented four different ecosystems (Great Basin desert, Colorado
Plateau, Rocky Mountain grassland and mixed grass prairie). We found that feral horses significantly
reduced grass biomass and total biomass at alpha=0.1, but did not have a significant effect on plant
community composition, species richness, diversity, evenness, or dominance. The effects of horses did
not vary by site, indicating that different precipitation levels are not driving differences in grazing effects
within the range encompassed by our sites. In other words, our results imply that while feral horses do
reduce plant biomass, they are not causing plant community shifts, and their effects may not be as site-
specific as has been assumed. Additional multi-site studies, preferably with standardized exclosures and
larger sample sizes, would increase our understanding of feral horse grazing effects.

iii
ACKNOWLEDGEMENTS
Thanks to my supportive family and friends. To my committee, Melinda Smith, Kate
Schoenecker, and Paul Meiman. Thanks to the US Geological Survey for funding, and to everyone from
the Bureau of Land Management, National Park Service, US Geological Survey and US Forest Service who
made this project possible, including: John Axtell, Bill Pickett, Jared Bybee, Jim Sparks, Mike Jensen, Stan
Kitchen, Elizabeth Burghard, Bill Whitworth, Chad Sexton, and Martina Thornton. To Ken, the BLM range
tech who set up my rain bucket at Clan Alpine. To my hardworking and intrepid field assistant Mariah
Patton, and lab assistants Abby, Jennie and Claire. Thanks to Phil Turk for statistics help, and to Nate
Lemoine for help with data analysis and figures. To Jesse Gray for fieldwork help and Jennifer Ackerfield
for plant ID help. To everyone who took a look at some plant that was stumping me. To Mike Bynum,
who taught me many of the plant ID skills I needed to do this project. To Jennifer Radcliffe for
manuscript comments. To TJ Holmes at Spring Creek Basin for sharing her time, knowledge and
positivity, and to her family for the food and conversation. And thanks to everyone else who made our
fieldwork more pleasant including Carol and Steve, Dave and his family in Fallon, Ivan and Lloyd in
Naturita, and Art and Nancy at Bighorn Canyon. Finally, thanks to CSU motorpool; sorry about all the
wear and tear on that truck.
iv
TABLE OF CONTENTS
ABSTRACT .................................................................................................................................................... ii ACKNOWLEDGEMENTS .............................................................................................................................. iii 1.0 INTRODUCTION .................................................................................................................................... 1 2.0 METHODS ............................................................................................................................................. 4
2.1 Study sites ...................................................................................................................................... 4 2.2 Experimental design ...................................................................................................................... 8 2.3 Species composition sampling ....................................................................................................... 8 2.4 Fecal transects ............................................................................................................................... 9 2.5 Biomass sampling ........................................................................................................................... 9 2.6 Statistical analysis ........................................................................................................................10
3.0 RESULTS ..............................................................................................................................................13 3.1 Plant community response to feral horse grazing .......................................................................13 3.2 Long-term effects of feral horse grazing on biomass ..................................................................13 3.3 Short-term grazing intensity and annual utilization ....................................................................14
4.0 DISCUSSION ........................................................................................................................................20 5.0 FUTURE RESEARCH .............................................................................................................................26 REFERENCES ..............................................................................................................................................28 APPENDIX: SUPPLEMENTARY TABLE .........................................................................................................32
1
INTRODUCTION
Feral horses are widespread in the western United States, and the nature of their ecological role
has often been a source of controversy. While the effects of cattle grazing on western rangelands have
been thoroughly studied (e.g. Kauffman and Krueger 1984, Belsky et al. 1999, Jones 2000), the impacts
of feral horses have received less attention (Beever 2003, Nimmo and Miller 2007). The effect of feral
horses on rangelands west of the Rocky Mountains is of particular importance given that a large
majority of federally managed feral horse herds and herd management areas (HMAs) are found in that
region, on land managed by the Bureau of Land Management (BLM). However, most studies of feral
horse grazing effects in North America have been conducted in salt marshes of the East Coast (Wood et
al. 1987, Turner 1987, Turner 1988, Furbish and Albano 1994, Seliskar 2003, De Stoppelaire et al. 2004)
and the Pryor Mountain Wild Horse Range of northern Wyoming/Southern Montana (Detling 1998,
Gerhardt 2000, Gerhardt and Detling 2000, Fahnestock and Detling 2000), with a limited number of
studies conducted in the Great Basin (Beever and Brussard 2000, Beever et al. 2003, Beever et al. 2008,
Davies et al. 2014) or other western rangelands. Thus, we still lack basic understanding of the effects of
feral horse grazing on rangelands of the western US, despite the fact that this represents a critical
knowledge gap for effective rangeland management.
When compared to other ungulates, feral horses are expected to differ in their effects on
rangeland plant communities because of differences in their digestive anatomy, as well as their grazing
behavior. Although horses and cattle share a high dietary overlap (Scasta 2014), horses have higher
energy requirements than cattle (Hanley 1982, Duncan et al. 1990). As cecal digesters rather than
ruminants, they digest their food less completely, and retain most forage for a shorter time in their
digestive tract (Duncan et al. 1990). Therefore, horses need to eat more plant biomass per unit of body
mass than cattle (Janis 1976, Holechek 1988, Duncan et al. 1990, Menard et al. 2002, Scasta 2014). On
2
the other hand, unlike ruminants, equids can live on a high-cellulose diet (Gwynne and Bell 1968, Janis
1976), enabling them to survive and even thrive in habitat that would be considered low quality for
other ungulates. Horses also differ from cattle in their grazing behavior. While cattle prefer to stay near
water sources (Kauffman and Krueger 1984, Beever 2003), horses are able to range farther from water
(Beever and Brussard 2000). Although Crane et al. (1997) found that feral horses in Wyoming spent
proportionally more time in riparian habitat than in other habitat types, Ganskopp and Vavra (1986) did
not observe such a preference among feral horses in Oregon. Horses also show a preference for higher
elevation habitats (Ganskopp and Vavra 1986, Crane et al. 1997). This may mean horses cause less
damage than cattle around water sources, but it also means that plants that might survive in high-
elevation refuges when only cattle are present are more likely to be grazed when horses are present
(Symanski 1994, Beever 2003, Beever and Aldridge 2011). Because of these differences, relying on
studies of cattle grazing effects to inform management of feral horse herds and HMAs is not
appropriate. Instead, improved information on the specific effects of feral horse grazing is needed.
While there have been some studies of the effects of feral horses on plants in rangelands of the
Intermountain West (Beever and Brussard 2000, Beever et al. 2003, Beever et al. 2008, Davies et al.
2014), the number of sites that has been studied is small compared to the area where feral horses are
found. However, grazing effects on plant communities can be locally specific and dependent on local
environmental conditions (Milchunas et al. 1988, Menke and Bradford 1992, Hobbs 1996, Ostermann-
Kelm et al. 2009, Beever and Aldridge 2011). For example, the magnitude and direction of grazing
effects on plant diversity appears to be influenced by the productivity of a site, which is correlated with
precipitation level (Milchunas et al. 1988, Milchunas and Lauenroth 1993, Frank 2005, Bakker et al.
2006, Lezama et al. 2014). In productive grasslands, grazing often increases plant diversity, while in less
productive grasslands, grazing can reduce diversity (Bakker et al. 2006, Lezama et al 2014, Koerner et al.
in prep). In addition, the magnitude of grazing effects tends to increase with increasing productivity
3
(Milchunas and Lauenroth 1993, Lezama et al. 2014). Thus, to more comprehensively understand the
impacts of feral horse grazing in the western US, studies across a range of environmental conditions are
required.
The purpose of this study was to assess the effects of feral horse grazing on plant communities
at five sites that span a large portion of the geographic area where feral horses are found in the western
US. These sites cover a range of precipitation from 229 to 413 mm/yr, and represent four different
rangeland ecosystems (Great Basin desert, Colorado Plateau, Rocky Mountain grasslands, and mixed
grass prairie). In an effort to capture long-term effects, the project was limited to sites with preexisting
exclosures or fenceline contrasts. Because of previous studies showing such a relationship between
grazing effects and productivity or precipitation, we hypothesized that horse grazing would increase
plant species richness and diversity at wetter sites, and decrease them at drier sites. We also predicted
that the magnitude of grazing effects would increase with increasing precipitation.
4
METHODS
Study sites
For this study, we selected five rangeland sites which had preexisting exclosures or fencelines
separating areas grazed by feral horses from areas not grazed by feral horses (Figure 1). Length of
treatment ranged from about 10 years at the Colorado site to 81 years at the Utah site (Table 1). The
sites spanned a precipitation gradient from about 229 mm/yr in Nevada to 413 mm/yr in Colorado.
Because most of our sites were remote and lacked long-term precipitation records, we defined this
gradient based on interpolated mean annual precipitation data from the Terrestrial Precipitation
Analysis package (TPA) (Lemoine et al. 2016).
The driest site, Clan Alpine Herd Management Area (abbreviated as CA), is located in Churchill
County, NV. It has an approximate mean annual precipitation of 229 mm. All of our sampling plots at CA
were located in the same Natural Resource Conservation Service soil map unit, the Old Camp-Singatse-
Rock outcrop association, the largest component of which is the Loamy Slope 8-10 P.Z. (R027XY007NV)
ecological site (NRCS 2016). In the area of the HMA where we sampled, the vegetation includes both
riparian and nonriparian species, dominated by the invasive annual grass Bromus tectorum (L.), native
saltgrass (Distichlis spicata (L.) Greene), and bluegrasses (Poa spp. L.), along with some shrubs including
Sarcobatus vermiculatus (Hook.) Torr., and exotic forbs such as Salsola spp. L. and Kochia spp. Roth.
The second driest site was the Sulphur Herd Management Area (Sulphur) in Millard County, UT,
also in the Great Basin, with a mean annual precipitation of 332 mm. Although National Resource
Conservation Service soil data were not available for this site, soils in the area are gravelly loams, sandy
loams, and loamy sands (Clary and Holmgren 1982). The site is dominated by black sagebrush (Artemisia
nova A. Nelson), rabbitbrush (Chrysothamnus spp. Nutt) and snakeweed (Gutierrezia sarothrae (Pursh)
Britton and Rusby). Native bunchgrasses like Hesperostipa comata (Trin. & Rupr.) Barkworth, Elymus
5
elymoides (Raf.) Swezey, and Achnatherum hymenoides (Roem. & Schult.) Barkworth, as well as Bromus
tectorum, are fairly prevalent.
The third site was the Pryor Mountain Wild Horse Range (PM) in Carbon County, MT/Big Horn
County, WY. This site is in the Bighorn Mountains and has been described as “Rocky Mountain
grassland” (Gerhardt and Detling 1998, Stohlgren et al. 1999), with mean annual precipitation of about
352 mm. Three of our exclosures at this site were located in the Silty-Limy (SiLy) RRU 46-S 10-14" p.z.
(R046XS141MT), Silty (Si) RRU 58A-C 11-14" p.z. (R058AC040MT), and Loamy (Lo) 5-9" p.z.
(R032XC020MT) ecological sites, while the fourth was located on limestone outcrop (NRCS 2016). The
vegetation at Pryor Mountain is dominated by grasses like Pseudoregneria spicata (Pursh) Á. Löve and
Bouteloua gracilis (Kunth) Lag. ex Griffiths, with the shrubs Artemisia nova and Cercocarpus ledifolius
Nutt. also important in some locations.
The fourth site was Theodore Roosevelt National Park (THRO) in Billings County, ND. It is in the
Great Plains region, with an average annual precipitation of 389 mm. Although this site was only the
second wettest according the interpolated data, it was by far the most productive (see Figure 4). Our
sampling plots were located in the park’s South Unit, and covered several ecological sites and soil types,
with plots farther east being on sandier soils, and those farther west on more clayey soils, with loamy
soils also represented throughout (NRCS 2016). The park is mostly mixed grass prairie, with some area
covered in badlands formations and woodlands. The park is dominated by native graminoids such as
Elymus elymoides, Carex inops L.H. Bailey, and Bouteloua curtipendula (Michx.) Torr., though nonnative
Kentucky bluegrass (Poa pratensis L.) is also abundant (Ashton and Prowatzke 2014).
The fifth and wettest site was Spring Creek Basin Herd Management Area (SCB), in San Miguel
County, CO, on the Colorado Plateau. According to TPA, this site has an annual precipitation of 413 mm.
Despite being the wettest site, SCB was less productive than THRO, probably due to differences in
temperature/aridity and soil fertility. Our sampling at this site took place on Silty Saltdesert
6
(R035XY410CO), Basin Shale (R035XY408CO), and Clayey Saltdesert (R035XY403CO) ecological sites
(NRCS 2016). The vegetation at SCB is characterized by shrubs including Atriplex canescens (Pursh) Nutt.,
Sarcobatus vermiculatus (Hook.) Torr, and Krascheninnikovia lanata (Pursh) A. Meeuse & A. Smit, as well
as native perennial bunchgrasses like Hilaria jamesii (Torr.) Benth and Sporobolus cryptandrus (Torr.) A.
Gray. Bromus tectorum is also common.
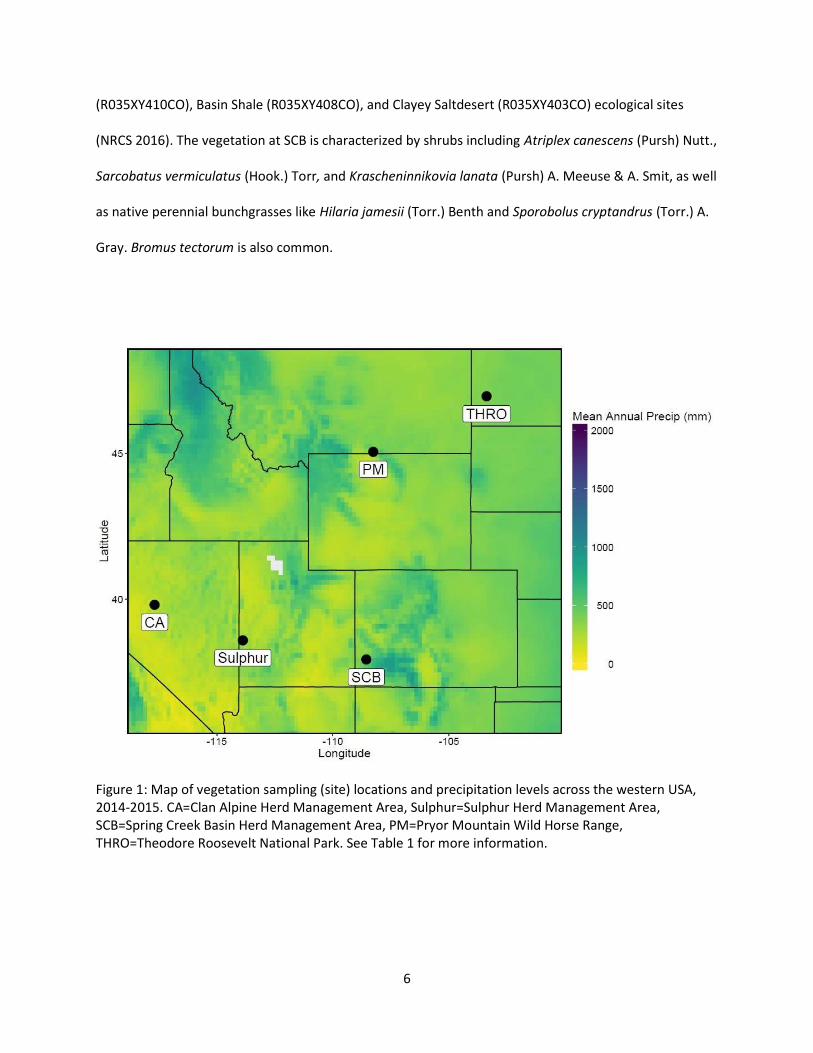
Figure 1: Map of vegetation sampling (site) locations and precipitation levels across the western USA, 2014-2015. CA=Clan Alpine Herd Management Area, Sulphur=Sulphur Herd Management Area, SCB=Spring Creek Basin Herd Management Area, PM=Pryor Mountain Wild Horse Range, THRO=Theodore Roosevelt National Park. See Table 1 for more information.
7
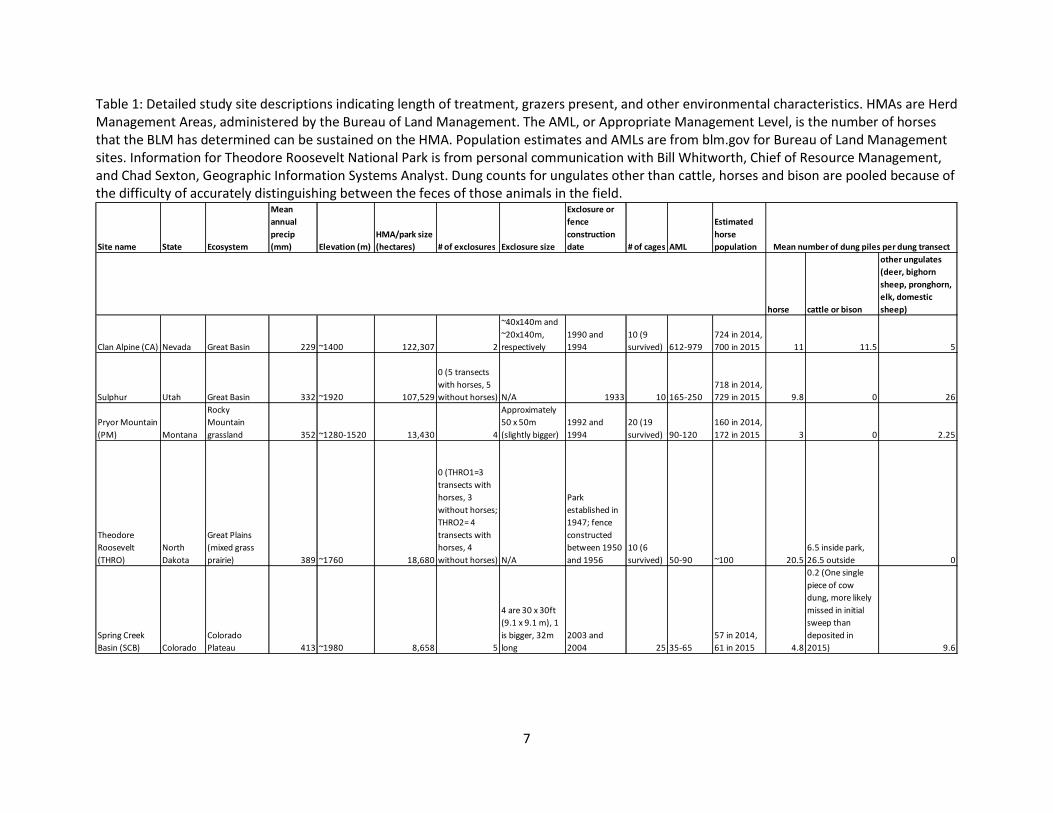
Table 1: Detailed study site descriptions indicating length of treatment, grazers present, and other environmental characteristics. HMAs are Herd Management Areas, administered by the Bureau of Land Management. The AML, or Appropriate Management Level, is the number of horses that the BLM has determined can be sustained on the HMA. Population estimates and AMLs are from blm.gov for Bureau of Land Management sites. Information for Theodore Roosevelt National Park is from personal communication with Bill Whitworth, Chief of Resource Management, and Chad Sexton, Geographic Information Systems Analyst. Dung counts for ungulates other than cattle, horses and bison are pooled because of the difficulty of accurately distinguishing between the feces of those animals in the field.
Site name State Ecosystem
Mean annual precip (mm) Elevation (m)
HMA/park size (hectares) # of exclosures Exclosure size
Exclosure or fence construction date # of cages AML
Estimated horse population
horse cattle or bison
other ungulates (deer, bighorn sheep, pronghorn, elk, domestic sheep)
Clan Alpine (CA) Nevada Great Basin 229 ~1400 122,307 2
~40x140m and ~20x140m, respectively
1990 and 1994
10 (9 survived) 612-979
724 in 2014, 700 in 2015 11 11.5 5
Sulphur Utah Great Basin 332 ~1920 107,529
0 (5 transects with horses, 5 without horses) N/A 1933 10 165-250
718 in 2014, 729 in 2015 9.8 0 26
Pryor Mountain (PM) Montana
Rocky Mountain grassland 352 ~1280-1520 13,430 4
Approximately 50 x 50m (slightly bigger)
1992 and 1994
20 (19 survived) 90-120
160 in 2014, 172 in 2015 3 0 2.25
Theodore Roosevelt (THRO)
North Dakota
Great Plains (mixed grass prairie) 389 ~1760 18,680
0 (THRO1=3 transects with horses, 3 without horses; THRO2= 4 transects with horses, 4 without horses) N/A
Park established in 1947; fence constructed between 1950 and 1956
10 (6 survived) 50-90 ~100 20.5
6.5 inside park, 26.5 outside 0
Spring Creek Basin (SCB) Colorado
Colorado Plateau 413 ~1980 8,658 5
4 are 30 x 30ft (9.1 x 9.1 m), 1 is bigger, 32m long
2003 and 2004 25 35-65
57 in 2014, 61 in 2015 4.8
0.2 (One single piece of cow dung, more likely missed in initial sweep than deposited in 2015) 9.6
Mean number of dung piles per dung transect
8
Experimental design
Because we were sampling preexisting exclosures and fencelines of different sizes, sampling
layout varied somewhat between sites (Table 1). Three of the sites (CA, PM and SCB) had preexisting
grazing exclosures, and data were collected inside and outside each exclosure. Clan Alpine differs from
the other sites in that its exclosures were built to protect springs. In 2014 our sampling protocol at CA
was similar to that of Beever and Brussard (2000); we located species composition transects inside
exclosures at exclosed springs and in grazed areas at nearby springs without exclosures. In 2015 we
added transects immediately outside the exclosures at the exclosed springs. Given these differences in
sampling, CA species composition data were included in analysis for 2015, but not 2014. However, plant
species richness, evenness, diversity and dominance were still calculated for 2014 (Supplementary Table
1).
Sulphur and THRO did not have grazing exclosures, but each site had a fenceline with horses
confined to one side. Sulphur HMA is separated by a fenceline from the USDA Forest Service’s Desert
Experimental Range (DER); horses graze on the BLM side but not the DER side. At THRO, we sampled in
the park’s South Unit, where the horses are confined inside the park fence and mostly on the east side
of the Little Missouri River which bisects the park. In 2014 we placed transects on either side of the
river. In 2015 we added transects on either side of the park fence. We treated these two groups of
transects as separate “sites” for analysis (THRO1 and THRO2).
Species composition sampling
To assess plant species composition, we recorded absolute percent cover of all plant species
within square 1m x 1m quadrats, placed every 2 m along transects inside and outside the permanent
exclosures or on either side of the fenceline. Most transects were 50 m long, but at Spring Creek Basin
the exclosures were too small, so we used multiple shorter transects. Some larger exclosures had
9
multiple 50-m transects inside to increase sampling. For each quadrat, we visually estimated aerial cover
of each species separately to the nearest 1%. We also estimated the percent cover of biological soil
crust, and of totally exposed ground covers including bare ground, rock, and litter where they exceeded
a contiguous 1% of the quadrat. In 2015 we also noted all animal dung inside quadrats to confirm the
identity of grazers that were present. Species composition data were collected at each site once in 2014
and twice in 2015 (early and late in the growing season); the larger of the two values for each species in
2015 was used in subsequent analyses.
Fecal transects
To assess the level of use of our sampling sites by herbivores, in 2015 we used dung transects
consisting of two 50-m tapes placed 4 m apart running parallel to our species composition transects,
outside exclosures, or on the side of the fence with horses, at each site except THRO1. One transect at
Sulphur and two at THRO2 were also placed on the side of the fence without horses. During our first
sampling trip of 2015, we cleared all large animal dung from the area between the tapes, recording the
number of dung piles. We repeated this process on our second sampling trip to see how many dung
piles had been added since the first trip. No statistical analyses were performed on these data; instead,
we used average number of piles per transect as a general metric of herbivore presence (see Table 1).
Biomass sampling
We constructed small temporary exclosures (“cages”), each 1 x 1 x 1 m in size, and installed
them outside permanent exclosures or in horse-grazed areas at each site in spring 2015. In late summer,
we collected all aboveground herbaceous biomass inside 0.25 m2 circular frames. For each cage, we
clipped one frame inside the cage, one frame approximately 1-2 m outside the cage, and one inside the
permanent exclosure. At the time the cages were placed, we determined where to place each outside
10
frame by comparing the area up to ~2m away from the cage on each of its four sides, and choosing the
side of each cage that had the most plant species in common with the area inside the cage. Since we
were not collecting biomass from woody plants, we avoided placing the cages and their corresponding
outside frames directly on top of shrubs. If multiple sides of the cage had the same species in common
with the area inside the cage, the side that seemed to be most similar in biomass to the area inside the
cage, based on a casual visual estimate at the time the cages were installed, was chosen. Frames inside
the permanent exclosures were placed by randomly tossing them into the exclosure and clipping where
they fell. Biomass was divided into three categories: grass (including other graminoids such as sedges),
forbs, and litter. Biomass was field-dried and then dried in drying ovens in the lab for at least 24 hours at
60°C before weighing.
Statistical analysis
For species composition data, the experimental unit for analysis was the plot level. In most
cases, each plot consisted of all quadrats inside or outside a single permanent exclosure. However, at
Sulphur, each 50m transect was considered a plot, meaning the site had a total of five plots with horse
grazing and five plots without. At THRO1, each plot consisted of three transects (meaning there was only
one plot per treatment), and at THRO2, each plot consisted of two transects (two plots per treatment).
(Transects were grouped into plots based on their proximity to each other. At Sulphur, the transects
were roughly evenly spaced along the fenceline, while at THRO1 and THRO2, transects were more
clustered due to topography.) Mean species richness, evenness, diversity (eH’), and Berger-Parker
dominance were calculated at the quadrat level and then averaged at the plot level to avoid bias caused
by the fact that not all plots had an equal number of quadrats. For CA, these calculations were done
using all available data for 2014, but grazed plots without corresponding ungrazed plots were dropped
11
from the 2015 data. An alpha level of 0.1 was set for all analyses, and 2014 and 2015 data were analyzed
separately.
The plot-level values of species richness, evenness, diversity (eH’), and dominance were
analyzed using a mixed linear model with PROC MIXED in SAS® version 9.4 (SAS Institute Inc., Cary, NC,
USA). Factors were site and grazing (i.e., feral horses present or not), with the grazing treatment nested
within site. A similar mixed linear model was used to analyze grass, forb and total herbaceous biomass
(hereafter “total biomass”) inside and outside permanent exclosures. In both models, effects of grazing
treatment, site, and treatment by site interactions were assessed. Although data were collected on litter
biomass, those data were not used in analyses.
As mentioned above, the layout used for species composition sampling at Clan Alpine differed
from that used at other sites in that some grazed plots did not have corresponding ungrazed plots,
meaning some data could not be used in the analyses to assess site or grazing effects. Because of this,
CA was not included in statistical analysis for 2014. For 2015 sampling, new transects were added, and
two grazed plots at CA without corresponding ungrazed plots were dropped from the analysis for 2015.
At THRO the groups of transects established in 2014 and 2015, respectively, were designated as
separate “sites” (THRO1 and THRO2) in the analyses.
To assess differences in plant community composition, community matrices were constructed,
consisting of relativized mean percent cover per quadrat of each species in each plot. These community
matrices were used to construct Bray-Curtis resemblance matrices. The resemblance matrices were
analyzed using two-factor permanovas (Primer v6), with site and treatment (with vs. without horses) as
factors, with treatment nested within site.
To assess short-term grazing effects/utilization (i.e., to compare biomass inside and outside
temporary exclosures), t-tests were conducted in SAS with PROC TTEST. Biomass was averaged across all
temporary exclosures and all corresponding grazed plots for each site, and those averages were used to

12
calculate 2015 growing season offtake ((ungrazed-grazed)/ungrazed) for each site (McNaughton 1979,
Bonham 1989).
13
RESULTS
Plant community response to feral horse grazing
In 2014 (Figure 2) and 2015 (Figure 3), richness, diversity (eH’) and dominance, but not evenness,
varied significantly by site at alpha=0.1. However, there were no significant grazing effects, and grazing
by site interactions were not significant (Table 2). Two-factor permanovas showed that, as expected,
plant community composition differed significantly among the five study sites (p=0.005 for both 2014
and 2015). However, plant community composition was not different between grazed vs. ungrazed plots
(p=0.987 for 2014 and p=0.969 for 2015). Individual single-factor permanovas performed separately for
each site in each year also failed to find any significant effect of grazing on community composition at
any individual site (p>0.1, data not shown).
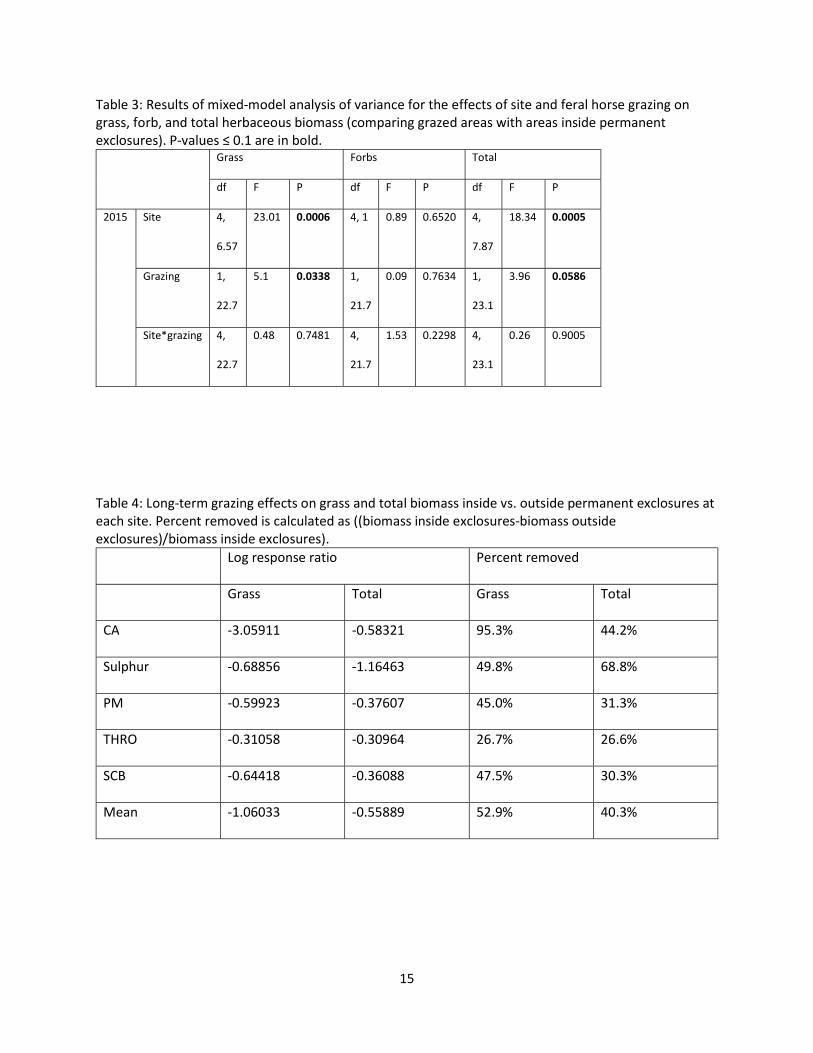
Long-term effects of feral horse grazing on biomass
Averaging across all treatments (inside permanent exclosures, inside temporary exclosures, and
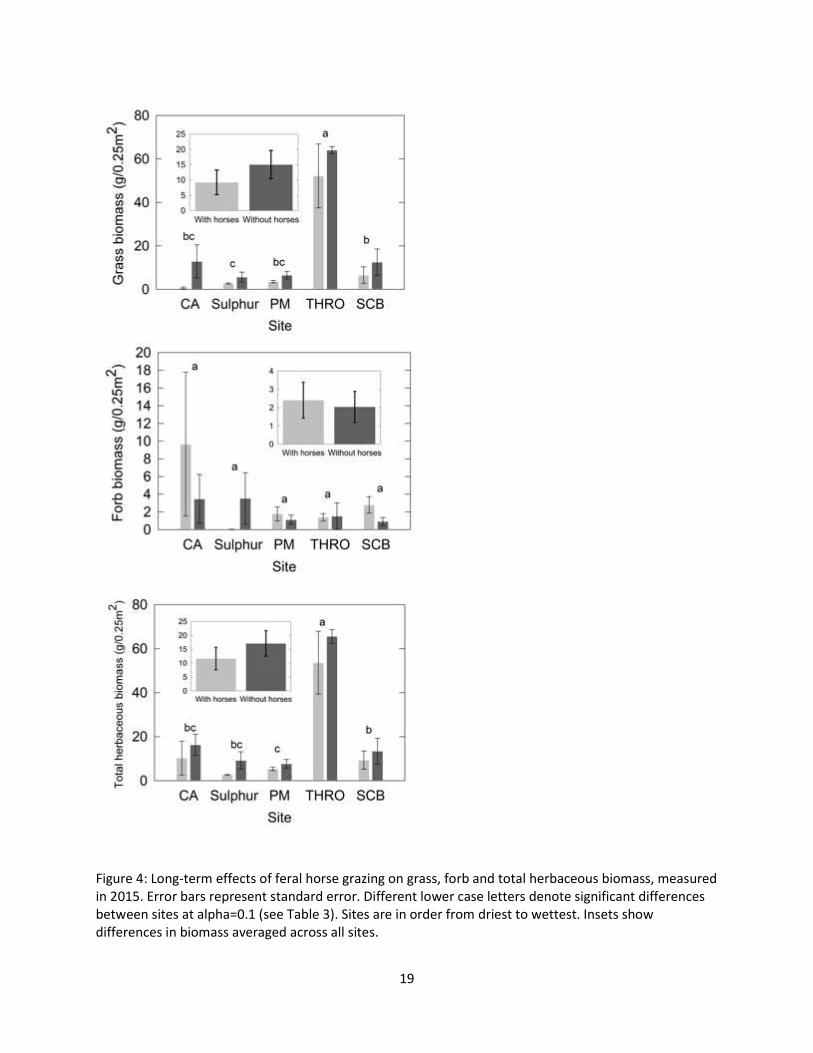
outside), THRO had by far the highest total biomass, followed by CA, SCB, PM and Sulphur (Figure 4).
Total biomass and grass biomass differed significantly by site and with grazing. Forb biomass did not
differ significantly between sites or with grazing (Table 3). Across sites, grazed areas had a mean of
52.9% less grass biomass and 40.3% less total biomass than areas experiencing long-term exclosure from
wild horse grazing. (These percentages are calculated as percent removed; see Table 4.) CA was an
outlier with 95.3% less grass biomass outside than inside permanent exclosures. However, interactions
between site and grazing were not significant for total, grass, or forb biomass (Table 3).
14
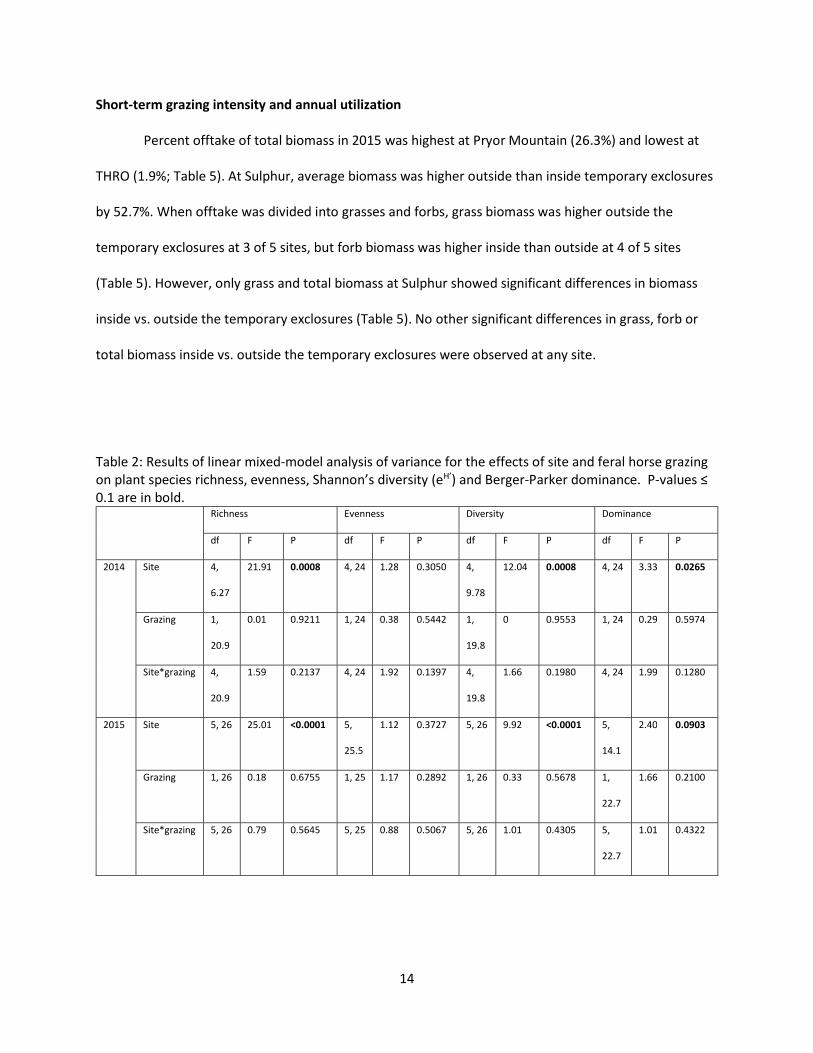
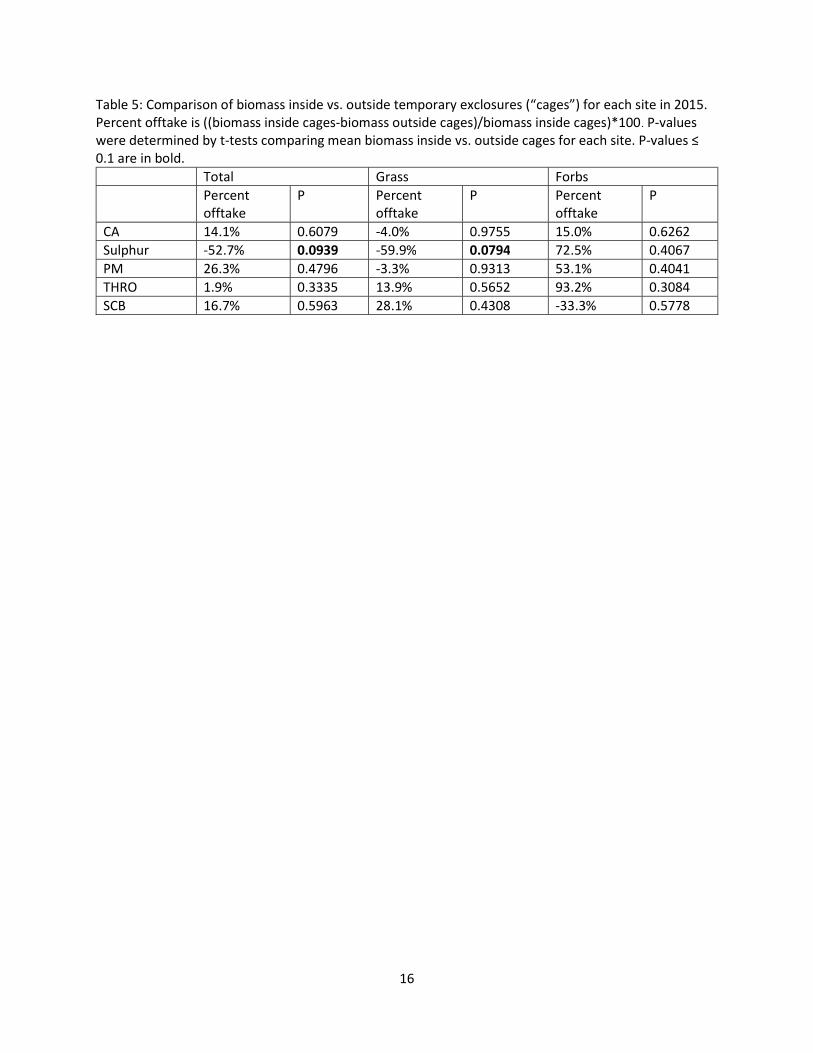
Short-term grazing intensity and annual utilization
Percent offtake of total biomass in 2015 was highest at Pryor Mountain (26.3%) and lowest at
THRO (1.9%; Table 5). At Sulphur, average biomass was higher outside than inside temporary exclosures
by 52.7%. When offtake was divided into grasses and forbs, grass biomass was higher outside the
temporary exclosures at 3 of 5 sites, but forb biomass was higher inside than outside at 4 of 5 sites
(Table 5). However, only grass and total biomass at Sulphur showed significant differences in biomass
inside vs. outside the temporary exclosures (Table 5). No other significant differences in grass, forb or
total biomass inside vs. outside the temporary exclosures were observed at any site.
Table 2: Results of linear mixed-model analysis of variance for the effects of site and feral horse grazing on plant species richness, evenness, Shannon’s diversity (eH’) and Berger-Parker dominance. P-values ≤ 0.1 are in bold.
Richness Evenness Diversity Dominance
df F P df F P df F P df F P
2014 Site 4,
6.27
21.91 0.0008 4, 24 1.28 0.3050 4,
9.78
12.04 0.0008 4, 24 3.33 0.0265
Grazing 1,
20.9
0.01 0.9211 1, 24 0.38 0.5442 1,
19.8
0 0.9553 1, 24 0.29 0.5974
Site*grazing 4,
20.9
1.59 0.2137 4, 24 1.92 0.1397 4,
19.8
1.66 0.1980 4, 24 1.99 0.1280
2015 Site 5, 26 25.01 <0.0001 5,
25.5
1.12 0.3727 5, 26 9.92 <0.0001 5,
14.1
2.40 0.0903
Grazing 1, 26 0.18 0.6755 1, 25 1.17 0.2892 1, 26 0.33 0.5678 1,
22.7
1.66 0.2100
Site*grazing 5, 26 0.79 0.5645 5, 25 0.88 0.5067 5, 26 1.01 0.4305 5,
22.7
1.01 0.4322
15
Table 3: Results of mixed-model analysis of variance for the effects of site and feral horse grazing on grass, forb, and total herbaceous biomass (comparing grazed areas with areas inside permanent exclosures). P-values ≤ 0.1 are in bold.
Grass Forbs Total
df F P df F P df F P
2015 Site 4,
6.57
23.01 0.0006 4, 1 0.89 0.6520 4,
7.87
18.34 0.0005
Grazing 1,
22.7
5.1 0.0338 1,
21.7
0.09 0.7634 1,
23.1
3.96 0.0586
Site*grazing 4,
22.7
0.48 0.7481 4,
21.7
1.53 0.2298 4,
23.1
0.26 0.9005
Table 4: Long-term grazing effects on grass and total biomass inside vs. outside permanent exclosures at each site. Percent removed is calculated as ((biomass inside exclosures-biomass outside exclosures)/biomass inside exclosures).
Log response ratio Percent removed
Grass Total Grass Total
CA -3.05911 -0.58321 95.3%
44.2%
Sulphur -0.68856 -1.16463 49.8% 68.8%
PM -0.59923 -0.37607 45.0% 31.3%
THRO -0.31058 -0.30964 26.7% 26.6%
SCB -0.64418 -0.36088 47.5% 30.3%
Mean -1.06033 -0.55889 52.9% 40.3%
16
Table 5: Comparison of biomass inside vs. outside temporary exclosures (“cages”) for each site in 2015. Percent offtake is ((biomass inside cages-biomass outside cages)/biomass inside cages)*100. P-values were determined by t-tests comparing mean biomass inside vs. outside cages for each site. P-values ≤ 0.1 are in bold.
Total Grass Forbs Percent
offtake P Percent
offtake P Percent
offtake P
CA 14.1% 0.6079 -4.0% 0.9755 15.0% 0.6262 Sulphur -52.7% 0.0939 -59.9% 0.0794 72.5% 0.4067 PM 26.3% 0.4796 -3.3% 0.9313 53.1% 0.4041 THRO 1.9% 0.3335 13.9% 0.5652 93.2% 0.3084 SCB 16.7% 0.5963 28.1% 0.4308 -33.3% 0.5778

17
Figure 2: Effects of feral horse grazing on plant species richness, evenness, Shannon’s diversity (eH’), and Berger-Parker dominance per m2 in 2014. Error bars represent standard error. Different lower case letters denote significant differences between sites at alpha=0.1. Sites are in order from driest (lowest precipitation) to wettest (highest precipitation).
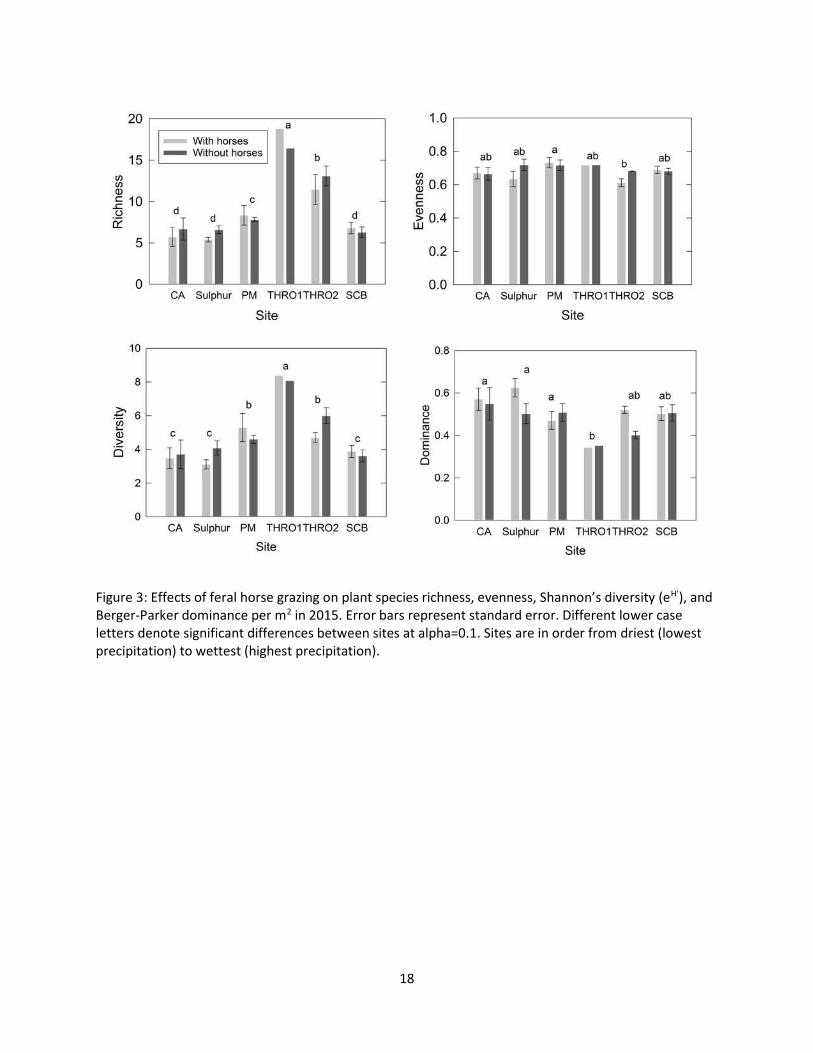
18
Figure 3: Effects of feral horse grazing on plant species richness, evenness, Shannon’s diversity (eH’), and Berger-Parker dominance per m2 in 2015. Error bars represent standard error. Different lower case letters denote significant differences between sites at alpha=0.1. Sites are in order from driest (lowest precipitation) to wettest (highest precipitation).
19
Figure 4: Long-term effects of feral horse grazing on grass, forb and total herbaceous biomass, measured in 2015. Error bars represent standard error. Different lower case letters denote significant differences between sites at alpha=0.1 (see Table 3). Sites are in order from driest to wettest. Insets show differences in biomass averaged across all sites.
20
DISCUSSION
We did not observe a significant effect of grazing by feral horses on any of several aspects of
plant community structure (plant species richness, diversity, evenness or dominance) or plant
community composition for the five rangeland sites spanning a 184-mm precipitation gradient. There
was also no grazing by site interaction for any of these factors. Conversely, based on comparisons with
long-term exclosed areas, feral horse grazing has significantly reduced grass biomass and total biomass
at alpha=0.1, and this effect did not vary among sites. Thus, our hypothesis that grazing effects would
vary by site, according to precipitation levels, was not supported.
Similar to our study, previous studies of feral horse impacts have usually found that horse
grazing reduced overall aboveground plant biomass. This includes Villalobos and Zalba (2010) in
grasslands in Argentina; and Wood et al. (1987), Turner (1987, in a study where clipping was used to
simulate feral horse grazing), and Seliskar (2003) on east coast barrier islands. Wood et al. (1987) also
observed lower grass biomass in areas grazed by feral horses. However, at Pryor Mountain, Gerhardt
and Detling (2000) found no significant effect of horses on total biomass, and Fahnestock and Detling
(1999a) found that grasses compensated for biomass removed by simulated horse grazing when water
availability was adequate.
Studies looking at the effects of horses on plant species richness and diversity are more
numerous, with more varied results. In Argentina, Villalobos and Zalba (2010) reported that horses
reduced both richness and diversity. On Assateague Island, Seliskar (2003) found no effect on species
richness. In the Sonoran Desert, Ostermann-Kelm et al. (2009) found increased plant diversity near
horse trails compared with control plots far from trails. Among previous studies at Pryor Mountain,
Gerhardt and Detling (2000) and Gerhardt (2000) found no effect on plant species richness, but
Fahnestock and Detling (1999b) found that horses increased diversity in some cases. In the Great Basin,
21
the presence of feral horses has usually been associated with lower plant species richness (Beever and
Brussard 2000, Beever et al. 2008) and diversity (Davies et al. 2014). However, Beever et al. (2008)
found increased species richness at some horse-occupied sites, while Davies et al. (2014) found no effect
of horses on richness. Similar to our study, Beever et al. (2003) in the Great Basin and Detling (1998) at
Pryor Mountain found that horse grazing was not a major influence on plant community composition.
One possible reason for the lack of significant effects on community composition and diversity is
that our sites, like many arid and semi-arid rangelands, are non-equilibrium systems where plant
communities and herbivore populations are not tightly coupled. Theoretically, this is the case because in
systems with high precipitation variability, droughts keep herbivore populations below a level that
would damage the vegetation (Behnke and Scoones 1993, Cowling 2000, Derry and Boone 2010, Von
Wehrden et al. 2012). Because the BLM gathers and removes horses when their numbers exceed
Appropriate Management Levels, these removals could be taking the place of drought-induced mortality
events by periodically reducing populations.
Relatedly, arid and semi-arid systems often display nonlinear and even irreversible responses to
grazing (Westoby et al. 1989, Friedel 1991, Laycock 1991, Joyce 1993). It is possible that grazing before
the construction of the exclosures we sampled pushed the plant communities into an alternate stable
state, after which removal of grazing was not enough to return the system to a previous state. In
keeping with many previous horse grazing exclusion studies (e.g. Turner 1987, Rogers 1991, Detling
1998, Fahnestock and Detling 1999b, Beever and Brussard 2000, Fahnestock and Detling 2000, Seliskar
2003, De Stoppelaire et al. 2004, Davies et al. 2014), we have assumed that comparing plant
communities inside and outside exclosures constitutes an observation of the effects of “horses” or of
“grazing.” However, because vegetation recovery is rarely a simple reversal of grazing-induced changes,
“effects of grazing” and “effects of protection from grazing” may not be equivalent (Fleischner 1994,
22
Sarr 2002). Past or current grazing may have caused changes that are not detectable purely through the
use of exclosures.
The productivity level of our sites may also have contributed to the lack of grazing effects that
we observed. Assuming that there is a relationship between primary productivity and the effects of
grazing on plant diversity, with grazing decreasing diversity at less-productive sites and increasing
diversity at more-productive sites, this implies an intermediate range of productivity where no effect of
grazing on plant diversity is observed. In a study by Frank (2005), the intercept where grazing effects
switched from negative to positive (i.e., the point where the effect should be zero) was slightly below
100 g/m2 net aboveground production. In another study by Bakker et al. (2006), this point was at
approximately 225 g/m2. Our sites may fall into such a range of intermediate productivity where grazing
has no observable effect on plant diversity.
Another possibility is that the areas where we sampled were not receiving high enough grazing
pressure to cause shifts in the plant community. Although only one of the sites, Sulphur, had a
population that far exceeded its AML, two additional sites (THRO and PM) had horse populations slightly
above the level recommended by their managing agencies. The BLM defines the upper AML as the
“maximum number […]which […]avoids a deterioration of the range” (BLM 2010). However, whether
AMLs accurately reflect such a threshold is questionable (NRC 2013), so it is possible that a herd could
be above AML but still too small to cause plant community shifts. Additionally, horse density in the site
as a whole may not directly correspond to horse use of the specific plots we sampled. Our dung
transects showed that horses were present near our plots (see Table 1), and we observed horses while
sampling at every site. Data comparing biomass inside and outside temporary exclosures in 2015
support the idea that grazing pressure was not very high, since there were no significant differences in
biomass inside vs. outside the temporary exclosures. However, the fact that total and grass biomass
23
was significantly higher inside the permanent exclosures vs. areas actively grazed (see Table 3), indicates
that the areas have been under grazing pressure over the long term.
In other words, there are several possible explanations for the observed lack of grazing effects
on plant community composition and diversity at these sites, and further research is needed to fully
understand the role of these different influences.
It is also possible that plant community changes have occurred which our sampling did not
detect. This study suffered from several limitations that restricted our power to detect grazing effects.
Because our goal was to investigate long-term grazing effects across sites spanning a broad precipitation
gradient in the western US, we were limited to sites with preexisting fencelines and exclosures, which
were not standardized in number or dimensions. Given that there were often only a few existing
exclosures or a single fenceline (or in the case of THRO1, a river) available for sampling at the study
sites, sample sizes within each site were relatively small, potentially affecting our ability to detect a
grazing effect. However, it is important to consider that other horse grazing exclusion studies have had
similarly small sample sizes (e.g. Turner 1987, 1988; Rogers 1991; Furbish and Albano 1994; Detling
1998; Fahnestock and Detling 2000; Beever and Brussard 2000; De Stoppelaire et al. 2004).
The placement of exclosures around springs at CA may have biased species composition data at
that site, due to the greater prevalence of riparian vegetation inside exclosures compared to outside.
Similarly, the “grazed” and “ungrazed” plots at THRO1 were unusually far apart (about 11 km),
introducing the possibility that differences were influenced by factors other than grazing. Additionally,
our analysis was unable to account for differences in exclosure sizes and differences between exclosures
and fencelines, despite the implications of such differences for edge effects, propagule dispersal, and
access by native herbivores.
This study was also subject to other complications that often make studying feral horse effects
difficult. Most places where feral horses are found have complex and sometimes poorly documented
24
grazing histories, and are also occupied by other large herbivores such as cattle, whose effects can be
difficult to separate from those of horses (Beever and Aldridge 2011, Beever and Herrick 2006). Three of
our sites (PM, SCB and Sulphur) had no cattle present at the time of our study. (PM has had no livestock
grazing since 1968 [Fahnestock and Detling 1999b]; SCB has had no cattle grazing since 2011 [TJ Holmes,
personal communication]; and at Sulphur, no dung, tracks or any other signs of cattle were observed
near our plots at any time during this study.) At CA, cattle were absent from the vicinity of the
exclosures from 1983 to at least 2000 (Beever and Brussard 2000), but they were present during our
study (personal observation). Our fecal transects suggest that roughly equal numbers of horses and
cattle were present near the exclosures (see Table 1). Because of this, grazing effects at CA should be
regarded as resulting from a combination of horse and cattle use. At THRO, bison were present inside
the park fence (the area with horses), and there was a Forest Service cattle grazing allotment outside
the fence (the area without horses). We hoped that because of the functional similarity between bison
and cattle grazing (Knapp et al. 1999, Tastad 2013), we would be able to detect the additional impact of
horses inside the fence; however, based on dung transects, cattle use of our transects outside the fence
exceeded bison use of our transects inside the fence, potentially causing our data to underestimate the
impact of horses. Similarly, domestic sheep graze both sides of the fence at Sulphur, and may have
affected our results there, although there is limited dietary overlap between horses and domestic sheep
(Hanley and Hanley 1982, Scasta 2014).
Native ungulates such as mule deer, pronghorn, bighorn sheep and/or elk also were present at
all of our sites, but did not always frequent our specific plots (see Table 1). These other herbivores may
also have influenced our results, especially at SCB and Sulphur where dung transects suggested higher
use by native herbivores compared to our other sites. For example, effects on species composition
caused by horses removing grasses may have been dampened by native browsers removing biomass
from shrubs and forbs. We were also unable to quantify shrub biomass, meaning we may have been
25
missing an important component of feral horse impacts, although shrubs typically make up only a small
proportion of horse diets (Scasta 2014).
Because of these limitations in our study, and despite our attempts to cover as wide a
precipitation gradient as possible, our data are not completely representative of the range of
environments in which feral horses live. Thus, although we did not find significant interactions between
site and grazing, it is premature to conclude that no relationship exists between precipitation levels (or
other site-specific environmental factors) and magnitude of feral horse grazing effects. Additional data
to address the effects of feral horses and connections between those effects and environmental
conditions could be provided by future research.
26
FUTURE RESEARCH
This study was an attempt to ameliorate the scarcity of studies of feral horses in the majority of
the geographic range where they occur in the US. However, our experimental design was limited by the
availability of existing exclosures. Despite this limitation, our study highlights ways that feral horse
research can be improved and expanded in the future. One way to better address the question of how
feral horses affect vegetation would be a large scale, long-term study with standardized exclosures.
The National Research Council, in its 2013 report on the BLM Wild Horse and Burro Program,
suggested designating and intensively studying “sentinel HMAs […] representative of diverse ecological
settings.” In keeping with this suggestion, a study could include sites in the Mojave Desert, throughout
the Great Basin, in the Colorado Plateau, and in southwestern Wyoming to fully cover the geographic
extent of feral horses on Bureau of Land Management lands. Because the Great Basin consists of
mountain ranges separated by low valleys, and each mountain range can have a unique species
composition (Berger 1986), it would be instructive to look at multiple mountain ranges as well as low
elevations within in the Great Basin. The study should also include sites at a range of elevations, since in
the Great Basin, elevation strongly affects temperature and precipitation (Berger 1986, Petersen 1994).
Together with a wider geographic extent, this would enable investigation of a larger precipitation
gradient to potentially detect relationships between precipitation and grazing effects.
Moreover, given that feral horse grazing often occurs in tandem with cattle, sheep, and native
ungulate grazing, there is a pressing need for studies that separate the effects of feral horses from those
of other herbivores. A study targeting HMAs without cattle or bison, or in an HMA where grazers could
be separated, would reduce the confounding effects of those grazers. Even better would be to find
places that are inhabited by feral horses but have not historically experienced cattle grazing (if any such
places exist). In general, the more detailed and reliable the record of past livestock grazing, the better. It
27
would also be helpful to select locations where the horse population (past and current numbers and
habitat use) is well documented. This would enable investigation of relationships between horse
density/grazing intensity and grazing effects, a question which is critical to wild horse management.
As mentioned above, many feral horse exclosure studies have suffered from small sample sizes.
In the case of this study, both small sample size and unbalanced data made analysis more difficult than it
would have been if more exclosures of similar size had been available. A system of large exclosures with
standardized dimensions, with multiple exclosures per site, would be extremely valuable for studying
feral horse impacts. Despite the logistical difficulties involved, selecting exclosure locations randomly
within each site would make the resulting data more representative of the study area as a whole, and
prevent bias arising from exclosures being located near roads or springs. Clearly and permanently
marked transects both inside and outside exclosures would facilitate long-term sampling of the same
locations, allowing observation of changes over time as well as differences between grazed and
ungrazed plant communities. Another advantage to long-term sampling of the same areas would be the
ability to use allometric measurements to quantify changes in woody biomass.
Although our study focused on plant communities, previous research has shown that feral
horses can also impact other ecosystem components such as soil (Beever et al. 2003, Beever and Herrick
2006, Ostermann-Kelm et al. 2009, Davies et al. 2014), invertebrates (Beever et al. 2003, Beever and
Herrick 2006, Ostermann-Kelm et al. 2009), birds (Levin et al. 2002, Beever and Aldridge 2011), and
small mammals (Beever and Brussard 2000, Beever et al. 2003). Even in locations where effects on plant
diversity are not observed, grazing may be having other important impacts which merit further study.
Despite the challenges of studying feral horses’ ecological effects, a large-scale, long-term study
of carefully selected HMAs using large, standardized exclosures could go a long way toward addressing
the questions and controversy surrounding this topic, and could contribute to optimal management of
America’s feral horses.
28
REFERENCES
Ashton, I.W., and M. Prowatzke. 2014. Plant community composition and structure monitoring for Theodore Roosevelt National Park: 2013 annual report. National Park Service, Fort Collins, CO.
Bakker, E.S., M.E. Ritchie, H. Olff, D.G. Milchunas, and J.M.H. Knops. 2006. Herbivore impact on grassland plant diversity depends on habitat productivity and herbivore size. Ecology Letters 9:780-788.
Beever, E.A., and P.F. Brussard. 2000. Examining ecological consequences of feral horse grazing using exclosures. Western North American Naturalist 60:236-254.
Beever, E. 2003. Management implications of the ecology of free-roaming horses in semi-arid ecosystems of the western United States. Wildlife Society Bulletin 31:887-895.
Beever, E.A., R.J. Tausch, and P.F. Brussard. 2003. Characterizing grazing disturbance in semiarid ecosystems across broad scales, using diverse indices. Ecological Applications 13:119-136.
Beever, E.A., and J.E. Herrick. 2006. Effects of feral horses in Great Basin landscapes on soil and ants: Direct and indirect mechanisms. Journal of Arid Environments 66:96-112.
Beever, E.A., R.J. Tausch, and W.E. Thogmartin. 2008. Multi-scale responses of vegetation to removal of horse grazing from Great Basin (USA) mountain ranges. Plant Ecology 196:163-184.
Beever, E.A., and C.L. Aldridge. 2011. Influences of free-roaming equids on sagebrush ecosystems, with a focus on Greater Sage-Grouse. Pages 273–290 in S. T. Knick and J. W. Connelly, editors. Greater Sage-Grouse: ecology and conservation of a landscape species and its habitats. Studies in Avian Biology (vol. 38), University of California Press, Berkeley, CA.
Behnke, R.H. and I. Scoones. 1993. Rethinking range ecology: Implications for rangeland management in Africa. Pages 1-30 in R.H. Behnke, I. Scoones, and C. Kerven, editors. Range Ecology at Disequilibrium: New Models of Natural Variability and Pastoral Adaptation in African Savannas. Overseas Development Institute, London.
Belsky, A.J., A. Matzke, and S. Uselman. 1999. Survey of livestock influences on stream and riparian ecosystems in the western United States. Journal of Soil and Water Conservation 54:419-431.
Berger, J. 1986. Wild horses of the Great Basin: Social competition and population size. University of Chicago Press, Chicago, IL.
Bonham, C.D. 1989. Measurements for terrestrial vegetation, 2nd edition. Wiley-Blackwell.
Bureau of Land Management (BLM). 2010. Wild horses and burros management handbook. U.S. Department of the Interior, Washington, DC.
Clary, W.P., and R.C. Holmgren. 1982. Desert Experimental Range: Establishment and Research Contribution. Rangelands 4:261-264.
Crane, K.K., M.A. Smith, and D. Reynolds. 1997. Habitat selection patterns of feral horses in southcentral Wyoming. Journal of Range Management 50:374-380.
29
Davies, K.W., G. Collins, and C.S. Boyd. 2014. Effects of feral free-roaming horses on semi-arid rangeland ecosystems: an example from the sagebrush steppe. Ecosphere 5:1-14.
Derry, J.F., and R.B. Boone. 2010. Grazing systems are a result of equilibrium and non-equilibrium dynamics. Journal of Arid Environments 74:307-309.
De Stoppelaire, G.H., T.W. Gillespie, J.C. Brock, and G.A. Tobin. 2004. Use of remote sensing techniques to determine the effects of grazing on vegetation cover and dune elevation at Assateague Island National Seashore: impact of horses. Environmental Management 34:642-649.
Detling, J.K. 1998. Mammalian herbivores: Ecosystem-level effects in two grassland national parks. Wildlife Society Bulletin 26:438-448.
Duncan, P.D., T.J. Foose, I.J. Gordon, C.G. Gakahu, and M. Lloyd. 1990. Comparative nutrient extraction from forages by grazing bovids and equids: a test of the nutritional model of equid/bovid competition and coexistence. Oecologia 84:411-418.
Fahnestock, J.T., and J.K. Detling. 1999a. Plant responses to defoliation and resource supplementation in the Pryor Mountains. Journal of Range Management 52: 263-270.
Fahnestock, J.T., and J.K. Detling. 1999b. The influence of herbivory on plant cover and species composition in the Pryor Mountain Wild Horse Range, USA. Plant Ecology 144:145-157.
Fahnestock, J.T., and J.K. Detling. 2000. Morphological and physiological responses of perennial grasses to long-term grazing in the Pryor Mountains, Montana. The American Midland Naturalist. 143:312-320.
Frank, D.A. 2005. The interactive effects of grazing ungulates and aboveground production on grassland diversity. Oecologia 143:629-634.
Friedel, M.H. 1991. Range condition assessment and the concept of thresholds: A viewpoint. Journal of Range Management 44:422-426.
Furbish, C.E., and M. Albano. 1994. Selective herbivory and plant community structure in a mid-Atlantic salt marsh. Ecology 75:1015-1022.
Ganskopp, D., and M. Vavra. 1986. Habitat use by feral horses in the northern sagebrush steppe. Journal of Range Management 39:207-212.
Gerhardt, T. 2000. Plant cover species richness in the Pryor Mountain Wild Horse Range—1998. In: Singer, F.J., Schoenecker, K.A. (Eds.), Managers’ Summary—Ecological Studies of the Pryor Mountain Wild Horse Range, 1992–1997. US Geological Survey, Midcontinent Ecological Science Center, Fort Collins, pp. 63–69.
Gerhardt, T., and J. Detling. 2000. Summary of vegetation dynamics at the Pryor Mountain Wild Horse Range— 1992–1996. Pages 3-36 in F.J. Singer and K.A. Schoenecker, editors. Managers’ summary—Ecological studies of the Pryor Mountain Wild Horse Range, 1992–1997. US Geological Survey, Midcontinent Ecological Science Center, Fort Collins, CO.
Gwynne, M.D., and R.H.V. Bell. 1968. Selection of vegetation components by grazing ungulates in the Serengeti National Park. Nature 220:390-393.
Hanley, T.A. 1982. The nutritional basis for food selection by ungulates. Journal of Range Management 35:146-151.
30
Hanley, T.A., and K.A. Hanley. 1982. Food resource partitioning by sympatric ungulates on Great Basin rangeland. Journal of Range Management. 35:152-158.
Hobbs, N.T. 1996. Modification of ecosystems by ungulates. Journal of Wildlife Management 60:695-713.
Holechek, J.L. 1988. An approach for setting the stocking rate. Rangelands 10:10-14.
Janis, C. 1976. The evolutionary strategy of the Equidae and the origins of rumen and cecal digestion. Evolution 30:757-774.
Jones, A. 2000. Effects of cattle grazing on North American arid ecosystems: A quantitative review. Western North American Naturalist 60:155-164.
Joyce, L.A. 1993. The life cycle of the range condition concept. Journal of Range Management 46:132-138.
Kauffman, J.B., and W.C. Krueger. 1984. Livestock impacts on riparian ecosystems and streamside management implications ... A review. Journal of Range Management 37:430-438.
Knapp, A.K., J.M. Blair, J.M. Briggs, S.L. Collins, D.C. Hartnett, L.C. Johnson, and E.G. Towne. 1999. The keystone role of bison in North American tallgrass prairie. BioScience 49:39-50.
Koerner, S.E., M.D. Smith, D.E. Burkepile, M.L. Avolio, S.L. Collins, A.K. Knapp, N.P. Lemoine, E. J. Forrestel, and The Grazing Exclosure Consortium. In prep. Changes in dominance drive global variation in herbivore effects on grassland diversity.
Laycock, W.A. 1991. Stable states and thresholds of range condition on North American rangelands: A viewpoint. Journal of Range Management 44: 472-433.
Lemoine, N.P., J. Sheffield, J.S. Dukes., A.K. Knapp, and M.D. Smith. 2016. Terrestrial Precipitation Analysis (TPA): A resource for characterizing long-term precipitation regimes and extremes. Methods in Ecology and Evolution.
Levin, P.S., J. Ellis, R. Petrik, and M.E. Hay. 2002. Indirect effects of feral horses on estuarine communities. Conservation Biology 16:1364-1371.
Lezama, F., S. Baeza, A. Altesor, A. Cesa, E.J. Chaneton, and J.M. Paruelo. 2014. Variation of grazing-induced vegetation changes across a large-scale productivity gradient. Journal of Vegetation Science 25:8-21.
McNaughton, S.J. 1979. Grazing as an optimization process: Grass-ungulate relationships in the Serengeti. The American Naturalist 113: 691-703.
Menard, C., P. Duncan, G. Fleurance, J. Georges, and M. Lila. 2002. Comparative foraging and nutrition of horses and cattle in European wetlands. Journal of Applied Ecology 39:120-133.
Menke, J., and G.E. Bradford. 1992. Rangelands. Agriculture, Ecosystems and Environment 42:141-163.
Milchunas, D.G., O.E. Sala, and W.K. Lauenroth. 1988. A generalized model of the effects of grazing by large herbivores on grassland community structure. The American Naturalist 132:87-106.
Milchunas, D.G., and W.K. Lauenroth. 1993. Quantitative effects of grazing on vegetation and soils over a global range of environments. Ecological Monographs 63:327-366.
31
National Research Council (NRC). 2013. Using science to improve the BLM wild horse and burro program: A way forward. The National Academies Press, Washington, DC.
Nimmo, D.G., and K.K. Miller. 2007. Ecological and human dimensions of management of feral horses in Australia: a review. Wildlife Research 34:408-417.
Natural Resource Conservation Service (NRCS). 2016. Web soil survey. Available from: http://websoilsurvey.sc.egov.usda.gov/App/HomePage.htm.
Ostermann-Kelm, S.D., E.A. Atwill, E.S. Rubin, L.E. Hendrickson, and W.M. Boyce. 2009. Impacts of feral horses on a desert environment. BMC Ecology 9:22.
Petersen, K.L. 1994. Modern and Pleistocene climatic patterns in the west. Pages 27-53 in K.T. Harper, L.L. St. Clair, K.H. Thorne and W.M. Hess, editors. Natural History of the Colorado Plateau and Great Basin, University Press of Colorado, Niwot, CO.
Rogers, G.M. 1991. Kaimanawa feral horses and their environmental impacts. New Zealand Journal of Ecology 15:49-64.
Sarr, D.A. 2002. Riparian livestock exclosure research in the western United States: A critique and some recommendations. Environmental Management 30:516-526.
Scasta, D. 2014. Dietary composition and conflicts of livestock and wildlife on rangeland. University of Wyoming Extension report B-1260. University of Wyoming, Laramie, WY.
Seliskar, D.M. 2003. The response of Ammophila breviligulata and Spartina patens (Poaceae ) to grazing by feral horses on a dynamic mid-Atlantic barrier island. American Journal of Botany 90:1038-1044.
Stohlgren, T.J., L.D. Schell, and B. Vanden Heuvel. 1999. How grazing and soil quality affect native and exotic plant diversity in Rocky Mountain grasslands. Ecological Applications 1:45-64.
Symanski, R. 1994. Contested realities: Feral horses in outback Australia. Annals of the Association of American Geographers 84:251-269.
Tastad, A.C. 2013. The relative effects of grazing by bison and cattle on plant community heterogeneity in northern mixed prairie. Master’s thesis, University of Manitoba.
Turner, M.G. 1987. Effects of grazing by feral horses, clipping, trampling, and burning on a Georgia salt marsh. Estuaries 10: 54-60.
Turner, M.G. 1988. Simulation and management implications of feral horse grazing on Cumberland Island, Georgia. Journal of Range Management 41: 441-447.
Villalobos, A.E., and S.M. Zalba. 2010. Continuous feral horse grazing and grazing exclusion in mountain Pampean grasslands in Argentina. Acta Oecologia 36:514-519.
Von Wehrden, H., J. Hanspach, P. Kaczensky, J. Fischer, and K. Wesche. 2012. Global assessment of the non-equilibrium concept in rangelands. Ecological Applications 22:393-399.
Westoby, M., B. Walker, and I. Noy-Meir. 1989. Opportunistic management for rangelands not at equilibrium. 42:266-274.
Wood, G.W., M. Mengak, and M.T. Murphy. 1987. Ecological importance of feral ungulates at Shackleford Banks, North Carolina. The American Midland Naturalist 118:236-244.
32
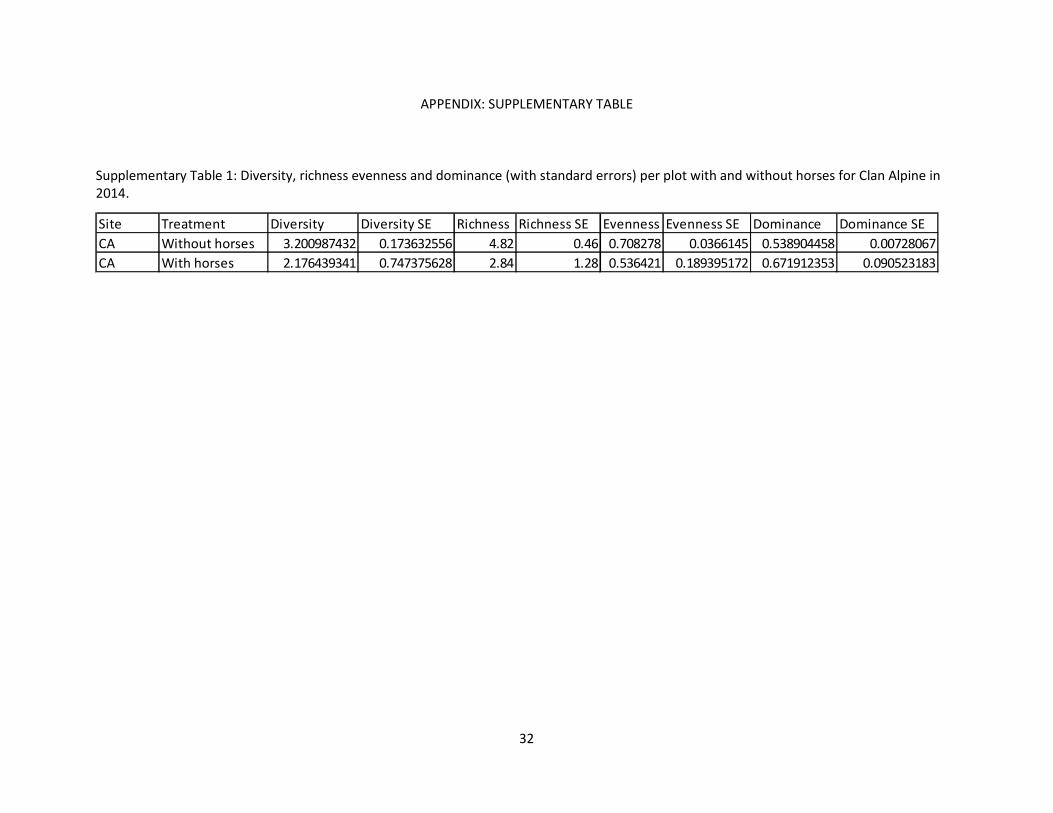
APPENDIX: SUPPLEMENTARY TABLE
Supplementary Table 1: Diversity, richness evenness and dominance (with standard errors) per plot with and without horses for Clan Alpine in 2014.
Site Treatment Diversity Diversity SE Richness Richness SE Evenness Evenness SE Dominance Dominance SECA Without horses 3.200987432 0.173632556 4.82 0.46 0.708278 0.0366145 0.538904458 0.00728067CA With horses 2.176439341 0.747375628 2.84 1.28 0.536421 0.189395172 0.671912353 0.090523183