Embed Size (px)
Citation preview

1
Effects of exercise and hyperthermia on
gastrointestinal dysfunction and symptoms
in recreational athletes
By
Stephen John Smith
A thesis submitted in partial fulfilment of the requirements of Liverpool John Moores University
for the degree of
DOCTOR OF PHILOSOPHY
May 2021

2
Author’s Declaration
I declare that the work in this thesis was carried out in accordance with the regulations of Liverpool
John Moores University. Apart from the help and advice acknowledged, the work within was solely
completed and carried out by the author.
Any views expressed in this thesis are those of the author and in no way represent those of Liverpool
John Moores University and the School of Sport and Exercise Science.
This thesis has not been presented to any other University for examination either in the United Kingdom
or overseas. No portion of the work referred to in this research project has been submitted in support of
an application for another degree or qualification of this or any other university or institute of learning.
Copyright in text of this research project rests with the author. The ownership of any intellectual
property rights, which may be described in this research project, is vested in Liverpool John Moores
University and may not be made available for use to any third parties without the written permission of
the University.
Signed
Date 01/05/2021

3
Acknowledgments
Firstly, I would like to express my sincere gratitude to my advisor Dr. Dominic Doran for the continuous
support of my PhD study and related research, for his patience, motivation, and immense knowledge.
His guidance helped me in all the time of research and writing of this thesis. I am sincerely grateful for
his support throughout the difficult times experienced during this period of study. Without him, this
thesis would not have been possible, and I could not have imagined having a better advisor and mentor
for my Ph.D. study.
I would also like to thank Prof. Graeme Close, who took a chance by allowing me to study for an MSc,
before providing me with the opportunity to undertake a PhD. Without the opportunities and advice
provided by Graeme, my development as a practitioner and researcher would not have been possible,
again, thank you.
Thirdly, I would also like to offer thanks to Prof. James Morton. Your work ethic and continuous pursuit
of personal development have helped me develop as a professional. Your advice is always received in
the highest regard, and your lectures always remind me of why I chose Sports Science as a profession.
Thank you.
I would like to offer thanks to Dr. Ben Edwards, for always being happy to discuss ideas, training and
presenting me with opportunities to develop as an academic; your friendship over the years has been
treasured. To Dr. Mark Scott, for the many hours of unscheduled statistics support and advice, your
‘open door’ policy was truly appreciated. To the lab technicians, Gemma, Dean, George and Ian, for
always being available to amend my (many) mistakes and provide guidance without question. I would
also like to extend thanks to my fellow PhD students, who were always willing to assist with data
collection and volunteering as participants without expecting anything in return.
Dedication
For my family: my wife Katie, for being my rock throughout this period of study, for believing in me
and doing an amazing job at raising our two children through the many hours of my absence. To my
parents for supporting me throughout writing this thesis and my life in general.

4
Abstract
Exercise leads to disturbances in the gastrointestinal (GI) tract, which have been suggested to contribute
towards the appearance of symptoms such as bloating, vomiting, and diarrhoea. The mechanisms
underlying the appearance of GI symptoms aren’t fully understood and there is large variations in the
individual susceptibility to symptoms (Karhu et al., 2017). Understanding this relationship is somewhat
constrained by the methodological approaches applied in the field. The methods used to quantify the
response in intestinal permeability and injury are subject to wide variations in response to a similar
exertional and environmental stresses which would appear to be population independent. Whilst
splanchnic hypoperfusion and hyperthermia have both been identified as key mechanism(s)
contributing towards an increase in intestinal permeability, it is less clear which of these factors is most
dominant. Furthermore, it is not yet clear whether these factors (hyperthermia and hypoperfusion) exist
on a continuum, where one factor may dominate under certain conditions, and whether other factors
such as psychological stress influence this relationship (van Wijck et al., 2011a; Pires et al., 2017). The
aim of this thesis is to investigate the relationship between GI dysfunction (permeability and injury),
subjective GI symptoms, hyperthermia and exercise. However, given the broad range of methods used
in previous literature, a secondary aim of this thesis is to address methodological clarity about the timing
of L/R test solution ingestion. The original contribution to knowledge from this work suggests,
methodologically, the timing of dual-sugar probe test solution ingestion in relation to exercise does not
significantly affect the subsequent serum Lactulose/L-Rhamnose ratio expressed (Chapter 4).
Furthermore, GI permeability displays a dose-response relationship with exercise intensity, but this
does not correlate with the expression of GI symptoms. The appearance of GI symptoms is likely due
to a multitude of factors including physiological strain and exercise intensity, yet is highly
individualistic (Chapter 5). Further, in Chapter 6 it is observed for the first time that hyperthermia
implemented during resting conditions, in absence of exercise-induced mesenteric hypoperfusion, but
does not augment GI permeability or markers of GI distress. Moreover, hyperthermia in absence of
exercise-induced hypoperfusion results in the appearance of symptoms of heat illness, and core
temperature is strongly correlated to nausea. Research has previously demonstrated that
supplementation with glutamine can ameliorate intestinal permeability and core temperature. However,
in Chapter 7, acute glutamine supplementation returned no protective effects on GI damage,
permeability, core temperature or heat-illness symptoms in response to exposure of passive
hyperthermia. Collectively, exercise causes an increase in GI permeability, a response not observed
when similar levels of core temperature are induced by passive hyperthermia. In summary, the increase

5
in GI permeability observed during exercise is likely to be caused by intestinal ischemia, rather than an
increase in core temperature. Furthermore, no association between intestinal permeability and GI
symptoms appears to exist. Passive heat stress results in a rise in core temperature, GI damage and heat-
illness symptoms, with glutamine supplementation demonstrating no protective effect on these
outcomes.
Table of Contents
Effects of exercise and hyperthermia on gastrointestinal dysfunction and symptoms in recreational
athletes .....................................................................................................................................................1
Author’s Declaration ...............................................................................................................................2
Acknowledgments ...................................................................................................................................3
Abstract ....................................................................................................................................................4
Table of Contents .................................................................................................................................5
List of Tables .......................................................................................................................................9
List of Figures ....................................................................................................................................10
List of Abbreviations .............................................................................................................................11
Chapter 1: Introduction ..........................................................................................................................13
1.1 Background ..................................................................................................................................13
1.1.1: The Intestinal Epithelial Barrier ..........................................................................................13
1.1.2: Intestinal injury and permeability ........................................................................................14
Chapter 2: Literature Review .................................................................................................................16
2.0: The Gastrointestinal System .......................................................................................................16
2.1: The Small intestine .................................................................................................................16
2.1.1: Splanchnic blood flow .........................................................................................................16
2.2: Gastrointestinal symptoms in athletes .......................................................................................18
2.2.1: Prevalence ............................................................................................................................18
2.2.2 Mechanisms of GI symptoms in athletes ..................................................................................19
2.3: The Gastrointestinal Barrier: Structure and Function .................................................................25
2.3.1: Intestinal Epithelial Tight-Junctions ....................................................................................25
2.4: Assessment of Gastrointestinal Permeability .............................................................................29
2.4.1: Urine and blood determination of dual sugar probes ..........................................................31
2.4.2: Sugar-probe assay dosage and timing .................................................................................31
2.4.3: Summary ..............................................................................................................................37
2.5: Assessment of intestinal injury: Novel biomarkers. ...................................................................37
2.6: Effects of exercise on gastrointestinal permeability ...................................................................43
2.6.1: Reduced splanchnic blood flow and oxygen availability ....................................................43
2.6.2: Exercise intensity .................................................................................................................43
2.6.3: Exercise duration .................................................................................................................44

6
2.6.4: Hyperthermia .......................................................................................................................46
2.6.5: The effect of glutamine on intestinal permeability ..............................................................48
2.6.6: Summary ..............................................................................................................................49
Chapter 3: General Methods ..................................................................................................................50
3.0 Introduction..................................................................................................................................50
3.1 Ethical Approval and list testing locations ..................................................................................50
3.2 Participants ..................................................................................................................................50
3.3 Anthropometry .............................................................................................................................51
3.4 Cardiorespiratory Measurements .................................................................................................51
3.4.1 Maximal oxygen uptake ................................................................................................51
3.4.2 Heart Rate .............................................................................................................................51
3.4.3 Rating of Perceived Exertion (RPE) .....................................................................................52
3.4.4 Thermal Comfort ..................................................................................................................53
3.5 Thermoregulatory Measurement .................................................................................................53
3.5.1 Core temperature ..................................................................................................................53
3.6 Assessment of gut permeability, injury and symptoms ...............................................................53
3.6.1 Intestinal Permeability ..........................................................................................................53
3.6.3 Gastrointestinal symptoms....................................................................................................54
3.7 Blood sample collection and biochemical analysis .................................................................54
3.8 Heat Stress ...............................................................................................................................54
Chapter 4 – Determining GI barrier Dysfunction in Exercise: Does the Timing of Lactulose/L-
rhamnose (L/R) Sugar-Probe Ingestion Affect Subsequent L/R Recovery Profile? .............................57
4.1: Abstract .......................................................................................................................................57
4.2: Introduction ................................................................................................................................57
4.3 Methods .......................................................................................................................................59
4.3.1 Participants ...........................................................................................................................59
4.3.2 Assessment of maximal oxygen uptake ................................................................................59
4.3.3 Experimental design .............................................................................................................59
4.3.4 Sugar probe administration ...................................................................................................60
4.3.5 Thermal comfort, HR, RPE, and core temperature...............................................................61
4.3.6 Gastrointestinal symptoms....................................................................................................61
4.3.7 Blood analysis .......................................................................................................................61
4.3.8 Statistical analysis .................................................................................................................62
4.4 Results....................................................................................................................................62
4.4.1 Physiological Responses .......................................................................................................62
4.4.2 Core temperature ..................................................................................................................62
4.4.3 Small Intestinal Permeability ................................................................................................66
4.4.4 GI symptoms .........................................................................................................................69

7
4.5 Discussion ....................................................................................................................................69
Chapter 5 – Effect of Exercise In Different Intensity Domains on Gastrointestinal Permeability and
Symptoms in Runners and Triathletes ...................................................................................................73
5.1 Abstract ........................................................................................................................................73
5.2 Introduction..................................................................................................................................73
5.3 Methods .......................................................................................................................................75
5.3.1 Participants ...........................................................................................................................75
5.3.2 Experimental Design ............................................................................................................75
5.3.3 Experimental Protocol ..........................................................................................................76
5.4 Data analysis ................................................................................................................................76
5.6 Assessment of GI permeability, injury and symptoms ................................................................78
5.7 Statistical analysis ........................................................................................................................78
5.8 Results..........................................................................................................................................79
5.8.1 Physiological responses to treadmill running .......................................................................79
5.8.2 Core Temperature .................................................................................................................80
5.8.3 GI permeability and injury ....................................................................................................82
5.8.4 GI symptoms .........................................................................................................................82
5.9 Discussion ................................................................................................................................83
Chapter 6– Effects of Passive Hyperthermia on Gastrointestinal Permeability, Injury and Symptoms88
6.1 Abstract ........................................................................................................................................88
6.2 Introduction..................................................................................................................................88
6.3 Methods .......................................................................................................................................89
6.3.1 Participants ...........................................................................................................................89
6.3.2 Pilot Measures ......................................................................................................................90
6.3.3 Assessment of Maximal Oxygen Uptake .............................................................................90
6.3.4 Experimental Design ............................................................................................................90
6.3.5 Sugar probe administration ...................................................................................................91
6.3.6 Thermal comfort, HR, RPE, and core temperature...............................................................91
6.3.7 Gastrointestinal symptoms....................................................................................................91
6.3.8 Blood analysis .......................................................................................................................92
6.3.9 Statistical analysis .................................................................................................................92
6.4 Results..........................................................................................................................................93
6.4.1 Physiological Responses .......................................................................................................93
6.4.2 Core Temperature .................................................................................................................94
6.4.3 Small Intestinal Permeability ................................................................................................96
6.4.4. Gastrointestinal symptoms...................................................................................................96
6.5 Discussion ....................................................................................................................................97

8
Chapter 7 – Effects Of Glutamine Supplementation on Gastrointestinal Permeability, Injury and
Symptoms in Response to Heat-Stress ................................................................................................101
7.1 Abstract ......................................................................................................................................101
7.2 Introduction................................................................................................................................101
7.3 Methods .....................................................................................................................................103
7.3.1 Participants .........................................................................................................................103
7.3.2 Assessment of maximal oxygen uptake ..............................................................................104
7.3.3 Experimental Design ..........................................................................................................104
7.3.4 Sugar probe administration .................................................................................................105
7.3.5 Thermal comfort, HR, RPE, and core temperature.............................................................105
7.3.6 Symptoms of heat-illness and GI discomfort .....................................................................105
7.3.7 Blood Collection .................................................................................................................105
7.3.8 Assessment of plasma glutamine ........................................................................................105
7.3.9 Assessment of I-FABP .......................................................................................................105
7.3.10 Statistical analysis .............................................................................................................106
7.4 Results........................................................................................................................................106
7.4.1 Glutamine supplementation did not affect the physiological response to passive heat stress
.....................................................................................................................................................106
7.4.2 Glutamine supplementation did not affect the thermoregulatory response to passive heat
stress ............................................................................................................................................107
7.4.3 Gastrointestinal permeability and injury ............................................................................107
7.4.4 Glutamine supplementation augments plasma glutamine concentrations ..........................109
7.4.5 GI symptoms were not affected by glutamine supplementation ........................................109
7.5 Discussion ..................................................................................................................................110
Chapter 8: Synthesis of Findings .........................................................................................................116
8.1 Realisation of Aims ...................................................................................................................116
8.1.1 Objective 1. Compare the reported magnitudes in intestinal permeability when the timing
of the dual-sugar probe solution is changed in response to exercise performance. .....................116
8.1.2 Objective 2: Investigate the effects of exercise intensity on GI permeability, damage and
symptoms .....................................................................................................................................116
8.1.3 Objective 3: Explore the responses in GI permeability, damage and symptoms in response
to passive hyperthermia ...............................................................................................................117
8.1.4 Investigate the efficacy of glutamine to reduce GI permeability and damage in response to
passive hyperthermia ...................................................................................................................118
8.2 General Discussion ....................................................................................................................119
8.2.1 The timing of ingestion of sugar-probe test solutions for the determination of intestinal
permeability .................................................................................................................................119
8.2.3 The effects of exercise intensity on gastrointestinal permeability and symptoms on
triathletes ......................................................................................................................................120
8.2.4 The effects of passive hyperthermia on intestinal permeability, injury and GI symptoms 121

9
8.2.5 The effects of glutamine supplementation on gastrointestinal permeability, injury and
symptoms in response to heat-stress ............................................................................................123
8.3 Thesis Limitations .....................................................................................................................124
8.3.1 Chapter 4 .............................................................................................................................124
8.3.2 Chapter 5 .............................................................................................................................124
8.3.3 Chapter 6 .............................................................................................................................124
8.3.4 Chapter 7 .............................................................................................................................125
9 Conclusions and implications .......................................................................................................125
Bibliography ........................................................................................................................................127
Appendix 1...........................................................................................................................................144
1.1 Adapted GI symptom questionnaire ..........................................................................................144
1.2 State-Trait Anxiety Inventory questionnaire .............................................................................146
1.3 Adapted heat-illness symptoms questionnaire ...........................................................................147
List of Tables
Table 1: A summary of studies reporting exercise-induced GI symptoms............................................21
Table 2: A summary of studies showing the effects of exercise and heat on tight junction proteins....27
Table 3: A summary of exercise studies showing: variations in sugar probe composition; timing of
ingestion; analysis method; and L/R ratio .............................................................................................33
Table 4: Summary of studies demonstrating the response in I-FABP concentrations to exercise ........40
Table 5: Summary of participant characteristics ...................................................................................51
Table 6: Descriptive characteristics of participants displaying means ± SD for age (yrs.); body mass
(kg); height (cm) and V̇O2 max. (mL‧kg-1‧min-1). .................................................................................59
Table 7: Post-exercise values for physiological responses. Showing heart rate (b·min-1); body mass
loss (%); percent of V̇O2 for the exercise; RPE (AU); core temperature (°C); and thermal comfort
(AU). Data are mean + SD. ...................................................................................................................63
Table 8: The L/R ratio (+ SD) at time points 0, 60 and 120, for the PRE, MID, and POST conditions.
Data are Mean ± SD. Where 0 represents immediately post exercise, 60 = 60min post exercise and
120 = 120 mins post-ingestion of the dual sugar probe solution. ..........................................................66
Table 9: The L/R ratio mean ± SD and 95% CI at all time points for the PRE, MID and POST
conditions. ..............................................................................................................................................66
Table 10: Post-exercise subjective gastrointestinal symptoms between conditions. Data are presented
as mean values indicated by participants from a 0-10 VAS. .................................................................69
Table 11: Physiological responses to treadmill running at rest and within the moderate, heavy and
severe exercise intensity domains. .........................................................................................................79
Table 12: Response in L/R ratio (AU); lactate (mmol.L-1); GI symptoms; core temperature (ºC);
rectal temperature (ºC); and thermal comfort (AU) for all experimental conditions. ...........................81
Table 13: Post-exercise subjective gastrointestinal symptoms across different intensity domains,
presented as mean + SD. Data are presented from a 0-10 VAS, whereby 0 represents no symptoms
and 10 represents severe symptoms. ......................................................................................................83

10
Table 14: Descriptive characteristics of participants displaying means ± SD for age (yrs.); body mass
(kg); height (cm) and V̇O2 max (mL·kg-1·min-1). .................................................................................90
Table 15: Peak physiological values: heart rate (b·min-1); thermal comfort (AU); core temperature
(°C); blood pressure (mmHg); and RPE (AU). Data are mean ± SD. ..................................................93
Table 16: Showing the L/R ratio at PRE and POST HWI, and two hours post sugar-probe ingestion
(120). nd represents values below the detection limit of the assay. ......................................................96
Table 17: eak physiological values: heart rate (b·min-1); thermal comfort (AU); core temperature
(°C); blood pressure (mmHg); RPE (AU); Data are mean ± SD. ........................................................107
Table 18: Post-HWI values for L/R ratio (AU) and I-FABP (pg·mL-1). Data are mean ± SD. nd
represents values below the detection limit of the assay. ....................................................................108
Table 19: Appearance of subjective heat-illness symptom during HWI. ............................................110
List of Figures
Figure 1: Schematic representation of the splanchnic circulation (Harper and Chandler, 2015) ..........17
Figure 2: Schematic representation of transcellular and paracellular diffusion pathways. ...................25
Figure 3: Schematic illustrating interactions between transmembrane proteins claudins; occludins
(TAMPs); zona occludin (ZO); and actin and myosin light chains. Also showing junctional adhesion
molecules (JAM) and the coxsackie adenovirus receptor (CAR) [not add ...........................................26
Figure 4: Non-Mucosal factors likely to influence the quantification of GI permeability (Travis and
Menzies, 1992). .....................................................................................................................................30
Figure 5: Summary data showing median changes in I-FABP concentrations (pg‧mL-1) between pre-
exercise (with SDs) and post-exercise (with SDs) across exercise studies (Lieberman et al., 1997;
Pelsers et al., 2003; Pelsers, Hermens and Glatz, 2005; van de Poll et al., 2007; Funaoka, Kanda and
Fujii, 2010; van Wijck et al., 2011a; Van Wijck et al., 2012b; Ishimura et al., 2013; Guzel et al., 2014;
Morrison, Cheung and Cotter, 2014; Uzun et al., 2014; Barberio et al., 2015; Lis et al., 2015;
Grootjans et al., 2016; Sessions et al., 2016; Sun et al., 2016; Karhu et al., 2017; Kashima et al., 2017;
March et al., 2017; McKenna et al., 2017; Pugh et al., 2017c; Snipe et al., 2017; Jonvik et al., 2018;
Sheahen et al., 2018; Snipe and Costa, 2018b; Snipe and Costa, 2018a). .............................................38
Figure 6: Borg scale for reporting subjective RPE (Borg, 1974). .........................................................52
Figure 7: Thermal comfort scale for quantification of subjective thermal strain. .................................53
Figure 8: Experimental equipment set up for passive hyperthermia by hot water immesion ...............55
Figure 9: Core temperature response of three participants during pilot work to establish core
temperature response to perceived passive heat stress methods ............................................................56
Figure 10: Protocol schematic for PRE (A), MID (B) and POST (C) exercise trials. Syringe graphics
indicate timing of bood sample collection, the clipboard indicates the timing of gut symptom
questionnaire collection and timing of the sugar-probe solution is indicated by the drink graphc.
Dashed lines indicate the time period before and after the exercise (solid line.) ..................................61
Figure 11: showing mean (A) body mass and core temperature (B) pre- and post-exercise. Also
showing individual values for each condition (PRE, MID, POST) in core temperature and body mass
at pre- and post-exercise. * significant effect of time (P<0.001)...........................................................65
Figure 12: The L/R ratio at immediately post-exercise (A); 60 minutes post-exercise (B); and two
hours post ingestion of the test solution (C). Also showing individual participant responses for PRE,
MID and POST conditions at 0 (immediately post-exercise), 60 minutes post exercise and 120 post
L/R solution ingestion time points. ........................................................................................................68

11
Figure 13: Post-exercise core-temperature (°C) values for all experimental conditions. ......................80
Figure 14: Post-exercise lactate (mmol.L-1) values for all experimental conditions ............................81
Figure 15: Two-hour lactulose/L-rhamnose ratio values for all experimental conditions.. Data are
mean ±SD. .............................................................................................................................................82
Figure 16: Schematic representation of the hot-water immersion protocol...........................................92
Figure 17: Changes in body mass (kg) between pre- and post-hot water immersion for control (CON),
warm (WARM) and hot (HOT) conditions. ..........................................................................................94
Figure 18: (A) Change in core temperature between pre- and post-hot water immersion for all
conditions; (B) showing the core temperature response of participants during hot-water immersion. **
representing a significant effect between time-points ...........................................................................95
Figure 19: Schematic representation of the experimental procedure. .................................................106
Figure 20: Individual 2-hour L/R ratio between the glutamine (GLU) and placebo (PLA) conditions.
.............................................................................................................................................................108
Figure 21: Individual post-HWI I-FABP between the glutamine (GLU) and placebo (PLA) conditions.
.............................................................................................................................................................108
Figure 22: Change in plasma glutamine values between baseline (BA), pre-HWI (PRE) and post-HWI
(POST), for the glutamine (GLU) and placebo (PLA) conditions. .....................................................109
Figure 23: Schematic representation of the main findings from this thesis in regard to the effects of
exercise intensity on GI permeability and GI symptom expression. ...................................................117
Figure 24: Schematic representation of the main findings from this thesis in regard to the effects of
passive hyperthermia, with or without glutamine supplementation on GI permeability and injury, and
symptoms. ............................................................................................................................................119
List of Abbreviations
Å Angstrom
ATP Adenosine triphosphate
Bpm Beats per minute
BMI Body mass index
BW Body weight
cm Centimetre
Da Dalton
EDTA Ethylenediaminetetraacetic acid
EGTA Ethylene glycol tetraacetic acid
ELISA Enzyme-linked immunosorbent assay
g Gram
GI Gastrointestinal
HCI Hydrochloric acid
HIE High intensity exercise
HPLC High-performance liquid chromatography
hr Hour

12
HR Heart rate
HWI Hot water immersion
I-FABP Intestinal fatty acid-binding protein
FABP Fatty acid-binding protein
IL Interleukin
kDa Kilo Dalton
kg kilogram
LPS Lipopolysaccharide
m Meter
MDCK Madin darby canine kidney cell
mL Millilitre
MW Molecular weight
NSAID non-steroidal anti-inflammatory drugs
PPAR peroxisome proliferator activated receptors
PHS Passive heat stress
RER Respiratory exchange ratio
SBF Splanchnic blood flow
SKF Skinfold thickness
SGLT-1 Sodium-dependent glucose transporter - 1
SST Serum separating tube
TC Thermal comfort
Tcore Core temperature
TER Transepithelial resistance
TNF Tumour necrosis factor
VAS Visual analogue scale
V̇O2 max Maximal oxygen uptake
V̇O2 peak Peak oxygen uptake
ZO Zona occulden

13
Chapter 1: Introduction
1.1 Background
The gastrointestinal (GI) system, alternatively referred to as the gut, GI tract or alimentary canal, is
responsible for the transportation, digestion and absorption of nutrients and fluids. It composes one of
the two organ groups of the digestive system, the other group being the accessory digestive organs such
as the salivary glands, liver, gallbladder and pancreas (Tortora and Derrickson, 2017). Exercise results
in a plethora of physiological events, particularly involving the musco-skeletal and cardiorespiratory
systems (Farrell et al., 2012). However, exercise also leads to disturbances in the gastrointestinal (GI)
tract, which can ultimately lead to the appearance of symptoms such as vomiting, diarrhoea or bloating
(Costa et al., 2017b). The appearance of these symptoms can cause impairments in performance for
athletes, as they have to adjust their pace to reduce the magnitude of symptoms, or stop completely (de
Oliveira and Burini, 2009). However, the mechanisms underlying the appearance of GI symptoms
aren’t fully understood and there is a large variation in the individual susceptibility to symptoms (Karhu
et al., 2017). It is estimated that between thirty to ninety percent of athletes experience exercise-related
GI symptoms (de Oliveira, Burini and Jeukendrup, 2014) such as nausea, abdominal pain, vomiting as
well as diarrhoea (van Nieuwenhoven, Brouns and Brummer, 2004; ter Steege, Van der Palen and
Kolkman, 2008; ter Steege et al., 2012; Costa et al., 2017b). There has been a considerable amount of
research investigating the underlying mechanisms behind exercise-related GI symptoms (Costa et al.,
2017b) with reduced splanchnic blood flow and an increase in core temperature being considered the
main contributing factors (de Oliveira, Burini and Jeukendrup, 2014; Pires et al., 2017).
1.1.1: The Intestinal Epithelial Barrier
The small intestine displays structural characteristics to increase its absorptive surface area and
capacity, including being very long (approximately three metres) and internally lined with finger-like
folds known as villi and microvilli to increase absorptive surface area. In addition to being primarily
responsible for the absorption of nutrients (water, organic molecules and ions) into the portal
circulation, the gut also acts as a barrier to protect the internal environment against pathogenic micro-
organisms (Grootjans et al., 2010b; Ward, Keely and Keely, 2014). Collectively, this protective barrier
primarily consists of a mucosal layer comprised of secretions produced by specialist goblet cells found
in the intestinal epithelium. Indeed, the intestinal epithelium itself acts as a secondary barrier and
consists of a monolayer of columnar enterocyte cells and intercellular tight-junctions. Together the
intestinal mucosal layer and enterocytes serve as both a physical and chemical barrier that prevents the
adherence of micro-organisms to the epithelium and the translocation of pathogens into the internal
environment (Grootjans et al., 2016).
14
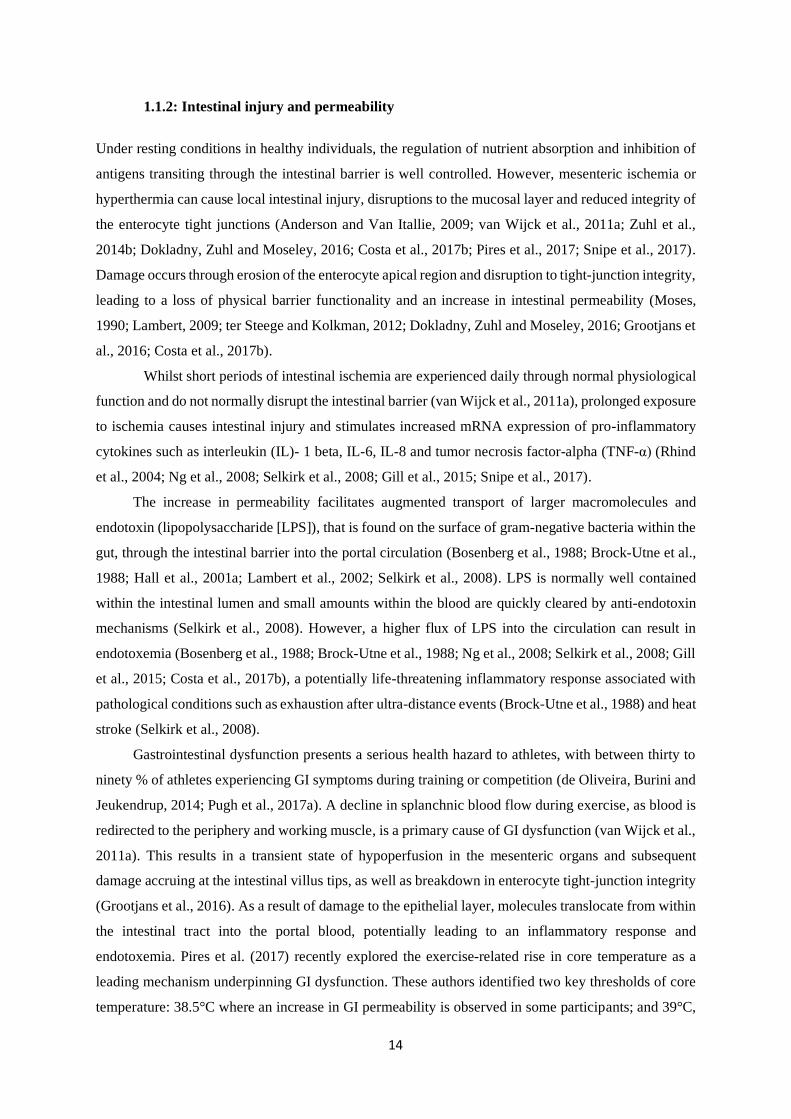
1.1.2: Intestinal injury and permeability
Under resting conditions in healthy individuals, the regulation of nutrient absorption and inhibition of
antigens transiting through the intestinal barrier is well controlled. However, mesenteric ischemia or
hyperthermia can cause local intestinal injury, disruptions to the mucosal layer and reduced integrity of
the enterocyte tight junctions (Anderson and Van Itallie, 2009; van Wijck et al., 2011a; Zuhl et al.,
2014b; Dokladny, Zuhl and Moseley, 2016; Costa et al., 2017b; Pires et al., 2017; Snipe et al., 2017).
Damage occurs through erosion of the enterocyte apical region and disruption to tight-junction integrity,
leading to a loss of physical barrier functionality and an increase in intestinal permeability (Moses,
1990; Lambert, 2009; ter Steege and Kolkman, 2012; Dokladny, Zuhl and Moseley, 2016; Grootjans et
al., 2016; Costa et al., 2017b).
Whilst short periods of intestinal ischemia are experienced daily through normal physiological
function and do not normally disrupt the intestinal barrier (van Wijck et al., 2011a), prolonged exposure
to ischemia causes intestinal injury and stimulates increased mRNA expression of pro-inflammatory
cytokines such as interleukin (IL)- 1 beta, IL-6, IL-8 and tumor necrosis factor-alpha (TNF-α) (Rhind
et al., 2004; Ng et al., 2008; Selkirk et al., 2008; Gill et al., 2015; Snipe et al., 2017).
The increase in permeability facilitates augmented transport of larger macromolecules and
endotoxin (lipopolysaccharide [LPS]), that is found on the surface of gram-negative bacteria within the
gut, through the intestinal barrier into the portal circulation (Bosenberg et al., 1988; Brock-Utne et al.,
1988; Hall et al., 2001a; Lambert et al., 2002; Selkirk et al., 2008). LPS is normally well contained
within the intestinal lumen and small amounts within the blood are quickly cleared by anti-endotoxin
mechanisms (Selkirk et al., 2008). However, a higher flux of LPS into the circulation can result in
endotoxemia (Bosenberg et al., 1988; Brock-Utne et al., 1988; Ng et al., 2008; Selkirk et al., 2008; Gill
et al., 2015; Costa et al., 2017b), a potentially life-threatening inflammatory response associated with
pathological conditions such as exhaustion after ultra-distance events (Brock-Utne et al., 1988) and heat
stroke (Selkirk et al., 2008).
Gastrointestinal dysfunction presents a serious health hazard to athletes, with between thirty to
ninety % of athletes experiencing GI symptoms during training or competition (de Oliveira, Burini and
Jeukendrup, 2014; Pugh et al., 2017a). A decline in splanchnic blood flow during exercise, as blood is
redirected to the periphery and working muscle, is a primary cause of GI dysfunction (van Wijck et al.,
2011a). This results in a transient state of hypoperfusion in the mesenteric organs and subsequent
damage accruing at the intestinal villus tips, as well as breakdown in enterocyte tight-junction integrity
(Grootjans et al., 2016). As a result of damage to the epithelial layer, molecules translocate from within
the intestinal tract into the portal blood, potentially leading to an inflammatory response and
endotoxemia. Pires et al. (2017) recently explored the exercise-related rise in core temperature as a
leading mechanism underpinning GI dysfunction. These authors identified two key thresholds of core
temperature: 38.5°C where an increase in GI permeability is observed in some participants; and 39°C,

15
whereby augmented intestinal permeability is universal in participants. However, the relative
contribution of each of these mechanisms towards the cascade of events leading to GI dysfunction and,
possibly, the appearance of GI symptoms remains unclear. Whilst the underlying aetiology has yet to
be fully delineated, practical approaches towards rescuing some of the reduced splanchnic blood flow
and attenuating the damage caused by heat-stress to the intestinal mucosa have been investigated. The
provision of carbohydrate during exercise (Rehrer et al., 2005) and acute glutamine supplementation
(Mondello et al., 2010) have been shown to increase portal vein flow during exercise and attenuate
ischaemia/reperfusion injury, respectively. Whilst glutamine supplementation has also been shown to
attenuate, both, the increase in core temperature in response to acute heat stress (Soares et al., 2014)
and exercise-induced GI permeability (Zuhl et al., 2015).
Understanding the mechanisms underlying exercise-induced GI dysfunction, with a view towards
developing nutritional strategies to offset these effects, will inform the structure of this thesis. The aim
is to investigate the relationship between GI dysfunction, subjective GI symptoms, and hyperthermia.
The effects of exercise intensity and passive hyperthermia will be examined, along with potential
nutritional strategies that could offset any disturbances to the intestinal barrier. Specifically, the
potential of glutamine to reduce GI permeability and injury will also be examined. To achieve these
aims, the following objectives will be addressed:
1. A comparison between the magnitudes of intestinal permeability elicited when the timing of
the dual-sugar probe solution ingestion is altered relative to exercise performance (Chapter 4).
2. Investigate the effects of exercise intensity on GI permeability, damage and symptoms (Chapter
5).
3. Explore the responses in GI permeability, damage and symptoms in response to passive
hyperthermia (Chapter 6)
4. Investigate the efficacy of glutamine supplementation to reduce GI permeability, damage and
symptoms in response to passive hyperthermia (Chapter 7).

16
Chapter 2: Literature Review
2.0: The Gastrointestinal System
2.1: The Small intestine
Essentially a continuous long tube, the GI tract extends from the mouth to the anus. Foods and fluids
enter the digestive system through the mouth and subsequently facilitated, via muscular contractions,
down the oesophagus and into the stomach for further digestion (Farrell et al., 2012). These muscular
contractions contribute to the physical breakdown and digestion of food through churning and mixing
with secretions extracted within the GI tract, respectively. The stomach connects the oesophagus to the
start of the small intestine (the duodenum) and essentially acts as a reservoir and mixing vessel for
ingested food before it enters the small intestine (Tortora and Derrickson, 2017). The stomach also aids
in the digestion of food and killing of bacteria by secreting a number of substances including gastric
juices and hydrochloric acid. Together, these secretions combined with food and saliva form chyme, a
thick liquid that leaves the stomach and enters the small intestine, where the major actions of digestion
and absorption occur (Tortora and Derrickson, 2017). Following the small intestine, chyme enters the
large intestine where, briefly, bacteria acts to further digest and absorb nutrients as well as water, ions
and vitamins (Tortora and Derrickson, 2017).
2.1.1: Splanchnic blood flow
Splanchnic circulation is delivered via three branches of the aorta: the coeliac trunk, and the superior
and inferior arteries (Harper and Chandler, 2015). Together these arteries perfuse the stomach, spleen,
pancreas, liver and, both, the small and large intestine. Branches of the coeliac trunk supply the stomach,
first 25-30 cm of the small intestine (upper duodenum) and the spleen and pancreas, while the superior
mesenteric artery supplies blood to the rest of the small intestine (duodenum, jejunum and the ileum)
as well as significant part of the large intestine. The inferior mesenteric artery supplies blood to the
descending colon, sigmoid colon and upper rectum (Farrell et al., 2012). Of these three arteries, the
superior mesenteric artery is the largest, delivering over ten % of the cardiac output to the splanchnic
region (Harper and Chandler, 2015). These three arteries branch out into a further three vascular
plexuses, namely the serosal, submucosal and mucosal plexuses. A capillary network from the mucosal
plexus further supplies blood to the intestinal mucosa (Mensink et al., 2006). All blood outflow from
the gastrointestinal tract is collectively delivered to the liver via the hepatic portal vein (Rehrer et al.,
2001; Harper and Chandler, 2015).

17
Figure 1: Schematic representation of the splanchnic circulation (Harper and Chandler, 2015)
Splanchnic blood flow (SBF) is highly adaptive, receiving approximately twenty to twenty five
% of whole-body cardiac output at rest (Matheson, Wilson and Garrison, 2000), with perfusion values
of approximately 30 mL-1 100g-1 of tissue which can decrease to below 10 mL-1 100g-1 under conditions
of low cardiac output, or increase to approximately 250 mL-1 100g-1 following a meal (Harper and
Chandler, 2015). In response to feeding, SBF rises rapidly within five to fifteen minutes of ingestion
and is sequentially increased during nutrient absorption to supply the relevant area of the GI tract with
blood as the chyme moves over the mucosal surface, before returning to baseline once absorption is
completed several hours later (Matheson, Wilson and Garrison, 2000). In contrast, SBF can decline
under physiological, psychological or environmental conditions such as exercise, dehydration, stress,
hyperthermia, medication or a combination (Rowell, 1974; Qamar and Read, 1987; Moses, 1990; Ryan,
Chang and Gisolfi, 1996; van Nieuwenhoven et al., 2000; Rehrer et al., 2001; Lambert et al., 2002;
Lambert et al., 2007; Lambert, 2009; Van Wijck et al., 2012b; Vargas and Marino, 2016; Pires et al.,
2017; Wilson, 2017).
During vigorous exercise splanchnic vascular resistance is increased as a result of splanchnic
vasoconstriction, due to increased sympathetic nervous system activity as norepinephrine, released from
nerve endings during vigorous exercise, binds to α-adrenoreceptors on the sympathetic nervous system
(Rowell, 1974; Pires et al., 2017). In contrast, the vascular resistance of organs under increased
physiological stress (muscles, cardiovascular system, cerebral region and skin) will simultaneously
decrease (Qamar and Read, 1987; Otte et al., 2005; Lambert, 2009; ter Steege and Kolkman, 2012),
with the net result being a reduction in splanchnic blood flow. Specifically, intestinal blood flow has
been shown to reduce by twenty % within ten minutes of the onset of steady-state exercise, increasing

18
to up to eighty % after one hour (Rehrer et al., 2001). This reduction in blood supply reduces the amount
of oxygen available to the tissue, leading to splanchnic ischemia and hypoperfusion of the mesenteric
organs (Ward, Keely and Keely, 2014), the magnitude of which is linearly associated with exercise
intensity (ter Steege and Kolkman, 2012).
2.2: Gastrointestinal symptoms in athletes
2.2.1: Prevalence
The appearance of gastrointestinal symptoms is common amongst athletes, particularly endurance and
ultra-athletes, where the sustained nature of the activities may cause a consistent reduction in splanchnic
blood flow (Rehrer et al., 2001; Gaskell, Snipe and Costa, 2019). However, recent research suggests
that team sport and combat sport athletes may also experience GI symptoms during a typical week
(Pugh et al., 2017a).
Typically quantified using a subjective scale, an accurate quantification of prevalence rates of
GI symptoms amongst athletes is difficult to obtain. Previous research has utilised various visual
analogue scales, which have also included differing lists of symptoms, retrospective or prospective
assessment, and online surveys (ter Steege et al., 2012; Guillochon and Rowlands, 2017; Snipe et al.,
2017). GI symptoms range in their magnitude and severity, from feelings of nausea and bloating, to
ischemic colitis and bloody stools. Nevertheless, de Oliveira, Burini and Jeukendrup (2014) estimate
that between 30 – 90% of distance runners experience exercise-related GI symptoms; furthermore a
more recent survey by Pugh et al. (2017a) suggests that 86% of athletes experience at least one GI
symptom.
The accepted and convenient method of assessing GI symptoms has typically been by the 10
cm visual analogue scale (Bengtsson et al., 2013), which was recently modified by Gaskell, Snipe and
Costa (2019) for specifically assessing GI symptoms during exercise. The results of previous studies
are also confounded by debate as to what constitutes a symptom, as well as separating exercise-related
GI symptoms and what an athlete may experience in normal daily life (Wilson, 2017). For example, in
the case of an Ironman, where competition lasts over eight hours, an athlete may experience the urge to
defecate, but whether this is related specifically to the exercise is debatable. Furthermore, the large
range of symptoms employed on visual scales (nausea, bloating, urge to defecate, side stitch etc.) in
addition to the wide 0 – 10 scale, representing “no symptom”, to “mild” and “severe”, makes the
reporting of research difficult. Nonetheless, previous research indicates that the appearance of
gastrointestinal symptoms in athletes is common, particularly those engaged in endurance sports,
however further research is required investigating the contribution from underlying mechanisms.

19
2.2.2 Mechanisms of GI symptoms in athletes
Whilst we understand the prevalence of GI symptoms to be high amongst athletes, the aetiology is less
well understood. A multifactorial, complex interplay is thought to exist between physiological
mechanisms (ischemia), mechanical stress (due to the jarring nature of some sports such as running),
(Coleman, 2019) and psychological factors as some athletes experience symptoms in competition but
not during training or laboratory conditions (Wilson, 2019). An increase in gastrointestinal permeability
was considered a primary factor, but correlations between GI permeability and symptoms have so far
lacked association. Furthermore, the use of anti-inflammatory drugs, as well as the intake of food or
fluids during exercise appear to exacerbate symptoms, both of which are common amongst athletes
(Costa et al., 2017b; de Oliveira, 2017).
Reduced splanchnic blood flow and exercise-induced heat stress are thought to contribute to
increased permeability (Lambert, 2008; Pires et al., 2017). Augmented permeability, whereby the tight-
junctions bridging the enterocytes become dysfunctional, therefore allowing the translocation of
otherwise impassable molecules, has often been considered a primary cause of exercise-induced GI
symptoms (Karhu et al., 2017). With reduced blood flow, less oxygen is available to perfuse the
intestinal organs, leading to ischemia and subsequent shedding of the villus tips. Whilst this shedding
occurs as part of normal physiological function, sustained ischemia and villus shedding, such as that
observed in response to endurance exercise, can lead to GI dysfunction (Grootjans et al., 2016). Indeed,
GI hypoperfusion may result in physiological responses that contribute to GI barrier dysfunction, such
as oxidative stress (Lambert et al., 2002) and an inflammatory cascade response (Grootjans et al.,
2010a). Whilst low levels of oxidative stress may be beneficial for the GI tract (Lambert et al., 2002),
excessive oxidative stress could be associated with the pathogenesis of GI diseases such as ulcers,
cancer and inflammatory bowel disease (Bhattacharyya et al., 2014). Furthermore, as a result of blood
flow returning to the gut, intestinal ischemia-reperfusion injury may occur through the production of
cytokines, reactive oxygen species contributing to immune activation, inflammation and intestinal
barrier compromise (Grootjans et al., 2010a).
The rise in core temperature associated with exercise results in hyperthermia within the gut
wall, subjecting the tight-junctions of the epithelium to heat stress. As such, hyperthermia has
consistently been shown to augment intestinal permeability in both animal and cell-culture models
(Table 1) through tight-junction dysfunction, with evidence supporting a dose-response relationship
(Pals et al., 1997; Dokladny, Zuhl and Moseley, 2016). Whilst the presence of such correlation is
promising, this does not necessarily represent a causation effect. Indeed, the rise in core temperature
and associated augmented intestinal permeability may be a proxy for other mechanistic, physiological
events which research is yet to identify.
The translocation of potential antigens across the GI barrier, such as endotoxin
(lipopolysaccharides), bacteriophages, large proteins (gliadin) or bacterial DNA, into the blood stream

20
can lead to an inflammatory response similar to that experienced by heat stroke patients (Ogden et al.,
2020). Indeed, heat-stress appears to be a distinct contributor to GI dysfunction, as athletes have
displayed endotoxemia in response to exercise in both laboratory and real-world situations such as
competitive events subject to environmental conditions (Bosenberg et al., 1988; Brock-Utne et al.,
1988; Yeh, Law and Lim, 2013). Participants have also displayed endotoxemia in response to exercise
in hot (35°C), but not neutral (22°C), conditions (Yeh, Law and Lim, 2013; Snipe et al., 2018b).
Together, these physiological events have seen athletes reporting the appearance of symptoms akin to
heat illness, such as dizziness and nausea (Gill et al., 2015; Snipe et al., 2018b).
Outside of physiological consequences such as heat-stress and ischemia, the appearance of GI
symptoms may be related to other factors such as nutritional intake before or during exercise,
mechanical stresses, or the use of anti-inflammatory drugs (Gisolfi, 2000; Lambert et al., 2007; Pfeiffer
et al., 2012). Gastric emptying is not likely affected at exercise intensities less than 70 % V̇O2 max,
however, intensities related to athletic competition, above 80% V̇O2 max, are likely to delay gastric
emptying (Costill and Saltin, 1974). Further evidence suggests that gastric emptying is associated with
exercise-induced GI symptoms such as nausea (van Nieuwenhoven et al., 2000). As such, athletes have
been advised to practice ‘gut training’ to enhance gastric emptying during exercise and avoid meals
high in nutrients such as fibre and protein prior to exercise, to prevent delayed gastric emptying (Costa
et al., 2017a; Costa et al., 2017b). Collectively, it is apparent that the appearance of GI symptoms in
response to exercise may not be related to one specific factor, but is instead governed by a mixture of
factors, some of which are out of the athletes’ control (such as environmental temperature).

21
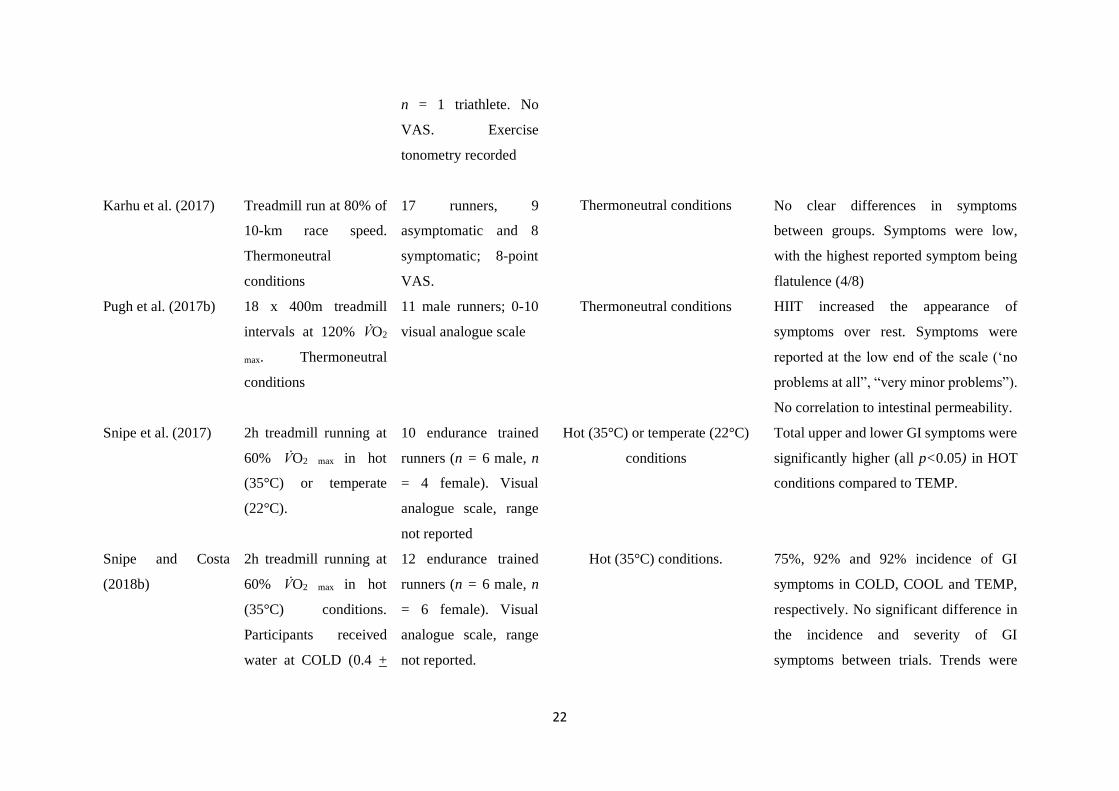
Table 1: A summary of studies reporting exercise-induced GI symptoms.
Authors Protocol Model Environmental Conditions Outcome
(Ryan, Chang and
Gisolfi, 1996)
60 min treadmill
running at ~70%V̇O2 max.
With or without aspirin
ingestion
. n = 7 healthy, active
males. 100-mm visual
analogue scale.
Thermoneutral
conditions
Mild (<10%) symptoms. Neither running
nor aspirin ingestion was associated with
appearance of severe GI symptoms. No
correlation with GI permeability.*
Pals et al. (1997) 60 min treadmill
running at 40, 60 or 80%
V̇O2 max.
n = 6 healthy (n =
male, n = 1 female)
volunteers.
Thermoneutral
conditions
One participant reported cramps (78 mm)
and side stitch (82 mm).
(Lambert et al., 2007) 60 minutes running at
70% V̇O2 max 24oC, 33%
RH
n = 8 (n = 6 male; n =
2 female), healthy,
recreational runners.
133 mm visual
analogue scale.
24oC, 33% RH No appearance of symptoms
Lambert et al. (2008) Treadmill running at
70% V̇O2 max. With or
without fluid intake.
Thermoneutral
conditions
Twenty runners, 11
males and 9 females;
133 mm visual
analogue scale.
Thermoneutral
conditions
Appearance of some symptoms but all
very low. Fluid intake resulted in higher
occurrence of stomach fullness.
(ter Steege et al.,
2012)
30-minute incremental
exercise test on a
cycling ergometer.
12 athletes (n = 7 male,
n = 5 female). n = 5
runners, n = 6 cyclists,
Thermoneutral
conditions
Athletes with GI symptoms reported
increased susceptibility for the
development of ischemia during exercise.
22
n = 1 triathlete. No
VAS. Exercise
tonometry recorded
Karhu et al. (2017) Treadmill run at 80% of
10-km race speed.
Thermoneutral
conditions
17 runners, 9
asymptomatic and 8
symptomatic; 8-point
VAS.
Thermoneutral conditions
No clear differences in symptoms
between groups. Symptoms were low,
with the highest reported symptom being
flatulence (4/8)
Pugh et al. (2017b) 18 x 400m treadmill
intervals at 120% V̇O2
max. Thermoneutral
conditions
11 male runners; 0-10
visual analogue scale
Thermoneutral conditions HIIT increased the appearance of
symptoms over rest. Symptoms were
reported at the low end of the scale (‘no
problems at all”, “very minor problems”).
No correlation to intestinal permeability.
Snipe et al. (2017) 2h treadmill running at
60% V̇O2 max in hot
(35°C) or temperate
(22°C).
10 endurance trained
runners (n = 6 male, n
= 4 female). Visual
analogue scale, range
not reported
Hot (35°C) or temperate (22°C)
conditions
Total upper and lower GI symptoms were
significantly higher (all p<0.05) in HOT
conditions compared to TEMP.
Snipe and Costa
(2018b)
2h treadmill running at
60% V̇O2 max in hot
(35°C) conditions.
Participants received
water at COLD (0.4 +
12 endurance trained
runners (n = 6 male, n
= 6 female). Visual
analogue scale, range
not reported.
Hot (35°C) conditions. 75%, 92% and 92% incidence of GI
symptoms in COLD, COOL and TEMP,
respectively. No significant difference in
the incidence and severity of GI
symptoms between trials. Trends were

23
0.4°C), COOL (7.3 +
0.8°C), or TEMP (22.1
+ 1.2°C).
observed for increased upper-GI on
TEMP compared to other conditions.
Snipe and Costa
(2018a)
2h treadmill running at
60% V̇O2 max in hot
(35°C) conditions.
24 endurance trained
runners (n = 13 male, n
= 11 female). Visual
analogue scale, 10-
point scale, 100 mm.
Hot (35°C) or temperate (22°C)
conditions.
No difference in upper- and lower GI
symptoms between sexes.
Snipe et al. (2018b) 2h treadmill running at
60% V̇O2 max in warm
(30°C) or temperate
(22°C).
10 endurance trained
runners (n = 6 male, n
= 4 female). 10-point
Likert-type rating scale
10 endurance trained runners (n =
6 male, n = 4 female). 10-point
Likert-type rating scale
WARM conditions returned significantly
higher total GI symptoms when compared
to TEMP.
(Wilson, 2017) Participants recorded GI
symptoms during 30
days of habitual
training.
150 endurance trained
runners (n =74 male, n
= 76 female). 10-point
Likert-type rating
scale. Stress and
anxiety measures via
Perceived Stress Scale.
Data not provided Appearance of symptoms during 45.6%
(16.6-67.3%) of training sessions. Age
and running negatively correlated with
occurrence of GI distress. Run RPE,
probiotic food consumption and PSS
scores positively correlated with GI
distress
Pugh et al. (2019) 28 days of probiotic
supplementation prior to
24 endurance trained
runners (n = 20 male, n
= 4 female). 10-point
16 – 17 °C Large range of scores for individual
symptoms in days prior to the race.

24
a track-based marathon
race.
Likert-type rating
scale.
Probiotic supplementation reduced the
incidence of moderate symptoms.*
*Data is shown from placebo arms where a study utilized multiple research interventions

25
2.3: The Gastrointestinal Barrier: Structure and Function
2.3.1: Intestinal Epithelial Tight-Junctions
Transportation of molecules through the intestinal epithelium occurs through paracellular or
transcellular diffusion; where paracellular transport is mediated by the intercellular tight junctions (TJs)
and transcellular transport is regulated by precise cellular membrane channels (Anderson and Van
Itallie, 2009).
Figure 2: Schematic representation of transcellular and paracellular diffusion pathways.
TJs are multi-protein complexes located within the apical region of the enterocyte that regulate
paracellular diffusion, epithelial permeability and, combined with mucous secretions and immune
mediators, serve to bind the enterocytes together (Lambert, 2004; Anderson and Van Itallie, 2009; Shen
et al., 2011). Transportation across TJs is regulated by two key pathways, namely the leak and pore
pathways (Shen et al., 2011). The pore pathway is charge-selective, restricting the transport of charged
molecules across the TJs, and controls paracellular flux of small solutes; in contrast, the leak pathway
regulates transport of large (over four angstroms [Å]) molecules and is unrestrictive to charge (Shen et
al., 2011).
The architecture of the tight-junctions is complex and a systematic description is beyond the
scope of this review, however, the integrity of the TJs is governed by transmembrane barrier proteins
(for example occludin and claudins), thus, greater accumulation of these proteins at the TJ site increases

26
the resistance of the barrier. TJs also consist of cytoplasmic scaffolding proteins such as the zona
occludin (ZO) family, which link the (extracellular) occludin and claudins to intracellular actin
cytoskeleton and regulatory proteins (Anderson and Van Itallie, 2009; Shen et al., 2011).
Permeability of the tight junction is controlled by the phosphorylation and de-phosphorylation of
the epithelial actomyosin protein under the regulation of myosin light-chain kinase (MLCK) and myosin
light-chain phosphatase (MLCP), respectively. Specifically, phosphorylation causes shortening and
opening of the TJ, whereas de-phosphorylation elicits closure of the TJs (Rodgers and Fanning, 2011).
Heat stress and exercise have both been shown to compromise TJ integrity and increase GI permeability,
however, studies thus far have only utilised cell-culture and animal models (Dokladny, Zuhl and
Moseley, 2016) (Table 2).
Figure 3: Schematic illustrating interactions between transmembrane proteins claudins; occludins
(TAMPs); zona occludin (ZO); and actin and myosin light chains. Also showing junctional
adhesion molecules (JAM) and the coxsackie adenovirus receptor (CAR) [not add

27
Table 2: A summary of studies showing the effects of exercise and heat on tight junction proteins.
Authors Protocol Model Outcome
Rao, Baker and Baker
(1999)
Oxidative stress induced by H2O2
exposure
In vitro Caco-2 intestinal epithelial cells Epidermal growth factor (EGF)
delayed TJ permeability
(Prosser et al., 2004) Challenge with 1mM EGTA MDCK cells TER decreased by 60%, (effect was
attenuated by colostrum exposure)
(Ikari et al., 2005) Heat stress, 42°C for 3 h Porcine renal epithelium LLC-PK1 cells Heat stress increased tight-junction
permeability
Dokladny, Moseley
and Ma (2006)
Heat
Increase from 37°C to 41°C over 24 h.
In vitro Caco-2 intestinal epithelial cells Increased TJ permeability
Yang, He and Zheng
(2007)
Heat stress (37°C - 43°C) for 1 h Human intestinal epithelial T84 cell
monolayers
Heat stress increased tight-junction
permeability is a dose-response
manner
(Pearce et al., 2013) Heat stress 35°C 20-35% RH, for 1,3 or
7 d
Crossbred gilts (pigs) TER decreased by 30% indicating TJ
dysfunction
Liu et al. (2012) Heat stress, 40°C for 2 h daily over 3
days
Sprague Dawley rats Heat stress damaged TJ structure
Zuhl et al. (2014b) Glutamine supplementation on heat
induced TJ protein expression
In vitro Caco-2 intestinal epithelial cells Glutamine preserved the stability of
occludin at the TJ

28
Glutamine supplementation on exercise
induced intestinal permeability
n = 8 male (n =5) and female (n=3)
participants. 60 min treadmill running at ~
70 % V̇O2 max
Glutamine prevented exercise-induced
intestinal permeability
Davison et al. (2016) 2°C rise (from 37°C to 39°C) In vitro Caco-2 intestinal epithelial cells Trans-epithelial resistance showed an
inverse relationship with temperature.

29
2.4: Assessment of Gastrointestinal Permeability
The first human investigation into the absorption dynamics of different sugars through the intestine
dates back to 1930 (McCance and Madders, 1930). These authors compared the rate of absorption of
both orally and intravenously administered L-rhamnose, arabinose and xylose. However, it wasn’t until
the 1970s that the introduction of non-metabolisable oligosaccharides facilitated feasible means for
measuring intestinal barrier function (Menzies, 1974). Since then, determination of human small-
intestinal permeability has typically been conducted through the ingestion of a solution containing high-
molecular weight dual-sugar probes followed by subsequent quantification of the ratio of the fractional
excretion of the larger molecule to the smaller molecule in the urine (Menzies, 1974) or serum/plasma
(Fleming et al., 1996). Two probes are used since quantifying the ratio of specific large and small
molecules presents greater interpretive value than if only one probe was used (Menzies, 1974). For the
assessment of intestinal permeability the most commonly utilized combination of molecules is lactulose
and mannitol (Wang et al., 2015), however L-rhamnose is also used and more common in exercise-
related studies (van Nieuwenhoven et al., 1999; Lambert, 2008; Lambert et al., 2012; van Wijck et al.,
2013; Pugh et al., 2017b). The absorption rate of the sugar probes can be affected by certain
physiological variations and diseases, so the need for participant screening and pre-experimental control
is high. For example, in patients with coeliac disease, L-rhamnose absorption is decreased whilst
lactulose absorption is increased. Furthermore, individual variations such as gastric emptying, intestinal
transit and dilution by secretions can influence the absorption of the sugar probes (Fig. 2.3) (Travis and
Menzies, 1992).
It is known that the probes transit through different areas of the crypt-villus axis of the small
intestine dependent on their size. As the cells mature along the axis (from bottom to top) the channels
decrease in size but become more abundant with the channels at the tip of the villus being approximately
<6 A, compared to those at the crypt (50-60 A). At the villus base there are also intermediate-sized
channels approximately 10 – 15 A (Fihn, Sjoqvist and Jodal, 2000). This data would suggest that larger
molecules such as disaccharides and probes of this structure e.g. lactulose, would be confined to the
lower channels, whereas L-rhamnose would readily transport across the villus tips (Arrieta, Bistritz and
Meddings, 2006).
Lactulose is a disaccharide comprised of galactose and glucose with a large molecular weight
(MW) (342Da) and (due to this high MW) is believed to only translocate across the intestinal wall
through the paracellular pathway (Vojdani, 2013). Since lactulose is non-digestible in the small intestine
and only begins to be degraded in the colon by colonic bacteria, its appearance in urine or plasma can
be utilized as a marker of small intestinal permeability (Arrieta, Bistritz and Meddings, 2006). In
contrast, L-rhamnose is a monosaccharide with a molecular weight of 164Da and transfers through the
gut wall via the transcellular pathway (Vojdani, 2013). Monosaccharides are consumed as part of the

30
test to control for non-barrier-related factors between experimental conditions such as: tissue
distribution (Bjarnason, MacPherson and Hollander, 1995); the surface area of the epithelium; and the
available time for permeation (Arrieta, Bistritz and Meddings, 2006). Despite these differences, a
common factor between the sugars is that they remain largely intact and unaltered throughout the
digestion process and their rate of appearance in the urine or plasma is directly correlated to their
absorbed quantity (Sequeira et al., 2014).
The majority of studies utilize a ‘classical’ dual-sugar probe assay consisting of lactulose and,
either, mannitol or L-rhamnose. This assay provides insight into the permeability characteristics of the
upper GI tract due to colonic degradation of the sugar probes (van Wijck et al., 2011b). However,
researchers began adding sucrose to sugar-probe assays to provide an analysis of gastroduodenal
permeability (Lambert et al., 2008) since sucrose is not completely broken down until reaching the
jejunum (Sutherland et al., 1994; Meddings, Wallace and Sutherland, 1995). Furthermore, sugar-probe
assays should contain additional probes, such as erythritol to enable a thorough analysis of permeability
throughout the length of the GI tract. However, these more complex assays require analysis through
highly sensitive liquid chromatography tandem mass spectrometry (van Wijck et al., 2011b).
Figure 4: Non-Mucosal factors likely to influence the quantification of GI permeability (Travis and
Menzies, 1992).

31
2.4.1: Urine and blood determination of dual sugar probes
Analysis of intestinal permeability can be performed through urine, plasma or serum sample analysis,
through the determination of sugar recovery and ratio. Whilst these tests correlate significantly (van
Wijck et al., 2013), urinary concentrations are approximately 100-fold higher than plasma
concentrations (Travis and Menzies, 1992). The higher concentrations from urine are argued to make
analysis easier and more reliable (Travis and Menzies, 1992). Urine analysis requires the frequent
collection of urine from periods of five to twenty-four hours post-exercise in a fasted state. This
drawback increases the difficultly of sugar probe assessment before and immediately after exercise, as
well as at shorter intervals after the exercise. Inaccuracies in the timing or quality of sample provision
and collection (pooling) can also lead to errors in sugar probe concentration (Fleming et al., 1996).
However, a longer period of sample collection increases the exposure of the gut to the test sugars, which
can contribute to its permeability; this may explain the larger magnitude of permeability demonstrated
from urinary analysis (Brunetto et al., 1990). An alternative to urinary analysis is through
plasma/serum-based permeability analysis which facilitates logistically easier and more frequent
sampling over time. Blood samples taken two hours post ingestion of the sugar-probe solution can be
analyzed for the ratios of L/R, therefore reducing the total amount of time for sample collection
(Fleming et al., 1996).
2.4.2: Sugar-probe assay dosage and timing
Currently there are no specific standards or guidelines towards the optimal dose of sugar probes to
quantify intestinal permeability. Instead, previous research reports the use of a variety of dosages and
combinations of probes. For example, in their landmark exercise study, Pals et al. (1997) utilized a test
solution composed of 5 g sucrose, 5 g lactulose and 2 g of L-rhamnose diluted in 50 mL of water; this
is similar to a test solution used by Lambert et al. (2008) however these authors diluted their probes in
150 mL of water. van Wijck et al. (2011a) used a test solution containing 1 g lactulose, 1 g sucralose,
1 g erythritol, 1 g sucrose and 0.5 g L-rhamnose, diluted in 150 mL tap water; whilst Snipe and Costa
(2018a) recently utilized a test solution containing 5 g lactulose and 1 g of L-rhamnose. Together, the
different compositions of these test solutions could display different absorption characteristics (Gisolfi
et al., 1998; Gisolfi, Lambert and Summers, 2001; Tokuda and Yu, 2019) and therefore affect the
appearance of the sugars for subsequent analysis; however, research is yet to investigate this hypothesis.
Similarly, previous research shows discrepancies in the timing of the provision of sugar-probe
solution. Test solutions are generally provided acutely around exercise i.e., within thirty minutes
preceding and following exercise, or at a point during exercise performance; however, there is no
32
consistency between studies in terms of administration. Table.3 demonstrates some of the variation in
both the composition of the sugar-probe test solution and the point of provision/ingestion.
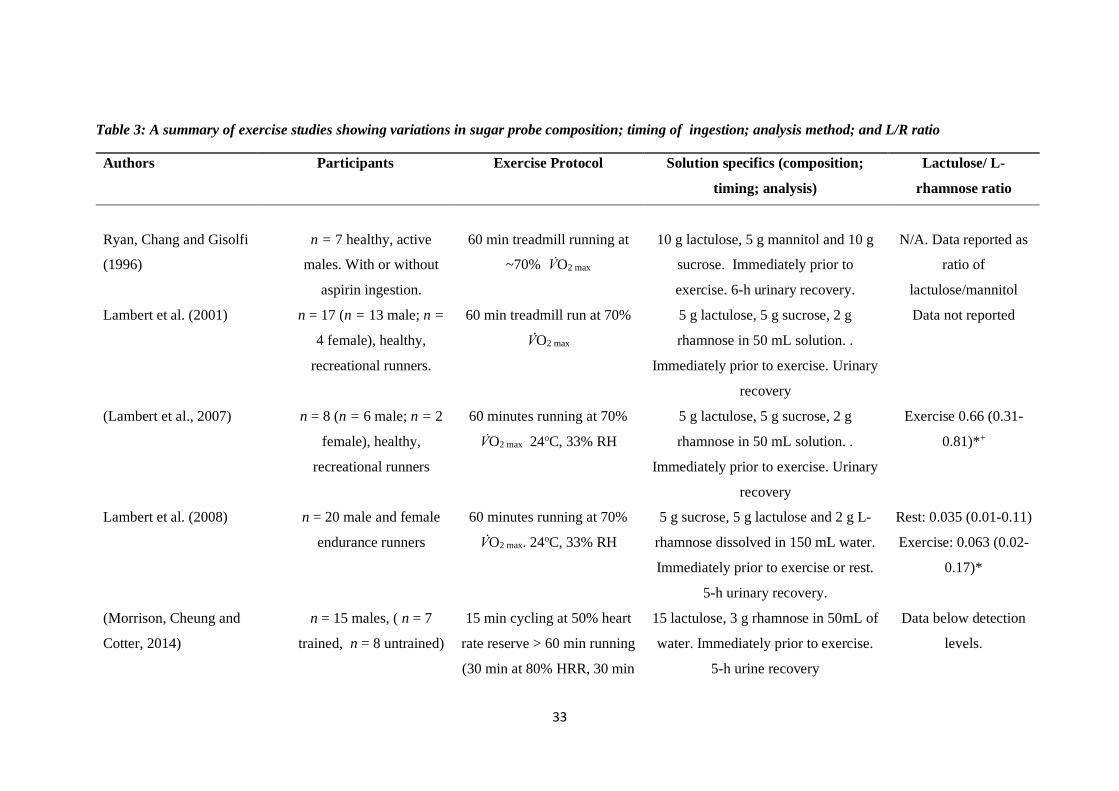
33
Table 3: A summary of exercise studies showing variations in sugar probe composition; timing of ingestion; analysis method; and L/R ratio
Authors Participants Exercise Protocol Solution specifics (composition;
timing; analysis)
Lactulose/ L-
rhamnose ratio
Ryan, Chang and Gisolfi
(1996)
n = 7 healthy, active
males. With or without
aspirin ingestion.
60 min treadmill running at
~70% V̇O2 max
10 g lactulose, 5 g mannitol and 10 g
sucrose. Immediately prior to
exercise. 6-h urinary recovery.
N/A. Data reported as
ratio of
lactulose/mannitol
Lambert et al. (2001) n = 17 (n = 13 male; n =
4 female), healthy,
recreational runners.
60 min treadmill run at 70%
V̇O2 max
5 g lactulose, 5 g sucrose, 2 g
rhamnose in 50 mL solution. .
Immediately prior to exercise. Urinary
recovery
Data not reported
(Lambert et al., 2007) n = 8 (n = 6 male; n = 2
female), healthy,
recreational runners
60 minutes running at 70%
V̇O2 max 24oC, 33% RH
5 g lactulose, 5 g sucrose, 2 g
rhamnose in 50 mL solution. .
Immediately prior to exercise. Urinary
recovery
Exercise 0.66 (0.31-
0.81)*+
Lambert et al. (2008) n = 20 male and female
endurance runners
60 minutes running at 70%
V̇O2 max. 24oC, 33% RH
5 g sucrose, 5 g lactulose and 2 g L-
rhamnose dissolved in 150 mL water.
Immediately prior to exercise or rest.
5-h urinary recovery.
Rest: 0.035 (0.01-0.11)
Exercise: 0.063 (0.02-
0.17)*
(Morrison, Cheung and
Cotter, 2014)
n = 15 males, ( n = 7
trained, n = 8 untrained)
15 min cycling at 50% heart
rate reserve > 60 min running
(30 min at 80% HRR, 30 min
15 lactulose, 3 g rhamnose in 50mL of
water. Immediately prior to exercise.
5-h urine recovery
Data below detection
levels.

34
distance trial) > 15 min
cycling at 50% heart rate
reserve. 30°C, 50% RH.
With or without bovine
colostrum
Shing et al. (2014) n = 10 male runners Time to fatigue at 80%
ventilatory threshold at 35 oC
40%RH
5 g lactulose, 5 g rhamnose and 5 g
sucrose in 100 mL water. Immediately
prior to exercise. Urinary excretion.
Data presented as
percentage change.
Ratios not expressed
Pugh et al. (2017b) n = 11 male endurance
trained runners
18 x 400-m intervals at 120%
V̇O2 max
5 g lactulose, 2 g rhamnose, 1 g
sucrose, 0.5 g D-xylose in 50 mL of
water. Urine and serum analysis. 15
minutes pre-exercise
Serum analysis
Rest: 0.031 + 0.021
Exercise: 0.051 +
0.015.*
Urinary
Rest: 0.030 + 0.005
Exercise: 0.032 +
0.005
(Pals et al., 1997) n = 6 healthy (n = male,
n = 1 female) volunteers.
60 min treadmill running at
40, 60
5 g sucrose, 5 g lactulose, 2 g
rhamnose in 50 mL water. 30 minutes
during exercise. 5-h urinary recovery.
Rest: 0.048 + 0.01
40%: 0.056 + 0.01
60%: 0.064 + 0.01
80%: 0.107 + 0.02*

35
Van Wijck et al. (2012b) n = 9 healthy male
cyclists and triathletes
60 minutes cycling at 70 %
maximal power output
1 g lactulose, 1 g sucralose, 1 g
erythritol, 1 g sucrose, 0.5 g L-
rhamnose in 150 mL of tap water. 30
minutes during exercise. 2h urinary
recovery
Rest: 0.01 (0.02-0.04)
Exercise: 0.03 (0.00-
0.20)
Zuhl et al. (2014b) n = 8 endurance trained
adults. (n = 5 men and n
= 3 women).
60 min treadmill run at 65-
70% of V̇O2 max
5 g lactulose and 2 g rhamnose in 50-
mL water. 20 minutes during exercise.
5-h urinary recovery
Rest: 0.0218 + 0.008
Exercise: 0.0603 +
0.047*
Zuhl et al. (2015) n = 7 endurance trained
adults (n= 2 male, n =
female)
60 min treadmill run at 65-
70% of V̇O2 max at 30°C
5 g lactulose and 2 g rhamnose in 50-
ml water. 20 minutes during exercise.
5-h urinary recovery
Rest: 0.02 + 0.01
Exercise: 0.06 + 0.01*
Pugh et al. (2017c) n = 10 recreationally
active males
60 min treadmill run at 70%
V̇O2 max. 30 oC, 40-45% RH
5 g lactulose, 2 g rhamnose. 15
minutes during exercise. Serum
analysis
Data not provided
Snipe and Costa (2018a) n = 24 (n = 13 male and
n = 11 female) endurance
trained runners.
120 minutes treadmill
running at 60% V̇02 max in
35°C.
5 g lactulose, 1 g L-rhamnose
dissolved in 100 mL water. 90 minutes
into exercise. 5-h urine recovery
Post-exercise: males
0.030 (0.017-0.044)+
Females (0.028 (0.011-
0.046)+
Smetanka et al. (1999) n = 34 (n =20 men, n =
14 women).
1996 Chicago Marathon 5 g sucrose, 5 g lactulose and 2 g
rhamnose dissolved in 40 mL of water.
Urinary analysis. 15 minutes
Control: 0.022 + 0.01
Runners: 0.019 +
0.01*

36
Post-race. 5-h urine recovery
March et al. (2017) n = 18, healthy males 20 min Treadmill run at 80%
V̇O2peak. With or without 14
days colostrum
supplementation
5 g lactulose, 2 g of mannitol, 1 g of
rhamnose. Immediately post-exercise.
5-hour urinary analysis.
Baseline: 0.35 + 0.06
Exercise: 0.95 + 0.12
*= Significant difference, + = data is median (range). Data is shown from placebo arms where a study utilized multiple research interventions

37
2.4.3: Summary
Differences in the composition and timing of sugar-probe ingestion, exercise stimulus, environmental
conditions and analysis methodology makes study comparison difficult. The ‘classic’ dual-sugar probe
assay has been developed to include additional probes to facilitate analysis of permeability to specific
regions of the gastrointestinal tract (van Wijck et al., 2011b). Research has shown that dehydration
(Lambert et al., 2008), hyperthermia (Pires et al., 2017), exercise intensity (Pals et al., 1997) and
NSAIDs (Lambert et al., 2007; Van Wijck et al., 2012b; Zuhl et al., 2014b) can exacerbate intestinal
permeability. However, research is warranted to investigate how the timing of sugar-probe assay
administration, in relation to exercise performance, impacts the reported magnitude of intestinal
permeability.
2.5: Assessment of intestinal injury: Novel biomarkers.
In assessing GI dysfunction there is a subtle distinction to be drawn between GI permeability and GI
injury with the latter not being synonymous with the former. In response to enterocyte tissue injury,
cellular proteins known as biochemical markers are released into the plasma. One of these biomarker
proteins is fatty acid-binding protein (FABP), a cytosolic protein with an atomic mass of 15 kDa,
expressed in abundance within tissues with a dynamic fatty acid metabolism, such as the heart, liver
and intestine (Pelsers, Hermens and Glatz, 2005). The cellular expression of FABPs is primarily
regulated at the transcriptional level, responsive to alterations in lipid metabolism. Whilst the primary
function of FABPs is to facilitate transport of intracellular long-chain fatty acids, secondary functions
include the regulation of gene expression through mediation of fatty acid signal translocation to
peroxisome proliferator activated receptors (PPARs) (Wolfrum et al., 2001; Pelsers, Hermens and
Glatz, 2005).
Exercise induced ischemia causes disruption to the integrity of the mature enterocytes located
at the apical region of the intestinal villi, as these are most affected by hypoxia since they are already
in a state of low oxygen. (Barberio et al., 2015; Grootjans et al., 2016). The further reduction in
oxygenation results in dysfunction to the epithelial membrane and subsequent release of I-FABP into
the plasma (van Wijck et al., 2011a), making I-FABP a convenient marker of intestinal damage (Derikx
et al., 2009). Research has shown that both steady state (van Wijck et al., 2011a; Barberio et al., 2015)
and high-intensity interval (Kashima et al., 2017) endurance exercise can result in a release of I-FABP
into the plasma. Interestingly, ingestion of non-steroidal anti-inflammatory drugs (NSAIDs) can
exacerbate this response, causing an augmented release of I-FABP when compared to exercise alone
and even at rest (Van Wijck et al., 2012b).
Whilst there is currently no normative data regarding resting levels of I-FABP in healthy
individuals, the majority of exercise-based studies report resting levels of I-FABP ranging from

38
approximately 200 to 300 picograms per milliliter (pg‧mL-1) (van Wijck et al., 2011a; Van Wijck et al.,
2012b; Sessions et al., 2016; Karhu et al., 2017). However, resting values of over 600 pg.mL-1 have
also been reported (Barberio et al., 2015; March et al., 2018), suggesting that a standardized protocol
for I-FABP collection and analysis is warranted, as cross-comparison between studies is difficult. Post-
exercise values of I-FABP seem to be approximately two-fold of resting values, despite differences in
exercise prescription (running vs. cycling and steady state vs. high intensity interval training) and
duration. For example, thirty minutes of intermittent cycling returned similar changes to pre- and post-
exercise I-FABP values than ninety minutes of treadmill running (Karhu et al., 2017; Kashima et al.,
2017). There also appears to be a large amount of deviation from the mean values. Furthermore,
comparison between studies is difficult due to differing reporting methods, for example, some
researchers report changes in mean values in pg‧mL-1 (Barberio et al., 2015; Karhu et al., 2017), whilst
some report changes in percentage from baseline (Snipe and Costa, 2018b), median and interquartile
range (March et al., 2018), or magnitude-based inferences (Pugh et al., 2017c).
Figure 5: Summary data showing median changes in I-FABP concentrations (pg‧mL-1) between
pre-exercise (with SDs) and post-exercise (with SDs) across exercise studies (Lieberman et al., 1997;
Pelsers et al., 2003; Pelsers, Hermens and Glatz, 2005; van de Poll et al., 2007; Funaoka, Kanda and
Fujii, 2010; van Wijck et al., 2011a; Van Wijck et al., 2012b; Ishimura et al., 2013; Guzel et al., 2014; Morrison, Cheung and Cotter, 2014; Uzun et al., 2014; Barberio et al., 2015; Lis et al., 2015; Grootjans
et al., 2016; Sessions et al., 2016; Sun et al., 2016; Karhu et al., 2017; Kashima et al., 2017; March et al., 2017; McKenna et al., 2017; Pugh et al., 2017c; Snipe et al., 2017; Jonvik et al., 2018; Sheahen et
al., 2018; Snipe and Costa, 2018b; Snipe and Costa, 2018a).
Plasma D-lactate, one of two stereoisomeric forms of lactate (D and L), is a byproduct of bacterial
fermentation in the GI tract, and another biomarker which has been identified as a potential indicator

39
of intestinal injury (Evennett et al., 2009). Both forms of lactate are produced from and metabolized to
pyruvate by the action of the enzyme lactate dehydrogenase (LDH). However, the enzyme is isomer-
specific so that production and metabolism of D-lactate requires D-LDH and L-lactate requires L-LDH.
Metabolic production of D-lactate in humans is possible despite not having D-LDH and may occur as
a result of the methylglyoxal pathway, a pathway of glycolysis that results in nanomolar concentrations
of methylglyoxal, a neurotoxic product that is converted to D-lactate (Uribarri, Oh and Carroll, 1998;
Ewaschuk, Naylor and Zello, 2005). In healthy individuals, a low level of circulating D-lactate is normal
(5-20 µmol/L in healthy adults), however, under circumstances of intestinal barrier dysfunction
circulating levels increase due to augmented translocation from within the GI tract into the plasma
(Grootjans et al., 2010b). Indeed, plasma D-lactate has been shown to increase in response to exercise
in trained participants (Kondoh, Kawase and Ohmori, 1992) but correlation with exercise duration or
intensity has been inconsistent (see Chapter 5). Additionally, the test is also sensitive to precision
detection methods, with the enzyme-linked immunosorbent assay technique returning a higher degree
of range and precision than a rapid assay UV colour-metric technique (see Chapter 5). Therefore, further
research is required to investigate the methodologies and efficacy of D-lactate as a marker of intestinal
permeability and injury.

40
Table 4: Summary of studies demonstrating the response in I-FABP concentrations to exercise
Authors Participants Protocol Outcome
van Wijck et al. (2011a) n = 15 healthy, endurance trained
males
60 min cycling at 70% maximum
workload capacity
I-FABP increased from 309 + 46 pg‧mL-1 to 615 + 118
pg‧mL-1
Van Wijck et al. (2012b) n = 9 healthy males, cyclists or
triathletes
60 minutes cycling at 70 %
maximal power output. With or
without ibuprofen
I-FABP increased from 295 + 46 pg‧mL-1 to 474 + 74
pg‧mL-1. Ibuprofen resulted in higher I-FABP levels
(baseline: 328 + 32 pg‧mL-1 to 875 + 137 pg‧mL-1 )
Morrison, Cheung and
Cotter (2014)
n = 15 males, ( n = 7 trained, n =
8 untrained)
15 min cycling at 50% heart rate
reserve > 60 min running (30 min
at 80% HRR, 30 min distance
trial) > 15 min cycling at 50%
heart rate reserve. 30°C, 50%
RH. With or without bovine
colostrum
Trained: baseline: 143 + 59 pg‧mL-1; post-exercise: 949
+ 423 pg‧mL-1
Untrained: baseline: 160 + 93 pg‧mL-1; post-exercise:
443 + 260 pg‧mL-1
No effect from bovine colostrum on I-FABP levels
Barberio et al. (2015) n = 8 healthy, endurance trained
males
5 consecutive days of exercise
and heat exposure (40°C, 40%
RH). Intensity at 4 mM blood
lactate until exhaustion
I-FABP significantly increased from 640.2 pg‧mL-1 +
125.0 (rest) to 936.7 pg‧mL-1+ 149 (post-exercise). Mean
data from Days 1-3
Lis et al. (2015) n = 13 competitive cyclists ( n =
8 male, n = 5 female)
45 min cycle at 70% peak power,
followed by 15-minute time-trial.
7-day gluten or gluten-free diet
I-FABP increased from 94 + 83 and 99 + 57 pg‧mL-1 to
304 + 191 and 301 + 252 pg‧mL-1 in the gluten and
gluten-free trials, respectively.

41
Sessions et al. (2016) n = 7 healthy, endurance trained
athletes. ( n = 5 male, n = 2
female)
60 min treadmill run at 70% V̇O2
max. 30°C, RH 12-20%. With or
without carbohydrate gel
Carbohydrate: baseline: 261.74 + 160.27 pg‧mL-1; post-
exercise: 524 + 381.25 pg‧mL-1
Placebo: baseline: not-reported; post-exercise: 337.96 +
207.38 pg‧mL-1
Karhu et al. (2017) n = 17 active runners, 9
asymptomatic and 8 symptomatic
for GI symptoms.
Treadmill run at 80% of 10-km
race speed. Thermo-neutral
conditions
Asymptomatic runners showed significantly high
increase from baseline to post-exercise (314 + 152
pg‧mL-1 vs. 804 + 599 pg‧mL-1). Symptomatic (baseline:
389 + 327 pg‧mL-1; post: 961 + 949 pg‧mL-1)
March et al. (2017) n = 18, healthy males 20 min Treadmill run at 80%
V̇O2peak. With or without 14 days
colostrum supplementation
Placebo: baseline: 578 (399) pg‧mL-1; post-exercise:
928 (382) pg‧mL-1
Colostrum: baseline: 672 (394) pg‧mL-1; post-exercise:
684 (481) pg‧mL-1. Data presented as median and
(interquartile range)
McKenna et al. (2017) n = 10, active, healthy males 46 + 7.75 min run at 95%
ventilator threshold. 40°C, 50%
RH. 14-day supplementation
with bovine colostrum or placebo
No significant difference between conditions. Relative
increase from baseline to post-exercise: Col 162 + 50%,
Pla 162 + 56%
Pugh et al. (2017c) n = 10, recreationally active,
healthy males
60-min treadmill run at 70%
V̇O2 max (30°C). Placebo, 0.25,
0.5 and 0.9 g kg-1 fat-free mass.
Glutamine supplementation was possible or likely to
reduce pre-exercise I-FABP. Glutamine at 0.5 g kg-1 and
0.9 g kg-1 was likely to lower post-exercise I-FABP.
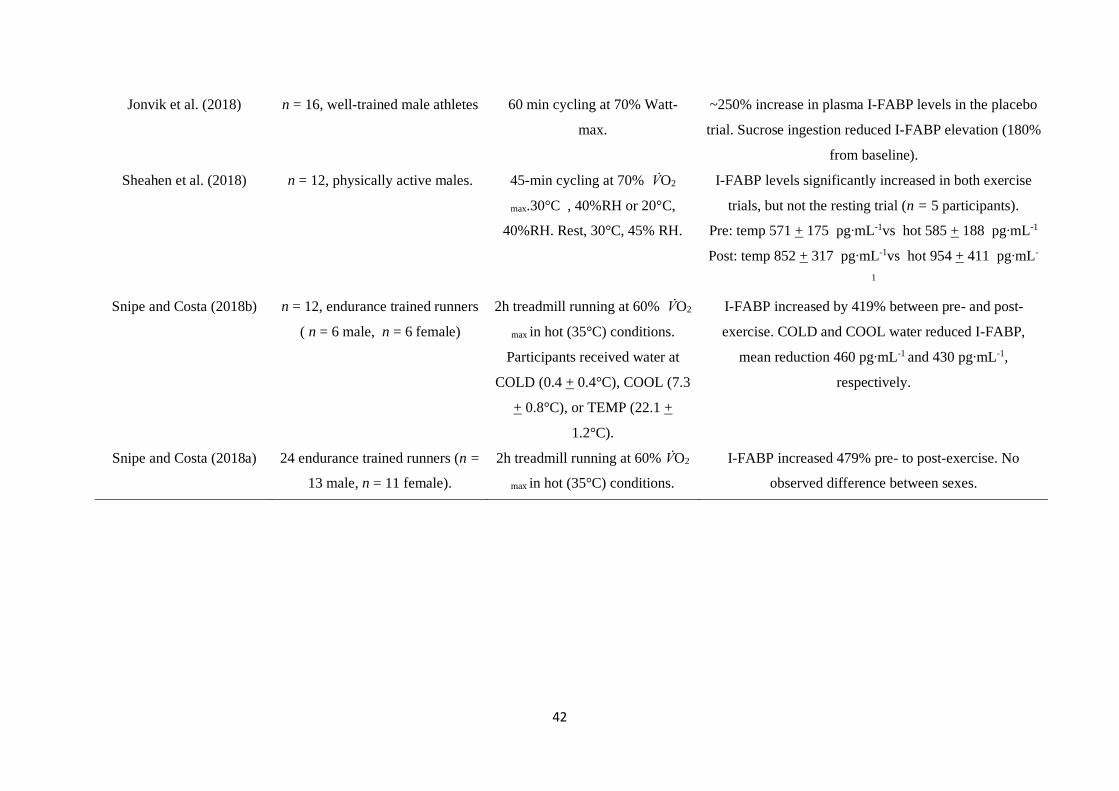
42
Jonvik et al. (2018) n = 16, well-trained male athletes 60 min cycling at 70% Watt-
max.
~250% increase in plasma I-FABP levels in the placebo
trial. Sucrose ingestion reduced I-FABP elevation (180%
from baseline).
Sheahen et al. (2018) n = 12, physically active males. 45-min cycling at 70% V̇O2
max.30°C , 40%RH or 20°C,
40%RH. Rest, 30°C, 45% RH.
I-FABP levels significantly increased in both exercise
trials, but not the resting trial (n = 5 participants).
Pre: temp 571 + 175 pg‧mL-1vs hot 585 + 188 pg‧mL-1
Post: temp 852 + 317 pg‧mL-1vs hot 954 + 411 pg‧mL-
1
Snipe and Costa (2018b) n = 12, endurance trained runners
( n = 6 male, n = 6 female)
2h treadmill running at 60% V̇O2
max in hot (35°C) conditions.
Participants received water at
COLD (0.4 + 0.4°C), COOL (7.3
+ 0.8°C), or TEMP (22.1 +
1.2°C).
I-FABP increased by 419% between pre- and post-
exercise. COLD and COOL water reduced I-FABP,
mean reduction 460 pg‧mL-1 and 430 pg‧mL-1,
respectively.
Snipe and Costa (2018a) 24 endurance trained runners (n =
13 male, n = 11 female).
2h treadmill running at 60% V̇O2
max in hot (35°C) conditions.
I-FABP increased 479% pre- to post-exercise. No
observed difference between sexes.

43
2.6: Effects of exercise on gastrointestinal permeability
2.6.1: Reduced splanchnic blood flow and oxygen availability
The release of norepinephrine close to the alpha-sympathetic nervous system during exercise promotes
vasoconstriction and thus increasing vascular resistance in the splanchnic area. Thus, blood flow is
rapidly redistributed away from the gut in favor of the periphery, working muscle and cardiovascular
system so-as-to facilitate thermoregulation and muscle metabolism. The most pronounced decrease in
perfusion occurs within the first ten minutes of exercise, returning to baseline within one hour of
exercise (Qamar and Read, 1987; Matheson, Wilson and Garrison, 2000; Rehrer et al., 2001; van Wijck
et al., 2011a). This hypoperfusion leads to decreased villus oxygenation and subsequent mesenteric
ischemia. As a consequence of ischemia, mesenteric acidosis increases along with a local depletion of
ATP, and this cascade of events ultimately results in dysfunction of the tight junction proteins leading
to mucosal/enterocyte injury, dysfunction of the GI barrier and increase in intestinal permeability (van
Wijck et al., 2012a; Grootjans et al., 2016).
The magnitude of intestinal injury and permeability has been correlated with that of exercise-
induced hypoperfusion (van Wijck et al., 2011a; ter Steege et al., 2012). Intestinal injury is predicated
upon an initial ischemia and a subsequent reperfusion stress which sees upregulated NF-ĸB gene
expression within the epithelial cells, which signals the release of pro-inflammatory cytokines such as
interleukin (IL)-1β, tumor necrosis factor (TNF)-α and interferon (IFN)-γ, and a subsequent local
inflammatory cascade (Costa et al., 2017b). Interestingly, the reperfusion of the organs can also cause
an inflammatory response, further intestinal damage and impaired gastrointestinal integrity (Derikx et
al., 2008b; Grootjans et al., 2010a). This inflammatory response and subsequent injury to the epithelial
lining has been observed following forty-five (Grootjans et al., 2010a), but not thirty (Matthijsen et al.,
2009) minutes of ischemia in a section of the jejunum during surgical procedures. These findings
suggest that the duration of ischemia could be an important factor as relates to the extent of intestinal
barrier dysfunction induced by transient hypoperfusion. However, questions remain regarding the
underlying mechanism between these two timeframes, furthermore these trials were conducted in
clinical situations, with complete blood flow reduction and not during exercise trials. Whether the same
response is witnessed following similar duration of exercise remains to be investigated, yet, research of
this nature would have to also consider the contribution of exercise-induced hyperthermia which rises
in accordance with exercise duration (Gleeson, 1998).
2.6.2: Exercise intensity
Current literature regarding the influence of exercise intensity on intestinal permeability is inconsistent.
It would appear, however, that for exercise to have an influence on intestinal permeability, a minimum

44
intensity of 70 % V̇O2 max is required (Pals et al., 1997; Dokladny, Zuhl and Moseley, 2016; Costa et al.,
2017b). Only one study has purposefully investigated a possible relationship between exercise intensity
and intestinal permeability (Pals et al., 1997). These authors compared the effects of sixty minutes of
treadmill running at 40, 60 and 80 % V̇O2peak in six (n = 5 males and n = 1 female) healthy participants
(mean V̇O2peak = 57.7±6 2.1 mL‧kg-1‧min-1). They reported a significant increase in L/R appearance in
urine during the 80 % V̇O2peak trial, but no linear association between exercise intensity and intestinal
permeability. The results of this study appear contradictory however, as running at 60 % V̇O2peak
returned a lower increase in L/R appearance than running at 40 % V̇O2peak. Furthermore, other research
has shown a dose-response effect with other factors such as heat stress (Dokladny, Moseley and Ma,
2006).
The relationship between exercise intensity and intestinal permeability (and injury) is further
contradicted by some studies (Lambert et al., 2008; Yeh, Law and Lim, 2013) showing both an increase
and no change in permeability whilst running for 60 minutes at 70 % V̇O2 max. These studies
demonstrated that additional physiological stress, such as dehydration (Lambert et al., 2008) or
environmental (hyperthermia) challenge (Yeh, Law and Lim, 2013) may be required for intestinal
permeability to increase, at least whilst exercising at 70 % of V̇O2 max.
Despite these observations, exercise above 80 % V̇O2 max consistently shows an increase in
intestinal permeability relative to rest (Pals et al., 1997; Marchbank et al., 2011; Pugh et al., 2017b).
However, studies utilizing intensities at or above 80 % V̇O2 max are limited, perhaps due to the difficulty
in maintaining this exercise intensity for a prolonged duration. However, (Pugh et al., 2017b), utilized
a high-intensity intermittent treadmill running protocol (18 x 400m runs at 120% 80 % V̇O2 max). The
results demonstrated a ~60 % increase in L/R appearance (permeability), and a 72 % increase in I-FABP
appearance (injury) when compared to rest.
The contributory role of exercise intensity towards intestinal permeability has thus far returned
contradictory results and requires further clarification. Research has suggested that a minimum exercise
intensity threshold of 70 % of V̇O2 max/peak is required, combined with other stress factors, such as heat
or dehydration, to elicit an increase in intestinal permeability. Specifically, research is warranted
investigating a possible dose-response relationship between exercise intensity and intestinal
dysfunction.
2.6.3: Exercise duration
Recent years have seen an increase in participation in endurance sports such as running or cycling;
furthermore, the prevalence of ultra-events, which are classified as races over the standard marathon
distance, has also increased (Nikolaidis and Knechtle, 2018). Endurance athletes frequently report the
appearance of GI symptoms and, indeed, the majority of research has utilised an endurance exercise
model consisting of treadmill running or cycling (de Oliveira, Burini and Jeukendrup, 2014; Costa et

45
al., 2017b). Yet, exercise duration per se has received little focus with regard to its effect on intestinal
dysfunction. Little is known about the effects of exercise duration on GI dysfunction; indeed, no
research exists directly comparing the effects of varying durations of exercise on intestinal dysfunction.
Current literature examining intestinal dysfunction has implemented a range of exercise protocols
(Table 3), including short, high-intensity interval bouts (Pugh et al., 2017b) and marathon running
(Buchman et al., 1999; Smetanka et al., 1999; Pugh et al., 2019). Furthermore, (Gill et al., 2015)
explored the endotoxin and cytokine response to ultra-marathon running but did not assess intestinal
permeability or injury. However, the majority of laboratory-based research has employed a protocol of
sixty minutes of exercise, typically at an intensity between 60-70 % V̇O2 max (Pals et al., 1997; Lambert
et al., 2007; Lambert et al., 2008; van Wijck et al., 2011a; Van Wijck et al., 2012b; Yeh, Law and Lim,
2013). Results from field-based studies of ultra-events have reported an increase in endotoxin
concentrations and cytokine profiles, and a high incidence of athletes (>75%) reported symptoms of GI
discomfort (Gill et al., 2015; Stuempfle and Hoffman, 2015). Pugh et al. (2017b) investigated the
intestinal permeability response to 18 repeats of 800m treadmill running. Whilst resting values are
similar to those observed from other studies (Zuhl et al., 2014b; March et al., 2017), they observed a
~60 % increase in serum L/R ratio when compared to rest (0.051 + 0.016 vs. 0.031 + 0.031 + 0.021).
However, urinary analysis showed no difference (0.032 + 0.005 vs. 0.030 + 0.005), The serum post-
exercise values from this study are similar to those observed from 60 minutes of treadmill running at
70 % V̇O2 max (Lambert et al., 2008; Zuhl et al., 2014b), yet higher than those following a marathon race
(Smetanka et al., 1999).
Research is lacking into the response in splanchnic hypoperfusion and ischemic response to
exercise, particularly in running, most likely due to the difficulty in measurement with ultrasonography
(van Wijck et al., 2011a). As such, research has typically used cycling as an exercise model and only
quantified the response in intestinal blood flow (Rehrer et al., 2001; Hayashi, Ikemura and Someya,
2011). One study demonstrated that fifteen minutes of treadmill walking at 5 km/h (20 % incline) was
able to reduce mesenteric blood flow by 43 %, (Qamar and Read, 1987), however, no effects on
intestinal permeability or injury were investigated. Effectively, longer periods of ischemia may increase
the likelihood of intestinal injury, clinical studies have shown that 45 minutes of ischemia resulted in
an increased inflammatory response and epithelial injury, whilst 30 minutes of ischemia did not
(Matthijsen et al., 2009; Grootjans et al., 2010a). Furthermore, (van Wijck et al., 2011a) were able to
show that 60 minutes of cycling at 70 % V̇O2 max was able to induce splanchnic hypoperfusion and
causes GI dysfunction. Together, it could be hypothesised that exercise duration influences
gastrointestinal dysfunction due to the longer periods of reduced blood flow and consequently reduced
oxygen availability in the mesenteric organs. However, future research should aim to investigate the
effects of exercise duration alone on intestinal dysfunction and symptoms.

46
2.6.4: Hyperthermia
Functionally, blood circulation helps the transfer and exchange of metabolic heat to other body tissues
for dissipation via evaporative cooling, thus facilitating maintenance of homeostasis and regulation of
core temperature (Tcore). The core temperature of humans is maintained within a fine range at
approximately 37°C and will only deviate outside of this range under certain conditions such as during
exercise (Gisolfi and Wenger, 1984; Pires et al., 2017), environmental stress (Cramer and Jay, 2016) or
pathophysiological conditions such as illness or heat stroke (Lambert, 2004). During exercise, core
temperature can rise by 1°C every five minutes if unmitigated, but temperature regulatory mechanisms
work to establish a balance between heat production and loss (Nadel et al., 1977). Such mechanisms
are efficient, as core temperature during a marathon can be maintained between 39 and 40°C (Cheuvront
and Haymes, 2001). However, environmental conditions (such as hot temperatures), dehydration,
obesity, or clothing which limits the body’s evaporation capabilities, can cause a significant challenge
to human thermoregulation. In these conditions, the temperature gradient required for radiative and
convective heat loss becomes compromised, leading to an increased storage of heat within the body
(Nadel et al., 1977; Coris, Ramirez and Van Durme, 2004). The progression of heat accumulation within
the body begins the process of heat-illness, which can manifest into a cascade of physiological events
that, if not addressed, can lead to severe heat stroke and death. Following heat-stress, symptoms of heat
illness can develop, indicated by an elevated core temperature up to 40.5°C, such as heat cramps,
syncope, mild confusion, nausea and vomiting. If heat strain is allowed to progress, heat stroke may
occur, whereby core temperature exceeds 40.5°C (Coris, Ramirez and Van Durme, 2004). Indeed, heat
stroke can develop into a life-threatening medical condition, and increased intestinal permeability is
thought to be a contributing factor. Augmented permeability facilitates increased transport of harmful
endotoxin contained within the gut into the portal blood, which subsequently causes a systemic
inflammatory response, which can manifest into multiple organ failure and death (Ogden et al., 2020).
Passive heat stress is defined as “heat stress that occurs through increases in heat gain via
exogenous sources at a time when metabolism remains at relatively basal levels” (Crandall and Wilson,
2015). Protocols typically involve methods such as immersion in hot water, environmental chambers
or water-perfused suits to increase core temperature (Miwa et al., 1994; Sheahen et al., 2018). A review
by Crandall and Wilson (2015) explains that passive heat stress results in a plethora of physiological
responses including increases in catecholamines, cardiac output and heart rate. Further responses to
passive heat stress, specifically HWI, include increases in subcutaneous and cutaneous blood flow,
whilst blood flow through the muscle may be decreased (Bonde-Petersen, Schultz-Pedersen and
Dragsted, 1992). This is in contrast to immersion in thermoneutral water, where an increase blood flow
through muscle beds may be observed due to a decrease in peripheral resistance with an accompanied
increase in cardiac output (Wilcock, Cronin and Hing, 2006). Splanchnic blood flow has also been
shown to decrease by approximately 40% in response to passive heat stress (Rowell, 1974).

47
Alternatively, exertional heat stress studies use an exercise model with the addition of heat stress,
induced by clothing (McLellan, Boscarino and Duncan, 2013) or elevated environmental temperatures
(Ogden et al., 2020). The addition of clothing or hot water immersion (HWI) effectively attenuate loss
by limiting radiative and convective processes, thereby creating a condition of uncompensable heat
stress (UHS) (Cheung, McLellan and Tenaglia, 2000). Interestingly, examination of exertional heat
stress studies reveals a lack of resting control conditions, instead, the majority of passive hyperthermia
studies are found from HWI in cardiac research (An, Lee and Yi, 2019). Furthermore, research has
failed to investigate the effects of passive hyperthermia on intestinal permeability in humans (Dokladny,
Zuhl and Moseley, 2016).
Animal and in vitro studies have indicated that passive hyperthermia, induced by environmental
heat stress, can increase intestinal permeability (Dokladny, Zuhl and Moseley, 2016). Yet, research is
lacking as to the effects of passive hyperthermia on intestinal permeability in humans; likely due to
ethical restrictions of increasing core temperature purposefully towards the levels of heat stress/stroke
(Dokladny, Zuhl and Moseley, 2016). Sheahen et al. (2018) observed no increase in core temperature
or plasma I-FABP levels (injury biomarker) following 45 minutes of passive heat stress at 30°C in
twelve physically active men. Unfortunately, intestinal permeability was not quantified. However, the
addition of exercise at 70% V̇O2 max in temperatures of 30°C and 20°C significantly increased I-FABP
and core temperature. Exercise in 20°C and 30°C resulted in a peak core temperature of 38.2°C and
38.3°C, respectively; whilst post-exercise levels of plasma I-FABP were similar in both conditions (852
+ 317 pg‧mL-1and 954 + 411 pg‧mL-1, respectively).
Pires et al. (2017) recently conducted a systematic review to investigate a possible relationship
between the exercise-induced rise in core temperature and augmented intestinal permeability. They
concluded a direct association between increased intestinal permeability and the magnitude of rise in
core temperature. They explained that a core temperature of 38.5°C was associated with augmented
intestinal permeability in some individuals, but when core temperature exceeded 39oC, increased
intestinal permeability was universal amongst participants (Pires et al., 2017). This finding was in
agreement with a previous estimate that a core temperate range of 38.2-39.6 °C, together with exercise
performed at an intensity equivalent to 70 % of V̇O2 max, resulted in augmented intestinal permeability
(Dokladny, Zuhl and Moseley, 2016). Further, in vitro studies have also reported a dose dependent
effect of heat stress on tight-junction integrity, with greater permeability being reported with increasing
heat stress (Dokladny, Moseley and Ma, 2006; Yang, He and Zheng, 2007; Davison et al., 2016).
Interestingly Pals et al. (1997) also reported a correlation between increased intestinal
permeability and rising core temperature whilst investigating the role exercise intensity has on GI
permeability. Running at 40, 60 and 80 % of V̇O2 max for 60 minutes resulted in mean peak core
temperatures of 38.0 + 0.11oC; 38.7 + 0.11 oC and 39.6 + 0.15 oC, respectively. In this study, increased
permeability was only significant following running at 80 % of V̇O2peak which also correlated with the
highest peak core temperature.
48
Passive hyperthermia has been shown to reduce splanchnic blood flow and induce intestinal
barrier dysfunction in rodents (Hall et al., 2001b), but to date, no studies have investigated the response
in intestinal permeability to passive heat stress in humans. Currently data is only available from case
studies of humans suffering from heat stroke that co-present with other morbidities or are elderly
(Ogden et al., 2020). As such, it is presently unclear whether the increase in intestinal permeability
associated with increased core temperature occurs independent of exercise-induced splanchnic
ischemia. Research has shown an increase in blood flow to the periphery under passive heat stress
(Ogoh et al., 2013) which would indicate a reduction in splanchnic blood flow by proxy. However,
research is warranted to investigate a possible correlation between a non-exertional rise in core
temperature and thus minimal influence of splanchnic hypoperfusion, and intestinal permeability.
2.6.5: The effect of glutamine on intestinal permeability
Glutamine is the most abundant amino acid in human muscle and plasma, and the preferred fuel source
of the enterocytes of the GI system (Newsholme et al., 2003). Plasma glutamine levels are maintained
at approximately 550 - 750 µmol/L, but can be significantly reduced following exercise and conditions
such as shock or trauma. The gastrointestinal tract plays a pivotal role in the response to infection and
injury, with prolonged periods of stress or trauma seeing a reduction in the glutamine pool, and
subsequent mucosal injury (Rao, Baker and Baker, 1999). However, oral glutamine supplementation
has been shown to offset mucosal injury and, furthermore, attenuate gastrointestinal permeability and
injury (Soares et al., 2014; Zuhl et al., 2014b; Pugh et al., 2017c). Glutamine provides a major source
of energy for the rapid proliferation of the epithelial cells of the GI mucosa. As such, glutamine may be
an effective mitigation strategy against stressors which may compromise GI barrier integrity and injury
(Rao and Samak, 2012). Animal studies have demonstrated glutamine supplementation to attenuate GI
injury in response to ischemia/ reperfusion (Mondello et al., 2010), whilst human studies have shown
glutamine to attenuate GI permeability in response to exercise and heat stress (Zuhl et al., 2015; Pugh
et al., 2017c). The underlying mechanisms behind the protective effect of glutamine on the GI tract is
complex and beyond the scope of this review, and has been explained elsewhere (Rao and Samak,
2012).
Over twenty years ago, Hond et al. (1999) demonstrated that an acute dose of 7 g of glutamine
was able to attenuate GI permeability in response to non-steroidal anti-inflammatory drug (NSAID)
ingestion in healthy people. Fourteen years later, (Zuhl et al., 2014b) showed that 7 days of glutamine
supplementation at 0.9g.kg-1 fat free mass was able to prevent an increase in intestinal permeability in
response to 60 minutes of treadmill running at 65-70% V̇O2 max, when compared to placebo. Glutamine
supplementation has since been shown to offset GI permeability in a dose-response manner; where
doses of 0.25 g.kg-1, 0.5 g.kg-1 and 0.9 g.kg-1 of glutamine were provided two hours before 60 minutes
of treadmill running at 70% V̇O2 max in 30°C heat (Pugh et al., 2017c). However, this study failed to

49
include an exercise only condition, so the relative contribution of heat is difficult to conclude. Research
is scarce investigating GI permeability and injury in humans, in response to passive heat stress. Rodent
models (rats) subjected to hyperthermia by increasing core temperature to 42°C, after five days of
glutamine supplementation at 0.9 g.kg-1 observed enhanced the heat shock protein (HSP) response,
significantly reduced intestinal permeability, plasma endotoxin, and decreased mortality. Given the
promising scope of glutamine to ameliorate GI permeability and injury in response to heat stress, further
consideration is warranted.
2.6.6: Summary
Despite an abundance of research investigating the characteristics and mechanisms of GI dysfunction,
the complex nature of the gastrointestinal tract and differing methodologies used in previous research
leave many questions still unanswered. Whilst researchers have explored the response in GI
permeability and injury to different exercise stresses such as intensity (Pals et al., 1997) or modality
e.g. running versus cycling (van Nieuwenhoven, Brouns and Brummer, 2004; Karhu et al., 2017), we
do not yet know at which point (in relation to exercise) that maximum permeability occurs. Further
investigation is also required to understand the mechanistic contributions of exercise-induced
hypoperfusion and hyperthermia, as we do not yet know which factor is responsible for the largest
magnitude of intestinal barrier dysfunction. It has been hypothesised that exercise-induced intestinal
injury could be due to hypoperfusion alone, or in combination with the subsequent reperfusion of the
epithelium (van Wijck et al., 2012a). However, this hypothesis fails to consider the contribution of
hyperthermia to intestinal barrier dysfunction. No data are available that have compared the
contribution of increased core temperature or hypoperfusion to intestinal dysfunction. An investigation
of this hypothesis would prove difficult as an increase in core temperature and a reduction in mesenteric
blood flow would have to occur independent of each other, or to an extent where one factor would
not impact on the other. This is technically difficult as exercise induces a mesenteric hypoperfusion as
well as elevated core temperature. Similarly, questions remain regarding intestinal damage in response
to passive hyperthermia. Increased I-FABP concentrations have been recorded in patients with heat
stroke (Zhang et al., 2015) but data is lacking regarding whether passive hyperthermia results in
intestinal tissue injury. The use of passive heating methods, however, provides a controlled
methodological approach by allowing elevation of core temperature through environmental stress whilst
maintaining exercise at an intensity which is known to elicit a level of hypoperfusion that does not
result in gastrointestinal permeability. Furthermore, since glutamine has shown positive outcomes on
intestinal permeability and injury in response to exercise and heat stress, more research is required
investigating the effects of glutamine on passive heat stress, such research could provide scope for
nutritional interventions for athletes exercising in the heat.

50
Chapter 3: General Methods
3.0 Introduction
The following section provides and overview of the core philosophies behind the methods employed in
the subsequent research studies and a rationale for their use. Where appropriate, unique methods and
protocols are described in the specific chapter.
3.1 Ethical Approval and list testing locations
All of the research studies conducted for this thesis received ethical approval by the local committee of
Liverpool John Moores University. All participants received written and verbal descriptions of the
testing procedures and provided informed consent prior to participation. Participants were made aware
of the risks of participation, with written inform consent being given in the presence of a third-party
witness. All exercise testing, including maximal oxygen uptake (V̇O2 max.) and experimental trials were
completed within in the Sport and Exercise Laboratories at the University. Analysis of serum lactulose
and L-rhamnose was completed at Royal Cornwall Hospital Trust, Cornwall, UK by an accredited
laboratory.
3.2 Participants
Participants were male and female, healthy, non-smokers who were free from gastrointestinal and
neurological disease, and muscoskeletal abnormality. Inclusion criteria also included being
recreationally active, training for a minimum of four hours per week. Participants were excluded if they
reported using nutritional supplements at the time of recruitment. Further exclusion criteria was that
participants were currently not engaged in another research study. Whilst heat acclimation status was
not an inclusion/exclusion factor, none of the participants reported recently returning from a hot
environment. Participants were asked to abstain from NSAID ingestion, exercise, alcohol and spicy
foods in the 24 hours preceding laboratory visits. A minimum of three, and maximum of 7 days were
scheduled between tests. These procedures were in place in light of the turnover rate of the small
intestine enterocytes; whereby whole intestinal enterocyte turnover is complete within 72 hours.
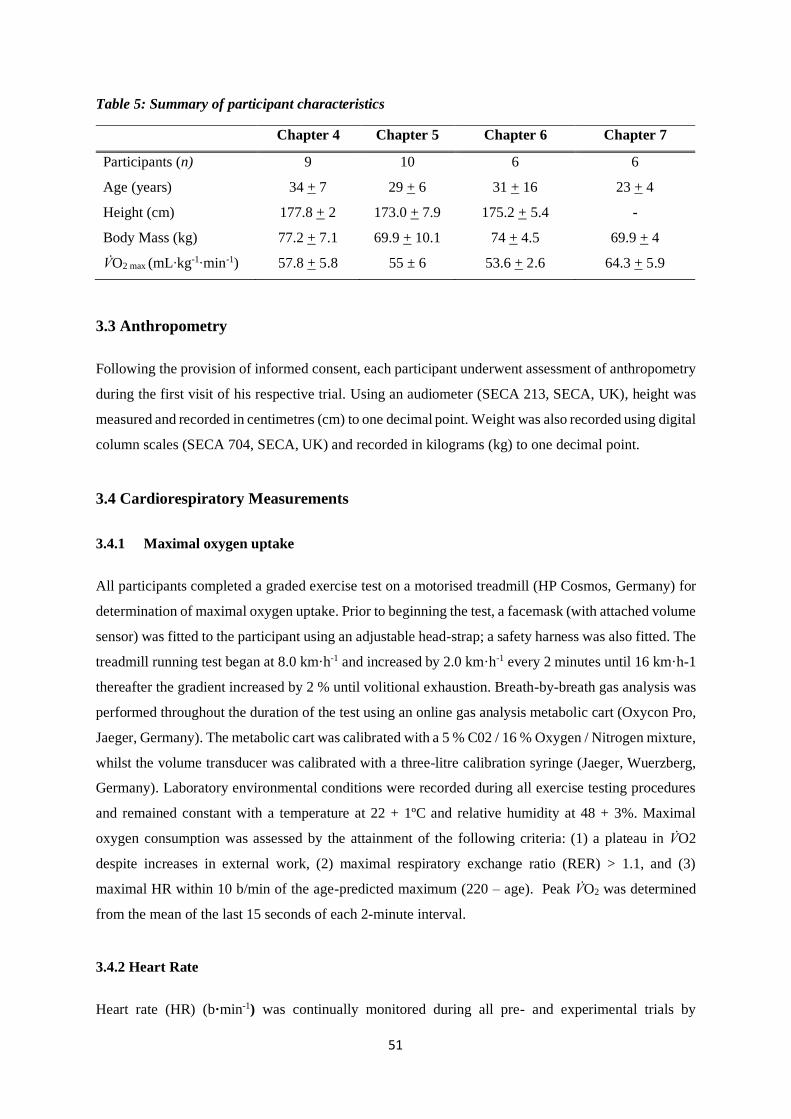
51
Table 5: Summary of participant characteristics
Chapter 4 Chapter 5 Chapter 6 Chapter 7
Participants (n) 9 10 6 6
Age (years) 34 + 7 29 + 6 31 + 16 23 + 4
Height (cm) 177.8 + 2 173.0 + 7.9 175.2 + 5.4 -
Body Mass (kg) 77.2 + 7.1 69.9 + 10.1 74 + 4.5 69.9 + 4
V̇O2 max (mL‧kg-1‧min-1) 57.8 + 5.8 55 ± 6 53.6 + 2.6 64.3 + 5.9
3.3 Anthropometry
Following the provision of informed consent, each participant underwent assessment of anthropometry
during the first visit of his respective trial. Using an audiometer (SECA 213, SECA, UK), height was
measured and recorded in centimetres (cm) to one decimal point. Weight was also recorded using digital
column scales (SECA 704, SECA, UK) and recorded in kilograms (kg) to one decimal point.
3.4 Cardiorespiratory Measurements
3.4.1 Maximal oxygen uptake
All participants completed a graded exercise test on a motorised treadmill (HP Cosmos, Germany) for
determination of maximal oxygen uptake. Prior to beginning the test, a facemask (with attached volume
sensor) was fitted to the participant using an adjustable head-strap; a safety harness was also fitted. The
treadmill running test began at 8.0 km·h-1 and increased by 2.0 km·h-1 every 2 minutes until 16 km·h-1
thereafter the gradient increased by 2 % until volitional exhaustion. Breath-by-breath gas analysis was
performed throughout the duration of the test using an online gas analysis metabolic cart (Oxycon Pro,
Jaeger, Germany). The metabolic cart was calibrated with a 5 % C02 / 16 % Oxygen / Nitrogen mixture,
whilst the volume transducer was calibrated with a three-litre calibration syringe (Jaeger, Wuerzberg,
Germany). Laboratory environmental conditions were recorded during all exercise testing procedures
and remained constant with a temperature at 22 + 1ºC and relative humidity at 48 + 3%. Maximal
oxygen consumption was assessed by the attainment of the following criteria: (1) a plateau in V̇O2
despite increases in external work, (2) maximal respiratory exchange ratio (RER) > 1.1, and (3)
maximal HR within 10 b/min of the age-predicted maximum (220 – age). Peak V̇O2 was determined
from the mean of the last 15 seconds of each 2-minute interval.
3.4.2 Heart Rate
Heart rate (HR) (b·min-1) was continually monitored during all pre- and experimental trials by

52
electrocardiography (Polar FT1, Polar UK). A heart rate monitoring strap was fitted to the participant’s
chest at V5 level, with the transmitter positioned centrally on the sternum, then adjusted to prevent any
movement during trials. Through all chapters, heart rate was recorded every three minutes.
3.4.3 Rating of Perceived Exertion (RPE)
RPE was recorded, using the BORG 6-20 (Borg, 1974) scale, at the end of each stage during the
maximal oxygen uptake assessment. In Chapter 4, RPE was recorded every three minutes during the
exercise trial.
Rating Description
6 No Exertion at All
7 Extremely Light
8
9 Very Light
10
11
12
13 Somewhat Hard
14
15 Hard
16
17 Very Hard
18
19 Extremely Hard
20 Maximal Exertion
Figure 6: Borg scale for reporting subjective RPE (Borg, 1974).

53
3.4.4 Thermal Comfort
Subjective rating of thermal comfort was obtained at the same time-points as heart rate using a 9-point
VAS (Figure 7), adapted from Snipe et al. (2018a).
Thermal Comfort Scale
1 Very Cold
2 Cold
3 Cool
4 Slightly Cool
5 Neutral
6 Slightly Warm
7 Warm
8 Hot
9 Very Hot
Figure 7: Thermal comfort scale for quantification of subjective thermal strain.
3.5 Thermoregulatory Measurement
3.5.1 Core temperature
Core temperature was measured via rectal thermistor inserted 10 cm past the external anal sphincter
(Mead and Bonmarito, 1949; Miller et al., 2017) which was connected to a portable multi-channel data
logger (SQ2010, Grant Instruments, UK).
3.6 Assessment of gut permeability, injury and symptoms
3.6.1 Intestinal Permeability
To determine GI permeability, serum samples from participants underwent a permeability assay. Each
participant ingested a solution containing a mixture of two mono- and disaccharide sugar probes. The
probes consisted of 10 g lactulose and 2 g L-rhamnose, diluted in 230 mL of tap water (Fleming et al.,
1996). Timing of ingestion of the probe solution is explained in each specific study chapter. Timing
of collection of blood samples is outlined in each specific chapter. Analysis of sugar probe
permeability was determined across all chapters through serum collection, two hours post-ingestion of
the sugar probe solution. High-performance liquid chromatography (HPLC) was used to determine
serum sugar concentrations using a previously published protocol (Fleming et al., 1996), with the
modification of using L-rhamnose instead of mannitol as the monosaccharide probe. The various sugars
were separated using high-pressure liquid chromatography (HPLC) and quantitated by use of a pulsed

54
electrochemical detector using a gold working electrode and silver/silver chloride reference electrode.
The detection potential was -0.01 V (0-0.5 s), the oxidation potential was +0.75 V (0.51-0.64 s), the
reduction potential was -0.75 V (0.65 0.75 s), and the integration period was 0.05 to 0.5 s. Retention
times were 2.7 min for L-rhamnose and 6.1 min for lactulose. The coefficient of variation for the
samples in the trial in this thesis using this method has been found to be between 1.8 – 8.5 %.
Quantification of lactulose, L-rhamnose, and the ratio of lactulose to L-rhamnose was used to evaluate
small intestinal permeability.
3.6.3 Gastrointestinal symptoms
An assessment of gastrointestinal symptoms was performed using a 10-point Likert questionnaire at
time-points to coincide with those of blood sample collection. Participants completed a questionnaire
detailing 16 symptoms with a visual analogue scale (VAS; 100 mm lines) (Pugh et al., 2017b).
Participants were asked to indicate by marking the scale, indicating the magnitude of different
symptoms, with 0 indicating no symptoms to 10 indicating severe symptoms. These data were
quantitated in terms of percentage, with 0% indicating no symptoms, and 100% representing severe
symptoms). Symptoms of GI discomfort included: side stitch; nausea; bloating; urge to burp; urge to
vomit; urge to defecate; diarrhoea; stomach cramps; stomach upset; intestinal cramps; dizziness;
shivering; and heart burn.
3.7 Blood sample collection and biochemical analysis
All blood samples were collected by the principal researcher. Blood samples were drawn from an
antecubital vein using standard venepuncture procedures. In all studies, three separate tubes were
collected, one serum separating tube (SST), one containing ethylenediaminetetraacetic acid (EDTA)
and one containing sodium heparin. Sample tubes were given ten gentle inversions before being stored
in ice until further processing, for later analysis. SST sample tubes were stored at room temperature
for thirty minutes before being stored in ice. Following the final blood collection, samples were
centrifuged at 1500 relative centrifugal force for fifteen minutes at 4oC using a Sigma 3-18 k centrifuge
(Scientific Laboratory Supplies). Plasma was then pipetted into sterile Eppendorf tubes before being
frozen at -80oC.
3.8 Heat Stress
In chapters six and seven, heat stress was induced through passive hyperthermia by submerging
participants to the sternal notch in a thermostatically controlled bath. Following assessment of baseline
measures, all participants were lowered into the water bath wearing swimwear, whilst secured in a
safety harness. The bath was thermostatically controlled at 40°C, with water temperature being recorded

55
every fifteen minutes. Participants were encouraged to submerge all limbs for the duration of the sixty-
minute protocol. Whilst participants were informed that they could be removed from the bath at their
request, all participants completed the protocol. Due to ethical reasons, a ceiling core temperature of
39.5°C was in place. It was hypothesised that core temperature would continue to increase beyond the
participant being removed from the bath. Hence, pilot work was completed prior to the main studies,
which indicated a time-lag of approximately ten minutes between the participants being removed from
the bath to reaching peak Tcore, before decreasing. Figure 9 demonstrates the core temperature response
of three participants to the heat stress protocol. Two participants were assigned to a higher core
temperature threshold of 39°C, and one participant was assigned to a threshold of 38°C. When their
Tcore reached the designated value, the participant was removed from the bath.
Figure 8: Experimental equipment set up for passive hyperthermia by hot water immersion

56
Figure 9: Core temperature response of three participants during pilot work to establish core
temperature response to perceived passive heat stress methods

57
Chapter 4 – Determining GI barrier
Dysfunction in Exercise: Does the Timing of
Lactulose/L-rhamnose (L/R) Sugar-Probe
Ingestion Affect Subsequent L/R Recovery
Profile?
4.1: Abstract
Purpose: It is unknown if the timing of dual-sugar probe test solution ingestion, in relation to exercise,
impacts the subsequent ratio of L/R ratio in the serum. Methods: Nine healthy, recreationally active
males participated in the study [age 34 + 7 years; height 177.8 + 2 cm; body mass 77.2 + 7.1 kg].
Participants completed three experimental trials of 60 minutes of treadmill running at approximately 80
% V̇O2 max. Timing of the sugar probe solution was administered to represent pre- (PRE), during (MID),
or post-exercise (POST) ingestion. Small intestinal permeability was determined through appearance
of L/R in serum and expressed as a ratio. Results: Ingestion of the dual sugar probe solution pre- or
during exercise returned a higher L/R ratio than post-exercise ingestion, however no significant
difference was observed between conditions. Conclusion: The timing of sugar-probe test solution does
not significantly affect the subsequent serum L/R ratio.
4.2: Introduction
Exercise, if of sufficient intensity and duration, can cause an increase in intestinal permeability
whereby the tight junctions of the enterocytes become dysfunctional, allowing the transport of
otherwise impassable molecules through the mucosa into the portal circulation (Grootjans et al.,
2010b; Costa et al., 2017b). Potentially, this barrier dysfunction is mediated through a sustained
reduction in mesenteric blood flow and hyperthermia in the small intestine (van Wijck et al., 2011a).
Small intestinal permeability is typically determined by the appearance of a dual-sugar test solution
containing lactulose and L-rhamnose or mannitol, in urine or plasma (serum) (van Wijck et al., 2011b;
Costa et al., 2017b). Typically, urine analysis requires the collection of urine for five to twenty-four
hours post sugar probe ingestion, whereas a two-hour post ingestion blood sample is required for
plasma (serum) analysis. The total recovery and ratio of the sugars is thus utilised as a determinant of
intestinal permeability (Fleming et al., 1996).
Whilst there is a considerable body of research investigating the exercise-induced response in
intestinal permeability, comparisons between studies is difficult due to the large variance in methods

58
between the studies (Table 3). Researchers have employed a wide range of sugar-probe solutions
containing different doses of lactulose and L-rhamnose, whilst in some cases adding further sugars
such as sucralose, mannitol or erythritol (Van Wijck et al., 2012b; March et al., 2017). Comparisons
are further complicated by the wide range of exercise protocols, analysis methods used (5-24 hr. urine,
or serum), how the data was reported i.e., mean or median, and the timing of ingestion of the test
solution (Table 3). Test solutions have been predominantly ingested prior to exercise (Lambert et al.,
2008), however some researchers have provided the solution during (Pals et al., 1997) or post-exercise
(Smetanka et al., 1999). Considering these variations, it is difficult to determine whether the timing of
sugar-probe ingestion impacts the subsequent appearance and ratio of the sugars in urine or serum.
Furthermore, these differences between studies complicate the contextualization of the specific exercise
protocol or intervention, such as the provision of NSAIDs (Lambert et al., 2012), in terms of the
magnitude of intestinal permeability reported. Current research (Table 3) demonstrates notionally
similar levels of L/R recovery when test solutions are provided before or during exercise (Lambert et
al., 2008; Zuhl et al., 2014a; Zuhl et al., 2015). Yet, research is currently lacking investigating how the
timing of the sugar-probe test solution post-exercise affects the recovery of L/R. Indeed, the post-
exercise period could represent the highest point of intestinal permeability. Since blood flow is rapidly
reduced at the onset of exercise (Rehrer et al., 2001), unless carbohydrate is provided (Rehrer et al.,
2005), the gut exists in a state of hypoperfusion and hyperthermia for a greater amount of time than if
the test solution had been provided pre- or during exercise providing an extended window of
opportunity for barrier disruption and for translocation to occur. (Otte et al., 2001).
It must be considered that fluids, for example the lactulose/L-rhamnose test solution, are not
made immediately available for small intestine absorption upon ingestion, but initially stored in the
stomach and subject to gastric emptying. Individual variation exists in gastric emptying, which can be
further affected by the volume, osmolality and chemical composition of solutions (Leiper, 2015). When
provided during exercise, weak glucose solutions have shown no difference in gastric emptying when
compared to rest, however, emptying can be significantly delayed following ingestion of stronger
solutions (Costill and Saltin, 1974). Once absorbed, it is difficult to comment on factors which may
affect subsequent appearance of lactulose and rhamnose in the urine or serum. Considering the large
variation in both the timing of ingestion, and osmolality of test solutions, research is warranted to
investigate how the timing of ingestion of a standardized solution reflects the reported magnitude of
intestinal permeability. If research were to compare intestinal permeability in response to a similar
exercise stimulus, this data would highlight when the small intestine is most permeable. Furthermore,
this research could demonstrate the recovery in intestinal permeability following the cessation of
exercise. Therefore, the aim of the present study was to investigate the dynamics of intestinal
permeability in response to a moderate intensity bout of treadmill running, and investigate whether
altering the timing of sugar-probe ingestion affects the subsequent recovery of L/R.

59
4.3 Methods
4.3.1 Participants
Nine healthy, recreationally active males volunteered to participate in the study. All participants
provided written consent prior to the commencement of testing. Participant requirements included that
they were male, training three or more hours per week of endurance-type exercise, free from
gastrointestinal syndrome and willing to abide by the restrictions implemented by the study (24h rest
prior to each trial, overnight fast, no caffeine or alcohol in the 24 hours prior to each trial.)
Table 6: Descriptive characteristics of participants displaying means ± SD for age (yrs.); body mass
(kg); height (cm) and V̇O2 max. (mL‧kg-1‧min-1).
Age (yrs.) Body Mass (kg) Height (cm) V̇O2 max (mL‧kg-1‧min-1)
Mean ± SD 34 + 7 77.2 + 7.1 177.8 + 2.4 57.8 + 5.8
4.3.2 Assessment of maximal oxygen uptake
During the first visit, V̇O2 max was determined as per section General Methods 3.4.1. Following the
assessment, the estimated running speed for the experimental trials was determined using a linear
regression equation. Running speed corresponding to 80% was then determined.
4.3.3 Experimental design
In a repeated measures cross-over design, each participant completed a baseline assessment of
maximal oxygen uptake and three test conditions comprising of 60 minutes of running on a motorised
treadmill at approximately 80% of their predetermined V̇O2 max. The duration was chosen to align with
previous literature to facilitate comparison, whilst the intensity was also determined from literature as
being above the minimal intensity needed to elicit an increase in permeability (Costa et al., 2017b).
Participants arrived at the laboratory between 07:00 and 9:00 h following an overnight fast, as well as
abstaining from strenuous exercise and alcohol consumption for the preceding twenty-four hours. All
preliminary measures and experimental trials were conducted in standard laboratory conditions, at
approximately 22°C, 45% RH. Participants were asked to ingest at least 500 mL of water prior to
arriving at the laboratory to promote hydration.
Upon arrival at the laboratory, participants were measured for height (cm) and weight (kg),
before completing a questionnaire of gastrointestinal symptoms and being fitted with a heart rate
monitor strap as described in the General Methods section. A pre-exercise blood sample was then
collected. The participant then inserted a rectal thermometer 10 cm past the anal sphincter, which was
connected to a portable data logger (SQ210, Grant Instruments, UK.) Following preliminary

60
assessments, participants completed a five minute self-paced warm up followed by two minutes of
complete rest. The self-paced warm up was always completely ‘free’ for the participants to complete
as desired. The participant then re-mounted the treadmill before the speed was increased to their
estimated velocity within ten seconds of the start, at an incline of one percent (Jones and Doust, 1996).
Treadmill speed (km‧h-1) was also recorded every three minutes. Breath-by-breath measurements of
oxygen consumption (V̇O2) and carbon dioxide (V̇CO2) production were recorded via online gas
analysis (Oxycon Pro, Jaeger) every six minutes to record the expired gases equivalent to the required
estimate of appropriate exercise intensity. Treadmill speed was adjusted in response to the recorded
measurements so-as-to maintain the desired intensity. Participants were provided with 500 mL tap
water throughout the trial which they ingested both ad-libitum and, or, within ten-minute intervals.
4.3.4 Sugar probe administration
Participants completed three experimental trials, informed by the timing of ingestion of the dual-sugar
probe solution. Gastrointestinal permeability was measured with a solution containing dual-sugar
probes, as described in section 3.6.1. Participants ingested the solution 15 minutes before (PRE), 30
minutes during (MID), or immediately post (POST) exercise; figure 10 demonstrates a schematic
representation of the study.
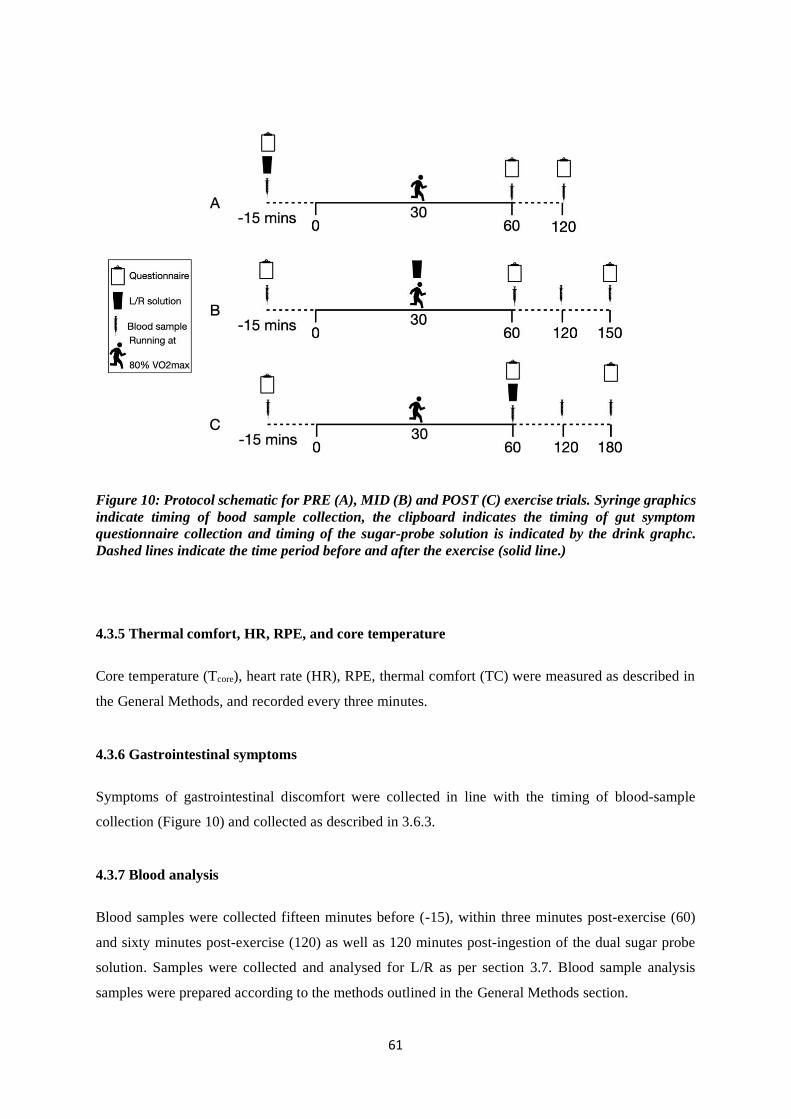
61
Figure 10: Protocol schematic for PRE (A), MID (B) and POST (C) exercise trials. Syringe graphics
indicate timing of bood sample collection, the clipboard indicates the timing of gut symptom
questionnaire collection and timing of the sugar-probe solution is indicated by the drink graphc.
Dashed lines indicate the time period before and after the exercise (solid line.)
4.3.5 Thermal comfort, HR, RPE, and core temperature
Core temperature (Tcore), heart rate (HR), RPE, thermal comfort (TC) were measured as described in
the General Methods, and recorded every three minutes.
4.3.6 Gastrointestinal symptoms
Symptoms of gastrointestinal discomfort were collected in line with the timing of blood-sample
collection (Figure 10) and collected as described in 3.6.3.
4.3.7 Blood analysis
Blood samples were collected fifteen minutes before (-15), within three minutes post-exercise (60)
and sixty minutes post-exercise (120) as well as 120 minutes post-ingestion of the dual sugar probe
solution. Samples were collected and analysed for L/R as per section 3.7. Blood sample analysis
samples were prepared according to the methods outlined in the General Methods section.

62
4.3.8 Statistical analysis
Data was analysed with the use of the statistical software package SPSS (Version 26.0, SPSS Inc.,
Armonk, NY: IBM Corp), with significance accepted at p ≤ 0.05. Values found to be below three
decimal places of 0 were adjusted to P<0.001. Changes between variables throughout conditions (PRE,
MID, POST) were tested using a repeated measures ANOVA. To correct violations of sphericity, the
degrees of freedom were corrected in a normal way, using Huynh-Feldt (ε >.75) or Greenhouse- Geisser
(ε <.75) values for ε, as appropriate (Field 2007). A Bonferroni pairwise comparison was applied when
main effects were present.
4.4 Results
4.4.1 Physiological Responses
One participant did not complete the study, leaving nine (n = 9) for analysis. Body mass (BM) decreased
in response to exercise, with a significant main effect for time (F1, 6 = 49.894, P < 0.001). The decrease
in BM was similar between all conditions. There was no significant main effect observed for condition
(F2, 12 = 0.443, P = 0.652). No significant interaction was observed between condition (F1.29, 7.72 = 0.179,
P = 0.774). No significant interaction was observed between condition and time (F1.29, 7.71 = 0.79, P =
0.774). There was an increase in HR in response to exercise, with a significant main effect for time (F1,
6 = 254.075, P < 0.001). HR increased by similar amounts between all conditions. There was no
significant main effect observed for condition (F1.317, 7.9 = 2.064, P = 0.191). No significant interaction
was observed between conditions (F1.33, 7.95 = 0.567, P = 0.521). No significant interaction was observed
between condition and time (F1.33, 7.95 = 0.567, P = 0.521). RPE showed no significant main effect
between conditions (F2, 12 = 0.087, P = 0.917). No significant interaction was observed between
condition and time (F1.29, 7.9 = 0.567, P = 0.521). Mean oxygen uptake represented ~79% of maximum
with no difference between conditions.
4.4.2 Core temperature
There was an increase in core temperature in response to exercise, with a significant main effect for
time (F1, 5 = 184.81, P < 0.001). Core temperature increased by similar amounts across all conditions.
There was no significant main effect observed for condition (F2, 10 = 0.856, P = 0.454). No significant
interaction was observed between conditions (F1.05, 5.26 = 0.242, P = 0.65).

63
Table 7: Post-exercise values for physiological responses. Showing heart rate (b·min-1); body mass
loss (%); percent of V̇O2 for the exercise; RPE (AU); core temperature (°C); and thermal comfort
(AU). Data are mean + SD.
Pre Mid Post Main Effect Significance
HR (b·min-1) 173 + 10 169 + 11 170 + 10 F1.9, 11.5 =1.905 P = 0.288
Body mass loss (% BM) 1.1 + 0.2 0.7 + 0.6 0.6 + 0.7 F2, 12 =1.873 P = 0.196
V̇O2 max (%) 79 + 6 79 + 4 80 + 4 F1.5, 9.2 =0.333 P = 0.677
RPE (AU) 13 + 1 13 + 1 13 + 1 F1.9, 11.9 =0.087 P = 0.936
Speed (km/h) 12 + 1 12 + 1 13 + 1
Tcore (°C) 39.1 + 0.7 38.8 + 0.7 39.1 + 0.4 F1.8, 7.1 =0.505 P = 0.564
TC (AU) 7 + 1 7 + 1 6 + 1 F2, 12 =1.560 P = 0.250

64

65
Figure 11: showing mean (A) body mass and core temperature (B) pre- and post-exercise. Also
showing individual values for each condition (PRE, MID, POST) in core temperature and body
mass at pre- and post-exercise. * significant effect of time (P<0.001).
*
*
*
POST
MID

66
4.4.3 Small Intestinal Permeability
No significant main effect was observed between conditions at any time point (Table 8). L/R values at
two-hour post-ingestion of the dual sugar probe solution are shown in Table 9. Immediately post-
exercise, the highest L/R ratio was reported in the MID condition. At sixty minutes post-exercise, the
highest L/R ratio was observed in the PRE condition (Table 8). At two-hour post exercise, the highest
L/R ratio was observed in the PRE condition. Although non-significant, post-exercise ingestion of the
dual-sugar probe solution returned the lowest ratios of lactulose/ rhamnose at all time points.
Table 8: The L/R ratio (+ SD) at time points 0, 60 and 120, for the PRE, MID, and POST
conditions. Data are Mean ± SD. Where 0 represents immediately post exercise, 60 = 60min post
exercise and 120 = 120 mins post-ingestion of the dual sugar probe solution.
Pre Mid Post Main Effect Significance
0 0.026 + 0.020 0.030 + 0.032 0.012 + 0.011 F1.13,5.63= 1.553 P = 0.268
60 0.032 + 0.024 0.024 + 0.016 0.010 + 0.005 F1.23,8.57= 4.008 P= 0.073
120 0.032 + 0.024 0.026 + 0.015 0.015 + 0.006 F1.35, 9.45= 2.374 P = 0.154
Table 9: The L/R ratio mean ± SD and 95% CI at all time points for the PRE, MID and POST
conditions.
0
L/R (AU) Lower Bound Upper Bound
PRE 0.026 + 0.020 0.005 0.047
MID 0.030 + 0.032 -0.004 0.063
POST 0.012 + 0.011 0.000 0.023
60
L/R (AU) Lower Bound Upper Bound
PRE 0.032 + 0.024 0.012 0.052
MID 0.024 + 0.016 0.013 0.038
POST 0.010 + 0.005 0.011 0.020
120
L/R (AU) Lower Bound Upper Bound
PRE 0.032 + 0.024 0.012 0.052
MID 0.025 + 0.015 0.011 0.038
POST 0.015 + 0.006 0.006 0.014

67
PRE MID POST
0.00
0.02
0.04
0.06
L/R
Ratio
PRE
MID
POST
AB
C

68
Figure 12: The L/R ratio at immediately post-exercise (A); 60 minutes post-exercise (B); and two
hours post ingestion of the test solution (C). Also showing individual participant responses for
PRE, MID and POST conditions at 0 (immediately post-exercise), 60 minutes post exercise and 120
post L/R solution ingestion time points.

69
4.4.4 GI symptoms
Assessment of gastrointestinal symptoms was completed through a questionnaire which ranked several
symptoms on a scale of zero (no symptoms) to ten (severe symptoms). Symptoms included: side stitch;
nausea; bloating; urge to burb; urge to vomit; urge to defecate; diarrhoea and flatulence. We observed
only mild symptoms (mean of 1) in the PRE condition for nausea, urge to burp, urge to defecate and
flatulence. Very mild symptoms (mean of 1) we reported during the MID condition for bloating and
flatulence. No symptoms were reported during the POST condition (Table 10).
Table 10: Post-exercise subjective gastrointestinal symptoms between conditions. Data are
presented as mean values indicated by participants from a 0-10 VAS.
Condition
Pre Mid Post
Gut symptoms Severity (%)
Side Stitch 0 0 0
Nausea 1 0 0
Bloating 0 1 0
Urge to Burb 1 0 0
Urge to Vomit 0 0 0
Urge to defecate 1 0 0
Diarrhoea 0 0 0
Flatulence 1 1 0
4.5 Discussion
The aim of the current study was to investigate whether the timing at which the dual-sugar probe test
solution was administered, in relation to a bout of moderate treadmill exercise, affects the subsequent
ratio of L/R recovered. To the author’s knowledge, present data has shown for the first time that, whilst
non-significant, ingestion of the dual-sugar probe solution pre or during exercise returns a higher L/R
ratio than post-exercise ingestion. However, providing the dual-probe solution pre-or during exercise,
consistently returns higher L/R estimates than when the solution is ingested post-exercise.
Previously, the L/R solutions to measure GI permeability have been administered before (Pugh
et al., 2017b), during (Van Wijck et al., 2012b; Snipe et al., 2017) or post-exercise (Marchbank et al.,
2011; Davison et al., 2016; March et al., 2017; March et al., 2018). Additionally, the dose of sugar-
probes in these test solutions has varied widely (Table 3). These differences make cross-study
comparisons of changes in small intestine permeability difficult, which are further complicated by the
chosen method of sample collection, for example urine or serum analysis, exercise modality,
environmental conditions, exercise intensity and reporting of results (mean vs. median). To align our
protocol with current literature, an exercise intensity of ~80 % maximal oxygen uptake was utilised to

70
promote an increase in small intestinal permeability (Pires et al., 2017), with sixty minutes continuous
treadmill running in thermoneutral conditions (Pals et al., 1997; Lambert et al., 2001; Lambert et al.,
2007; Lambert et al., 2008).
Ingesting the L/R dual probe solution pre-exercise returned the highest magnitude of
permeability. These results are similar to those of resting participants, but much lower than those
following 60 minutes of treadmill running at 70% V̇O2 max in 30°C heat (Pugh et al., 2017c). However,
comparisons between studies is difficult, despite using a similar assay, these authors used only 5 g of
lactulose, whereas 10 g of lactulose was used in the present study. At present, research is lacking
investigating the effects of different doses of sugar-probes on the L/R ratio, but some researchers argue
that larger doses of lactulose increases the passage through the GI system, effectively influencing the
sensitivity of the analysis (van Wijck et al., 2011b).
The ratios of L/R from the present study are lower than the urinary L/R values reported by
Lambert et al. (2008) for participants at rest (0.035 (0.011-0.107), or with placebo (0.049 (0.017-0.124)
following sixty minutes treadmill running at seventy % of maximal oxygen uptake. These values are
also lower than another study by Lambert et al. (2007), which returned a L/R ratio of 0.065 (0.04 –
0.08), again following sixty minutes treadmill running at 70% V̇O2 max. Utilising a similar exercise
protocol, but providing the L/R dual probe solution at 30 minutes during a 60 minute exercise protocol,
Pals et al. (1997), reported mean L/R values of 0.048 + 0.009 at rest, 0.056 + 0.005 at 40% V̇O2 max.,
0.064 + 0.010 at 60% V̇O2 max., and 0.107 + 0.021 at 80% V̇O2. max. Given that no statistical difference
was observed between the L/R ratio at any time point in the present study, and these authors used a
similar test-solution, the results of these studies (Pals et al., 1997; Lambert et al., 2007; Lambert et al.,
2008) are, arguably, comparable. However, the data from Lambert et al. (2007) is inconsistent with the
conclusions made by Pals et al. (1997), who argued a positive relationship between exercise intensity
and intestinal permeability. Lambert et al. (2007) returned L/R values of 0.065 (0.04 – 0.08) following
sixty minutes treadmill running at 70% V̇O2 max, compared to 0.064 + 0.010 at 60% V̇O2. max reported
by Pals et al. (1997).
Smetanka et al. (1999) investigated intestinal permeability in thirty-four runners in the 1996
Chicago Marathon, providing the dual-sugar test solution within 15 minutes of race completion, and
utilising a five-hour urinary excretion analysis. Taking values from runners who did not ingest
ibuprofen or aspirin, the L/R ratio was 0.019 + 0.01; interestingly, these values were lower than resting
controls (0.022 + 0.01). Whilst not significantly different, it would be expected that intestinal
permeability be higher following a marathon than an equivalent time of rest since the gut may have
experienced an extended period of hypoperfusion, core temperature would have also been elevated
(Adams et al., 1975). Interestingly, the results from the present study report an L/R ratio of 0.012 at the
0 time point during the post-condition. These findings are difficult to explain as the pre-exercise serum
samples returned an undetectable level of L/R; since the test-solution had not been provided to
participants at the 0 time point, similar or undetectable of lactulose and rhamnose should have been
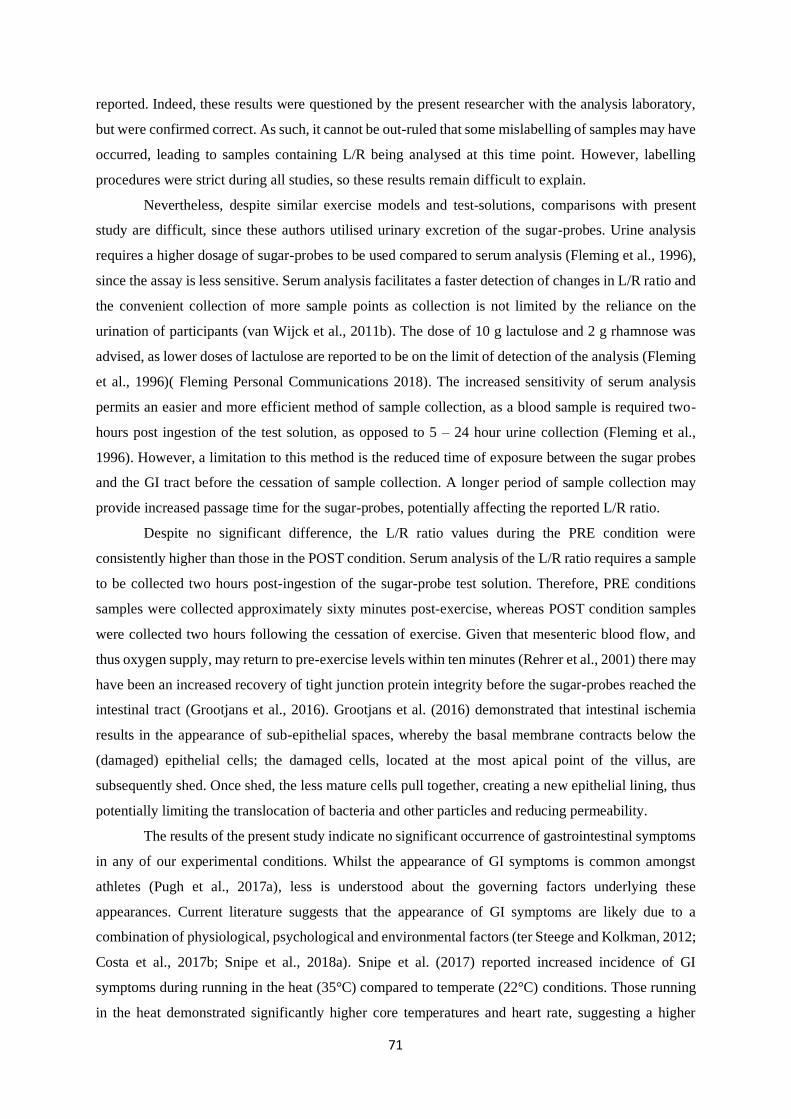
71
reported. Indeed, these results were questioned by the present researcher with the analysis laboratory,
but were confirmed correct. As such, it cannot be out-ruled that some mislabelling of samples may have
occurred, leading to samples containing L/R being analysed at this time point. However, labelling
procedures were strict during all studies, so these results remain difficult to explain.
Nevertheless, despite similar exercise models and test-solutions, comparisons with present
study are difficult, since these authors utilised urinary excretion of the sugar-probes. Urine analysis
requires a higher dosage of sugar-probes to be used compared to serum analysis (Fleming et al., 1996),
since the assay is less sensitive. Serum analysis facilitates a faster detection of changes in L/R ratio and
the convenient collection of more sample points as collection is not limited by the reliance on the
urination of participants (van Wijck et al., 2011b). The dose of 10 g lactulose and 2 g rhamnose was
advised, as lower doses of lactulose are reported to be on the limit of detection of the analysis (Fleming
et al., 1996)( Fleming Personal Communications 2018). The increased sensitivity of serum analysis
permits an easier and more efficient method of sample collection, as a blood sample is required two-
hours post ingestion of the test solution, as opposed to 5 – 24 hour urine collection (Fleming et al.,
1996). However, a limitation to this method is the reduced time of exposure between the sugar probes
and the GI tract before the cessation of sample collection. A longer period of sample collection may
provide increased passage time for the sugar-probes, potentially affecting the reported L/R ratio.
Despite no significant difference, the L/R ratio values during the PRE condition were
consistently higher than those in the POST condition. Serum analysis of the L/R ratio requires a sample
to be collected two hours post-ingestion of the sugar-probe test solution. Therefore, PRE conditions
samples were collected approximately sixty minutes post-exercise, whereas POST condition samples
were collected two hours following the cessation of exercise. Given that mesenteric blood flow, and
thus oxygen supply, may return to pre-exercise levels within ten minutes (Rehrer et al., 2001) there may
have been an increased recovery of tight junction protein integrity before the sugar-probes reached the
intestinal tract (Grootjans et al., 2016). Grootjans et al. (2016) demonstrated that intestinal ischemia
results in the appearance of sub-epithelial spaces, whereby the basal membrane contracts below the
(damaged) epithelial cells; the damaged cells, located at the most apical point of the villus, are
subsequently shed. Once shed, the less mature cells pull together, creating a new epithelial lining, thus
potentially limiting the translocation of bacteria and other particles and reducing permeability.
The results of the present study indicate no significant occurrence of gastrointestinal symptoms
in any of our experimental conditions. Whilst the appearance of GI symptoms is common amongst
athletes (Pugh et al., 2017a), less is understood about the governing factors underlying these
appearances. Current literature suggests that the appearance of GI symptoms are likely due to a
combination of physiological, psychological and environmental factors (ter Steege and Kolkman, 2012;
Costa et al., 2017b; Snipe et al., 2018a). Snipe et al. (2017) reported increased incidence of GI
symptoms during running in the heat (35°C) compared to temperate (22°C) conditions. Those running
in the heat demonstrated significantly higher core temperatures and heart rate, suggesting a higher
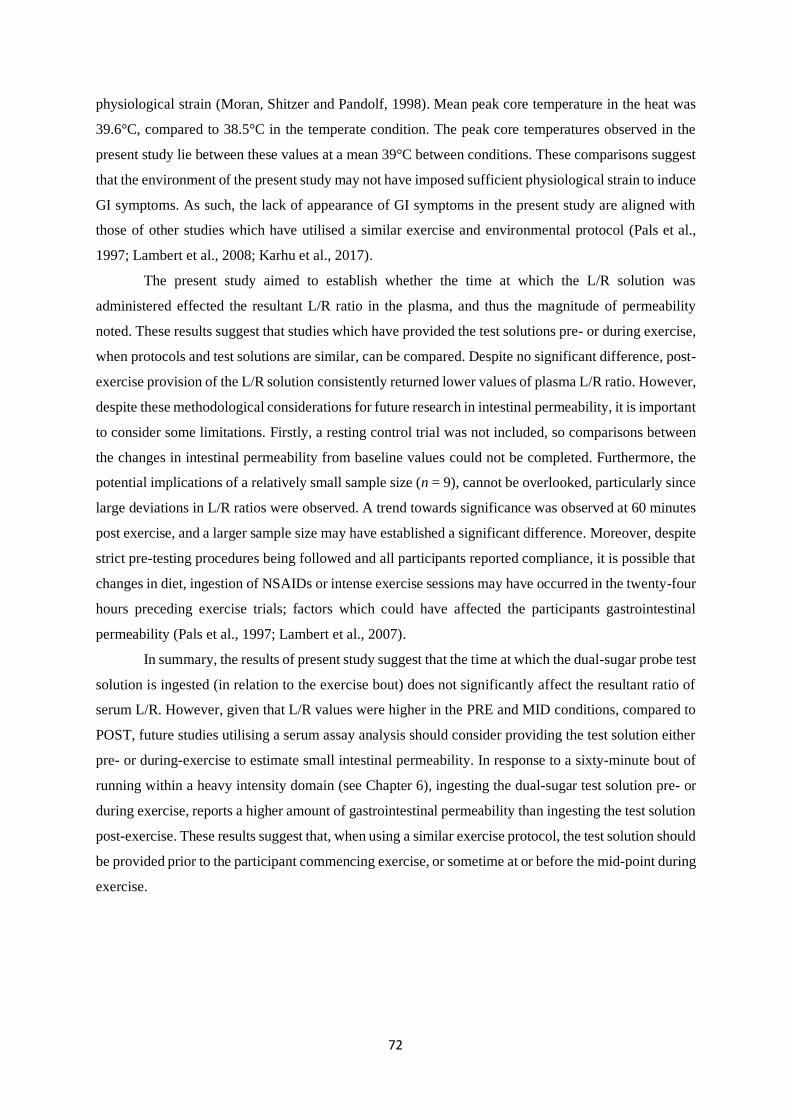
72
physiological strain (Moran, Shitzer and Pandolf, 1998). Mean peak core temperature in the heat was
39.6°C, compared to 38.5°C in the temperate condition. The peak core temperatures observed in the
present study lie between these values at a mean 39°C between conditions. These comparisons suggest
that the environment of the present study may not have imposed sufficient physiological strain to induce
GI symptoms. As such, the lack of appearance of GI symptoms in the present study are aligned with
those of other studies which have utilised a similar exercise and environmental protocol (Pals et al.,
1997; Lambert et al., 2008; Karhu et al., 2017).
The present study aimed to establish whether the time at which the L/R solution was
administered effected the resultant L/R ratio in the plasma, and thus the magnitude of permeability
noted. These results suggest that studies which have provided the test solutions pre- or during exercise,
when protocols and test solutions are similar, can be compared. Despite no significant difference, post-
exercise provision of the L/R solution consistently returned lower values of plasma L/R ratio. However,
despite these methodological considerations for future research in intestinal permeability, it is important
to consider some limitations. Firstly, a resting control trial was not included, so comparisons between
the changes in intestinal permeability from baseline values could not be completed. Furthermore, the
potential implications of a relatively small sample size (n = 9), cannot be overlooked, particularly since
large deviations in L/R ratios were observed. A trend towards significance was observed at 60 minutes
post exercise, and a larger sample size may have established a significant difference. Moreover, despite
strict pre-testing procedures being followed and all participants reported compliance, it is possible that
changes in diet, ingestion of NSAIDs or intense exercise sessions may have occurred in the twenty-four
hours preceding exercise trials; factors which could have affected the participants gastrointestinal
permeability (Pals et al., 1997; Lambert et al., 2007).
In summary, the results of present study suggest that the time at which the dual-sugar probe test
solution is ingested (in relation to the exercise bout) does not significantly affect the resultant ratio of
serum L/R. However, given that L/R values were higher in the PRE and MID conditions, compared to
POST, future studies utilising a serum assay analysis should consider providing the test solution either
pre- or during-exercise to estimate small intestinal permeability. In response to a sixty-minute bout of
running within a heavy intensity domain (see Chapter 6), ingesting the dual-sugar test solution pre- or
during exercise, reports a higher amount of gastrointestinal permeability than ingesting the test solution
post-exercise. These results suggest that, when using a similar exercise protocol, the test solution should
be provided prior to the participant commencing exercise, or sometime at or before the mid-point during
exercise.

73
Chapter 5 – Effect of Exercise in
Different Intensity Domains on
Gastrointestinal Permeability and
Symptoms in Runners and Triathletes
Chapter 4 investigated methodological considerations surrounding the timing of sugar probe
ingestion in relation to exercise, and whether this affected the subsequent serum L/R ratio. Given
the importance of exercise intensity as a contributing factor towards intestinal permeability (Pals
et al., 1997; Costa et al., 2017b), Chapter 5 will address the influence of increasing exercise
intensity domains on intestinal permeability and symptom expression.
5.1 Abstract
Aim: The aim of this study is to determine the effects of running exercise intensity on GI dysfunction,
GI permeability and biomarkers of GI damage. Methods: A total of ten participants (Male = 7, Female
= 3) [age = 29 + 6 years , body mass = 69.9 + 10.1 kg, height = 173.0 + 7.9 cm, V̇O2 max = 55 ± 6 mL·kg-
1·min-1] volunteered to take part in the study. After assessment of maximal oxygen uptake and
familiarisation, in a counterbalanced experimental design, participants completed four experimental
trials (rest, moderate, heavy and severe intensity based on CP estimation). GI permeability was
determined by serum lactulose/ rhamnose ratio whilst translocation of D-lactate into portal
circulation was taken as a marker of GI permeability. Subjective GI symptoms were assessed
via 10-point Likert scale (Lambert et al. 2008). Results: Exercise in the severe intensity domain
returned higher L/R ratio values than exercise completed in the moderate and heavy intensity
domains. Conclusion: Intestinal permeability demonstrates a stepwise linear relationship with
exercise intensity. The appearance of GI symptoms does not correlate with the step wise
increase in exercise intensity within the ranges utilised within this study.
5.2 Introduction
Exercise results in a intergated range of physiological events, particularly involving the muscoskeletal
and cardiovascular systems. Some biological functions are upregulated to meet the increased demand
for oxygen by the muscles and the need for an augmented rate of ATP synthesis. During exercise, an
increase in oxygen consumption, heart rate, heat and lactate production can be observed which
positively correlate with exericse intensity (Hill, 1923). Furthermore, the nature of exercise adaptions
can be dictated by the exercise intensity of the training session, leading to athletes and coaches

74
incorporating a range of intensities into the training program. Athletes engaged in endurance sports
such as running, cycling or rowing have previously used heart rate to dictate the intensity of their
training sessions; this method required the athlete to increase their effort to raise their heart rate into the
specific zone. Technological advances have since facilitated athletes and coaches with power meters to
monitor the exercise intensity, either through monitoring the force applied through the pedal or through
the rowing-machine flywheel (Jeukendrup and VanDiemen, 1998). However, more recently, power
meters have also been developed for running, whereby the athlete attaches a device to the shoe and can
relay their power output to their training watch.
An athlete’s training zones are typically developed in accordance with their notional critical
power or the sometime interchangeably utilised functional threshold power; an intensity correlating to
a steady-state of lactate production, where lactate production is met by lactate clearance (Burnley and
Jones, 2018). Research has typically utilised a fixed % maximal oxygen uptake to prescribe exercise
intensity, however, the relative physiological strain experienced by the participant may be influenced
by their training status. Thus, variations in the level of physiological strain experienced by participants
within a study may exist. An alternative method for determining exercise intensity is critical power
(CP), which represents a threshold where an athlete transverses from steady to non-steady exercise
intensity domains. CP zones are defined as moderate, heavy and severe and represent intensities utilised
to elicit specific physiological adaptions (Vanhatalo, Jones and Burnley, 2011). Exercise below CP
represents an intensity corresponding to maximal utilisation of oxidative metabolism, without
progressive accumulation of metabolites (Poole et al., 2016), however above CP (W’), the athlete is
considered to be on ‘borrowed time’, whereby exercise above this threshold quickly leads to exhaustion
(Jones et al., 2010).
During exercise, the gastrointestinal system also displays an array of physiological events.
Specifically, blood is directed away from the gut towards the working muscle to aid thermoregulation
and nutrient delivery. As such, blood flow to the gut can be reduced by as much as eighty percent,
which can lead to a state of intestinal ischemia (Rehrer et al., 2001). These disturbances can lead to an
increase in intestinal permeability, whereby the enterocyte tight junctions become dysfunctional. As a
result, large particles such as sugars, or harmful bacteria within the gut which cannot normally be
absorbed by paracellular transport, can now enter the portal circulation (van Wijck et al., 2011a).
Intestinal permeability is typically quantified by measurement of the ratio of dual-sugar probes
(lactulose and L-rhamnose) in the urine or plasma (Fleming et al., 1996; Camilleri et al., 2010). Under
conditions of increased intestinal permeability, lactulose can now be transported across the intestinal
mucosa, allowing subsequent detection in the urine or plasma. More recently, plasma D-lactate has been
identified as another potential biomarker of intestinal injury. This isoform of lactate is normally
produced by the bacteria of the GI tract through fermentation (Ewaschuk, Naylor and Zello, 2005).
Healthy individuals display low levels of circulating D-lactate (5-20 µmol/L); however, GI dysfunction
causes a greater concentration of D-lactate to translocate the intestinal mucosa to systemic circulation.

75
Whilst this biomarker has typically been used in clinical studies, a limited amount of research has
investigated the response in plasma D-lactate to exercise (Kondoh, Kawase and Ohmori, 1992). Since,
increased plasma D-lactate has been linked to intestinal ischemia (Li et al., 2017), together with the
limited research in exercising healthy individuals, further research is warranted investigating the role
of D-lactate and its suitability as a marker of intestinal permeability.
Previous research has demonstrated that intestinal permeability increases in a dose response
manner with exercise intensity (Pals et al., 1997). Current reviews suggest that intestinal permeability
occurs above an exercise intensity of ~70% V̇O2 max, with core temperature also demonstrating a dose
response relationship (Costa et al., 2017b; Pires et al., 2017). However, these studies have utilised an
exercise intensity calculated as a percentage of V̇O2 max. Furthermore, discrepancies exist in the results
of the only study investigating a dose response relationship between exercise intensity and GI
permeability (Pals et al., 1997), and there is a need for additional research into the suitability of D-
lactate as a biomarker for intestinal damage. As such, the aim of the present study was to investigate
the effects of increasing exercise intensity domains on GI permeability, GI injury and the appearance
of gastrointestinal symptoms.
5.3 Methods
5.3.1 Participants
Ten participants (Males = 7, Females = 3) [age = 29 + 6 years , body mass = 69.9 + 10.1 kg, height =
173.0 + 7.9 cm, V̇O2 max = 55±6 mL·kg-1·min-1] volunteered to take part in the study. All participants
provided written consent prior to the commencement of testing. Participant requirements included that
they were training three or more hours per week of endurance-type exercise, free from gastrointestinal
syndrome, not taking NSAIDs or nutritional supplements and willing to abide by the restrictions
implemented by the study (24h rest prior to each trial, overnight fast, no caffeine or alcohol in the 24
hours prior to each trial.)
5.3.2 Experimental Design
Following consent, participants completed a familiarisation of the critical power protocol, to familiarise
themselves with the pace and intensities required for each stage of the test. Seven days after
familiarisation, participants returned to the laboratory to complete the pre-experimental phase of the
study, to determine the critical power (CP) and critical speed (CS). Power was determined with a
running power meter pod (Stryd, Boulder, CO, USA), which has previously been validated (Imbach et
al., 2020) attached to the dominant foot and synchronised in accordance with the height and body mass

76
values of the participants during each trial. The data was recorded using the manufacturer’s software
(Stryd, Boulder, CO, USA), with power being displayed every sixty seconds. Pulmonary gas exchange,
heart rate, RPE, thermal comfort and rectal temperature (n = 3 participants) were measured every three
minutes as outlined in the General Methods section. Aural temperature was utilised in the remaining
participants using a digital tympanic infrared thermometer (Genius™ 2 Tympanic Thermometer and
Base, Covidien, UK). Measures of aural temperature were taken pre-exercise, post-exercise and one-
hour post-exercise. Haematology parameters, including blood lactate, haemoglobin and haematocrit
were collected at pre, post and 2 hours post-exercise, to quantify changes in concentration between
different intensities and times. Assessment of GI symptoms was completed pre- and immediately post-
exercise, and one-hour post-exercise.
The order of experimental trials was determined in a counterbalanced design. In both studies,
during each experimental trial, participants were asked to verbally verify their adherence to the pre-
experimental conditions as expressed in the General Methods section. All testing sessions were
conducted in the morning under the laboratory conditions outlined in the General Methods. Exclusion
criteria followed the guidelines as outlined in the General Methods section.
5.3.3 Experimental Protocol
Pre-experimental protocol: The test to determine CP and CS consisted of three consecutive time trials
of varying distances (800, 1200 and 2400 meters, respectively), which were separated by different
resting periods, as per the manufacturer’s instructions (Stryd 2017) (Fig.2). Participants were
familiarised with the test during their first visit.
Running Protocol: Each participant completed three experimental trials, each consisting of a treadmill
run. Run speed was determined by power output (Watts), equivalent to three intensity domains:
moderate (80-85% CP/CS); heavy (90-95% CP/CS) and severe (above CP/CS). Run time for each
experimental trial was determined through completion of approximately 42000 to 43000 joules of work.
Upon completion of the desired time, the trial was stopped. Running commenced 15 minutes following
ingesting of the dual-sugar probe solution. Throughout each running test, participants ingested tap water
at a rate of 1 mL‧kg-1‧BW of fluid every 15 minutes. During the rest arm of the study, participants were
asked to rest, either sitting or supine for 120 minutes.
5.4 Data analysis

77
Determination of time and intensity: Critical power was determined by linear regression of the
average power (watts) in each running trial, against the inversed time (seconds). The gradient of the
regression line determined the CP, while the point of interception determined capacity available to
accumulate work above this threshold W’ (Vanhatalo, Jones and Burnley, 2011). Power was predicted
using Equation 1, where P is power and Tlim represents time-to-exhaustion. The result of Tlim was
divided against 1 to get the legitimate time to exhaustion.
𝑃 = 𝑊′∙ (1
𝑇𝑙𝑖𝑚) +𝐶𝑃 [Equation 1]
To determine CS, a linear regression was performed, plotting completed distance (meters), against time
to complete the distance (seconds). The gradient of the regression line provided the distance (D’) whilst
the intercept provided the CS, and Tlim represents time-to-exhaustion (Vanhatalo, Jones and Burnley,
2011).
𝐷=𝐶𝑆 ∙𝑇𝑙𝑖𝑚+𝐷′ [Equation 2]
To facilitate a comparison between the participants, it was necessary to standardise the amount of work
(J). It is estimated that the minimum time required to augment intestinal permeability is approximately
20 minutes (Costa et al., 2017b). Therefore, the CP equation was modified to calculate the required
amount of work (Vanhatalo, Jones and Burnley, 2011)
𝑃 = (W
(𝑇𝑙𝑖𝑚)) + 𝐶𝑃 [Equation 3]
The power displayed at 20 minutes was used to establish Tlim, outlining the power that could be sustained
for 20 minutes or above. Work in joules was calculated by multiplying power by time in seconds. A
range of 42 – 43 kJ was established to warrant a similar amount of work between participants whilst
ensuring a minimum of twenty minutes was completed in each of the intensity domains. To predict the
time required to attain the desired work (42 – 43 kJ), the following equation was utilised:
T = (Joules
(𝑊𝑎𝑡𝑡)) / 60 [Equation 4]
The power at each intensity domain was 81 ± 2%, 93 ± 3% and 104 ± 1% of CP, for moderate, heavy
and severe, respectively. Working within these power zones is reported to elicit different physiological
response (Poole et al., 2016). Initial treadmill speed during every experimental trial was determined by
the Critical Speed, in accordance with the specific power zone. Speed was calculated as moderate and

78
heavy at 80 – 85 % and 90 – 95 %, respectively, as well as the %CS equivalent to the power above CP,
which is sustainable for twenty minutes or longer. Despite the determination of CS for each power zone,
intensity was primarily determined by power. As such, running speed was modified to attain the desired
power. V̇O2 peak was determined during the test as the highest mean V̇O2 value over ten seconds. The gas
exchange threshold (GET), was established during each test from the first disproportionate increase in
VCO2, determined by visual inspection of the individual V̇CO2 by V̇O2 plots (Vanhatalo et al., 2011).
5.6 Assessment of GI permeability, injury and symptoms
Gastrointestinal permeability was quantified by the dual-sugar probe method as outlined in the General
Methods section (Fleming et al., 1996). Blood samples were collected at baseline, immediately post-
exercise and 120 minutes post-ingestion of the test solution.
D-lactate was determined by a rapid assay ultra violet (UV) colour metric technique, in 100 µl
of EDTA, at 340 nm in plasma (Meagazyme, Ireland). Briefly, 100 μl of plasma was reacted for 5
minutes with sample reagents with the change in NADH release proportional to D-lactate present. The
detection threshold for D-lactate of this micro-plate approach translates to a D-lactate lower
concentration threshold of 0.21mg∙L-1.
The appearance of GI symptoms was quantified by a 10-point Likert scale using 100 mm lines,
as described in the General Methods section. Briefly, participants would indicate the appearance of any
symptoms by marking on the scale. Symptoms being assessed included side stitch, nausea, bloating,
urge to burp, urge to vomit, urge to defecate, diarrhoea, fluctuation, stomach cramps and stomach upset.
5.7 Statistical analysis
Data are presented as the mean ± the standard deviation (SD) unless otherwise stated. Ninety-five
percent confidence intervals (95% CIs) are presented where appropriate. Changes between different
variables throughout intensity domains were examined using a repeated-measures ANOVA. To correct
violations of sphericity, the degrees of freedom were corrected in a normal way, using Huynh-Feldt (ε
>.75) or Greenhouse-Geisser (ε <.75) values for ε, as appropriate (Field 2007). A Bonferroni pairwise
comparison was made when 10 main effects were present. Pearson’s product-moment correlation
analysis was used to assess associations between variables respectively. Statistics were analysed using
Statistical Package for Social Science (SPSS; 26.0, Armonk, NY: IBM Corp) with significance accepted
at p ≤ 0.05. Values found to be equal to P=0.000 were adjusted to P<0.001.

79
5.8 Results
5.8.1 Physiological responses to treadmill running
There was no significant main effect observed in work completed (42.5 + 0.1 kilojoules) or distance
covered (5.9 + 0.1 km), indicating no difference in load between intensity conditions and participants.
We observed no difference (P = 0.77) in body weight loss between exercise conditions (0.7 + 0.1 kg).
Mean power for each intensity domain was 192±37, 227±44 and 252±49 watts for moderate, heavy and
severe intensity respectively. Table 11 displays power, %CP, HR, % of maximal HR, AND the relative
V̇O2, % of V̇O2peak associated at every intensity domain.
Blood lactate concentrations showed a significant increase between conditions in a stepwise manner,
with the severe domain returning higher lactate concentrations than the heavy (P = 0.015), moderate (P
<0.001) and rest (P <0.001) conditions. The heavy intensity domain returned higher lactate levels than
moderate (P = 0.026) and rest (P = 0.011), but lower concentrations than severe (Fig 5.2). A significant
effect for condition was reported for HR and RPE, with the severe domain returning higher values than
heavy (P<0.05), moderate (P<0.001) and rest (P<0.001) (Table 11).
Table 11: Physiological responses to treadmill running at rest and within the moderate, heavy and
severe exercise intensity domains.
Rest Moderate Heavy Severe Main effect Significance
Power (W) - 192±37 227±44 252±49 F1.3,12.1=96.9 P<0.001
Percentage CP (%) - 81±2 93±3 104±1
Work (kilojoules) - 42.54±2.48 42.40±3.13 42.58±1.59 F1.4,11.2=1.12 P=0.34
Distance (Km) - 5.9±1.0 5.8±0.9 6.0±1.0 F1.2,11.5=0.38 P=0.60
Running time (min) - 37 ± 7 32 ± 6 28 ± 4 - -
Speed (km/h) - 9.8 + 0.8 11.4 + 1.2 12.5 + 1.5 - -
V̇O2 (mL‧kg-1‧min-1) 9±2 39±4 44±6 49±6 F1.2,10.4=490.9 P<0.001
V̇O2 (L.min-1) 625±155 2720±437 3094±584 3435±609 F1.2,10.7=48.9 P<0.001
V̇O2 max (%) 16±2 71±3 81±5 90±4 - -
HR (b·min-1) 58±9 150±11 163±11 174±10 F1.7,15.3=541.5 P<0.001
HR (%) 31±5 78±5 85±6 91±5 - -
RPE (AU) 6 11±1 14±2 16±1 F2.1,18.9=196.7 P<0.001

80
5.8.2 Core Temperature
A significant main effect was observed in core temperature between exercise intensities (Table 12).
Severe intensity domain returned a significantly higher core temperature response than the heavy (P =
0.003), moderate (P = 0.002) and rest (P< 0.001) intensity domains. Whilst an increase in rectal
temperature was observed between intensity domains (Fig. 5.1), the limitations in sample size prevent
rigorous conclusions being possible. A significant difference was observed in thermal comfort between
severe and moderate (P=0.019) and rest (P<0.001). TC also showed a significant difference between
heavy and moderate (P = 0.008), and rest (P<0.001). A significant difference between moderate and
rest was also observed for TC (P=0.001). A significant correlation between core temperature and
intestinal permeability was observed (r = 0.55, P<0.001) with core temperature accounting for 30
percent of the changes in L/R ratio. Furthermore, a significant positive correlation was observed
between core temperature and subjective GI symptoms (r=0.54, P<0.001) with core temperature
accounting for 29 percent of the changes in GI symptoms.
.
Figure 13: Post-exercise core-temperature (°C) values for all experimental conditions.
REST MODERATE HEAVY SEVERE
34.5
35.0
35.5
36.0
36.5
37.0
37.5
38.0
38.5
39.0
39.5
40.0
Tre
cta
l (°C
)
Threshold 1
Threshold 2

81
Figure 14: Post-exercise lactate (mmol.L-1) values for all experimental conditions
Table 12: Response in L/R ratio (AU); lactate (mmol.L-1); GI symptoms; core temperature (ºC);
rectal temperature (ºC); and thermal comfort (AU) for all experimental conditions.
Rest Moderate Heavy Severe Main effect Significance
L/R ratio
(AU) 0.031±0.011 0.039±0.011 0.052±0.012
0.055±0.
011 F3,27=13.3 P<0.001
Lactate
(mmol.L-1) 0.8±0.6 1.8±0.9 3.9±1.9 6.3±2.6 F1.8,16.2=26.6 P<0.001
GI symptoms
(%) 1±2 0±1 5±3 12±6 F1.5,13.8=34.0 P<0.001
Tcore (ºC) 36.0±0.4 36.9±1.0 37.2±0.9 37.9±1.0 F2.1,19.6=29.2 P<0.001
Trectal (ºC) 36.4±0.3 38.2±0.1 38.6±0.2 39.2±0.4 F1.9,3.8=115.1 P<0.001
TC (AU) 5.1 + 0.3 6.7 ± 0.9 7.4 ± 0.8 7.8 ± 1 F2.3,21.50=45 P<0.001

82
5.8.3 GI permeability and injury
A significant main effect for condition was observed (P<0.001) in serum L/R ratio, as the ratio increased
in a stepwise manner in response to increasing exercise intensity (Table 12). L/R increased in the severe
condition by 75% relative to rest. The severe condition also returned significantly higher L/R ratio
values than moderate (P=0.041) and rest (P=0.05). However, no significant difference was observed
between the severe and heavy exercise intensity domains. L/R in serum increased in the heavy condition
by 65 percent when compared to rest, a significant effect (P=0.05), with no difference between heavy
and moderate (Fig. 5.3). A significant positive correlation was observed between L/R ratio and GI
symptoms (r=0.48, P=0.002), with L/R accounting for 23 percent of the changes in GI symptoms. D-
lactate concentrations returned inconsistent data throughout the different conditions, with 89 % of data
being under levels of detection (<0.21 mg∙L).
Figure 15: Two-hour lactulose/L-rhamnose ratio values for all experimental conditions. Data are
mean ±SD.
5.8.4 GI symptoms
Despite a low appearance of GI symptoms, a significant main effect for condition was observed (Table
13). The severe intensity domain returned significantly higher appearance of GI symptoms compared
to heavy (P=0.006), moderate (P=0.001) and rest (P=0.001). The heavy intensity domain also showed
a significant higher appearance of symptoms than moderate (P=0.005) and rest (P=0.007), but

83
significantly lower symptoms than severe. Post-exercise subjective GI symptoms are displayed in Table
13.
Table 13: Post-exercise subjective gastrointestinal symptoms across different intensity domains,
presented as mean + SD. Data are presented from a 0-10 VAS, whereby 0 represents no symptoms
and 10 represents severe symptoms.
Gut symptoms Rest Moderate Heavy Severe
Side Stitch 0 + 0 0 + 0 1 + 1 2 + 2
Nausea 0 + 0 0 + 0 0 + 0 0 + 1
Bloating 0 + 0 0 + 0 1 + 1 1 + 2
Urge to Burb 0 + 0 0 + 0 0 + 0 2 + 3
Urge to Vomit 0 + 0 0 + 0 0 + 0 1 + 3
Urge to defecate 0 + 0 0 + 1 1 + 2 2 + 3
Diarrhoea 0 + 0 0 + 0 0 + 1 0 + 0
Flatulence 0 + 0 0 + 0 1 + 2 1 + 2
Stomach Cramps 0 + 0 0 + 0 1 + 2 1 + 3
Stomach upsets 0 + 0 0 + 0 1 + 2 1 + 2
5.9 Discussion
The aim of the present study was to investigate the effect of exercise intensity on GI permeability,
biomarkers of GI injury and subjective GI symptoms in trained runners. We report that GI permeability
increases in a stepwise manner with exercise intensity, when intensity is based upon running Critical
Power. Furthermore, despite the appearance of only mild symptoms of GI discomfort, symptomology
also increased in relation to exercise intensity, thus indicating a positive relationship between exercise
intensity and GI symptoms. Core temperature and lactate also displayed a positive correlation with
exercise intensity; suggesting a possible relationship between exercise intensity associated
physiological disturbance and GI integrity. Due to inconsistencies and lack of detection of D-lactate,
we cannot in our hands conclude that this biomarker is a reliable indicator of disruption to the GI barrier.
Exercise may result in a disturbance to the integrity of the gastrointestinal barrier, leading to
increased permeability of the enterocyte tight junctions and damage to the mucosal layer (van Wijck et
al., 2011a). These disturbances are influenced by intestinal ischemia as blood is directed away from the
gut towards the periphery (Rehrer et al., 2001; van Wijck et al., 2012a). Furthermore, it has been
hypothesised that the rise in core temperature in response to exercise may also contribute
mechanistically to GI dysfunction (Pires et al., 2017). Following high intensity interval running at 120%
V̇ O2 max, whereby average V̇ O2 max for the bout was 90%, Pugh et al. (2017b) reported serum L/R ratio
to be approximately 0.051. The results of the present study indicate similar concentrations in the heavy
(0.052) and severe (0.055) conditions, where average V̇O2 max was 81 and 90 %, respectively. The
present data therefore indicates that exercise above 93 % of critical power, corresponding to below 80

84
% of V̇ O2 max and 93 % of Gas exchange threshold is able to induce a significant increase in GI
permeability despite a low volume of running (5.9 km and 32 + 5 min).
To date, only one study exists exploring the relationship between exercise intensity and
gastrointestinal permeability (Pals et al., 1997). However, this study represented a relatively small
sample (n = 6), and presented anomalies in their data; furthermore, methodological changes have
developed the means of assessing gut permeability from urine analysis to a serum based biomarker
method allowing the detection of smaller fluctuations in permeability which may not be detected with
urine analysis (Fleming et al., 1996). These authors investigated the response in intestinal permeability
to repeated bouts of sixty minutes of treadmill running at intensities corresponding to 40, 60 and 80 %
of V̇O2 max. Whilst their analysis indicated a stepwise increase in GI permeability with exercise intensity,
when compared to rest, the only significant increase was observed in response to running at 80 % of
V̇O2 max. Whereby, their results indicate a 123 % increase in L/R when compared to rest. This is
distinctively higher than the increases reported in the present study, where we observed increases of 68
and 77 % in the heavy (81% V̇O2 max) and severe (90% V̇O2 max) conditions, respectively. The results of
the present study also report a smaller increase in L/R ratio of 26 % in the moderate condition (71 %
V̇O2 max). Similarly, data from the current study indicates lower resting L/R values of 0.031, compared
to 0.048 reported by Pals et al. (1997). Collectively, despite methodological differences in permeability
assessment between studies, a threshold of exercise intensity indicative of a significant increase in GI
permeability appears to exist at or above 80 % V̇O2 max; higher than the 70 % V̇O2 max threshold
previously proposed, and used widely, in the literature (Dokladny, Zuhl and Moseley, 2016; Costa et
al., 2017b). The differences between these two identified thresholds could be accountable to variance
in the protocols and analysis methods of the studies; methodological differences such as the
composition of the sugar-probe test solution, timing of ingestion of the solution, serum versus urine
analysis where serum samples return higher sensitivity (van Wijck et al., 2011b; Pugh et al., 2017b)
and variations in the length of urine collections (from one to twenty-four hours), collectively make
comparisons between studies difficult (Costa et al., 2017b). Together, the results of the present study
suggest that exercise intensity is a determining factor in the dynamics of gastrointestinal permeability.
A recent review identified a strong correlation between GI permeability and an increase in core
temperature (Pires et al., 2017). Specifically, two key thresholds were identified: 38.5 °C, whereby GI
permeability increases in some, but not all cases; and a core temperature of 39 °C or above, which
corresponds to a universal increase in GI permeability. These results are similar to those of the present
study, where a significant positive correlation was observed. However, in the present study, core
temperature accounted for just 30 % of the variations in L/R, questioning the robustness of the findings
by Pires et al. (2017). Rectal temperature is regarded as the most accurate way of recording core
temperature (Moran and Mendal, 2002). With only three of our participants volunteering for this
assessment, comparisons with the previous literature and that of core temperature thresholds is limited
(Pires et al., 2017). Despite these limitations, a positive trend between core temperature and L/R was

85
observed and we report significant increases in GI permeability, compared to rest, from exercise
performed in the heavy and severe intensity domains only. The mean peak core temperatures from these
experimental conditions were above the thresholds outlined by Pires et al. (2017), suggesting a positive
association between core temperature and GI permeability. These observations are further supported by
our data, whereby exercise performed within the moderate intensity domain, where peak core
temperature remained below 38.5 °C, did not induce a significant rise in GI permeability. Nonetheless,
further research is warranted investigating the relationship between core temperature and GI
permeability since clear associations from the present study are limited by the small sample size.
D-lactate is an alternative isoform of lactate, produced through fermentation by bacteria within
the GI tract (Ewaschuk, Naylor and Zello, 2005). Studies in critical care patients have demonstrated a
positive relationship between D-lactate and intestinal ischemia (Poeze et al., 2003); as such, this
metabolite has been recognised as a potential biomarker for GI dysfunction (Li et al., 2017). To date,
only Kondoh, Kawase and Ohmori (1992) have explored the D-lactate response in exercising humans.
These researchers investigated the changes in plasma D-lactate in trained, and untrained runners, in
response to approximately five minutes of stair running and thirty minutes of running around an
athletics field. Whilst no control on exercise intensity was reported, D-lactate showed a greater increase
following the stair running when compared to longer duration running. As such, this was the first study
to investigate a potential relationship between exercise, D-lactate, GI permeability and symptoms
within a controlled laboratory setting. However, data from the current study failed to show any change
in D-lactate as the majority of results were below the detection limit of our assay. On face value these
results would suggest D-lactate to be an unsuitable biomarker for detecting GI damage in healthy,
exercising adults. However, the current study utilised a rapid assay UV colorimetric technique at 340
nm in plasma (Meagazyme, Ireland) to detect changes in plasma D-lactate. This method may have
influenced the results of the present study as precision and detection levels are lower when compared
to other more sensitive enzyme-linked immunosorbent assay (Shi et al., 2015). Furthermore, the body
of research investigating D-lactate has been conducted in clinical patients experiencing severe GI
ischemia or conditions (Poeze et al., 2003; Shi et al., 2015). Together, the results of the current study
suggest that further research is warranted investigating the suitability of D-lactate as a marker of GI
damage, but attention should be paid towards the method of analysis, with regard to detection threshold
sensitivity.
The appearance of gastrointestinal symptoms is common amongst athletes, particularly runners
(de Oliveira, Burini and Jeukendrup, 2014) and, indeed, a mild expression of GI symptoms (12 % of
participants) was observed in the present study. Yet, the underlying mechanisms governing GI
symptomology in response to exercise are not clear and current research remains contradictory (Costa
et al., 2017b). In the present study, a positive relationship between GI symptoms and exercise intensity,
with a significant increase in symptomology occurring in response to exercise in the severe domain. A
further positive correlation was evident between the appearance of GI symptoms and the L/R ratio, yet

86
L/R ratio accounted for only 23 % of the presence of symptoms. Together with previous research, these
results suggest a very weak relationship between intestinal permeability and GI symptoms (Karhu et
al., 2017; Pugh et al., 2017b; Snipe et al., 2017). Participants of our previous studies (Chapter 4)
reported no appearance of GI symptoms in response to treadmill running at 80 % V̇O2 max, yet in the
present study, symptoms started to appear during the heavy (81% V̇O2 max) condition and significantly
increased during the severe (90% V̇O2 max) condition. The mild appearance of symptoms during the
heavy condition is particularly interesting as the mean running time (32 + 6) is almost half of that from
our previous study (Chapter 3), where participants exercised for sixty minutes at a similar intensity.
This is despite similar conditions between studies including environment, hydration and participant
characteristics. One important difference between the studies remains that the current study was of
mixed gender design including three female participants. The literature is equivocal with regards to
whether female athletes are more likely to develop GI symptoms and only one study exists whereby
confounding factors such as menstrual cycle phase were controlled (Snipe and Costa, 2018a). Despite
similar control measures being in place in the present study, one female participant accounted for 56 %
of the appearance of GI symptoms in the heavy condition and 47 % in the severe condition. One other
(male) participant accounted for a distinct contribution to the expression symptoms in both the heavy
(37 %) and severe (17 %) conditions. The remaining female participants reported almost no symptoms
in any condition (2 %). Given the relatively small sample size of participants, it is difficult to draw
conclusions as to whether females are more likely to develop GI symptoms, but instead, individual
susceptibility may be a more critical determining factor. Together, these results may suggest that in
thermoneutral conditions, exercise intensity may be a governing factor of GI symptoms. Core
temperature has been shown to display a positive correlation with exercise intensity (Pals et al., 1997),
furthermore, when compared to thermoneutral conditions, exercise in hot environments has shown to
result in both higher core temperatures and increased incidence of GI symptoms (Snipe et al., 2017).
These results agree with the present study, whereby the highest occurrence of GI symptoms and peak
core temperatures were observed in the severe exercise domain trial. Indeed, Snipe et al. (2017) reported
a significant increase in GI symptoms in response to exercise in the heat, where core temperature
averaged 39.6°C, similar to the peak core temperature during the severe condition (39.5°C).
Collectively, these data suggest that a relationship between core temperature and the appearance of
gastrointestinal symptoms may exist and, thus, further research is warranted investigating this
relationship.
Previous research has typically utilised V̇O2 max to prescribe exercise intensity, such as running
speed or cycling power, with the majority of studies prescribing an intensity relative to 70 % of V̇O2 max
(Costa et al., 2017b). Yet, a participant’s training status may influence the physiological strain they
experience when exercise intensity is determined by V̇O2 max, meaning some participants may
experience greater physiological disturbances than others (Poole et al., 2016). Critical power identifies
a threshold within the power-duration relationship where energy supply reaches a steady-state, being

87
provided through oxidative metabolism without a progressive accumulation of blood lactate. This
threshold thereby provides the determination of exercise intensity zones within which physiological
reactions may or may not be stabilised, specifically below or above critical power, respectively (Poole
et al., 2016). As such, when exercise intensity is prescribed in relation to critical power, within the
moderate, heavy, or severe domains, the physiological and biochemical responses represent a specific
stimuli to the participant (Burnley and Jones, 2018). Indeed, research has described a variety of
physiological responses which increase when exercise is performed at an intensity which coincides with
the severe domain, such as blood lactate accumulation, heart rate and faster decline of PCr stores; yet
these physiological responses achieve a more steady-state at lower exercise intensities (Burnley,
Vanhatalo and Jones, 2012; Vanhatalo et al., 2016). There are a number of similarities between the
results of the present study and the literature, as exercise in the severe domain produced significantly
higher responses in blood lactate, core temperature, HR and RPE when compared to the moderate and
heavy intensity domains (Pals et al., 1997). Incidentally, this data provides further evidence of a
potential association between exercise intensity and GI dysfunction, whereby higher exercise intensities
contribute to a greater physiological strain which includes augmented intestinal permeability. However,
a key weakness of the present study and indeed the existing literature, is a lack of quantification of
mesenteric blood flow, a key contributor to GI dysfunction (ter Steege and Kolkman, 2012).
Measurement of mesenteric blood flow and its relationship with exercise intensity, intestinal
permeability and the appearance of GI symptoms, would strengthen our understanding of the
mechanisms underlying GI dysfunction, thus, future research is warranted. Nonetheless, the association
between running critical power and the alterations in physiological disturbances suggest CP to be an
applicable method in prescribing a more individualised exercise intensity in future research. In
particular the ecological application of CP determination and measurement through running power
meters allows for refinement of field and lab based studies.
The results of the present study show that GI permeability displays a dose-response relationship
with exercise intensity. The current study also demonstrated that exercise above CP compromises
gastrointestinal integrity. Whilst an increase in GI symptoms was observed following exercise in the
severe domain, the majority of this data was attributed to two participants, and therefore it cannot be
concluded that a relationship between exercise intensity and subjective GI symptoms exists.
Furthermore, the inconsistent data observed for D-lactate warrants further investigation into this
biomarker as an indicator of GI dysfunction in exercising individuals.

88
Chapter 6– Effects of Passive Hyperthermia
on Gastrointestinal Permeability, Injury
and Symptoms
Chapter 5 demonstrated that intestinal permeability increases in a stepwise manner with exercise
intensity, which correlated with core temperature. As such, Chapter 6 will investigate how an
increase in core temperature with no physical exercise (passive heating) affects intestinal
permeability.
6.1 Abstract
This study tested the hypothesis that increased intestinal permeability and injury are related to
hyperthermia, independent of exercise-induced ischemia. Methods: Six healthy males participated in
the study. After familiarisation, each participant completed three trial conditions (CONTROL, WARM
and HOT), whereby core temperature was increased through hot water immersion (40℃). GI
permeability was determined by serum L/R ratio. Results: Intestinal permeability increased in all
conditions but there was no difference between conditions P = 0.566. No correlation between increased
gastrointestinal permeability and core temperature was observed (r = 0.019). Conclusion: Hyperthermia
independent of exercise-induced intestinal hypoperfusion does not augment gastrointestinal
permeability or symptoms.
6.2 Introduction
Under normal physiological conditions, the passage of molecules across the enterocytes in the GI barrier
is well controlled. However, under certain physiological conditions such as hyperthermia or ischemia
(caused by a reduction in blood and oxygen supply to the gut), the tight junctions become dysfunction
and intestinal permeability increases (Costa et al., 2017b). Indeed, hyperthermia has been shown to
increase the permeability of the intestinal tract in both human studies and in vitro (Dokladny, Moseley
and Ma, 2006; Dokladny, Zuhl and Moseley, 2016). However, it is not yet clear which contributing
factor, hyperthermia or hypoperfusion, plays the predominant role in augmenting intestinal
permeability.
The physical barrier between the contents of the intestine and the portal blood consists of an
epithelial layer connected by protein structures known as tight-junctions (Grootjans et al., 2016). During
exercise, blood is redirected away from the GI tract towards the periphery and working muscle, reducing
the blood and oxygen supply to the GI tract (Rehrer et al., 2001). This state of intestinal ischemia causes

89
a cascade of events which ultimately leads to the dysfunction of the tight junctions and an increase in
intestinal permeability. These events have been discussed in Chapter 2.2.
Normal core temperature is maintained at approximately 37℃, however this can increase
during exercise (exertional) or in hot environments (passive) (Tyler et al., 2016). The temperature
regulatory systems of the body can be compromised by clothing or submersion in water, preventing the
loss of heat by radiation and creating an environment of uncompensable heat stress (McLellan,
Boscarino and Duncan, 2013). As heat accumulates in the body, core temperature continues to rise and
symptoms of heat illness may develop, such as nausea or syncope, posing a serious threat to the health
of athletes, military personnel and some workers (Coris, Ramirez and Van Durme, 2004; McLellan,
Boscarino and Duncan, 2013). If these symptoms are not addressed and core temperature continues to
rise, heat stroke may occur. Indeed, heat stroke is a serious, life-threatening, medical condition, which
is characterised by an elevation in core temperature above 40℃, which sees a cascade of events leading
to an inflammatory response, multiple organ failure and death (Epstein and Yanovich, 2019). Hall et al.
(2001b) also demonstrated in rats, that elevating core temperatures above 40℃ reduces splanchnic
blood flow, leading to intestinal barrier dysfunction and subsequent endotoxemia. Whilst research into
the effects of passive hyperthermia on the intestinal permeability of humans is currently lacking, a
recent review by Pires et al. (2017) identified an association between exercise induced hyperthermia
and intestinal permeability. These researchers identified two key thresholds of core temperature: 38.5℃
where intestinal permeability is augmented but not universal amongst participants; and 39℃ where an
increase in intestinal permeability is universal. This review fails to investigate the effects of passive
hyperthermia on intestinal permeability, likely due to the lack of research in this area given the ethical
restrictions towards increasing the core temperature of humans towards levels associated with heat
stroke (Dokladny, Zuhl and Moseley, 2016). Therefore, the aim of the present study was to investigate
whether increasing core temperature via passive hyperthermia to the two identified core temperature
thresholds augments intestinal permeability. A secondary aim of the present study was to quantify the
response in subjective GI symptoms in response to passive hyperthermia.
6.3 Methods
6.3.1 Participants
Eight healthy, recreationally active males volunteered to participate in the study. One participant
withdrew from the study following familiarisation. All participants provided written consent prior to
the commencement of testing. Participant requirements included that they were training four or more
hours per week, which included endurance or resistance-type exercise, free from gastrointestinal
syndrome and willing to abide by the restrictions implemented by the study (24h rest prior to each
trial, overnight fast, no caffeine, alcohol or non-steroidal anti-inflammatory drugs in the 24 hours prior

90
to each trial.)
Table 14: Descriptive characteristics of participants displaying means ± SD for age (yrs.); body
mass (kg); height (cm) and V̇O2 max (mL·kg-1·min-1).
Age (yrs.) Body Mass (kg) Height (cm) V̇O2 max. (mL·kg-1·min-1-
1.min-1)
Mean ± SD 31 + 16 74 + 4.5 175.2 + 5.4 53.6 + 2.6
6.3.2 Pilot Measures
To investigate the physiological responses to our proposed methods of passive hyperthermia, we
performed a series of pilot procedures prior to the main experimental study. The aims of the pilot study
were to establish an estimate of the time required for core temperature to increase to the two critical
values previously identified (38°C and above 39°C). Furthermore, we aimed to observe the core
temperature response following removal of the heat stress i.e., once the participant was removed from
the bath. Three healthy, trained males participated in the pilot study. Following resting measurements
of weight (kg), heart rate (bpm) and core temperature (rectal thermometer, °C) each participant sat,
resting, in a thermostatically controlled bath set at 40°C. Core temperature and heart rate were recorded
every three minutes.
6.3.3 Assessment of Maximal Oxygen Uptake
During the first visit, V̇O2 max was determined as per section General Methods 3.4.1.
6.3.4 Experimental Design
In a crossover, repeated-measures design, participants completed a familiarisation trial and three
experimental trials: control (CON); warm (WARM) and hot (HOT). Familiarisation trials included
rectal probe insertion and introduction to heat stress induced by hot water immersion until Tcore reached
39°C. Familiarisation trials were performed at least seven days before the first experimental trial to
limit the acute effects of heat acclimation. All experimental trials began between 7.00 h and 9.00 h at
the Sport & Exercise Science laboratory. During all experimental conditions, upon arrival at the
laboratory, participants rested in a supine position for two minutes before a resting measure of blood
pressure and a blood sample were taken. During WARM and HOT, participants then changed into
swimwear before having their nude mass (kg) recorded. During CON, participants would wear light
sports clothing including a t-shirt, shorts or tracksuit bottoms, socks and shoes. Participants then
inserted a calibrated rectal thermometer 10 cm past the anal sphincter and provided a urine sample to

91
determine hydration status, before being fitted with a heart rate monitor strap around the chest (Polar,
H10, Finland). During CON, participants sat, resting, in the laboratory under ambient environmental
conditions. During the WARM and HOT conditions, participants were secured in a safety harness and,
fifteen minutes post sugar-probe ingestion, lowered into a thermostatically controlled bath, set at 40°C,
to the manubrium, so-as-to to induce a rise in core temperature. Participants remained submerged until
their Tcore reached specific values: WARM (38-38.5°C) and HOT (39°C). When Tcore reached the
specific value, participants were raised out of the bath to attenuate any further increase in core
temperature. Cooling was implemented via cold water misting and a fan in the WARM condition to
attenuate Tcore increasing beyond 38.5°C. In each experimental condition, exposure was set at 60
minutes. After 60 minutes, the participant was raised out of the bath and lowered onto a bed where they
remained, resting, for thirty minutes. During all experimental conditions, measures of heart rate (BPM),
core temperature (°C), RPE (6-20), thermal comfort (0-10) and gastrointestinal symptoms (Likert scale
1-10) were recorded every three minutes.
During the WARM and HOT conditions, participants received tap water at approximately 37°C, at a
rate of 250 mL every fifteen minutes. We provided water to prevent the possibility of augmented tight-
junction permeability due to dehydration (Lambert et al., 2008). The temperature of the water was
selected to represent typical core temperature, and prevent any attenuation of thermal strain or intestinal
injury which may occur with water of a lower temperature (Snipe and Costa, 2018b). During the CON
trial, participants were provided with tap water set at room temperature and instructed to drink ad
libitum.
6.3.5 Sugar probe administration
During each experimental visit, participants ingested a solution containing 10 g of lactulose and 2 g of
L-rhamnose in 230 mL tap water, at 15 minutes prior to be submerged in the bath or rest.
6.3.6 Thermal comfort, HR, RPE, and core temperature
Core temperature (Tcore), heart rate (HR), RPE, thermal comfort (TC) were measured as described in
the General Methods, and recorded every three minutes.
6.3.7 Gastrointestinal symptoms
Symptoms of gastrointestinal discomfort were collected in line with the timing of blood-sample
collection and every three minutes during the experimental trials. Data was collected as described in
3.6.3.

92
6.3.8 Blood analysis
Blood samples were collected fifteen minutes before (Pre), within three minutes post-PHS (Post) and
120 minutes post-ingestion (120) of the dual sugar probe solution. Samples were collected and
analysed for L/R as per section 3.7. Blood sample analysis samples were prepared according to the
methods outlined in the General Methods section.
Figure 16: Schematic representation of the hot-water immersion protocol.
6.3.9 Statistical analysis
Data was analysed with the use of the statistical software package SPSS (Version 26, SPSS Inc.,
Armonk, NY: IBM Corp), with significance accepted at p ≤ 0.05. Values found to be equal to P=0.000
were adjusted to P<0.001. Where appropriate, ninety-five percent confidence intervals (95% CIs) are
presented. Changes between variables throughout conditions (CON, WARM, HOT) were tested using
a repeated measures ANOVA. To correct violations of sphericity, the degrees of freedom were corrected
in a normal way, using Huynh-Feldt (ε >.75) or Greenhouse- Geisser (ε <.75) values for ε, as appropriate
(Field 2007).

93
6.4 Results
6.4.1 Physiological Responses
No change in body mass was observed in any condition (see Figure 17), with no significant main effect
for time (F1, 6 = 4.134, P = 0.88) or condition (F2, 12 = 0.181, P = 0.837). No significant interaction was
observed between conditions (F2, 12 = 1.138, P = 0.353). There was an observed increase in HR in
response to heat stress, with a significant main effect for time (F1, 5 = 14.329, P =0.013). A similar
increase in HR occurred between WARM and HOT conditions. A significant main effect was observed
for condition (F2, 10 = 4.618, P = 0.042). There was also a significant interaction observed (F2, 10 = 9.380,
P = 0.005). RPE increased between pre- and post-exposure in the WARM and HOT conditions, with a
significant main effect observed for condition (F2, 12 = 4.263, P = 0.04) and time (F1, 6 = 6.280, P = 0.05).
A significant interaction was also observed (F1.80, 12 = 4.263, P = 0.04). TC increased between pre- and
post-exposure in the WARM and HOT conditions; significant main effect was observed for condition
(F2, 10 = 11.023, P = 0.003) and time (F1, 5 = 14.412, P = 0.013), however no significant interaction was
observed (F1.76, 8.80 = 3.824, P = 0.068) (Table 15).
Table 15: Peak physiological values: heart rate (b·min-1); thermal comfort (AU); core temperature
(°C); blood pressure (mmHg); and RPE (AU). Data are mean ± SD.
CON WARM HOT Main Effect Significance
HR (b·min-1) 58 + 5 89 + 15 96 + 24 F1.87, 9.33= 4.618 P = 0.042
TC (AU) 5 + 1 7 + 2 8 + 2 F2,10 = 11.023 P = 0.003
Tcore (°C) 36.50 + 0.23 38.15 + 0.20 39.20 + 0.10 F1.78, 12.4= 136.648 P = 0.001
Systolic Blood
Pressure (mmHg) 131 + 6 132 + 8 131 + 9 F1.58, 7.91= 0.254 P = 0.732
Diastolic Blood
Pressure (mmHg) 75 + 4 65 + 4 64 + 9 F1.87, 7.49= 8.432 P = 0.013
RPE 6 + 0 8 + 4 12 + 6 F2, 12 = 4.263 P = 0.04

94
PRE POST
65
70
75
80
Body Mass
Bo
dyy M
ass (
kg)
CONTROL
WARM
HOT
Figure 17: Changes in body mass (kg) between pre- and post-hot water immersion for control
(CON), warm (WARM) and hot (HOT) conditions.
6.4.2 Core Temperature
There was an observed increase in core temperature in response to heat stress (Figure 18), with a
significant main effect for time (F1, 7 = 373.998, P < 0.001). Mean water temperature was 40 + 0.3°C
across all bath conditions. Core temperature increased to the greatest degree in the HOT condition (39.2
+ 0.2°C), compared to the WARM condition (38.1 + 0.2°C). There was a significant main effect
observed for condition (F2, 14 = 136.648, P = <0.001) and a significant interaction was observed (F2, 14
= 180.222, P = <0.001). In the WARM condition, participants’ core temperature was elevated above
38°C for 33 + 6 minutes. In the HOT condition, participants’ core temperature was elevated above 39°C
for 24 + 8 minutes (Figure 18 (B)).
95
A
B
Figure 18: (A) Change in core temperature between pre- and post-hot water immersion for all
conditions; (B) showing the core temperature response of participants during hot-water immersion.
** representing a significant effect between time-points
0 20 40 60 80
35
36
37
38
39
40
TIME
Co
re T
em
pera
ture
(°C
)
CONTROL WARM HOT**
96
6.4.3 Small Intestinal Permeability
An increase in intestinal permeability was observed in all conditions, indicated by the ratio of lactulose
to rhamnose in the serum. There was a significant effect of time on permeability (F 1, 7 = 22.286, P =
0.002). There was no significant difference between the mean L/R ratios for all conditions (F2, 14= 0.132,
P = 0.0878). There was also no significant interaction (F 1, 56, 10.89= 2.234, P = 0.159). There was no
significant main effect between conditions (P = 0.566). The WARM condition resulted in the highest
observed permeability (0.018 + 0.006). Interestingly, CON displayed a higher L/R ratio (0.017 + 0.004)
than HOT (0.015 + 0.007). There was no correlation observed between small intestinal permeability
and core temperature (r = 0.019, P = 0.517).
Table 16: Showing the L/R ratio at PRE and POST HWI, and two hours post sugar-probe ingestion
(120). nd represents values below the detection limit of the assay.
PRE
CON WARM HOT Main Effect Significance
L/R ratio (AU) nd nd nd
POST
CON WARM HOT Main Effect Significance
L/R ratio (AU) 0.012 + 0.005 0.012 + 0.004 0.013 + 0.007 F2,14= 0.144 P = 0.867
120
CON WARM HOT Main Effect Significance
L/R ratio (AU) 0.017 + 0.004 0.018 + 0.006 0.015 + 0.007 F2,14 = 1.083 P = 0.365
6.4.4. Gastrointestinal symptoms
Symptoms of regurgitation, stomach fullness, cramps, flatulence or urge to defecate were non-existent
to mild (< 2). Peak values for symptoms were higher in the HOT condition than WARM. In the WARM
trial, there were no reported symptoms other than nausea. In the HOT trial, one participant reported a
peak of 2 for regurgitation. Three participants reported symptoms of fullness, with peaks of 7, 3 and 4,
respectively. One participant reported a peak of 2 for cramps, two participants reported a peak of 2 for
flatulence. No participants reported the urge to defecate. No GI symptoms were reported in the CON
trial.
In the WARM trial, nausea accounted for the highest occurring symptom, with three participants
reporting peak values of 6, 8, and 1, respectively. However, a strong correlation over time was observed
between core temperature and nausea (r = 0.856). During the HOT trial, participants reported symptoms

97
of nausea and stomach fullness. Four participants reported symptoms of nausea, with peak values of
10, 8, 6 and 10, respectively. A strong correlation over time between core temperature and nausea was
observed in the HOT condition (r = 0.856). Of the eight participants, four reported symptoms of nausea,
two of which reported a peak score of ten. Three participants reported symptoms of stomach fullness,
with peak scores of seven, three and four, respectively.
6.5 Discussion
The aim of the current study was to quantify the intestinal permeability responses and symptoms to
non-exercise induced (passive) hyperthermia in a healthy, active population. Whilst variations in
gastrointestinal permeability were observed, as indicated by a change in L/R ratio in the serum, we
report no difference between conditions. Furthermore, a weak correlation between core temperature and
gastrointestinal permeability is reported. Collectively, passive heat stress did not induce lower
gastrointestinal symptoms. However, when taken individually, a strong correlation was observed
between core temperature and nausea.
Exercise results in a multitude of physiological responses that can contribute to GI dysfunction,
including a rise in core temperature (Gleeson, 1998) and a reduction in mesenteric blood flow (Rehrer
et al., 2001). However, the magnitude of contribution from these physiological responses towards
augmented intestinal permeability is not fully understood. A systematic review (Pires et al., 2017)
identified a strong correlation between increased core temperature and GI permeability. In their review,
these researchers proposed two key thresholds of exercise-induced core temperature: 38.5°C (threshold
1), whereby intestinal permeability is augmented in some participants, and 39°C (threshold 2), where
increased intestinal permeability is universal amongst participants. Similarly, in their landmark study,
Pals et al. (1997) reported a stepwise positive correlation between core temperature and GI permeability.
These authors reported elevated GI permeability in participants after running at 80% of V̇O2 peak for
sixty minutes, which also resulted in the highest final rectal temperature (39.6°C).
At two hours post ingestion of the dual-sugar probe solution, a serum L/R ratio of 0.015 was
observed in the HOT condition. This ratio was lower than that observed in the WARM condition
(0.018). Interestingly, the L/R ratio in our CON trial returned a higher value (0.016) than WARM,
although the value equalled only 0.001 (AU). These values represent increases between post-HWI and
120 in the L/R of 0.004, 0.006 and 0.002 for the CON, WARM and HOT trials respectively. According
to the hypothesis proposed by Pires et al. (2017), the highest L/R ratio should have been observed in
the HOT condition, followed by the WARM condition. The changes in the L/R ratio may thus present
the ‘normal’ transport of the sugar probes across the intestinal barrier, not necessarily an increase in
intestinal permeability. The results therefore suggest that passive hyperthermia has no effect on the
transport of the sugar probes when compared to a thermoneutral control condition. An alternative
explanation behind these results may be that the two-hour plasma assay may not be sensitive enough to

98
detect a meaningful change or difference in the L/R ratio between time-points. Given the large variation
in methodology within intestinal permeability research (Table 3), comparisons between the change in
L/R values from the present study and previous literature are challenging. It is therefore difficult to
conclude whether these value changes, between sample points, have physiological significance. For
example, previous research has observed similar resting L/R ratios to those of the present study, yet
these were obtained from urinary measures whilst using a different composition of test solution (van
Nieuwenhoven, Brouns and Brummer, 2004; van Wijck et al., 2011a). Another study (Pugh et al.,
2017b) observed a mean resting serum L/R ratio of 0.031, almost two-fold of that observed in the
current study, with a wider range in their L/R ratio ( + 0.016). L/R ratio was found to increase following
high-intensity intermittent exercise (0.051 + 0.016). Whilst these studies observed an increase in L/R
ratio following exercise, they failed to record core temperature, making comparisons between the
present study and the thresholds proposed by Pires et al. (2017) difficult. Collectively however, it can
be assumed that resting L/R values can differ significantly between individuals, and no data is currently
available to compare the changes in L/R ratio across time amongst resting participants. Furthermore, it
is unclear how the rapid turnover rate of the GI enterocytes, approximately 72 hours (Darwich et al.,
2014), affects an individual’s intestinal permeability reproducibility.
Mesenteric blood flow decreases during exercise (Rehrer et al., 2001) which can lead to a
decreased supply of oxygen to the gastrointestinal organs (Otte et al., 2001). Short periods of
hypoperfusion and ischemia can cause erosion of the epithelial lining at the tips of the villi (Grootjans
et al., 2016). However, before the epithelial cells shed, a zipper-like mechanism acts to pull the lower
epithelial cells together, creating a new barrier and preventing the translocation of endotoxins into the
portal blood. Under periods of prolonged ischemia with complete cessation of blood flow of
approximately forty-five minutes or more, the zipper-like mechanism becomes dysfunctional; the
restorative mechanisms of the membrane fail, leading to a compromised physical barrier through
disruption of the epithelial lining and tight-junction protein complexes (Grootjans et al., 2016).
Specifically, cytoskeletal structure within the enterocyte may be altered, which begins a cascade of
disturbances to the transmembrane proteins, ultimately decreasing their resistance and increasing
paracellular permeability(Rodgers and Fanning, 2011). Given that the present author and other
researchers (Pals et al., 1997) have observed increased intestinal permeability in response to sixty
minutes of exercise, it could be hypothesised that sufficient hypoperfusion occurred to induce
dysfunction in the tight-junction protein complexes. However, these exercise studies also observed a
rise in core temperature, making it difficult to conclude the relative contribution of increased core
temperature or intestinal hypoperfusion to increased intestinal permeability.
The present study utilised sixty minutes of hot-water immersion to elevate core temperature
above the thresholds proposed by Pires et al. (2017). However, it was not viable to measure mesenteric
blood flow due to logistical restrictions related to the participants being submerged in a hot water bath
via the only available method of simultaneous Doppler ultrasound of the femoral and mesenteric
99
arteries. Heat exposure induces cutaneous vasodilation and skin blood flow to promote heat dissipation
away from the core to the environment. To facilitate this process, cardiac output is increased and blood
is redirected from areas such as the splanchnic region (Charkoudian, 2003). Indeed, substantial inter-
individual differences exist in the response of skin blood flow to heat due to factors such as heat
acclimation or training status (Roberts et al., 1977). Again, due to logistical limitations of participants
being submerged in water, measurement of skin blood flow was not viable in the present study. Blood
pressure was however recorded every fifteen minutes yet showed no change over time (P = 0.595).
Which would be indicative of an adaptive cardiovascular response to maintain blood pressure (Crandall
and Wilson 2015), that could bring about reductions in splanchnic blood flow which has previously
been shown to be reduced by 40% in response to passive hyperthermia in rats (Hall et al., 2001b). In
humans, reductions of ~20-40% splanchnic blood flow have been observed in response to passive heat
stress (Rowell et al., 1970; Rowell, 1974). This wide range in splanchnic blood flow response reflects
high intra-and inter individual differences to comparable levels of heat exposure (Crandall and Wilson
et al., 2015). However, these values are still considerably below the 80% reductions achieved in during
high intensity exercise (Rehrer et al., 2001). Unfortunately it cannot be demonstrated that a reduction
in mesenteric blood flow occurred in the participants of the present study; such data would have helped
inform the contribution of hypoperfusion to the augmented intestinal permeability observed in the
present study. However, the values and changes in L/R ratio between sample time points in the present
study are minor compared to those of previous research (Table 3). Together, these results may suggest
that hypoperfusion, rather than hyperthermia, may elicit greater increases in intestinal permeability in
exercise-related studies in healthy athletes.
Whilst prolonged periods of mesenteric ischemia (over forty-five minutes) may cause
disruption to the epithelial barrier (Grootjans et al., 2010b; Grootjans et al., 2016), research has not
investigated whether similar periods of hyperthermia alone (i.e., not induced by exercise), result in a
similar response. Dokladny, Moseley and Ma (2006) exposed Caco-2 intestinal epithelial cells to
temperatures of 37 and 41ºC over a twenty-four hour period. They observed a dose-response effect of
temperature on tight-junction permeability, with the higher temperature resulting in increased
permeability (Zuhl et al., 2014a). However, it is not clear whether this response would have occurred
either at temperatures similar to those achieved in the present study, or with shorter exposures to
hyperthermia. Nevertheless, considering the mean exposure of the participants of the present study to
the higher core temperature threshold of 39°C was only 24 + 8 minutes, this may not have been
sufficient for a distinct rise in intestinal permeability to occur. The exposure times of the present were
limited due to ethical limitations.
The appearance of GI symptoms during exercise is common amongst athletes (de Oliveira,
Burini and Jeukendrup, 2014). However, the literature is inconclusive as to the dominant factor
underlying the appearance of symptoms, indeed, it is likely due to a combination of factors including
environment, psychological stress or nutrition (Lis et al., 2016; Wilson, 2017; Snipe et al., 2018a).

100
Nausea is a common symptom of heat illness (Coris, Ramirez and Van Durme, 2004) and whilst it has
been correlated to exercise intensity (Keeffe et al., 1984), this is the first study to quantify a correlation
between core temperature and nausea. Prevalent amongst athletes and a leading cause for non-
completion of events, nausea induces a feeling of light headedness, with a feeling of sickness and urge
to vomit (Wilson, 2019). In the present study, the prevalence of GI symptoms was low, however, nausea
was common and correlated strongly with core temperature. Indeed, higher core temperatures have also
been associated with increased exercise intensity (Pals et al., 1997), further suggesting an association
between core temperature and nausea.
It has been previously demonstrated that dehydration of approximately 1.5 % of body mass can
increase GI permeability without any difference in final core temperature (Lambert et al., 2008);
suggesting dehydration per se may contribute to an increase in GI permeability. In the present study,
participants were permitted to drink water ad-libitum (CON) or at a rate of 250 mL, every fifteen
minutes (WARM and HOT). In the WARM and HOT condition, participants were provided with water
heated to approximately 37°C to replicate normal core temperature and prevent any dampening in core
temperature increase (Snipe and Costa, 2018b). We observed no difference between pre- and post-
weight in any condition, suggesting that euhydration was maintained, and that dehydration did not
contribute to the differences observed in gastrointestinal permeability.
Considering a similar response was observed across all conditions, it is difficult to delineate the
relative contribution of factors that contributed to the rise in intestinal permeability. Using hot water
immersion, an increase in core temperature above those proposed by Pires et al. (2017) was achieved
in the present study, yet it was observed that no significant difference between conditions occurred,
including CON. Therefore, no significant correlation between the elevation in core temperature and
intestinal permeability is evident. Indeed, more research is required to quantify variations in resting
levels of intestinal permeability and its reproducibility in a large cohort of participants. Further, passive
heating and GI permeability with mesenteric blood flow determined simultaneously will allow further
delineation of the relationship between whole body hyperthermia and GI permeability.

101
Chapter 7 – Effects of Glutamine
Supplementation on Gastrointestinal
Permeability, Injury and Symptoms in
Response to Heat-Stress
Chapter 6 demonstrated that hyperthermia without exercise-induced hypoperfusion may not
elevate intestinal permeability. However, the response in intestinal injury to passive heat stress
remains unknown. Furthermore, acute glutamine supplementation has demonstrated protective
effects on core temperature and intestinal damage, but these effects remain unexplored in
response to passive heat stress.
7.1 Abstract
Aim: Investigate the effects of acute glutamine supplementation on markers of gastrointestinal
permeability, injury and subjective measures of heat illness in response to heat stress. Methods: Six
healthy, recreationally active males [age 23 + 4 yrs., body mass 69.9 + 4.0 kg , V̇O2 max 64.3 +
5.9mL·kg-1·min-1] volunteered to participate in the study. In a randomised, placebo-controlled cross-
over design, each participant completed two experimental trials. Participants received either glutamine
(0.5g·kg-1 BM) or placebo, two hours prior to exposure to heat stress by hot-water immersion at 40°C.
Each experimental trial consisted of sixty minutes of heat exposure. Markers of GI permeability and
injury were quantified by serum L/R ration and I-FABP, respectively. Subjective measures of heat
illness were quantified by questionnaire throughout each experimental trial. Results: L/R ratio did not
differ between glutamine or placebo trials (0.029 ± 0.011; and 0.025 ± 0.009). Heat stress resulted in a
significant increase in GI damage, however no significant difference was observed between trials.
Similarly, heat illness resulted in an increase in subjective symptoms, with no difference between trials.
Conclusion: Passive hyperthermia, induced by hot-water immersion, results in an increase in
gastrointestinal injury and subjective symptoms of heat illness, with no effect from glutamine
consumption. Passive hyperthermia independent of exercise induced hypoperfusion does not induce
increased gastrointestinal permeability.
7.2 Introduction
Heat-related pathology poses a serious threat to the health of athletes and certain workers who are
required to wear protective clothing such as the military or firefighters (Coris, Ramirez and Van Durme,
2004; McLellan, Boscarino and Duncan, 2013). Summer heat waves have accounted for approximately
200 deaths per year in the United States (Leon and Helwig, 2010). Certain factors such as obesity, poor

102
fitness, dehydration, common medications such as antihistamines and widely used stimulants like
caffeine, put people at a higher risk of developing heat-illness (Coris, Ramirez and Van Durme, 2004).
With global ambient surface temperatures predicted to increase, along with more frequent and intense
extreme weather events, heat-illness also poses a future risk to athletes and certain workers (Lucas,
Epstein and Kjellstrom, 2014).
Heat illness is a pathological condition which can develop following elevation of core
temperature above normal physiological range in response to certain stimuli such as high environmental
temperatures or exertion from exercise (Ogden et al., 2020). Heat can disturb many intracellular
molecular structures and proteins, and ameliorate protein, DNA and RNA synthesis. Furthermore, heat
stress can induce oxidative stress and reactive oxygen species production (Rhoads et al., 2013). These
disturbances are similar to those observed in the gut following hypoperfusion/ reperfusion, which sees
excess production of reactive oxygen species (Granger and Kvietys, 2015).
Those experiencing heat illness can display symptoms, some of which can be displayed by
athletes during training or competition, such as nausea, syncope, muscle cramps and confusion; indeed,
nausea has been attributed as the leading cause of drop-outs from endurance events (Barrow and Clark,
1998; de Oliveira, Burini and Jeukendrup, 2014; Wilson, 2019). If left untreated, heat-illness can
develop into heat-stroke, a serious pathological condition which can result in organ failure and death.
Furthermore, heat stroke patients are often left with permanent impairments to neurological and
peripheral tissue systems (Leon and Helwig, 2010).
Considering the potential implications of heat-illness on the health and performance of athletes
and the wider population, nutritional interventions to ameliorate the progression of heat-illness has
received some attention from researchers. Strategies such as ice-slurry ingestion have been shown lower
core temperature and increase performance in runners and cyclists (Siegel et al., 2010; Burdon et al.,
2013). Another nutritional strategy that has been explored in the literature as a way to offset heat
disturbance and intestinal injury is the ingestion of the amino acid glutamine (Mondello et al., 2010;
Soares et al., 2014). Glutamine is the most abundant amino acid within the human body and serves as
the primary fuel source for the enterocytes of the intestinal tract, however plasma glutamine
concentrations are reduced under conditions of exercise, shock or trauma (Rao and Samak, 2012).
Supplementation with glutamine has been shown to reduce intestinal permeability in response to
exercise in thermoneutral conditions and the heat (Zuhl et al., 2014b; Zuhl et al., 2015; Pugh et al.,
2017c). Research from rodent studies also demonstrates that glutamine supplementation can protect the
cells of the intestinal tract from reperfusion injury by offsetting oxidative stress, increase epithelial cell
proliferation, as well as increasing villus height (Mondello et al., 2010; Wu et al., 2018). Furthermore,
one rodent study demonstrated glutamine supplementation to attenuate a rise in core temperature
following acute heat exposure (Soares et al., 2014), however, this effect has not been demonstrated in
exercising humans (Pugh et al., 2017c).

103
One consequence of exercise is a reduction in intestinal blood flow as blood is redirected away
from the gut towards the periphery to promote thermoregulation and nutrient delivery (Rehrer et al.,
2001). Hypoperfusion of the intestinal tract is thought to be a primary cause of the augmented intestinal
permeability and injury observed during exercise (Costa et al., 2017b), with heat being hypothesised as
another major contributor (Pires et al., 2017). The gold standard for quantifying intestinal permeability
is through the use of sugar absorption test, with subsequent analysis of urine or serum to measure the
ratio of the reappearance of the probes (Fleming et al., 1996; van Wijck et al., 2011b). I-FABP, an
intracellular protein expressed exclusively in the apical epithelial cells of the small and large intestine,
has more recently received attention as a marker of intestinal injury. Briefly, following injury to the
mucosal layer of the small intestine, the apical cells of the villus are shed and I-FABP is released into
circulation, permitting the detection of the protein in the serum (Lau et al., 2016). Since the half-life of
I-FABP is approximately 11 minutes, its detection in the serum is considered a marker of preceding
acute intestinal injury (Guzel et al., 2014). Indeed, I-FABP concentrations have been shown to be
elevated following exercise in the heat, but this elevation was prevented with acute glutamine
supplementation (Pugh et al., 2017c).
However, research is currently lacking distinguishing the effects of hypoperfusion or
hyperthermia alone on intestinal permeability and, or injury, in healthy participants. Core temperature
can be increased through exertional or passive heat stress, through methods such as exercise and, or,
increasing environmental temperatures (Miwa et al., 1994; Dokladny, Moseley and Ma, 2006; Tyler et
al., 2016; Sheahen et al., 2018; Snipe et al., 2018a). Physiologically relevant elevations in temperature,
induced by passive hyperthermia, have previously been shown to augment permeability in vitro, in
caco-2 cell lines (Dokladny, Moseley and Ma, 2006) and rodents (Wu et al., 2018), by disrupting the
integrity of the tight-junction proteins. However, passive hyperthermia without exercise has not yet
been shown to increase intestinal permeability in humans. As such, the present study addressed the
following aims: to investigate the effects of passive heat stress on intestinal permeability and injury as
expressed by the presence of I-FABP, and furthermore, investigate the effects of acute glutamine
supplementation on these responses. Given the association between heat-illness symptoms, particularly
nausea, and the effects of these symptoms on athletic performance, a further aim of the present study
was to quantify the response of heat-illness symptoms to passive hyperthermia, and whether glutamine
supplementation demonstrated an effect on these symptoms.
7.3 Methods
7.3.1 Participants
Six healthy, recreationally active males [age 23 + 4 years, body mass 69.9 + 4.0 years, V̇O2 max.64.3 +
5.9 mL·kg-1·min-1] volunteered to participate in the study. Participant requirements included that they

104
were male, training three or more hours per week of endurance-type exercise, not taking medication
(NSAIDs, diuretics) free from gastrointestinal syndrome and willing to abide by the restrictions
implemented by the study (24h fast rest prior to each trial, overnight fast, no caffeine or alcohol in the
24 hours prior to each trial.)
7.3.2 Assessment of maximal oxygen uptake
During the first visit, V̇O2 max was determined as per section General Methods 3.4.1.
7.3.3 Experimental Design
In a double blind, placebo controlled randomised crossover design; each participant completed a
baseline assessment of maximal oxygen uptake and familiarisation, and a total of two experimental
trials. In both trials, participants were required to remain submerged in a thermostatically controlled
bath, set to 40°C, to the sternal notch, for 60 minutes. Participants received either a placebo or
glutamine bolus to ingest at a dose of 0.5g·kg body mass. A dose of 0.5g·kg body mass was chosen to
both align with previous research from our group (Pugh et al., 2017c), but also due to ethical restrictions
imposed by the University ethics committee. Trials were separated by a one-week washout period to
minimise any effects of supplementation or heat adaption.
Participants were asked to complete a 24 h food diary prior to the first experimental trial and
asked to repeat this diet ahead of the second trial. Participants arrived at the laboratory between 07:00
and 9:00 h following an overnight fast. Upon arrival at the laboratory and two-hours prior to hot water
immersion (HWI), a baseline blood sample was taken. Participants were then provided with an opaque
bottle containing 400mL of tap water, mixed with either 100mL sugar-free lemon cordial (placebo) or
cordial plus glutamine, and asked to consume the solution within five to ten minutes. Participants then
sat, resting for two hours, before inserting a rectal thermometer 10 cm past the anal sphincter, which
was connected to a portable data logger (SQ210, Grant Instruments, UK) and providing a urine sample.
Participants were also fitted with a heart rate monitor strap, followed by another blood sample, before
ingesting of the dual-sugar probe solution, which contained 10 g of lactulose and 5 g L-rhamnose.
Participants completed an adapted State-Trait Anxiety Inventory questionnaire (State-Trait Anxiety
Inventory, 2014)
Participants were then lowered into the bath whilst sat in a safety harness, and remained
submerged for sixty minutes. Measures of thermal comfort (TC), RPE, core temperature and heat
illness symptoms were collected every three minutes. After sixty minutes, the participants were lifted
out of the bath before being transferred to a bed where they rested in a supine position.

105
7.3.4 Sugar probe administration
During each experimental visit, participants ingested a solution containing 10 g of lactulose and 2 g of
L-rhamnose in 230 mL tap water, at 15 minutes prior to be submerged in the bath or rest.
7.3.5 Thermal comfort, HR, RPE, and core temperature
Core temperature (Tcore), heart rate (HR), RPE, thermal comfort (TC) were measured as described in
the General Methods, and recorded every three minutes.
7.3.6 Symptoms of heat-illness and GI discomfort
Symptoms of heat-illness were collected every three minutes during the experimental trials utilising
an adapted State-Trait Anxiety Inventory questionnaire Data was collected as described in 3.6.3.
7.3.7 Blood Collection
Blood samples were collected at baseline, immediately prior to the ingestion of the sugar-probe
solution (0), immediately post hot water immersion (60), and two hours post-ingestion of the dual
sugar probe solution (120). Blood was collected as previously explained in the General Methods
section. Following the final sample collection all samples were prepared according to the methods
outlined in the general methods section.
7.3.8 Assessment of plasma glutamine
Plasma glutamine was assessed using a quantitative colorimetric enzyme assay kit (EGLN-100,
BioAssay Systems, Hayward, CA) sensitive to 0.023 mM glutamine according to manufacturer’s
instructions. Samples were diluted 1:2 with distilled water. Glutamate was measured in each sample
and subtracted from the glutamine absorbance of the respective sample.
7.3.9 Assessment of I-FABP
I-FABP was determined by analysis of EDTA plasma samples by an enzyme-linked immunosorbent
assay (ELISA) (Hycult Biotechnology, Uden, the Netherlands; detection window 47 – 3000 pg·mL-1)
according to the manufacturer’s instructions. The ELISA is a solid-phase enzyme-linked
immunosorbent assay based on the sandwich principle. Samples were diluted 1:2 with a provided
sample dilution buffer and plates were read at 450 nm. The coefficient of variation was 8% for between-

106
sample duplicates. I-FABP concentrations were analysed from samples taken pre- and immediately
post- heat stress. Post heat stress values were corrected for adjustments to plasma volume.
Figure 19: Schematic representation of the experimental procedure.
7.3.10 Statistical analysis
Data was analysed with the use of the statistical software package SPSS (Version 26, SPSS Inc.,
Armonk, NY: IBM Corp), with significance accepted at p ≤ 0.05. Values found to be equal to P=0.000
were adjusted to P<0.001. Where appropriate, ninety-five percent confidence intervals (95% CIs) are
presented. Changes between variables throughout conditions (PLA, GLU) were tested using a repeated
measures ANOVA. To correct violations of sphericity, the degrees of freedom were corrected in a
normal way, using Huynh-Feldt (ε >.75) or Greenhouse- Geisser (ε <.75) values for ε, as appropriate
(Field 2007). A Bonferroni pairwise comparison was made when main effects were present.
7.4 Results
7.4.1 Glutamine supplementation did not affect the physiological response to passive heat stress
Total hot-water immersion time during the glutamine and placebo trials was 48.0 ± 10.4 and 51.5 ± 9.0
min, respectively. A similar but non-significant increase in HR was observed between conditions (P=
0.668). No difference was observed between conditions for thermal comfort (P= 0.363), peak core
temperature (P= 0.885), RPE (P= 0.363) or blood pressure (Table 17)

107
Table 17: Peak physiological values: heart rate (b·min-1); thermal comfort (AU); core temperature
(°C); blood pressure (mmHg); RPE (AU); Data are mean ± SD.
Placebo Glutamine Significance
HR (b·min-1) 116 ± 20 114 ± 11 0.668
Thermal comfort (AU) 8.83 ± 0.41 8.67 ± 0.52 0.363
Core temperature (°C) 39.19 ± 0.12 39.27 ± 0.13 0.855
Systolic Blood Pressure
(mmHg) 139.7 ± 12.7 133.67 ± 9.07 0.235
Diastolic Blood Pressure
(mmHg) 63 ± 8.41 63 ± 5.8 1
RPE 14.67 ± 6.74 14.5 ± 6.66 0.363
7.4.2 Glutamine supplementation did not affect the thermoregulatory response to passive heat
stress
There was an observed increase in core temperature in response to HWI, with a significant main effect
for time (F1, 5 = 283.051, P < 0.001). Core temperature increase across both conditions was similar.
There was no significant main effect observed for condition (F1, 5 = 0.229, P = 0.652). No significant
interaction was observed between conditions (F1, 5 = 1.848, P = 0.232). There were no differences in
peak core temperature between conditions. GLU peak Tcore was 39.27 (34.46 - 39.34) °C, whilst PLA
peak Tcore was 39.19 (36.5-39.35) °C.
7.4.3 Gastrointestinal permeability and injury
There was no significant difference in post-HWI ratios of L/R in the GLU and PLA condition (Table
18). HWI resulted in increased IFABP concentrations across both conditions. Baseline values of IFABP
were similar in both conditions, however, there was a significant effect of time on serum IFABP
concentrations (P = 0.002). There was a larger, non-significant increase in IFABP following glutamine
supplementation compared to placebo (Table 17) There was no significant interaction observed (P =
0.234). Similarly, no significant main effect was observed for condition (P = 0.312).

108
Table 18: Post-HWI values for L/R ratio (AU) and I-FABP (pg·mL-1). Data are mean ± SD. nd
represents values below the detection limit of the assay.
Figure 20: Individual 2-hour L/R ratio between the glutamine (GLU) and placebo (PLA)
conditions.
Figure 21: Individual post-HWI I-FABP between the glutamine (GLU) and placebo (PLA)
conditions.
PLA GLU Significance
PRE POST PRE POST
I-FABP
(pg·mL-1) 515.9 + 208.1 1123.0 + 61.7 511.3 + 277.5 1554.0 + 588.3 P= 0.002
L/R (AU) nd 0.029 + 0.011 nd 0.025 + 0.009 P= 0.503

109
7.4.4 Glutamine supplementation augments plasma glutamine concentrations
There was no difference observed in plasma glutamine concentrations at baseline or post-HWI in either
condition (0.84 ± 0.31 vs. 0.94 ± 0.47 mM in glutamine and placebo conditions, respectively; P =
0.310). Plasma glutamine concentrations were significantly elevated between baseline and pre- hot
water immersion in the GLU condition (1.77 ± 0.66 mM) (P = 0.009). When compared to placebo, pre-
HWI plasma glutamine concentrations were significantly higher in the GLU condition (0.87 ± 0.36
mM) (p = 0.007). Plasma glutamine concentrations decreased during HWI, and there was no significant
difference in post-HWI plasma glutamine concentrations between conditions.
Figure 22: Change in plasma glutamine values between baseline (BA), pre-HWI (PRE) and post-
HWI (POST), for the glutamine (GLU) and placebo (PLA) conditions.
7.4.5 GI symptoms were not affected by glutamine supplementation
Participants reported mild to severe occurrence of subjective heat illness symptoms. Only one
participant reported symptoms of ‘chills’ and ‘stopped sweating.’ Glutamine supplementation did not
affect the appearance of subjective symptoms in response to hot-water immersion when compared to
placebo. The highest reported symptom was ‘feeling lightheaded’, with feelings of ‘tiredness’,
‘dizziness’, ‘nausea’, and ‘heat sensation’ being augmented to a similar magnitude. Participants

110
reported a high occurrence of “thirst” to a similar extent in both conditions.
Table 19: Appearance of subjective heat-illness symptom during HWI.
Glutamine Placebo Wilcoxon sig. value
Tired 8.5 (0-10) 8.5 (0-10) 0.564
Swelling 7 (0-10) 5.5 (0-9) 0.102
Cramps 4 (0-10) 2.5 (0-8) 0.276
Nausea 8 (0-10) 8 (0-8) 0.109
Dizziness 8.5 (0-10) 8 (0-10) 0.180
Thirst 9 (0-10) 8.5 (0-9) 0.180
Vomiting 5.5 (0-7) 6 (0-8) 1
Confusion 6.5 (0-10) 5.5 (0-10) 0.276
Muscle weakness 7 (0-10) 6 (0-9) 0.336
Heat sensation 9 (0-10) 8.5 (0-10) 0.705
Chills 0 (0-0) 0 (0-4) 0.317
Stop sweating 0 (0-0) 0 (0-2) 0.317
Feeling lightheaded 9.5 (0-10) 8.5 (0-10) 0.102
*Data are median and range appearing in parenthesis
7.5 Discussion
The aim of the present study was to quantify the effects of acute glutamine supplementation (0.5 g.kg-
1 BM) versus a placebo on intestinal permeability, injury and symptoms in response to passive
hyperthermia induced by hot water immersion in a healthy, active population. Heat stress increased
core temperature and markers of intestinal injury, however we observed no attenuating effect from
glutamine supplementation. Similarly, no difference was observed in intestinal permeability between
conditions, indicated by the ratio of lactulose to L-rhamnose in the serum. Furthermore, heat stress
resulted in a high occurrence of subjective symptoms of heat-illness, yet no attenuation effect was
observed from glutamine supplementation. Together, the results of the current study suggest that acute
glutamine supplementation does not prevent the appearance of gastrointestinal injury or symptoms of
heat illness in response to heat-stress. Furthermore, hyperthermia for the period of ~60 minutes, without
exercise mediated reductions in blood flow, may not be sufficient to induce an increase in
gastrointestinal permeability.
Fatty acid-binding proteins (FABP) are cytosolic proteins with a low molecular weight (atomic
mass of 14-15 kDa), expressed in abundance within tissues with a dynamic fatty acid metabolism, such

111
as the heart, liver and intestine (Pelsers, Hermens and Glatz, 2005). Cellular expression of FABP is
regulated at the transcriptional level, responsive to alterations in lipid metabolism. Whilst the primary
function of FABPs is to facilitate transport of intracellular long-chain fatty acids, secondary functions
include the regulation of gene expression through mediation of fatty acid signal translocation to
peroxisome proliferator activated receptors (PPARs) (Wolfrum et al., 2001; Pelsers, Hermens and
Glatz, 2005). FABPs are released into circulation in response to tissue injury and subsequently removed
from circulation primarily through renal clearance, facilitating the quantification of both urinary and
plasma concentrations of FABP. Approximately 30 % of FABP are removed in a single pass through
the kidneys, and the plasma half-life of FABP has been calculated at approximately 11 minutes (van de
Poll et al., 2007), suggesting FABP to be a useful indicator of acute tissue injury.
Despite three isoforms of FABP being expressed within the intestine (intestinal (I)-FABP, liver
(L)-IFABP and ileal-bile acid binding protein (I-BABP)) (Pelsers, Hermens and Glatz, 2005), I-FABP
has primarily been utilized as an indicator of intestinal injury. I-FABP is abundantly expressed within
the apical region of the villi, in the most mature enterocytes, with the highest tissue concentrations being
found within the jejunum, followed by the duodenum (4.79 µg·g-1 and 2.22 µg·g-1, respectively) (Pelsers
et al., 2003). These region are primarily affected in response to physiological stressors, which can lead
to intestinal injury and disruption of the epithelial lining (Barberio et al., 2015; Grootjans et al., 2016).
This disruption can subsequently lead to dysfunction of the tight-junction proteins located between the
enterocytes, allowing I-FABP to enter circulation via paracellular diffusion (Van Wijck et al., 2012b)
and be subsequently detected in the urine or plasma. Despite the half-life of I-FABP being only eleven
minutes, this protein has become a popular marker of enterocyte damage and intestinal injury in clinical
studies (Derikx et al., 2010; van Wijck et al., 2011a; Dokladny, Zuhl and Moseley, 2016; Pugh et al.,
2017b; Wells et al., 2017). The rapid clearance of I-FABP into the plasma or urine permits a quick
diagnosis of clinical intestinal pathology, since its appearance can occur before any visual indicators
(Khadaroo et al., 2014)
Circulating levels of I-FABP increase following exercise (van Wijck et al., 2011a; March et al.,
2017), trauma (Timmermans et al., 2015), and in cases of heat-stroke patients where core temperature
exceeds 40º C (Zhang et al., 2015). Research to measure intestinal permeability and injury on passively
heat-stressed humans is limited. Data regarding the intestinal responses to heat-stress has thus been
collated from clinical studies of heat-stroke patients, or exercise studies. As such, in the author’s best
knowledge, this is the first study to purposefully quantify I-FABP concentrations in response to passive
heat stress i.e., induced by hot-water immersion and not exercise with, or without, additional
environmental stress. Our resting I-FABP values were similar to those observed by other researchers
(van Wijck et al., 2011a; Pugh et al., 2017b; Jonvik et al., 2018), however we report higher post-test
values. Specifically, Pugh et al. (2017b) reported a 72 % increase in I-FABP from baseline in response
to treadmill running at 70% of maximal oxygen uptake in 30°C heat, whilst van Wijck et al. (2011a)
report a 99 % increase in response to 60 minutes of cycling at 70% maximum workload capacity.

112
In the present study an increase of 204 and 118 % in I-FABP was observed during the glutamine
and placebo trials, respectively. Aside from hyperthermia, the mechanisms underlying such a large
increase in I-FABP remain unclear. It has previously been suggested that hemodynamic parameters
such as low blood pressure (< 70mmHg) and haemoglobin levels (<80 % of the lower normal value
limit), in response to abdominal trauma may contribute to intestinal injury (Timmermans et al., 2015).
However, the present study reports no correlation between I-FABP and arterial blood pressure (r =
0.221), and a minor, negatively correlated relationship between Hb and I-FABP (r = -0.247). The results
of the present study therefore indicate, for the first time, that in-vivo heat stress alone may be sufficient
to elicit enterocyte intestinal injury. It should be remembered that in present study, along with the
majority of literature (van Wijck et al., 2011a; Van Wijck et al., 2012b; Barberio et al., 2015; Lis et al.,
2015; Karhu et al., 2017; March et al., 2017), single point measures of I-FABP have been utilised and
may fail to reflect the total injury load expressed; I-FABP has a relatively fast elimination profile. Future
research should consider reporting data as area under the curve, as originally proposed to estimate
release profiles (van Wijck et al. (2011a).
GI permeability has previously been increased in response to exercise (Costa et al., 2017b),
and in vitro by subjecting Caco-2 cell culture models to physiologically relevant increases in heat-stress
(Dokladny, Moseley and Ma, 2006; Davison et al., 2016). Since exercise results in an increase in core
temperature, it has been suggested that hyperthermia is a major contributing factor towards
compromised gastrointestinal integrity, potentially in a dose-dependent manor (Pires et al., 2017).
Following a twenty-four hour exposure to elevated temperatures (37 to 41°C), Caco-2 cells
demonstrated a linear inverse relationship between transepithelial resistance (TER) and paracellular
permeability (Dokladny, Moseley and Ma, 2006). Davison et al. (2016) similarly observed an increase
in permeability of HT29 and Caco02 cells in response to an increase in temperature of 2°C, from 37°C
to 39°C.
Similarly, core temperatures in excess of 39° C have also been correlated to augmented
intestinal permeability (Pires et al., 2017). In the present study, mean peak core temperature was 39.2
°C, with no difference between conditions (P= 0.855). These temperatures are similar to those seen in
participants exercising for sixty minutes during at 70% of V̇O2 max (Zuhl et al., 2015) where an increase
in intestinal permeability was observed. However, intestinal hypoperfusion, caused by the redistribution
of blood flow away from the gut during exercise, has also been considered a major contributor to the
underlying mechanisms augmenting intestinal permeability. Blood flow to the gut can be reduced by as
much as 40-50% within 20 minutes of the onset of exercise (Rehrer et al., 2001), therefore reducing the
amount of oxygen available for the perfusion of the intestinal organs. Unfortunately, one limitation of
the present study is that we were unable to measure mesenteric blood flow, thus the blood flow response
to passive heat stress cannot be determined in the present model. Despite this limitation, data again
indicates, that short term hyperthermia alone does not result in an increase in intestinal permeability in
passively heat-stressed humans. Together, these results indicate no attenuating effect on core

113
temperature by glutamine supplementation and that a combination of hyperthermia and intestinal
ischemia mediated via mesenteric hypoperfusion may be necessary to augment enterocyte permeability
in this population.
L-glutamine is the most abundant amino acid in human muscle and plasma, with normal plasma
ranges between normal range of plasma glutamine is 500- 750µmol/L. Maintenance of this range is
coordinated by the net balance between glutamine release and uptake, with the gut being responsible
for a high proportion of uptake (Felig and Wahren, 1971). Under conditions of catabolic stress, such as
infection, trauma, burns and prolonged exercise, the endogenous glutamine pool is depleted (Rao and
Samak, 2012; Timmermans et al., 2015). It has previously been suggested that a reduction in intestinal
glutamine is associated with an increase in intestinal permeability and that glutamine supplementation
can repair intestinal membrane integrity (Camilleri et al., 2012). Whilst glutamine supplementation has
ameliorated intestinal permeability and injury when compared to placebo (Hond et al., 1999; Pugh et
al., 2017c), the present study demonstrates no difference in GI permeability or injury between
conditions. Two-hour post HWI L/R ratio values were similar to those reported in resting conditions in
this thesis (Chapter 5) and previous studies (Pugh et al., 2017b), and also following 60 minutes of
treadmill running (Chapter 4). Furthermore, despite similar conditions, the values from the present
study are higher than those previously reported from passive heat stress by HWI (Chapter 6). A
limitation exists in the present study as L/R values are obtained from one time point, taken two hours
post-ingestion of the dual-sugar probe solution. As such, it cannot be concluded whether intestinal
permeability changed in these participants.
The occurrence of GI symptoms is common during exercise (de Oliveira, Burini and
Jeukendrup, 2014), with several contributing factors being proposed including heat-stress (Snipe et al.,
2017), intestinal ischemia (ter Steege et al., 2012) and psychological stress (Wilson, 2017). We have
previously demonstrated that exercise intensity could affect the appearance of GI symptoms in a
stepwise manner (see Chapter 3). Passive heat-stress did not increase the appearance of subjective GI
symptoms, yet our participants reported a high occurrence of nausea, a common symptom of heat-
illness (Howe and Boden, 2007). It was therefore decided, for the present study, to quantify the
appearance of heat-stress related symptoms, rather than gastrointestinal symptoms. It has previously
been shown that the appearance of GI symptoms does not correlate with intestinal injury or permeability
(Karhu et al., 2017; Pugh et al., 2017c). Whilst increased levels of endotoxin release cannot be ruled
out in the present study, in absence of augmented intestinal permeability, endotoxemia would have been
unlikely, which can cause similar subjective symptoms (Lambert, 2008); therefore, the appearance of
heat-stress symptoms would suggest alternative underlying mechanism.
In the present study, we observed a high incidence of subjective symptoms of heat illness, with
no effect from glutamine supplementation. The exact mechanisms underpinning the pathophysiology
of heat-illness symptoms are not clear, and are likely due to a combination of factors. Peripheral
vasodilation occurs during heat stress as a mechanism to dissipate heat, however, heat dissipation was

114
likely impaired by hot-water immersion, compromising the loss of heat via radiation into the external
environment. An increase in heart rate was observed, a mechanism utilized to maintain cardiac output
and prevent an attenuation in blood pressure (Costrini et al., 1979). This impairment in vascular control,
combined with the un-compensable nature of hot-water immersion likely caused heat load to exceed
heat dissipation capacity, leading to an accumulation of body heat. Together, these physiological
responses may have affected cerebral blood flow and increased the temperature of blood supply to the
brain. Subsequently, brain temperature (Romanovsky, 2007; Walter and Carraretto, 2016) may have
increased, leading to a cascade of physiological mechanisms, including syncope (Seto, Way and
O'Connor, 2005), which have been associated with the appearance of symptoms of heat exhaustion,
including nausea, lightheadedness and confusion (Aggarwal et al., 2008; Cheshire, 2016; Walter and
Carraretto, 2016).
During short periods (30 – 45 minutes) of intestinal hypoperfusion, the upper and more mature
epithelial cells found at the villus tips, whereby I-FABP is exclusively expressed, become
compromised. This results in a retraction of the basal membrane, creating a sub-epithelial space.
Subsequently, the less mature enterocytes are pulled together by the contraction of the basal membrane,
forming a new villus tip, and the upper damaged cells detach, shedding into the intestinal lumen,
increasing circulating levels of I-FABP (Grootjans et al., 2016). As such, the epithelial lining is quickly
restored, with the paracellular tight junctions thus maintaining a barrier to the translocation of luminal
microbiota or larger particles such as lactulose (Derikx et al., 2008a; Grootjans et al., 2016).
Theoretically, this would explain the mechanism behind our observation of intestinal injury without an
increase in the L/R ratio. However, this physiological mechanism is underpinned by intestinal ischemia,
resulting from a sustained reduction in blood flow to the gut.
Passive heat stress induced by a water perfusion suit exposure has previously reduced hepatic
blood flow by up to 60% (Rowell et al., 1968; Rowell et al., 1970; Rowell, 1974), similar to those values
observed in response to exercise ranging from 50 to 70% maximal oxygen uptake (Rehrer et al., 2001;
Rehrer et al., 2005; Thijssen, Steendijk and Hopman, 2009). Because of ethical and logistical
restrictions, these measures were not performed in the present study. The data suggests, however, that
cardiovascular adjustments occurred in the participants, namely an increase in cardiac output indicated
by an augmented heart rate. These mechanisms serve to promote thermoregulation and dissipation of
heat away from the core to the environment (Crandall and Wilson, 2015). Together with the work by
(Rowell, 1974), it cannot be ruled out that some degree of reduced splanchnic blood flow occurred in
the participants of the present study. However this notional hypoperfusion appears not to be of
sufficient magnitude and duration to induce an increase in intestinal permeability.
The results of the present study indicate, for the first time, that passive heat-stress results in
intestinal injury, indicated by an increase in plasma I-FABP. Whilst encouraging, the post-HWI sample
reflects the I-FABP concentration of only the previous 11 minutes (given the half-life of I-FABP). As
such it is unclear whether these values represent the highest concentrations of I-FABP. Further samples
115
taken during and further post-HWI could indicate a timeline of I-FABP dynamics in response to this
passive hyperthermia stimulus. The present study was also able to demonstrate that passive heat stress
induced symptoms of heat-illness, particularly nausea and that nausea is positively correlated to core
temperature. This data may provide valuable information towards nutritional interventions for athletes
who are prone to symptoms of nausea during exercise or competition, as measures could be
implemented to offset the increase in core temperature. The data from the present study also suggests
that 60 minutes of passive heat stress may not be sufficient to elevate intestinal permeability. These
data also demonstrate that intestinal injury and subsequent shedding of the villus tips, thus releasing I-
FABP into circulation, may precede tight-junction dysfunction; providing evidence that the
mechanisms outline by Grootjans et al. (2016) may also be reflected in humans. No attenuating effect
from acute glutamine supplementation was observed on any of our measures including intestinal
permeability, injury, core temperature and symptoms. Since we observed no increase in serum L/R
ratio, the results of the current study suggest that hyperthermia alone may not be sufficient to induce
increased intestinal permeability.

116
Chapter 8: Synthesis of Findings
8.1 Realisation of Aims
The primary aim of this thesis was to investigate the relationship between exercise intensity and the
role of hyperthermia in eliciting increased GI dysfunction, and subjective GI symptoms. In addition, a
secondary aim was to examine potential nutritional intervention strategies that could offset any
observed disturbances to the intestinal barrier. Specifically, the potential of glutamine to reduce GI
permeability and injury will also be examined. To achieve these aims, the following objectives were
addressed:
8.1.1 Objective 1. Compare the reported magnitudes in intestinal permeability when the timing
of the dual-sugar probe solution is changed in response to exercise performance.
This objective was addressed in Chapter 4 (Study 1). The principal findings indicate that GI
permeability as represented by the surrogate measure of L/R ratio indicate no significant difference was
when the dual-sugar probe solution was ingested either pre-, during or post-exercise. Furthermore,
treadmill running at approximately ~80% V̇O2 max for a duration of 60 minutes was insufficient to induce
the appearance of subjective gastrointestinal symptoms.
8.1.2 Objective 2: Investigate the effects of exercise intensity on GI permeability, damage and
symptoms
This objective was addressed in Chapter 5 (Study 2). Two-hour serum sample analysis showed a
significant increase in intestinal permeability with increasing exercise intensity, in a stepwise manner.
The findings from Chapter 5 indicate that exercise intensities above Critical Power (CP) are sufficient
to compromise gastrointestinal barrier integrity permitting the translocation of the sugar probe markers.
These results also indicated that shorter periods of exercise, when performed at an intensity above the
heavy domain, are also sufficient to induce an increase in intestinal permeability similar to those
observed in longer duration exercise occurring at lower intensities noted in literature. Furthermore, the
running exercise intensity threshold associated with augmented intestinal permeability in this
population is suggested to occur at or above 90% CP. A trend was also observed between core
temperature and intestinal permeability. Significantly higher serum L/R ratios were returned in the
heavy and severe exercise conditions, in which rectal temperature rose above threshold 1 (38.5 °C) and
threshold 2 (38.9 °C), respectively. However, this data only represents three participants so does not

117
allow for strong conclusions to be made regarding the robustness of this association and the causal
mechanistic associations between permeability and elevation in temperature.
The data from Chapter 5 which showed a clear disassociation between exercise intensity and
GI symptom expression which putatively suggests no observable causal link between exercise intensity
and the appearance of gastrointestinal symptoms in this short duration laboratory protocol. In this study,
the same two participants accounted for the appearance of GI symptoms in both the heavy and severe
exercise conditions. Furthermore, Chapter 5 also indicated that D-lactate may not be a suitable
biomarker of intestinal damage in an exercise model. However, this assertion must be bracketed with
the caveat that future investigations move toward a more sensitive assay protocol with lower threshold
of detection that presently utilised.
Figure 23: Schematic representation of the main findings from this thesis in regard to the effects of
exercise intensity on GI permeability and GI symptom expression.
8.1.3 Objective 3: Explore the responses in GI permeability, damage and symptoms in response
to passive hyperthermia
This objective was addressed in Chapters 6 (Study 3) and 7 (Study 4). In Chapter 6, despite elevating
core temperatures to thresholds 1 (38.5 °C) and 2 (38.9 °C), no significant increases in intestinal
permeability were observed. In Chapter 7, despite mean core temperature being elevated above 39 °C
in both trial conditions, intestinal permeability was not augmented. The core temperatures observed
across both chapters are approximately similar to those observed in participants exercising for sixty
minutes at 70% of V̇O2 max (Zuhl et al., 2015) which evidenced increased intestinal permeability. An
increase in heart rate was observed, which is indicative of a redirection of blood flow away from the

118
splanchnic area towards the periphery to promote heat dissipation. However, the hypothesised reduction
in splanchnic blood flow may not have been of sufficient magnitude to perturb dissipation of heat load
away from the GI walls, impair oxygen delivery to the villi that would result in an increase in intestinal
permeability. Moreover, no meaningful expression of a broad range of gastrointestinal symptoms was
noted with heat exposure, apart from nausea was frequently reported and showed a strong correlation
with elevated core temperature.
8.1.4 Objective 4: Investigate the efficacy of glutamine to reduce GI permeability and damage in
response to passive hyperthermia
In Chapter 7 (Study 4), participants received an acute dose of glutamine or placebo prior to hot water
immersion, whereby core temperature was elevated above 39 °C. The results indicated no effect of
acute glutamine supplementation on intestinal permeability, yet an increase in intestinal injury was
observed, indicated by an elevation in plasma I-FABP concentrations. Together, these results suggest
that passive hyperthermia induced by 60 minutes of hot-water immersion is sufficient to result in apical
structural damage to the intestinal villus, but the epithelial lining of the GI tract may recover before an
increase in intestinal permeability manifests (Grootjans et al., 2016). Furthermore, passive hyperthermia
resulted in the appearance of symptoms of heat-illness, particularly those associated with the head, such
as nausea, tiredness, dizziness, thirst and feeling lightheaded, and confusion. However, acute
supplementation with glutamine at 0.5 g.kg-1 body mass failed to impact any of the measures in the
study including L/R ratio, I-FABP concentrations, and core temperature or heat-illness symptoms.

119
Figure 24: Schematic representation of the main findings from this thesis in regard to the effects of
passive hyperthermia, with or without glutamine supplementation on GI permeability and injury,
and symptoms.
8.2 General Discussion
8.2.1 The timing of ingestion of sugar-probe test solutions for the determination of intestinal
permeability
A large body of literature exists investigating the effects of exercise with, or without, additional
environmental or nutritional stress such as heat, fluid restriction or NSAID ingestion on gastrointestinal
symptomology and function (Table 1). Whilst these authors have all aimed to investigate intestinal
permeability, diversity in the methods used between studies makes comparison between studies
difficult. For the determination of intestinal permeability, previous research has employed the standard
sugar absorption test procedure, utilising a sugar-probe test solution containing a large non-
metabolisable molecule (lactulose) with a smaller molecule which is absorbed by paracellular transport
through the enterocytes (L-rhamnose). However, a wide variation exists in the composition (
concentration) of the test solutions and the timing of ingestion. For example, researchers have utilised
different quantities of lactulose and L-rhamnose, or provided the test solution before (Lambert et al.,
2008), during (Pals et al., 1997) or post-exercise (Smetanka et al., 1999). Furthermore, various methods

120
of physiological, environmental or nutritional challenges have been employed, including running (Zuhl
et al., 2015) or cycling (van Wijck et al., 2011a), heat (Snipe et al., 2017), and the ingestion of NSAIDs
(Lambert et al., 2007). These variations make comparisons between studies difficult due to factors that
may affect the absorption and pharmacokinetics of the sugar-probes. Individualistic factors such as
gastric emptying rate, intestinal transit or habitual diet may affect the transport and absorption of sugar
probes through the digestive system into the blood stream (Travis and Menzies, 1992; Costa et al.,
2017a; Jeukendrup, 2017). Indeed, different concentrations of sugar probes used in these test express
differential kinetic and absorptive responses in the small intestine and as such may impact
interpretation of data (van Nieuwenhoven et al., 1999). To the author’s knowledge, this was the first
study to compare the reported magnitudes of L/R ratio when ingestion of the sugar-probe test solution
was provided at different times in relation to the exercise bout. This study demonstrated that in response
to 60 minutes of treadmill running at approximately 80% V̇O2 max, the timing of sugar-probe ingestion
does not significantly affect the reported L/R ratio. However, the data demonstrates consistently lower
ratios of L/R when the test solution is ingested post-exercise. These results could be explained by
previous literature on mouse models, when the sugar-probes are ingested post-exercise, that restorative
mechanisms have initiated the repair of enterocyte tight-junctions proteins and activation of the actin-
myosin protein complexes between enterocytes sufficiently enough to prevent transport of the sugar-
probes through the intestinal tract before they could reach the small intestine (Grootjans et al., 2016).
However, other studies have detected large increases in permeability using the 5-hr urinary sample
method, following post-exercise ingestion of the L/R test solution, in response to a relatively short bout
of exercise (20 minutes treadmill running in temperate conditions at 80% V̇O2 max) (Marchbank et al.,
2011; Davison et al., 2016). Previous research by Marchbank et al. (2011) demonstrated an approximate
2.5 fold increase between baseline and post-exercise L/R ratio values in response to 20 minutes
treadmill running in temperate conditions at 80% V̇O2 max. Interestingly, these researchers reported
baseline values of 0.222 which are higher than the 2-hr post test-solution ingestion values of the present
study (0.015), which were collected after 1 hour of exercise at 80% V̇O2 max. Considering the participants
of the current study completed a three-fold duration of similar exercise, in similar conditions, at a similar
intensity, it is difficult to explain the discrepancies between these results.
Since, to date, only one study has provided the sugar-probe solution post-exercise (Smetanka
et al., 1999), future research should continue to provide test solutions either prior to, or during, exercise.
8.2.3 The effects of exercise intensity on gastrointestinal permeability and symptoms on
triathletes
It has previously been suggested that intestinal permeability increases in a stepwise manner with
exercise intensity (Pals et al., 1997), and that a critical threshold of exercise intensity of 70% V̇O2 max is

121
required to induce an increase in intestinal permeability (Costa et al., 2017b). The results from Chapter
4 support this hypothesis, whereby exercise at 80% V̇O2 max was able to induce an increase in intestinal
permeability in all participants. Furthermore, in Chapter 5, a large increase in permeability was
observed between the Moderate and Heavy intensity domains, representing approximately 70 and 80%
% V̇O2 max, respectively. However, inconsistencies in the data presented by Pals et al. (1997) showed a
lower % recovery of lactulose (an indicator of small intestinal permeability) following exercise at 60%
V̇O2 max than 40% V̇O2 max, followed by a sharp increase following exercise at 80% V̇O2 max. Although the
results showed a stepwise increase in the L/R ratio, the lactulose recovery data would suggest that the
intestinal barrier may notionally recover integrity at 60% V̇O2 max., thus reducing estimates of GI
permeability. Furthermore, their data representing the % recovery of rhamnose showed a modest
stepwise decrease with exercise intensity, showing exercise at 40% V̇O2 max returning higher values than
80% V̇O2 max, suggesting that transcellular transport may decrease or remain unchanged with increasing
exercise intensity. The results are a contrast to those obtained within this thesis and all other studies,
which showed a stepwise increase in the recovery of both lactulose and rhamnose (data not presented),
as well as an increasing ratio of the sugar-probes in accordance with exercise intensity. The data from
this thesis would suggest that intestinal permeability, expressed through L/R ratio, increases in a
stepwise manner with exercise intensity. Together with the results from Chapter 4, it would appear that
an exercise intensity of 80%% V̇O2 max elicits a large increase in permeability. Indeed, even short
duration exercise of 20 minutes at 80%% V̇O2 max has been shown to increase intestinal permeability
(Marchbank et al., 2011).
The appearance of GI symptoms during training or competition is common amongst athletes
(de Oliveira, Burini and Jeukendrup, 2014). Some factors such as diet (Lis et al., 2016), hot
environments (Costa et al., 2017b) and life stress (Wilson, 2017) can lead to an increased development
of symptoms, but the role of exercise intensity has thus far been unclear. If taken collectively, the results
from this study appear to demonstrate a link between increasing exercise intensity and the appearance
of GI symptoms. However, further interpretation of the data shows that the same two participants
accounted for the appearance of symptoms throughout the study, both of which were female.
Furthermore, acute high-intensity interval running failed to elicit an increase in GI symptoms despite
participants exercising at 120% V̇O2 max (Pugh et al., 2017b), whilst in Chapter 7, 60 minutes of running
at 80% V̇O2 max failed to elevate the expression of GI symptoms. These data suggest that the appearance
of GI symptoms during exercise may be highly individualistic with a possible difference in sexes, yet a
clear link between GI symptoms and exercise intensity cannot be concluded based upon present data.
8.2.4 The effects of passive hyperthermia on intestinal permeability, injury and GI symptoms
Exercise can cause an increase in intestinal permeability with hypoperfusion and heat being identified
as two key mediators of exercise-induced GI dysfunction (Costa et al., 2017b; Pires et al., 2017). The

122
redirection of blood away from the splanchnic region toward the periphery, to aid thermoregulation and
nutrient delivery, leading to hypoperfusion and reduced oxygen availability to the enterocyte cells of
the intestinal tract (Otte et al., 2001; Rehrer et al., 2001). However, the specific contributions of
hypoperfusion and hyperthermia towards GI dysfunction are unclear, as such we do not yet understand
which may be the primary causal factor. Previous literature has demonstrated that heat-stress can
augment intestinal permeability in both exercise and in vitro studies (Dokladny, Moseley and Ma, 2006;
Dokladny, Zuhl and Moseley, 2016; Snipe et al., 2018a), by disrupting the integrity of the tight-junction
protein complexes which bridge the enterocytes (Ogden et al., 2020). Recently, Pires et al. (2017)
identified two key thresholds of core temperature from exercise-related studies whereby intestinal
permeability is augmented. However, their review fails to distinguish the synergistic impact of
hypoperfusion on intestinal permeability. This study aimed to investigate the effects of passive
hyperthermia on intestinal permeability, which theoretically acted to minimise the effects of exercise-
induced hypoperfusion. Previous research has demonstrated that some decline (20-40%) in intestinal
blood flow can occur with passive hyperthermia (Rowell et al., 1970; Rowell, 1974), however these
measures could not be completed in this study due to ethical and logistical restrictions. An interesting
observation of the present study was the increase in serum L/R ratio in the control condition, possibly
indicating the ‘normal’ translocation/transport rate of the sugar probes across the intestinal barrier.
Furthermore, no difference was observed in the serum L/R ratio between conditions. In Chapter 5, it
was demonstrated that exercise in the Heavy domain, equating to approximately 80% V̇O2 max was
sufficient to elicit an increase in intestinal permeability, despite the duration of exercise only being
approximately 32 minutes which is consistent with others (Marchbank et al., 2011). Mean core
temperature within this condition (37.2 °C) was just below the 38.5°C lower threshold outlined by (Pires
et al., 2017), whilst rectal temperature was equal to the threshold. However, the present study failed to
observe an increase in intestinal permeability when core temperature was elevated to the lower 38.5°C
threshold. Together, this data suggests that an exercise stimulus, or indeed a combination of
physiological challenges in addition to core temperature rise, may be required to elicit an increase in
intestinal permeability. Whilst no appearance of GI symptoms was reported, passive hyperthermia
resulted in an increase in nausea, a symptom of heat illness (Howe and Boden, 2007). The core
temperatures reached in this study are similar to those reported from exercise studies where intestinal
permeability was increased (Pals et al., 1997; Morrison, Cheung and Cotter, 2014; Snipe et al., 2018b).
Furthermore, participants received water at regular periods during this study, and displayed no
indications of dehydration which can also augment intestinal permeability (Lambert et al., 2008).
Collectively, these results would suggest that hypoperfusion may be the key underlying mechanism
towards augmented intestinal permeability during exercise.

123
8.2.5 The effects of glutamine supplementation on gastrointestinal permeability, injury and
symptoms in response to heat-stress
Previous research has demonstrated that supplementation with glutamine can attenuate intestinal
permeability and injury, and the rise in core temperature in response to heat stress (Mondello et al.,
2010; Rao and Samak, 2012; Soares et al., 2014; Pugh et al., 2017c). In response to running at 70 %
V̇O2 max in 30°C heat, Pugh et al. (2017c) reported a protective effect of glutamine supplementation at
0.25, 0.5 and 0.9 g.kg-1 on intestinal permeability in a stepwise manner. Whilst no effect on core
temperature was observed, glutamine also attenuated intestinal injury indicated by a reduction in I-
FABP. These results are in contrast to those of Soares et al. (2014) who observed an attenuating effect
of glutamine on the core temperature of rats in response to heat stress. In Chapter 6, passive
hyperthermia induced a rise in core temperature but no further increase in intestinal permeability when
compared to control, however I-FABP was not quantified in this study. Furthermore, the effects of
glutamine on core temperature dynamics in response to heat stress had not been investigated. In chapter
7 it was demonstrated that passive hyperthermia through HWI can induce intestinal injury and
permeability, as represented by an increase in I-FABP and serum L/R ratio, respectively. Additionally,
glutamine supplementation showed no effect on I-FABP, intestinal permeability or core temperature.
Moreover, despite similar conditions, final core temperature (compared to the HOT condition) and pre-
experimental protocols, intestinal permeability was elevated approximately two-fold in this study, when
compared than in Chapter 7. Previous literature has demonstrated that the apical cells of the villus are
shed under conditions of ischemia, but a zipper-like mechanism acts to recover the intestinal lining
(Grootjans et al., 2016). This process may precede the breakdown of the tight junction complexes which
permit the transport of otherwise impassable molecules, such as lactulose, through the intestinal barrier
into the portal blood. As such, an increase in I-FABP would be observed without an accompanying
increase in the serum L/R ratio. Since glutamine has previously demonstrated an attenuating effect on
intestinal permeability in response to exercise in the heat, these effects may be more pronounced in the
presence of exercise-induced hypoperfusion. Similarly to Chapter 6, logistical and ethical restrictions
prevented the quantification of intestinal blood flow during the study, yet previous literature suggests
intestinal blood flow may have been reduced by some degree in the current study (Rowell et al., 1968;
Rowell et al., 1970). This study therefore supports the hypothesis that exercise-induced hypoperfusion,
when combined with an adequate increase in core temperature, underlies the appearance of increased
intestinal permeability.
In this thesis, exercise at 70% V̇O2 max and above, as well as passive hyperthermia has failed to induce
a rise in GI symptoms often reported by athletes during training or competition (de Oliveira, Burini and
Jeukendrup, 2014). However in Chapter 6, participants frequently reported the appearance of symptoms
related to heat-illness such as nausea or dizziness (Coris, Ramirez and Van Durme, 2004). Furthermore,
this study demonstrated a strong relationship between core temperature and nausea. Exercise in the heat

124
has seen an elevation in reported symptoms, including nausea, when compared to temperate conditions
(Snipe et al., 2017). Future studies may aim to differentiate symptoms into those relating to the gut and
those relating to heat illness. Together, the underlying mechanisms governing the appearance of GI
symptoms in response to exercise remain unclear and warrant further investigation.
8.3 Thesis Limitations
8.3.1 Chapter 4
A limitation in Chapter 4 was the small sample size. Whilst mean data is presented in the results of this
thesis, the wide deviations demonstrate a large difference in the individual response in intestinal
permeability. Examination of the results indicated that one participant displayed large variances in
intestinal permeability during one experimental visit when compared to their other trials. Despite
confirming adherence to the pre-experimental conditions it is the belief of the present author that these
conditions may not have been followed. Another limitation to this study was the participant cohort did
not include any females. Indeed, there is a distinct lack of research investigating the response in
intestinal permeability in response to exercise in females. Some research suggests that the prevalence
of GI symptoms is higher amongst female athletes (de Oliveira, Burini and Jeukendrup, 2014), however
this is contradictory to other reports (Snipe and Costa, 2018a). Indeed, in Chapter 5, the two participants
who accounted for the increase in GI symptoms were both females, suggesting more research is
warranted investigating the appearance of GI symptoms in female athletes. It is worthy of note that
female participants were invited to participate in the study, but no volunteers were received.
8.3.2 Chapter 5
Previous literature has demonstrated core temperature to be an important influencing factor of exercise-
induced GI dysfunction (Pires et al., 2017). However, during the study, persistent problems with the
rectal probe equipment resulted in this data only being recorded from three participants; the remaining
participants’ core temperature was quantified using tympanic infrared thermometer. The validity of
aural temperature for measurement of core temperature in indoor conditions has been questioned, with
readings being -0.67 °C when compared to rectal temperature (Ganio et al., 2009). As such, the lack of
validity limits the confidence of the author to make conclusions on the core temperature data. Again,
the cohort of this study presented a limited number of female athletes.
8.3.3 Chapter 6
A limitation of the study is that mesenteric blood flow was not measured; therefore it is difficult to
delineate the relative contribution of hypoperfusion to the observed results. Previous research has

125
demonstrated that passive hyperthermia can reduce mesenteric blood blow (Rowell et al., 1968; Rowell
et al., 1970), yet this was the first study to investigate the response in intestinal permeability to passive
heat stress. Despite elevating core temperatures to thresholds previously identified as associated with
augmented intestinal permeability (Pires et al., 2017), ethical restrictions meant hot water immersion
was limited to a total of 60 minutes. As such, core temperature did not reach these thresholds for a
further 15 minutes. This amount of time may not have been sufficient to elicit disruption to the tight-
junction complexes (Grootjans et al., 2016). Future research should aim to quantify the response in
intestinal permeability to increased durations of passive hyperthermia, however, the hot-water
immersion model proved an efficient method for elevating and maintaining core temperature. A further
limitation to this study was that I-FABP was not measured. These measures would have added to the
limited body of literature examining the effects of passive hyperthermia on intestinal damage.
8.3.4 Chapter 7
Similarly to Chapter 6, in this study, mesenteric blood flow was not measured. Again, the cohort of
participants included no females. Furthermore, serum L/R data was obtained from only one time point;
whilst the results demonstrated no effect of glutamine supplementation, it is difficult to conclude
whether an increase in intestinal permeability occurred.
9 Conclusions and implications
The methodological approaches used to the investigate intestinal permeability changes as a result of
exercise across a range of exercise modalities, intensities and environmental conditions have noted wide
variances in GI permeability biomarkers . Data presented in this thesis demonstrate that the timing of
L/R sugar-probe ingestion do not significantly affect the reported serum L/R ratio. However, it is
recommended that sugar-probe solutions are provided either pre- or during (up to 30 min), rather than
at the end of the experimental protocol.
This thesis has also demonstrated that intestinal permeability increases in a stepwise manner with
exercise intensity. A similar stepwise relationship was observed with core temperature. The relationship
between exercise intensity, GI symptoms and, furthermore, biological sex requires further attention
since two female participants accounted for the appearance of the majority of symptoms in the study.
Exercise studies across this thesis demonstrate weak relationships between intestinal permeability and
the appearance of GI symptoms. Indeed, research has demonstrated that intestinal permeability can be
increased in response to exercise, but there has been no relationship established with intestinal
permeability and the appearance of symptoms or indeed a decline in exercise performance.
Furthermore, the results of this thesis have failed to support a link between an increase in core

126
temperature and augmented intestinal permeability, at least when in absence of exercise-induced
hypoperfusion. The studies presented in this thesis, and previous research (Table 1) may demonstrate
that augmented intestinal permeability occurs, however, comparisons between the specific magnitudes
of ratios of lactulose/ rhamnose cannot be made.
Hyperthermia and hypoperfusion represent two key mechanisms underlying the increase in
intestinal permeability associated with exercise (Costa et al., 2017b; Pires et al., 2017). Using a passive
heat stress model, this thesis demonstrates that hyperthermia may be secondary to hypoperfusion in
eliciting the greatest increase in intestinal permeability. Minor increases in intestinal permeability were
observed in hyperthermia, but no difference was present between control conditions in a thermoneutral
environment and following heat stress. It remains unclear why intestinal permeability increased in the
control condition, as such this research requires further investigation into daily and hourly variance in
intestinal permeability. The use of I-FABP as a marker of intestinal damage in response to exercise has
recently gained attention. Yet, a review of the literature identifies a large range in the responses to
exercise, no nominal data exists outlining the day-to-day variations in circulating I-FABP, no
population specific values exist and in relation to trained individuals no consideration of I-FABP
adaptive responses to training exists. Chapter 7 was the first study in humans to report an increase in I-
FABP in response to passive hyperthermia. Yet, this increase was not ameliorated by acute glutamine
supplementation. Furthermore, acute glutamine supplementation returned no effect on intestinal
permeability or core temperature.
The results of this thesis suggest that hypoperfusion, rather than hyperthermia, may be a
predominant casual factor in the appearance of increased intestinal permeability during exercise. The
studies undertaken in this thesis demonstrate an increase in intestinal permeability in response to
exercise, but this effect is not observed when exercise stress is removed, despite a similar increase in
core temperature achieved. Furthermore, the results in this thesis suggest no protective (attenuation)
effect of acute glutamine supplementation on core temperature elevation, intestinal permeability or
injury, or heat-illness symptoms in response to passive hyperthermia.

127
Bibliography
Adams, W.C., Fox, R.H., Fry, A.J. and MacDonald, I.C. (1975) Thermoregulation during
marathon running in cool, moderate, and hot environments. Journal of Applied Physiology, 38
(6), 1030-1037.
Aggarwal, Y., Karan, B.M., Das, B.N. and Sinha, R.K. (2008) Prediction of heat-illness
symptoms with the prediction of human vascular response in hot environment under resting
condition. Journal of Medical Systems, 32 (2), 167-176.
An, J., Lee, I. and Yi, Y. (2019) The Thermal Effects of Water Immersion on Health Outcomes:
An Integrative Review. International Journal of Environmental Research and Public Health,
16 (7).
Anderson, J.M. and Van Itallie, C.M. (2009) Physiology and function of the tight junction.
Cold Spring Harbor Perspectives in Biology, 1 (2), a002584.
Arrieta, M.C., Bistritz, L. and Meddings, J.B. (2006) Alterations in intestinal permeability.
Gut, 55 (10), 1512-1520.
Barberio, M.D., Elmer, D.J., Laird, R.H., Lee, K.A., Gladden, B. and Pascoe, D.D. (2015)
Systemic LPS and inflammatory response during consecutive days of exercise in heat.
International Journal of Sports Medicine, 36 (3), 262-270.
Barrow, M.W. and Clark, K.A. (1998) Heat-related illnesses. American Family Physician, 58
(3), 749-756, 759.
Bengtsson, M., Persson, J., Sjolund, K. and Ohlsson, B. (2013) Further validation of the visual
analogue scale for irritable bowel syndrome after use in clinical practice. Gastroenterology
Nursing, 36 (3), 188-198.
Bhattacharyya, A., Chattopadhyay, R., Mitra, S. and Crowe, S.E. (2014) Oxidative stress: an
essential factor in the pathogenesis of gastrointestinal mucosal diseases. Physiological
Reviews, 94 (2), 329-354.
Bjarnason, I., MacPherson, A. and Hollander, D. (1995) Intestinal permeability: an overview.
Gastroenterology, 108 (5), 1566-1581.
Bonde-Petersen, F., Schultz-Pedersen, L. and Dragsted, N. (1992) Peripheral and central blood
flow in man during cold, thermoneutral, and hot water immersion. Aviation Space and
Environmental Medicine, 63 (5), 346-350.
Borg, G.A. (1974) Perceived exertion. Exercise and Sport Sciences Reviews, 2, 131-153.
Bosenberg, A., Brock-Utne, J., Gaffin, S., Wells, M. and Blake, G. (1988) Strenuous exercise
causes systemic endotoxemia. Journal of Applied Physiology, 65 (1), 106-108.
128
Brock-Utne, J.G., Gaffin, S.L., Wells, M.T., Gathiram, P., Sohar, E., James, M.F., Morrell,
D.F. and Norman, R.J. (1988) Endotoxaemia in exhausted runners after a long-distance race.
South African Medical Journal, 73 (9), 533-536.
Brunetto, A.L., Pearson, A.D., Gibson, R., Bateman, D.N., Rashid, M.U. and Laker, M.F.
(1990) The effect of pharmacological modification of gastric emptying and mouth-to-caecum
transit time on the absorption of sugar probe marker molecules of intestinal permeability in
normal man. European Journal of Clinical Investigation, 20 (3), 279-284.
Buchman, A.L., Killip, D., Ou, C.-N., Rognerud, C.L., Pownall, H., Dennis, K. and Dunn, J.K.
(1999) Short-term vitamin E supplementation before marathon running: a placebo-controlled
trial. Nutrition, 15 (4), 278-283.
Burdon, C.A., Hoon, M.W., Johnson, N.A., Chapman, P.G. and O'Connor, H.T. (2013) The
effect of ice slushy ingestion and mouthwash on thermoregulation and endurance performance
in the heat. International Journal of Sport Nutrition and Exercise Metabolism, 23 (5), 458-469.
Burnley, M. and Jones, A.M. (2018) Power-duration relationship: Physiology, fatigue, and the
limits of human performance. Eur J Sport Sci, 18 (1), 1-12.
Burnley, M., Vanhatalo, A. and Jones, A.M. (2012) Distinct profiles of neuromuscular fatigue
during muscle contractions below and above the critical torque in humans. J Appl Physiol
(1985), 113 (2), 215-223.
Camilleri, M., Madsen, K., Spiller, R., Greenwood-Van Meerveld, B. and Verne, G.N. (2012)
Intestinal barrier function in health and gastrointestinal disease. Neurogastroenterology and
Motility, 24 (6), 503-512.
Camilleri, M., Nadeau, A., Lamsam, J., Nord, S.L., Ryks, M., Burton, D., Sweetser, S.,
Zinsmeister, A.R. and Singh, R. (2010) Understanding measurements of intestinal permeability
in healthy humans with urine lactulose and mannitol excretion. Neurogastroenterology and
Motility, 22 (1), e15-26.
Charkoudian, N. (2003) Skin blood flow in adult human thermoregulation: how it works, when
it does not, and why. Mayo Clinic Proceedings, 78 (5), 603-612.
Cheshire, W.P., Jr. (2016) Thermoregulatory disorders and illness related to heat and cold
stress. Autonomic Neuroscience, 196, 91-104.
Cheung, S.S., McLellan, T.M. and Tenaglia, S. (2000) The thermophysiology of
uncompensable heat stress. Physiological manipulations and individual characteristics. Sports
Medicine, 29 (5), 329-359.
Cheuvront, S.N. and Haymes, E.M. (2001) Thermoregulation and marathon running:
biological and environmental influences. Sports Medicine, 31 (10), 743-762.
Coleman, N. (2019) Gastrointestinal Issues in Athletes. Current Sports Medicine Reports, 18
(6), 185-187.

129
Coris, E.E., Ramirez, A.M. and Van Durme, D.J. (2004) Heat illness in athletes: the dangerous
combination of heat, humidity and exercise. Sports Medicine, 34 (1), 9-16.
Costa, R.J.S., Miall, A., Khoo, A., Rauch, C., Snipe, R., Camoes-Costa, V. and Gibson, P.
(2017a) Gut-training: the impact of two weeks repetitive gut-challenge during exercise on
gastrointestinal status, glucose availability, fuel kinetics, and running performance. Applied
Physiology, Nutrition, and Metabolism. Physiologie Appliquée, Nutrition et Métabolisme, 42
(5), 547-557.
Costa, R.J.S., Snipe, R.M.J., Kitic, C.M. and Gibson, P.R. (2017b) Systematic review:
exercise-induced gastrointestinal syndrome-implications for health and intestinal disease.
Alimentary Pharmacology and Therapeutics, 46 (3), 246-265.
Costill, D.L. and Saltin, B. (1974) Factors limiting gastric emptying during rest and exercise.
Journal of Applied Physiology, 37 (5), 679-683.
Costrini, A.M., Pitt, H.A., Gustafson, A.B. and Uddin, D.E. (1979) Cardiovascular and
metabolic manifestations of heat stroke and severe heat exhaustion. American Journal of
Medicine, 66 (2), 296-302.
Cramer, M.N. and Jay, O. (2016) Biophysical aspects of human thermoregulation during heat
stress. Autonomic Neuroscience, 196, 3-13.
Crandall, C.G. and Wilson, T.E. (2015) Human cardiovascular responses to passive heat stress.
Compr Physiol, 5 (1), 17-43.
Darwich, A.S., Aslam, U., Ashcroft, D.M. and Rostami-Hodjegan, A. (2014) Meta-analysis of
the turnover of intestinal epithelia in preclinical animal species and humans. Drug Metabolism
and Disposition: The Biological Fate of Chemicals, 42 (12), 2016-2022.
Davison, G., Marchbank, T., March, D.S., Thatcher, R. and Playford, R.J. (2016) Zinc
carnosine works with bovine colostrum in truncating heavy exercise-induced increase in gut
permeability in healthy volunteers. American Journal of Clinical Nutrition, 104 (2), 526-536.
de Oliveira, E.P. (2017) Runner's diarrhea: what is it, what causes it, and how can it be
prevented? Curr Opin Gastroenterol, 33 (1), 41-46.
de Oliveira, E.P. and Burini, R.C. (2009) The impact of physical exercise on the gastrointestinal
tract. Current Opinion in Clinical Nutrition and Metabolic Care, 12 (5), 533-538.
de Oliveira, E.P., Burini, R.C. and Jeukendrup, A. (2014) Gastrointestinal complaints during
exercise: prevalence, etiology, and nutritional recommendations. Sports Medicine, 44 Suppl 1,
S79-85.
Derikx, J.P., Luyer, M.D., Heineman, E. and Buurman, W.A. (2010) Non-invasive markers of
gut wall integrity in health and disease. World J Gastroenterol, 16 (42), 5272-5279.
Derikx, J.P., Matthijsen, R.A., de Bruine, A.P., van Bijnen, A.A., Heineman, E., van Dam,
R.M., Dejong, C.H. and Buurman, W.A. (2008a) Rapid reversal of human intestinal ischemia-

130
reperfusion induced damage by shedding of injured enterocytes and reepithelialisation. PloS
One, 3 (10), e3428.
Derikx, J.P., van Waardenburg, D.A., Thuijls, G., Willigers, H.M., Koenraads, M., van Bijnen,
A.A., Heineman, E., Poeze, M., Ambergen, T., van Ooij, A., van Rhijn, L.W. and Buurman,
W.A. (2008b) New Insight in Loss of Gut Barrier during Major Non-Abdominal Surgery. PloS
One, 3 (12), e3954.
Derikx, J.P., Vreugdenhil, A.C., Van den Neucker, A.M., Grootjans, J., van Bijnen, A.A.,
Damoiseaux, J.G., van Heurn, L.W., Heineman, E. and Buurman, W.A. (2009) A pilot study
on the noninvasive evaluation of intestinal damage in celiac disease using I-FABP and L-
FABP. Journal of Clinical Gastroenterology, 43 (8), 727-733.
Dokladny, K., Moseley, P.L. and Ma, T.Y. (2006) Physiologically relevant increase in
temperature causes an increase in intestinal epithelial tight junction permeability. American
Journal of Physiology: Gastrointestinal and Liver Physiology, 290 (2), G204-212.
Dokladny, K., Zuhl, M.N. and Moseley, P.L. (2016) Intestinal epithelial barrier function and
tight junction proteins with heat and exercise. J Appl Physiol (1985), 120 (6), 692-701.
Epstein, Y. and Yanovich, R. (2019) Heatstroke. New England Journal of Medicine, 380 (25),
2449-2459.
Evennett, N.J., Petrov, M.S., Mittal, A. and Windsor, J.A. (2009) Systematic review and pooled
estimates for the diagnostic accuracy of serological markers for intestinal ischemia. World J
Surg, 33 (7), 1374-1383.
Ewaschuk, J.B., Naylor, J.M. and Zello, G.A. (2005) D-lactate in human and ruminant
metabolism. Journal of Nutrition, 135 (7), 1619-1625.
Farrell, P.A., Joyner, M.J., Caiozzo, V.J. and American College of Sports, M. (2012) ACSM's
advanced exercise physiology. Philadelphia: Wolters Kluwer Health/Lippincott Williams &
Wilkins.
Felig, P. and Wahren, J. (1971) Amino acid metabolism in exercising man. Journal of Clinical
Investigation, 50 (12), 2703-2714.
Fihn, B.M., Sjoqvist, A. and Jodal, M. (2000) Permeability of the rat small intestinal epithelium
along the villus-crypt axis: effects of glucose transport. Gastroenterology, 119 (4), 1029-1036.
Fleming, S.C., Duncan, A., Russell, R.I. and Laker, M.F. (1996) Measurement of sugar probes
in serum: an alternative to urine measurement in intestinal permeability testing. Clinical
Chemistry, 42 (3), 445-448.
Funaoka, H., Kanda, T. and Fujii, H. (2010) [Intestinal fatty acid-binding protein (I-FABP) as
a new biomarker for intestinal diseases]. Rinsho Byori. Japanese Journal of Clinical
Pathology, 58 (2), 162-168.

131
Ganio, M.S., Brown, C.M., Casa, D.J., Becker, S.M., Yeargin, S.W., McDermott, B.P., Boots,
L.M., Boyd, P.W., Armstrong, L.E. and Maresh, C.M. (2009) Validity and reliability of devices
that assess body temperature during indoor exercise in the heat. J Athl Train, 44 (2), 124-135.
Gaskell, S.K., Snipe, R.M.J. and Costa, R.J.S. (2019) Test-Retest Reliability of a Modified
Visual Analog Scale Assessment Tool for Determining Incidence and Severity of
Gastrointestinal Symptoms in Response to Exercise Stress. International Journal of Sport
Nutrition and Exercise Metabolism, 29 (4), 411-419.
Gill, S.K., Hankey, J., Wright, A., Marczak, S., Hemming, K., Allerton, D.M., Ansley-Robson,
P. and Costa, R.J. (2015) The Impact of a 24-h Ultra-Marathon on Circulatory Endotoxin and
Cytokine Profile. International Journal of Sports Medicine, 36 (8), 688-695.
Gisolfi, C.V. (2000) Is the GI System Built For Exercise? News in Physiological Sciences, 15,
114-119.
Gisolfi, C.V., Lambert, G.P. and Summers, R.W. (2001) Intestinal fluid absorption during
exercise: role of sport drink osmolality and [Na+]. Medicine and Science in Sports and
Exercise, 33 (6), 907-915.
Gisolfi, C.V., Summers, R.W., Lambert, G.P. and Xia, T. (1998) Effect of beverage osmolality
on intestinal fluid absorption during exercise. J Appl Physiol (1985), 85 (5), 1941-1948.
Gisolfi, C.V. and Wenger, C.B. (1984) Temperature regulation during exercise: old concepts,
new ideas. Exercise and Sport Sciences Reviews, 12, 339-372.
Gleeson, M. (1998) Temperature regulation during exercise. International Journal of Sports
Medicine, 19 Suppl 2, S96-99.
Granger, D.N. and Kvietys, P.R. (2015) Reperfusion injury and reactive oxygen species: The
evolution of a concept. Redox Biol, 6, 524-551.
Grootjans, J., Lenaerts, K., Buurman, W.A., Dejong, C.H. and Derikx, J.P. (2016) Life and
death at the mucosal-luminal interface: New perspectives on human intestinal ischemia-
reperfusion. World journal of gastroenterology, 22 (9), 2760.
Grootjans, J., Lenaerts, K., Derikx, J.P., Matthijsen, R.A., de Bruine, A.P., van Bijnen, A.A.,
van Dam, R.M., Dejong, C.H. and Buurman, W.A. (2010a) Human intestinal ischemia-
reperfusion-induced inflammation characterized: experiences from a new translational model.
American Journal of Pathology, 176 (5), 2283-2291.
Grootjans, J., Thuijls, G., Verdam, F., Derikx, J.P., Lenaerts, K. and Buurman, W.A. (2010b)
Non-invasive assessment of barrier integrity and function of the human gut. World J
Gastrointest Surg, 2 (3), 61-69.
Guillochon, M. and Rowlands, D.S. (2017) Solid, Gel, and Liquid Carbohydrate Format
Effects on Gut Comfort and Performance. International Journal of Sport Nutrition and
Exercise Metabolism, 27 (3), 247-254.

132
Guzel, M., Sozuer, E.M., Salt, O., Ikizceli, I., Akdur, O. and Yazici, C. (2014) Value of the
serum I-FABP level for diagnosing acute mesenteric ischemia. Surgery Today, 44 (11), 2072-
2076.
Hall, D.M., Buettner, G.R., Oberley, L.W., Xu, L., Matthes, R.D. and Gisolfi, C.V. (2001a)
Mechanisms of circulatory and intestinal barrier dysfunction during whole body hyperthermia.
American Journal of Physiology-Heart and Circulatory Physiology, 280 (2), H509-H521.
Hall, D.M., Buettner, G.R., Oberley, L.W., Xu, L., Matthes, R.D. and Gisolfi, C.V. (2001b)
Mechanisms of circulatory and intestinal barrier dysfunction during whole body hyperthermia.
American Journal of Physiology: Heart and Circulatory Physiology, 280 (2), H509-521.
Harper, D. and Chandler, B. (2015) Splanchnic circulation. Bja Education, 16 (2), 66-71.
Hayashi, N., Ikemura, T. and Someya, N. (2011) Effects of dynamic exercise and its intensity
on ocular blood flow in humans. European Journal of Applied Physiology, 111 (10), 2601-
2606.
Hond, E.D., Peeters, M., Hiele, M., Bulteel, V., Ghoos, Y. and Rutgeerts, P. (1999) Effect of
glutamine on the intestinal permeability changes induced by indomethacin in humans.
Alimentary Pharmacology and Therapeutics, 13 (5), 679-685.
Howe, A.S. and Boden, B.P. (2007) Heat-related illness in athletes. American Journal of Sports
Medicine, 35 (8), 1384-1395.
Ikari, A., Nakano, M., Suketa, Y., Harada, H. and Takagi, K. (2005) Reorganization of ZO-1
by sodium-dependent glucose transporter activation after heat stress in LLC-PK1 cells. Journal
of Cellular Physiology, 203 (3), 471-478.
Imbach, F., Candau, R., Chailan, R. and Perrey, S. (2020) Validity of the Stryd Power Meter
in Measuring Running Parameters at Submaximal Speeds. Sports (Basel), 8 (7).
Ishimura, S., Furuhashi, M., Watanabe, Y., Hoshina, K., Fuseya, T., Mita, T., Okazaki, Y.,
Koyama, M., Tanaka, M., Akasaka, H., Ohnishi, H., Yoshida, H., Saitoh, S. and Miura, T.
(2013) Circulating levels of fatty acid-binding protein family and metabolic phenotype in the
general population. PloS One, 8 (11), e81318.
Jeukendrup, A. and VanDiemen, A. (1998) Heart rate monitoring during training and
competition in cyclists. Journal of Sports Sciences, 16 Suppl, S91-99.
Jeukendrup, A.E. (2017) Training the Gut for Athletes. Sports Medicine, 47 (Suppl 1), 101-
110.
Jones, A.M. and Doust, J.H. (1996) A 1% treadmill grade most accurately reflects the energetic
cost of outdoor running. Journal of Sports Sciences, 14 (4), 321-327.
Jones, A.M., Vanhatalo, A., Burnley, M., Morton, R.H. and Poole, D.C. (2010) Critical power:
implications for determination of V O2max and exercise tolerance. Medicine and Science in
Sports and Exercise, 42 (10), 1876-1890.

133
Jonvik, K.L., Lenaerts, K., Smeets, J.S., Kolkman, J.J., Loon, L.J.V. and Verdijk, L.B. (2018)
Sucrose but Not Nitrate Ingestion Reduces Strenuous Cycling-induced Intestinal Injury.
Medicine and Science in Sports and Exercise.
Karhu, E., Forsgard, R.A., Alanko, L., Alfthan, H., Pussinen, P., Hamalainen, E. and Korpela,
R. (2017) Exercise and gastrointestinal symptoms: running-induced changes in intestinal
permeability and markers of gastrointestinal function in asymptomatic and symptomatic
runners. European Journal of Applied Physiology, 117 (12), 2519-2526.
Kashima, H., Harada, N., Miyamoto, K., Fujimoto, M., Fujita, C., Endo, M.Y., Kobayashi, T.,
Miura, A. and Fukuba, Y. (2017) Timing of postexercise carbohydrate-protein
supplementation: roles of gastrointestinal blood flow and mucosal cell damage on gastric
emptying in humans. J Appl Physiol (1985), 123 (3), 606-613.
Keeffe, E.B., Lowe, D.K., Goss, J.R. and Wayne, R. (1984) Gastrointestinal symptoms of
marathon runners. West J Med, 141 (4), 481-484.
Khadaroo, R.G., Fortis, S., Salim, S.Y., Streutker, C., Churchill, T.A. and Zhang, H. (2014) I-
FABP as biomarker for the early diagnosis of acute mesenteric ischemia and resultant lung
injury. PloS One, 9 (12), e115242.
Kondoh, Y., Kawase, M. and Ohmori, S. (1992) D-lactate concentrations in blood, urine and
sweat before and after exercise. European Journal of Applied Physiology and Occupational
Physiology, 65 (1), 88-93.
Lambert, G., Gisolfi, C.V., Berg, D.J., Moseley, P.L., Oberley, L.W. and Kregel, K.C. (2002)
Selected contribution: Hyperthermia-induced intestinal permeability and the role of oxidative
and nitrosative stress. Journal of Applied Physiology, 92 (4), 1750-1761.
Lambert, G.P. (2004) Role of gastrointestinal permeability in exertional heatstroke. Exercise
and Sport Sciences Reviews, 32 (4), 185-190.
Lambert, G.P. (2008) Intestinal barrier dysfunction, endotoxemia, and gastrointestinal
symptoms: the 'canary in the coal mine' during exercise-heat stress? Medicine and Sport
Science, 53, 61-73.
Lambert, G.P. (2009) Stress-induced gastrointestinal barrier dysfunction and its inflammatory
effects. Journal of Animal Science, 87 (14 Suppl), E101-108.
Lambert, G.P., Boylan, M., Laventure, J.P., Bull, A. and Lanspa, S. (2007) Effect of aspirin
and ibuprofen on GI permeability during exercise. International Journal of Sports Medicine,
28 (9), 722-726.
Lambert, G.P., Broussard, L.J., Mason, B.L., Mauermann, W.J. and Gisolfi, C.V. (2001)
Gastrointestinal permeability during exercise: effects of aspirin and energy-containing
beverages. J Appl Physiol (1985), 90 (6), 2075-2080.
Lambert, G.P., Lang, J., Bull, A., Pfeifer, P.C., Eckerson, J., Moore, G., Lanspa, S. and O'Brien,
J. (2008) Fluid restriction during running increases GI permeability. International Journal of
Sports Medicine, 29 (3), 194-198.

134
Lambert, G.P., Schmidt, A., Schwarzkopf, K. and Lanspa, S. (2012) Effect of aspirin dose on
gastrointestinal permeability. International Journal of Sports Medicine, 33 (6), 421-425.
Lau, E., Marques, C., Pestana, D., Santoalha, M., Carvalho, D., Freitas, P. and Calhau, C.
(2016) The role of I-FABP as a biomarker of intestinal barrier dysfunction driven by gut
microbiota changes in obesity. Nutrition & Metabolism, 13, 31.
Leon, L.R. and Helwig, B.G. (2010) Heat stroke: role of the systemic inflammatory response.
J Appl Physiol (1985), 109 (6), 1980-1988.
Li, H., Chen, Y., Huo, F., Wang, Y. and Zhang, D. (2017) Association between acute
gastrointestinal injury and biomarkers of intestinal barrier function in critically ill patients.
BMC Gastroenterology, 17 (1), 45.
Lieberman, J.M., Sacchettini, J., Marks, C. and Marks, W.H. (1997) Human intestinal fatty
acid binding protein: report of an assay with studies in normal volunteers and intestinal
ischemia. Surgery, 121 (3), 335-342.
Lis, D., Ahuja, K.D., Stellingwerff, T., Kitic, C.M. and Fell, J. (2016) Case Study: Utilizing a
Low FODMAP Diet to Combat Exercise-Induced Gastrointestinal Symptoms. International
Journal of Sport Nutrition and Exercise Metabolism, 26 (5), 481-487.
Lis, D., Stellingwerff, T., Kitic, C., Ahuja, K.D. and Fell, J. (2015) No effects of a short-term
gluten-free diet on performance in nonceliac athletes. Medicine and Science in Sports and
Exercise, 47 (12), 2563-2570.
Liu, X., Li, H., Lu, A., Zhong, Y., Hou, X., Wang, N., Jia, D., Zan, J., Zhao, H., Xu, J. and Liu,
F. (2012) Reduction of intestinal mucosal immune function in heat-stressed rats and bacterial
translocation. International Journal of Hyperthermia, 28 (8), 756-765.
Lucas, R.A., Epstein, Y. and Kjellstrom, T. (2014) Excessive occupational heat exposure: a
significant ergonomic challenge and health risk for current and future workers. Extrem Physiol
Med, 3, 14.
March, D.S., Jones, A.W., Thatcher, R. and Davison, G. (2018) The effect of bovine colostrum
supplementation on intestinal injury and circulating intestinal bacterial DNA following
exercise in the heat. European Journal of Nutrition.
March, D.S., Marchbank, T., Playford, R.J., Jones, A.W., Thatcher, R. and Davison, G. (2017)
Intestinal fatty acid-binding protein and gut permeability responses to exercise. European
Journal of Applied Physiology, 117 (5), 931-941.
Marchbank, T., Davison, G., Oakes, J.R., Ghatei, M.A., Patterson, M., Moyer, M.P. and
Playford, R.J. (2011) The nutriceutical bovine colostrum truncates the increase in gut
permeability caused by heavy exercise in athletes. American Journal of Physiology:
Gastrointestinal and Liver Physiology, 300 (3), G477-484.
Matheson, P.J., Wilson, M.A. and Garrison, R.N. (2000) Regulation of intestinal blood flow.
Journal of Surgical Research, 93 (1), 182-196.

135
Matthijsen, R.A., Derikx, J.P., Kuipers, D., van Dam, R.M., Dejong, C.H. and Buurman, W.A.
(2009) Enterocyte shedding and epithelial lining repair following ischemia of the human small
intestine attenuate inflammation. PloS One, 4 (9), e7045.
McCance, R.A. and Madders, K. (1930) The comparative rates of absorption of sugars from
the human intestine. Biochemical Journal, 24 (3), 795-804.
McKenna, Z., Berkemeier, Q., Naylor, A., Kleint, A., Gorini, F., Ng, J., Kim, J.K., Sullivan,
S. and Gillum, T. (2017) Bovine colostrum supplementation does not affect plasma I-FABP
concentrations following exercise in a hot and humid environment. European Journal of
Applied Physiology, 117 (12), 2561-2567.
McLellan, T.M., Boscarino, C. and Duncan, E.J. (2013) Physiological strain of next generation
combat uniforms with chemical and biological protection: importance of clothing vents.
Ergonomics, 56 (2), 327-337.
Mead, J. and Bonmarito, C.L. (1949) Reliability of rectal temperatures as an index of internal
body temperature. Journal of Applied Physiology, 2 (2), 97-109.
Meddings, J.B., Wallace, J.L. and Sutherland, L.R. (1995) Sucrose Permeability: A Novel
Means of Detecting Gastroduodenal Damage Noninvasively. American Journal of
Therapeutics, 2 (11), 843-849.
Mensink, P.B., van Petersen, A.S., Kolkman, J.J., Otte, J.A., Huisman, A.B. and Geelkerken,
R.H. (2006) Gastric exercise tonometry: the key investigation in patients with suspected celiac
artery compression syndrome. Journal of Vascular Surgery, 44 (2), 277-281.
Menzies, I.S. (1974) Absorption of Intact Oligosaccharide in Health and Disease. Biochemical
Society Transactions, 2 (5), 1042-1047.
Miller, K.C., Hughes, L.E., Long, B.C., Adams, W.M. and Casa, D.J. (2017) Validity of Core
Temperature Measurements at 3 Rectal Depths During Rest, Exercise, Cold-Water Immersion,
and Recovery. J Athl Train, 52 (4), 332-338.
Miwa, C., Matsukawa, T., Iwase, S., Sugiyama, Y., Mano, T., Sugenoya, J., Yamaguchi, H.
and Kirsch, K.A. (1994) Human cardiovascular responses to a 60-min bath at 40 degrees C.
Environmental Medicine, 38 (1), 77-80.
Mondello, S., Galuppo, M., Mazzon, E., Domenico, I., Mondello, P., Carmela, A. and
Cuzzocrea, S. (2010) Glutamine treatment attenuates the development of
ischaemia/reperfusion injury of the gut. European Journal of Pharmacology, 643 (2-3), 304-
315.
Moran, D.S. and Mendal, L. (2002) Core temperature measurement: methods and current
insights. Sports Medicine, 32 (14), 879-885.
Moran, D.S., Shitzer, A. and Pandolf, K.B. (1998) A physiological strain index to evaluate heat
stress. American Journal of Physiology, 275 (1), R129-134.

136
Morrison, S.A., Cheung, S.S. and Cotter, J.D. (2014) Bovine colostrum, training status, and
gastrointestinal permeability during exercise in the heat: a placebo-controlled double-blind
study. Applied Physiology, Nutrition, and Metabolism. Physiologie Appliquée, Nutrition et
Métabolisme, 39 (9), 1070-1082.
Moses, F.M. (1990) The effect of exercise on the gastrointestinal tract. Sports Medicine, 9 (3),
159-172.
Nadel, E.R., Wenger, C.B., Roberts, M.F., Stolwijk, J.A. and Cafarelli, E. (1977) Physiological
defenses against hyperthermia of exercise. Annals of the New York Academy of Sciences, 301,
98-109.
Newsholme, P., Lima, M.M., Procopio, J., Pithon-Curi, T.C., Doi, S.Q., Bazotte, R.B. and Curi,
R. (2003) Glutamine and glutamate as vital metabolites. Brazilian Journal of Medical and
Biological Research, 36 (2), 153-163.
Ng, Q.Y., Lee, K.W., Byrne, C., Ho, T.F. and Lim, C.L. (2008) Plasma endotoxin and immune
responses during a 21-km road race under a warm and humid environment. Annals of the
Academy of Medicine, Singapore, 37 (4), 307-314.
Nikolaidis, P.T. and Knechtle, B. (2018) Performance in 100-km ultra-marathoners - At which
age it reaches its peak? Journal of Strength and Conditioning Research.
Ogden, H.B., Child, R.B., Fallowfield, J.L., Delves, S.K., Westwood, C.S. and Layden, J.D.
(2020) The Gastrointestinal Exertional Heat Stroke Paradigm: Pathophysiology, Assessment,
Severity, Aetiology and Nutritional Countermeasures. Nutrients, 12 (2).
Ogoh, S., Sato, K., Okazaki, K., Miyamoto, T., Hirasawa, A., Morimoto, K. and Shibasaki, M.
(2013) Blood flow distribution during heat stress: cerebral and systemic blood flow. Journal
of Cerebral Blood Flow and Metabolism, 33 (12), 1915-1920.
Otte, J.A., Geelkerken, R.H., Oostveen, E., Mensink, P.B., Huisman, A.B. and Kolkman, J.J.
(2005) Clinical impact of gastric exercise tonometry on diagnosis and management of chronic
gastrointestinal ischemia. Clinical Gastroenterology and Hepatology, 3 (7), 660-666.
Otte, J.A., Oostveen, E., Geelkerken, R.H., Groeneveld, A.B. and Kolkman, J.J. (2001)
Exercise induces gastric ischemia in healthy volunteers: a tonometry study. J Appl Physiol
(1985), 91 (2), 866-871.
Pals, K.L., Chang, R.T., Ryan, A.J. and Gisolfi, C.V. (1997) Effect of running intensity on
intestinal permeability. J Appl Physiol (1985), 82 (2), 571-576.
Pearce, S.C., Mani, V., Weber, T.E., Rhoads, R.P., Patience, J.F., Baumgard, L.H. and Gabler,
N.K. (2013) Heat stress and reduced plane of nutrition decreases intestinal integrity and
function in pigs. Journal of Animal Science, 91 (11), 5183-5193.
Pelsers, M.M., Hermens, W.T. and Glatz, J.F. (2005) Fatty acid-binding proteins as plasma
markers of tissue injury. Clinica Chimica Acta, 352 (1-2), 15-35.

137
Pelsers, M.M., Namiot, Z., Kisielewski, W., Namiot, A., Januszkiewicz, M., Hermens, W.T.
and Glatz, J.F. (2003) Intestinal-type and liver-type fatty acid-binding protein in the intestine.
Tissue distribution and clinical utility. Clinical Biochemistry, 36 (7), 529-535.
Pfeiffer, B., Stellingwerff, T., Hodgson, A.B., Randell, R., Pottgen, K., Res, P. and Jeukendrup,
A.E. (2012) Nutritional intake and gastrointestinal problems during competitive endurance
events. Medicine and Science in Sports and Exercise, 44 (2), 344-351.
Pires, W., Veneroso, C.E., Wanner, S.P., Pacheco, D.A.S., Vaz, G.C., Amorim, F.T., Tonoli,
C., Soares, D.D. and Coimbra, C.C. (2017) Association Between Exercise-Induced
Hyperthermia and Intestinal Permeability: A Systematic Review. Sports Medicine, 47 (7),
1389-1403.
Poeze, M., Solberg, B.C., Greve, J.W. and Ramsay, G. (2003) Gastric PgCO2 and Pg-aCO2
gap are related to D-lactate and not to L-lactate levels in patients with septic shock. Intensive
Care Medicine, 29 (11), 2081-2085.
Poole, D.C., Burnley, M., Vanhatalo, A., Rossiter, H.B. and Jones, A.M. (2016) Critical Power:
An Important Fatigue Threshold in Exercise Physiology. Medicine and Science in Sports and
Exercise, 48 (11), 2320-2334.
Prosser, C., Stelwagen, K., Cummins, R., Guerin, P., Gill, N. and Milne, C. (2004) Reduction
in heat-induced gastrointestinal hyperpermeability in rats by bovine colostrum and goat milk
powders. J Appl Physiol (1985), 96 (2), 650-654.
Pugh, J.N., Fearn, R., Morton, J.P. and Close, G.L. (2017a) Gastrointestinal symptoms in elite
athletes: time to recognise the problem? British Journal of Sports Medicine.
Pugh, J.N., Impey, S.G., Doran, D.A., Fleming, S.C., Morton, J.P. and Close, G.L. (2017b)
Acute high-intensity interval running increases markers of gastrointestinal damage and
permeability but not gastrointestinal symptoms. Applied Physiology, Nutrition, and
Metabolism. Physiologie Appliquée, Nutrition et Métabolisme, 42 (9), 941-947.
Pugh, J.N., Sage, S., Hutson, M., Doran, D.A., Fleming, S.C., Highton, J., Morton, J.P. and
Close, G.L. (2017c) Glutamine supplementation reduces markers of intestinal permeability
during running in the heat in a dose-dependent manner. European Journal of Applied
Physiology, 117 (12), 2569-2577.
Pugh, J.N., Sparks, A.S., Doran, D.A., Fleming, S.C., Langan-Evans, C., Kirk, B., Fearn, R.,
Morton, J.P. and Close, G.L. (2019) Four weeks of probiotic supplementation reduces GI
symptoms during a marathon race. European Journal of Applied Physiology, 119 (7), 1491-
1501.
Qamar, M.I. and Read, A.E. (1987) Effects of exercise on mesenteric blood flow in man. Gut,
28 (5), 583-587.
Rao, R., Baker, R.D. and Baker, S.S. (1999) Inhibition of oxidant-induced barrier disruption
and protein tyrosine phosphorylation in Caco-2 cell monolayers by epidermal growth factor.
Biochemical Pharmacology, 57 (6), 685-695.

138
Rao, R. and Samak, G. (2012) Role of Glutamine in Protection of Intestinal Epithelial Tight
Junctions. Journal of Epithelial Biology & Pharmacology, 5 (Suppl 1-M7), 47-54.
Rehrer, N.J., Goes, E., DuGardeyn, C., Reynaert, H. and DeMeirleir, K. (2005) Effect of
carbohydrate on portal vein blood flow during exercise. International Journal of Sports
Medicine, 26 (3), 171-176.
Rehrer, N.J., Smets, A., Reynaert, H., Goes, E. and De Meirleir, K. (2001) Effect of exercise
on portal vein blood flow in man. Medicine and Science in Sports and Exercise, 33 (9), 1533-
1537.
Rhind, S.G., Gannon, G.A., Shephard, R.J., Buguet, A., Shek, P.N. and Radomski, M.W.
(2004) Cytokine induction during exertional hyperthermia is abolished by core temperature
clamping: neuroendocrine regulatory mechanisms. International Journal of Hyperthermia, 20
(5), 503-516.
Rhoads, R.P., Baumgard, L.H., Suagee, J.K. and Sanders, S.R. (2013) Nutritional interventions
to alleviate the negative consequences of heat stress. Advances in Nutrition, 4 (3), 267-276.
Roberts, M.F., Wenger, C.B., Stolwijk, J.A. and Nadel, E.R. (1977) Skin blood flow and
sweating changes following exercise training and heat acclimation. J Appl Physiol Respir
Environ Exerc Physiol, 43 (1), 133-137.
Rodgers, L.S. and Fanning, A.S. (2011) Regulation of epithelial permeability by the actin
cytoskeleton. Cytoskeleton (Hoboken), 68 (12), 653-660.
Romanovsky, A.A. (2007) Thermoregulation: some concepts have changed. Functional
architecture of the thermoregulatory system. American Journal of Physiology: Regulatory,
Integrative and Comparative Physiology, 292 (1), R37-46.
Rowell, L.B. (1974) Human cardiovascular adjustments to exercise and thermal stress.
Physiological Reviews, 54 (1), 75-159.
Rowell, L.B., Brengelmann, G.L., Blackmon, J.R. and Murray, J.A. (1970) Redistribution of
blood flow during sustained high skin temperature in resting man. Journal of Applied
Physiology, 28 (4), 415-420.
Rowell, L.B., Brengelmann, G.L., Blackmon, J.R., Twiss, R.D. and Kusumi, F. (1968)
Splanchnic blood flow and metabolism in heat-stressed man. Journal of Applied Physiology,
24 (4), 475-484.
Ryan, A.J., Chang, R.T. and Gisolfi, C.V. (1996) Gastrointestinal permeability following
aspirin intake and prolonged running. Medicine and Science in Sports and Exercise, 28 (6),
698-705.
Selkirk, G.A., McLellan, T.M., Wright, H.E. and Rhind, S.G. (2008) Mild endotoxemia, NF-
kappaB translocation, and cytokine increase during exertional heat stress in trained and
untrained individuals. American Journal of Physiology: Regulatory, Integrative and
Comparative Physiology, 295 (2), R611-623.

139
Sequeira, I.R., Lentle, R.G., Kruger, M.C. and Hurst, R.D. (2014) Standardising the lactulose
mannitol test of gut permeability to minimise error and promote comparability. PloS One, 9
(6), e99256.
Sessions, J., Bourbeau, K., Rosinski, M., Szczygiel, T., Nelson, R., Sharma, N. and Zuhl, M.
(2016) Carbohydrate gel ingestion during running in the heat on markers of gastrointestinal
distress. Eur J Sport Sci, 16 (8), 1064-1072.
Seto, C.K., Way, D. and O'Connor, N. (2005) Environmental illness in athletes. Clinics in
Sports Medicine, 24 (3), 695-718, x.
Sheahen, B.L., Fell, J.W., Zadow, E.K., Hartley, T.F. and Kitic, C.M. (2018) Intestinal damage
following short-duration exercise at the same relative intensity is similar in temperate and hot
environments. Applied Physiology, Nutrition, and Metabolism. Physiologie Appliquée,
Nutrition et Métabolisme, 43 (12), 1314-1320.
Shen, L., Weber, C.R., Raleigh, D.R., Yu, D. and Turner, J.R. (2011) Tight junction pore and
leak pathways: a dynamic duo. Annual Review of Physiology, 73, 283-309.
Shi, H., Wu, B., Wan, J., Liu, W. and Su, B. (2015) The role of serum intestinal fatty acid
binding protein levels and D-lactate levels in the diagnosis of acute intestinal ischemia. Clinics
and Research in Hepatology and Gastroenterology, 39 (3), 373-378.
Shing, C.M., Peake, J.M., Lim, C.L., Briskey, D., Walsh, N.P., Fortes, M.B., Ahuja, K.D. and
Vitetta, L. (2014) Effects of probiotics supplementation on gastrointestinal permeability,
inflammation and exercise performance in the heat. European Journal of Applied Physiology,
114 (1), 93-103.
Siegel, R., Mate, J., Brearley, M.B., Watson, G., Nosaka, K. and Laursen, P.B. (2010) Ice slurry
ingestion increases core temperature capacity and running time in the heat. Medicine and
Science in Sports and Exercise, 42 (4), 717-725.
Smetanka, R.D., Lambert, G.P., Murray, R., Eddy, D., Horn, M. and Gisolfi, C.V. (1999)
Intestinal permeability in runners in the 1996 Chicago marathon. International Journal of Sport
Nutrition, 9 (4), 426-433.
Snipe, R.M.J. and Costa, R.J.S. (2018a) Does biological sex impact intestinal epithelial injury,
small intestine permeability, gastrointestinal symptoms and systemic cytokine profile in
response to exertional-heat stress? Journal of Sports Sciences, 36 (24), 2827-2835.
Snipe, R.M.J. and Costa, R.J.S. (2018b) Does the temperature of water ingested during
exertional-heat stress influence gastrointestinal injury, symptoms, and systemic inflammatory
profile? Journal of Science and Medicine in Sport, 21 (8), 771-776.
Snipe, R.M.J., Khoo, A., Kitic, C.M., Gibson, P.R. and Costa, R.J.S. (2017) The impact of
exertional-heat stress on gastrointestinal integrity, gastrointestinal symptoms, systemic
endotoxin and cytokine profile. European Journal of Applied Physiology.

140
Snipe, R.M.J., Khoo, A., Kitic, C.M., Gibson, P.R. and Costa, R.J.S. (2018a) The impact of
exertional-heat stress on gastrointestinal integrity, gastrointestinal symptoms, systemic
endotoxin and cytokine profile. European Journal of Applied Physiology, 118 (2), 389-400.
Snipe, R.M.J., Khoo, A., Kitic, C.M., Gibson, P.R. and Costa, R.J.S. (2018b) The Impact of
Mild Heat Stress During Prolonged Running On Gastrointestinal Integrity, Gastrointestinal
Symptoms, Systemic Endotoxin and Cytokine Profiles. International Journal of Sports
Medicine.
Soares, A.D., Costa, K.A., Wanner, S.P., Santos, R.G., Fernandes, S.O., Martins, F.S., Nicoli,
J.R., Coimbra, C.C. and Cardoso, V.N. (2014) Dietary glutamine prevents the loss of intestinal
barrier function and attenuates the increase in core body temperature induced by acute heat
exposure. British Journal of Nutrition, 112 (10), 1601-1610.
State-Trait Anxiety Inventory (2014). In: Michalos, A. C. (ed.) Encyclopedia of Quality of Life
and Well-Being Research. Dordrecht: Springer Netherlands. pp. 6331-6331.
Stuempfle, K.J. and Hoffman, M.D. (2015) Gastrointestinal distress is common during a 161-
km ultramarathon. Journal of Sports Sciences, 33 (17), 1814-1821.
Sun, D.L., Cen, Y.Y., Li, S.M., Li, W.M., Lu, Q.P. and Xu, P.Y. (2016) Accuracy of the serum
intestinal fatty-acid-binding protein for diagnosis of acute intestinal ischemia: a meta-analysis.
Scientific Reports, 6, 34371.
Sutherland, L.R., Verhoef, M., Wallace, J.L., Van Rosendaal, G., Crutcher, R. and Meddings,
J.B. (1994) A simple, non-invasive marker of gastric damage: sucrose permeability. Lancet,
343 (8904), 998-1000.
ter Steege, R.W., Geelkerken, R.H., Huisman, A.B. and Kolkman, J.J. (2012) Abdominal
symptoms during physical exercise and the role of gastrointestinal ischaemia: a study in 12
symptomatic athletes. British Journal of Sports Medicine, 46 (13), 931-935.
ter Steege, R.W. and Kolkman, J.J. (2012) Review article: the pathophysiology and
management of gastrointestinal symptoms during physical exercise, and the role of splanchnic
blood flow. Alimentary Pharmacology and Therapeutics, 35 (5), 516-528.
ter Steege, R.W., Van der Palen, J. and Kolkman, J.J. (2008) Prevalence of gastrointestinal
complaints in runners competing in a long-distance run: an internet-based observational study
in 1281 subjects. Scandinavian Journal of Gastroenterology, 43 (12), 1477-1482.
Thijssen, D.H., Steendijk, S. and Hopman, M.T. (2009) Blood redistribution during exercise
in subjects with spinal cord injury and controls. Medicine and Science in Sports and Exercise,
41 (6), 1249-1254.
Timmermans, K., Sir, O., Kox, M., Vaneker, M., de Jong, C., Gerretsen, J., Edwards, M.,
Scheffer, G.J. and Pickkers, P. (2015) Circulating iFABP Levels as a marker of intestinal
damage in trauma patients. Shock, 43 (2), 117-120.

141
Tokuda, S. and Yu, A.S.L. (2019) Regulation of Epithelial Cell Functions by the Osmolality
and Hydrostatic Pressure Gradients: A Possible Role of the Tight Junction as a Sensor.
International Journal of Molecular Sciences, 20 (14).
Tortora, G.J. and Derrickson, B. (2017) Principles of anatomy & physiology.
Travis, S. and Menzies, I. (1992) Intestinal permeability: functional assessment and
significance. Clinical Science (London, England: 1979), 82 (5), 471-488.
Tyler, C.J., Reeve, T., Hodges, G.J. and Cheung, S.S. (2016) The Effects of Heat Adaptation
on Physiology, Perception and Exercise Performance in the Heat: A Meta-Analysis. Sports
Medicine, 46 (11), 1699-1724.
Uribarri, J., Oh, M.S. and Carroll, H.J. (1998) D-lactic acidosis. A review of clinical
presentation, biochemical features, and pathophysiologic mechanisms. Medicine (Baltimore),
77 (2), 73-82.
Uzun, O., Turkmen, S., Eryigit, U., Mentese, A., Turkyilmaz, S., Turedi, S., Karahan, S.C. and
Gunduz, A. (2014) Can Intestinal Fatty Acid Binding Protein (I-FABP) Be A Marker in the
Diagnosis of Abdominal Pathology? Turk J Emerg Med, 14 (3), 99-103.
van de Poll, M.C., Derikx, J.P., Buurman, W.A., Peters, W.H., Roelofs, H.M., Wigmore, S.J.
and Dejong, C.H. (2007) Liver manipulation causes hepatocyte injury and precedes systemic
inflammation in patients undergoing liver resection. World J Surg, 31 (10), 2033-2038.
van Nieuwenhoven, M.A., Brouns, F. and Brummer, R.J. (2004) Gastrointestinal profile of
symptomatic athletes at rest and during physical exercise. European Journal of Applied
Physiology, 91 (4), 429-434.
van Nieuwenhoven, M.A., Geerling, B.J., Deutz, N.E., Brouns, F. and Brummer, R.J. (1999)
The sensitivity of the lactulose/rhamnose gut permeability test. European Journal of Clinical
Investigation, 29 (2), 160-165.
van Nieuwenhoven, M.A., Vriens, B.E.P.J., Brummer, R.-J.M. and Brouns, F. (2000) Effect of
dehydration on gastrointestinal function at rest and during exercise in humans. European
Journal of Applied Physiology, 83 (6), 578-584.
van Wijck, K., Lenaerts, K., Grootjans, J., Wijnands, K.A., Poeze, M., van Loon, L.J., Dejong,
C.H. and Buurman, W.A. (2012a) Physiology and pathophysiology of splanchnic
hypoperfusion and intestinal injury during exercise: strategies for evaluation and prevention.
American Journal of Physiology: Gastrointestinal and Liver Physiology, 303 (2), G155-168.
Van Wijck, K., Lenaerts, K., Van Bijnen, A.A., Boonen, B., Van Loon, L.J., Dejong, C.H. and
Buurman, W.A. (2012b) Aggravation of exercise-induced intestinal injury by Ibuprofen in
athletes. Medicine and Science in Sports and Exercise, 44 (12), 2257-2262.
van Wijck, K., Lenaerts, K., van Loon, L.J., Peters, W.H., Buurman, W.A. and Dejong, C.H.
(2011a) Exercise-induced splanchnic hypoperfusion results in gut dysfunction in healthy men.
PloS One, 6 (7), e22366.

142
van Wijck, K., van Eijk, H.M., Buurman, W.A., Dejong, C.H. and Lenaerts, K. (2011b) Novel
analytical approach to a multi-sugar whole gut permeability assay. Journal of
Chromatography. B: Analytical Technologies in the Biomedical and Life Sciences, 879 (26),
2794-2801.
van Wijck, K., Verlinden, T.J., van Eijk, H.M., Dekker, J., Buurman, W.A., Dejong, C.H. and
Lenaerts, K. (2013) Novel multi-sugar assay for site-specific gastrointestinal permeability
analysis: a randomized controlled crossover trial. Clinical Nutrition, 32 (2), 245-251.
Vanhatalo, A., Black, M.I., DiMenna, F.J., Blackwell, J.R., Schmidt, J.F., Thompson, C.,
Wylie, L.J., Mohr, M., Bangsbo, J., Krustrup, P. and Jones, A.M. (2016) The mechanistic bases
of the power-time relationship: muscle metabolic responses and relationships to muscle fibre
type. Journal of Physiology, 594 (15), 4407-4423.
Vanhatalo, A., Jones, A.M. and Burnley, M. (2011) Application of critical power in sport.
International Journal of Sports Physiology and Performance, 6 (1), 128-136.
Vanhatalo, A., Poole, D.C., DiMenna, F.J., Bailey, S.J. and Jones, A.M. (2011) Muscle fiber
recruitment and the slow component of O2 uptake: constant work rate vs. all-out sprint
exercise. American Journal of Physiology: Regulatory, Integrative and Comparative
Physiology, 300 (3), R700-707.
Vargas, N. and Marino, F. (2016) Heat stress, gastrointestinal permeability and interleukin-6
signaling - Implications for exercise performance and fatigue. Temperature (Austin), 3 (2),
240-251.
Vojdani, A. (2013) For the assessment of intestinal permeability, size matters. Alternative
Therapies in Health and Medicine, 19 (1), 12-24.
Walter, E.J. and Carraretto, M. (2016) The neurological and cognitive consequences of
hyperthermia. Critical Care (London, England), 20 (1), 199.
Wang, L., Llorente, C., Hartmann, P., Yang, A.M., Chen, P. and Schnabl, B. (2015) Methods
to determine intestinal permeability and bacterial translocation during liver disease. Journal of
Immunological Methods, 421, 44-53.
Ward, J.B., Keely, S.J. and Keely, S.J. (2014) Oxygen in the regulation of intestinal epithelial
transport. Journal of Physiology, 592 (12), 2473-2489.
Wells, J.M., Brummer, R.J., Derrien, M., MacDonald, T.T., Troost, F., Cani, P.D., Theodorou,
V., Dekker, J., Meheust, A., de Vos, W.M., Mercenier, A., Nauta, A. and Garcia-Rodenas, C.L.
(2017) Homeostasis of the gut barrier and potential biomarkers. American Journal of
Physiology: Gastrointestinal and Liver Physiology, 312 (3), G171-G193.
Wilcock, I.M., Cronin, J.B. and Hing, W.A. (2006) Physiological response to water immersion:
a method for sport recovery? Sports Medicine, 36 (9), 747-765.
Wilson, P.B. (2017) Perceived life stress and anxiety correlate with chronic gastrointestinal
symptoms in runners. Journal of Sports Sciences, 1-7.

143
Wilson, P.B. (2019) 'I think I'm gonna hurl': A Narrative Review of the Causes of Nausea and
Vomiting in Sport. Sports (Basel), 7 (7).
Wolfrum, C., Borrmann, C.M., Borchers, T. and Spener, F. (2001) Fatty acids and
hypolipidemic drugs regulate peroxisome proliferator-activated receptors alpha - and gamma-
mediated gene expression via liver fatty acid binding protein: a signaling path to the nucleus.
Proceedings of the National Academy of Sciences of the United States of America, 98 (5), 2323-
2328.
Wu, Q.J., Liu, N., Wu, X.H., Wang, G.Y. and Lin, L. (2018) Glutamine alleviates heat stress-
induced impairment of intestinal morphology, intestinal inflammatory response, and barrier
integrity in broilers. Poultry Science, 97 (8), 2675-2683.
Yang, P.C., He, S.H. and Zheng, P.Y. (2007) Investigation into the signal transduction pathway
via which heat stress impairs intestinal epithelial barrier function. Journal of Gastroenterology
and Hepatology, 22 (11), 1823-1831.
Yeh, Y.J., Law, L.Y. and Lim, C.L. (2013) Gastrointestinal response and endotoxemia during
intense exercise in hot and cool environments. European Journal of Applied Physiology, 113
(6), 1575-1583.
Zhang, L., Fan, X., Zhong, Z., Xu, G. and Shen, J. (2015) Association of plasma diamine
oxidase and intestinal fatty acid-binding protein with severity of disease in patient with heat
stroke. American Journal of Emergency Medicine, 33 (7), 867-871.
Zuhl, M., Dokladny, K., Mermier, C., Schneider, S., Salgado, R. and Moseley, P. (2015) The
effects of acute oral glutamine supplementation on exercise-induced gastrointestinal
permeability and heat shock protein expression in peripheral blood mononuclear cells. Cell
Stress and Chaperones, 20 (1), 85-93.
Zuhl, M., Schneider, S., Lanphere, K., Conn, C., Dokladny, K. and Moseley, P. (2014a)
Exercise regulation of intestinal tight junction proteins. British Journal of Sports Medicine, 48
(12), 980-986.
Zuhl, M.N., Lanphere, K.R., Kravitz, L., Mermier, C.M., Schneider, S., Dokladny, K. and
Moseley, P.L. (2014b) Effects of oral glutamine supplementation on exercise-induced
gastrointestinal permeability and tight junction protein expression. J Appl Physiol (1985), 116
(2), 183-191.

144
Appendix 1
1.1 Adapted GI symptom questionnaire
Gastrointestinal Screening Questionnaire
Below are a series of scales 0-10 regarding symptoms of gastrointestinal upsets. Please indicate on
each scale whether you have any symptom of the stated condition during or after training over the last
6 weeks. No symptoms is 0 and 10 is extreme symptoms.
Side
Stitch
Nausea
Bloating
Urge to
burp
Urge to
vomit

145
Urge to
defecate
Diarrhoea
Flatuation
Stomach
Cramps
Stomach
Upsets

146
1.2 State-Trait Anxiety Inventory questionnaire
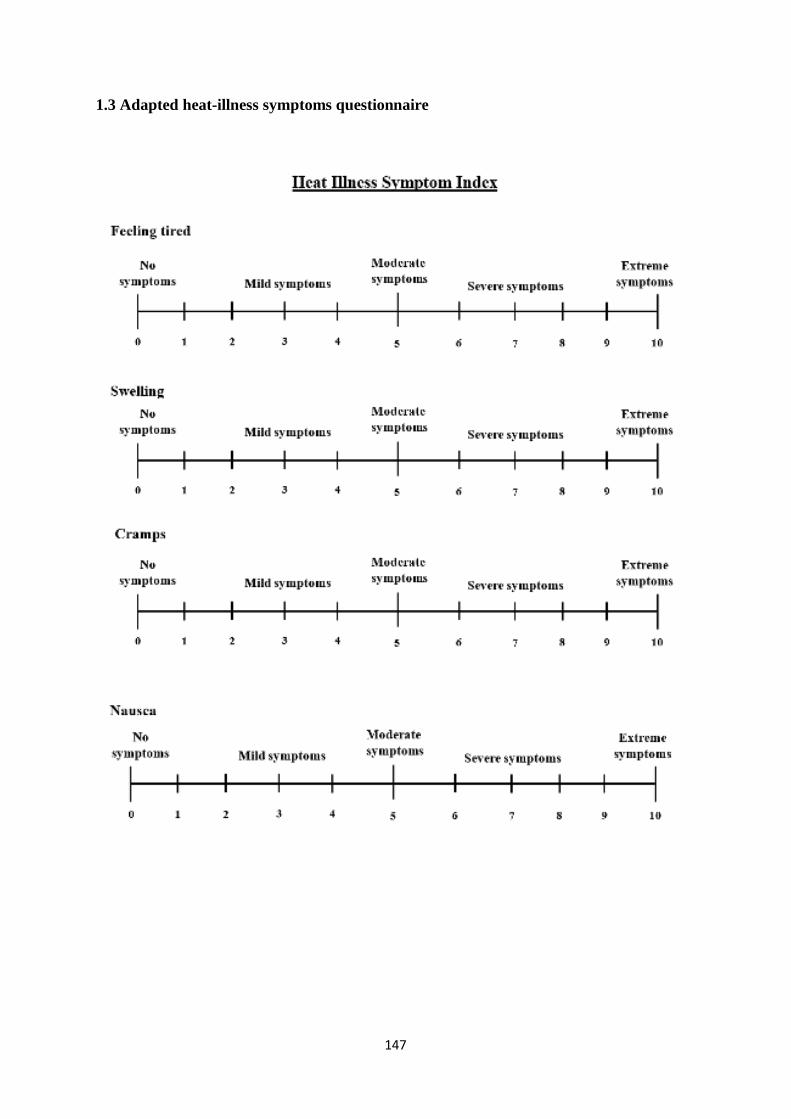
147
1.3 Adapted heat-illness symptoms questionnaire

148

149


![Malignant hyperthermia [final]](https://img.pdfslide.us/doc/110x75/58ceb1b71a28abb2218b5123/malignant-hyperthermia-final.jpg)