Embed Size (px)
Citation preview

The Journal of Neuroscience, May 1987, 7(5): 1327-l 339
Effects of Early Unilateral Blur on the Macaque’s Visual System. II. Anatomical Observations
Anita E. Hendrickson,lB2 J. Anthony Movshon, 4 Howard M. Eggers,5 Martin S. Gizzi,4,a Ronald G. Boothe,3,b and Lynne Kiorpes3zc
Departments of ‘Biological Structure, 20phthalmology, and 3Psychology, University of Washington, Seattle, Washington 98195; 4Department of Psychology, New York University, New York, New York 10003; and 5Harkness Eye Institute, College of Physicians and Surgeons, Columbia University, New York, New York 10036
We studied the effects of early unilateral blur on the ana- tomical organization of the visual pathways in 8 macaque monkeys. Blur was induced in one eye, beginning 2-14 d af- ter birth, by 0.5% atropine twice a day. Atropiniration was stopped at 6-8 months of age, and the animals were studied for anatomy 3-24 months later. The retina and all other eye tissues showed normal histology. In the dorsal lateral ge- niculate nucleus (LGN), cells in parvocellular layers receiv- ing input from the atropine-treated eye were 9-32% smaller and were more lightly stained than those in layers innervated by the untreated eye. These changes were generally larger in the LGN ipsilateral to the treated eye. LGN cell size changes were absent or much smaller in the magnocellular layers. In the striate cortex, the distribution of the oxidative enzyme cytochrome oxidase (CO) was markedly altered in layer 4C@. Layer 4Ca is uniformly stained in normal animals, but showed a distinct pattern of alternating high and low CO bands in the atropine-treated animals; the bands of higher CO activity were narrower than the bands of lower activity and had a 857-l 050 pm repeat. Fainter banding was seen in layers 4A, 4Ca, and 6, but the density of the rows of dark CO-stained dots in layer 3 was unaffected. Double-labeling revealed that the narrow dark CO bands were associated with the centers of the ocular dominance columns devoted to the atropine- treated eye. The distribution of 14C-2-deoxyglucose uptake in visual cortex produced by 4.5-9 cldeg spatial frequency stimulation was strongly biased toward the untreated eye. The treated eye could, however, elicit reasonably strong uptake when stimulated with patterns containing lower spa- tial frequencies. These results suggest that unilateral neo-
Received Apr. 21, 1986; revised Dec. 5, 1986; accepted Dec. 5, 1986.
This research was supported by NIH Grants EY01208, EY04536, EY01730, EY02017, EY02536, RRO0166, and HD02274. A.E.H. is the recipient ofa Dolly Green Scholar Award from Research to Prevent Blindness, Inc. J.A.M. held g Research Career Development Award from NIH (EYO0187). M.S.G. was partly supported by a grant from the New York State Health Research Council. We are grateful for the critical suggestions of Dr. Helen Sherk, the excellent technical assistance of Bente Noble, Bradley Clifton, Ronald Jones, and Mark Hartley, and for the cooperation of United Airlines.
Correspondence should be addressed to Dr. J. A. Movshon, Department of Psychology, New York University, 6 Washington Place, New York, NY 10003.
= Present address: Department of Neurology, Mount Sinai Medical School, New York, NY 10036.
b Present address: Department of Psychology, Emory University, Atlanta, GA 30322.
c Present address: Department of Psychology, New York University, New York, NY 10003. Copyright 0 1987 Society for Neuroscience 0270-6474/87/051327-13$02.00/O
natal blur preferentially affects the parvocellular layers of the LGN and layer 4Cfl of striate cortex, which are the por- tions of the central visual system associated with the pro- cessing of information concerning fine spatial detail. These anatomical changes are consistent with the high spatial fre- quency loss of vision demonstrated behaviorally and elec- trophysiologically in the atropine eye-driven visual system of these same animals.
Amblyopia is a loss of visual function that is not due to optical abnormalities or peripheral pathology. The visual losses seen in monocularly lid-sutured monkeys represent this condition in a particularly severe form. Among the most striking changes that occur in the primate visual system following early eyelid suture are anatomical alterations in the dorsal lateral geniculate nucleus (LGN) and striate cortex. Cell size and basophilic stain- ing are markedly reduced in all LGN layers containing ganglion cell terminals from the retina of the deprived eye (von Noorden et al., 1970; von Noorden and Middleditch, 1975b; Hubel et al., 1977; GareyandVital-Durand, 1981; Headon et al., 1985b). When the projections of LGN cells are studied, their axon dis- tribution in striate cortex is seen to be contracted, while the axons from cells in LGN layers driven by the normal eye are expanded in a complementary fashion (Hubel et al., 1977; LeVay et al., 1980; Swindale et al., 198 1). Bands of LGN input in striate layer 4C are the anatomical representation of the ocular dominance columns (Hubel and Wiesel, 1968), each of which is 350-500 pm wide in a normal monkey (Hubel and Wiesel, 1972; Hendrickson et al., 1978). In a lid-sutured monkey, the open eye expands its territory so that its axons occupy 60-90% of layer 4C; closures within the first week after birth cause larger changes than closures at 8- 10 weeks, near the end of the critical period (Hubel et al., 1977; LeVay et al., 1980; Swindale et al., 1981). This change in LGN synaptic input within layer 4C is accompanied by a loss of functional connections from the lid- sutured eye throughout the visual cortex (Hubel et al., 1977; LeVay et al., 1980; Blakemore et al., 1981) and also by a pro- found behavioral loss of vision in this eye (von Noorden et al., 1970; von Noorden, 1973; Hendrickson et al., 1977; Harwerth et al., 198 1).
In humans, amblyopia is often caused by early visual expe- rience with a blurred retinal image in one eye due to refractive imbalance (anisometropia). This situation is not as drastic in its visual effects as lid suture in monkeys, although rare occur- rences of total lid closure in human infants (von Noorden, 1973)
1328 Hendrickson et al. - Anatomical Effects of Early Unilateral Blur
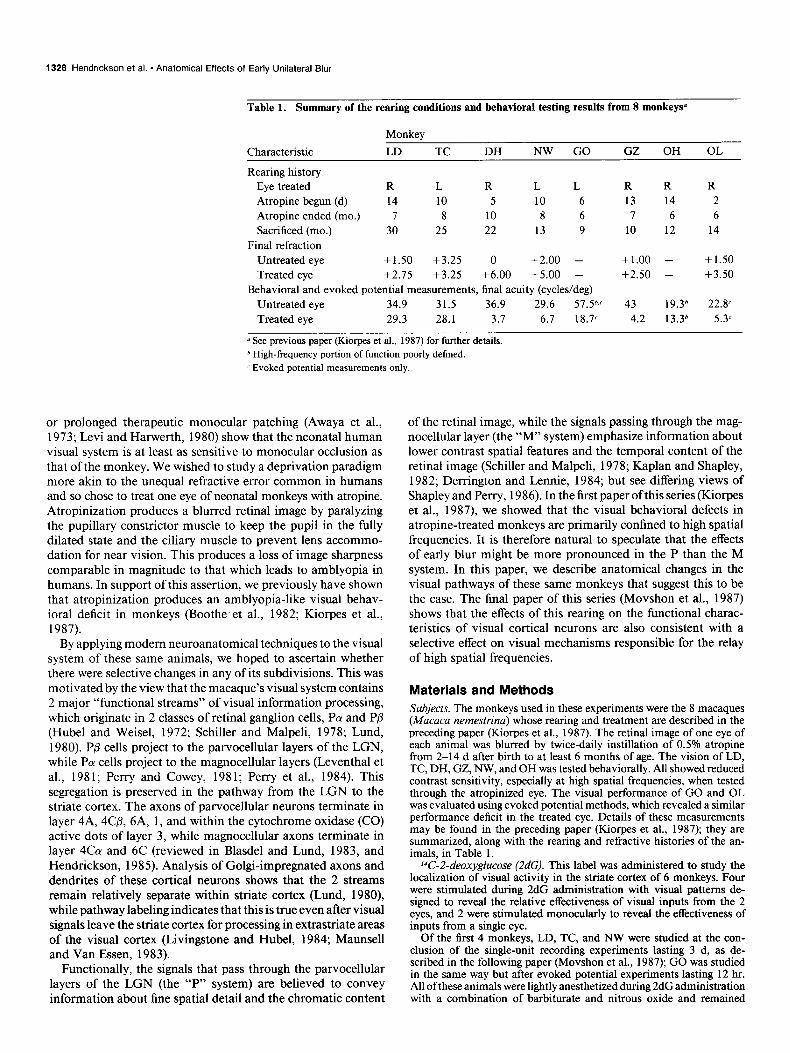
Table 1. Summary of the rearing conditions and behavioral testing results from 8 monkeysa
Characteristic
Monkey
LD TC DH NW GO GZ OH OL
Rearing history Eye treated R L R L L Atropine begun (d) 14 10 5 10 6 Atropine ended (mo.) I 8 10 8 6 Sacrificed (mo.) 30 25 22 13 9
Final refraction Untreated eye +1.50 +3.25 0 +2.00 - Treated eye +2.15 +3.25 +6.00 +5.00 -
Behavioral and evoked potential measurements, final acuity (cycles/deg) Untreated eye 34.9 31.5 36.9 29.6 51.5b.C Treated eye 29.3 28.1 3.7 6.7 18.7c
R R R 13 14 2 7 6 6
10 12 14
+1.00 - + 1.50 +2.50 - +3.50
43 19.36 22.8’ 4.2 13.36 5.3
y See previous paper (Kiorpes et al., 1987) for further details. h High-frequency portion of function poorly defined. c Evoked potential measurements only.
or prolonged therapeutic monocular patching (Awaya et al., 1973; Levi and Harwerth, 1980) show that the neonatal human visual system is at least as sensitive to monocular occlusion as that of the monkey. We wished to study a deprivation paradigm more akin to the unequal refractive error common in humans and so chose to treat one eye of neonatal monkeys with atropine. Atropinization produces a blurred retinal image by paralyzing the pupillary constrictor muscle to keep the pupil in the fully dilated state and the ciliary muscle to prevent lens accommo- dation for near vision. This produces a loss of image sharpness comparable in magnitude to that which leads to amblyopia in humans. In support of this assertion, we previously have shown that atropinization produces an amblyopia-like visual behav- ioral deficit in monkeys (Boothe et al., 1982; Kiorpes et al., 1987).
By applying modem neuroanatomical techniques to the visual system of these same animals, we hoped to ascertain whether there were selective changes in any of its subdivisions. This was motivated by the view that the macaque’s visual system contains 2 major “functional streams” of visual information processing, which originate in 2 classes of retinal ganglion cells, Pot and P@ (Hubel and Weisel, 1972; Schiller and Malpeli, 1978; Lund, 1980). Pp cells project to the parvocellular layers of the LGN, while Pa cells project to the magnocellular layers (Leventhal et al., 1981; Perry and Cowey, 1981; Perry et al., 1984). This segregation is preserved in the pathway from the LGN to the striate cortex. The axons of parvocellular neurons terminate in layer 4A, 4Cp, 6A, 1, and within the cytochrome oxidase (CO) active dots of layer 3, while magnoceilular axons terminate in layer 4Ca and 6C (reviewed in Blasdel and Lund, 1983, and Hendrickson, 1985). Analysis of Golgi-impregnated axons and dendrites of these cortical neurons shows that the 2 streams remain relatively separate within striate cortex (Lund, 1980), while pathway labeling indicates that this is true even after visual signals leave the striate cortex for processing in extrastriate areas of the visual cortex (Livingstone and Hubel, 1984; Maunsell and Van Essen, 1983).
Functionally, the signals that pass through the parvocellular layers of the LGN (the “I”’ system) are believed to convey information about fine spatial detail and the chromatic content
of the retinal image, while the signals passing through the mag- nocellular layer (the “M” system) emphasize information about lower contrast spatial features and the temporal content of the retinal image (Schiller and Malpeli, 1978; Kaplan and Shapley, 1982; Derrington and Lennie, 1984; but see differing views of Shapley and Perry, 1986). In the first paper of this series (Kiorpes et al., 1987), we showed that the visual behavioral defects in atropine-treated monkeys are primarily confined to high spatial frequencies. It is therefore natural to speculate that the effects of early blur might be more pronounced in the P than the M system. In this paper, we describe anatomical changes in the visual pathways of these same monkeys that suggest this to be the case. The final paper of this series (Movshon et al., 1987) shows that the effects of this rearing on the functional charac- teristics of visual cortical neurons are also consistent with a selective effect on visual mechanisms responsible for the relay of high spatial frequencies.
Materials and Methods Subjects. The monkeys used in these experiments were the 8 macaques (Mucaca nemestrina) whose rearing and treatment are described in the preceding paper (Kiorpes et al., 1987). The retinal image of one eye of each animal was blurred by twice-daily instillation of 0.5% atropine from 2-14 d after birth to at least 6 months of age. The vision of LD, TC, DH, GZ, NW, and OH was tested behaviorally. All showed reduced contrast sensitivity, especially at high spatial frequencies, when tested through the atropinized eye. The visual performance of GO and OL was evaluated using evoked potential methods, which revealed a similar performance deficit in the treated eye. Details of these measurements may be found in the preceding paper (Kiorpes et al., 1987); they are summarized, along with the rearing and refractive histories of the an- imals, in Table 1.
T-2-deoxyglucose (2dG). This label was administered to study the localization of visual activity in the striate cortex of 6 monkeys. Four were stimulated during 2dG administration with visual patterns de- signed to reveal the relative effectiveness of visual inputs from the 2 eyes, and 2 were stimulated monocularly to reveal the effectiveness of inputs from a single eye.
Of the first 4 monkeys, LD, TC, and NW were studied at the con- clusion of the single-unit recording experiments lasting 3 d, as de- scribed in the following paper (Movshon et al., 1987); GO was studied in the same way but after evoked potential experiments lasting 12 hr. All of these animals were lightly anesthetized during 2dG administration with a combination of barbiturate and nitrous oxide and remained
The Journal of Neuroscience, May 1987, 7(5) 1329
paralyzed throughout the visual presentation. The visual stimulus was arranged so that each nasal retina (temporal visual field) was stimulated by 1 of 2 identical CRT screens that subtended 12” at the monkey’s eye and had a mean luminance of 40 cd/m* (P31 phosphor). Sinusoidal grating targets were generated by the same PDP 1 l/34 computer system used in the electrophysiological experiments described in the following paper (Movshon et al., 1987) and were always the same on both screens. Because only the nasal, contralaterally projecting portion of the retina of each eye was stimulated, each visual cortex was activated only by one eye, allowing a direct within-animal comparison of cortical 2dG uptake. Matching loci in each visual cortex thus contained 2dG uptake initiated by neural activity in either the treated or untreated eye.
To ensure that small errors of alignment did not produce binocular stimulation across the vertical meridian, we centered the CRT screens on the horizontal meridian and masked them so that a strip 4” wide centered on the vertical meridian remained unstimulated. This config- uration stimulated a roughly circular region of the visual field between 2” and 14 o from the fovea, which is represented on the opercular and dorsal calcarine surface of striate cortex (Van Essen et al., 1984). The stimulus consisted of moving sinusoidal gratings of moderately high spatial frequency and contrast. In the absence of behavioral data on the visual resolution of macaques in the paracentral visual field, we assumed that resolution and contrast sensitivity fall with eccentricity approxi- mately according to the relationships found by Robson and Graham (198 1) for human observers. The spatial frequency ranges chosen were within 2 octaves of the presumed resolution limit for macaques in the stimulated portion of the visual field. The spatial frequencies used for LD were 6-9 cvcles (cl/dea: for TC. NW. and GO thev were 4.5-6 c/dea: in all cases contrast‘was iz excess ‘of 0.7. Six spatial-frequencies withg the selected range were presented for 10 set intervals in a pseudorandom sequence. Each new stimulus moved in a randomly chosen direction and was oriented orthogonal to that direction. The drift rate was ran- domly selected for each stimulus to be 1, 2, 4, or 8 Hz, which covers the range of optima for cortical neurons observed under identical stim- ulus conditions for single neurons in macaque striate cortex (Newsome et al., 1983). Over the 45 min of stimulation, 270 different stimuli were shown, covering the selected spatial frequencies and a full range of orientations, directions, and speeds of motion.
The other monkeys OH and GZ were stimulated monocularly during 2dG administration using a regimen designed to produce maximum label caused by all aspects of complex visual stimuli (Hendrickson and Wilson, 1979). The monkey was sedated with ketamine and restrained in a holding box; the lids of the treated (GZ) or untreated (OH) eye were sutured shut, anesthetized with lidocaine ointment, and covered with black tape. The animal was allowed to become fully alert before the experiment was begun. During 2dG infusion the monkey viewed a brightly lit large board subtending 40” x 60” that was covered with black-and-white and colored patterns containing all orientations and a wide range of spatial frequencies. The board was slowly moved back and forth horizontally during the stimulation period. In this arrange- ment, both cortices would contain labeling patterns caused only by the open eye.
Once the animal was positioned and the stimulus sequence begun, approximately 250 &i/kg of 14C-2dG in 5 cc of sterile saline was injected intravenously over 2 min. The stimulus was continued for 45 min; then the monkey was given a lethal intravenous dose of barbituate and im- mediately perfused intravascularly with 1 liter of 4% paraformaldehyde in 0.05 M phosphate buffer, pH 7.6. The brain was quickly removed and the opercular striate cortex cut into blocks of known orientation, which were frozen in Freon chilled in liquid nitrogen.
2dG autoradiography and CO staining. Electrophysiological record- ings, when they were done, were confined to the regions of the cortex representing the central 2” of the visual field, and this tissue was reserved for reconstructions of the electrode tracks. Blocks of the remaining striate cortex representing the visual field between 2” and 14” from the fovea were sectioned either perpendicular to the long axis of the ocular dominance columns or tangentially to the cortical surface. Frozen sec- tions were cut serially at 25 pm in a cryostat. Two serial sections were placed on a coverslip and rapidly dried on a 50°C hotplate. The third section in the series was stained for CO using a method slightly modified from Wong-Riley (1979). Coverslips were placed on posterboard in X-ray cassettes and a sheet of DuPont mammography film laid over them, emulsion side facing the sections, in complete darkness. Films were exposed for 1 O-28 d and then developed in complete darkness in Kodak X-ray developer for 5 min, fixed in Kodak Rapid Fix for 5 min,
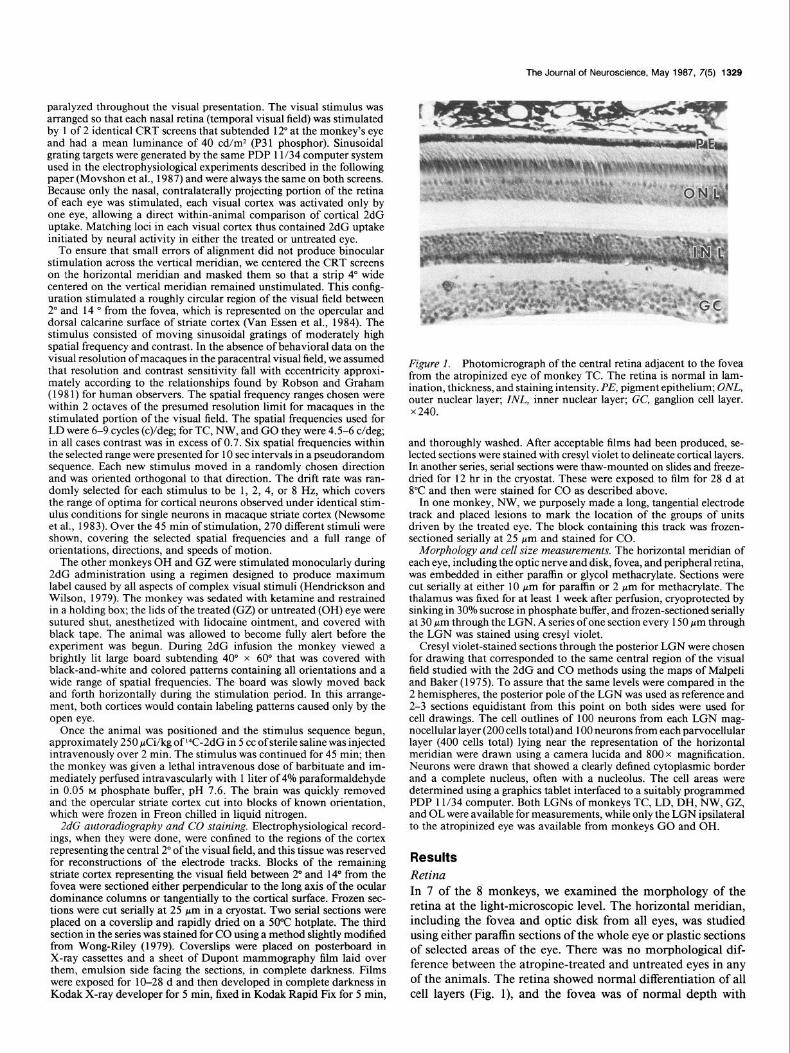
Figure 1. Photomicrograph of the central retina adjacent to the fovea from the atropinized eye of monkey TC. The retina is normal in lam- ination, thickness, and staining intensity. PE, pigment epithelium; ONL, outer nuclear layer; ZNL, inner nuclear layer; GC, ganglion cell layer. x 240.
and thoroughly washed. After acceptable films had been produced, se- lected sections were stained with cresyl violet to delineate cortical layers. In another series, serial sections were thaw-mounted on slides and freeze- dried for 12 hr in the cryostat. These were exposed to film for 28 d at 8°C and then were stained for CO as described above.
In one monkey, NW, we purposely made a long, tangential electrode track and placed lesions to mark the location of the groups of units driven by the treated eye. The block containing this track was frozen- sectioned serially at 25 pm and stained for CO.
Morphology and cell size measurements. The horizontal meridian of each eye, including the optic nerve and disk, fovea, and peripheral retina, was embedded in either paraffin or glycol methacrylate. Sections were cut serially at either 10 pm for paraffin or 2 pm for methacrylate. The thalamus was fixed for at least 1 week after perfusion, cryoprotected by sinking in 30% sucrose in phosphate buffer, and frozen-sectioned serially at 30 pm through the LGN. A series of one section every 150 pm through the LGN was stained using cresyl violet.
Cresyl violet-stained sections through the posterior LGN were chosen for drawing that corresponded to the same central region of the visual field studied with the 2dG and CO methods using the maps of Malpeli and Baker (1975). To assure that the same levels were compared in the 2 hemispheres, the posterior pole of the LGN was used as reference and 2-3 sections equidistant from this point on both sides were used for cell drawings. The cell outlines of 100 neurons from each LGN mag- nocellular layer (200 cells total) and 100 neurons from each parvocellular layer (400 cells total) lying near the representation of the horizontal meridian were drawn using a camera lucida and 800 x magnification. Neurons were drawn that showed a clearly defined cytoplasmic border and a complete nucleus, often with a nucleolus. The cell areas were determined using a graphics tablet interfaced to a suitably programmed PDP 1 l/34 computer. Both LGNs of monkeys TC, LD, DH, NW, GZ, and OL were available for measurements. while onlv the LGN iusilateral to the atropinized eye was available from monkeys GO and OH.
Results Retina In 7 of the 8 monkeys, we examined the morphology of the retina at the light-microscopic level. The horizontal meridian, including the fovea and optic disk from all eyes, was studied using either paraffin sections of the whole eye or plastic sections of selected areas of the eye. There was no morphological dif- ference between the atropine-treated and untreated eyes in any of the animals. The retina showed normal differentiation of all cell layers (Fig. l), and the fovea was of normal depth with

1330 Hendrickson et al. * Anatomical Effects of Early Unilateral Blur
Figure 2. Low-power photomicrographs of the dorsal lateral geniculate nuclei (LGN) from monkey DH (A, B) and NW (C, D). A and D are from the LGN ipsilateral to the atropinized eye. Note that the ipsilateral parvocellular layers 3 and 5, which receive input from the atropinized eye, are paler staining that the contralateral layers 4 and 6 receiving input from the untreated eye. The staining density of the parvocellular layers 4 and 6 receiving contralateral axons from the atropinized eye (B, C) and all magnocellular layers are less obviously affected. x 12. E and F. Higher-power view of the parvocellular (I?) and magnocellular (8) layers from the LGN of DH, ipsilateral to the atropinized eye. There is a pronounced difference in staining intensity and size between un- treated-input layer 6 and atropinized-input layer 5, but atropinized- input layer 2 appears quite normal. x 140.
typical thin, elongated cones. The pigment epithelium, iris, and ciliary body were well pigmented, while the cornea was of nor- mal thickness and cellular organization.
Cell size changes in the LGN In the light microscope at low power it was possible to distin- guish between the staining intensity of parvocellular layers re-
ceiving axons from the treated and untreated eye, especially on the side ipsilateral to the atropine-treated eye (Fig. 24-D). At higher power it could be seen that the neurons in the parvo- cellular layers innervated by the atropinized eye were both smaller and markedly reduced in basophilic staining (Fig. 2E). There was little obvious difference between magnocellular layers in either size or staining in most animals (Fig. 2F).
We measured neuronal cell size in both LGNs of 6 animals (LD, TC, DH, NW, GZ, and OL) and in the LGN ipsilateral to the atropinized eye of GO and OH. All sections used for mea- surement were from the portion of the nucleus representing the central 15” of the visual field (Malpeli and Baker, 1975) and were matched to be from the same LGN level for right and left sides of the same animal. Figure 3 shows these data in histogram form; the open bars represent data from the atropine-treated monkeys and the filled bars data from 2 normally reared ani- mals. Each bar represents the percentage difference in mean cell area between cells in adjacent magnocellular or parvocellular laminae. For comparison, mean cell areas of ipsilateral parvo- cellular layers 3 and 5 were averaged, as were data from con- tralateral parvocellular layers 4 and 6. Mean cell areas were directly compared for magnocellular ipsilateral layer 2 and con- tralateral layer 1. The upward direction represents instances in which cells in untreated eye layers (U) are larger than cells in atropine-treated eye (A) layers.
In the 2 normally-reared l-year-old monkeys (Hendrickson et al., 1975), average cell size does not differ by more than 4% between contra- and ipsilaterally innervated parvocellular lay- ers, in agreement with other data on normal macaque LGN (von Noorden and Middleditch, 1975a; Headon et al., 198 1). In the LGN ipsilateral to the atropinized eye, in all atropine-treated monkeys there is a consistent difference between parvocellular layers (Fig. 3, upper right), with the treated-eye neurons being 1 l-3 1% smaller than untreated-eye neurons. In the LGN con- tralateral to the treated eye (Fig. 3, upper left) in TC and OL the size difference between parvocellular layers is in the same range as in the normal monkeys. In LD and NW, there is a larger difference, but the ipsilaterally innervated layers still are more affected than the contralateral layers. In DH and GZ the difference is large and about equal on the 2 sides.
The cell-size changes in the magnocellular layers are less con- sistent (Fig. 3, lower half). In normal monkeys we find that ipsilaterally innervated layer 2 can be up to 7% larger than contralaterally innervated layer 1 (also see von Noorden and Middleditch, 1975a; Headon et al., 198 1). Thus, in the contra- lateral LGN of our experimental monkeys, cells in layer 2 that are innervated by the treated eye should be slightly larger than cells in layer 1; this is true for monkeys OL, TC, LD, GZ, and NW (Fig. 3). In DH, however, cells in the untreated layer 2 were 23% larger. In magnocellular layers ipsilateral to the atropine eye, although layer 2 is supplied by the treated eye, the cells were slightly larger than those of layer 1 in TC, GZ, and DH, suggesting a normal size relationship. Layer 2 cells were, 14% larger in LD, while in NW, layer 2 cells were 13% smaller., This method of comparison indicates that, with the possible excep- tion of DH, LD, and NW, cell size in the parvocellular layers was consistently affected by blur, while cell size in the magno- cellular layers was not.
Another means of comparison is to pair the same layers from both nuclei, for instance, to compare cell sizes in layer 6 that would receive crossed nasal ganglion cell axons from the atro- pine-treated eye in one hemisphere and from the untreated eye

The Journal of Neuroscience, May 1987, 7(5) 1331
LGN Contralateral to Atropinized Eye
(.. PARVOCELLULAR LAYERS..,
I Normal
LGN Ipsilaterol to Atropinized Eye
“’ PARVOCELLULAR LAYERS-
:: 30 25
... MAGNOCELLULAR LAYERS .(. ..-MAGNOCELLULAR LAYERS...
s 4 2o 20-
h
3 IO- 10 -
0 +* :.>::... ::...::.
o.,- m - Yy .:y:.:
: lo- IO-
a 20 -GO OH OL TC LD NW GZ DH Nl N2 20- GO OH OL TC LD NW GZ DH Nl N2
Figure 3. Graphic representation of cell-size changes in LGN following early postnatal atropine treatment of 1 eye. The percentage difference in mean cell area is shown for all animals. For comparison the mean cell areas of contralateral parvocellular layers 4 and 6 and ipsilateral parvocellular layers 3 and 5 were averaged. The percentage difference for the parvocellular layers from the atropine-treated animals (stippled bars) is shown for the LGN contralateral (upper left) or ipsilateral (upper right) to the atropine-treated eye. The percentage difference from the atropine-treated monkeys (stippled bars) in magnocellular mean cell area between contralateral layer 1 and ipsilateral layer 2 is shown for the LGN contralateral (lower left) and ipsilateral (lower right) to the atropine-treated eye. The percentage differences between the same layers in normal monkeys are shown in black bars. Upward deflections indicate that cells in layers receiving axons from the atropine-treated (A) eye are smaller than cells receiving input from the untreated (U) eye; downward deflections are the reverse. All animals showed a marked difference between parvocellular layers on the ipsilateral side, and most showed a similar but smaller difference on the contralateral side. The magnocellular layers showed no consistent direction of change.
in the other. This approach eliminates the cell-size bias in the magnocellular layers, which complicates the intrageniculate comparison of Figure 3. The results of this method applied to monkeys TC, NW, LD, GZ, DH, and OL are presented in Table 2. These data are in overall agreement with the intrageniculate comparison, in that in most animals both ipsilateral and con- tralateral parvocellular layers show a statistically significant size difference with the treated eye layers always having the smaller cells. The contralateral side of TC had size changes of borderline significance, in agreement with the intrageniculate comparison. OL had a small but significant difference only on the contra- lateral side, in contrast to all of the other monkeys. On the other hand, this method of comparison provides more clear evidence that the magnocellular layers are less affected than the parvo- cellular layers by the atropine rearing. In ipsilateral layer 2, only DH showed a highly significant 12% difference, while TC, GZ, and NW showed a less significant S-7% size change; in these monkeys the layer 2 cells receiving axons from the atropine- treated eye were the smaller. For contralateral layer 1, only NW showed a significant change, again with the atropine-treated layer cells being 11% smaller.
Striate cortex
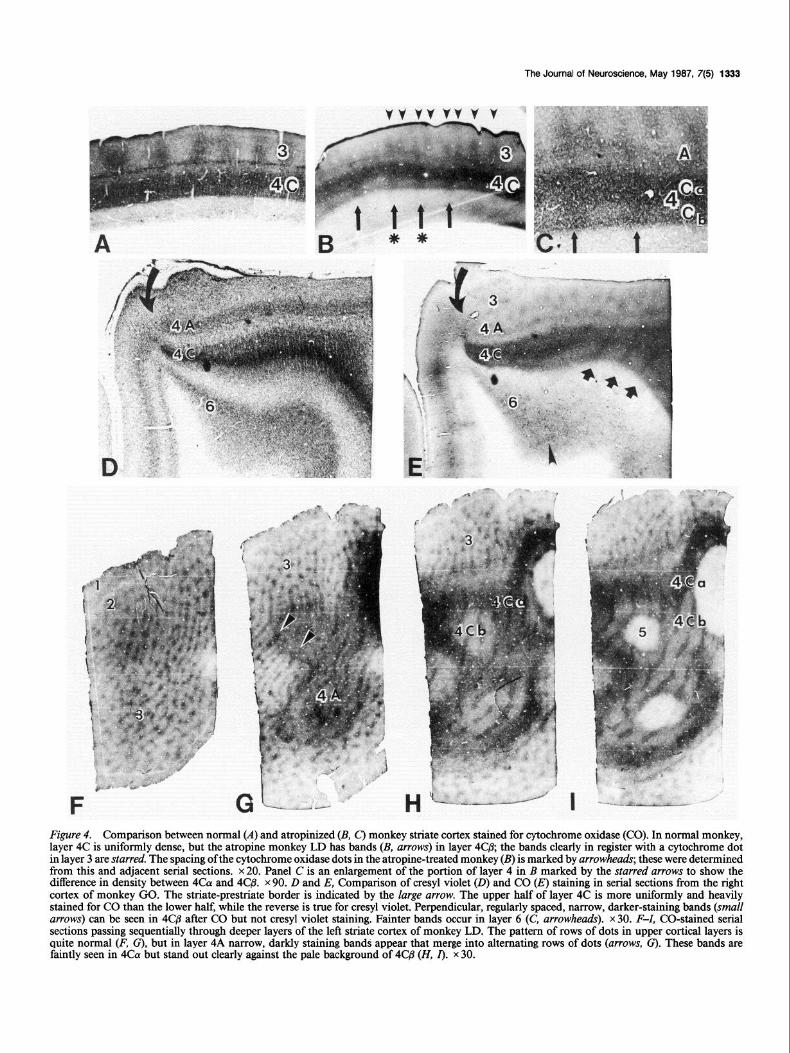
CO staining. When sections of striate cortex from a normal M. nemestrina monkey are reacted for the oxidative enzyme CO, clear laminar differences are apparent (Blasdel and Lund, 1983; Horton, 1984; Hendrickson, 1985). Figure 4A shows a normal monkey striate cortex section from the opercular cortex, stained for CO. The plane of section passes perpendicularly across the ocular dominance columns (LeVay et al., 1985). Layers 4A and 4C are darkly reactive, while 4B is lightly stained. The staining in layer 4C is uniform, and darkest in the cortex. Above and below layer 4, regular periodic regions of CO staining are evi-
dent, which are especially prominent in layers 2/3. These dots of enhanced CO activity (also called patches, blobs or puffs by other workers) are aligned in parallel rows when the cortex is viewed en face. Experiments using double labeling (Hendrickson et al., 198 1; Horton and Hubel, 198 1; Horton, 1984) have shown that each row of dots marks the center of an ocular dominance column from one eye, with adjacent rows alternating between the 2 eyes.
In all of the atropine-treated monkeys, CO staining of striate cortex showed a marked change. In perpendicular sections (Fig. 4,&C), layer 4Ca was uniformly stained, similar to results in normal monkeys, but layer 4C@ was subdivided into alternating narrower, darkly stained bands and wider, more lightly stained bands. Sometimes the dark CO bands can be traced through to the upper cortical layers, where they intersect with a layer 3 dot (Fig. 4B, starred arrows), indicating that these CO bands lie along the center of an ocular dominance column. The spacing of layer 3 dots (arrowheads) was approximately twice that of the 4Cp bands (arrows), suggesting that each band marks every other eye. Paired serial sections stained for cresyl violet did not show changes in the basophilic staining of layer 4C (Fig. 40), even when CO bands were clearly present (Fig. 4E). In tangential sections through opercular cortex, the rows of CO dots in layer 2/3 (Fig. 4F) were unchanged in staining density or spacing. In LD the repeat averaged 457 pm; in DH, 429 pm; and in GZ, 525 pm, compared to a repeat of 47 1 and 505 pm in 2 normal M. nemestrina monkeys. Alternating bands first appear in layer 4A, where they can be seen to connect to every other row of dots in layer 3 (Fig. 4G, arrowheads). Layer 4coI was more darkly stained overall, but narrow, darker bands could also be faintly seen in this layer as well (Fig. 4H). The most obvious change has occurred in 4Cp (Fig. 4,H,Z), which was more lightly stained than normal and contained narrow, irregularly beaded bands of
1332 Hendrickson et al. * Anatomical Effects of Early Unilateral Blur
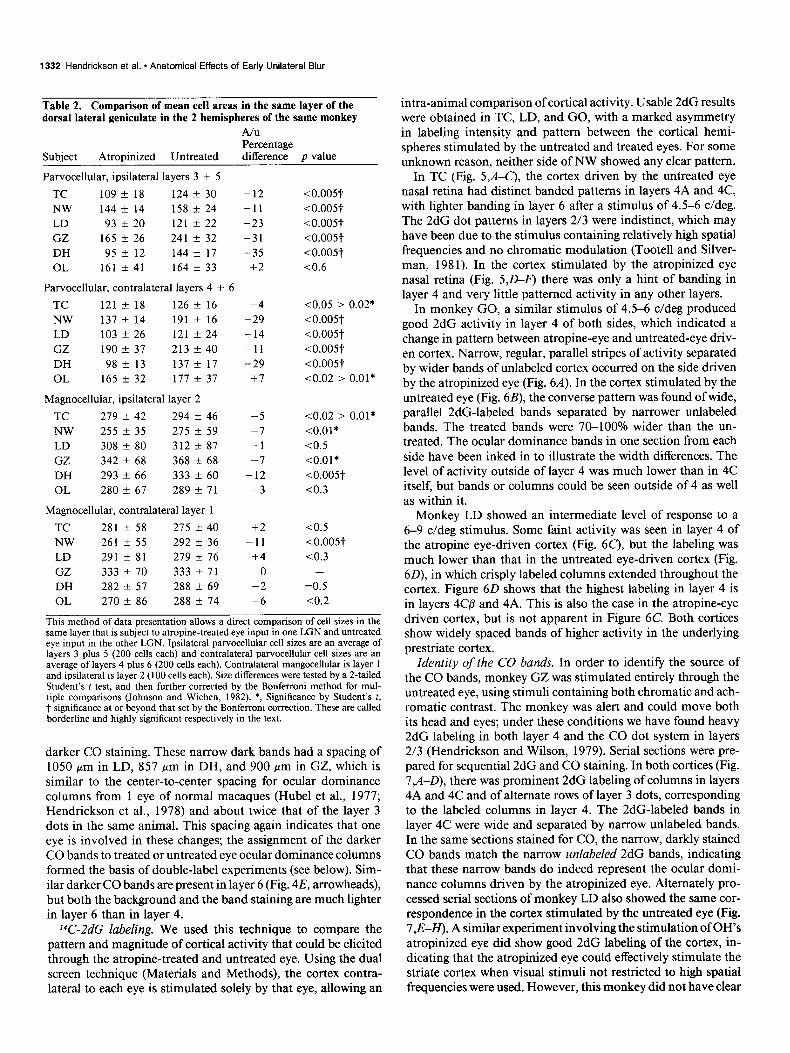
Table 2. Comparison of mean cell areas in the same layer of the dorsal lateral geniculate in the 2 hemispheres of the same monkey
A/u Percentage
Subject Atropinized Untreated difference p value
Parvocellular, ipsilateral layers 3 + 5
TC 109 + 18 124 k 30 -12 <o.o05t
NW 144 Zk 14 158 ? 24 -11 <o.o05t
LD 93 + 20 121 + 22 -23 <o.o05t
GZ 165 + 26 241 k 32 -31 <o.o05t
DH 95 t- 12 144 -t 17 -35 <o.o05t
OL 161 k 41 164 + 33 +2 ~0.6
Parvocellular, contralateral layers 4 + 6
TC 121 -t 18 126 + 16 -4 co.05 > 0.02*
NW 137 Ik 14 191 + 16 -29 <o.o05t
LD 103 f 26 121 + 24 -14 10.005t
GZ 190 + 37 213 k 40 -11 <0.005t
DH 98k 13 137 k 17 -29 <o.o05t
OL 165 + 32 177 * 37 i-7 co.02 > 0.01*
Magnocellular, ipsilateral layer 2
TC 279 f 42 294 + 46 -5 co.02 > 0.01*
NW 255 t 35 275 + 59 -7 <0.01*
LD 308 + 80 312 + 87 -1 co.5
GZ 342 f 68 368 + 68 -7 <0.01*
DH 293 + 66 333 k 60 -12 <o.o05t
OL 280 -t 67 289 +- 71 -3 co.3
Magnocellular, contralateral layer 1
TC 281 k 58 275 zk 40 +2 co.5
NW 261 f 55 292 + 36 -11 <o.o05t
LD 291 f 81 279 k 76 +4 co.3
GZ 333 * 70 333 k 71 0 -
DH 282 k 57 288 + 69 -2 =0.5
OL 270 + 86 288 + 74 -6 co.2
This method of data presentation allows a direct comparison of cell sizes in the same layer that is subject to atropine-treated eye input in one LGN and untreated eye input in the other LGN. Ipsilateral parvocellular cell sizes are an average of layers 3 plus 5 (200 cells each) and contralateral parvocellular cell sizes are an average of layers 4 plus 6 (200 cells each). Contralateral mangocellular is layer 1 and ipsilateral is layer 2 (100 cells each). Size differences were tested by a 2-tailed Student’s t test, and then further corrected by the Bonferroni method for mul- tiple comparisons (Johnson and Wichen, 1982). *, Significance by Student’s t, t significance at or beyond that set by the Bonferroni correction. These are called borderline and highly significant respectively in the text.
darker CO staining. These narrow dark bands had a spacing of 1050 pm in LD, 857 pm in DH, and 900 pm in GZ, which is similar to the center-to-center spacing for ocular dominance columns from 1 eye of normal macaques (Hubel et al., 1977; Hendrickson et al., 1978) and about twice that of the layer 3 dots in the same animal. This spacing again indicates that one eye is involved in these changes; the assignment of the darker CO bands to treated or untreated eye ocular dominance columns formed the basis of double-label experiments (see below). Sim- ilar darker CO bands are present in layer 6 (Fig. 4E, arrowheads), but both the background and the band staining are much lighter in layer 6 than in layer 4.
T-2dG labeling. We used this technique to compare the pattern and magnitude of cortical activity that could be elicited through the atropine-treated and untreated eye. Using the dual screen technique (Materials and Methods), the cortex contra- lateral to each eye is stimulated solely by that eye, allowing an
intra-animal comparison of cortical activity. Usable 2dG results were obtained in TC, LD, and GO, with a marked asymmetry in labeling intensity and pattern between the cortical hemi- spheres stimulated by the untreated and treated eyes. For some unknown reason, neither side of NW showed any clear pattern.
In TC (Fig. 5+4-C’), the cortex driven by the untreated eye nasal retina had distinct banded patterns in layers 4A and 4C, with lighter banding in layer 6 after a stimulus of 4.5-6 c/deg. The 2dG dot patterns in layers 2/3 were indistinct, which may have been due to the stimulus containing relatively high spatial frequencies and no chromatic modulation (Tootell and Silver- man, 1981). In the cortex stimulated by the atropinized eye
nasal retina (Fig. 5,D-F) there was only a hint of banding in layer 4 and very little patterned activity in any other layers.
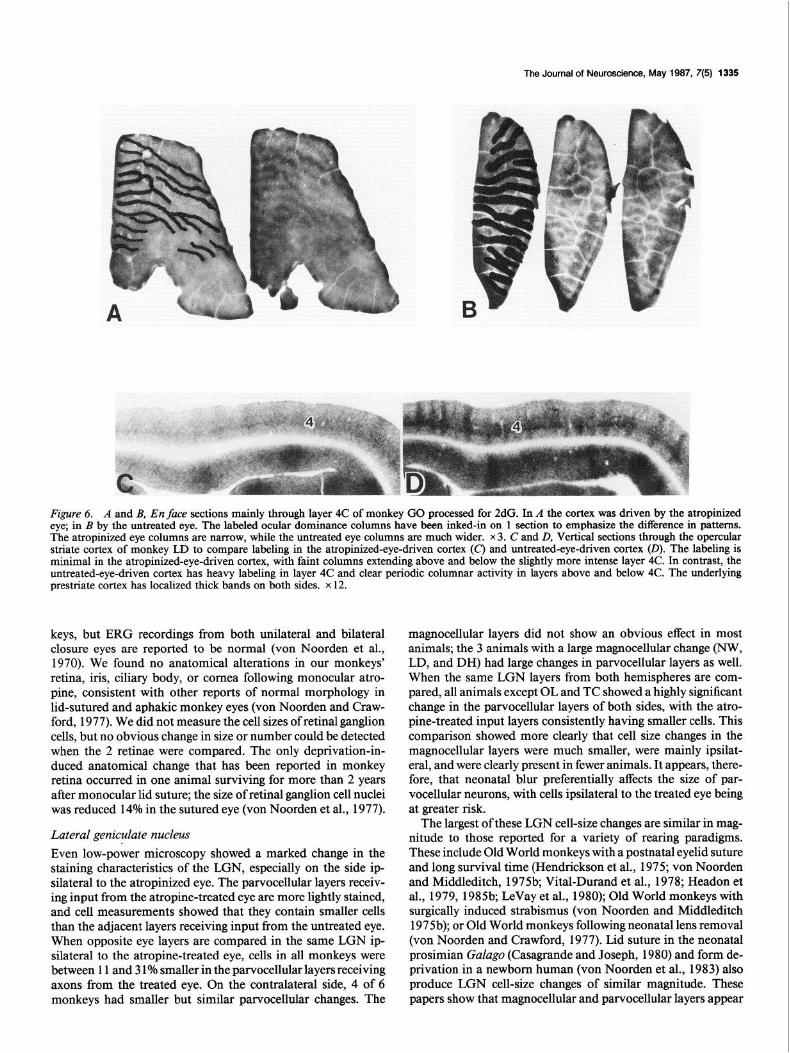
In monkey GO, a similar stimulus of 4.5-6 c/deg produced good 2dG activity in layer 4 of both sides, which indicated a change in pattern between atropine-eye and untreated-eye driv- en cortex. Narrow, regular, parallel stripes of activity separated by wider bands of unlabeled cortex occurred on the side driven by the atropinized eye (Fig. 6A). In the cortex stimulated by the untreated eye (Fig. 6B), the converse pattern was found of wide, parallel 2dG-labeled bands separated by narrower unlabeled bands. The treated bands were 70-100% wider than the un- treated. The ocular dominance bands in one section from each side have been inked in to illustrate the width differences. The level of activity outside of layer 4 was much lower than in 4C itself, but bands or columns could be seen outside of 4 as well as within it.
Monkey LD showed an intermediate level of response to a 6-9 c/deg stimulus. Some faint activity was seen in layer 4 of the atropine eye-driven cortex (Fig. 60, but the labeling was much lower than that in the untreated eye-driven cortex (Fig. 6D), in which crisply labeled columns extended throughout the cortex. Figure 60 shows that the highest labeling in layer 4 is in layers 4Cp and 4A. This is also the case in the atropine-eye driven cortex, but is not apparent in Figure 6C. Both cortices show widely spaced bands of higher activity in the underlying prestriate cortex.
Identity of the CO bands. In order to identify the source of the CO bands, monkey GZ was stimulated entirely through the untreated eye, using stimuli containing both chromatic and ach- romatic contrast. The monkey was alert and could move both its head and eyes; under these conditions we have found heavy 2dG labeling in both layer 4 and the CO dot system in layers 2/3 (Hendrickson and Wilson, 1979). Serial sections were pre- pared for sequential 2dG and CO staining. In both cortices (Fig. 7,A-D), there was prominent 2dG labeling of columns in layers 4A and 4C and of alternate rows of layer 3 dots, corresponding to the labeled columns in layer 4. The 2dG-labeled bands in layer 4C were wide and separated by narrow unlabeled bands. In the same sections stained for CO, the narrow, darkly stained CO bands match the narrow unlabeled 2dG bands, indicating that these narrow bands do indeed represent the ocular domi- nance columns driven by the atropinized eye. Alternately pro- cessed serial sections of monkey LD also showed the same cor- respondence in the cortex stimulated by the untreated eye (Fig. 7,E-H). A similar experiment involving the stimulation of OH’s atropinized eye did show good 2dG labeling of the cortex, in- dicating that the atropinized eye could effectively stimulate the striate cortex when visual stimuli not restricted to high spatial frequencies were used. However, this monkey did not have clear
The Journal of Neuroscience, May 1987, 7(5) 1333
Figure 4. Comparison between normal (A) and atropinized (B, C) monkey striate cortex stained for cytochrome oxidase (CO). In normal monkey, layer 4C is uniformly dense, but the atropine monkey LD has bands (B, arrows) in layer 4Cj3; the bands clearly in register with a cytochrome dot in layer 3 are starred. The spacing of the cytochrome oxidase dots in the atropine-treated monkey (B) is marked by arrowheads; these were determined from this and adjacent serial sections. x 20. Panel C is an enlargement of the portion of layer 4 in B marked by the starred arrows to show the difference in density between 4col and 4Cj3. x 90. D and E, Comparison of cresyl violet (0) and CO Q staining in serial sections from the right cortex of monkey GO. The striate-prestriate border is indicated by the large arrow. The upper half of layer 4C is more uniformly and heavily stained for CO than the lower half, while the reverse is true for cresyl violet. Perpendicular, regularly spaced, narrow, darker-staining bands (small arrows) can be seen in 4C@ after CO but not cresyl violet staining. Fainter bands occur in layer 6 (C, arrowheads). x 30. F-Z, CO-stained serial sections passing sequentially through deeper layers of the left striate cortex of monkey LD. The pattern of rows of dots in upper cortical layers is quite normal (F, G), but in layer 4A narrow, darkly staining bands appear that merge into alternating rows of dots (arrows, G). These bands are faintly seen in ~GY but stand out clearly against the pale background of 4C/3 (H, I). x 30.

1334 Hendrickson et al. l Anatomical Effects of Early Unilateral Blur
Figure 5. Tangential sections of the opercular striate cortex from monkey TC that have been autoradiographed for V-2-deoxyglucose (2dG) localization. A-C are from the cortex stimulated by the atropinized nasal retina; D-F, from the cortex stimulated by the untreated nasal retina. The 4.5-6 c/deg stimulus produced relatively little uptake in cortical layers 2/3 on either side (A, D). Layers 4A and 4C showed striking, heavy columnar uptake in the hemisphere driven by the untreated eye (E, F) but not the atropinized eye (B, C’). x 3.
enough CO bands in 4C to permit us to match them to the 2dG patterns.
We also sought to identify the eye of origin of the inputs to the CO-rich bands by intentionally marking cortical regions driven by the atropine eye during an electrophysiological re- cording experiment of the type described in detail in the fol- lowing paper (Movshon et al., 1987). In monkey NW, we di- rected a long tangential penetration across the ocular dominance columns in a direction parallel to the lip of the lunate sulcus and placed 5 electrolytic lesions near distinct, well-separated clusters of units dominated by the atropine-treated eye. The reconstruction of this electrode track from CO-stained sections is shown in Figure 8. Each lesion is related to an ocular dom- inance column marked by a dark band in layer 4C/3, providing
independent confirmation that these columns were driven by signals from the atropine-treated eye.
Discussion Retina There is now abundant evidence that monocular visual depri- vation influences both the anatomical and functional connec- tivity of central visual pathways, while the retina of the deprived eye remains relatively normal. Following monocular eyelid su- ture or lens/goggle rearing in cats, there is no change in the electrophysiological characteristics of retinal ganglion cells when recordings are done within the eye (Cleland et al., 1980; Thibos and Levick, 1982) or optic nerve (Sherman and Stone, 1973). Similar electrophysiological studies have not been done in mon-
The Journal of Neuroscience, May 1987, 7(5) 1335
Figure 6. A and B, En face sections mainly through layer 4C of monkey Go processed for 2dG. In A the cortex was driven by the atropinized eye; in B by the untreated eye. The labeled ocular dominance columns have been inked-in on 1 section to emphasize the difference in patterns. The atropinized eye columns are narrow, while the untreated eye columns are much wider. x 3. C and D, Vertical sections through the opercular striate cortex of monkey LD to compare labeling in the atropinized-eye-driven cortex (C) and untreated-eye-driven cortex (0). The labeling is minimal in the atropinized-eye-driven cortex, with faint columns extending above and below the slightly more intense layer 4C. In contrast, the untreated-eye-driven cortex has heavy labeling in layer 4C and clear periodic columnar activity in layers above and below 4C. The underlying prestriate cortex has localized thick bands on both sides. x 12.
keys, but ERG recordings from both unilateral and bilateral closure eyes are reported to be normal (von Noorden et al., 1970). We found no anatomical alterations in our monkeys’ retina, iris, ciliary body, or cornea following monocular atro- pine, consistent with other reports of normal morphology in lid-sutured and aphakic monkey eyes (von Noorden and Craw- ford, 1977). We did not measure the cell sizes of retinal ganglion cells, but no obvious change in size or number could be detected when the 2 retinae were compared. The only deprivation-in- duced anatomical change that has been reported in monkey retina occurred in one animal surviving for more than 2 years after monocular lid suture; the size of retinal ganglion cell nuclei was reduced 14% in the sutured eye (von Noorden et al., 1977).
Lateral geniculate nucleus
Even low-power microscopy showed a marked change in the staining characteristics of the LGN, especially on the side ip- silateral to the atropinized eye. The parvocellular layers receiv- ing input from the atropine-treated eye are more lightly stained, and cell measurements showed that they contain smaller cells than the adjacent layers receiving input from the untreated eye. When opposite eye layers are compared in the same LGN ip- silateral to the atropine-treated eye, cells in all monkeys were between 11 and 3 1% smaller in the parvocellular layers receiving axons from the treated eye. On the contralateral side, 4 of 6 monkeys had smaller but similar parvocellular changes. The
magnocellular layers did not show an obvious effect in most animals; the 3 animals with a large magnocellular change (NW, LD, and DH) had large changes in parvocellular layers as well. When the same LGN layers from both hemispheres are com- pared, all animals except OL and TC showed a highly significant change in the parvocellular layers of both sides, with the atro- pine-treated input layers consistently having smaller cells. This comparison showed more clearly that cell size changes in the magnocellular layers were much smaller, were mainly ipsilat- eral, and were clearly present in fewer animals. It appears, there- fore, that neonatal blur preferentially affects the size of par- vocellular neurons, with cells ipsilateral to the treated eye being at greater risk.
The largest of these LGN cell-size changes are similar in mag- nitude to those reported for a variety of rearing paradigms. These include Old World monkeys with a postnatal eyelid suture and long survival time (Hendrickson et al., 1975; von Noorden and Middleditch, 1975b, Vital-Durand et al., 1978; Headon et al., 1979, 1985b, LeVay et al., 1980); Old World monkeys with surgically induced strabismus (von Noorden and Middleditch 1975b); or Old World monkeys following neonatal lens removal (von Noorden and Crawford, 1977). Lid suture in the neonatal prosimian Galago (Casagrande and Joseph, 1980) and form de- privation in a newborn human (von Noorden et al., 1983) also produce LGN cell-size changes of similar magnitude. These papers show that magnocellular and parvocellular layers appear

1336 Hendrickson et al. l Anatomical Effects of Early Unilateral Blur
Figure 7. Freeze-dried tangential sections from monkey GZ processed for CO (A, c) after autoradiography (B, 0). The normal eye was stimulated by broad-frequency, nonoriented colored patterns. The narrow dark bands in 4Cj3 revealed by CO staining (A. C’) are marked by arrowheads. These bands correspond to the unlabeled narrow gaps in 4C@ of the deoxyglucose sections (B, D), which also are marked by small arrowheads. In the lower left portion of A and B, a glancing section through 4Cj3 shows a single narrow CO band (A, large arrowhead) and 2 wide, heavily labeled deoxyglucose bands separated by a narrow unlabeled band (B, large arrowhead), which corresponds to the CO band. x 30. E-H, Serial sections cut perpendicularly through the right opercular cortex of LD, showing the alignment of narrow CO bands in 4C@ (E, H) with unlabeled narrow bands representing the atropine-treated eye in the deoxyglucose sections (F, G). One sequence is marked by arrowheads. x 30.
1
3 4A
4c
6
Figure 8. Reconstruction of the electrode track through the fovea1 striate cortex of monkey NW, as seen in CO serial sections. The 5 marking lesions were made at sites driven by the atropinized eye. All lesions are adjacent to a CO-dense band or its extension in layers 4A, 4C& or 6 (stipple).
to be differentially affected by different types of deprivation. Neonatal eyelid suture and aphakia cause a cell-size change in both layers, while eyelid suture of late onset, esotropic and ex- otropic strabismus, and atropinization (this study) show a pref- erential effect on the parvocellular layers. The different LGN results for form deprivation (aphakia vs atropinization) may only be a difference in degree rather than kind, for when the atropine-induced amblyopia was behaviorally profound, as in DH, NW, and GZ, a change in magnocellular neurons also occurred. This preferential parvocellular cell-size response to moderate blur suggests that form deprivation differentially af- fects the “P system” located predominantly within the parvo- cellular layers of LGN and layer 4C/l of striate cortex (Hubel and Wiesel, 1972; Hendrickson et al., 1978; Perry and Cowey, 198 1; Blasdel and Lund, 1983). In a single human case of an- isometropic amblyopia of unknown etiology there also was a much larger cell-size change in the parvocellular layers (von Noorden et al., 1983), suggesting that the same would be true of the human visual system.

The Journal of Neuroscience, May 1987, 7(5) 1337
Our animals also showed a much larger change on the side ipsilateral to the atropinized eye, which may be related to an asymmetry in macaque cone and retinal ganglion cell number. Perry et al. (1984) and Perry and Cowey (1986) report that the peripheral nasal retina has up to 3 times as many ganglion cells as the peripheral temporal retina, which gives rise to the ipsi- lateral LGN projections. The central retina has a smaller but similar asymmetry. This imbalance is carried into the cortex where in the more peripheral retinal representation the ocular dominance columns from the temporal retina are broken into patches and clearly occupy less than 50% of the cortical space (LeVay et al., 1985). Work in our laboratory (Packer et al., 1986) indicates that central temporal retina in M. nemestrina also contains fewer cones than nasal retina at the same eccentricity. Given this numerical imbalance, the temporal retinal pathways might be more handicapped when placed in a competitive sit- uation against nasal input.
Although there is a consistent direction in the size difference between parvocellular LGN neurons in treated and untreated eye input layers (untreated > treated), we are not able to state the absolute direction of this size change compared to normal monkeys. Headon et al. (1979, 198 1, 1985b) have directly com- pared normal LGN cell size in one set of monkeys to deprived- eye and open-eye LGN cell size in a second set. These authors assert that the balance of cell change takes place in the untreated eye layers as a hypertrophy and that the deprived eye layers usually do not shrink, as has been supposed by others. A similar comparison in our animals was not possible because both our normal and atropinized animals varied markedly between in- dividuals in the absolute size of LGN neurons, perhaps due to our use of frozen sections.
It has been suggested that neurons are most sensitive to de- privation during a rapid growth phase (Hickey, 1977). In the human LGN, parvocellular neurons have reached 95% of their adult size by 6 months after birth, while the magnocellular layers increase in size until 24 months of age (Hickey, 1977). The monkey shows a similar growth pattern, in which the parvo- cellular layers are virtually adult by birth, but the magnocellular layers still grow somewhat after birth (Headon et al., 1985a). Because postnatal atropine treatment affects mainly the par- vocellular layers, and this can occur even when treatment is not begun until the end of the second week after birth, it would appear that rapid growth is not a prerequisite for these form- deprivation effects to occur.
What is the cause of the changes in LGN cell size? Eyelid suture causes a reduction in the cortical area occupied by tha- lamic axons driven by the deprived eye (Hubel et al., 1977; LeVay et al., 1980; Blakemore et al., 198 1; Swindale et al., 198 1) and smaller LGN cell size and reduced basophilia are the prob- able result of this reduced arbor. Alternatively, hypertrophy of the untreated eye neurons to support an enlarged axon arbor (Headon et al., 1979, 198 1, 1985b) might also be the result of expanded columns. We do not have direct ocular dominance column measurements for all of our monkeys, but GO, GZ, NW, and DH all showed reductions in the amount of cortex driven by the treated eye, as measured by anatomical or phys- iological means. This reduction in cortical area is believed to be largely due to active and unequal postnatal competition be- tween the axons of the 2 eyes within layer 4 of striate cortex during ocular dominance column formation (Guillery, 1972; Hubel et al., 1977; Blakemore et al., 198 1). Interestingly, New World monkeys lack ocular dominance columns in cortex and
should not be subject to this competition, yet they also show marked LGN cell size changes after eyelid suture (Lin and Kaas, 1980; Tigges et al., 1984). In other situations where the possi- bility for cortical competition is removed, for instance, within the region of LGN representing the monocular segment (von Noorden and Middleditch, 1975b) or by creating an artificial monocular segment (Hendrickson et al., 1975), LGN neurons still show cell-size changes. These findings suggest that at least 2 mechanisms are operative in the primate, binocular compe- tition within cortex and some direct “deprivation” effect, per- haps at the retinogeniculate synapse itself. Both processes would inhibit the growth of cell bodies in the treated eye layers and/ or enhance those in the untreated eye layers.
Despite the changes in cell size, electron-microscopic exam- ination of the LGN synaptic organization of deprived monkeys (Wilson and Hendrickson, 198 1) has not shown any qualitative or quantitative changes. Similarly, single-unit recordings in de- prived LGN show that spatial resolution develops at a normal rate and reaches normal levels in the LGN layers receiving input from the deprived eye (Blakemore and Vital-Durand, 1979; Movshon et al., 1987). This constellation of results lends support to the idea that the major functional effects of visual deprivation occur within the striate cortex.
Striate cortex The 2dG results in TC and LC revealed reduced cortical re- sponsiveness to midrange spatial frequency stimulation in the treated-eye-driven cortex but not in the untreated-eye-driven cortex. This is consistent with the results of striate cortex elec- trophysiological recording (Movshon et al., 1987), in which these animals had markedly reduced responsiveness to these and higher spatial frequencies in cortical units driven by the treated eye. On the other hand, 2dG labeling for a midrange stimulus was partly retained in GO. In this animal an altered ocular domi- nance pattern was found in layer 4, with the untreated eye elict- ing wider columns than the treated eye. GO was not studied electrophysiologically or behaviorally but did have a perfor- mance deficit in the atropine-treated eye as measured by evoked cortical potentials. Whether this difference was functionally more or less severe than the deficit in TC and LD cannot be directly compared, but if it were less, it could explain the difference in responsiveness. The difference in responsiveness of the atro- pine-eye-driven cortex of TC and LD and of GO also could have been influenced by the shorter time of anesthesia experi- enced by GO (10 vs 48 hr or more for TC and LD).
The changes in CO staining in the atropine-eye-driven striate cortex were consistent with a marked change in the parvocellular pathway and a lesser effect in the magnocellular pathway. The primary target of axons from the parvocellular layers is layer 4Cp, with smaller inputs to layers 6A, 4A, 3, and 1 (Blasdel and Lund, 1983; Hendrickson, 1985). The most obvious change in CO staining pattern was in layers 4A and 4C/3, although layer 6 usually showed an enhancement of CO activity within the same columns that showed increases in layer 4. Most monkeys had uniform dark staining in 4Ca, the site of magnocellular input which is consistent with the minimal LGN cell size changes found in these layers. The rows of CO dots, which are aligned along the centers of the ocular dominance columns, also did not show changes in staining intensity. This dot system has been reported to contain a !arge number of poorly oriented, color- specific units that often are monocular (Livingstone and Hubel, 1984). Postnatal defocus due to atropinization should markedly

1338 Hendrickson et al. * Anatomical Effects of Early Unilateral Blur
degrade spatial resolution but should have little effect on the processing of chromatic information, so the lack of an atropine effect on the dots is consistent with this proposed parcellation of cell function within layer 3.
Our finding that the heavier CO staining in layer 4Cp resides in ocular dominance columns associated with the atropinized eye is not easily explained. Enucleation (Horton and Hubel, 198 1; Horton, 1984) abolition of ganglion cell activity (Wong- Riley and Carroll, 1984), or lid suture of an adult monkey (Hen- dry and Jones, 1986) rapidly produces a marked decrease in CO staining within columns driven by the affected eye. There are no reports from neonatal deprivation paradigms showing marked CO staining changes in primate cortex. Given the small number of cortical neurons driven by a neonatally sutured eye (Blake- more et al., 198 l), the decrease in size and number of synaptic terminals within the sutured eye’s patches of layer 4 (cat striate cortex; Tieman, 1984) and the marked reduction in the baso- philia and size of LGN neurons receiving input from the sutured eye, one might predict a marked decrease in CO staining of monocularly deprived striate cortex. What might explain the apparent decrease in CO activity within the untreated-eye-driv- en columns of layer 4C@? As reported in the following paper (Movshon et al., 1987), we found that, in contrast to results for neonatal eyelid suture, many neurons were responsive in all layers of cortex to the atropine-treated eye. These units were typical for all perimeters except for their inability to respond to high spatial frequencies. However, some shift in ocular domi- nance column size in favor of the untreated eye also has oc- curred. This suggests that LGN synapses driven by the treated eye should have been formed in cortex in a relatively normal manner during development but within a smaller overall area of 4Cp. The resulting increased synaptic density might result in relatively normal metabolic staining. Conversely, the untreated eye columns would expand in size but decrease in CO staining intensity, presumably due to an overall decrease in synaptic density. Increased CO staining is seen in some normal animals along the column centers in layers 4 and 6 (Horton, 1984; Hen- drickson, 1985), so this change in our atropine-treated monkeys could be an exaggeration of a normal but poorly understood aspect ofcortical organization. Alternatively, this altered pattern of CO staining could reflect a redistribution of some intrinsic cortical system acting within the atropine-driven areas of cortex. CO staining is not confined to excitatory input regions but is found in all types of synaptic terminals, as well as axons, cell bodies, and dendrites within cortex (Wong-Riley, 1979; Carroll and Wong-Riley, 1984). Interestingly, LeVay et al. (1980) re- ported a similar change in axon neurofilament staining patterns using the silver-based Liesengang method. They found that brief eyelid suture resulted in enhanced staining of the narrowed su- tured-eye columns and reduction of staining in the wider open- eye columns. Their monkey had “near-normal” acuity, sug- gesting a functional but deprived eye system somewhat like our atropine monkeys.
In these atropine-treated monkeys, the anatomical changes that occurred within the visual system were qualitatively con- sistent across animals and were seen most clearly within the LGN and striate cortical pathways associated with the parvo- cellular pathways. The amount of LGN cell-size change and 2dG labeling intensity was also correlated with the severity of the behavioral loss in contrast sensitivity and spatial resolution in the same animals that we reported in the previous paper (Kiorpes et al., 1987). In the final paper in this series (Movshon
et al., 1987), we show in striate cortex that the physiological effects of neonatal monocular atropine treatment also are con- sistent with a functional change predominantly affecting the parvocellular system, and that the magnitude of anatomical and behavioral change in a given monkey is predictive of the degree of functional loss within that animal’s striate cortex.
References Awaya, S., Y. Miyake, Y. Imaizumi, Y. Sinose. T. Kanda. and K.
Komuro (1973) Amblyopia in man suggestive of stimulus depri- vation amblvonia. J. Gnhthalmol. 17: 69-82.
Blakemore, C.,-and F. Vital-Durand (1979) Development of the neural basis of visual acuity in monkeys. Speculation on the origin of de- privation amblyopia. Trans. Ophthalmol. Sot. UK 99: 363-368.
Blakemore, C., F. Vital-Durand, and L. Garey (198 1) Recovery from monocular deprivation in the monkey. I. Reversal of physiological effects in the visual cortex. Proc. R. Sot. London [Biol.] 211: 399- 423.
Blasdel, G. G., and J. S. Lund (1983) Termination of afferent axons in macaaue striate cortex. J. Neurosci. 3: 1389-t 413 , - . _ I .
Boothe, R.-G., L. Kiorpes, and A. Hendrickson (1982) Anisometropic amblyopia in Macaca nemestrina monkeys produced bv atroniniza- tion of one eye during development. Invest. Ophthalmol. Vfis. Sci. 22: 228-233.
Carroll, E. W., and M. T. T. Wong-Riley (1984) Quantitative light and electron microscopic analysis of cytochrome oxidase-rich zones in the striate cortex of the squirrel monkey. J. Comp. Neurol. 222: 1-17.
Casagrande, V. A., and R. Joseph (1980) Mornholoaical effects of monocular deprivation and recovery on the dorsal lateral geniculate nucleus in Galano. J. Comp. Neurol. 194: 4 13-426. .-_.
Cleland, B. G., D.E. Mitchell, S. Gillard-Crewther, and D. P. Crewther (1980) Visual resolution of retinal ganglion cells in monocularly- deprived cats. Brain Res. 192: 26 I-266.
Derrington, A. M., and P. Lennie (1984) Spatial and temnoral contrast sensitivity of neurones in lateral geniculate nucleus of macaque. J. Phvsiol. (Lond.) 357: 2 19-240.
Garey, L. J:, and .F. Vital-Durand (198 1) Recovery from monocular deprivation in the monkey. II. Reversal of morphological effects in the lateral geniculate nucleus. Proc. R. Sot. London [Biol.] 213: 425- 413 .--.
Guillery, R. W. (1972) Binocular competition in the control of genic- ulate cell growth. J. Comp. Neurol. 144: 117-130.
Harwerth, R. S., M. L. J. Crawford, E. L. Smith, and R. L. Boltz (1981) Behavioral studies of stimulus deprivation amblyopia in monkeys. Vision Res. 21: 779-789.
Headon, M. P., J. J. Sloper, R. W. Hioms, and T. P. S. Powell (1979) Cell size changes in undeprived laminae of monkey lateral geniculate nucleus after monocular closure. Nature 281: 572-574.
Headon, M. P., J. J. Sloper, R. W. Hioms, and T. P. S. Powell (198 1) Cell sizes in the lateral geniculate nucleus of normal infant and adult rhesus monkeys. Brain Res. 229: 183-l 86.
Headon, M. P., J. J. Sloper, R. W. Hioms, and T. P. S. Powell (1985a) Sizes of neurons in the primate lateral geniculate nucleus during nor- mal develonment. Dev. Brain Res. 18: 5 l-56
Headon, M. P., J. J. Sloper, R. W. Hioms, and 7. P. S. Powell (1985b) Effects of monocular closure at different ages on deprived and un- deprived cells in the primate lateral geniculate nucleus. Dev. Brain Res. 18: 57-78.
Hendrickson, A. E. (1985) Dots, stripes and columns in monkey visual cortex. Trends Neurosci. 8: 406-4 10.
Hendrickson, A., and J. R. Wilson (1979) A difference in %-deoxy- glucose patterns in striate cortex between Macaca and Saimiri mon- keys following monocular stimulation. Brain Res. 170: 353-358.
Hendrickson, A., J. Lund, and R. Kalina (1975) The interaction of retinal lesions and eyelid closure in the monkey dorsal lateral genic- ulate. Sot. Neurosci. Abstr. I: 478.
Hendrickson, A., J. Bowles, and E. B. McLean (1977) Visual acuity and behavior of monocularly deprived monkeys after retinal lesions. Invest. Ophthalmol. Vis. Sci. 16: 469-473.
Hendrickson, A. E., J. R. Wilson, and M. P. Ogren (1978) The neu- roanatomical organization of pathways between the dorsal lateral geniculate nucleus and visual cortex in Old World and New World primates. J. Comp. Neurol. 182: 123-136.
The Journal of Neuroscience, May 1987, 7(5) 1339
Hendrickson, A. E., S. P. Hunt, and J.-Y. Wu (1981) Immuno- cytochemical localization of glutamic acid decarboxylase in monkey striate cortex. Nature 292: 605-607.
Hendry, S. H. C., and E. G. Jones (1986) Reduction in number of immunostained GABAergic neurons in deprived-eye dominance col- umns of monkey area 17. Nature 320: 750-752.
Hickey, T. (1977) Postnatal development of the human lateral genic- ulate nucleus: Relationship to a critical period for the visual system. Science 198: 836-838.
Horton, J. (1984) Cytochrome oxidase patches: a new cytoarchitec- tonic feature of monkey visual cortex. Phil, Trans. Roy. Sot. Lond. 304: 199-253.
Horton, J., and D. H. Hubel (1981) Regular patchy distribution of cytochrome oxidase staining in primary visual cortex of macaque monkey. Nature 292: 762-764.
Hubel, D. H., and T. N. Wiesel (1968) Receptive fields and functional architecture of monkey striate cortex. J. Physiol. (Lond.) 195: 2 15- 243.
Hubel, D. H., and T. N. Wiesel (1972) Laminar and columnar dis- tribution of geniculo-cortical fibers in the macaque monkey. J. Comp. Neurol. 46: 42 l-450.
Hubel, D. H., T. N. Wiesel, and S. LeVay (1977) Plasticity of ocular dominance columns in monkey striate cortex. Phil. Trans. R. Sot. Lond. B 278: 377-409.
Johnson, R. A., and D. W. Wichen (1982) Applied Multivariate Sta- tistical Analysis, p. 197, Prentice-Hall, Englewood Cliffs, NJ.
Kaplan, E., and R. M. Shapley (1982) X and Y cells in the lateral geniculate nucleus of macaque monkeys. J. Physiol. (Lond.) 330: 125- 144.
Kiorpes, L., R. G. Boothe, A. E. Hendrickson, J. A. Movshon, H. M. Eaeers. and M. S. Gizzi (1987) Effects of earlv unilateral blur on the macaque’s visual system: I. Behavioral obsekations. J. Neurosci. 7: 1318-1326.
LeVay, S., T. N. Wiesel, and D. H. Hubel (1980) The development of ocular dominance columns in normal and visually deprived mon- key. J. Comp. Neurol. 191: 1-51.
LeVay, S., M. Connolly, J. Houde, and D. C. VanEssen (1985) The complete pattern of ocular dominance stripes in the striate cortex and visual field of the macaque monkey. J. Neurosci. 5: 486-50 1.
Leventhal, A. G., R. W. Rodieck, and B. Dreher (198 1) Retinal gan- glion cell classes in old-world monkey; morphology and central pro- jections. Science 213: 1139-l 142.
Levi, D. M., and R. S. Harwerth (1980) Contrast sensitivity in am- blyopia due to stimulus deprivation. Br. J. Ophthalmol. 64: 15-20.
Lin, C-S., and J. H. Kaas (1980) Effects of monocular deprivation on geniculo-cortical pathway in the owl monkey, Aotus trivirgatus. Neu- rosci. Lett. 18: 267-273.
Livingstone, M., and D. H. Hubel (1984) Anatomy and physiology of a color system in the primate visual cortex. J. Neurosci. 4: 309- 356.
Lund, J. S. (1980) Intrinsic organization of the primate visual cortex, area 17, as seen in Golgi preparations. In The Organization of the Cerebral Cortex, Proceedings of a Neuroscience Research Program Colloquium, F. 0. Schmitt, F. G. Worden, G. Adelman, and S. G. Dennis, eds., pp. 105-l 24, MIT Press, Cambridge, MA.
Malpeli, J. G., and F. H. Baker (1975) The representation of the visual field in the lateral geniculate nucleus of Macaca mulatta. J. Comp. Neurol. 161: 569-594.
Maunsell, J. H. R., and D. C. Van Essen (1983) The connections of the middle temporal visual area (MT) and their relationship to a cortical hierarchy in the macaque monkey. J. Neurosci. 3: 2563-2586.
Movshon, J. A., H. M. Eggersi M. S. Gizzi, A. E. Hendrickson, L. Kiornes. and R. G. Boothe (1987) Effects of earlv unilateral blur on the macaque’s visual system: III. Physiological observations. J. Neu- rosci. 7: 1340-l 35 1.
Newsome, W. T., M. S. Gizzi, and J. A. Movshon (1983) Spatial and temporal properties of neurons in macaque MT. Invest. Ophthalmol. Vis. Sci. (Suppl.) 24: 106.
Packer, O., C. Curcio, and A. Hendrickson (1986) Topography of photoreceptors in the Macaca nemestrina retina. Assoc. Res. Vis. Ophthalmol. Abstr. (Suppl.) 27: 330.
Perry, V. H., and A. Cowey (1981) The morphological correlates of
X- and Y-like retinal ganglion cells in the retina of monkeys. Exp. Brain Res. 43: 426-428.
Perry, V. H., and A. Cowey (1986) The ganglion cell and cone dis- tributions in the monkey’s retina: Implications for central magnifi- cation factors. Vision Res. 25: 1795-18 10.
Perry, V. H., R. Oehler, and A. Cowey (1984) Retinal ganglion cells that project to the dorsal lateral geniculate nucleus in the macaque monkey. Neuroscience 12: 1101-l 124.
Robson. J. G.. and N. Graham (1981) Probability summation and regional variation in contrast sensitivity across the visual field. Vision Res. 21: 409-418.
Schiller, P. H., and J. G. Malpeli (1978) Functional specificity oflateral geniculate nucleus laminae of the rhesus monkey. J. Neurophysiol. 41: 788-797.
Shapley, R., and V. H. Perry (1986) Cat and monkey retinal ganglion cells and their visual functional roles. Trends Neurosci. 9: 229-235.
Sherman, S. M., and J. Stone (1973) Physiological normality of the retina in visually deprived cats. Brain Res. 60: 224-230.
Swindale, N. V., F. Vital-Durand, and C. Blakemore (198 1) Recovery from monocular deprivation in the monkey. III. Reversal of anatom- ical effects in the visual cortex. Proc. R. Sot. London [Biol.] 219: 435-450.
Thibos, L. N., and W. R. Levick (1982) Astigmatic visual deprivation in cat: Behavioral, optical and physiological consequences. Vision Res. 22: 43-53.
Tieman, S. B. (1984) Effects of monocular deprivation on geniculo- cortical synapses in the cat. J. Comp. Neurol. 222: 166-176.
Tigges, M., A. E. Hendrickson, and J. Tigges (1984) Anatomical con- sequences of long-term monocular eyelid closure on lateral geniculate nucleus and striate cortex in squirrel monkey. J. Comp. Neurol. 227: 1-13.
Tootell, R. B. H., and M. S. Silverman (1981) A comparison of cy- tochrome oxidase and deoxyglucose activity patterns in macaque vis- ual cortex. Sot. Neurosci. Abstr. 7: 356.
Van Essen, D. C., W. T. Newsome, and J. H. R. Maunsell (1984) The visual field representation in striate cortex of the macaque monkey: Asymmetries, anisotropies, and individual variability. Vision Res. 24: 429-448.
Vital-Durand, F., L. J. Garey, and C. Blakemore (1978) Monocular and binocular deprivation in the monkey: Morphological effects and reversibility. Brain Res. 158: 45-64.
von Noorden, G. K. (1973) Experimental amblyopia in monkeys. Further behavioral observations and clinical correlations. Invest. Ophthalmol. 12: 721-726.
von Noorden, G. K., and M. L. J. Crawford (1977) Form deprivation without light deprivation produces the visual deprivation syndrome in Macaca mulatta. Brain Res. 129: 37-44.
von Noorden, G. K. and P. R. Middleditch (1975a) Histological ob- servations in the normal monkey lateral geniculate nucleus. Invest. Ophthalmol. 14: 55-58.
von Noorden, G. K. and P. R. Middleditch (1975b) Histology of the monkey lateral geniculate nucleus after unilateral lid closure and ex- perimental strabismus: Further observations. Invest. Ophthalmol. 14: 674-683.
von Noorden, G. K., J. E. Dowling, and D. C. Ferguson (1970) Ex- perimental amblyopia in monkeys. I. Behavioral studies of stimulus dearivation amblvonia. Arch. Onhthalmol. 84: 206-212.
von Noorden, G. K, M. L. J. Crawford, and P. R. Middleditch (1977) Effect of lid suture on retinal ganglion cells in Macaca mulatta. Brain Res. 122: 437-444.
von Noorden, G. K., M. L. J. Crawford, and R. A. Levacy (1983) The lateral geniculate nucleus in human anisometropic amblyopia. Invest. Ophthalmol. Vis. Sci. 24: 788-790.
Wilson, J. R., and A. E. Hendrickson (1981) Neuronal and synaptic structure of the dorsal lateral geniculate nucleus in normal and mon- ocularlv denrived Macaca monkevs. J. Comn. Neurol. 197: 5 17-539.
Wong-Riley, ‘M. T. T. (1979) Changes in the visual system of mon- ocularly sutured or enucleated cats demonstrable with cytochrome oxidase histochemistry. Brain Res. 171: 1 l-28.
Wong-Riley, M. T. T., and E. W. Carroll (1984) Effect of impulse blockage on cytochrome oxidase activity in monkey visual system. Nature 307: 262-263.
![Discriminative Blur Detection Featuresleojia/projects/dblurdetect/... · cal blur features for blur confidenceand type classification. Chakrabarti et al. [3] analyzed directional](https://img.pdfslide.us/doc/110x75/606a380b892efc4f822ed5db/discriminative-blur-detection-leojiaprojectsdblurdetect-cal-blur-features.jpg)