Embed Size (px)
Citation preview
* Corresponding author: Senior Lecturer in Structural Engineering, School of Civil and Environmental
Engineering, Faculty of Engineering and Information Technology, University of Technology Sydney (UTS),
Building 11, Level 11, Broadway, Ultimo NSW 2007 (PO Box 123), Email: [email protected]
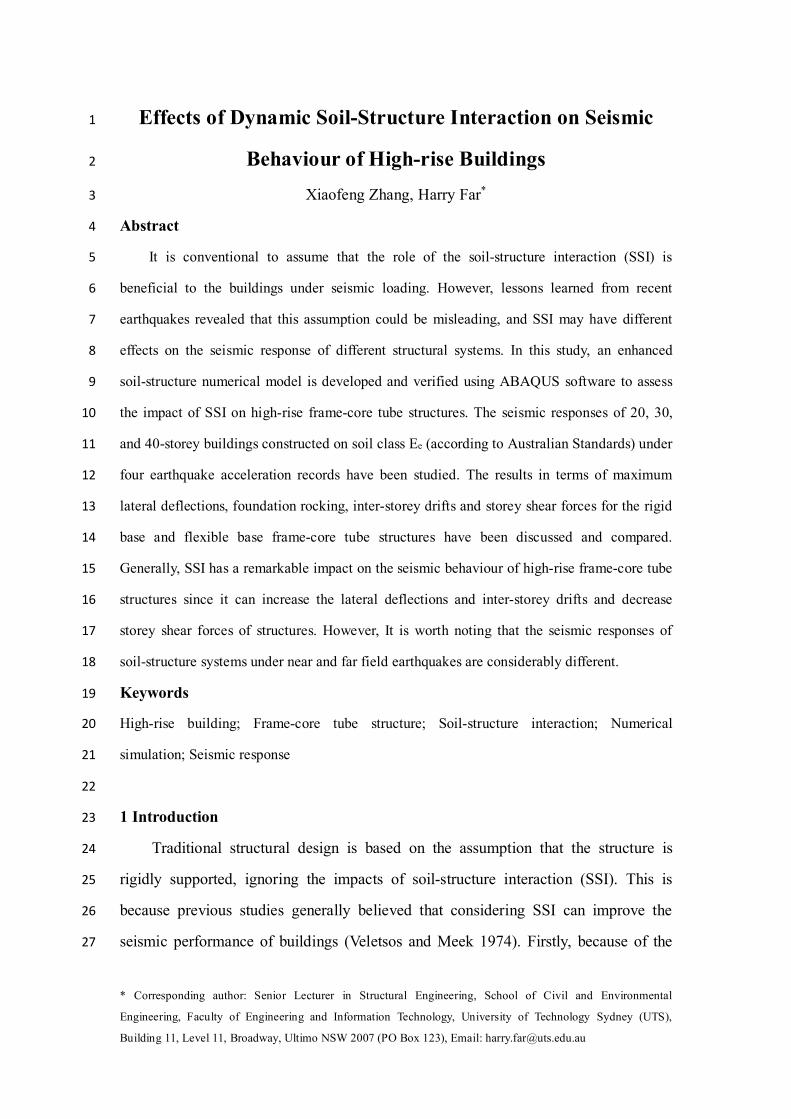
Effects of Dynamic Soil-Structure Interaction on Seismic 1
Behaviour of High-rise Buildings 2
Xiaofeng Zhang, Harry Far* 3
Abstract 4
It is conventional to assume that the role of the soil-structure interaction (SSI) is 5
beneficial to the buildings under seismic loading. However, lessons learned from recent 6
earthquakes revealed that this assumption could be misleading, and SSI may have different 7
effects on the seismic response of different structural systems. In this study, an enhanced 8
soil-structure numerical model is developed and verified using ABAQUS software to assess 9
the impact of SSI on high-rise frame-core tube structures. The seismic responses of 20, 30, 10
and 40-storey buildings constructed on soil class Ee (according to Australian Standards) under 11
four earthquake acceleration records have been studied. The results in terms of maximum 12
lateral deflections, foundation rocking, inter-storey drifts and storey shear forces for the rigid 13
base and flexible base frame-core tube structures have been discussed and compared. 14
Generally, SSI has a remarkable impact on the seismic behaviour of high-rise frame-core tube 15
structures since it can increase the lateral deflections and inter-storey drifts and decrease 16
storey shear forces of structures. However, It is worth noting that the seismic responses of 17
soil-structure systems under near and far field earthquakes are considerably different. 18
Keywords 19
High-rise building; Frame-core tube structure; Soil-structure interaction; Numerical 20
simulation; Seismic response 21
22
1 Introduction 23
Traditional structural design is based on the assumption that the structure is 24
rigidly supported, ignoring the impacts of soil-structure interaction (SSI). This is 25
because previous studies generally believed that considering SSI can improve the 26
seismic performance of buildings (Veletsos and Meek 1974). Firstly, because of the 27
flexibility of the ground, the foundation of buildings incorporating the dynamic SSI 1
has two more degrees of freedom: horizontal movement and rotation. The increase of 2
degrees of freedom can reduce the stiffness of soil-structure system, and then lengthen 3
the natural period. Secondly, the foundation input motion is different from the free 4
field motion due to the kinematic interaction and inertial interaction effects (Anand 5
and Satish Kumar 2018). According to the response spectrum theory, the increase of 6
the natural period and the change of the input motion can modify the seismic demand 7
of the structure (Seed et al. 1976). In addition, when the flexible-base structure 8
(considering the SSI) is in vibration, a considerable part of the energy is dissipated 9
into the soil due to the radiation damping generated by wave propagation and the 10
hysteresis damping of soil material, which makes the effective damping ratio of the 11
structures resting on soft soils is generally greater than that of the rigidly supported 12
structure (Wolf 1985). 13
Because SSI lengthens the natural period and increases the damping of system, 14
Veletsos and Meek (1974) concluded that influence of SSI seemed to be beneficial to 15
the structural system under the act of earthquake records. Besides, provisions that 16
allow reduction of base shear when SSI is considered can be found in many current 17
codes (NZS1170.5, 2007; IBC, 2012; NBCC, 2010; GB 50011-2010). However, this 18
conclusion is misleading. Horizontal movement and rotation of the foundation may 19
amplify the lateral deformations and inter-storey drifts of the superstructure (Guin and 20
Banerjee 1998; Tabatabaiefar 2012; Tabatabaiefar & Clifton 2016; Far 2019a), which 21
are the most commonly used damage parameters in performance-based design 22
(Monavari and Massumi 2012; Mohammadi et al. 2015; Samimifar et al. 2019). As a 23
result, considering SSI can alter the performance level of buildings and is notably 24
crucial for high-rise and slender buildings (Kramer 1996; Fatahi et al. 2011; Samali et 25
al. 2011; Tabatabaiefar et al. 2012). 26
Therefore, it can be observed that there are some contradictory opinions about 27
the influence of SSI on the seismic responses of structures (Mylonakis and Gazetas 28
2000; Far & Flint 2017). The complexity of SSI and inconclusiveness of the literature 29
provide sufficient motivation to critically investigate the effects of SSI (Sharma et al. 30
2018). 1
Based on commonly used structure types in reality, it is essential to study the 2
impacts of SSI on various kinds of structural systems to get a complete understanding 3
of their seismic response. When subjected to seismic loading, the behaviour of any 4
structure-soil system results from different factors, such as the input motion, type and 5
depth of foundation, soil modulus and shear wave velocity, geometry and natural 6
period of the superstructure (Anand and Satish Kumar 2018; Saleh et al 2018). In the 7
past decades, many scholars have investigated the influence of SSI on moment 8
resisting frames with low and mid-rise buildings (Tabatabaiefar et al. 2013; 9
Tabatabaiefar and Fatahi 2014; Ghandil and Behnamfar 2017; Far 2019b; Yang et al. 10
2020). Generally, compared with rigidly supported model, the base shear of the model 11
considering SSI decreases whereas the lateral deformations and inter-storey drifts 12
increase relatively, and the SSI effects is more significant with diminishing the shear 13
wave velocity of ground soils. Therefore, ignoring SSI may lead to changes in the 14
performance level of buildings and unsafe results of structures subjected to seismic 15
loading. 16
Studies in terms of high-rise buildings and frame-shear wall structures have been 17
substantially insufficient. Han (2002) examined a 20-storey building resting on pile 18
foundation. The influences of pile foundation displacements on the performance of 19
high-rise buildings were studied, and the results was compared with the response of 20
buildings founded on shallow foundation. The author found that the raft or mat 21
foundation usually induce longer natural period and much significant displacement 22
amplitudes in superstructures and foundations. The conventional design procedure 23
without the influence of SSI cannot fully represent the real behaviour of high rise 24
buildings. In the study of Galal and Naimi (2008), the influences of SSI on the 25
seismic response of 20-storey moment resisting frames were evaluated by comparing 26
the flexible-base model to the rigid-base model under the act of 13 different 27
earthquake records on four types of soils. It is concluded that the fixed-base 28
assumption cannot represent the true seismic behaviour. Besides, the author 29
recommended that designers and researchers should pay more attention to determine 30
whether considering SSI effects is beneficial or detrimental of a structure’s seismic 1
response. In the research of Bilotta et al. (2015), seismic response of a 100 m 2
high-rise building in Naples (Italy) resting on a piled raft floating foundation was 3
evaluated. In this model, the site amplification effects and SSI were adequately 4
considered. The results indicated that the peat layer acted as a natural damper in the 5
system and thus, it is beneficial in the free-field seismic behaviour. In addition, the 6
influences of inertial interaction were assessed considering soil-foundation 7
compliance and it leads to an increase of the natural period of the system. The 8
prolonged natural period results in further decrease of spectral acceleration. Bagheri et 9
al. (2018) carried out numerical simulations on 15-storey and 30-storey frame 10
structures rested on six types of pile foundations to study the seismic behaviour of the 11
structures. The numerical results indicated that the performance level of the structures 12
is related to the pile configuration, ground motion features and height-width ratios of 13
the superstructures. Moreover, SSI was founded to have remarkable influences on the 14
distribution way of the shear forces along the superstructures. Scarfone et al. (2020) 15
investigated the impacts of SSI on a 20-storey frame-shear wall building using 3D 16
nonlinear dynamic time history analyses. Particularly, three foundation types (shallow 17
foundation, compensated foundation and pile foundation) were evaluated. Results 18
showed that the increase in foundation flexibility can result in a decrease of seismic 19
demand and a more obvious foundation rotation. Arboleda-Monsalve et al. (2020) 20
investigated the seismic performance of 40-storey buildings considering SSI. Four 21
scenarios of modeling and building configuration were considered: fixed-base model, 22
model considering SSI, fixed-base model with shear walls, and model including shear 23
walls and considering SSI. Taking into account SSI effects in the model altered the 24
seismic demands of the high-rise buildings in regard to the inter-story drifts, storey 25
horizontal accelerations, and seismic-induced settlements. Direct economic losses for 26
the strong earthquakes increased 33% considering SSI effects compared with the 27
fixed-base model. In the research of Qaftan et al. (2020), the scaling process and 28
design of a scaled 15-storey RC frame-shear wall structure with a scale factor of 1:50 29
are addressed. The results indicated the structure built on pile raft foundation 30
experienced on average 30% less rocking in comparison to the structure supported by 1
the raft foundation. 2
From these studies in terms of moment resisting frames and frame-shear wall 3
structures, it has been observed that the current research are mainly focusing on low 4
and mid-rise frame structures. However, the seismic response of low-rise and 5
high-rise structures are different. In the same way, the seismic response of frame 6
structures is different from that of the frame-shear wall structures in which foundation 7
rotation is significant (Sharma et al. 2018; Walsh 2018). Therefore, it is imperative to 8
investigate the behaviour of high-rise wall-frame buildings with different 9
superstructure geometry considering SSI. 10
The aim of this study is to assess the seismic performance of a generally used 11
structural system of high-rise buildings: frame-core tube structure. Firstly, a new 3D 12
numerical soil-structure model is built and verified as a qualified model that can be 13
used for further SSI numerical simulations. After that, seismic behaviour of high-rise 14
frame-core tube structures founded on soft soil deposit with different heights 15
(20-storey, 30-storey, and 40-storey) is investigated. 16
17
2 Development and validation of 3D numerical model 18
In this section, a novel and enhanced soil-structure numerical model is 19
established in finite element software ABAQUS 6.14, and the direct method (Wolf 20
1998) is used to accurately simulate the previous shaking table tests of a frame 21
structure in the authors’ research group. The accuracy of the 3D numerical model is 22
validated by comparing the results of numerical simulation and experimental shaking 23
table tests. In the next section, this validated 3D numerical model will be employed to 24
simulate the high-rise frame-core tube structure. 25
26
2.1 Structural model 27
The prototype of structure in shaking table tests is a 15-story frame structure 28
founded on shallow foundation with a natural frequency of 0.384 Hz and a total mass 29
of 953 tonnes. The aim of the scaling procedure for this test was to achieve “dynamic 30
similarity”, where model and prototype experience homologous forces. Therefore, the 1
methodology of Meymand (1998) was adopted. The first condition is that the shaking 2
table test is carried out in a 1-g environment, which defines model and prototype 3
accelerations to be equal. Secondly, a model with similar density to the prototype is 4
desired. By defining scaling conditions for density and acceleration, a complete set of 5
dimensionally correct scaling relations can be derived for all variables being studied. 6
By comparing shaking table specifications and dimension and weight of scaled model 7
considering different scaling factors, geometric scaling factor (λ) of 1:30 provides the 8
largest achievable scale model with rational scales, maximum payload, and 9
overturning moment which meet the facility limitations. Thus, scaling factor of 1:30 is 10
adopted for experimental shaking table tests in this study. 11
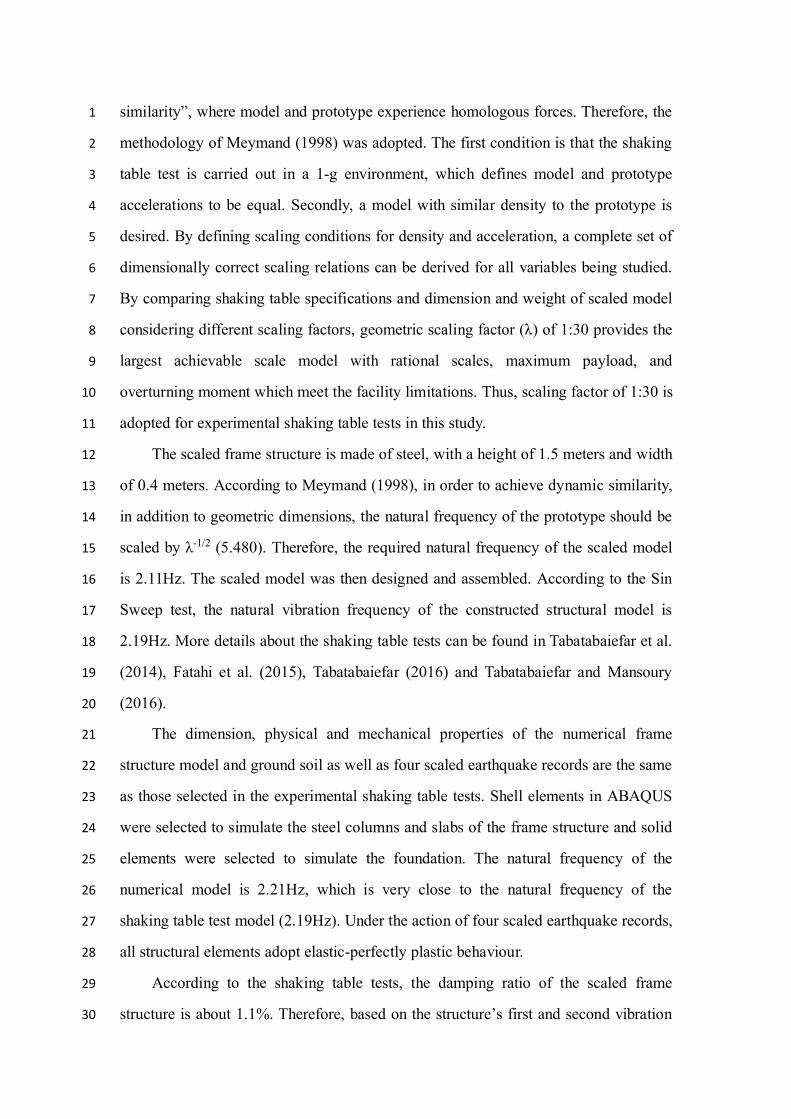
The scaled frame structure is made of steel, with a height of 1.5 meters and width 12
of 0.4 meters. According to Meymand (1998), in order to achieve dynamic similarity, 13
in addition to geometric dimensions, the natural frequency of the prototype should be 14
scaled by λ-1/2 (5.480). Therefore, the required natural frequency of the scaled model 15
is 2.11Hz. The scaled model was then designed and assembled. According to the Sin 16
Sweep test, the natural vibration frequency of the constructed structural model is 17
2.19Hz. More details about the shaking table tests can be found in Tabatabaiefar et al. 18
(2014), Fatahi et al. (2015), Tabatabaiefar (2016) and Tabatabaiefar and Mansoury 19
(2016). 20
The dimension, physical and mechanical properties of the numerical frame 21
structure model and ground soil as well as four scaled earthquake records are the same 22
as those selected in the experimental shaking table tests. Shell elements in ABAQUS 23
were selected to simulate the steel columns and slabs of the frame structure and solid 24
elements were selected to simulate the foundation. The natural frequency of the 25
numerical model is 2.21Hz, which is very close to the natural frequency of the 26
shaking table test model (2.19Hz). Under the action of four scaled earthquake records, 27
all structural elements adopt elastic-perfectly plastic behaviour. 28
According to the shaking table tests, the damping ratio of the scaled frame 29
structure is about 1.1%. Therefore, based on the structure’s first and second vibration 30
frequencies, two damping coefficients α and β can be obtained as 2.297 and 0.0004. 1
Fig. 1 illustrates the 3D numerical model of this scaled frame structure. 2
3 Fig. 1 3D numerical model of this scaled fixed-base frame structure in ABAQUS 4
5
2.2 Soil model 6
The soil element is simulated by 3D eight-node reduced integration element 7
C3D8R and the Mohr-Coulomb model is adopted. In ABAQUS, cohesion and of 8
internal friction angle (the same values as used in the shaking table tests) and the 9
tension cut off option are specified. 10
When calculating wave propagation or seismic response in soil and rock medium, 11
the fully nonlinear method is a common method to capture the soil nonlinearity. In 12
this method, the nonlinear backbone curves and trial and error were used to obtain the 13
strain-compatible values of soil damping and shear modulus. The detailed steps of this 14
method can be found in Tabatabaiefar et al. (2013), Fatahi and Tabatabaiefar (2014) 15
and Tabatabaiefar et al (2017). 16
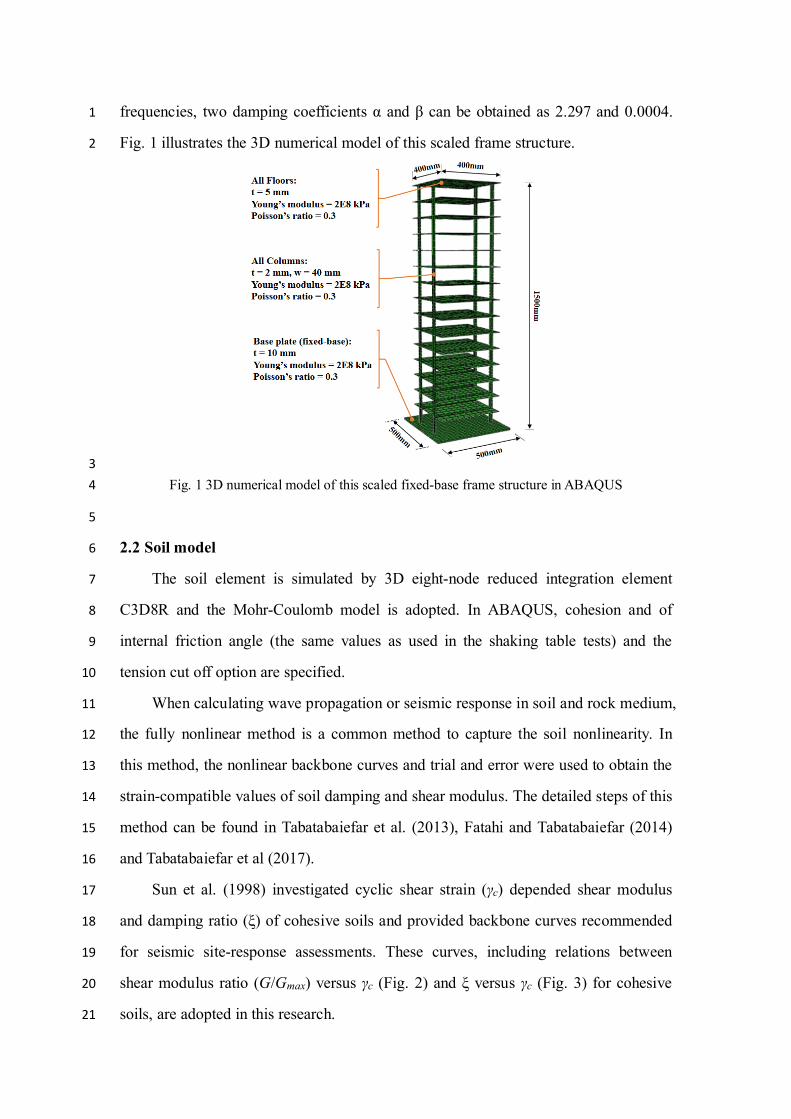
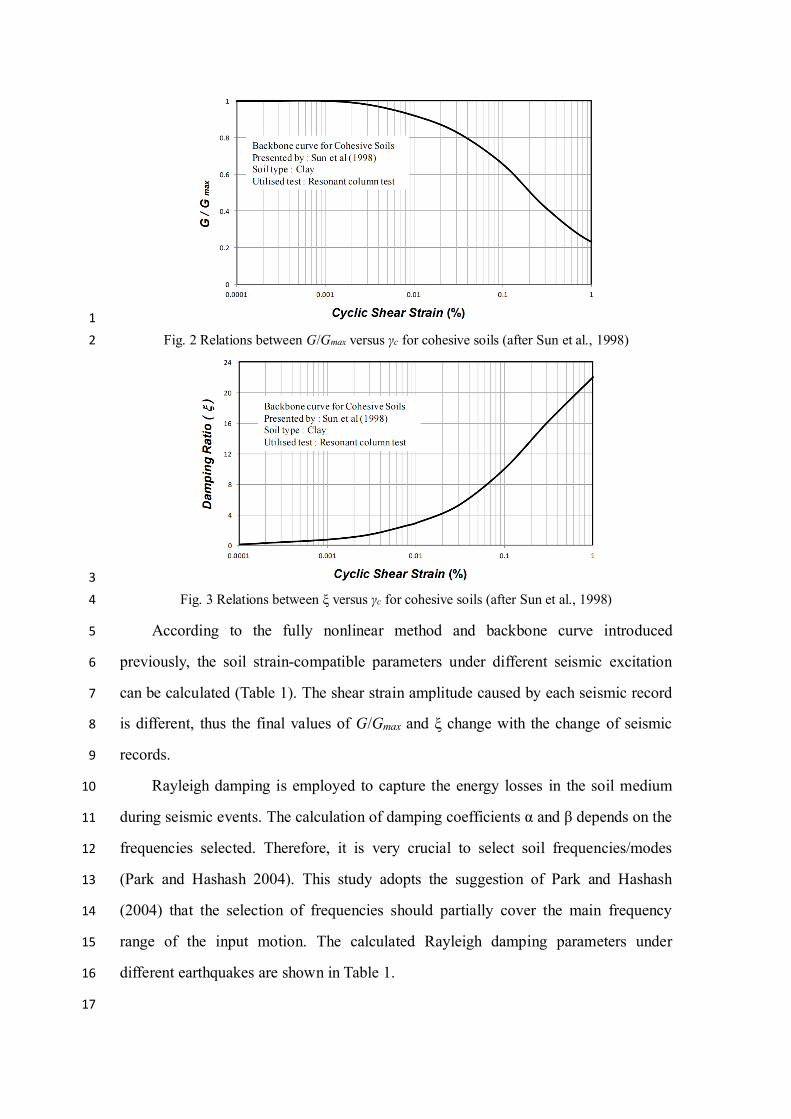
Sun et al. (1998) investigated cyclic shear strain (γc) depended shear modulus 17
and damping ratio (ξ) of cohesive soils and provided backbone curves recommended 18
for seismic site-response assessments. These curves, including relations between 19
shear modulus ratio (G/Gmax) versus γc (Fig. 2) and ξ versus γc (Fig. 3) for cohesive 20
soils, are adopted in this research. 21
1 Fig. 2 Relations between G/Gmax versus γc for cohesive soils (after Sun et al., 1998) 2
3 Fig. 3 Relations between ξ versus γc for cohesive soils (after Sun et al., 1998) 4
According to the fully nonlinear method and backbone curve introduced 5
previously, the soil strain-compatible parameters under different seismic excitation 6
can be calculated (Table 1). The shear strain amplitude caused by each seismic record 7
is different, thus the final values of G/Gmax and ξ change with the change of seismic 8
records. 9
Rayleigh damping is employed to capture the energy losses in the soil medium 10
during seismic events. The calculation of damping coefficients α and β depends on the 11
frequencies selected. Therefore, it is very crucial to select soil frequencies/modes 12
(Park and Hashash 2004). This study adopts the suggestion of Park and Hashash 13
(2004) that the selection of frequencies should partially cover the main frequency 14
range of the input motion. The calculated Rayleigh damping parameters under 15
different earthquakes are shown in Table 1. 16
17
Table 1 Adopted strain-compatible parameters and damping parameters for the soil-frame 1 structure system 2
Earthquake records G/Gmax ξ Damping coefficients
Scaled El-Centro 0.48 14.0% α=5.245
β=0.0028
Scaled Hachinohe 0.36 17.1% α=2.540
β=0.0071
Scaled Kobe 0.33 17.5% α=5.885
β=0.0039
Scaled Northridge 0.25 19.8% α=6.534
β=0.0044
3
2.3 Contact surface of foundation and soil 4
Surface to surface contact is selected to simulate the interaction between the 5
bottom surface of foundation (master surface) and the top surface of soil medium 6
(slave surface) during seismic loading. In addition, finite sliding formulation and the 7
surface-to-surface discretisation method are used. 8
In numerical simulation, mechanical behaviour of the contact surfaces are 9
divided into normal behaviour and tangential behaviour. Normal behaviour adopts 10
hard contact which uses Lagrange Multipliers to enforce contact constraints. (Nguyen 11
et al. 2017) In tangential behavior, penalty friction formulation is adopted and 12
contact-pressure-dependent data is used to simulate the Mohr-Coulomb failure 13
criterion between the contact surfaces of foundation and soil. 14
15
2.4 Boundary conditions and seismic motion input method 16
When using numerical methods to solve the dynamic soil-structure interaction 17
problem, it is generally inevitable to extract a finite calculation area from the infinite 18
medium. The simulation of the infinite foundation can be achieved by introducing 19
artificial boundary condition (ABC) on boundaries of this area to ensure that 20
boundary can efficiently absorb the scattering waves energy (Liu et al. 2006). 21
Compared with viscous boundary, viscous-spring boundary can absorb the 1
energy of the scattering waves on the boundary and capture the recovery ability of a 2
semi-infinite ground without the problems of high frequency instability and low 3
frequency drift (Gu et al. 2007). Therefore, the viscous-spring boundary is adopted. 4
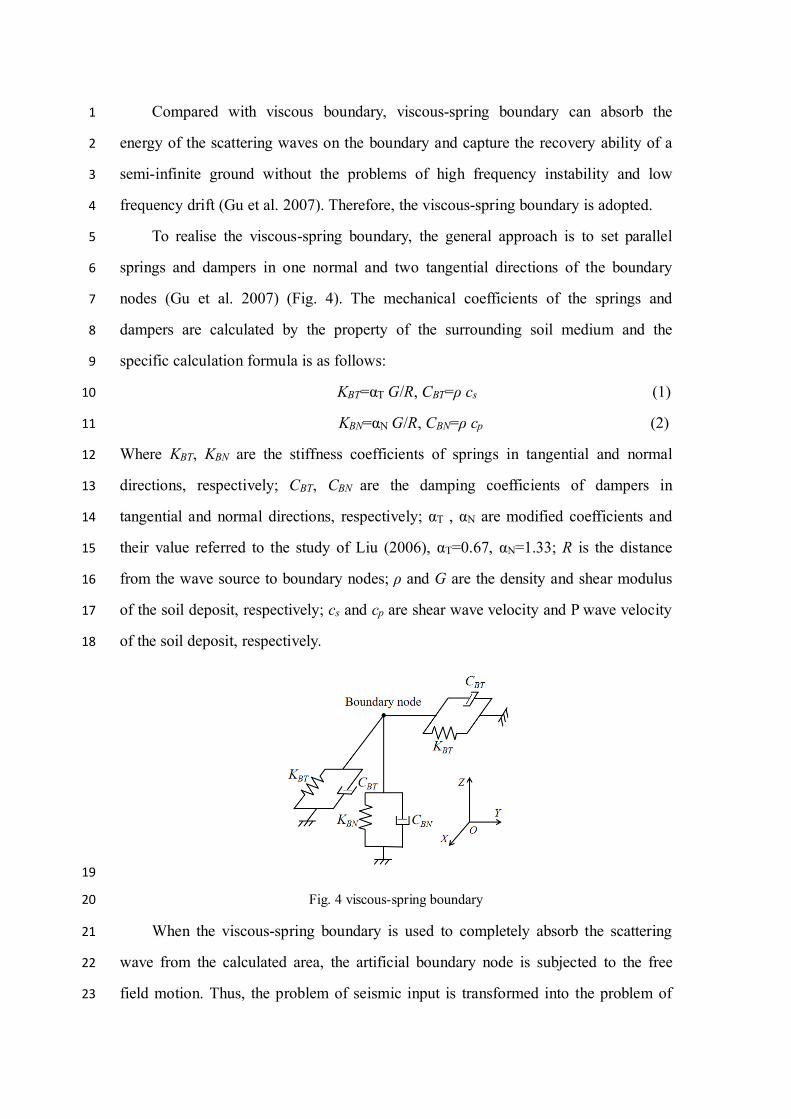
To realise the viscous-spring boundary, the general approach is to set parallel 5
springs and dampers in one normal and two tangential directions of the boundary 6
nodes (Gu et al. 2007) (Fig. 4). The mechanical coefficients of the springs and 7
dampers are calculated by the property of the surrounding soil medium and the 8
specific calculation formula is as follows: 9
KBT=αT G/R, CBT=ρ cs (1) 10
KBN=αN G/R, CBN=ρ cp (2) 11
Where KBT, KBN are the stiffness coefficients of springs in tangential and normal 12
directions, respectively; CBT, CBN are the damping coefficients of dampers in 13
tangential and normal directions, respectively; αT , αN are modified coefficients and 14
their value referred to the study of Liu (2006), αT=0.67, αN=1.33; R is the distance 15
from the wave source to boundary nodes; ρ and G are the density and shear modulus 16
of the soil deposit, respectively; cs and cp are shear wave velocity and P wave velocity 17
of the soil deposit, respectively. 18
19
Fig. 4 viscous-spring boundary 20
When the viscous-spring boundary is used to completely absorb the scattering 21
wave from the calculated area, the artificial boundary node is subjected to the free 22
field motion. Thus, the problem of seismic input is transformed into the problem of 23
free field motion acting on boundary nodes, and the free field motion can be 1
transformed into the equivalent node force Fb acting on boundary nodes (Ma 2020). 2
The equivalent node force Fb includes three parts: the first two parts can eliminate the 3
impacts of viscous-spring boundary, and the third part is the stress generated by free 4
field motion on the artificial boundary: 5
Fb = (Kbubff + Cbvbff +σbff n) Ab (3) 6
Where ubff = [ux νy wz]T is free field displacement vector at artificial boundary nodes, 7
vbff = [vx νy vz]T is free field velocity vector at artificial boundary nodes, σbff is free 8
field stress tensor, Kb is spring stiffness of viscous-spring boundary, Cb is damping 9
coefficient of viscous-spring boundary. Ab is the influencing area of the boundary 10
node, n is the cosine vector of the normal direction outside the boundaries. By 11
referring to the method of Ma (2020) and compiling a simple program in MATLAB 12
software, the equivalent nodal force amplitudes in the three directions of each node 13
can be calculated, and then the amplitude file can be read into the inp file of 14
ABAQUS, and thus the seismic equivalent nodal forces can be applied on 15
viscous-spring boundary. After that, the seismic behaviour of the soil-structure model 16
under four scaled earthquake acceleration records can be analysed. 17
18
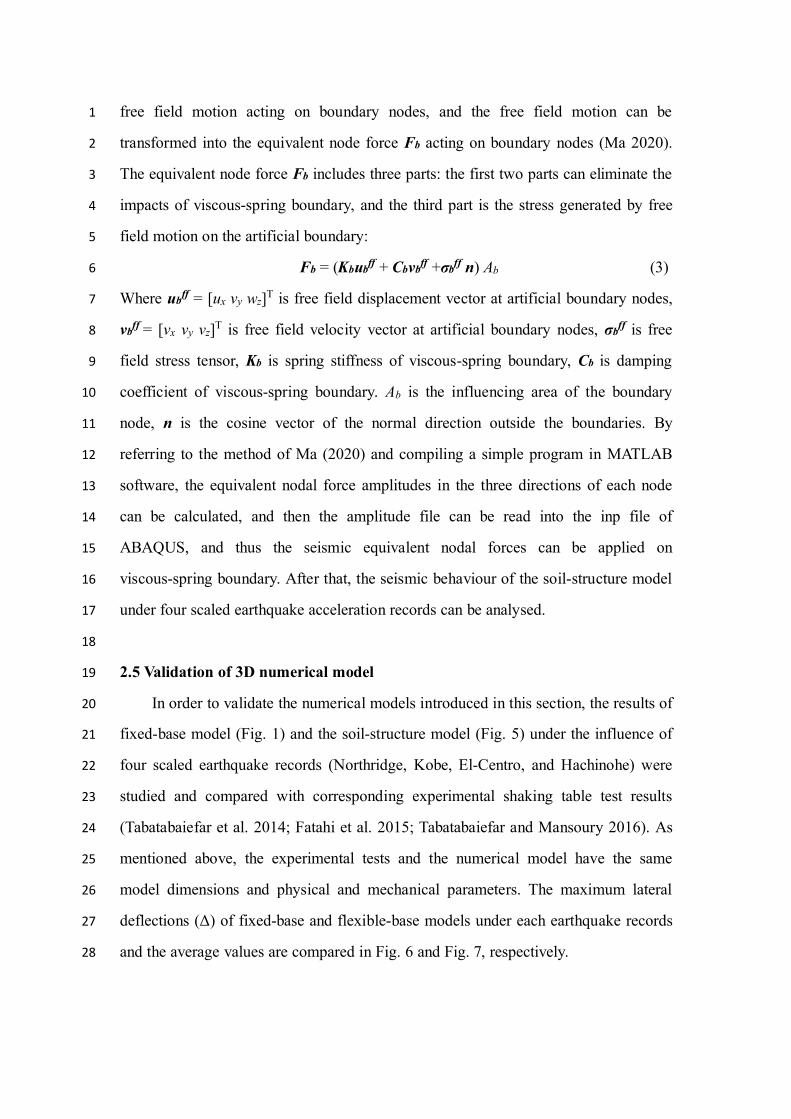
2.5 Validation of 3D numerical model 19
In order to validate the numerical models introduced in this section, the results of 20
fixed-base model (Fig. 1) and the soil-structure model (Fig. 5) under the influence of 21
four scaled earthquake records (Northridge, Kobe, El-Centro, and Hachinohe) were 22
studied and compared with corresponding experimental shaking table test results 23
(Tabatabaiefar et al. 2014; Fatahi et al. 2015; Tabatabaiefar and Mansoury 2016). As 24
mentioned above, the experimental tests and the numerical model have the same 25
model dimensions and physical and mechanical parameters. The maximum lateral 26
deflections (Δ) of fixed-base and flexible-base models under each earthquake records 27
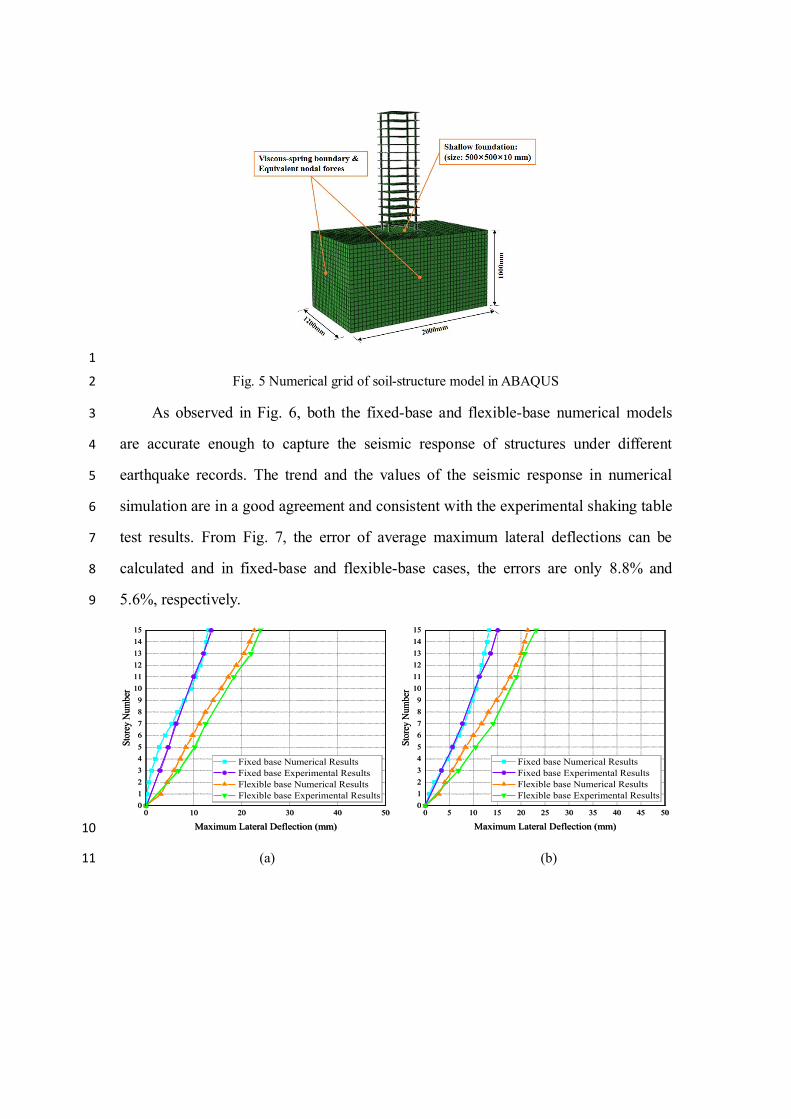
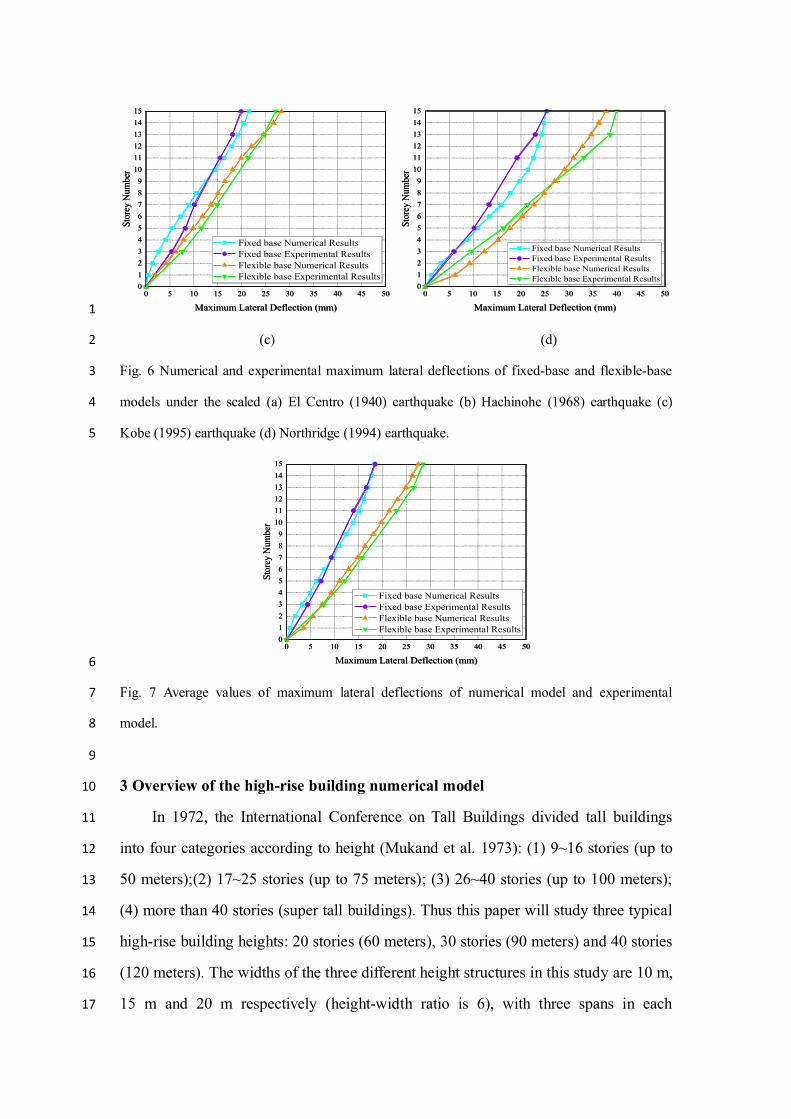
and the average values are compared in Fig. 6 and Fig. 7, respectively. 28
1
Fig. 5 Numerical grid of soil-structure model in ABAQUS 2
As observed in Fig. 6, both the fixed-base and flexible-base numerical models 3
are accurate enough to capture the seismic response of structures under different 4
earthquake records. The trend and the values of the seismic response in numerical 5
simulation are in a good agreement and consistent with the experimental shaking table 6
test results. From Fig. 7, the error of average maximum lateral deflections can be 7
calculated and in fixed-base and flexible-base cases, the errors are only 8.8% and 8
5.6%, respectively. 9
0 10 20 30 40 500123456789
101112131415
Stor
ey N
umbe
r
Maximum Lateral Deflection (mm)
Fixed base Numerical Results Fixed base Experimental Results Flexible base Numerical Results Flexible base Experimental Results
0 10 20 30 40 500123456789
101112131415
Stor
ey N
umbe
r
Maximum Lateral Deflection (mm)
Fixed base Numerical Results Fixed base Experimental Results Flexible base Numerical Results Flexible base Experimental Results
0 5 10 15 20 25 30 35 40 45 50
0123456789
101112131415
Stor
ey N
umbe
r
Maximum Lateral Deflection (mm)
Fixed base Numerical Results Fixed base Experimental Results Flexible base Numerical Results Flexible base Experimental Results
0 5 10 15 20 25 30 35 40 45 500123456789
101112131415
Stor
ey N
umbe
r
Maximum Lateral Deflection (mm)
Fixed base Numerical Results Fixed base Experimental Results Flexible base Numerical Results Flexible base Experimental Results
10
(a) (b) 11
0 5 10 15 20 25 30 35 40 45 500123456789
101112131415
Stor
ey N
umbe
r
Maximum Lateral Deflection (mm)
Fixed base Numerical Results Fixed base Experimental Results Flexible base Numerical Results Flexible base Experimental Results
0 5 10 15 20 25 30 35 40 45 500123456789
101112131415
Stor
ey N
umbe
r
Maximum Lateral Deflection (mm)
Fixed base Numerical Results Fixed base Experimental Results Flexible base Numerical Results Flexible base Experimental Results
0 5 10 15 20 25 30 35 40 45 50
0123456789
101112131415
Stor
ey N
umbe
r
Maximum Lateral Deflection (mm)
Fixed base Numerical Results Fixed base Experimental Results Flexible base Numerical Results Flexible base Experimental Results
0 5 10 15 20 25 30 35 40 45 500123456789
101112131415
Stor
ey N
umbe
r
Maximum Lateral Deflection (mm)
Fixed base Numerical Results Fixed base Experimental Results Flexible base Numerical Results Flexible base Experimental Results
1
(c) (d) 2
Fig. 6 Numerical and experimental maximum lateral deflections of fixed-base and flexible-base 3
models under the scaled (a) El Centro (1940) earthquake (b) Hachinohe (1968) earthquake (c) 4
Kobe (1995) earthquake (d) Northridge (1994) earthquake. 5
0 5 10 15 20 25 30 35 40 45 500123456789
101112131415
Stor
ey N
umbe
r
Maximum Lateral Deflection (mm)
Fixed base Numerical Results Fixed base Experimental Results Flexible base Numerical Results Flexible base Experimental Results
0 5 10 15 20 25 30 35 40 45 500123456789
101112131415
Stor
ey N
umbe
r
Maximum Lateral Deflection (mm)
Fixed base Numerical Results Fixed base Experimental Results Flexible base Numerical Results Flexible base Experimental Results
6
Fig. 7 Average values of maximum lateral deflections of numerical model and experimental 7
model. 8
9
3 Overview of the high-rise building numerical model 10
In 1972, the International Conference on Tall Buildings divided tall buildings 11
into four categories according to height (Mukand et al. 1973): (1) 9~16 stories (up to 12
50 meters);(2) 17~25 stories (up to 75 meters); (3) 26~40 stories (up to 100 meters); 13
(4) more than 40 stories (super tall buildings). Thus this paper will study three typical 14
high-rise building heights: 20 stories (60 meters), 30 stories (90 meters) and 40 stories 15
(120 meters). The widths of the three different height structures in this study are 10 m, 16
15 m and 20 m respectively (height-width ratio is 6), with three spans in each 17
direction. 1
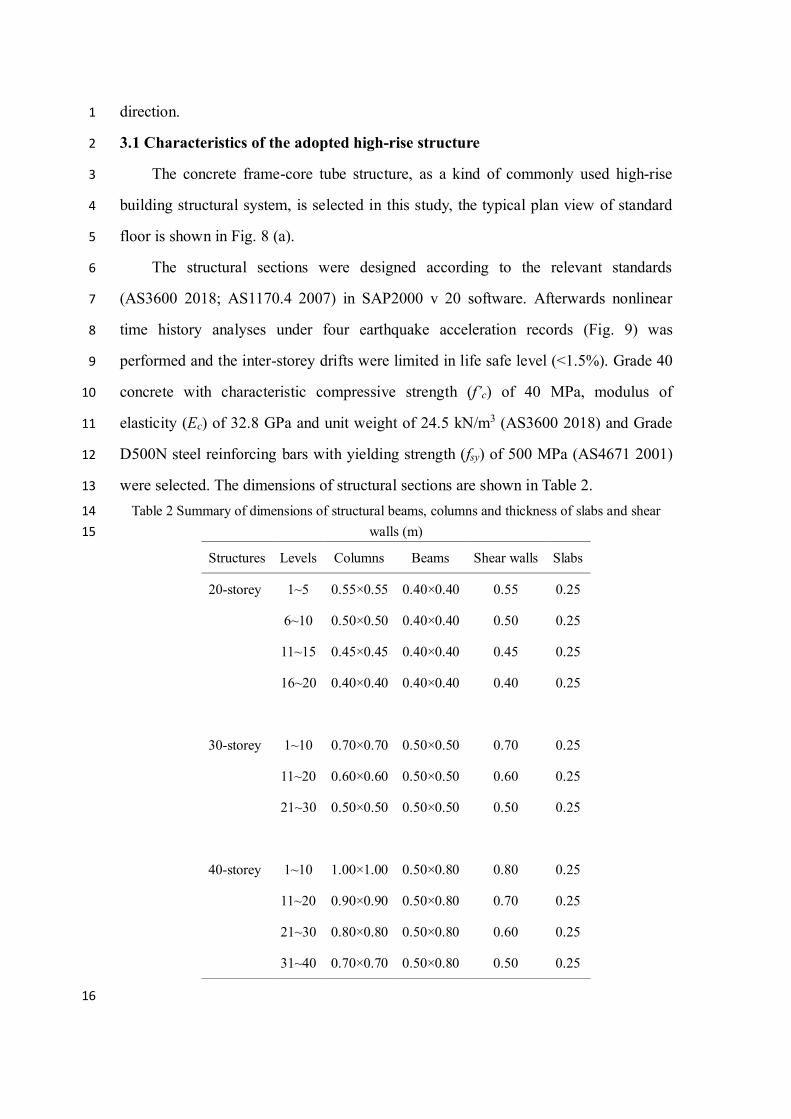
3.1 Characteristics of the adopted high-rise structure 2
The concrete frame-core tube structure, as a kind of commonly used high-rise 3
building structural system, is selected in this study, the typical plan view of standard 4
floor is shown in Fig. 8 (a). 5
The structural sections were designed according to the relevant standards 6
(AS3600 2018; AS1170.4 2007) in SAP2000 v 20 software. Afterwards nonlinear 7
time history analyses under four earthquake acceleration records (Fig. 9) was 8
performed and the inter-storey drifts were limited in life safe level (<1.5%). Grade 40 9
concrete with characteristic compressive strength (f’c) of 40 MPa, modulus of 10
elasticity (Ec) of 32.8 GPa and unit weight of 24.5 kN/m3 (AS3600 2018) and Grade 11
D500N steel reinforcing bars with yielding strength (fsy) of 500 MPa (AS4671 2001) 12
were selected. The dimensions of structural sections are shown in Table 2. 13
Table 2 Summary of dimensions of structural beams, columns and thickness of slabs and shear 14 walls (m) 15
Structures Levels Columns Beams Shear walls Slabs
20-storey 1~5 0.55×0.55 0.40×0.40 0.55 0.25
6~10 0.50×0.50 0.40×0.40 0.50 0.25
11~15 0.45×0.45 0.40×0.40 0.45 0.25
16~20 0.40×0.40 0.40×0.40 0.40 0.25
30-storey 1~10 0.70×0.70 0.50×0.50 0.70 0.25
11~20 0.60×0.60 0.50×0.50 0.60 0.25
21~30 0.50×0.50 0.50×0.50 0.50 0.25
40-storey 1~10 1.00×1.00 0.50×0.80 0.80 0.25
11~20 0.90×0.90 0.50×0.80 0.70 0.25
21~30 0.80×0.80 0.50×0.80 0.60 0.25
31~40 0.70×0.70 0.50×0.80 0.50 0.25
16
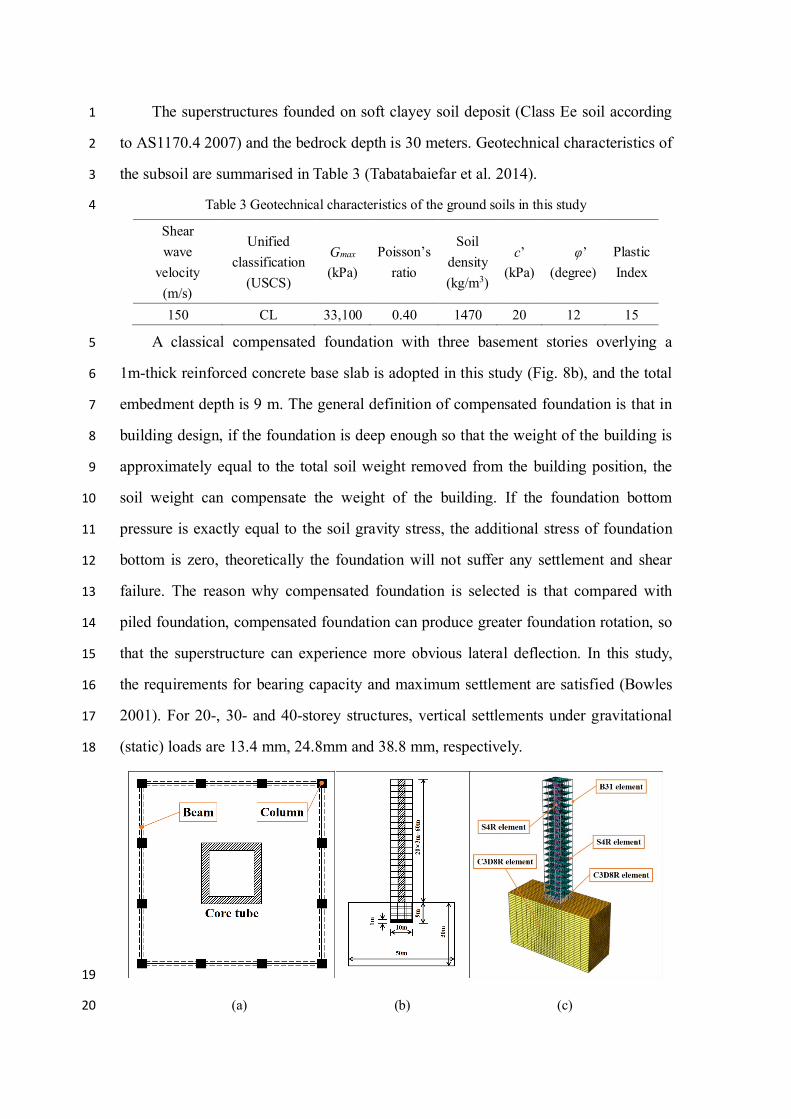
The superstructures founded on soft clayey soil deposit (Class Ee soil according 1
to AS1170.4 2007) and the bedrock depth is 30 meters. Geotechnical characteristics of 2
the subsoil are summarised in Table 3 (Tabatabaiefar et al. 2014). 3
Table 3 Geotechnical characteristics of the ground soils in this study 4
Shear wave
velocity (m/s)
Unified classification
(USCS)
Gmax (kPa)
Poisson’s ratio
Soil density (kg/m3)
c’ (kPa)
φ’ (degree)
Plastic Index
150 CL 33,100 0.40 1470 20 12 15
A classical compensated foundation with three basement stories overlying a 5
1m-thick reinforced concrete base slab is adopted in this study (Fig. 8b), and the total 6
embedment depth is 9 m. The general definition of compensated foundation is that in 7
building design, if the foundation is deep enough so that the weight of the building is 8
approximately equal to the total soil weight removed from the building position, the 9
soil weight can compensate the weight of the building. If the foundation bottom 10
pressure is exactly equal to the soil gravity stress, the additional stress of foundation 11
bottom is zero, theoretically the foundation will not suffer any settlement and shear 12
failure. The reason why compensated foundation is selected is that compared with 13
piled foundation, compensated foundation can produce greater foundation rotation, so 14
that the superstructure can experience more obvious lateral deflection. In this study, 15
the requirements for bearing capacity and maximum settlement are satisfied (Bowles 16
2001). For 20-, 30- and 40-storey structures, vertical settlements under gravitational 17
(static) loads are 13.4 mm, 24.8mm and 38.8 mm, respectively. 18
19
(a) (b) (c) 20
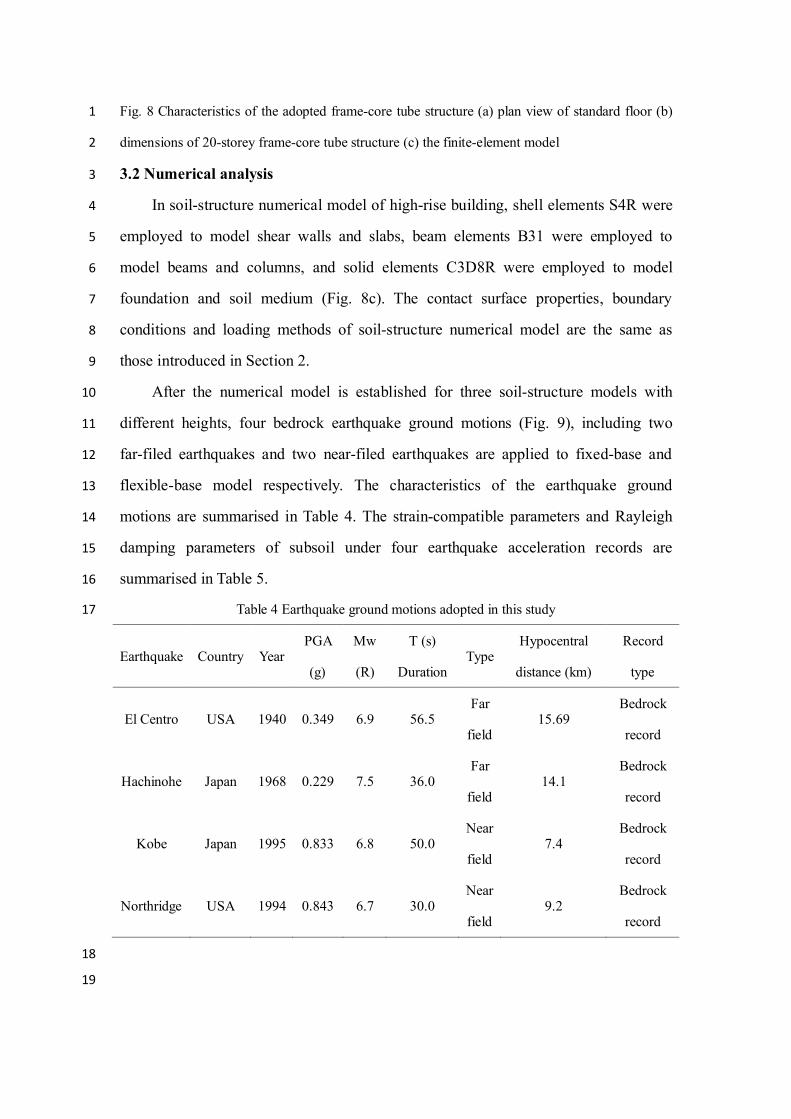
Fig. 8 Characteristics of the adopted frame-core tube structure (a) plan view of standard floor (b) 1
dimensions of 20-storey frame-core tube structure (c) the finite-element model 2
3.2 Numerical analysis 3
In soil-structure numerical model of high-rise building, shell elements S4R were 4
employed to model shear walls and slabs, beam elements B31 were employed to 5
model beams and columns, and solid elements C3D8R were employed to model 6
foundation and soil medium (Fig. 8c). The contact surface properties, boundary 7
conditions and loading methods of soil-structure numerical model are the same as 8
those introduced in Section 2. 9
After the numerical model is established for three soil-structure models with 10
different heights, four bedrock earthquake ground motions (Fig. 9), including two 11
far-filed earthquakes and two near-filed earthquakes are applied to fixed-base and 12
flexible-base model respectively. The characteristics of the earthquake ground 13
motions are summarised in Table 4. The strain-compatible parameters and Rayleigh 14
damping parameters of subsoil under four earthquake acceleration records are 15
summarised in Table 5. 16
Table 4 Earthquake ground motions adopted in this study 17
Earthquake Country Year PGA
(g)
Mw
(R)
T (s)
Duration Type
Hypocentral
distance (km)
Record
type
El Centro USA 1940 0.349 6.9 56.5 Far
field 15.69
Bedrock
record
Hachinohe Japan 1968 0.229 7.5 36.0 Far
field 14.1
Bedrock
record
Kobe Japan 1995 0.833 6.8 50.0 Near
field 7.4
Bedrock
record
Northridge USA 1994 0.843 6.7 30.0 Near
field 9.2
Bedrock
record
18
19
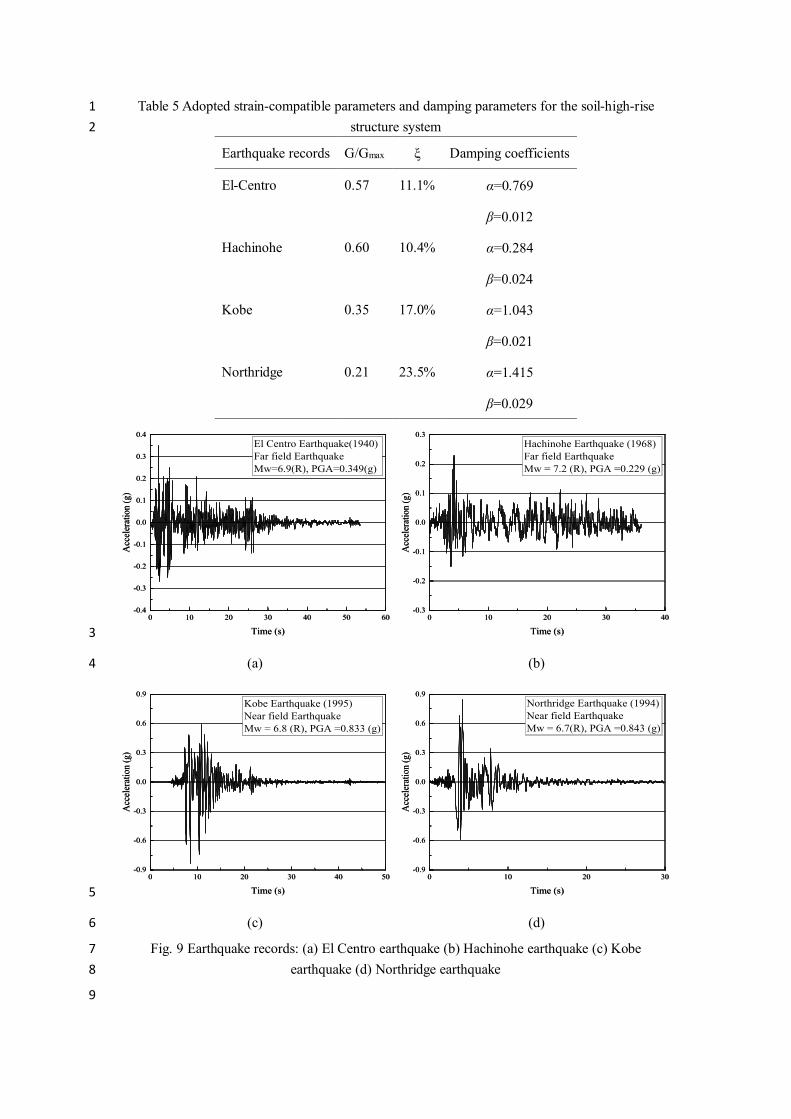
Table 5 Adopted strain-compatible parameters and damping parameters for the soil-high-rise 1 structure system 2
Earthquake records G/Gmax ξ Damping coefficients
El-Centro 0.57 11.1% α=0.769
β=0.012
Hachinohe 0.60 10.4% α=0.284
β=0.024
Kobe 0.35 17.0% α=1.043
β=0.021
Northridge 0.21 23.5% α=1.415
β=0.029
0 10 20 30 40 50 60-0.4
-0.3
-0.2
-0.1
0.0
0.1
0.2
0.3
0.4
Acc
eler
atio
n (g
)
Time (s)
El Centro Earthquake(1940) Far field EarthquakeMw=6.9(R), PGA=0.349(g)
0 10 20 30 40 50 60-0.4
-0.3
-0.2
-0.1
0.0
0.1
0.2
0.3
0.4
Acc
eler
atio
n (g
)
Time (s)
El Centro Earthquake(1940) Far field EarthquakeMw=6.9(R), PGA=0.349(g)
0 10 20 30 40
-0.3
-0.2
-0.1
0.0
0.1
0.2
0.3
Acc
eler
atio
n (g
)
Time (s)
Hachinohe Earthquake (1968)Far field EarthquakeMw = 7.2 (R), PGA =0.229 (g)
0 10 20 30 40-0.3
-0.2
-0.1
0.0
0.1
0.2
0.3
Acc
eler
atio
n (g
)
Time (s)
Hachinohe Earthquake (1968)Far field EarthquakeMw = 7.2 (R), PGA =0.229 (g)
3
(a) (b) 4
0 10 20 30 40 50-0.9
-0.6
-0.3
0.0
0.3
0.6
0.9
Acc
eler
atio
n (g
)
Time (s)
Kobe Earthquake (1995)Near field EarthquakeMw = 6.8 (R), PGA =0.833 (g)
0 10 20 30 40 50-0.9
-0.6
-0.3
0.0
0.3
0.6
0.9
Acc
eler
atio
n (g
)
Time (s)
Kobe Earthquake (1995)Near field EarthquakeMw = 6.8 (R), PGA =0.833 (g)
0 10 20 30
-0.9
-0.6
-0.3
0.0
0.3
0.6
0.9
Acc
eler
atio
n (g
)
Time (s)
Northridge Earthquake (1994)Near field EarthquakeMw = 6.7(R), PGA =0.843 (g)
0 10 20 30-0.9
-0.6
-0.3
0.0
0.3
0.6
0.9
Acc
eler
atio
n (g
)
Time (s)
Northridge Earthquake (1994)Near field EarthquakeMw = 6.7(R), PGA =0.843 (g)
5
(c) (d) 6
Fig. 9 Earthquake records: (a) El Centro earthquake (b) Hachinohe earthquake (c) Kobe 7 earthquake (d) Northridge earthquake 8
9
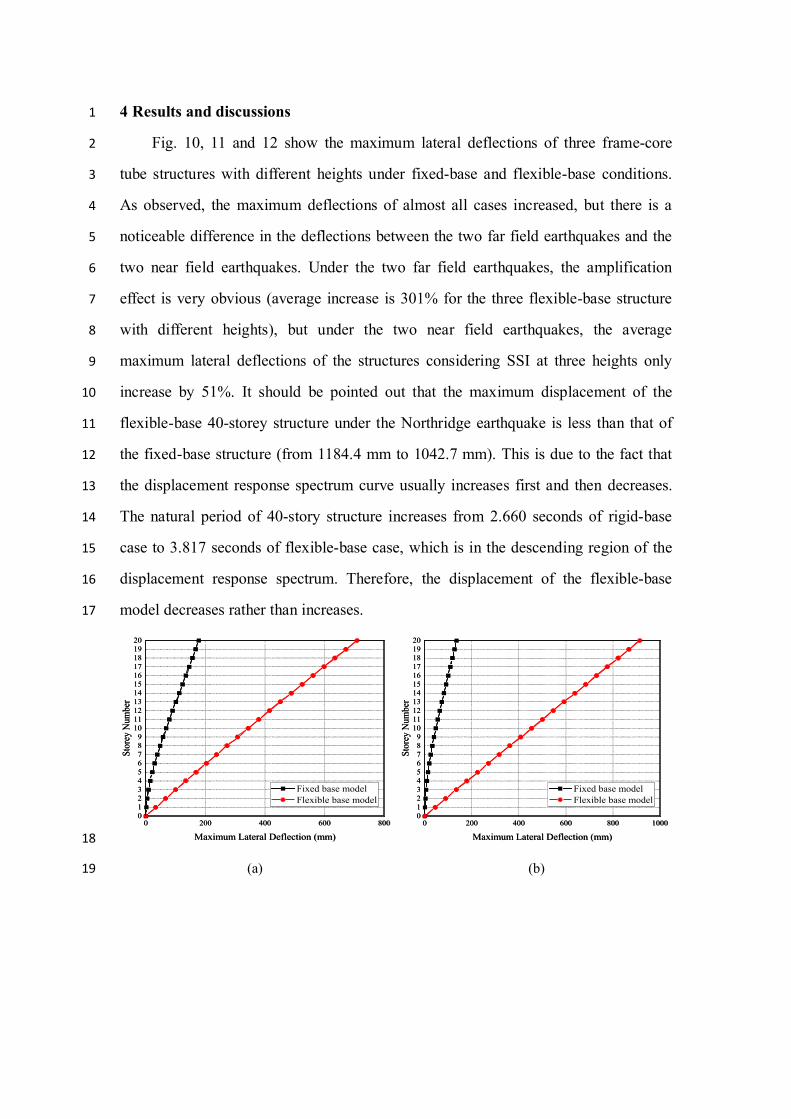
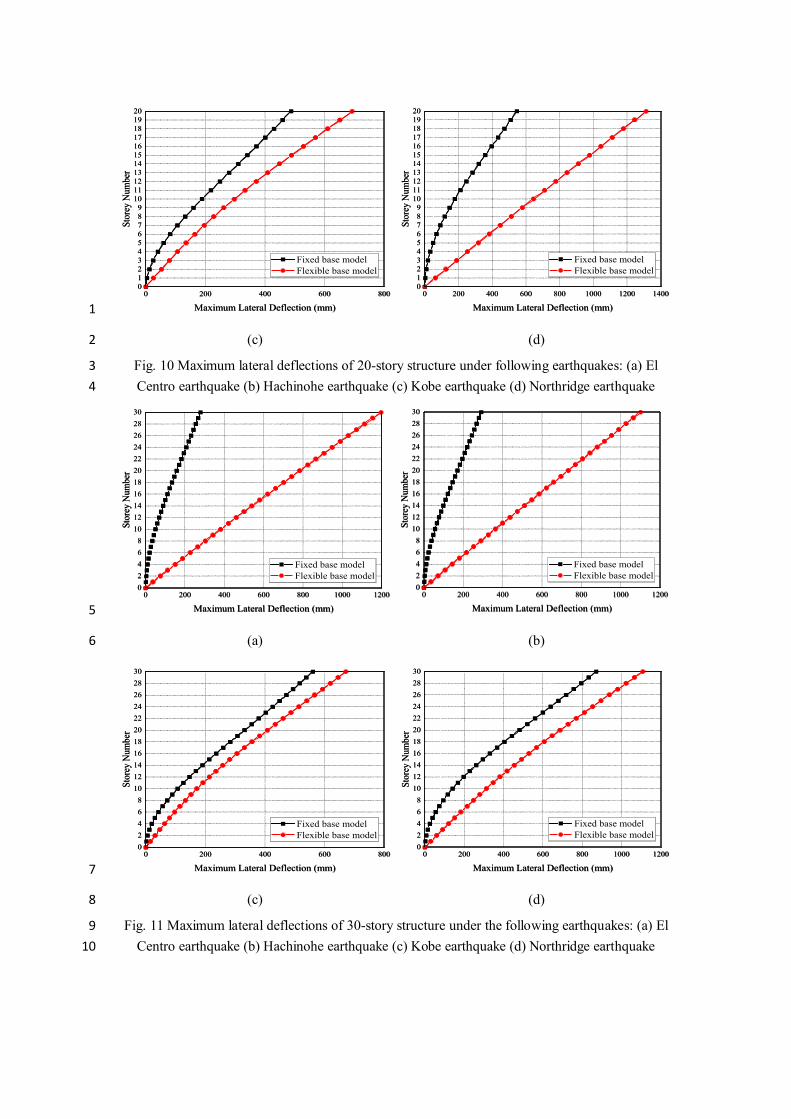
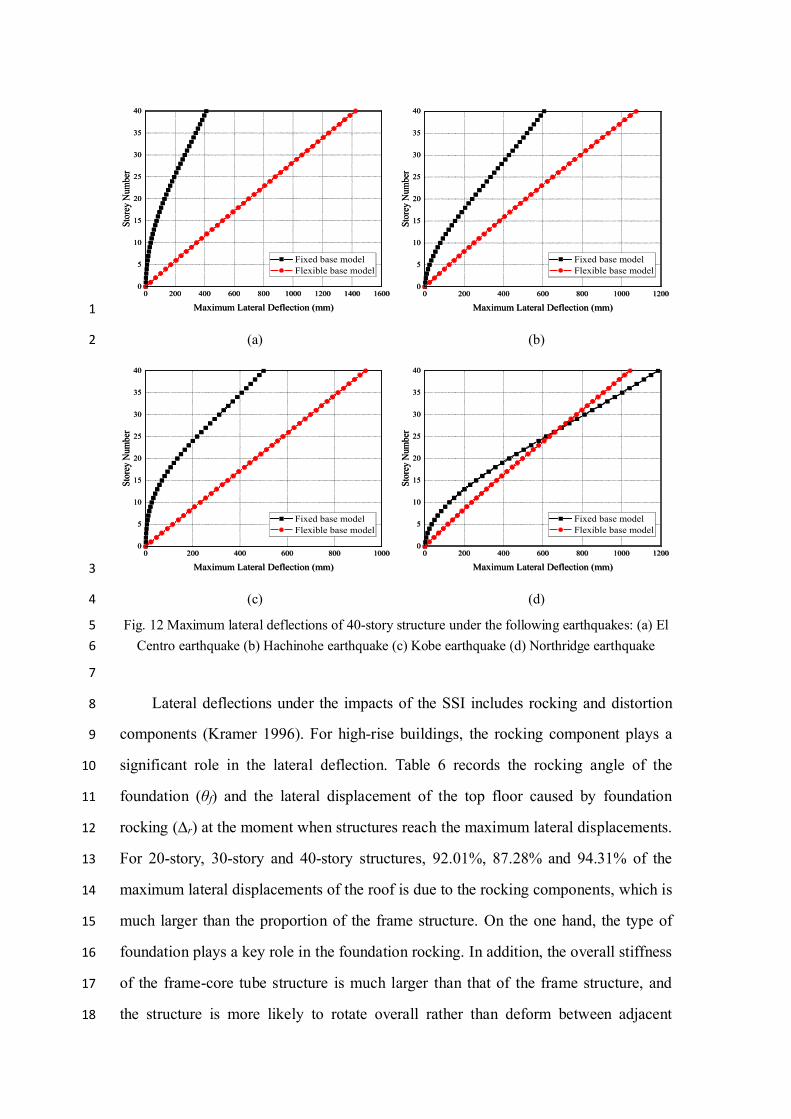
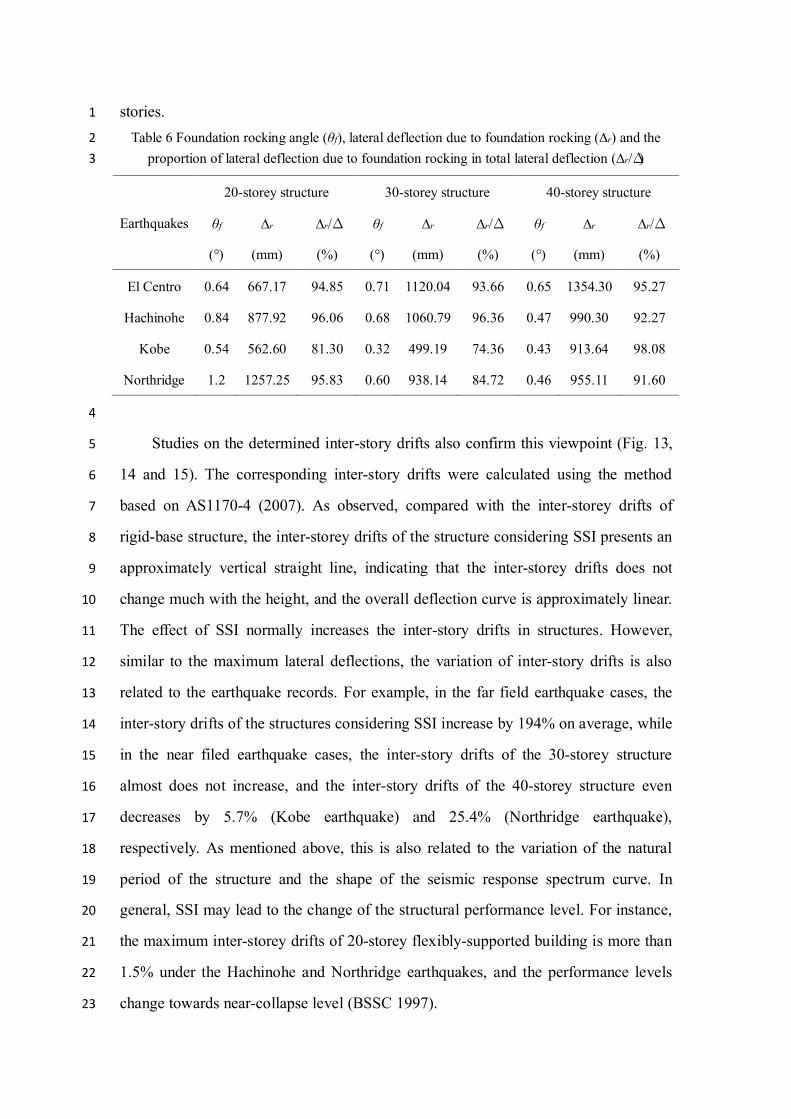
4 Results and discussions 1
Fig. 10, 11 and 12 show the maximum lateral deflections of three frame-core 2
tube structures with different heights under fixed-base and flexible-base conditions. 3
As observed, the maximum deflections of almost all cases increased, but there is a 4
noticeable difference in the deflections between the two far field earthquakes and the 5
two near field earthquakes. Under the two far field earthquakes, the amplification 6
effect is very obvious (average increase is 301% for the three flexible-base structure 7
with different heights), but under the two near field earthquakes, the average 8
maximum lateral deflections of the structures considering SSI at three heights only 9
increase by 51%. It should be pointed out that the maximum displacement of the 10
flexible-base 40-storey structure under the Northridge earthquake is less than that of 11
the fixed-base structure (from 1184.4 mm to 1042.7 mm). This is due to the fact that 12
the displacement response spectrum curve usually increases first and then decreases. 13
The natural period of 40-story structure increases from 2.660 seconds of rigid-base 14
case to 3.817 seconds of flexible-base case, which is in the descending region of the 15
displacement response spectrum. Therefore, the displacement of the flexible-base 16
model decreases rather than increases. 17
0 200 400 600 8000123456789
1011121314151617181920
Stor
ey N
umbe
r
Maximum Lateral Deflection (mm)
Fixed base model Flexible base model
0 200 400 600 8000123456789
1011121314151617181920
Stor
ey N
umbe
r
Maximum Lateral Deflection (mm)
Fixed base model Flexible base model
0 200 400 600 800 1000
0123456789
1011121314151617181920
Stor
ey N
umbe
r
Maximum Lateral Deflection (mm)
Fixed base model Flexible base model
0 200 400 600 800 10000123456789
1011121314151617181920
Stor
ey N
umbe
r
Maximum Lateral Deflection (mm)
Fixed base model Flexible base model
18
(a) (b) 19
0 200 400 600 8000123456789
1011121314151617181920
Stor
ey N
umbe
r
Maximum Lateral Deflection (mm)
Fixed base model Flexible base model
0 200 400 600 8000123456789
1011121314151617181920
Stor
ey N
umbe
r
Maximum Lateral Deflection (mm)
Fixed base model Flexible base model
0 200 400 600 800 1000 1200 1400
0123456789
1011121314151617181920
Stor
ey N
umbe
r
Maximum Lateral Deflection (mm)
Fixed base model Flexible base model
0 200 400 600 800 1000 1200 14000123456789
1011121314151617181920
Stor
ey N
umbe
r
Maximum Lateral Deflection (mm)
Fixed base model Flexible base model
1
(c) (d) 2
Fig. 10 Maximum lateral deflections of 20-story structure under following earthquakes: (a) El 3 Centro earthquake (b) Hachinohe earthquake (c) Kobe earthquake (d) Northridge earthquake 4
0 200 400 600 800 1000 120002468
1012141618202224262830
Stor
ey N
umbe
r
Maximum Lateral Deflection (mm)
Fixed base model Flexible base model
0 200 400 600 800 1000 120002468
1012141618202224262830
Stor
ey N
umbe
r
Maximum Lateral Deflection (mm)
Fixed base model Flexible base model
0 200 400 600 800 1000 1200
02468
1012141618202224262830
Stor
ey N
umbe
r
Maximum Lateral Deflection (mm)
Fixed base model Flexible base model
0 200 400 600 800 1000 120002468
1012141618202224262830
Stor
ey N
umbe
r
Maximum Lateral Deflection (mm)
Fixed base model Flexible base model
5
(a) (b) 6
0 200 400 600 80002468
1012141618202224262830
Stor
ey N
umbe
r
Maximum Lateral Deflection (mm)
Fixed base model Flexible base model
0 200 400 600 80002468
1012141618202224262830
Stor
ey N
umbe
r
Maximum Lateral Deflection (mm)
Fixed base model Flexible base model
0 200 400 600 800 1000 1200
02468
1012141618202224262830
Stor
ey N
umbe
r
Maximum Lateral Deflection (mm)
Fixed base model Flexible base model
0 200 400 600 800 1000 120002468
1012141618202224262830
Stor
ey N
umbe
r
Maximum Lateral Deflection (mm)
Fixed base model Flexible base model
7
(c) (d) 8
Fig. 11 Maximum lateral deflections of 30-story structure under the following earthquakes: (a) El 9 Centro earthquake (b) Hachinohe earthquake (c) Kobe earthquake (d) Northridge earthquake 10
0 200 400 600 800 1000 1200 1400 16000
5
10
15
20
25
30
35
40
Stor
ey N
umbe
r
Maximum Lateral Deflection (mm)
Fixed base model Flexible base model
0 200 400 600 800 1000 1200 1400 16000
5
10
15
20
25
30
35
40
Stor
ey N
umbe
r
Maximum Lateral Deflection (mm)
Fixed base model Flexible base model
0 200 400 600 800 1000 1200
0
5
10
15
20
25
30
35
40
Stor
ey N
umbe
r
Maximum Lateral Deflection (mm)
Fixed base model Flexible base model
0 200 400 600 800 1000 12000
5
10
15
20
25
30
35
40
Stor
ey N
umbe
r
Maximum Lateral Deflection (mm)
Fixed base model Flexible base model
1
(a) (b) 2
0 200 400 600 800 10000
5
10
15
20
25
30
35
40
Stor
ey N
umbe
r
Maximum Lateral Deflection (mm)
Fixed base model Flexible base model
0 200 400 600 800 10000
5
10
15
20
25
30
35
40
Stor
ey N
umbe
r
Maximum Lateral Deflection (mm)
Fixed base model Flexible base model
0 200 400 600 800 1000 1200
0
5
10
15
20
25
30
35
40
Stor
ey N
umbe
r
Maximum Lateral Deflection (mm)
Fixed base model Flexible base model
0 200 400 600 800 1000 12000
5
10
15
20
25
30
35
40
Stor
ey N
umbe
r
Maximum Lateral Deflection (mm)
Fixed base model Flexible base model
3
(c) (d) 4
Fig. 12 Maximum lateral deflections of 40-story structure under the following earthquakes: (a) El 5 Centro earthquake (b) Hachinohe earthquake (c) Kobe earthquake (d) Northridge earthquake 6
7
Lateral deflections under the impacts of the SSI includes rocking and distortion 8
components (Kramer 1996). For high-rise buildings, the rocking component plays a 9
significant role in the lateral deflection. Table 6 records the rocking angle of the 10
foundation (θf) and the lateral displacement of the top floor caused by foundation 11
rocking (∆r) at the moment when structures reach the maximum lateral displacements. 12
For 20-story, 30-story and 40-story structures, 92.01%, 87.28% and 94.31% of the 13
maximum lateral displacements of the roof is due to the rocking components, which is 14
much larger than the proportion of the frame structure. On the one hand, the type of 15
foundation plays a key role in the foundation rocking. In addition, the overall stiffness 16
of the frame-core tube structure is much larger than that of the frame structure, and 17
the structure is more likely to rotate overall rather than deform between adjacent 18
stories. 1
Table 6 Foundation rocking angle (θf), lateral deflection due to foundation rocking (∆r) and the 2 proportion of lateral deflection due to foundation rocking in total lateral deflection (∆r/∆) 3
Earthquakes
20-storey structure 30-storey structure 40-storey structure
θf
(°)
∆r
(mm)
∆r/∆
(%)
θf
(°)
∆r
(mm)
∆r/∆
(%)
θf
(°)
∆r
(mm)
∆r/∆
(%)
El Centro 0.64 667.17 94.85 0.71 1120.04 93.66 0.65 1354.30 95.27
Hachinohe 0.84 877.92 96.06 0.68 1060.79 96.36 0.47 990.30 92.27
Kobe 0.54 562.60 81.30 0.32 499.19 74.36 0.43 913.64 98.08
Northridge 1.2 1257.25 95.83 0.60 938.14 84.72 0.46 955.11 91.60
4
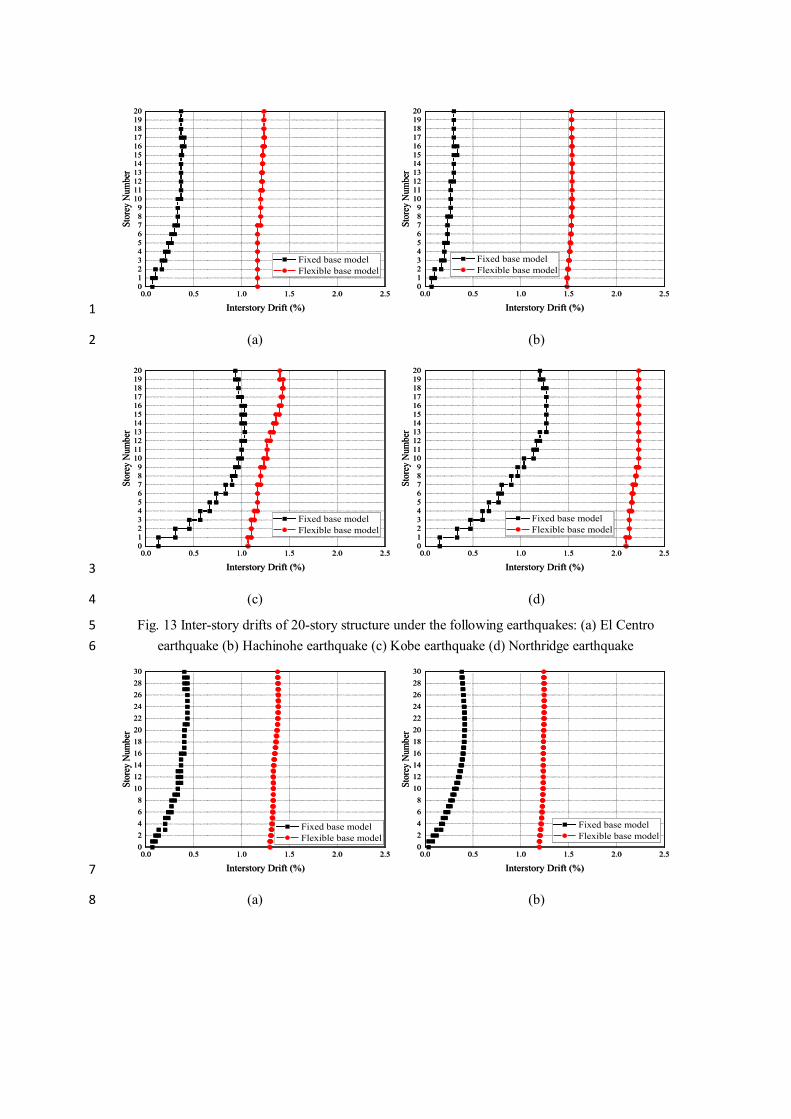
Studies on the determined inter-story drifts also confirm this viewpoint (Fig. 13, 5
14 and 15). The corresponding inter-story drifts were calculated using the method 6
based on AS1170-4 (2007). As observed, compared with the inter-storey drifts of 7
rigid-base structure, the inter-storey drifts of the structure considering SSI presents an 8
approximately vertical straight line, indicating that the inter-storey drifts does not 9
change much with the height, and the overall deflection curve is approximately linear. 10
The effect of SSI normally increases the inter-story drifts in structures. However, 11
similar to the maximum lateral deflections, the variation of inter-story drifts is also 12
related to the earthquake records. For example, in the far field earthquake cases, the 13
inter-story drifts of the structures considering SSI increase by 194% on average, while 14
in the near filed earthquake cases, the inter-story drifts of the 30-storey structure 15
almost does not increase, and the inter-story drifts of the 40-storey structure even 16
decreases by 5.7% (Kobe earthquake) and 25.4% (Northridge earthquake), 17
respectively. As mentioned above, this is also related to the variation of the natural 18
period of the structure and the shape of the seismic response spectrum curve. In 19
general, SSI may lead to the change of the structural performance level. For instance, 20
the maximum inter-storey drifts of 20-storey flexibly-supported building is more than 21
1.5% under the Hachinohe and Northridge earthquakes, and the performance levels 22
change towards near-collapse level (BSSC 1997). 23
0.0 0.5 1.0 1.5 2.0 2.50123456789
1011121314151617181920
Stor
ey N
umbe
r
Interstory Drift (%)
Fixed base model Flexible base model
0.0 0.5 1.0 1.5 2.0 2.50123456789
1011121314151617181920
Stor
ey N
umbe
r
Interstory Drift (%)
Fixed base model Flexible base model
0.0 0.5 1.0 1.5 2.0 2.5
0123456789
1011121314151617181920
Stor
ey N
umbe
r
Interstory Drift (%)
Fixed base model Flexible base model
0.0 0.5 1.0 1.5 2.0 2.50123456789
1011121314151617181920
Stor
ey N
umbe
r
Interstory Drift (%)
Fixed base model Flexible base model
1
(a) (b) 2
0.0 0.5 1.0 1.5 2.0 2.50123456789
1011121314151617181920
Stor
ey N
umbe
r
Interstory Drift (%)
Fixed base model Flexible base model
0.0 0.5 1.0 1.5 2.0 2.50123456789
1011121314151617181920
Stor
ey N
umbe
r
Interstory Drift (%)
Fixed base model Flexible base model
0.0 0.5 1.0 1.5 2.0 2.5
0123456789
1011121314151617181920
Stor
ey N
umbe
r
Interstory Drift (%)
Fixed base model Flexible base model
0.0 0.5 1.0 1.5 2.0 2.50123456789
1011121314151617181920
Stor
ey N
umbe
r
Interstory Drift (%)
Fixed base model Flexible base model
3
(c) (d) 4
Fig. 13 Inter-story drifts of 20-story structure under the following earthquakes: (a) El Centro 5 earthquake (b) Hachinohe earthquake (c) Kobe earthquake (d) Northridge earthquake 6
0.0 0.5 1.0 1.5 2.0 2.502468
1012141618202224262830
Stor
ey N
umbe
r
Interstory Drift (%)
Fixed base model Flexible base model
0.0 0.5 1.0 1.5 2.0 2.502468
1012141618202224262830
Stor
ey N
umbe
r
Interstory Drift (%)
Fixed base model Flexible base model
0.0 0.5 1.0 1.5 2.0 2.5
02468
1012141618202224262830
Stor
ey N
umbe
r
Interstory Drift (%)
Fixed base model Flexible base model
0.0 0.5 1.0 1.5 2.0 2.502468
1012141618202224262830
Stor
ey N
umbe
r
Interstory Drift (%)
Fixed base model Flexible base model
7
(a) (b) 8
0.0 0.5 1.0 1.5 2.0 2.502468
1012141618202224262830
Stor
ey N
umbe
r
Interstory Drift (%)
Fixed base model Flexible base model
0.0 0.5 1.0 1.5 2.0 2.502468
1012141618202224262830
Stor
ey N
umbe
r
Interstory Drift (%)
Fixed base model Flexible base model
0.0 0.5 1.0 1.5 2.0 2.5
02468
1012141618202224262830
Stor
ey N
umbe
r
Interstory Drift (%)
Fixed base model Flexible base model
0.0 0.5 1.0 1.5 2.0 2.502468
1012141618202224262830
Stor
ey N
umbe
r
Interstory Drift (%)
Fixed base model Flexible base model
1
(c) (d) 2
Fig. 14 Inter-story drifts of 30-story structure under the following earthquakes: (a) El Centro 3 earthquake (b) Hachinohe earthquake (c) Kobe earthquake (d) Northridge earthquake 4
0.0 0.5 1.0 1.5 2.0 2.50
5
10
15
20
25
30
35
40
Stor
ey N
umbe
r
Interstory Drift (%)
Fixed base model Flexible base model
0.0 0.5 1.0 1.5 2.0 2.50
5
10
15
20
25
30
35
40
Stor
ey N
umbe
r
Interstory Drift (%)
Fixed base model Flexible base model
0.0 0.5 1.0 1.5 2.0 2.5
0
5
10
15
20
25
30
35
40St
orey
Num
ber
Interstory Drift (%)
Fixed base model Flexible base model
0.0 0.5 1.0 1.5 2.0 2.50
5
10
15
20
25
30
35
40St
orey
Num
ber
Interstory Drift (%)
Fixed base model Flexible base model
5
(a) (b) 6
0.0 0.5 1.0 1.5 2.0 2.50
5
10
15
20
25
30
35
40
Stor
ey N
umbe
r
Interstory Drift (%)
Fixed base model Flexible base model
0.0 0.5 1.0 1.5 2.0 2.50
5
10
15
20
25
30
35
40
Stor
ey N
umbe
r
Interstory Drift (%)
Fixed base model Flexible base model
0.0 0.5 1.0 1.5 2.0 2.5
0
5
10
15
20
25
30
35
40
Stor
ey N
umbe
r
Interstory Drift (%)
Fixed base model Flexible base model
0.0 0.5 1.0 1.5 2.0 2.50
5
10
15
20
25
30
35
40
Stor
ey N
umbe
r
Interstory Drift (%)
Fixed base model Flexible base model
7
(c) (d) 8
Fig. 15 Inter-story drifts of 40-story structure under the following earthquakes: (a) El Centro 9 earthquake (b) Hachinohe earthquake (c) Kobe earthquake (d) Northridge earthquake 10
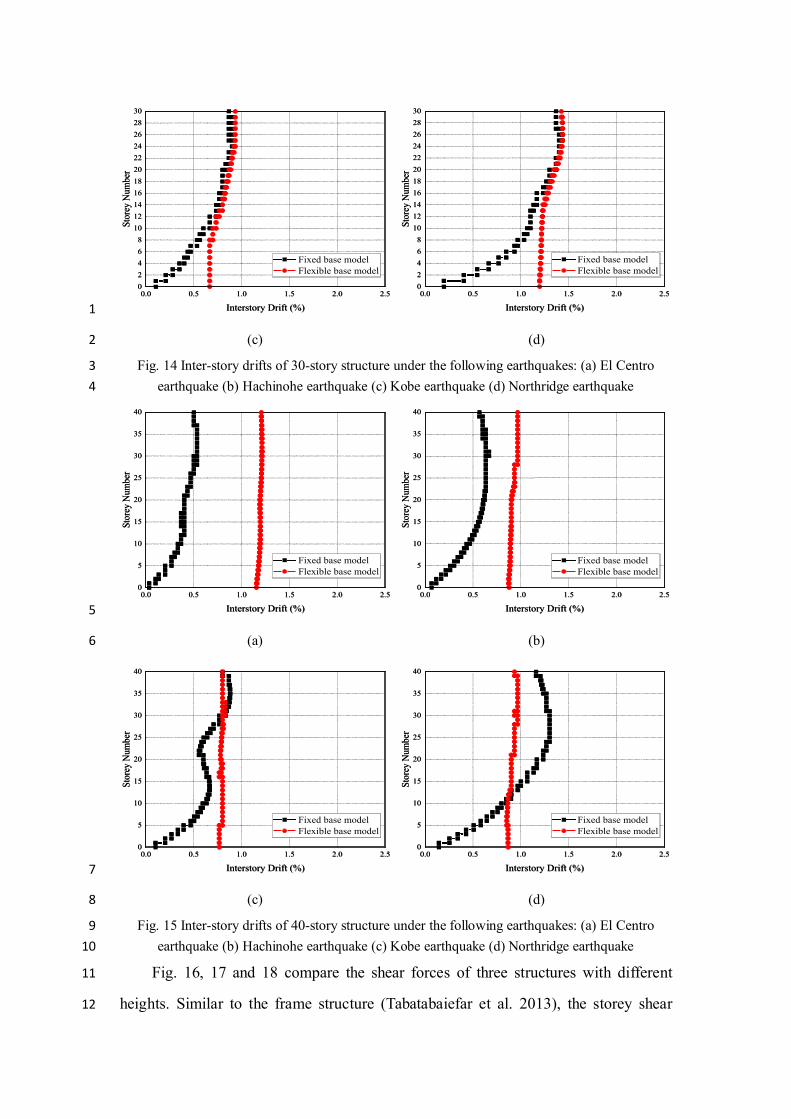
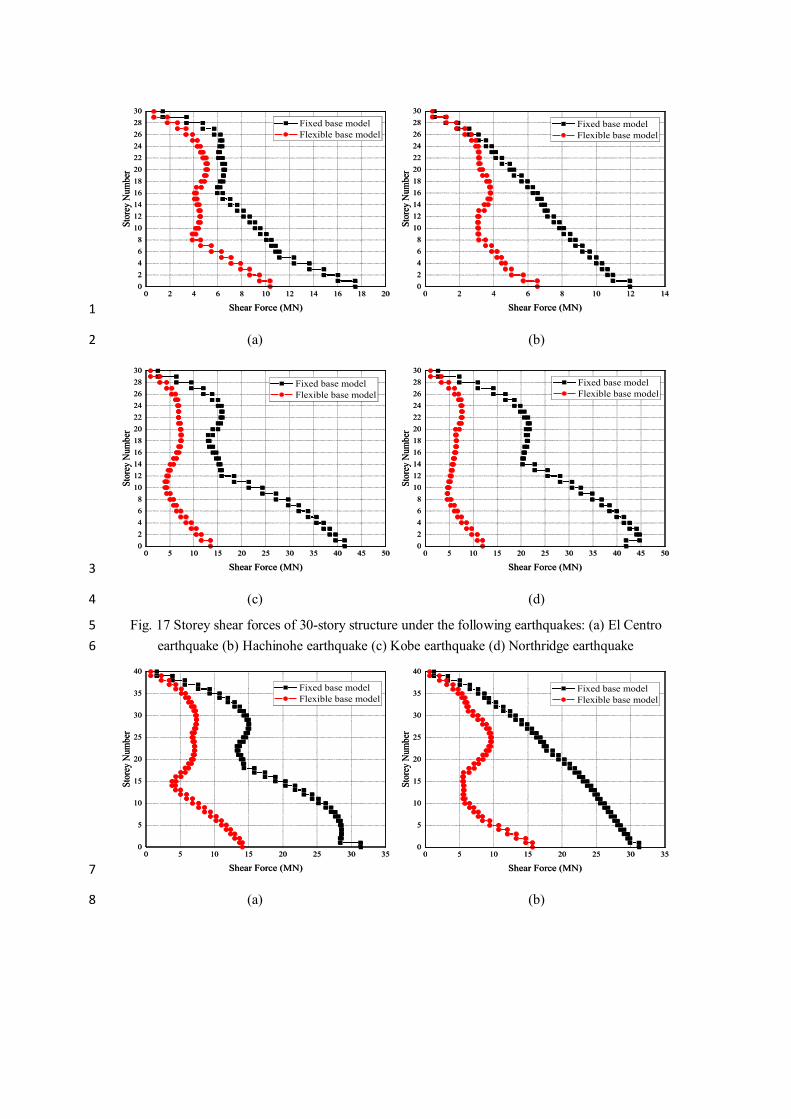
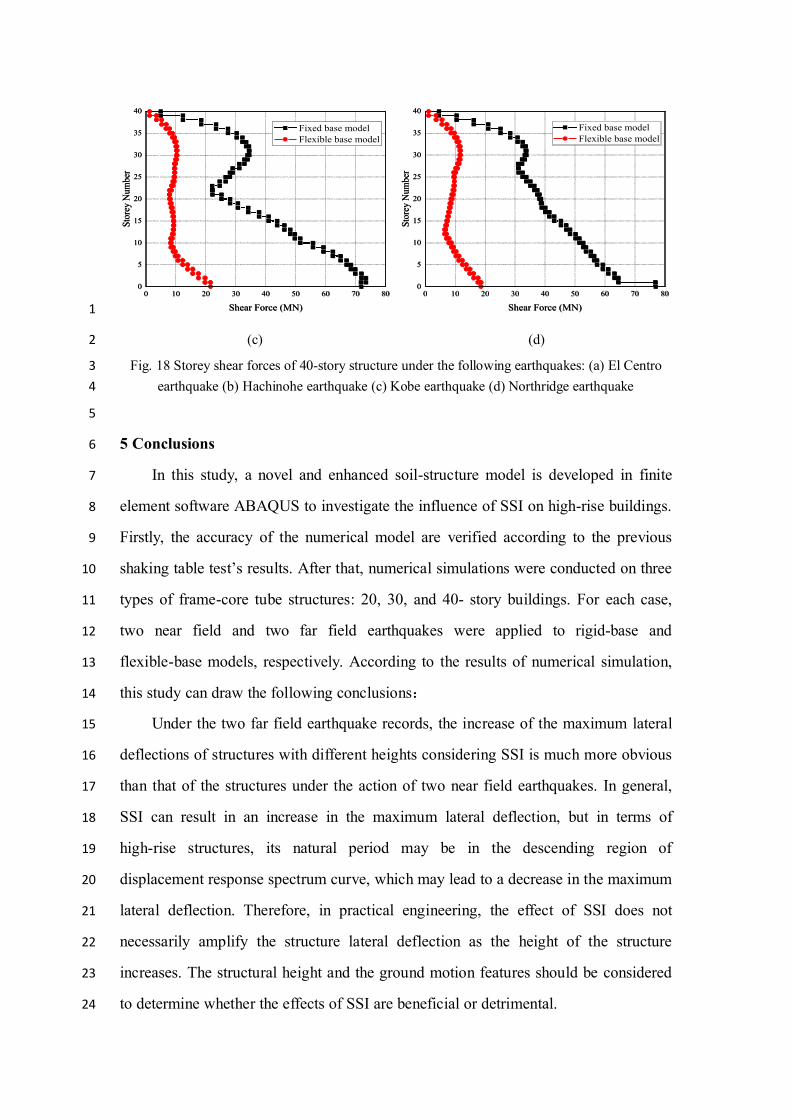
Fig. 16, 17 and 18 compare the shear forces of three structures with different 11
heights. Similar to the frame structure (Tabatabaiefar et al. 2013), the storey shear 12
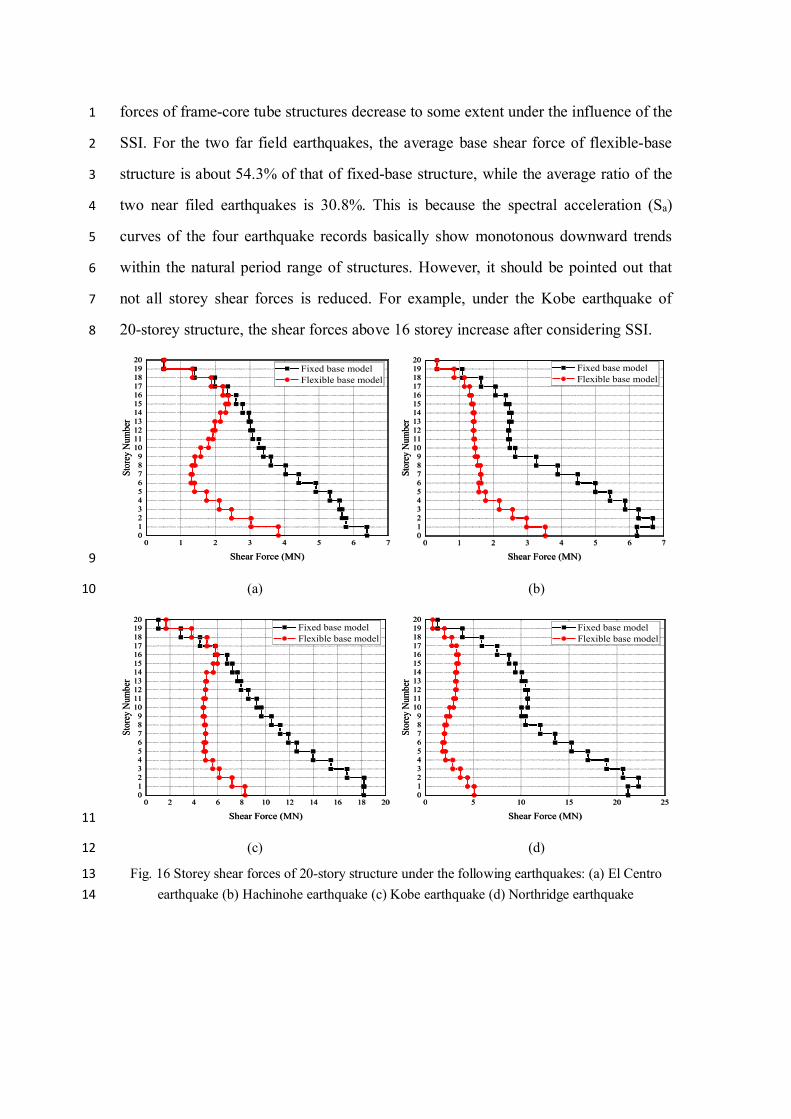
forces of frame-core tube structures decrease to some extent under the influence of the 1
SSI. For the two far field earthquakes, the average base shear force of flexible-base 2
structure is about 54.3% of that of fixed-base structure, while the average ratio of the 3
two near filed earthquakes is 30.8%. This is because the spectral acceleration (Sa) 4
curves of the four earthquake records basically show monotonous downward trends 5
within the natural period range of structures. However, it should be pointed out that 6
not all storey shear forces is reduced. For example, under the Kobe earthquake of 7
20-storey structure, the shear forces above 16 storey increase after considering SSI. 8
0 1 2 3 4 5 6 70123456789
1011121314151617181920
Stor
ey N
umbe
r
Shear Force (MN)
Fixed base model Flexible base model
0 1 2 3 4 5 6 70123456789
1011121314151617181920
Stor
ey N
umbe
r
Shear Force (MN)
Fixed base model Flexible base model
0 1 2 3 4 5 6 7
0123456789
1011121314151617181920
Stor
ey N
umbe
r
Shear Force (MN)
Fixed base model Flexible base model
0 1 2 3 4 5 6 70123456789
1011121314151617181920
Stor
ey N
umbe
r
Shear Force (MN)
Fixed base model Flexible base model
9
(a) (b) 10
0 2 4 6 8 10 12 14 16 18 200123456789
1011121314151617181920
Stor
ey N
umbe
r
Shear Force (MN)
Fixed base model Flexible base model
0 2 4 6 8 10 12 14 16 18 200123456789
1011121314151617181920
Stor
ey N
umbe
r
Shear Force (MN)
Fixed base model Flexible base model
0 5 10 15 20 25
0123456789
1011121314151617181920
Stor
ey N
umbe
r
Shear Force (MN)
Fixed base model Flexible base model
0 5 10 15 20 250123456789
1011121314151617181920
Stor
ey N
umbe
r
Shear Force (MN)
Fixed base model Flexible base model
11
(c) (d) 12
Fig. 16 Storey shear forces of 20-story structure under the following earthquakes: (a) El Centro 13 earthquake (b) Hachinohe earthquake (c) Kobe earthquake (d) Northridge earthquake 14
0 2 4 6 8 10 12 14 16 18 2002468
1012141618202224262830
Stor
ey N
umbe
r
Shear Force (MN)
Fixed base model Flexible base model
0 2 4 6 8 10 12 14 16 18 2002468
1012141618202224262830
Stor
ey N
umbe
r
Shear Force (MN)
Fixed base model Flexible base model
0 2 4 6 8 10 12 14
02468
1012141618202224262830
Stor
ey N
umbe
r
Shear Force (MN)
Fixed base model Flexible base model
0 2 4 6 8 10 12 1402468
1012141618202224262830
Stor
ey N
umbe
r
Shear Force (MN)
Fixed base model Flexible base model
1
(a) (b) 2
0 5 10 15 20 25 30 35 40 45 5002468
1012141618202224262830
Stor
ey N
umbe
r
Shear Force (MN)
Fixed base model Flexible base model
0 5 10 15 20 25 30 35 40 45 5002468
1012141618202224262830
Stor
ey N
umbe
r
Shear Force (MN)
Fixed base model Flexible base model
0 5 10 15 20 25 30 35 40 45 50
02468
1012141618202224262830
Stor
ey N
umbe
r
Shear Force (MN)
Fixed base model Flexible base model
0 5 10 15 20 25 30 35 40 45 5002468
1012141618202224262830
Stor
ey N
umbe
r
Shear Force (MN)
Fixed base model Flexible base model
3
(c) (d) 4
Fig. 17 Storey shear forces of 30-story structure under the following earthquakes: (a) El Centro 5 earthquake (b) Hachinohe earthquake (c) Kobe earthquake (d) Northridge earthquake 6
0 5 10 15 20 25 30 350
5
10
15
20
25
30
35
40
Stor
ey N
umbe
r
Shear Force (MN)
Fixed base model Flexible base model
0 5 10 15 20 25 30 350
5
10
15
20
25
30
35
40
Stor
ey N
umbe
r
Shear Force (MN)
Fixed base model Flexible base model
0 5 10 15 20 25 30 35
0
5
10
15
20
25
30
35
40
Stor
ey N
umbe
r
Shear Force (MN)
Fixed base model Flexible base model
0 5 10 15 20 25 30 350
5
10
15
20
25
30
35
40
Stor
ey N
umbe
r
Shear Force (MN)
Fixed base model Flexible base model
7
(a) (b) 8
0 10 20 30 40 50 60 70 800
5
10
15
20
25
30
35
40
Stor
ey N
umbe
r
Shear Force (MN)
Fixed base model Flexible base model
0 10 20 30 40 50 60 70 800
5
10
15
20
25
30
35
40
Stor
ey N
umbe
r
Shear Force (MN)
Fixed base model Flexible base model
0 10 20 30 40 50 60 70 80
0
5
10
15
20
25
30
35
40
Stor
ey N
umbe
r
Shear Force (MN)
Fixed base model Flexible base model
0 10 20 30 40 50 60 70 800
5
10
15
20
25
30
35
40
Stor
ey N
umbe
r
Shear Force (MN)
Fixed base model Flexible base model
1
(c) (d) 2
Fig. 18 Storey shear forces of 40-story structure under the following earthquakes: (a) El Centro 3 earthquake (b) Hachinohe earthquake (c) Kobe earthquake (d) Northridge earthquake 4
5
5 Conclusions 6
In this study, a novel and enhanced soil-structure model is developed in finite 7
element software ABAQUS to investigate the influence of SSI on high-rise buildings. 8
Firstly, the accuracy of the numerical model are verified according to the previous 9
shaking table test’s results. After that, numerical simulations were conducted on three 10
types of frame-core tube structures: 20, 30, and 40- story buildings. For each case, 11
two near field and two far field earthquakes were applied to rigid-base and 12
flexible-base models, respectively. According to the results of numerical simulation, 13
this study can draw the following conclusions: 14
Under the two far field earthquake records, the increase of the maximum lateral 15
deflections of structures with different heights considering SSI is much more obvious 16
than that of the structures under the action of two near field earthquakes. In general, 17
SSI can result in an increase in the maximum lateral deflection, but in terms of 18
high-rise structures, its natural period may be in the descending region of 19
displacement response spectrum curve, which may lead to a decrease in the maximum 20
lateral deflection. Therefore, in practical engineering, the effect of SSI does not 21
necessarily amplify the structure lateral deflection as the height of the structure 22
increases. The structural height and the ground motion features should be considered 23
to determine whether the effects of SSI are beneficial or detrimental. 24
Different from frame structures, for frame-core tube structures, the maximum 1
lateral deflection caused by the foundation rocking accounts for a large proportion. 2
The reduction of the foundation rocking can effectively reduce the lateral deflections 3
of buildings. Therefore, the lateral deflection of the structure can be effectively 4
reduced by using pile foundation or increasing the width of foundation. 5
The inter-storey drifts of structures considering SSI do not change much with the 6
height, and the overall deflection curve of the structure is approximately linear, which 7
is also caused by the large proportion of foundation rocking. Generally ignoring SSI is 8
safety threatening because it may change the performance level of buildings from life 9
safe to near collapse. 10
Under different earthquake records, the base shear of frame-core tube structures 11
decrease to different extents after considering SSI. However, it should be pointed out 12
that in most cases in this study, the storey shear forces of the topmost stories are 13
almost not reduced. Hence, in designing high-rise buildings, it is not reasonable to use 14
the same shear force reduction factor for all stories in a structure. 15
In short, SSI has a noticeable influence on the seismic behaviour of high-rise 16
frame-core tube structures. There are also notable differences in the seismic behaviour 17
of soil-structure model under near and far field earthquakes. Therefore, ignoring SSI 18
or considering inappropriate seismic records in real construction projects can 19
misestimate the damage level of structures and cause unsafe consequences. 20
21
22
Reference 1
Anand V, Satish Kumar SR (2018) Seismic soil-structure interaction: a state-of-the-art 2
review. Structures 16:317-326. 3
Arboleda-Monsalve LG, Mercado JA, Terzic V, Mackie KR (2020) Soil-structure 4
interaction effects on seismic performance and earthquake-induced losses in tall 5
buildings. Journal of Geotechnical and Geoenvironmental Engineering 6
146(5):04020028. 7
AS1170.4 (2007) Structural Design Actions - Part 4: Earthquake Actions in Australia. 8
Australian Standards, Sydney. 9
AS3600 (2018) Concrete Structures. Australian Standards, Sydney. 10
AS4671 (2001) Steel reinforceing materials. Standards Australia, Sydney, Australia. 11
Bagheri M, Jamkhaneh ME, Samali B (2018) Effect of seismic soil-pile-structure 12
interaction on mid- and high-rise steel buildings resting on a group of pile 13
foundations. International Journal of Geomechanics 18(9):04018103. 14
Bilotta E, De Sanctis L, Di Laora R, D’onofrio A, Silvestri F (2015) Importance of 15
seismic site response and soil-structure interaction in dynamic behaviour of a tall 16
building. Géotechnique 65(5): 391-400. 17
Bowles JE (2001) Foundation analysis and design. 5th Ed., McGraw-Hill 18
International, New York. 19
Building Seismic Safety Council (BSSC) (1997) NEHRP guidelines for the seismic 20
rehabilitation of buildings. 1997 edition, Part 1: Provisions and Part 2: 21
Commentary. FEMA 273/274, FEMA, Washington, DC. 22
Far, H., Flint, D. (2017) Significance of using isolated footing technique for 23
residential construction on expansive soils Frontiers of Structural and Civil 24
Engineering, 11(1), pp. 123–129 25
Far H (2019a) Advanced computation methods for soil structure interaction analysis 26
of structures resting on soft soils. International Journal of Geotechnical 27
Engineering 13(4):352-359. 28
Far H (2019b) Dynamic behaviour of unbraced steel frames resting on soft ground. 29
Steel Construction 12(2):135-140. 1
Fatahi B, Tabatabaiefar HR, Samali B (2011) Performance based assessment of 2
dynamic soil-structure interaction effects on seismic response of building frames. 3
In C. H. Juang, K. K. Phoon, A. J. Puppala, R. A. Green, & G. A. Fenton (Eds.), 4
PROCEEDINGS OF GEORISK 2011-Geotechnical Risk Assessment & 5
Management (Geotechnical Special Publication No. 224) (pp. 344-351). USA: 6
American Society of Civil Engineers (ASCE). 7
Fatahi B, Tabatabaiefar HR (2014) Effects of soil plasticity on seismic performance of 8
mid-rise building frames resting on soft soils. Advances in Structural 9
Engineering, An International Journal 17(10):1387-1402. 10
Fatahi B, Tabatabaiefar HR, Ghabraie K, Zhou W H (2015) Evaluation of numerical 11
procedures to determine seismic response of structures under influence of 12
soil-structure interaction. Structural Engineering and Mechanics 56(1):27-47. 13
Galal K, Naimi M (2008) Effect of soil conditions on the response of reinforced 14
concrete tall structures to near-fault earthquakes. The Structural Design of Tall 15
and Special Buildings 17(3):541-562. 16
GB50011 (2010) Code for Seismic Design of Buildings. China Architecture & 17
Building Press, Beijing. 18
Ghandil M, Behnamfar F (2017) Ductility demands of MRF structures on soft soils 19
considering soil-structure interaction. Soil Dynamics and Earthquake 20
Engineering 92:203-214. 21
Gu Y, Liu JB, Du YX (2007) 3D consistent viscous-spring artificial boundary and 22
viscous-spring boundary element. Engineering Mechanics 24(12):31-37. 23
Guin J, Banerjee PK (1998) Coupled soil-pile-structure interaction analysis under 24
seismic excitation. Journal of Structural Engineering 124:434-444. 25
Han Y (2002) Seismic response of tall building considering soil-pile-structure 26
interaction. Earthquake Engineering and Engineering Vibration 1(1): 57-64. 27
IBC (2012) International Building Code. International Code Council (ICC). 28
Kramer SL (1996) Geotechnical earthquake engineering. Prentice Hall, Upper Saddle 29
River, NJ. 30
Liu JB, Du YX, Du XL, Wang ZY, Wu J (2006) 3D viscous-spring artificial boundary 1
in time domain. Earthquake Engineering and Engineering Vibration 5(1):93-102. 2
Ma SJ, Chi MJ, Chen HJ, Chen S (2020) Implementation of viscous-spring boundary 3
in ABAQUS and comparative study on seismic motion input methods. Chinese 4
Journal of Rock Mechanics and Engineering 39(7):1445-1457. 5
Meymand PJ (1998) Shaking table scale model tests of nonlinear soil-pile 6
superstructure interaction in soft clay. PhD thesis in Civil Engineering, 7
University of California, Berkeley. 8
Mohammadia R, Massumi A, Meshkat-Dinib A (2015) Structural reliability index 9
versus behavior factor in RC frames with equal lateral resistance. Earthquakes 10
and Structures 8(5):995-1016. 11
Monavari B, Massumi A (2012) Estimating displacement demand in reinforced 12
concrete frames using some failure criteria. International Journal of Advanced 13
Structural Engineering 4(1):4. 14
Mukand J, Padmanabhan P, Arya AS, et al. National conference on tall buildings. New 15
Delhi 1973. 16
Mylonakis G, Gazetas G (2000) Seismic soil-structure interaction: beneficial or 17
detrimental? Journal of Earthquake Engineering 4(3):277-301. 18
National Building Code of Canada (NBCC) (2010) NRC Institute for Research in 19
Construction, Canada. 20
Nguyen QV, Fatahi B, Hokmabadi AS (2017) Influence of size and load-bearing 21
mechanism of piles on seismic performance of buildings considering 22
soil-pile-structure interaction. Int J Geomech 17(7):04017007. 23
NZS1170.5-2007 Structural Design Actions-Part 5: Earthquake Actions-New Zealand, 24
New Zealand Standards, Wellington. 25
Park D, Hashash YMA (2003). Soil damping formulation in nonlinear time domain 26
site response analysis. J Earthquake Eng, 8(2):249-274. 27
Qaftan OS, Toma-Sabbagh T, Weekes L, Augusthus-Nelson L (2020) Validation of a 28
finite element modelling approach on soil-foundation-structure interaction of a 29
multi-storey wall-frame structure under dynamic loadings. Soil Dynamics and 30
Earthquake Engineering 131:106041. 1
Samali, B., Fatahi, B. & Far, H. (2011) Seismic behaviour of Concrete Moment 2
Resisting Buildings on Soft Soil Considering Soil-Structure Interaction, 3
Proceedings of the 21st Australasian Conference on the Mechanics of Structures 4
and Materials (ACMSM21), pp. 407-412. 5
Samimifar M, Massumi A, Moghadam AS (2019) A new practical equivalent linear 6
model for estimating seismic hysteretic energy demand of bilinear systems. 7
Structural Engineering and Mechanics 70(3):289-301. 8
Saleh, A., Far, H., Mok, L. (2018) Effects of different support conditions on 9
experimental bending strength of thin walled cold formed steel storage upright 10
frames Journal of Constructional Steel Research, 150, pp. 1–6. 11
Scarfone R, Morigi M, Conti R (2020) Assessment of dynamic soil-structure 12
interaction effects for tall buildings: A 3D numerical approach. Soil Dynamics 13
and Earthquake Engineering 128:105864. 14
Seed HB, Murarka R, Lysmer J, Idriss IM (1976) Relationships of maximum 15
acceleration, maximum velocity, distance from source, and local site conditions 16
for moderately strong earthquakes. Bulletin of the Seismological Society of 17
America 66(4):1323-1342. 18
Sharma N, Dasgupta K, Dey A (2018) A state-of-the-art review on seismic SSI studies 19
on building structures. Innovative Infrastructure Solutions 3(22):1-16. 20
Sun JI, Golesorkhi R, Seed B (1998) Dynamic module and damping ratios for 21
cohesive soils. Earthquake Engineering Research Centre, Report No. 22
UCB/EERC-88/15, University of California, Berkeley. 23
Tabatabaiefar HR (2012) Determining seismic response of mid-rise building frames 24
considering dynamic soil-structure interaction. University of Technology Sydney. 25
Tabatabaiefar HR, Fatahi B, Samali B (2012) Finite difference modelling of 26
soil-structure interaction for seismic design of moment resisting building frames. 27
Australian Geomechanics Journal 47(3):113-119. 28
Tabatabaiefar HR, Fatahi B, Samali B (2013) Seismic behaviour of building frames 29
considering dynamic soil-structure interaction. International Journal of 1
Geomechanics 13(4):409-420. 2
Tabatabaiefar HR, Fatahi B (2014) Idealisation of soil-structure system to determine 3
inelastic seismic response of mid-rise building frames. Soil Dynamics and 4
Earthquake Engineering 66(11):339-351. 5
Tabatabaiefar HR, Fatahi B, Samali B (2014) Numerical and experimental 6
investigations on seismic response of building frames under influence of 7
soil-structure interaction. Advances in Structural Engineering, An International 8
Journal 17(1):109-130. 9
Tabatabaiefar, H.R. (2016) Detail design and construction procedure of laminar soil 10
containers for experimental shaking table tests International Journal of 11
Geotechnical Engineering, 10(4), pp. 328–336 12
Tabatabaiefar HR, Clifton T (2016) Significance of considering soil-structure 13
interaction effects on seismic design of unbraced building frames resting on soft 14
soils. Australian Geomechanics Journal 51(1):55-64. 15
Tabatabaiefar HR, Mansoury B (2016) Detail design, building and commissioning of 16
tall building structural models for experimental shaking table tests. The 17
Structural Design of Tall and Special Buildings 25(8):357-374. 18
Tabatabaiefar, H.R., Mansoury, B., Khadivi Zand, M.J., Potter, D. (2017) Mechanical 19
properties of sandwich panels constructed from polystyrene/cement mixed cores 20
and thin cement sheet facings, Journal of Sandwich Structures and 21
Materials, 19(4), pp. 456–481. 22
Veletsos AS, Meek JW (1974) Dynamic behaviour of building-foundation systems. 23
Earthquake Engineering And Structural Dynamics 3:121-138. 24
Walsh, P., Saleh, A., Far, H. (2018) Evaluation of structural systems in slender 25
high-rise buildings Australian Journal of Structural Engineering, 19(2), pp. 105–26
117. 27
Wolf JP (1985) Dynamic soil-structure interaction. Prentice-Hall, Englewood Cliffs, 28
New Jersey. 29

Wolf JP (1998) Soil–structure interaction analysis in time domain. Upper Saddle 1
River, NJ: Prentice Hall Co. 2
Yang J, Lu Z, Li P (2020) Large-scale shaking table test on tall buildings with viscous 3
dampers considering pile-soil-structure interaction. Engineering Structures 4
220:110960. 5