Embed Size (px)
Citation preview
Effects of Different Topologies on Network Lifetime in WSN
Akanksha Agrawal, Manju, Vikas Raina, Ranjana Thalore, M. K. Jha
Abstract— Wireless Sensor Network (WSN) is an application of Wireless ad-hoc networks used in everyday lives. The energy efficiency of network is the major challenge facing WSN. This paper investigates the network lifetime of WSN and different network parameters like throughput, packets dropped, delay and jitter on different network topologies. Two WSN networks comprising of 20 nodes and 100 nodes with a PAN coordinator in 100 x 100 square meters terrain size has been implemented in QualNet 6.1 simulator. The result indicates that when the number of nodes is increased, Gradient time synchronized protocol topology gives the best network lifetime. Throughput is also highest for the GTSP topology. But the number of packets dropped is high and so as end to end delay.
Index Terms— End to end delay, Jitter, Network lifetime, Network topology, Throughput, WSNs, Wireless ad-hoc networks.
—————————— ——————————
1 INTRODUCTION Wireless Sensor Network (WSN) is promising novel tool for sensing and observing natural phenomena at large scale. WSN is composed of thousands of micro sensors
which are small in size but capable of collecting and calculat-ing data or information anytime under different situations. In future, WSN will be omnipresent; it could be applied in securi-ty, intelligent detecting, coordinating and controlling public and personal environment.
Basic topology structures for various WSN are focused to meet energy requirements in specific environments. Various parameters including network lifetime, throughput, end to end delay and jitter are affected by different topologies. In this paper, we present a comparison of different network topolo-gies with two cases-for 20 nodes and 100 nodes-to give clear impact caused by number of nodes as well as topology.
The rest of paper is organized as following. Section 2 is litera-
ture survey. Section 3 includes network simulation presenting the scenario and simulation parameter values. And section 4 represents the results showing different parameters of WSN. Finally section 5 represents the conclusion.
2 LITERATURE SURVEY Routing trees rooted at the sink is typical topology widely used in WSN in order to deliver data to the sink. The Shortest Path Tree (SPT) approach is one of the commonly used me-thods to construct routing trees in the many-to-one WSN [5]. The goal of SPT algorithms is to construct a tree rooted at the sink such that the path cost from any node to the sink is mi-
nimal. Walid Bechkit et. al explained that the energy con-sumption and the end-to end delay are correlated to the path length, the use of shortest paths in terms of hop count reduces
the energy dissipation and the end-to-end delay. They ex-plained the network lifetime in WSN with tree topology [6].
Other topologies have also been investigated in this work to compare the results.
3 NETWORK SIMULATION This section describes simulation scenario and various simula-tion parameters considered for performance analysis.
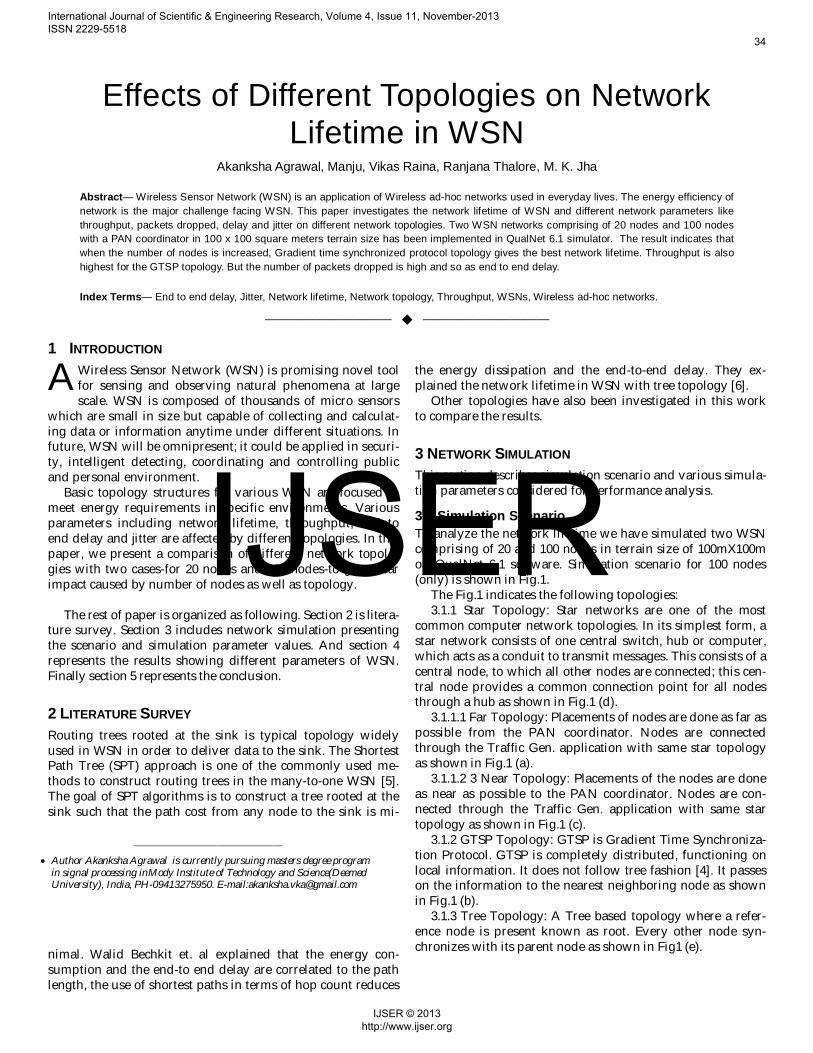
3.1 Simulation Scenario To analyze the network lifetime we have simulated two WSN comprising of 20 and 100 nodes in terrain size of 100mX100m on QualNet 6.1 software. Simulation scenario for 100 nodes (only) is shown in Fig.1.
The Fig.1 indicates the following topologies: 3.1.1 Star Topology: Star networks are one of the most
common computer network topologies. In its simplest form, a star network consists of one central switch, hub or computer, which acts as a conduit to transmit messages. This consists of a central node, to which all other nodes are connected; this cen-tral node provides a common connection point for all nodes through a hub as shown in Fig.1 (d).
3.1.1.1 Far Topology: Placements of nodes are done as far as possible from the PAN coordinator. Nodes are connected through the Traffic Gen. application with same star topology as shown in Fig.1 (a).
3.1.1.2 3 Near Topology: Placements of the nodes are done as near as possible to the PAN coordinator. Nodes are con-nected through the Traffic Gen. application with same star topology as shown in Fig.1 (c).
3.1.2 GTSP Topology: GTSP is Gradient Time Synchroniza-tion Protocol. GTSP is completely distributed, functioning on local information. It does not follow tree fashion [4]. It passes on the information to the nearest neighboring node as shown in Fig.1 (b).
3.1.3 Tree Topology: A Tree based topology where a refer-ence node is present known as root. Every other node syn-chronizes with its parent node as shown in Fig1 (e).
A
———————————————— Author Akanksha Agrawal is currently pursuing masters degree program
in signal processing inMody Institute of Technology and Science(Deemed University), India, PH-09413275950. E-mail:[email protected]
IJSER
International Journal of Scientific & Engineering Research, Volume 4, Issue 11, November-2013 ISSN 2229-5518
34
IJSER © 2013 http://www.ijser.org
a.)Far_100nodes
b.) GTSP_100nodes
c.) Near_100nodes
d.)Star_100nodes
e.) Tree_100nodes
Fig 1: Simulation scenario
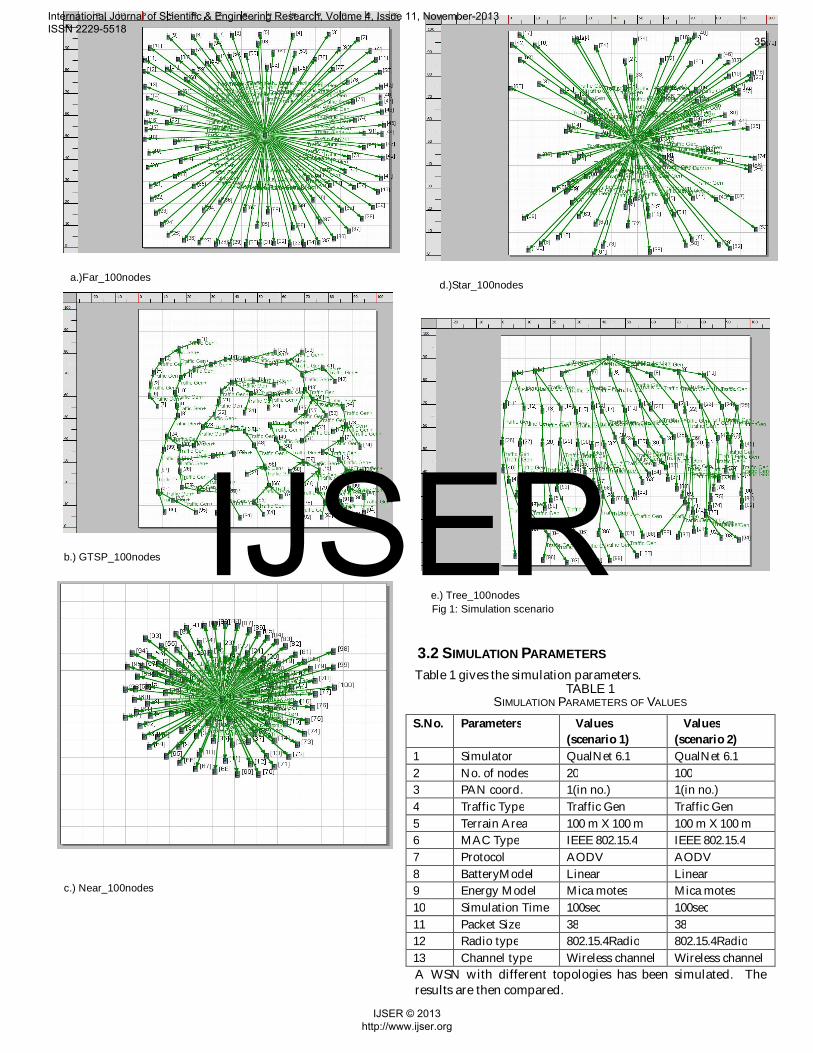
3.2 SIMULATION PARAMETERS Table 1 gives the simulation parameters.
TABLE 1 SIMULATION PARAMETERS OF VALUES
S.No. Parameters Values (scenario 1)
Values (scenario 2)
1 Simulator QualNet 6.1 QualNet 6.1 2 No. of nodes 20 100 3 PAN coord. 1(in no.) 1(in no.) 4 Traffic Type Traffic Gen Traffic Gen 5 Terrain Area 100 m X 100 m 100 m X 100 m 6 MAC Type IEEE 802.15.4 IEEE 802.15.4 7 Protocol AODV AODV 8 BatteryModel Linear Linear 9 Energy Model Mica motes Mica motes 10 Simulation Time 100sec 100sec 11 Packet Size 38 38 12 Radio type 802.15.4Radio 802.15.4Radio 13 Channel type Wireless channel Wireless channel A WSN with different topologies has been simulated. The results are then compared.
IJSER
International Journal of Scientific & Engineering Research, Volume 4, Issue 11, November-2013 ISSN 2229-5518
35
IJSER © 2013 http://www.ijser.org

4 RESULT With the use of QualNet 6.1 we have studied different para-meters for two cases.
Network life time is defined in terms of number of surviving nodes after a particular interval of time [7]. This is calculated with the help of Residual battery capacity. Fig 2 shows the Network Lifetime.
Throughput is one of the dimensional parameters of the Wireless sensor network which gives the fraction of the channel capacity used for useful transmission whenever net-work selects a destination when simulation starts. Information of the data packets delivery to the destinations is observed. Fig 3 shows Unicast received Throughput.
Fig 2: Network Lifetime
Fig 3: Unicast Received Throughput
The Average End-to-End Delay is the duration between the data packets generation time and the last bit arrival time at the destination. Fig 4 shows Average End to End delay.
Fig 4: Average Unicast End to end Delay
Average Jitter is the variation of the packet-arrival times between the two successive packets received. Fig 5 shows Average Unicast Jitter.
Fig 5: Average Unicast Jitter
Number of data Packets dropped due to channel access failure the number of packets dropped when the channel is proceeding to failure point. Fig 6 shows Number of Data Packets Dropped Due To Channel Access Failure.
Fig 6: Numberof Packets Dropped
IJSER
International Journal of Scientific & Engineering Research, Volume 4, Issue 11, November-2013 ISSN 2229-5518
36
IJSER © 2013 http://www.ijser.org
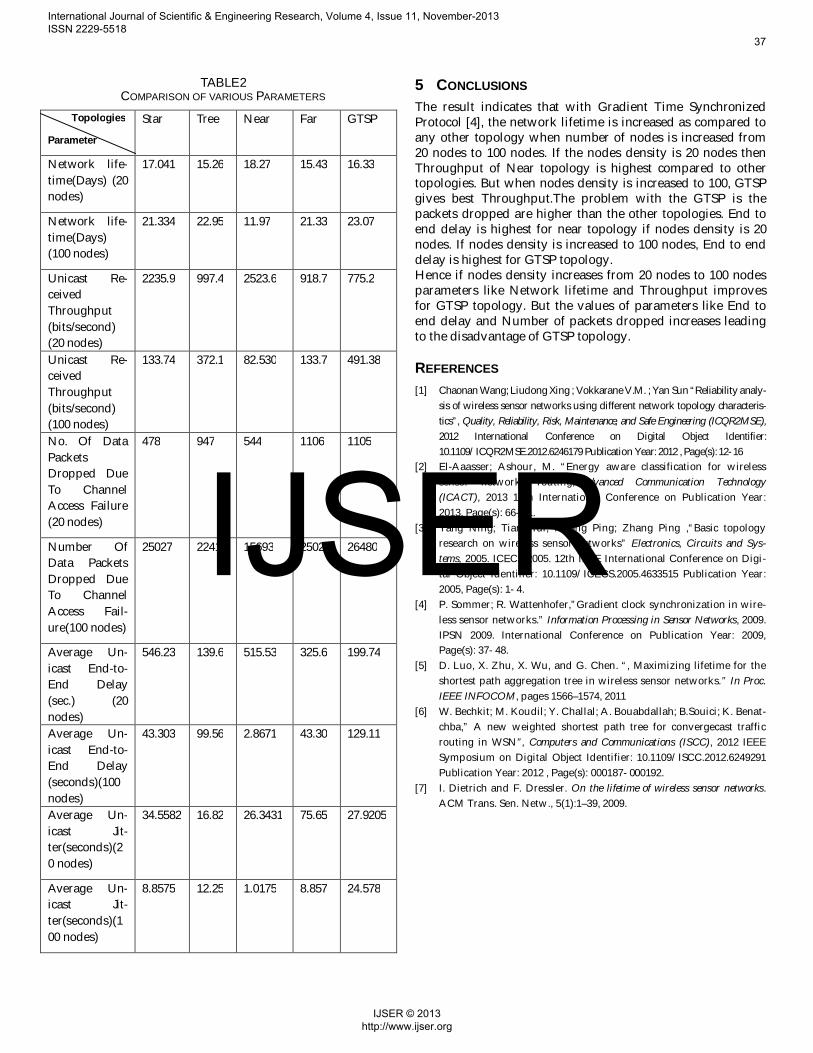
TABLE2 COMPARISON OF VARIOUS PARAMETERS
5 CONCLUSIONS The result indicates that with Gradient Time Synchronized Protocol [4], the network lifetime is increased as compared to any other topology when number of nodes is increased from 20 nodes to 100 nodes. If the nodes density is 20 nodes then Throughput of Near topology is highest compared to other topologies. But when nodes density is increased to 100, GTSP gives best Throughput.The problem with the GTSP is the packets dropped are higher than the other topologies. End to end delay is highest for near topology if nodes density is 20 nodes. If nodes density is increased to 100 nodes, End to end delay is highest for GTSP topology. Hence if nodes density increases from 20 nodes to 100 nodes parameters like Network lifetime and Throughput improves for GTSP topology. But the values of parameters like End to end delay and Number of packets dropped increases leading to the disadvantage of GTSP topology.
REFERENCES [1] Chaonan Wang; Liudong Xing ; Vokkarane V.M. ; Yan Sun “Reliability analy-
sis of wireless sensor networks using different network topology characteris-tics”, Quality, Reliability, Risk, Maintenance, and Safe Engineering (ICQR2MSE), 2012 International Conference on Digital Object Identifier: 10.1109/ICQR2MSE.2012.6246179 Publication Year: 2012 , Page(s): 12- 16
[2] El-Aaasser; Ashour, M. “Energy aware classification for wireless sensor networks routing,”Advanced Communication Technology (ICACT), 2013 15th International Conference on Publication Year: 2013, Page(s): 66- 71.
[3] Yang Ning; Tian Hui; Huang Ping; Zhang Ping ,“Basic topology research on wireless sensor networks” Electronics, Circuits and Sys-tems, 2005. ICECS 2005. 12th IEEE International Conference on Digi-tal Object Identifier: 10.1109/ICECS.2005.4633515 Publication Year: 2005, Page(s): 1- 4.
[4] P. Sommer; R. Wattenhofer,”Gradient clock synchronization in wire-less sensor networks.” Information Processing in Sensor Networks, 2009. IPSN 2009. International Conference on Publication Year: 2009, Page(s): 37- 48.
[5] D. Luo, X. Zhu, X. Wu, and G. Chen. “, Maximizing lifetime for the shortest path aggregation tree in wireless sensor networks.” In Proc. IEEE INFOCOM, pages 1566–1574, 2011
[6] W. Bechkit; M. Koudil; Y. Challal; A. Bouabdallah; B.Souici; K. Benat-chba,” A new weighted shortest path tree for convergecast traffic routing in WSN”, Computers and Communications (ISCC), 2012 IEEE Symposium on Digital Object Identifier: 10.1109/ISCC.2012.6249291 Publication Year: 2012 , Page(s): 000187- 000192.
[7] I. Dietrich and F. Dressler. On the lifetime of wireless sensor networks. ACM Trans. Sen. Netw., 5(1):1–39, 2009.
Topologies
Parameter
Star Tree Near Far GTSP
Network life-time(Days) (20 nodes)
17.041 15.26 18.27 15.43 16.33
Network life-time(Days) (100 nodes)
21.334 22.95 11.97 21.33 23.07
Unicast Re-ceived Throughput (bits/second) (20 nodes)
2235.9 997.4 2523.6 918.7 775.2
Unicast Re-ceived Throughput (bits/second) (100 nodes)
133.74 372.1 82.530 133.7 491.38
No. Of Data Packets Dropped Due To Channel Access Failure (20 nodes)
478 947 544 1106 1105
Number Of Data Packets Dropped Due To Channel Access Fail-ure(100 nodes)
25027 22415 15693 25027 26480
Average Un-icast End-to-End Delay (sec.) (20 nodes)
546.23 139.6 515.53 325.6 199.74
Average Un-icast End-to-End Delay (seconds)(100 nodes)
43.303 99.56 2.8671 43.30 129.11
Average Un-icast Jit-ter(seconds)(20 nodes)
34.5582 16.82 26.3431 75.65 27.9205
Average Un-icast Jit-ter(seconds)(100 nodes)
8.8575 12.25 1.0175 8.857 24.578
IJSER
International Journal of Scientific & Engineering Research, Volume 4, Issue 11, November-2013 ISSN 2229-5518
37
IJSER © 2013 http://www.ijser.org


![Network final [Read-Only] - WordPress.com · 2011-07-19 · 43 Star Topology Uses a central device with drop cables extending in all directions Star topologies can be nested within](https://img.pdfslide.us/doc/110x75/5fb2fe09b71c3c318e3baea3/network-final-read-only-2011-07-19-43-star-topology-uses-a-central-device.jpg)