Embed Size (px)
Citation preview
Effects of Dietary Pulses on
Lipid Risk Factors of Cardiovascular Disease and Oxidative Stress
by
Vanessa Ha
A thesis submitted in conformity with the requirements
for the degree of Master of Science
Graduate Department of Nutritional Sciences
University of Toronto
© Copyright by Vanessa Ha 2013
ii
Effects of Dietary Pulses on Lipid Risk Factors of CVD and Oxidative Stress
Vanessa Ha
Master of Science
Department of Nutritional Sciences
University of Toronto
2013
ABSTRACT
The objective was to conduct a systematic review and meta‐analysis of randomized feeding
trials to assess the effect of dietary pulses (beans, chickpeas, lentils, peas) on established lipid targets of
cardiovascular disease (CVD) and perform a secondary analysis of our randomized feeding trial to assess
whether dietary pulses as a means of lowering the glycemic index offer further CVD protection by
reducing oxidative stress. The meta‐analysis of 26 trials (n=1013) found dietary pulse interventions
significantly lowered LDL‐C compared with isocaloric control interventions (mean difference=‐
0.17mmol/L [95% CI: ‐0.25, ‐0.09]; p<0.0001). No treatment effects were observed for Apo‐B and non‐
HDL‐C. Our feeding trial found no significant differences between the high‐dietary pulse diet and high‐
fibre control diet on markers of oxidative stress, including thiobarbituric acid reactive substances
(TBARS), conjugated dienes (CDs), and protein thiols. Overall, the results suggest dietary pulses reduce
LDL‐C but not oxidative stress as a means of reducing cardiovascular risk.
Abstract Word Count: 150
iii
TABLE OF CONTENTS Title Page Number ABSTRACT ..................................................................................................................................................... ii
TABLE OF CONTENTS ................................................................................................................................... iii
LIST OF ABBREVIATIONS ............................................................................................................................ vii
LIST OF FIGURES ........................................................................................................................................... x
LIST OF TABLES ............................................................................................................................................ xi
CHAPTER I‐ INTRODUCTION ................................................................................................................. 1
CHAPTER II‐ LITERATURE REVIEW ........................................................................................................ 4
2.1 CARDIOVASCULAR DISEASE .................................................................................................................... 5
2.1.1 PREVALENCE ............................................................................................................................ 5
2.1.2 COMPLICATIONS AND MORTALITY ......................................................................................... 5
2.1.3 RISK FACTORS .......................................................................................................................... 6
2.1.3.1 CORONARY HEART DISEASE .................................................................................. 6
2.1.3.2 STROKE .................................................................................................................. 6
2.2 LIPIDS AND CARDIOVASCULAR DISEASE ................................................................................................. 6
2.2.1 GUIDELINES ............................................................................................................................. 7
2.2.1.1 NATIONAL CHOLESTEROL EDUCATION PROGRAM‐ ADULT TREATMENT PLAN III8
2.2.1.2 CANADIAN CARDIOVASCULAR SOCIETY .............................................................. 8
2.2.1.3 CANADIAN DIABETES ASSOCIATION .................................................................... 8
2.2.1.4 AMERICAN DIABETES ASSOCIATION .................................................................... 9
2.3 OXIDATIVE STRESS AND CARDIOVASCULAR DISEASE ............................................................................. 9
2.4 DIET AND CARDIOVASCULAR DISEASE .................................................................................................. 10
2.4.1 DIET AND DRUGS ................................................................................................................... 10
2.4.2 DIETARY PATTERNS AND CARDIOVASCULAR DISEASE .......................................................... 11
2.4.2.1 PROSPECTIVE COHORT STUDIES ......................................................................... 11
2.4.2.2 DIETARY INTERVENTION TRIALS ......................................................................... 12
2.5 PLANT‐PROTEIN BASED DIET AND CARDIOVASCULAR DISEASE ........................................................... 13
2.5.1 PROSPECTIVE COHORT STUDIES ........................................................................................... 14
2.5.2 DIETARY INTERVENTION TRIALS ............................................................................................ 15
2.6 DIETARY PULSES AND CARDIOVASCULAR DISEASE ............................................................................... 15
2.6.1 DIETARY PULSES IN GUIDELINES ........................................................................................... 16
iv
2.6.2 DIETARY PULSES AND CARDIOVASCULAR DISEASE ............................................................... 17
2.6.3 DIETARY PULSES IN DIETARY PATTERNS ............................................................................... 17
2.6.4 DIETARY PULSES AND ESTABLISHED LIPID TARGETS OF CARDIOVASCULAR DISEASE .......... 18
2.6.4.1 EVIDENCE FROM META‐ANALYSES ..................................................................... 18
2.6.4.2 EVIDENCE FROM RANDOMIZED FEEDING TRIALS IN HUMANS .......................... 18
2.6.5 DIETARY PULSES AND OXIDATIVE STRESS ............................................................................. 19
2.6.6 DIETARY PULSES AND OTHER CARIOVASCULAR RISK FACTORS ............................................ 20
CHAPTER III‐ HYPOTHESIS, OBJECTIVES, AND RATIONALE ................................................................... 21
3.1 HYPOTHESIS ............................................................................................................................. 22
3.2 OBJECTIVES .............................................................................................................................. 22
3.3 RATIONALE ............................................................................................................................... 22
CHAPTER IV‐ THE EFFECT OF DIETARY PULSES ON ESTABLISHED LIPID THERAPEUTIC TARGETS OF
CARDIOVASCULAR DISEASE: A SYSTEMATIC REVIEW AND META‐ANALYSIS OF RANDOMIZED
CONTROLELD TRIALS .......................................................................................................................... 24
4.1 CITATIONS ............................................................................................................................................. 25
4.2 ABSTRACT .............................................................................................................................................. 27
4.3 INTRODUCTION ..................................................................................................................................... 28
4.4 METHODS .............................................................................................................................................. 29
4.4.1 STUDY STRATEGY SELECTION ................................................................................................ 29
4.4.2 ELIGIBILITY CRITERIA ............................................................................................................. 29
4.4.3 DATA EXTRACTIONS .............................................................................................................. 30
4.4.4 TREATMENT OF MISSING DATA ............................................................................................ 31
4.3.5 STATISTICAL ANALYSIS .......................................................................................................... 31
4.5 RESULTS ................................................................................................................................................. 32
4.5.1 SEARCH RESULTS ................................................................................................................... 32
4.5.2 STUDY CHARACTERISTICS ...................................................................................................... 32
4.5.3 GASTRO‐INTESTINAL SYMPTOMS ......................................................................................... 34
4.5.4 EFFECT ON LDL‐C ................................................................................................................... 34
4.5.5 EFFECT ON NON‐HDL‐C ......................................................................................................... 35
4.5.6 EFFECT ON APOLIPROTEINS B ............................................................................................... 35
4.5.7 PUBLICATION BIAS ................................................................................................................ 36
4.6 DISCUSSION ........................................................................................................................................... 36
v
4.6.1 RESULTS IN RELATION TO OTHER STUDIES ........................................................................... 36
4.6.2 INTER‐STUDY HETEROGENEITY ............................................................................................. 38
4.6.3 LIMITATIONS ......................................................................................................................... 39
4.6.4 CONCLUSIONS ....................................................................................................................... 40
4.7 ACKNOWLEDGMENTS ........................................................................................................................... 41
4.8 SOURCE OF FUNDING ........................................................................................................................... 41
4.9 CONFLICTS OF INTEREST/DISCLOSURE ................................................................................................. 41
4.10 TABLES ................................................................................................................................................. 44
4.11 FIGURES ............................................................................................................................................... 50
CHAPTER V‐ EFFECT OF A HIGH DIETARY PULSES, LOW GLYCEMIC INDEX DIET ON OXIDATIVE STRESS
MARKERS IN TYPE 2 DIABETES ........................................................................................................... 57
5.1 ABSTRACT .............................................................................................................................................. 59
5.2 INTRODUCTION ..................................................................................................................................... 60
5.3 METHODS .............................................................................................................................................. 60
5.3.1 PARTICIPANTS ....................................................................................................................... 61
5.3.2 PROTOCOL ............................................................................................................................. 61
5.3.3 DIETARY INTERVENTION ....................................................................................................... 62
5.3.4 BIOCHEMICAL ANALYSIS ....................................................................................................... 62
5.3.5 STATISTICAL ANALYSIS .......................................................................................................... 62
5.4 RESULTS ................................................................................................................................................. 63
5.4.1 OXIDATIVE STRESS MARKERS ................................................................................................ 64
5.4.2 GLYCEMIC EXCURSION .......................................................................................................... 64
5.5 DISCUSSION ........................................................................................................................................... 64
5.5.1 RELATIONS TO OTHER STUDIES............................................................................................. 65
5.5.2 LIMITATIONS ......................................................................................................................... 66
5.6 CONCLUSIONS ....................................................................................................................................... 67
5.7 SOURCE OF FUNDING ........................................................................................................................... 67
5.8 CONFLICTS OF INTEREST/DISCLOSURE ................................................................................................. 68
5.9 TABLES ................................................................................................................................................... 70
5.10 FIGURES ............................................................................................................................................... 75
CHAPTER VI‐ OVERALL DISCUSSION AND LIMITATIONS ...................................................................... 77
6.1 OVERALL DISCUSSION ........................................................................................................................... 78
vi
6.2 LIMITATIONS ......................................................................................................................................... 79
6.2.1 SYSTEMATIC REVIEW AND META‐ANALYSIS ......................................................................... 79
6.2.2 DIETARY INTERVENTION TRIAL ............................................................................................. 79
6.3 MECHANISM OF ACTION ....................................................................................................................... 80
6.4 CLINICAL IMPLICATIONS ........................................................................................................................ 81
6.5 FUTURE DIRECTIONS ............................................................................................................................. 81
CHAPTER VII‐ CONCLUSIONS .............................................................................................................. 83
CHAPTER VIII‐ REFERENCES ................................................................................................................ 85

vii
LIST OF ABBREVIATIONS
CVD‐ Cardiovascular Disease
LDL‐C‐ low‐density lipoprotein cholesterol
CHD‐ Coronary Heart Disease
NHS‐ Nurses’ Health Study
AHS‐ Adult Health Study
USDA‐ United States Department of Agriculture
DASH‐ Dietary Approaches to Stopping Hypertension
ox‐LDL‐C‐ oxidized‐LDL‐C
Apo‐B‐ apolipoprotein‐B
Non‐HDL‐C‐ non‐high density lipoprotein cholesterol
NHANES‐ National Health and Nutrition Examination Survey
BP‐ blood pressure
TC‐ total cholesterol
PAR‐ population attributable risk
FHS‐ Framingham Heart Study
CTT‐ Cholesterol Treatment Trialists
NCEP‐ATP III‐ National Cholesterol Education Program‐ Adult Treatment Plan III
TG‐ Triglyceride
T2DM‐ type 2 diabetes mellitus
CCS‐ Canadian Cardiovascular Society
CDA‐ Canadian Diabetes Association
ADA‐ American Diabetes Association
FRS‐ Framingham Risk Score
NHS‐ Nurses’ Health Study
viii
HPFS‐ Health Professional Follow‐Up Study
HDL‐C‐ high‐density lipoprotein cholesterol
FAO/WHO‐ Food and Agriculture Organization of the United Nations/World Health Organization
AHA‐ American Heart Association
EASD‐ European Association for the Study of Diabetes
FDA‐ Food and Drug Association
EFSA‐ European Food Safety Authority
SCFA‐ short chain fatty acids
n‐ sample size
MDA‐ malendialdehyde
TBARS‐ thiobarbituric acid reactive substances
CD‐ conjugated dienes
CI‐ confidence intervals
PRISMA‐ Preferred Reporting Items for Systematic Review and Meta‐Analyses
MQS‐ Methodological Quality Score
MD‐ mean difference
% E‐ percent energy
g/d‐ grams per day
SD‐ standard deviation
Ob‐ Obese
OW‐ Overweight
HC‐ Hypercholesterolemia
N‐ normal/healthy
Pre‐MS‐ Pre‐Metabolic Syndrome
IR‐ Insulin Resistant

ix
IS‐ Insulin Sensitive
M‐ Men
W‐ Women
C‐ Crossover Design
P‐ Parallel Design
IP‐ inpatient
OP‐ outpatient
UR‐ unclear risk of bias
LR‐ low risk of bias
HR‐ high risk of bias
AHS‐ Adult Health Study
USDA‐ United States Department of Agriculture
GI‐ glycemic index
Haemoglobin A1c‐ HbA1c
CV‐ coefficient of variation
FBG‐ fasting blood glucose
ORAC‐ Oxygen Radical Absorbance Capacity
SFA‐ saturated fatty acid
MUFA‐ monounsaturated fatty acid
PUFA‐ polyunsaturated fatty acid
PREDIMED‐ Prevención con Dieta Mediterrànea

x
LIST OF FIGURES
CHAPTER II
Figure 1. Schematic Diagram of the Formation of Atheromatous Plaques via ox‐LDL‐C.
CHAPTER IV
Figure 1. Flow of the literature search.
Figure 2. Forest plot of trials investigating the effect of isocaloric exchange of dietary pulses for control diets on LDL‐C. Figure 3. Forest plots of subgroup analyses for dichotomous variables investigating the effect of isocaloric exchange of dietary pulses for other adequate comparators on LDL‐C in all participants. Figure 4. Forest plot of trials investigating the effect of isocaloric exchange of dietary pulses for control diets on non‐HDL‐C. Figure 5. Forest plots of subgroup analyses for dichotomous variables investigating the effect of isocaloric exchange of dietary pulses for other adequate comparators on non‐HDL‐C in all participants. Figure 6. Forest plot of a trial investigating the effect of isocaloric exchange of dietary pulses for control diet on Apo‐B. Figure 7. Funnel plot investigating publication bias and effect of small study effects in clinical trials with isocaloric exchange of dietary pulses for other adequate comparators on LDL‐C (7A) and non‐HDL‐C (7B) in all participants. CHAPTER V
Figure 1. Flowchart of Participants through the Trial.
Figure 2. Correlation of Change in Pulse intake (∆Pulse Intake) and Change in Conjugated Dienes (∆CDs).
xi
LIST OF TABLES
CHAPTER II
Table 1. Summary of Lipid Targets by Major Chronic Disease Guidelines in Adults.
Table 2. Summary of Lipids Targets set by NCEP‐ATP III.
Table 3. Summary of Lipid Targets set by CCS (2012).
Table 4. Summary of Lipid Targets set by CDA (2013).
Table 5. Summary of Lipid Targets set by ADA (2013).
CHAPTER IV
Table 1. Search Strategy for Studies Assessing the Effect of Dietary Pulses on Lipids in Randomized, Controlled Feeding Trials.
Table 2. Study Characteristics Table.
Table 3. Study Quality Assessment by Using the Heyland MQS. Table 4. Risk of Bias Assessment by Using the Cochrane Risk of Bias Tool.
Table 5. Subgroup analyses by a priori dichotomous categorization for LDL‐C and non‐HDL‐C.
CHAPTER V
Table 1. Definitions of quadrant groups for glucose excursion analysis.
Table 2. Baseline Characteristics of Participants.
Table 3. Daily Nutritional Profile at Baseline and End of Study. Table 4. Mean study measurements and significance of treatment differences on oxidative stress markers. Table 5. Associations between changes in oxidative stress markers and changes in study outcomes.

INTRODUCTION
Page 1 of 93
CHAPTER I‐ INTRODUCTION
INTRODUCTION
Page 2 of 93
1. INTRODUCTION
Abnormal lipids have been identified as one of the most modifiable risk factors for cardiovascular
disease (CVD), contributing to almost 50% of the population’s risk1. While statins are effective in
reducing blood LDL‐C2, major health organizations maintained that the initial and essential approach to
CVD prevention and management is to modify dietary and lifestyle patterns3‐6. Studies have shown that
82% of coronary heart disease (CHD) may be prevented with healthier dietary and lifestyle choices7.
Dietary pulses (beans, chickpeas, peas, and lentils) have received particular attention for their
ability to reduce CVD risk as part of low‐glycemic index8, Dietary Strategies to Stop Hypertension
(DASH)9, high‐fibre10, Mediterranean11, and vegetarian12 dietary patterns. They are high in vegetable
protein, fibre and have a low glycemic index13, 14, all of which are associated with improved CHD
outcomes15‐17. Dietary pulses are also high in 7S globulin, a protein which has been shown to increase
uptake and degradation of LDL‐C in human hepatic cells18. Small controlled feeding trials have
demonstrated that diets which emphasize dietary pulses improved lipid levels19‐30. Taken together these
data suggest that high dietary pulse intake may improve serum lipids.
Dietary pulses may offer further cardiovascular protection through reducing oxidized‐LDL‐C (ox‐
LDL‐C). Dietary pulses are a good source of vegetable protein which has been shown to reduce the
oxidation of LDL‐C31, 32. Reducing levels of ox‐LDL‐C is hypothesized to reduce the atherogenicity of LDL‐C
since ox‐LDL‐C is taken up more rapidly by the scavenger receptors of macrophages in the
subendothelial arterial wall33‐35. Recent prospective cohort studies have reported the benefits of higher
plant protein intakes on CVD risk36, 37 and dietary patterns which may include dietary pulses such as low
glycemic index8, DASH9, and Mediterranean11 have also been shown to reduce markers of oxidative
stress. However except for one, few studies have directly assessed a high dietary pulse intake on
oxidative damage32.
INTRODUCTION
Page 3 of 93
Despite these emerging benefits of dietary pulses, most major chronic disease prevention
guidelines have not made specific recommendations for dietary pulse intake to reduce cardiovascular
risk. Rather guidelines have encouraged the consumption of dietary pulses as part of a low‐glycemic
index8, DASH9, high‐fibre10, Mediterranean11, or vegetarian12 diet. There is a need for higher quality
evidence to support the lipid‐lowering and oxidative stress mitigating effects of dietary pulses for
guidelines development. To provide higher quality evidence on the effects of dietary pulses on lipids to
reduce cardiovascular risk, the following thesis work will present: 1) the results of a systematic review
and meta‐analysis of randomized feeding trials of the effects of dietary pulse interventions on
established lipid targets of CVD risk (LDL‐C, Apo‐B, and non‐HDL‐C) and 2) the results of a secondary
endpoint analysis of a randomized feeding trial of the effects of a high dietary pulse diet as a means to
lower the glycemic index compared to a high‐fibre control diet on markers of oxidative stress.

LITERATURE REVIEW
Page 4 of 93
CHAPTER II‐ LITERATURE REVIEW
LITERATURE REVIEW
Page 5 of 93
2.1 CARDIOVASCULAR DISEASE 2.1.1 PREVALENCE
Cardiovascular disease (CVD) is a major public health concern. CVD is a class of diseases relating
to the heart and vascular system including coronary heart disease (CHD), stroke, peripheral vascular
disease, heart failure, rheumatic and congenital heart disease. According to the National Health and
Nutrition Examination Survey (NHANES: 2007–2010), 83.6 million Americans (35.3%) were suffering
from CVD in 201038and 1.3 million Canadians were diagnosed in 200739. Specifically the 2 most prevalent
types of CVD, CHD and stroke, were diagnosed in 15.4 million (6.4%) and 6.8 million (2.4%) individuals,
respectively38. Although the rate of CHD has declined over the decades (NHANES: 1971‐2006), the
prevalence of CHD is still high38. Similar trends have also been reported for Canada39. Despite recent
advances in the understanding of CVD prevention, the prevalence of CVD still remains high.
2.1.2 COMPLICATIONS AND MORTALITY
CVD has serious long‐term consequences. The pathogenesis of CVD is usually characterized by
the development and progression of atheromatous plaques in the arterial wall40. Although
atherogenesis begins as early as adolescence, CVD is considered a preventable disease7. Individuals with
CHD have lower life expectancy because they are at high risk for myocardial infarctions (i.e. heart
attacks), stroke, and heart failure, all of which increases the risk of long‐term disability and mortality. In
2009, the overall death rate attributable to CVD was 236.1 per 100, 000 or 1 in 3 deaths, and specifically
CHD and stroke accounted for 1 in 6 deaths and 1 in 19 deaths, respectively38. Most individuals survive
their first heart attacks38, however, re‐occurring heart attacks can weaken the heart muscle and
decrease the quality of life. It has been estimated that approximately every 34 seconds, 1 American has
a coronary event, and approximately every minute, an American will die of one38. Taken altogether, the
data suggest that the burden of CVD remains high.
LITERATURE REVIEW
Page 6 of 93
2.1.3 RISK FACTORS
2.1.3.1 Coronary Heart Disease
Risk factors of CHD are characterized by the 10‐year CHD Framingham Risk Score (FRS)4. The Risk
Score predicts the risk of CHD based on non‐modifiable risk factors including sex and age, and
modifiable risk factors including diabetes, smoking, blood pressure (BP), total cholesterol (TC), and LDL‐C
levels4. It has been estimated that 80 to 90% of patients with CHD have at least 1 of the 4 modifiable risk
factors of CHD and unhealthy dietary and lifestyle habits have been shown to account for more than
80% of coronary heart events7. The INTERHEART Study, a case‐control study of 15 152 acute myocardial
infarction cases and 14 820 controls from 52 countries, reported that diabetes contributed 9.9% of the
population attributable risk (PAR), smoking at 35.7% (PAR), hypertension at 17.9% PAR, and abnormal
lipids at 49.2% PAR1. In addition to these major risk factors, obesity, poor dietary patterns, physical
inactivity, family history of CHD, and small LDL‐C particles have been associated with an increase in CHD
risk3, 4.
2.1.3.2 Stroke
Risk factors of stroke are characterized by the 10‐year Stroke FRS41. Similar to the CHD risk
score, risk factors for stroke include non‐modifiable risk factors including sex and age, and modifiable
risk factors including systolic BP, diabetes, smoking, CVD and atrial fibrillation status, left ventricular
hypertrophy, and hypertension. Consequences of stroke have serious debilitating effects and it is one of
the leading causes of long‐term disability. Similar to those of CHD, other risk factors associated with
stroke include obesity, poor dietary patterns, physical inactivity, and family history of stroke41.
2.2 LIPIDS AND CARDIOVASCULAR DISEASE
Abnormal lipids have been recognized as one of the most preventable risk factors for CVD. The
pathogenesis of CVD is usually characterized by the development and progression of atheromatous
plaques in the arterial wall40. The Framingham Heart Study (FHS) was the first to correlate high lipid
LITERATURE REVIEW
Page 7 of 93
levels with CHD incidence42, and the INTERHEART Study has identified that almost 50% of acute
myocardial infarctions can be prevented by modifying abnormal lipid levels1. Further the success of
statins, a class of drugs used to lower cholesterol levels by inhibiting the hepatic enzyme HMG‐CoA
reductase, have shown to lower CHD and stroke risk and 43, 44 the Cholesterol Treatment Trialists’ (CTT)
Collaboration have also reported that every 1 mmol/L reduction of LDL‐C can reduce CHD risk by 20%45.
As a result of the overwhelming data supporting the role of abnormal lipids in heart health, major
chronic disease guidelines including the National Cholesterol Education Program‐ Adult Treatment Plan
III (NCEP‐ATP III), Canadian Cardiovascular Society (CCS), Canadian Diabetes Association (CDA), and
American Diabetes Association (ADA) have recognized the importance of lipids in heat health and have
set lipid targets to lower the risk of CVD3, 4, 6, 46.
2.2.1 GUIDELINES
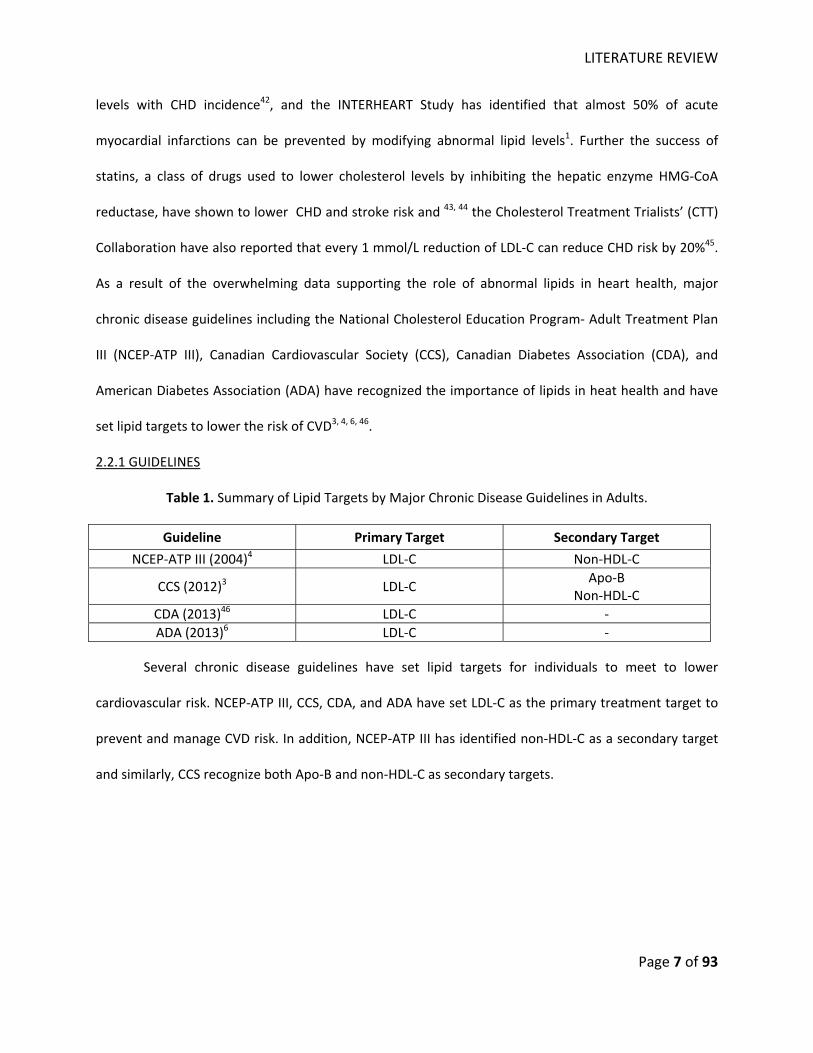
Table 1. Summary of Lipid Targets by Major Chronic Disease Guidelines in Adults.
Guideline Primary Target Secondary Target
NCEP‐ATP III (2004)4 LDL‐C Non‐HDL‐C
CCS (2012)3 LDL‐C Apo‐B
Non‐HDL‐C CDA (2013)46 LDL‐C ‐ ADA (2013)6 LDL‐C ‐
Several chronic disease guidelines have set lipid targets for individuals to meet to lower
cardiovascular risk. NCEP‐ATP III, CCS, CDA, and ADA have set LDL‐C as the primary treatment target to
prevent and manage CVD risk. In addition, NCEP‐ATP III has identified non‐HDL‐C as a secondary target
and similarly, CCS recognize both Apo‐B and non‐HDL‐C as secondary targets.
LITERATURE REVIEW
Page 8 of 93
2.2.1.1 National Cholesterol Education Program‐ Adult Treatment Plan III (NCEP‐ATP III)4
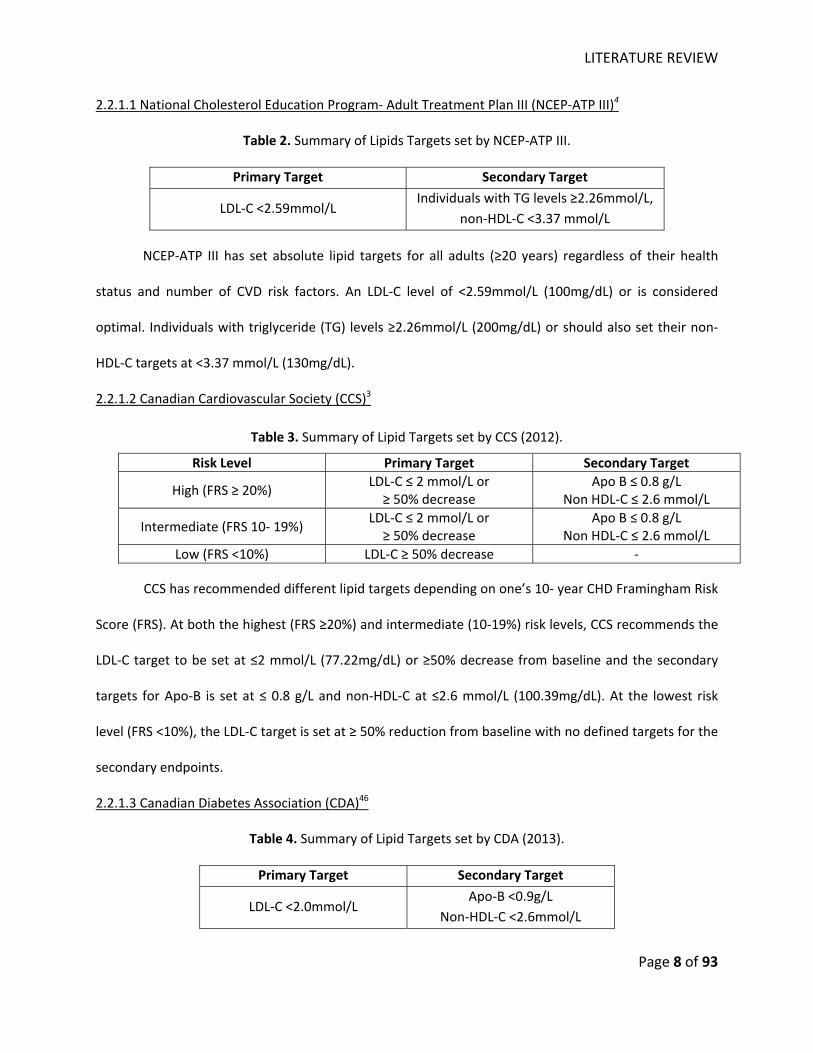
Table 2. Summary of Lipids Targets set by NCEP‐ATP III.
Primary Target Secondary Target
LDL‐C <2.59mmol/L Individuals with TG levels ≥2.26mmol/L,
non‐HDL‐C <3.37 mmol/L
NCEP‐ATP III has set absolute lipid targets for all adults (≥20 years) regardless of their health
status and number of CVD risk factors. An LDL‐C level of <2.59mmol/L (100mg/dL) or is considered
optimal. Individuals with triglyceride (TG) levels ≥2.26mmol/L (200mg/dL) or should also set their non‐
HDL‐C targets at <3.37 mmol/L (130mg/dL).
2.2.1.2 Canadian Cardiovascular Society (CCS)3
Table 3. Summary of Lipid Targets set by CCS (2012).
CCS has recommended different lipid targets depending on one’s 10‐ year CHD Framingham Risk
Score (FRS). At both the highest (FRS ≥20%) and intermediate (10‐19%) risk levels, CCS recommends the
LDL‐C target to be set at ≤2 mmol/L (77.22mg/dL) or ≥50% decrease from baseline and the secondary
targets for Apo‐B is set at ≤ 0.8 g/L and non‐HDL‐C at ≤2.6 mmol/L (100.39mg/dL). At the lowest risk
level (FRS <10%), the LDL‐C target is set at ≥ 50% reduction from baseline with no defined targets for the
secondary endpoints.
2.2.1.3 Canadian Diabetes Association (CDA)46
Table 4. Summary of Lipid Targets set by CDA (2013).
Primary Target Secondary Target
LDL‐C <2.0mmol/L Apo‐B <0.9g/L
Non‐HDL‐C <2.6mmol/L
Risk Level Primary Target Secondary Target
High (FRS ≥ 20%) LDL‐C ≤ 2 mmol/L or ≥ 50% decrease
Apo B ≤ 0.8 g/L Non HDL‐C ≤ 2.6 mmol/L
Intermediate (FRS 10‐ 19%) LDL‐C ≤ 2 mmol/L or ≥ 50% decrease
Apo B ≤ 0.8 g/L Non HDL‐C ≤ 2.6 mmol/L
Low (FRS <10%) LDL‐C ≥ 50% decrease ‐
LITERATURE REVIEW
Page 9 of 93
CDA recognizes fasting for >8 hours may be inappropriate for individuals with diabetes,
especially if insulin is part of treatment. Under these circumstances, non‐HDL cholesterol or Apo‐B
measurements should be used instead. The target for the primary endpoint, LDL‐C, is set at ≤2.0 mmol/L
(77.22mg/dL) for individuals with diabetes. Secondary lipid targets for individuals that cannot fast
include a Apo‐B target of <0.9 g/L and/or a non‐HDL‐C target of <2.6mmol/L (100.39mg/dL).
2.2.1.4 American Diabetes Association (ADA)6
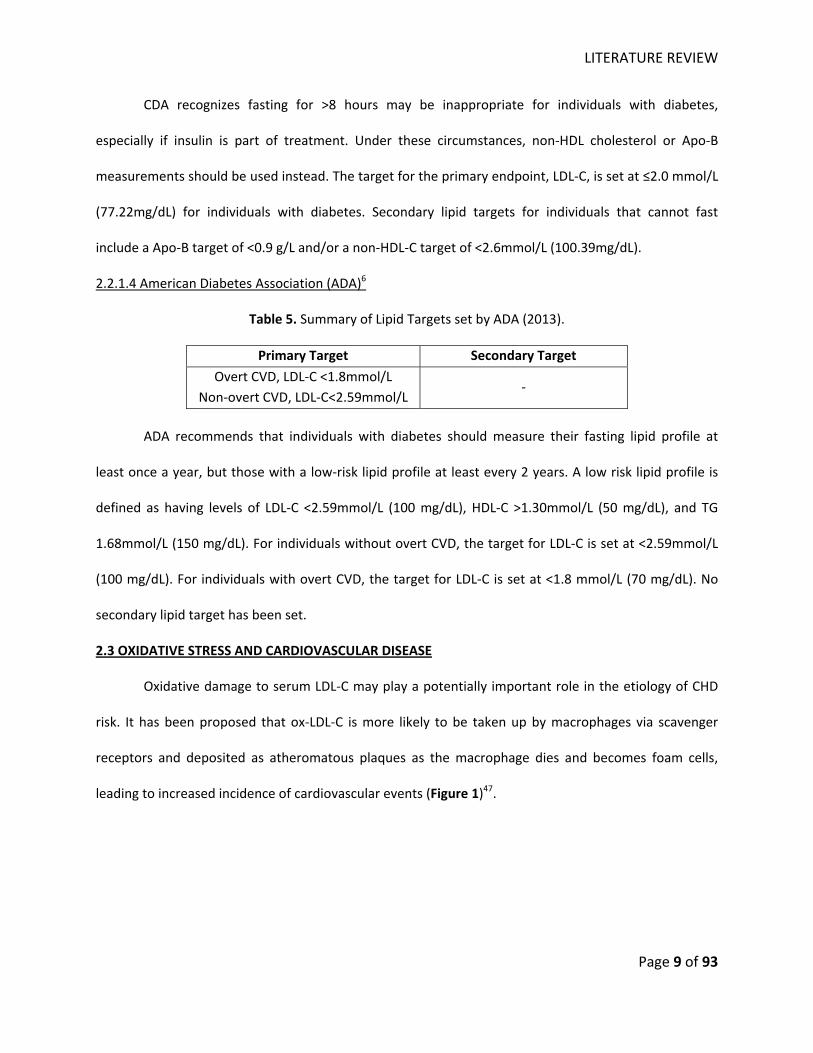
Table 5. Summary of Lipid Targets set by ADA (2013).
Primary Target Secondary Target
Overt CVD, LDL‐C <1.8mmol/L Non‐overt CVD, LDL‐C<2.59mmol/L
‐
ADA recommends that individuals with diabetes should measure their fasting lipid profile at
least once a year, but those with a low‐risk lipid profile at least every 2 years. A low risk lipid profile is
defined as having levels of LDL‐C <2.59mmol/L (100 mg/dL), HDL‐C >1.30mmol/L (50 mg/dL), and TG
1.68mmol/L (150 mg/dL). For individuals without overt CVD, the target for LDL‐C is set at <2.59mmol/L
(100 mg/dL). For individuals with overt CVD, the target for LDL‐C is set at <1.8 mmol/L (70 mg/dL). No
secondary lipid target has been set.
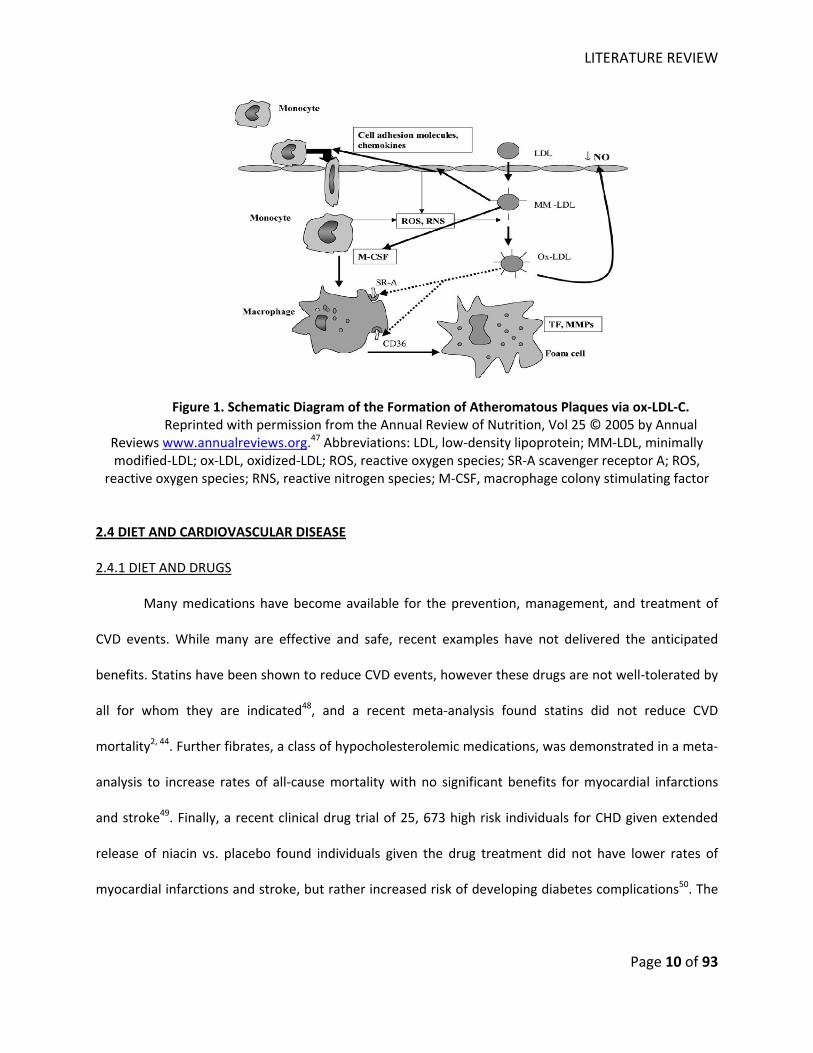
2.3 OXIDATIVE STRESS AND CARDIOVASCULAR DISEASE
Oxidative damage to serum LDL‐C may play a potentially important role in the etiology of CHD
risk. It has been proposed that ox‐LDL‐C is more likely to be taken up by macrophages via scavenger
receptors and deposited as atheromatous plaques as the macrophage dies and becomes foam cells,
leading to increased incidence of cardiovascular events (Figure 1)47.
LITERATURE REVIEW
Page 10 of 93
Figure 1. Schematic Diagram of the Formation of Atheromatous Plaques via ox‐LDL‐C. Reprinted with permission from the Annual Review of Nutrition, Vol 25 © 2005 by Annual
Reviews www.annualreviews.org.47 Abbreviations: LDL, low‐density lipoprotein; MM‐LDL, minimally modified‐LDL; ox‐LDL, oxidized‐LDL; ROS, reactive oxygen species; SR‐A scavenger receptor A; ROS,
reactive oxygen species; RNS, reactive nitrogen species; M‐CSF, macrophage colony stimulating factor
2.4 DIET AND CARDIOVASCULAR DISEASE
2.4.1 DIET AND DRUGS
Many medications have become available for the prevention, management, and treatment of
CVD events. While many are effective and safe, recent examples have not delivered the anticipated
benefits. Statins have been shown to reduce CVD events, however these drugs are not well‐tolerated by
all for whom they are indicated48, and a recent meta‐analysis found statins did not reduce CVD
mortality2, 44. Further fibrates, a class of hypocholesterolemic medications, was demonstrated in a meta‐
analysis to increase rates of all‐cause mortality with no significant benefits for myocardial infarctions
and stroke49. Finally, a recent clinical drug trial of 25, 673 high risk individuals for CHD given extended
release of niacin vs. placebo found individuals given the drug treatment did not have lower rates of
myocardial infarctions and stroke, but rather increased risk of developing diabetes complications50. The
LITERATURE REVIEW
Page 11 of 93
lack of anticipated effects by drugs has reinforced the position of major health organizations that diet
and lifestyle change remain the cornerstone of CVD prevention and management.
2.4.2 DIETARY PATTERNS AND CARDIOVASCULAR DISEASE
Diet has been recognized as an essential and preventive method of reducing cardiovascular risk3‐
6. Since Ancel Key’s landmark publication of the Seven Countries Study which identified the influence of
nutrition and diet on CHD risk51, there has been a renewed interest on understanding the effects of
dietary and lifestyle patterns on heart health. In the past, nutrition studies have focused on a single
nutrient component or food on cardiovascular risk, but more recently, the attention has shifted to
focusing on the totality of the diet52. Diets such as DASH for blood pressure reduction9, Portfolio for lipid
improvements53, and Mediterranean for CHD risk reduction54 have all shown greater improvements in
CVD risk factors and events than any single nutrient component or food. In addition, the analysis of
overall dietary patterns is more reflective of real‐life conditions as individuals are likely to eat foods in
the context of a meal and substitute one food for another rather than simply adding another food
component to their diet55. For example, current recommendations advise to reduce total saturated fat
intake to lower CVD. However, a majority of studies have reported that saturated fat intake is harmful
only when substituting for polyunsaturated fatty acids (PUFAs), but there is no conclusive evidence of
harm when substituting for carbohydrates or monounsaturated fatty acids (MUFAs)56. Food choices
appear in clusters in diets and they reflective an overall pattern in the diet (eg. individuals with high
saturated fat intake are less likely to have high PUFA intake)55. Given that there is strong collinearity
between food intakes, focusing on encouraging a “healthy” dietary pattern may have more impact on
the prevention and management of CVD risk3‐6.
2.4.2.1 Prospective Cohort Studies
Prospective cohort studies have provided evidence that dietary patterns have important
implications for CVD prevention and management. Two “basic” dietary patterns have been identified: 1)
LITERATURE REVIEW
Page 12 of 93
Western pattern characterized by high consumptions of red and processed meat, butter, potatoes,
refined grains, and high‐fat dairy; 2) prudent pattern characterized by high consumptions of vegetables,
fruits, legumes, seafood, and whole grain consumption57. Although the Western diet is more prevalent
in some developed countries, more developing countries are adapting to this dietary habit as their
economic development becomes more integrated with the Western economy52. In the Health
Professional Follow‐Up Study (HPFS: 1986‐1994), after coronary risk factors were adjusted, the prudent
diet was associated with a decreased risk of 24% for CHD compared to the lowest‐quantile characterized
as having the lowest adherence to the prudent diet. In contrast, the Western diet was associated with
an increased risk of 46% for CHD when the extreme quantile was compared to the lowest55. The
difference in risk demonstrates the prudent diet offers an overall of 50% CHD risk reduction compared
to the Western diet55. Similar findings have also been reported by other prospective cohorts for both the
prudent and Western diets58, 59. These findings are not surprising as the prudent diet is made up of foods
and nutrient components that have been well associated with improved cardiovascular outcomes37, 52, 57.
There is evidence from dietary intervention trials suggestive that the combination of foods that are
known to offer cardio‐protection have additive effects when taken together53. Other benefits of health
have also been positively associated with greater adherence to the prudent diet including lower risks of
CVD events, cancer, and total mortality60.
2.4.2.2 Dietary Intervention Trials
Intervention trials have provided further support to strengthen the benefits of dietary patterns
on cardiovascular risk. Studies of dietary patterns have shown greater reductions in CVD risk factors
than isolated nutrients or foods. The Portfolio diet, for example, has 4 primary interventions: plant
sterols, viscous fibre, soy protein, and nuts. Individually each of these foods has been recognized by the
FDA to lower LDL‐C53. The combination of these foods in the same diet, however, has found significant
serum LDL‐C reductions to levels equivalent to the effects of early statin drug trials after 6 months of
LITERATURE REVIEW
Page 13 of 93
intervention, an outcome greater than any of the foods consumed singly53. The Dietary Approach to
Stop Hypertension (DASH) diet characterized by a low salt diet by increasing consumptions of fruits and
vegetables, nuts, whole grains, reduced low‐fat dairy and red meat intakes has also shown similar
benefits of dietary patterns over isolated foods but on blood pressure9. More importantly, the
Prevención con Dieta Mediterrànea (PREDIMED), a recent randomized feeding trial with a dietary
pattern intervention design, has shown benefits on clinical cardiovascular outcomes54. The PREDIMED
study compared the control diet (dietary advice to reduce fat intake) to 2 intervention arms, a
Mediterranean diet supplemented with either extra‐virgin olive oil or mixed nuts. Combined together,
the Mediterranean intervention diets showed a significant 30% reduction in the composite of
myocardial infarction, stroke, and death from cardiovascular‐cause events, after a median 4.8 years of
follow‐up. There is strong support demonstrating the effects of dietary patterns on cardiovascular risk
factors and clinical hard‐endpoints. These beneficial dietary pattern effects have been recognized by
guidelines in the prevention and management CVD3‐6.
2.5 PLANT‐PROTEIN BASED DIET AND CARDIOVASCULAR DISEASE
There is a growing interest in preventing cardiovascular risk using foods high in plant protein57,
61. Sources of high plant protein include fruits and vegetables, whole grains, soy, and dietary pulses.
Diets high in plant‐protein have been commonly been characterized in vegetarian and vegan diets, both
of which have demonstrated significant reductions of both cardiovascular risk factors and overall risk in
large prospective cohort studies such as the 62, 63. Higher plant protein intake may offer cardio‐protective
effects because it displaces refined carbohydrate consumption, and is associated with higher fibre and
lower saturated fat intakes37, 57, 64. It is also likely that the different sources of plant protein may have an
unique protein composition that further offers cardiovascular risk protection. For example, dietary
pulses and soy are high in 7S globulin, a protein that has been shown to have hypocholesterolemic
effects in humans18.
LITERATURE REVIEW
Page 14 of 93
2.5.1 PROSPECTIVE COHORT STUDIES
Prospective cohort studies have primarily focused on the analysis of vegetable proteins and
have reported a protective association against cardiovascular events. A study of a Finnish cohort (n=
5133) found an inverse association between vegetables and CHD risk with the multivariate relative risks
for CHD death at 0.66 (95% CI: 0.46, 0.96) for men and 0.66 (95% CI: 0.35‐1.23) in women65. Two of the
largest prospective cohorts, the Nurses’ Health Study (NHS: 1976‐1994) and Health Professionals’
Follow‐up Study (HPFS: 1986‐1994) have also shown reduced CVD events with higher vegetable and fruit
intakes66. Vegetables are high in many cardio‐protective nutrients including fibre, potassium, flavonoids,
and antioxidants57, but are also a good source of protein which may have important cardiovascular
implications. The Iowa Women’s Health Study of almost 30 000 post‐menopausal women, reported a
significant inverse relationship with vegetable protein intake and CHD deaths with greater displacement
of carbohydrates or animal protein by vegetable protein intake17. Contrary to this finding, the Adult
Health Study (AHS)67 and a Japanese prospective cohort study68, both of which did not assess for
displacement of nutrients like the Iowa Women’s Health Study, found no significant associations with
total vegetable protein intake and stroke. These findings appear to suggest the cardio‐protective effects
of vegetable proteins is greatest when it displaces carbohydrates or animal protein intakes; however
there is still the possibility that high vegetable protein intake is protective against of CHD mortality but
not stroke events. If the former is true, however, more studies are needed to better understand the
association of vegetable protein intake and stroke risk when vegetable protein displaces other nutrient
components in the diet.
Although soy protein has received particular attention for its hypolipidemic effects69, the
association of soy protein on cardiovascular events from prospective cohort studies have not been well‐
studied. To our knowledge, only one prospective cohort in Chinese women (n= 75 000) has been
published assessing soy protein intake and CHD events, which reported a 75% CHD event reduction with
LITERATURE REVIEW
Page 15 of 93
~18 grams per day of soy protein compared to ~5 grams per day70. Most of the cardio‐protective effects
of soy have been studied through dietary trials, however there is an urgent need for more studies to
improve the existing evidence for the association of soy protein intake and hard endpoints such as
myocardial infarction, stroke, and mortality.
2.5.2 DIETARY INTERVENTION TRIALS
With the exception of soy protein, there is a limited number of dietary intervention trials that
have assessed the effects of other sources of plant protein on cardiovascular risk factors. The
hypocholesterolemic effects of soy protein have been well documented69 and as a result, both Canada
and US have issued health claims to encourage the consumption of soy protein to improve lipid levels to
reduce CVD risk. Only one study has been identified to assess the effects for each of wheat gluten
protein31, barley protein71, and total vegetable protein72 on cardiovascular risk factors. Both trials of
wheat gluten and vegetable proteins have shown significant favourable on lipids with wheat gluten
protein also showing improvements in ox‐LDL‐C when compared to a high fibre diet31, 72. In contrast,
barley protein consumption did not show favourable effects on lipids when compared to casein;
however they may still be used to increase the overall intake of protein71. These studies offer support
for different sources of plant protein as a method of decreasing CVD risk; however there is a need for
more studies to improve the existing evidence to support the effects of plant protein on CVD risk
factors.
2.6 DIETARY PULSES AND CARDIOVASCULAR DISEASE
The Food and Agriculture Organization of the United Nations/World Health Organization
(FAO/WHO) define dietary pulses as: “dry seeds of leguminous plants which are distinguished from
leguminous oil seeds by their low fat content.73” They do not include soybeans or peanuts because both
are high in fat content, or green beans or peas because these include both the seeds and pods of the
LITERATURE REVIEW
Page 16 of 93
legume. They are high in plant protein, fibre, and have a low glycemic index, which have all been shown
to improve cardiovascular outcomes8, 13, 19.
2.6.1 DIETARY PULSES IN GUIDELINES
Major health organizations have encouraged dietary pulse intake as part of a strategy to lower
the risk of chronic diseases but none have directly made recommendations to increase dietary pulse
consumption based on lipid‐lowering effects and CVD prevention. Public health guidelines from Health
Canada and the FAO/WHO encourage dietary pulse intake as a method of increasing fibre intake, and
decreasing the risks of obesity, T2DM, and CVD74, 75. Chronic disease association guidelines from the
American Heart Association (AHA)76, as well as the American (ADA)6, Canadian (CDA)5, and European
(EASD)77 Diabetes Associations encourage dietary pulse consumption as a means for improving
cardiometabolic outcomes through reducing postprandial glycemia, reducing energy intake, lowering
the GI, increasing dietary fibre and displacing cholesterol. In all cases, the evidence on which these
recommendations is based has been assigned a low‐grade, while the FAO/WHO (minimum of 20‐g/d)
and AHA (2‐3‐cups/wk) are the only associations to find sufficient evidence to quantify intake targets74,
76. The Canadian Cardiovascular Society (CCS) did not make recommendations for dietary pulses;
however it does recognize the LDL‐C lowering effects of soy3. Neither Health Canada nor its American
(FDA) or European (European Food Safety Authority [EFSA]) counterpart permits any pulse related
health claims, and none of the major Canadian or American hypertension78, 79 and dyslipidemia3, 4
guidelines address dietary pulses in their recommendations. This situation, in which diabetes and heart
association have made recommendations for dietary pulses but have assigned the recommendation as
based on a low‐grade of evidence and the lack of data to support health claims and other
cardiometabolic recommendations, serves as a call for stronger evidence.
LITERATURE REVIEW
Page 17 of 93
2.6.2 DIETARY PULSES AND CARDIOVASCULAR DISEASE
The association of dietary pulses and cardiovascular risk is difficult to ascertain. Prospective
cohort and case‐control studies have grouped dietary pulses with soybean and peanut products
(collectively referred to as legumes) in the analyses. Collectively legumes have shown significant
cardiovascular risk reduction with greater intakes80, 81; however unlike soybeans and peanuts, dietary
pulses have a low fat content and are very likely to act differently than soybeans and peanuts in their
cardio‐protective effects. More likely, dietary pulses lower the risk of CVD through other nutritional
components. The NHANES (1999‐2002) study found that Americans. who consumed approximately ½
cup dry beans or peas had higher intakes of fibre, vegetable protein, folate, zinc, iron and magnesium
and lower intakes of saturated and total fat82, all of which are cardio‐protective. Dietary pulses are also
high in 7S globulin which has been shown to have hypocholesterolemic effects18. However to date, there
has been no prospective cohort study that directly assessed dietary pulses only and CVD risk. There is a
need for observational studies to better understand the relationship between high dietary pulse intake
and heart health.
2.6.3 DIETARY PULSES IN DIETARY PATTERNS
Dietary pulses have been included in several dietary patterns. These diets have been shown to
improve serum lipid levels, including the Portfolio53, low‐GI53, DASH9, high fibre10, and vegetarian12 diets.
Further the Mediterranean diet has been shown to improve the risk for composite of myocardial
infarctions, stroke, and cardiovascular‐cause deaths54. However as dietary pulses were included with
other dietary interventions in these studies, it is difficult to ascertain the independent effects of dietary
pulses on cardiovascular risk factors and outcomes. Dietary intervention trials specific to assessing
dietary pulses on cardiovascular risk are needed to better qualify and quantify its benefits.
LITERATURE REVIEW
Page 18 of 93
2.6.4 DIETARY PULSES IN INTERVENTION TRIALS
2.6.4.1 Evidence from Meta‐Analyses
Two previous meta‐analyses have been conducted investigating the effects of dietary pulses
(beans, chickpeas, lentils and peas) on lipids13, 83. Both studies involving 15 trials estimated higher
dietary pulse intakes for 2 to 16 weeks compared to control diets showed significant improvements in
total cholesterol (TC) (≈0.30 mmol/L, p<0.001; or ≈7.12%, p<0.05) and LDL‐C levels (≈0.20 mmol/L,
p<0.001; or ≈6.16%, p<0.05) at doses of 50‐440 grams per day (i.e. 1 to 10 175‐g servings/week), while
Anderson et al. also reported a significant TG reduction (16.6%, p<0.05)83. A review of controlled feeding
trials since these meta‐analyses were published shows the results have remained largely consistent8, 20,
25. Although both meta–analyses reported the effects of dietary pulses on LDL‐C, neither considered
other established lipid outcomes including Apo‐B and non‐HDL‐C. Controlled feeding trials, however,
have shown that consumption of dietary pulses reduce TC and VLDL‐C levels22, 23, 25, reductions which
would be reflected in a lower non‐HDL‐C level. Future meta‐analyses need to consider these established
lipid targets to provide higher level of evidence for the development of clinical practice guidelines for
the recommendations of dietary pulses.
2.6.4.2 Evidence from Randomized Feeding Trials in Humans
Clinical studies have shown regular consumption of dietary pulses can reduce serum TC and LDL‐
C but have little or no effect on HDL‐C 19‐28, 30. Few studies, however, have reported the effects of dietary
pulses on other established lipid targets such as Apo‐B and non‐HDL‐C.
The mechanism by which dietary pulses lower cholesterol levels is unclear; however, the effect
can be broadly divided into 2 pathways: extrinsic and intrinsic. The extrinsic pathway proposes that
dietary pulses reduce serum cholesterol by displacing saturated and trans fat intake. Americans who
consumed approximately ½ cup dry beans or peas daily had lower intakes of saturated and total fat82.
While the effects of saturated and total fat on cardiovascular risk are conflicting, many human clinical
LITERATURE REVIEW
Page 19 of 93
trials have shown a beneficial effect when saturated fat is replaced with polyunsaturated or
monounsaturated fatty acid intake (PUFA or MUFA, respectively)84. Further, dietary pulses are high in
soluble fibre which is known to bind to dietary cholesterol in the intestine and prevent its absorption85,
86. Possibly more importantly, dietary pulses are high in 7S globulins, a peptide which has been shown to
increase uptake and degradation of LDL‐C in human hepatic cells, and is also hypothesized to confer the
favourable lipid effects of soybeans18. Of the intrinsic pathway proposes that in addition to binding to
dietary cholesterol, the soluble fibre in dietary pulses can bind to bile acids to prevent its re‐absorption.
Consequently, there is an increase in the production of bile acids by the liver, which decreases the liver
pool of cholesterol and increases uptake of serum cholesterol by the liver thereby decreasing circulating
cholesterol in the blood22. Further fermentation of fibre in the colon produces short chain fatty acids
(SCFA) such as propionate and butyrate, which are associated with inhibition of cholesterol synthesis19,
23.
2.6.5 DIETARY PULSES AND OXIDATIVE STRESS
There is suggestion that a high dietary pulse intake may reduce levels of ox‐LDL‐C. Foods high in
plant protein such as wheat gluten have been shown to improve levels of oxidative stress in a dietary
intervention trial31. Dietary pulses are also high in plant protein; however, only one trial of 3 weeks in
duration (n= 30) has assessed the effects of dietary pulses, at an intake of 130 grams per day, on
oxidative stress, reporting no significant treatment differences when compared to an average American
diet32. Despite these findings, the study still reported a significant reduction of ox‐LDL‐C when
comparing the 2 treatment arms (p= 0.035)32. The findings of this study suggest that high dietary pulse
intake may still reduce levels of ox‐LDL‐C through a mechanism that is independent of oxidative stress.
Possibly dietary pulses lower the levels of serum LDL‐C, thereby reducing the availability of LDL‐C for
oxidation. Indeed several meta‐analyses have demonstrated high dietary pulse intake lowers LDL‐C
LITERATURE REVIEW
Page 20 of 93
levels13, 83. However given the short duration and small sample size of this study, larger, longer, and high‐
quality clinical trials are needed to further understand the effects of dietary pulses on oxidative stress.
2.6.6 DIETARY PULSES AND OTHER CARIOVASCULAR RISK FACTORS
Regular dietary pulse consumption has also been shown to improve other risk factors of CVD
including glycemia, body weight, and blood pressure. A meta‐analysis of 11 trials reported that dietary
pulses resulted in significant fasting blood glucose (standardized mean difference=‐0.82 [95% confidence
interval: ‐1.36 to ‐0.27]; p=0.03) and insulin (standardized mean difference= ‐0.49 [95% confidence
interval= ‐0.93 to ‐0.04]; p=0.03) reduction87. Early studies have shown high consumption of dietary
pulses resulted in exceptionally low glycemic responses when fed to healthy volunteers14, and in later
experiments were demonstrated to possess a carbohydrate profile that was more slowly digested than
that of other foods such as cereals88. This property of slower absorption, which is common to the α‐
glucosidase inhibitor class of medications such as acarbose suggest that dietary pulses are an important
means of lowering the glycemic index of the diet and, by analogy with acarbose, CHD risk89.
The review of the available evidence shows the data from experimental trials in humans are
largely inconclusive for body weight, with the only meta‐analysis published 10 years ago (n=11 trials)
finding no effect of dietary pulses on body weight.83 However, since the meta‐analysis has been
published, several dietary intervention studies have reported significant weight loss with higher dietary
pulse intake8, 90, suggesting that perhaps a beneficial body weight effect may have been missed in the
meta‐analysis due to the limited available studies. Further, a review of the few randomized trials
conducted to‐date is suggestive of a tendency for modest blood pressure‐lowering effect8, 20, 25, 90.
However, as a good source of fibre, dietary pulses would be expected to show a blood pressure lowering
effect91.

HYPOTHESIS, OBJECTIVES, AND RATIONALE
Page 21 of 93
CHAPTER III‐ HYPOTHESIS, OBJECTIVES, AND RATIONALE
HYPOTHESIS, OBJECTIVES, AND RATIONALE
Page 22 of 93
3. HYPOTHESIS, OBJECTIVES, RATIONALE 3.1 HYPOTHESIS
A diet high in dietary pulses will improve lipid risk factors of cardiovascular disease.
1. Diets emphasizing dietary pulses will improve levels of established lipid targets of cardiovascular
risk including LDL‐C, Apo‐B, and non‐HDL‐C compared to control diets in a systematic review and
meta‐analysis of randomized feeding trials
2. A high‐dietary pulse diet as a means to lower the glycemic index of the diet will reduce oxidative
stress markers including thiobarbituric acid reactive substances (TBARS), conjugated dienes
(CD), and protein thiols compared to a high‐fibre control diet in a secondary endpoint analysis
of a randomized, controlled, parallel trial of 12 weeks in T2DM
3.2 OBJECTIVES
Overall objective: To investigate the effects of dietary pulses (beans, chickpeas, lentils, and peas)
on lipid risk factors associated with increased CVD risk.
Specifically:
1. To assess the effects of dietary pulses on established lipid targets of cardiovascular disease in a
systematic review and meta‐analysis of randomized feeding trials.
2. To determine whether a diet high in dietary pulses, as a means to lower the GI of diet,
compared to a high fibre diet will improve oxidative damage to serum lipids and proteins, as
assessed by TBARS and CD in the LDL fraction and protein thiols in serum in a secondary
endpoint analysis of a 12‐week randomized feeding trial in T2DM.
3.3 RATIONALE
Although most major chronic disease prevention guidelines encourage the consumption of
dietary pulses, few guidelines have made recommendations based on the direct lipid lowering or
cardiovascular risk reduction benefits of dietary pulses. While 2 previous meta‐analyses have assessed
HYPOTHESIS, OBJECTIVES, AND RATIONALE
Page 23 of 93
the effects of dietary pulses on lipids13, 83, neither assessed the effects on established lipid targets nor
did they include studies that were at least 3 weeks in duration, a requirement to satisfy the FDA criteria
used in the scientific evaluation of lipid‐lowering health claims92. In all cases, the evidence on which the
recommendations for dietary pulses are based on has been assigned a low‐grade. Therefore, there is a
need for higher quality evidence to support the lipid‐lowering effects of dietary pulses for guideline
development. Therefore a systematic review and meta‐analysis assessing the effects of dietary pulses on
established lipid targets of CVD was undertaken.
Dietary pulses may offer further cardiovascular protection through reducing oxidized‐LDL‐C (ox‐
LDL‐C). Dietary pulses are a good source of vegetable protein and this nutritional property may provide
further protection from CVD by reducing the oxidation of LDL‐C31. Further like soy, they are high in
phenolics which may have beneficial effect on oxidative stress. Few feeding trials in humans have
assessed the effects of dietary pulses on oxidative stress except for one small trial of 30 individuals32.
Therefore a human feeding trial comparing the effects of a high dietary pulse diet as a means to lower
the GI to a high fibre comparator diet on oxidative stress was undertaken.
DIETARY PULSES AND LIPIDS
Page 24 of 93
CHAPTER IV‐ THE EFFECT OF DIETARY PULSES ON ESTABLISHED LIPID THERAPEUTIC TARGETS OF CARDIOVASCULAR DISEASE: A SYSTEMATIC REVIEW AND META‐ANALYSIS OF RANDOMIZED
CONTROLELD TRIALS
DIETARY PULSES AND LIPIDS
Page 25 of 93
4.1 CITATIONS
The abstract of this work has been published in the following journals:
1. Ha V, Jayalath VH, de Souza RJ, Sievenpiper JL, Mirrahimi A, Chiavaroli L, Beyene J, Kendall CWD,
Jenkins DJ. The Effects of Dietary Pulses on Established Lipid Therapeutic Targets of Cardiovascular
Disease: A Systematic Review and Meta‐analysis of Randomized Controlled‐Feeding Trials. Journal of
the American College of Nutrition 2012; 31(3): 218.
2. Ha V, Sievenpiper JL, de Souza RJ, Jayalath VH, Mirrahimi A, Blanco Mejia S, Beyene J, Kendall CWD,
Jenkins DJ. Dietary Pulse Intake May Improve Levels of LDL‐C and Non‐HDL‐C: A Systematic Review
and Meta‐analysis. Canadian Journal of Diabetes 2012; 36 (5): S10.
3. Ha V, de Souza RJ, Sievenpiper JL, Jayalath VH, Beyene J, Jenkins DJA, Kendall CWC. The Effect of
Dietary Pulses on Lipids in Controlled Feeding Trials: A Systematic Review and Meta‐Analysis. FASEB J
2012; 26:117.4.
DIETARY PULSES AND LIPIDS
Page 26 of 93
THE EFFECT OF DIETARY PULSES ON ESTABLISHED THERAPEUTIC LIPID TARGETS OF CARDIOVASCULAR
DISEASE: A SYSTEMATIC REVIEW AND META‐ANALYSIS OF RANDOMIZED CONTROLLED TRIALS
Vanessa Ha MSc Candidate1,4, John L Sievenpiper Knowledge Synthesis Lead and Resident Physician1,7,
Russell J de Souza Post‐doctoral Fellow1,4,8, Viranda H Jayalath Research Student1,4, Arash Mirrahimi
Research Coordinator1, Arnav Agarwal Research Student,9 Laura Chiavaroli PhD Candidate1,4, Sonia
Blanco‐Mejia Research Coordinator1,4, Frank M Sacks Professor of Cardiovascular Disease
Prevention13,14,15, Marco Di Buono Vice President, Science and Research10, Adam M Bernstein Director of
Research13,16, Lawrence A Leiter Professor of Medicine and Nutritional Sciences1,2,3,4,5, Penny M Kris‐
Etherton Distinguished Professor of Nutrition17, Vladimir Vuksan Professor of Nutritional Sciences1,2,4,
Richard P Bazinet Associate Professor of Nutritional Sciences4, Robert G Josse Professor of Medicine and
Nutritional Sciences1,2,3,4,5, Joseph Beyene Associate Professor of Clinical Epidemiology and
Biostatistics6,8,11, Cyril WC Kendall Research Associate and Adjunct Professor of Nutritional Sciences1,4,12,
David JA Jenkins University Professor of Medicine and Nutritional Sciences1,2,3,4,5,
1Clinical Nutrition and Risk Factor Modification Centre, 2Keenan Research Centre of the Li Ka Shing Knowledge
Institute, and 3Division of Endocrinology, St. Michael’s Hospital, Toronto, ON, CANADA; 4Departments of
Nutritional Sciences, and 5Medicine, and 6The Dalla Lana School of Public Health, Faculty of Medicine, University of
Toronto, Toronto, ON, CANADA; 7Departments of Pathology and Molecular Medicine, 8Clinical Epidemiology &
Biostatistics, 9Health Sciences, Faculty of Health Sciences, McMaster University, Hamilton, ON, CANADA; 10American Heart Association, Houston, Texas, USA; 11The Hospital for Sick Children Research Institute, Toronto,
ON, CANADA; 12College of Pharmacy and Nutrition, University of Saskatchewan, Saskatoon, Saskatchewan,
CANADA; 13Department of Nutrition, Harvard School of Public Health, and 14the Channing Laboratory, Department
of Medicine, Brigham and Women’s Hospital and 15Harvard Medical School, Cambridge, MA, USA; 16Wellness
Institute of the Cleveland Clinic, Lyndhurst, OH, USA; 17Department of Nutritional Sciences, Pennsylvania State
University, University Park, PA, USA.
Corresponding author: John L Sievenpiper MD, PhD Toronto 3D Knowledge Synthesis and Clinical Trials Unit, St. Michael's Hospital 61 Queen Street East, Toronto, ON, M5C 2T2, CANADA Tel: 416 867 7475 Fax: 416 867 7495 Email: [email protected]
DIETARY PULSES AND LIPIDS
Page 27 of 93
4.2 ABSTRACT
Background: Evidence from controlled feeding trials supports dietary pulses (beans, peas, chickpeas,
and lentils) as a dietary intervention to improve dyslipidemia, but heart health guidelines have stopped
short of ascribing specific heart‐health benefits to dietary pulses or have graded the beneficial evidence
as low. To improve the evidence on which dietary guidelines are based, we conducted a systematic
review and meta‐analysis to assess the effect of dietary pulses on established therapeutic lipid targets
for cardiovascular risk reduction: LDL‐C, Apo‐B, and non‐HDL‐C.
Methods and Results: We searched MEDLINE, EMBASE, Cochrane, and CINAHL databases through Feb
11 2013 and included randomized controlled feeding trials of ≥3‐weeks duration that compared a diet
emphasizing dietary pulse intake with an isocaloric diet without pulses. Three independent reviewers
extracted relevant data with disagreements resolved by consensus. Data were pooled by the generic
inverse variance method using random effects models and expressed as mean differences (MD) with
95% confidence intervals (CI). Heterogeneity was assessed (Chi2) and quantified (I2). Study quality and
risk of bias were assessed. Twenty‐six isocaloric trials (n= 1013) satisfied the inclusion criteria. Diets
emphasizing dietary pulses at a median dose of 130g/d (~1.5 servings) significantly lowered LDL‐C
compared with isocaloric control diets (MD= ‐0.17 mmol/L [95% CI: ‐0.25, ‐0.09]; p<0.0001). No
treatment effects were observed for Apo‐B and non‐HDL.
Conclusions: Pooled analyses demonstrated that dietary pulses significantly improve LDL‐C. The majority
of trials, however, were short in duration and poor quality. There is a need for larger and higher quality
trials
Clinical Trial Registration: NCT01594567
Abstract word count: 247
Key words: systematic review, meta‐analysis, dietary trials, legumes, dietary pulses, dyslidpidemia,
cardiovascular disease
DIETARY PULSES AND LIPIDS
Page 28 of 93
4.3 INTRODUCTION
Abnormal blood concentrations of lipids and lipoproteins are one of the most important
modifiable risk factors for cardiovascular disease (CVD). Although statins are effective in reducing blood
LDL‐C2, major health organizations maintained that the initial and essential approach to CVD prevention
and management is to modify dietary and lifestyle patterns3‐6.
Dietary non‐oil‐seed pulses are foods which have received particular attention for their ability to
reduce CVD risk as part of low‐glycemic index (GI)8, Dietary Strategies to Stop Hypertension (DASH)9,
high‐fibre10, Mediterranean11, and vegetarian12 dietary patterns. Dietary non‐oil‐seed pulses, including
beans, peas, chickpeas, and lentils, have a low GI, are high in viscous soluble fibre, vegetable protein,
and various bioactive compounds13, 86. Observational studies have shown legumes including dietary
pulse consumptions are associated with CVD reduction80, 81 and small controlled feeding trials8, 19‐23, 25‐30,
90, 93, 94 have demonstrated that diets which emphasize dietary pulses improve LDL‐C levels. Although
most major chronic disease prevention guidelines encourage the consumption of dietary pulses as part
of a dietary strategy3, 74, 77, 95, 96, none of the guidelines have made recommendations based on the direct
lipid lowering or cardiovascular risk reduction benefits. The focus of guidelines, such as those of the
American Heart Association which recommends ≥4‐5 servings/week96, has been on the effects of dietary
pulses to improve the diet quality in the management of diabetes and CVD risk5, 6, 74, 77, 95, 96. In all cases,
the evidence on which recommendations are based has been assigned a low‐grade5, 6, 74, 77, 95, 96.
Dyslipidemia guidelines including those from the National Cholesterol Education Program (NCEP) adult
treatment panel III (ATP III) and the Canadian Cardiovascular Society (CCS) do not address dietary pulses
intake directly3, 4. There is a need for higher quality evidence to support the lipid lowering effects of
dietary non‐oil‐seed pulses for guidelines development.
To improve the evidence on which dietary guidelines are based, we conducted a systematic
review and meta‐analysis of randomized controlled feeding trials on the effect of dietary non‐oil‐seed

DIETARY PULSES AND LIPIDS
Page 29 of 93
pulses on established therapeutic lipid targets for cardiovascular risk reduction including LDL‐C, Apo‐B,
and non‐HDL‐C.
4.4 METHODS
The Cochrane Handbook for Systematic Reviews of Intervention was used as a guideline for this
meta‐analysis97. Reporting of results followed the Preferred Reporting Items for Systematic Reviews and
Meta‐Analyses (PRISMA) guidelines98. The review protocol is available at ClinicalTrials.gov (registration
no. NCT01594567).
4.4.1 STUDY STRATEGY SELECTION
We searched MEDLINE, EMBASE, Cochrane Central Register of Controlled Trials, and CINAHL
through Feb 11 2013, to identify randomized controlled dietary trials of dietary non‐oil‐seed pulses.
Table 1 shows the search strategy. Manual searches of references cited by published studies also
supplemented the database search. No restriction was placed on language.
4.4.2 ELIGIBILITY CRITERIA
We included randomized trials that investigated the effect on LDL‐C, Apo‐B and non‐HDL‐C of
diets high in dietary non‐oil‐seed pulses compared to control or usual diets matched for energy for a
period of ≥3 weeks, a duration which satisfies the minimum follow‐up requirement of the FDA used in
the scientific evaluation of lipid‐lowering health claims92. Studies that only examined dietary non‐oil‐
seed pulses (beans, chickpeas, lentils, and peas) were included; peanuts and soybeans were excluded
because of their high oil content. We included interventions in which dietary pulses were not the sole
intervention, provided that dietary pulses were the dominant intervention used to achieve intervention
goals (n=3)8, 10, 99. Studies providing only dietary pulse extracts, such as bean extracts or isolated fibre
supplements, were not eligible. Both control and treatment arms must have been matched for total
energy (i.e. an isocaloric comparison). The selected endpoints included only those which have been
DIETARY PULSES AND LIPIDS
Page 30 of 93
identified as therapeutic lipid targets in the NCEP‐ATP III4, 2012 CCS3, 2012 American Diabetes
Association (ADA)6, and 2013 Canadian Diabetes Association (CDA) guidelines3.
The study by Anderson et al.85 was quasi‐randomized. We attempted to reduce bias induced by
non‐randomization by re‐analyzing this study by randomly assigning participants to either treatment or
control, stratified by baseline total cholesterol and age, and treating the post‐control and post‐
treatment arms as a parallel study design.
4.4.3 DATA EXTRACTIONS
Studies that met the inclusion criteria had their study characteristics and results extracted by 3
independent reviewers (VH, VHJ, and RJdS). As well, a 10‐year CHD risk score was calculated for each
study’s population using the Framingham risk equation3. If information was missing for CHD risk
prediction, participants were assumed to be at higher risk for that particular dimension (eg. assumed to
be smokers, hypertensive, low HDL‐C, and/or have family history of CHD).
The quality of each study was assessed using Heyland’s Methodological Quality Score (MQS)100.
Studies could receive a maximum score of 13 points. Studies with scores of ≥8 were considered high
quality. Points were awarded based on the quality of study methods, sample selection and follow‐up,
and intervention.
Studies were assessed for risk of bias using the Cochrane Risk of Bias Tool. Domains of bias
assessed were sequence generation, allocation concealment, blinding, outcome data, and outcome
reporting97. Studies were marked as, high risk of bias when a methodological flaw was likely to have
affected the true outcome, low risk of bias if the flaw was deemed inconsequential to the true outcome,
and unclear risk of bias when insufficient information was provided to permit judgment. All
disagreements were resolved by consensus.
DIETARY PULSES AND LIPIDS
Page 31 of 93
4.4.4 TREATMENT OF MISSING DATA
When non‐HDL‐C was not reported, they were calculated from aggregate data using the
formula: non‐HDL =TC‐HDL‐C. A formula was used to calculate SD for non‐HDL‐C:
; N denotes the total sample size; S denotes standard deviation; and as
a reliable covariance ( ) could not be estimated, it was assumed to be zero. Trials that did not
report either change‐from‐baseline differences within or between treatments, or end‐differences
between treatments had these calculated from the available study data using standard formulae97.
Authors were contacted, when possible, to request additional information (n= 3)20, 30, 90.
4.3.5 STATISTICAL ANALYSIS
Data were analyzed using Review Manager (RevMan) 5.0.25. Pooled analyses for isocaloric
dietary pulse feeding trials were conducted using the Generic Inverse Variance method using random
effects weighting. Mean endpoints of LDL‐C, Apo‐B and non‐HDL‐C were compared between dietary
pulse arms and comparator arms. Data were expressed as mean differences (MD) with 95% CI. To
mitigate the unit‐of‐analysis error from including trials with multiple intervention arms, we combined
arms to create single pair‐wise comparisons (n=1)94. To impute standard deviations for between‐
treatment differences in crossover trials, correlation coefficients between baseline and end‐of‐
treatment values within each individual trial were derived from the reported within and between
treatment SD according to a published formula101. These correlation coefficients were transformed into
z‐scores ± SD, meta‐analyzed using inverse‐variance weighing, and back transformed to derive a pooled
correlation coefficient. A pooled correlation of 0.72 was used for LDL‐C analysis but a correlation
coefficient of 0.5 was assumed for non‐HDL‐C, owing to a lack of data, with sensitivity analyses done at
0.25 and 0.75. A two‐sided p‐value <0.05 was set as the level of significance for comparisons of MD.
DIETARY PULSES AND LIPIDS
Page 32 of 93
The Q‐statistic (Chi2) assessed and I² quantified the inter‐study heterogeneity with significance
set at p<0.10. An I² ≥50% indicated “substantial” heterogeneity and ≥75% indicated “considerable”
heterogeneity97. Sources of heterogeneity were explored using a priori subgroup analyses according to
baseline cholesterol values, pulse dose and type, duration of follow‐up, the difference in fibre content
and saturated fat between the dietary pulses and control diet, study design (crossover or parallel), and
study quality (MQS). A priori subgroup analyses were not conducted for Apo‐B because only one study
was included. A post‐hoc analysis by sex (percentage of males) was also conducted. To determine if any
single trial exerted an undue influence on the overall results, a sensitivity analysis was undertaken in
which each individual study was removed from the meta‐analysis and the effect size was re‐calculated
with the remaining studies.
Possible publication bias was assessed by visual inspection of funnel plots, and formally tested
using Begg’s and Egger’s tests, with a P value <0.05 considered evidence of small‐study effects.
4.5 RESULTS
4.5.1 SEARCH RESULTS
Figure 1 shows the flow of literature. The search identified 3002 reports, 2940 of which were
determined to be irrelevant on review of the titles and abstracts. The remaining 62 reports were
reviewed in full. A total of 22 reports providing data for 26 randomized trials were identified8, 10, 19‐30, 85, 86,
90, 93, 94, 99, 102, 103.
4.5.2 STUDY CHARACTERISTICS
Table 2 shows the characteristics of the 26 randomized trials (n=1013). Eight trials (31%) were
conducted in hyperlipidemic participants, 3 trials (12%) in normolipidemic participants, and 15 trials
(58%) in a combination of both. Median age of participants was 50.2 years with approximately equal
number of men and women. Median baseline LDL‐C was 3.50 mmol/L and non‐HDL‐C was 4.34 mmol/L.
Studies had a median of 3 risk factors associated with increased CHD risk as defined by the Framingham
DIETARY PULSES AND LIPIDS
Page 33 of 93
risk equation, implicating a moderate CHD risk (i.e. 10‐year CHD risk ≤20%)4. Three trials were rated as
CHD risk equivalent as according to NCEP‐ATP III guidelines4 because they were conducted in individuals
with Type 2 Diabetes8, 29, 99. All trials explicitly excluded individuals on lipid‐lowering medications with
the exception of 3 trials where it was unclear. Participants were from 6 countries: 11 trials were from
the United States (42%), 6 trials from Australia (23%), 5 trials from Canada (19%), 2 trials from Spain
(8%), and one trial each from Ireland and Iran (4%). Dietary pulse type included: beans (14 trials [54%]),
peas (2 trials [8%]), chickpeas (2 trials [8%]), lentils (1 trial [4%]), and mixed pulses (8 trials [31%]).
Dietary pulses were administered as flour in 3 trials (12%), as whole foods in 18 trials (69%), and mixed
format (flour and/or whole foods) in 3 trials (12%) at a median dose of 130g/day (range: 50‐377g/d).
Two trials did not report the form in which dietary pulses were administered as. The background diet
consisted of 39‐65% energy (E) from carbohydrate, 10‐35% E protein, and 20‐41% E fat with a median
fibre and saturated fat intake of 20g/d (range: 13‐47g/d) and 11%E (range: 5‐15%E), respectively, in the
comparator diets, and 26g/d (range: 17‐53g/d) and 11%E (range: 5‐15%E), respectively, in the dietary‐
pulse enriched diets. The method of increasing dietary pulses while maintaining caloric balance between
arms differed across protocols: 15 trials (58%), replaced non‐dietary pulse carbohydrates (eg. bread
products, canned spaghetti, oat bran), specifically 7 trials replaced fibre, 5 trials (19%) replaced animal
protein, 3 trials (12%) emphasized dietary pulses to achieve a low‐glycemic diet, and 3 trials (12%) did
not specify. Three trials (12%) were weight loss interventions designed to reduce total caloric intake by
30 or 35%. Five trials (19%) were metabolically‐controlled (eg. all foods were provided), 17 trials (65%)
were partially metabolically controlled (eg. test foods were provided), and 4 trials (15%) were not
metabolically controlled (eg dietary advice was offered). Thirteen trials (50%) had a crossover design.
Twenty‐two trials (84%) were conducted in an outpatient setting, 2 trials (8%) in an inpatient setting,
and 2 trials (8%) in a combination of the two. Median follow‐up was 6 weeks (range: 3‐52 weeks).
DIETARY PULSES AND LIPIDS
Page 34 of 93
By the Heyland MQS, seven trials (27%) were of high quality (MQS ≥8). Poor description of
randomization, absence of double‐blinding, lack of intention‐to‐treat statistical analysis, and high
dropout rates contributed to lower scores (Table 3). The Cochrane Risk of Bias Tool showed that 17
(77%) reports had unclear risk of bias and 5 reports (23%) had low risk of bias for sequence generation.
Sixteen reports (73%) had unclear risk of bias and 6 reports (27%) had low risk of bias for allocation
concealment. Nine reports (41%) had unclear risk of bias, 12 reports (54%) had low risk of bias, and 1
report (4%) had high risk of bias for blinding. Twenty‐one reports (95%) were scored with low risk of bias
for incomplete outcome data. Twelve reports (54%) scored unclear risk of bias for selective outcome
reporting (Table 4). Funding of all trials was from: agency alone (50%); agency‐industry sources (27%);
industry alone (15%); and 2 trials were unclear of their funding sources.
4.5.3 GASTRO‐INTESTINAL SYMPTOMS
Eleven trials provided self‐reported gastrointestinal (GI) symptoms data. Four trials (36%)
reported participants with upset stomach, 7 trials (64%) with flatulence, 6 trials (54%) with bloating, 1
trial with diarrhea and constipation each (9%), and 3 trials (27%) with increased stool frequency. Two
trials compared GI symptoms to the comparator group but found no statistical differences across all
symptoms except for increased flatulence in the comparator for 1 trial28. Most studies reported that
symptoms tended to improve over the course of the dietary pulse treatment. Only 2 trials had 1 to 2
participants reporting GI symptoms as a reason for study withdrawal24, 28.
4.5.4 EFFECT ON LDL‐C
Twenty‐one reports involving 25 comparisons (n= 686 intervention, 684 control) provided data
on the effects of dietary pulses on LDL‐C (Figure 2). Diets emphasizing dietary pulses significantly
reduced LDL‐C compared to control diets (MD= ‐0.17 mmol/L [95% CI: ‐0.25, ‐0.09]; p<0.0001) but
showed significant evidence of inter‐study heterogeneity (I2= 80%; p≤0.00001). Sensitivity analyses in
DIETARY PULSES AND LIPIDS
Page 35 of 93
which each individual study was systematically removed and the effect size recalculated did not alter
conclusions.
A priori subgroup analyses were carried out to test for possible modification of the effect of
dietary pulses on LDL‐C by study design characteristics. None of the subgroup analyses showed
significant effects. In a post‐hoc analysis by sex, we found greater LDL‐C reduction as the ratio of males
to females increased (β= ‐0.0036 [95% CI: ‐0.006, ‐0.001]; p= 0.012) (Figure 3 and Table 5).
4.5.5 EFFECT ON NON‐HDL‐C
Twenty reports involving 22 comparisons (n= 605 intervention, 605 control) provided data on
the effects of dietary pulses on non‐HDL‐C (Figure 4). Diets emphasizing dietary pulses did not have a
significant effect on non‐HDL‐C (MD= ‐0.09 mmol/L [95% CI: ‐0.19, 0.00]; p=0.06) but showed significant
evidence of inter‐study heterogeneity (I2= 98%; p≤0.00001). Sensitivity analyses showed when Abete et
al.90 Anderson et al. (1984)19, Belski et al.20, Gravel et al. 24, Hermsdorff et al.25, or Marinangeli et al. was
removed, the pooled effect size became significant. The use of a correlation coefficient of 0.25 did not
alter conclusions but a correlation coefficient of 0.75 resulted in a significant reduction in non‐HDL‐C.
A priori subgroup analyses were carried out to determine if the effect of dietary pulses on non‐
HDL‐C differed according to study design characteristics. We found higher fibre intake in the dietary
pulse compared to the control arm showed a significantly greater non‐HDL reduction. None of the other
subgroup analyses showed significance (Figure 5 and Table 5). Post‐hoc analysis by sex also did not
shown significant (Table 5).
4.5.6 EFFECT ON APOLIPROTEINS B
One trial met the inclusion criteria for Apo‐B analysis. Isocaloric exchange of dietary pulses for
another diet did not significantly alter Apo‐B (MD= 0.02 [95% CI:‐0.04, 0.08]) (Figure 6).
DIETARY PULSES AND LIPIDS
Page 36 of 93
4.5.7 PUBLICATION BIAS
Inspection of funnel plots for evidence of publication bias revealed asymmetry favouring small
studies with LDL‐C reducing effects (Figure 7A). Egger’s test detected significant evidence of publication
bias in LDL‐C trials (p= 0.003) but Begg’s test did not show significant evidence of bias. Non‐HDL‐C
showed no significant evidence of publication bias by visual inspection of funnel plot, Egger’s and Begg’s
tests (Figure 7B).
4.6 DISCUSSION
We conducted a systematic review and meta‐analysis of 26 randomized, controlled trials of the
effect of dietary non‐oil‐seed pulses (beans, chickpeas, lentils and peas) on established therapeutic lipid
targets for cardiovascular risk reduction in 1013 predominantly middle‐age, normolipidemic or
hyperlipidemic adults at moderate CHD risk, most of whom were not taking lipid lowering medications.
Pooled analyses showed a significant LDL‐C‐lowering‐effect of 0.17 mmol/L with a median dose of
130g/d of dietary pulses (~1.5 servings per day) over a median follow‐up of 6‐weeks. There was no
significant effect of dietary pulses on Apo‐B and non‐HDL‐C. Although some studies reported increased
GI symptoms initially from the dietary pulse treatment, most reported that the effects subdued over the
course of the study.
4.6.1 RESULTS IN RELATION TO OTHER STUDIES
This is the first systematic review and meta‐analysis to report the effect of dietary pulse intake
on all established lipids and lipoprotein CHD risk factors including LDL‐C, Apo‐B, and non‐HDL‐C. The
observed LDL‐lowering effect of dietary pulses is consistent with that of 2 previous meta‐analyses13, 83;
however, our analysis was limited to randomized controlled trials with at least 3 weeks of follow‐up
duration in conformity with FDA guidelines92.
We found a non‐significant decreasing effect on non‐HDL‐C despite a significant reduction in
LDL‐C, suggesting a rise in VLDL‐C. This contradictory result may be explained by elevated triglyceride
DIETARY PULSES AND LIPIDS
Page 37 of 93
(TG) levels. Dyslipidemic guidelines suggest that when TG level is greater than 2.24 mmol/L
(~200mg/dL)4 or 1.50 mmol/L (~133mg/dL)3, LDL‐C and non‐HDL‐C no longer correlate well with each
other. We found 13 trials (52%) in our analysis reported higher TG levels (≥2.24 mmol/L) and in a post‐
hoc analysis, individuals with normal levels of TG had greater reductions in LDL‐C and non‐HDL‐C than
those with high levels of TG (data not shown). However, we were unable to conduct a correlation
analysis to examine the association of LDL‐C and non‐HDL‐C stratified by TG levels; future analyses
should consider this association.
The mechanism by which dietary pulses lower cholesterol levels is unclear; however there are
several hypotheses that have been generated to explain this benefit. Dietary pulses reduce serum
cholesterol by displacing saturated and trans fat intake. The 1999‐2002 NHANES study found that
Americans, who consumed approximately ½ cup dry beans or peas daily had lower intakes of saturated
and total fat82. While the effects of saturated and total fat on cardiovascular risk are conflicting, many
clinical trials have shown a beneficial effect when saturated fat is replaced with monounsaturated and
polyunsaturated fatty acid intake (MUFA and PUFA, respectively)84. Further, dietary pulses are high in
viscous fibre. Viscous fibre has been shown to trap bile acids in the intestine and prevent their
absorption85, 86, and human studies have demonstrated significant increases in fecal bile acid output
related to LDL‐C reduction104. Consequently, there is an increase in the production of bile acids by the
liver, which decreases the liver pool of cholesterol and increases uptake of LDL‐C by the liver thereby
decreasing circulating LDL‐C in the blood22. Further fermentation of fibre in the colon produces SCFA
such as propionate and butyrate, which have been associated with inhibition of cholesterol synthesis in
the liver19, 23. Possibly of greater importance is the presence of a 7S globulin fraction, common to dietary
pulses, which is consistent with this cholesterol reduction property18. It has been shown that peptides
digested from this fraction, which may be absorbed intact, have a markedly inhibiting effect on Apo‐B
synthesis, the lipoprotein which influences hepatic cholesterol secretion.
DIETARY PULSES AND LIPIDS
Page 38 of 93
4.6.2 INTER‐STUDY HETEROGENEITY
We reported significant evidence of inter‐heterogeneity in our LDL‐C analysis; however none of
our a priori subgroup analyses could explain the source of inter‐study heterogeneity. To further
investigate possible explanations, we conducted a post‐hoc subgroup analysis by sex, where we treated
the ratio of males to females from each study as a continuous variable. We found that studies
conducted in all males tended to show a greater difference in LDL‐C levels with dietary pulse intake
compared to control10, 19, 21, 22, 85, 90, than in the one study conducted in females only24. Possible reasons
why males may have shown a greater LDL‐C reduction was because: 1)males tend to have poorer dietary
patterns and respond more favourably to risk factors of CVD when dietary habits are healthier105;
2)males of similar age have higher levels of LDL‐C than pre‐menopausal and post‐menopausal women
on hormone replacement therapy (HRT) and therefore LDL‐C is more likely to be reduced in men4; 3)
compared to the total cholesterol fraction, males have higher LDL‐C whereas females have higher HDL‐
C; the former is more responsive to dietary changes than the latter4 and; 4)as there is only one all‐
female study included, there may not be enough female‐only studies for comparison. Although the
subgroup analysis by sex showed reduction of inter‐study heterogeneity, the level is still moderate and
future analyses are needed to better understand the sources of heterogeneity.
The effect of dietary pulses on LDL‐C should not be underestimated despite the high level of
inter‐study heterogeneity. The LDL‐C effect translated to a ~5% reduction from baseline. This reduction
in LDL‐C equates to ~5‐6% risk reduction in major vascular events (major coronary event, stroke, and
coronary revascularization)45. This is important especially in hypercholestrolemic patients who prefer
dietary approaches to managing cholesterol levels or for those who cannot tolerate statin therapies.
Further, the MDs of the majority of trials (23 of 25) fell within the 95% CI of the pooled estimate for LDL‐
C suggesting robustness in our data and increasing confidence in our conclusions. Therefore, while inter‐
DIETARY PULSES AND LIPIDS
Page 39 of 93
study heterogeneity was high in our pooled analysis of LDL‐C, the effect estimate may still have
meaningful clinical applications.
Our non‐HDL‐C findings were complicated by significant evidence of inter‐study heterogeneity.
In a previous systematic review and meta‐analysis on the effect of dietary pulses on glycemic control,
we reported significant effect modification by diabetes status, pulse type, dose, follow‐up duration,
study design, study quality, and baseline metabolic control87. In the current analysis, we only found a
significant reducing non‐HDL‐C effect when the dietary pulse arm had greater fibre intake than the
comparator. Diets high in fibre have been shown to reduce non‐HDL‐C106 and be inversely associated
with CHD risk15. However, a substantial amount of inter‐study heterogeneity remains unexplained. To
further address inter‐study heterogeneity, we conducted sensitivity analysis, where the removal of
Abete et al.90, Anderson et al. (1984)19, Belski et al.20, Gravel et al.24, Hermsdorff et al.25, or Marinangeli
et al.102 resulted in a significant non‐HDL‐C reduction. Each of these studies favoured the effect of the
control treatment, but there was no common characteristics common amongst them that would lead us
to believe that there is any bias in these analyses. Other sources of heterogeneity across trials need to
be investigated when more trials are published.
4.6.3 LIMITATIONS
There are limitations to our work. First, the majority of studies were of low quality (MQS<8),
short duration (<3 months), and did not report enough data to judge risk of bias. These observations
reinforce the need for longer, better‐designed clinical trials that report data more systematically and
transparently to better understand the effect of dietary pulses on serum lipids. Second, only one trial
reported on non‐HDL‐C values; therefore we had to calculate non‐HDL‐C and imputed its SD. To assess
whether our method of SD imputation was reasonable, we conducted a sensitivity analysis, where we
pooled reported SDs and substituted the calculated SD for trials that did not report these values. Our
findings for non‐HDL‐C indicate that the second method of SD imputation did not alter our primary
DIETARY PULSES AND LIPIDS
Page 40 of 93
conclusions, suggesting that our method of SD imputation is unlikely to have biased our conclusions.
Third, only one trial provided Apo‐B data. These deficiencies highlight the need for future trials to
examine these endpoints as they are important biomarkers of cardiovascular health. Lastly, publication
bias remains a possibility. We observed plot asymmetry favouring small studies with LDL‐C reducing
effects which was confirmed by a significant Egger’s test.
4.6.4 CONCLUSIONS
Our findings have implications for cardiovascular health. Dietary pulses resulted in a modest yet
clinically meaningful reduction in the primary therapeutic lipid risk factor, LDL‐C, showing a 0.17 mmol/L
reduction (equivalent to ~5% reduction from baseline). This is important especially when combined as
part of diets that have shown clinically impactful lipid‐lowering that can potentially achieve upwards of
30% reductions in LDL‐C53 and may be particularly helpful for those who prefer dietary approaches to
managing cholesterol levels or for those who cannot tolerate statin therapies. The median pulse intake
of ≈1.5 servings/day required to achieve this benefit supports a higher intake target than that proposed
by the AHA of ≥4‐5 servings/week. Achieving a high level of intake may prove a challenge in some
Western countries, given that current U.S. level of intake is 0.2 serving/day. However, a dietary pulse
intake of 130g/d is very reasonable as this level is currently consumed by many cultures without reports
of side effects that would limit consumption. As the majority of these trials were conducted on a
background heart‐healthy NCEP‐like diet, including >20‐25g/d of fibre and <10%E of saturated fat, these
results can be considered in addition to the 5‐10% LDL‐C lowering expected from these diets alone53.
Whereas guidelines have largely focused on dietary pulses as part of a healthy dietary pattern in the
prevention and management of diabetes and CVD, these data support lipid‐lowering and cardiovascular
risk reduction recommendations. As dietary pulses may have beneficial effects on other cardiometabolic
risk factors including body weight, blood pressure, and glucose control87, future systematic reviews and
DIETARY PULSES AND LIPIDS
Page 41 of 93
meta‐analyses should evaluate the effects of dietary pulses on these endpoints and others to address
these factors that contribute to cardiovascular risk.
4.7 ACKNOWLEDGMENTS
We would like to thank Xavier Thobaut Gusmini and Júlio Medeiros Rego for their technical
support.
Aspects of this work was presented at the 2012 Experimental Biology Conference, San Diego, CA,
USA, April 21‐25 2012, 15th Annual Canadian Society for Endocrinology and Metabolism/Canadian
Diabetes Association (CSEM/CDA) Professional Conference and Annual Meetings, Toronto, ON, Canada,
October 10‐13 2012., and 53rd Annual Conference at the American College of Nutrition, Morristown, NJ,
USA, November 14‐17 2012.
4.8 SOURCE OF FUNDING
This work was funded by a Canadian Institutes of Health Research (CIHR) Knowledge Synthesis
Grant (Funding Reference Number: 119797). VH was supported by an Ontario Graduate Scholar (OGS)
award. RJD was funded by a Canadian Institutes for Health Research (CIHR) Postdoctoral Fellowship
Award. DJAJ was funded by the Government of Canada through the Canada Research Chair Endowment.
The funders had no role in study design, data collection and analysis, decision to publish, or preparation
of the manuscript.
4.9 CONFLICTS OF INTEREST/DISCLOSURE
JLS has received several unrestricted travel grants from The Coca‐Cola Company to present
research at meetings and is a co‐investigator on an unrestricted research grant from The Coca‐Cola
Company. JLS has also received travel funding and honoraria from Abbott Laboratories, Archer Daniels
Midland, and the International Life Sciences Institute (ILSI) North America and Brazil; and research
support, consultant fees, and travel funding from Pulse Canada. Spouse of JLS works for Unilever
DIETARY PULSES AND LIPIDS
Page 42 of 93
Canada. RJD, JB, and CWCK are co‐investigators on an unrestricted grant from The Coca‐Cola Company.
VV holds American (No. 7,326,404 B2) and Canadian (No. 2,410,556) patents for the use of viscous fibre
blend in diabetes, metabolic syndrome and cholesterol lowering. VV currently holds grant support for
ginseng research from the Canadian Diabetes Association, Canada and the National Institute of
Horticultural & Herbal Science, RDA, Korea. CWCK has served on the scientific advisory board, received
research support, travel funding, consultant fees, or honoraria from Pulse Canada, Barilla, Solae,
Unilever, Hain Celestial, Loblaws Inc., Oldways Preservation Trust, the Almond Board of California, the
International Nut Council, Paramount Farms, the California Strawberry Commission, the Canola and Flax
Councils of Canada, and Saskatchewan Pulse Growers. CWCK also receives partial salary funding from
research grants provided by Unilever, Loblaw’s, and the Almond Board of California. DJAJ has served on
the Scientific Advisory Board of Sanitarium Company, Agri‐Culture and Agri‐Food Canada (AAFC),
Canadian Agriculture Policy Institute (CAPI), California Strawberry Commission, Loblaw Supermarket,
Herbal Life International, Nutritional Fundamental for Health, Pacific Health Laboratories, Metagenics,
Bayer Consumer Care, Orafti, Dean Foods, Kellogg’s, Quaker Oats, Procter & Gamble, Coca‐Cola, NuVal
Griffin Hospital, Abbott, Pulse Canada, Saskatchewan Pulse Growers, and Canola Council of Canada;
received honoraria for scientific advice from Sanitarium Company, Orafti, the Almond Board of
California, the American Peanut Council, International Tree Nut Council Nutrition Research and
Education Foundation and the Peanut Institute, Herbal Life International, Pacific Health Laboratories,
Nutritional Fundamental for Health, Barilla, Metagenics, Bayer Consumer Care, Unilever Canada and
Netherlands, Solae, Oldways, Kellogg’s, Quaker Oats, Procter & Gamble, Coca‐Cola, NuVal Griffin
Hospital, Abbott, Canola Council of Canada, Dean Foods, California Strawberry Commission, Haine
Celestial, Pepsi, and Alpro Foundation; has been on the speakers panel for the Almond Board of
California; received research grants from Saskatchewan Pulse Growers, the Agricultural Bioproducts
Innovation Program (ABIP) through the Pulse Research Network (PURENet), Advanced Food Materials
DIETARY PULSES AND LIPIDS
Page 43 of 93
Network (AFMNet), Loblaw, Unilever, Barilla, Almond Board of California, Coca‐Cola, Solae, Haine
Celestial, Sanitarium Company, Orafti, International Tree Nut Council Nutrition Research and Education
Foundation and the Peanut Institute, the Canola and Flax Councils of Canada, Calorie Control Council,
Canadian Institutes of Health Research, Canada Foundation for Innovation, and the Ontario Research
Fund; and received travel support to meetings from the Solae, Sanitarium Company, Orafti, AFMNet,
Coca‐Cola, The Canola and Flax Councils of Canada, Oldways Preservation Trust, Kellogg’s, Quaker Oats,
Griffin Hospital, Abbott Laboratories, Dean Foods, the California Strawberry Commission, American
Peanut Council, Herbal Life International, Nutritional Fundamental for Health, Metagenics, Bayer
Consumer Care, AAFC, CAPI, Pepsi, Almond Board of California, Unilever, Alpro Foundation,
International Tree Nut Council, Barilla, Pulse Canada, and the Saskatchewan Pulse Growers. Dr Jenkins'
wife is a director, VV is the vice‐president and part owner, and LC is a clinical study coordinator of
Glycemic Index Laboratories, Toronto, Ontario, Canada. VH, VHJ, AA, SBM, MD, FMS, AMB, PKE, RPB,
RGJ, and LAL have no declared conflicts of interest related to this paper.
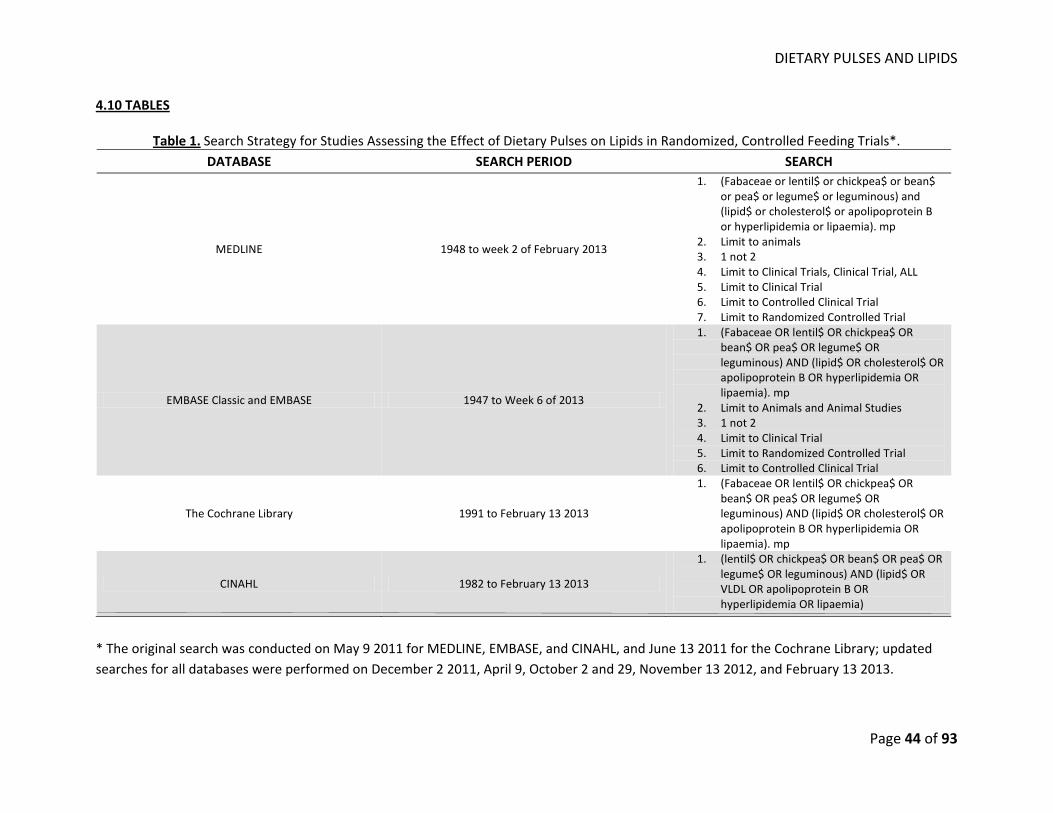
DIETARY PULSES AND LIPIDS
Page 44 of 93
4.10 TABLES
Table 1. Search Strategy for Studies Assessing the Effect of Dietary Pulses on Lipids in Randomized, Controlled Feeding Trials*. DATABASE SEARCH PERIOD SEARCH
MEDLINE 1948 to week 2 of February 2013
1. (Fabaceae or lentil$ or chickpea$ or bean$ or pea$ or legume$ or leguminous) and (lipid$ or cholesterol$ or apolipoprotein B or hyperlipidemia or lipaemia). mp
2. Limit to animals 3. 1 not 2 4. Limit to Clinical Trials, Clinical Trial, ALL 5. Limit to Clinical Trial 6. Limit to Controlled Clinical Trial 7. Limit to Randomized Controlled Trial
EMBASE Classic and EMBASE 1947 to Week 6 of 2013
1. (Fabaceae OR lentil$ OR chickpea$ OR bean$ OR pea$ OR legume$ OR leguminous) AND (lipid$ OR cholesterol$ OR apolipoprotein B OR hyperlipidemia OR lipaemia). mp
2. Limit to Animals and Animal Studies 3. 1 not 2 4. Limit to Clinical Trial 5. Limit to Randomized Controlled Trial 6. Limit to Controlled Clinical Trial
The Cochrane Library 1991 to February 13 2013
1. (Fabaceae OR lentil$ OR chickpea$ OR bean$ OR pea$ OR legume$ OR leguminous) AND (lipid$ OR cholesterol$ OR apolipoprotein B OR hyperlipidemia OR lipaemia). mp
CINAHL 1982 to February 13 2013
1. (lentil$ OR chickpea$ OR bean$ OR pea$ OR legume$ OR leguminous) AND (lipid$ OR VLDL OR apolipoprotein B OR hyperlipidemia OR lipaemia)
* The original search was conducted on May 9 2011 for MEDLINE, EMBASE, and CINAHL, and June 13 2011 for the Cochrane Library; updated searches for all databases were performed on December 2 2011, April 9, October 2 and 29, November 13 2012, and February 13 2013.
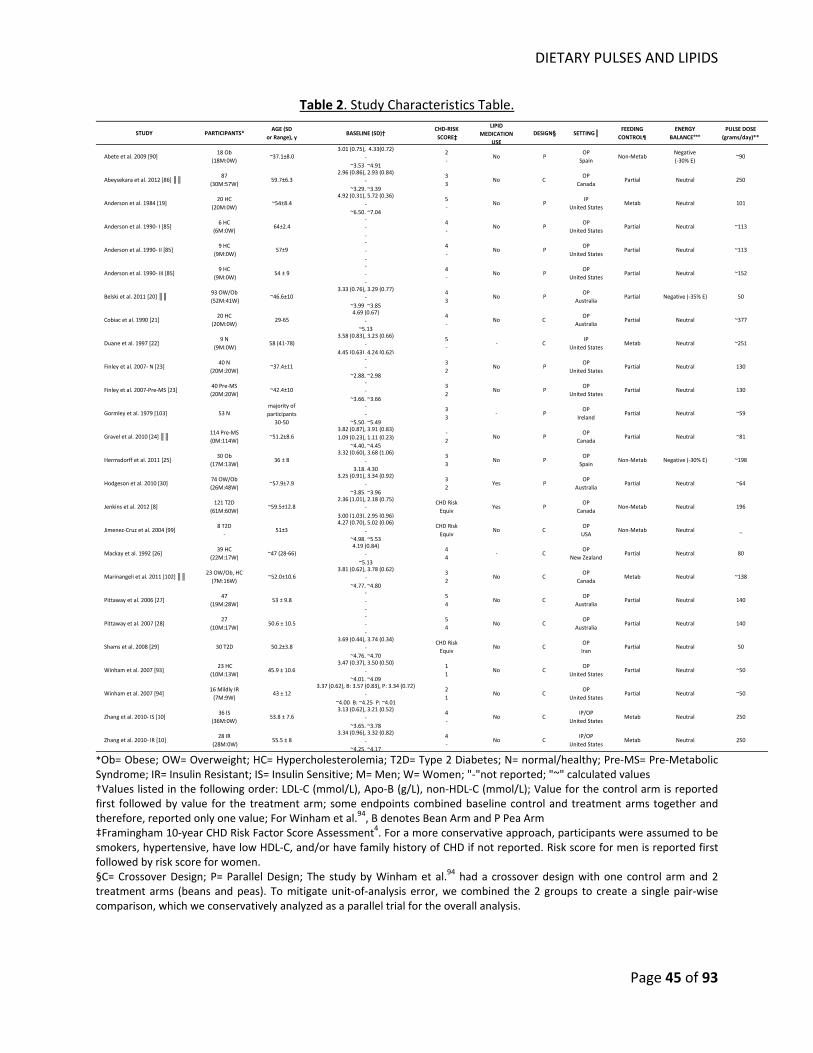
DIETARY PULSES AND LIPIDS
Page 45 of 93
Table 2. Study Characteristics Table.
STUDY PARTICIPANTS*AGE (SD
or Range), yBASELINE (SD)† CHD‐RISK
SCORE‡
LIPIDMEDICATION
USEDESIGN§ SETTING║ FEEDING
CONTROL¶ENERGY
BALANCE***PULSE DOSE
(grams/day)**
Abete et al. 2009 [90]18 Ob
(18M:0W)~37.1±8.0
3.01 (0.75), 4.33(0.72)‐
~3.53, ~4.91
2‐
No POP
SpainNon‐Metab
Negative (‐30% E)
~90
Abeysekara et al. 2012 [86] ║║ 87(30M:57W)
59.7±6.32.96 (0.86), 2.93 (0.84)
‐~3.29, ~3.39
33
No C OP
CanadaPartial Neutral 250
Anderson et al. 1984 [19]20 HC
(20M:0W)~54±8.4
4.92 (0.31), 5.72 (0.36) ‐
~6.50, ~7.04
5‐
No PIP
United StatesMetab Neutral 101
Anderson et al. 1990‐ I [85]6 HC
(6M:0W)64±2.4
‐‐‐
4‐
No POP
United StatesPartial Neutral ~113
Anderson et al. 1990‐ II [85]9 HC
(9M:0W)57±9
‐‐‐
4‐
No POP
United StatesPartial Neutral ~113
Anderson et al. 1990‐ III [85]9 HC
(9M:0W)54 ± 9
‐‐‐
4‐
No POP
United StatesPartial Neutral ~152
Belski et al. 2011 [20] ║║ 93 OW/Ob (52M:41W)
~46.6±103.33 (0.76), 3.29 (0.77)
‐~3.99, ~3.85
43
No POP
AustraliaPartial Negative (‐35% E) 50
Cobiac et al. 1990 [21]20 HC
(20M:0W)29‐65
4.69 (0.67)‐
~5.13
4‐
No C OP
AustraliaPartial Neutral ~377
Duane et al. 1997 [22] 9 N
(9M:0W)58 (41‐78)
3.58 (0.83), 3.23 (0.66)‐
4.45 (0.63), 4.24 (0.62)
5‐
‐ C IP
United StatesMetab Neutral ~251
Finley et al. 2007‐ N [23]40 N
(20M:20W)~37.4±11
‐‐
~2.88, ~2.98
32
No POP
United StatesPartial Neutral 130
Finley et al. 2007‐Pre‐MS [23]40 Pre‐MS(20M:20W)
~42.4±10‐‐
~3.66, ~3.66
32
No POP
United StatesPartial Neutral 130
Gormley et al. 1979 [103] 53 Nmajority of participants
30‐50
‐‐
~5.50, ~5.49
33
‐ POP
IrelandPartial Neutral ~59
Gravel et al. 2010 [24] ║║ 114 Pre‐MS(0M:114W)
~51.2±8.63.82 (0.87), 3.91 (0.83)1.09 (0.23), 1.11 (0.23)
~4.40, ~4.45
‐2
No POP
CanadaPartial Neutral ~81
Hermsdorff et al. 2011 [25]30 Ob
(17M:13W)36 ± 8
3.32 (0.60), 3.68 (1.06)‐
3.18, 4.30
33
No POP
SpainNon‐Metab Negative (‐30% E) ~198
Hodgeson et al. 2010 [30]74 OW/Ob(26M:48W)
~57.9±7.93.25 (0.91), 3.34 (0.92)
‐~3.85, ~3.96
32
Yes POP
AustraliaPartial Neutral ~64
Jenkins et al. 2012 [8]121 T2D
(61M:60W)~59.5±12.8
2.36 (1.01), 2.18 (0.75)‐
3.00 (1.03), 2.95 (0.96)
CHD RiskEquiv
Yes POP
CanadaNon‐Metab Neutral 196
Jimenez‐Cruz et al. 2004 [99]8 T2D
‐51±3
4.27 (0.70), 5.02 (0.06)‐
~4.98, ~5.53
CHD RiskEquiv
No C OPUSA
Non‐Metab Neutral _
Mackay et al. 1992 [26]39 HC
(22M:17W)~47 (28‐66)
4.19 (0.84)‐
~5.13
44
‐ C OP
New ZealandPartial Neutral 80
Marinangeli et al. 2011 [102] ║║ 23 OW/Ob, HC (7M:16W)
~52.0±10.63.81 (0.62), 3.78 (0.62)
‐~4.77, ~4.80
32
No C OP
CanadaMetab Neutral ~138
Pittaway et al. 2006 [27]47
(19M:28W)53 ± 9.8
‐‐‐
54
No C OP
AustraliaPartial Neutral 140
Pittaway et al. 2007 [28]27
(10M:17W)50.6 ± 10.5
‐‐‐
54
No C OP
AustraliaPartial Neutral 140
Shams et al. 2008 [29] 30 T2D 50.2±3.83.69 (0.44), 3.74 (0.34)
‐~4.76, ~4.70
CHD RiskEquiv
No C OPIran
Partial Neutral 50
Winham et al. 2007 [93] 23 HC
(10M:13W)45.9 ± 10.6
3.47 (0.37), 3.50 (0.50)‐
~4.01, ~4.09
11
No C OP
United StatesPartial Neutral ~50
Winham et al. 2007 [94]16 Mildly IR(7M:9W)
43 ± 123.37 (0.62), B: 3.57 (0.83), P: 3.34 (0.72)
‐~4.00, B: ~4.25, P: ~4.01
21
No C OP
United StatesPartial Neutral ~50
Zhang et al. 2010‐ IS [10]36 IS
(36M:0W)53.8 ± 7.6
3.13 (0.62), 3.21 (0.52)‐
~3.65, ~3.78
4‐
No C IP/OP
United StatesMetab Neutral 250
Zhang et al. 2010‐ IR [10]28 IR
(28M:0W)55.5 ± 8
3.34 (0.96), 3.32 (0.82)‐
~4.25, ~4.17
4‐
No C IP/OP
United StatesMetab Neutral 250
*Ob= Obese; OW= Overweight; HC= Hypercholesterolemia; T2D= Type 2 Diabetes; N= normal/healthy; Pre‐MS= Pre‐Metabolic Syndrome; IR= Insulin Resistant; IS= Insulin Sensitive; M= Men; W= Women; "‐"not reported; "~" calculated values †Values listed in the following order: LDL‐C (mmol/L), Apo‐B (g/L), non‐HDL‐C (mmol/L); Value for the control arm is reported first followed by value for the treatment arm; some endpoints combined baseline control and treatment arms together and therefore, reported only one value; For Winham et al.94, B denotes Bean Arm and P Pea Arm ‡Framingham 10‐year CHD Risk Factor Score Assessment4. For a more conservative approach, participants were assumed to be smokers, hypertensive, have low HDL‐C, and/or have family history of CHD if not reported. Risk score for men is reported first followed by risk score for women. §C= Crossover Design; P= Parallel Design; The study by Winham et al.94 had a crossover design with one control arm and 2 treatment arms (beans and peas). To mitigate unit‐of‐analysis error, we combined the 2 groups to create a single pair‐wise comparison, which we conservatively analyzed as a parallel trial for the overall analysis.
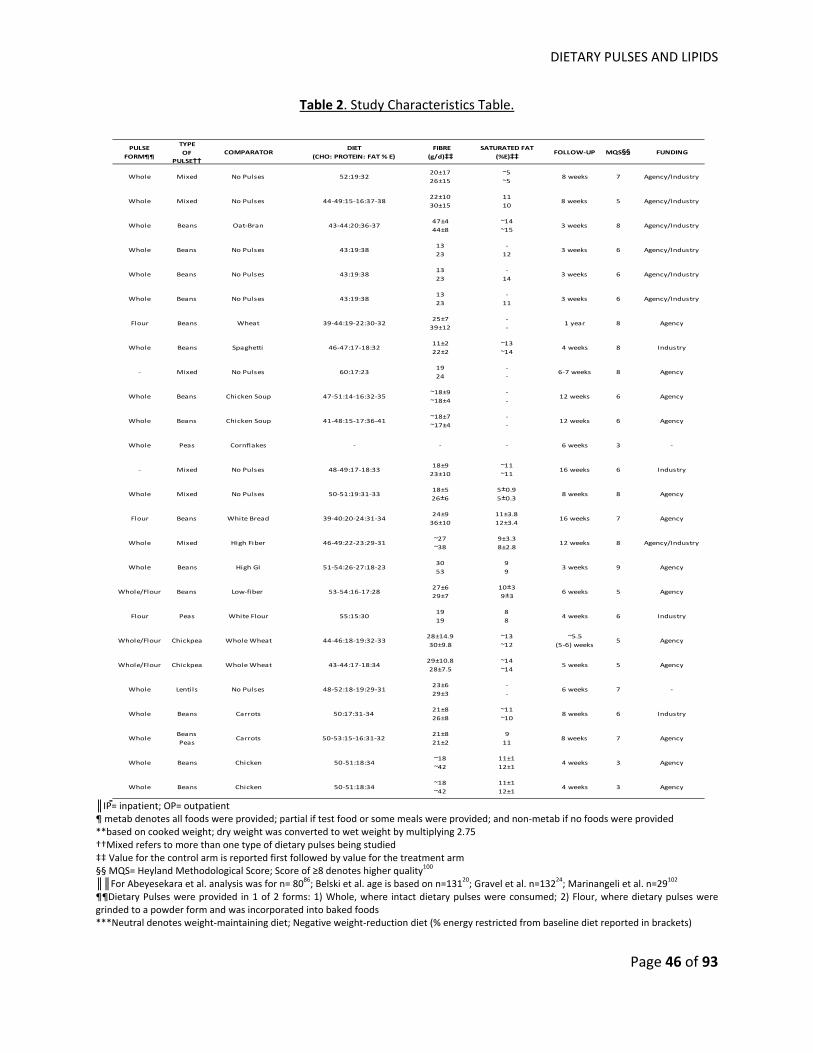
DIETARY PULSES AND LIPIDS
Page 46 of 93
Table 2. Study Characteristics Table.
PULSE FORM¶¶
TYPE OF
PULSE††COMPARATOR
DIET (CHO: PROTEIN: FAT % E)
FIBRE (g/d)‡‡
SATURATED FAT(%E)‡‡ FOLLOW‐UP MQS§§ FUNDING
Whole Mixed No Pulses 52:19:3220±1726±15
~5~5
8 weeks 7 Agency/Industry
Whole Mixed No Pulses 44‐49:15‐16:37‐3822±1030±15
1110
8 weeks 5 Agency/Industry
Whole Beans Oat‐Bran 43‐44:20:36‐3747±444±8
~14~15
3 weeks 8 Agency/Industry
Whole Beans No Pulses 43:19:381323
‐12
3 weeks 6 Agency/Industry
Whole Beans No Pulses 43:19:381323
‐14
3 weeks 6 Agency/Industry
Whole Beans No Pulses 43:19:381323
‐11
3 weeks 6 Agency/Industry
Flour Beans Wheat 39‐44:19‐22:30‐3225±739±12
‐‐
1 year 8 Agency
Whole Beans Spaghetti 46‐47:17‐18:3211±222±2
~13~14
4 weeks 8 Industry
‐ Mixed No Pulses 60:17:231924
‐‐
6‐7 weeks 8 Agency
Whole Beans Chicken Soup 47‐51:14‐16:32‐35~18±9~18±4
‐‐
12 weeks 6 Agency
Whole Beans Chicken Soup 41‐48:15‐17:36‐41~18±7~17±4
‐‐
12 weeks 6 Agency
Whole Peas Cornflakes ‐ ‐ ‐ 6 weeks 3 ‐
‐ Mixed No Pulses 48‐49:17‐18:3318±923±10
~11~11
16 weeks 6 Industry
Whole Mixed No Pulses 50‐51:19:31‐3318±5 26±6
5±0.95±0.3
8 weeks 8 Agency
Flour Beans White Bread 39‐40:20‐24:31‐3424±936±10
11±3.812±3.4
16 weeks 7 Agency
Whole Mixed High Fiber 46‐49:22‐23:29‐31~27~38
9±3.38±2.8
12 weeks 8 Agency/Industry
Whole Beans High GI 51‐54:26‐27:18‐233053
99
3 weeks 9 Agency
Whole/Flour Beans Low‐fiber 53‐54:16‐17:2827±629±7
10±39±3
6 weeks 5 Agency
Flour Peas White Flour 55:15:301919
88
4 weeks 6 Industry
Whole/Flour Chickpea Whole Wheat 44‐46:18‐19:32‐3328±14.930±9.8
~13~12
~5.5 (5‐6) weeks
5 Agency
Whole/Flour Chickpea Whole Wheat 43‐44:17‐18:3429±10.828±7.5
~14~14
5 weeks 5 Agency
Whole Lentils No Pulses 48‐52:18‐19:29‐3123±629±3
‐‐
6 weeks 7 ‐
Whole Beans Carrots 50:17:31‐3421±826±8
~11~10
8 weeks 6 Industry
WholeBeansPeas
Carrots 50‐53:15‐16:31‐3221±821±2
911
8 weeks 7 Agency
Whole Beans Chicken 50‐51:18:34~18~42
11±112±1
4 weeks 3 Agency
Whole Beans Chicken 50‐51:18:34~18~42
11±112±1
4 weeks 3 Agency
║IP= inpatient; OP= outpatient ¶ metab denotes all foods were provided; partial if test food or some meals were provided; and non‐metab if no foods were provided **based on cooked weight; dry weight was converted to wet weight by multiplying 2.75 ††Mixed refers to more than one type of dietary pulses being studied ‡‡ Value for the control arm is reported first followed by value for the treatment arm §§ MQS= Heyland Methodological Score; Score of ≥8 denotes higher quality100 ║║For Abeyesekara et al. analysis was for n= 8086; Belski et al. age is based on n=13120; Gravel et al. n=13224; Marinangeli et al. n=29102 ¶¶Dietary Pulses were provided in 1 of 2 forms: 1) Whole, where intact dietary pulses were consumed; 2) Flour, where dietary pulses were grinded to a powder form and was incorporated into baked foods ***Neutral denotes weight‐maintaining diet; Negative weight‐reduction diet (% energy restricted from baseline diet reported in brackets)
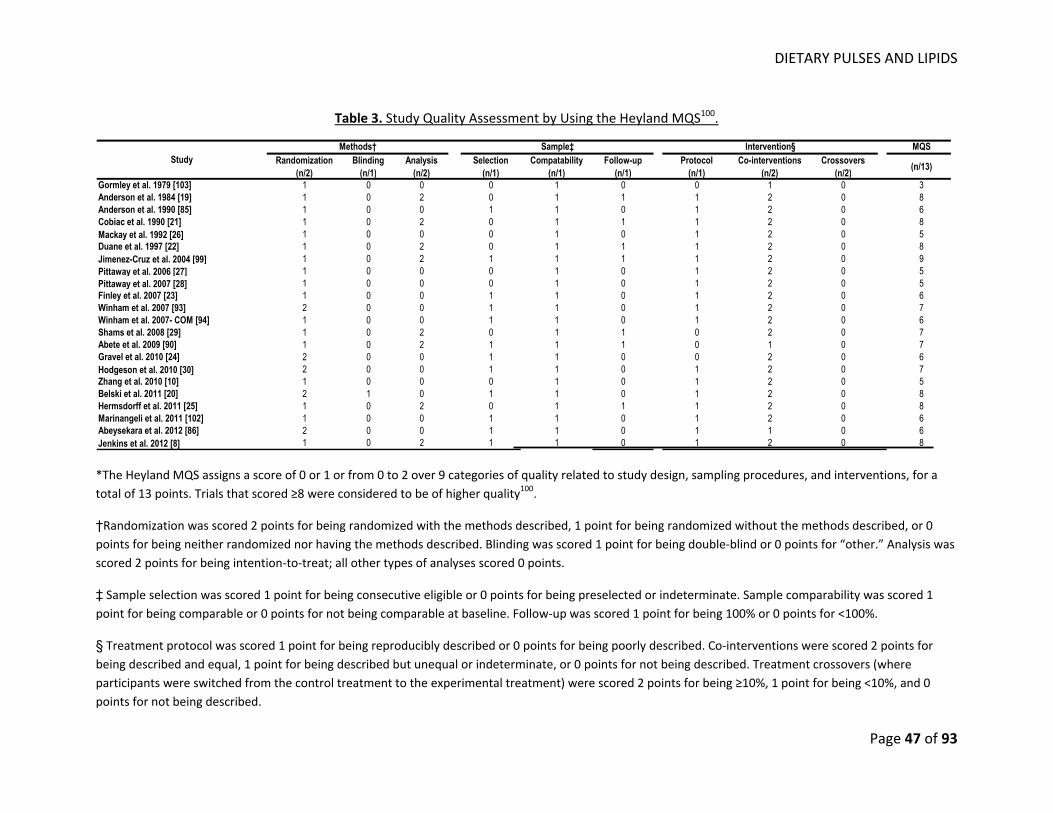
DIETARY PULSES AND LIPIDS
Page 47 of 93
Table 3. Study Quality Assessment by Using the Heyland MQS100.
MQSRandomization
(n/2)Blinding
(n/1)Analysis
(n/2)Selection
(n/1)Compatability
(n/1)Follow-up
(n/1)Protocol
(n/1)Co-interventions
(n/2)Crossovers
(n/2) (n/13)
Gormley et al. 1979 [103] 1 0 0 0 1 0 0 1 0 3Anderson et al. 1984 [19] 1 0 2 0 1 1 1 2 0 8Anderson et al. 1990 [85] 1 0 0 1 1 0 1 2 0 6Cobiac et al. 1990 [21] 1 0 2 0 1 1 1 2 0 8Mackay et al. 1992 [26] 1 0 0 0 1 0 1 2 0 5Duane et al. 1997 [22] 1 0 2 0 1 1 1 2 0 8Jimenez-Cruz et al. 2004 [99] 1 0 2 1 1 1 1 2 0 9Pittaway et al. 2006 [27] 1 0 0 0 1 0 1 2 0 5Pittaway et al. 2007 [28] 1 0 0 0 1 0 1 2 0 5Finley et al. 2007 [23] 1 0 0 1 1 0 1 2 0 6Winham et al. 2007 [93] 2 0 0 1 1 0 1 2 0 7Winham et al. 2007- COM [94] 1 0 0 1 1 0 1 2 0 6Shams et al. 2008 [29] 1 0 2 0 1 1 0 2 0 7Abete et al. 2009 [90] 1 0 2 1 1 1 0 1 0 7Gravel et al. 2010 [24] 2 0 0 1 1 0 0 2 0 6Hodgeson et al. 2010 [30] 2 0 0 1 1 0 1 2 0 7Zhang et al. 2010 [10] 1 0 0 0 1 0 1 2 0 5Belski et al. 2011 [20] 2 1 0 1 1 0 1 2 0 8Hermsdorff et al. 2011 [25] 1 0 2 0 1 1 1 2 0 8Marinangeli et al. 2011 [102] 1 0 0 1 1 0 1 2 0 6Abeysekara et al. 2012 [86] 2 0 0 1 1 0 1 1 0 6Jenkins et al. 2012 [8] 1 0 2 1 1 0 1 2 0 8
StudyMethods† Sample‡ Intervention§
*The Heyland MQS assigns a score of 0 or 1 or from 0 to 2 over 9 categories of quality related to study design, sampling procedures, and interventions, for a total of 13 points. Trials that scored ≥8 were considered to be of higher quality100.
†Randomization was scored 2 points for being randomized with the methods described, 1 point for being randomized without the methods described, or 0 points for being neither randomized nor having the methods described. Blinding was scored 1 point for being double‐blind or 0 points for “other.” Analysis was scored 2 points for being intention‐to‐treat; all other types of analyses scored 0 points.
‡ Sample selection was scored 1 point for being consecutive eligible or 0 points for being preselected or indeterminate. Sample comparability was scored 1 point for being comparable or 0 points for not being comparable at baseline. Follow‐up was scored 1 point for being 100% or 0 points for <100%.
§ Treatment protocol was scored 1 point for being reproducibly described or 0 points for being poorly described. Co‐interventions were scored 2 points for being described and equal, 1 point for being described but unequal or indeterminate, or 0 points for not being described. Treatment crossovers (where participants were switched from the control treatment to the experimental treatment) were scored 2 points for being ≥10%, 1 point for being <10%, and 0 points for not being described.
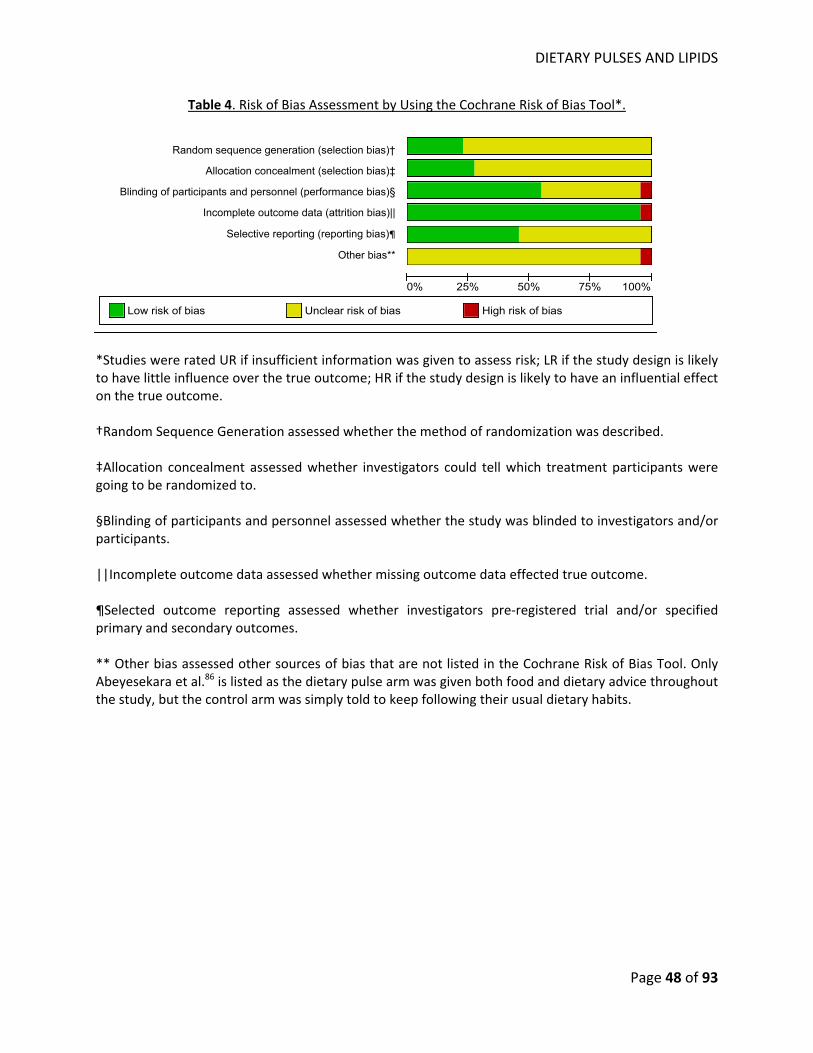
DIETARY PULSES AND LIPIDS
Page 48 of 93
Table 4. Risk of Bias Assessment by Using the Cochrane Risk of Bias Tool*.
Random sequence generation (selection bias)
Allocation concealment (selection bias)
Blinding of participants and personnel (performance bias)
Incomplete outcome data (attrition bias)
Selective reporting (reporting bias)
Other bias
0% 25% 50% 75% 100%
Low risk of bias Unclear risk of bias High risk of bias
*Studies were rated UR if insufficient information was given to assess risk; LR if the study design is likely to have little influence over the true outcome; HR if the study design is likely to have an influential effect on the true outcome. †Random Sequence Generation assessed whether the method of randomization was described. ‡Allocation concealment assessed whether investigators could tell which treatment participants were going to be randomized to. §Blinding of participants and personnel assessed whether the study was blinded to investigators and/or participants. ||Incomplete outcome data assessed whether missing outcome data effected true outcome. ¶Selected outcome reporting assessed whether investigators pre‐registered trial and/or specified primary and secondary outcomes. ** Other bias assessed other sources of bias that are not listed in the Cochrane Risk of Bias Tool. Only Abeyesekara et al.86 is listed as the dietary pulse arm was given both food and dietary advice throughout the study, but the control arm was simply told to keep following their usual dietary habits.
†
‡
§
¶
Random sequence generation (selection bias)†
Allocation concealment (selection bias)‡
Blinding of participants and personnel (performance bias)§
Incomplete outcome data (attrition bias)||
Selective reporting (reporting bias)¶
Other bias**
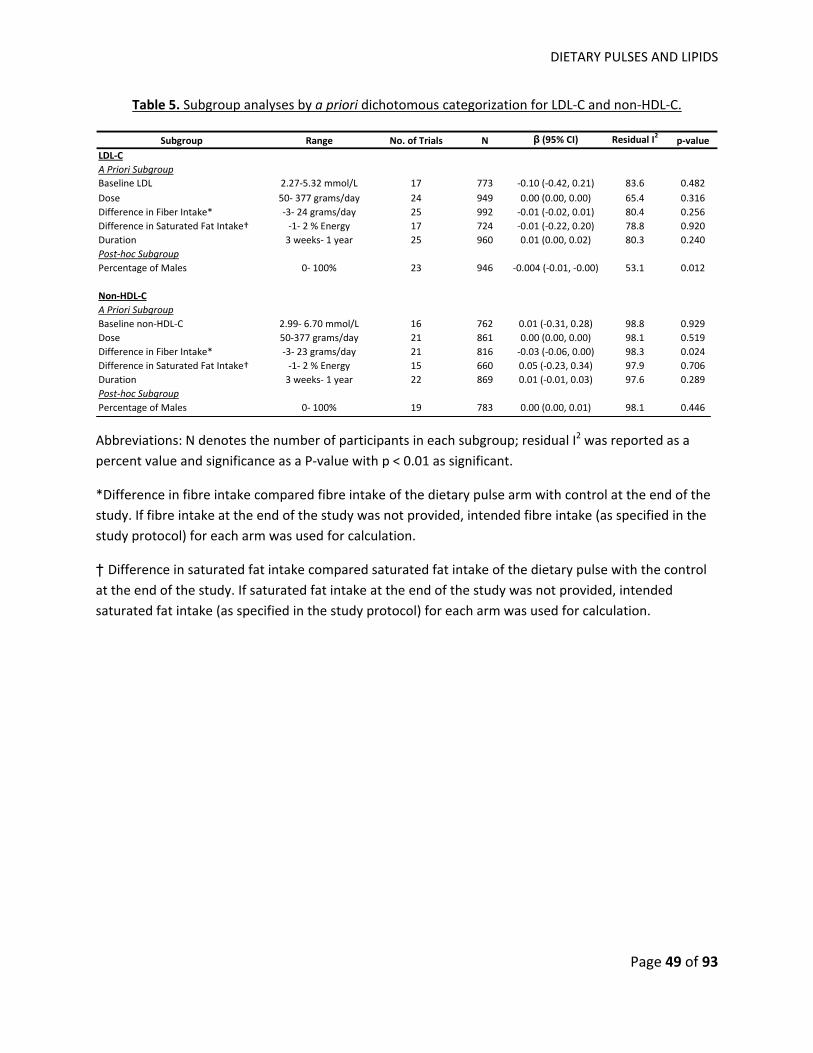
DIETARY PULSES AND LIPIDS
Page 49 of 93
Table 5. Subgroup analyses by a priori dichotomous categorization for LDL‐C and non‐HDL‐C.
Subgroup Range No. of Trials N β (95% CI) Residual I2 p‐valueLDL‐CA Priori SubgroupBaseline LDL 2.27‐5.32 mmol/L 17 773 ‐0.10 (‐0.42, 0.21) 83.6 0.482Dose 50‐ 377 grams/day 24 949 0.00 (0.00, 0.00) 65.4 0.316Difference in Fiber Intake* ‐3‐ 24 grams/day 25 992 ‐0.01 (‐0.02, 0.01) 80.4 0.256Difference in Saturated Fat Intake† ‐1‐ 2 % Energy 17 724 ‐0.01 (‐0.22, 0.20) 78.8 0.920Duration 3 weeks‐ 1 year 25 960 0.01 (0.00, 0.02) 80.3 0.240Post‐hoc SubgroupPercentage of Males 0‐ 100% 23 946 ‐0.004 (‐0.01, ‐0.00) 53.1 0.012
Non‐HDL‐CA Priori SubgroupBaseline non‐HDL‐C 2.99‐ 6.70 mmol/L 16 762 0.01 (‐0.31, 0.28) 98.8 0.929Dose 50‐377 grams/day 21 861 0.00 (0.00, 0.00) 98.1 0.519Difference in Fiber Intake* ‐3‐ 23 grams/day 21 816 ‐0.03 (‐0.06, 0.00) 98.3 0.024Difference in Saturated Fat Intake† ‐1‐ 2 % Energy 15 660 0.05 (‐0.23, 0.34) 97.9 0.706Duration 3 weeks‐ 1 year 22 869 0.01 (‐0.01, 0.03) 97.6 0.289Post‐hoc SubgroupPercentage of Males 0‐ 100% 19 783 0.00 (0.00, 0.01) 98.1 0.446
Abbreviations: N denotes the number of participants in each subgroup; residual I2 was reported as a percent value and significance as a P‐value with p < 0.01 as significant.
*Difference in fibre intake compared fibre intake of the dietary pulse arm with control at the end of the study. If fibre intake at the end of the study was not provided, intended fibre intake (as specified in the study protocol) for each arm was used for calculation.
† Difference in saturated fat intake compared saturated fat intake of the dietary pulse with the control at the end of the study. If saturated fat intake at the end of the study was not provided, intended saturated fat intake (as specified in the study protocol) for each arm was used for calculation.
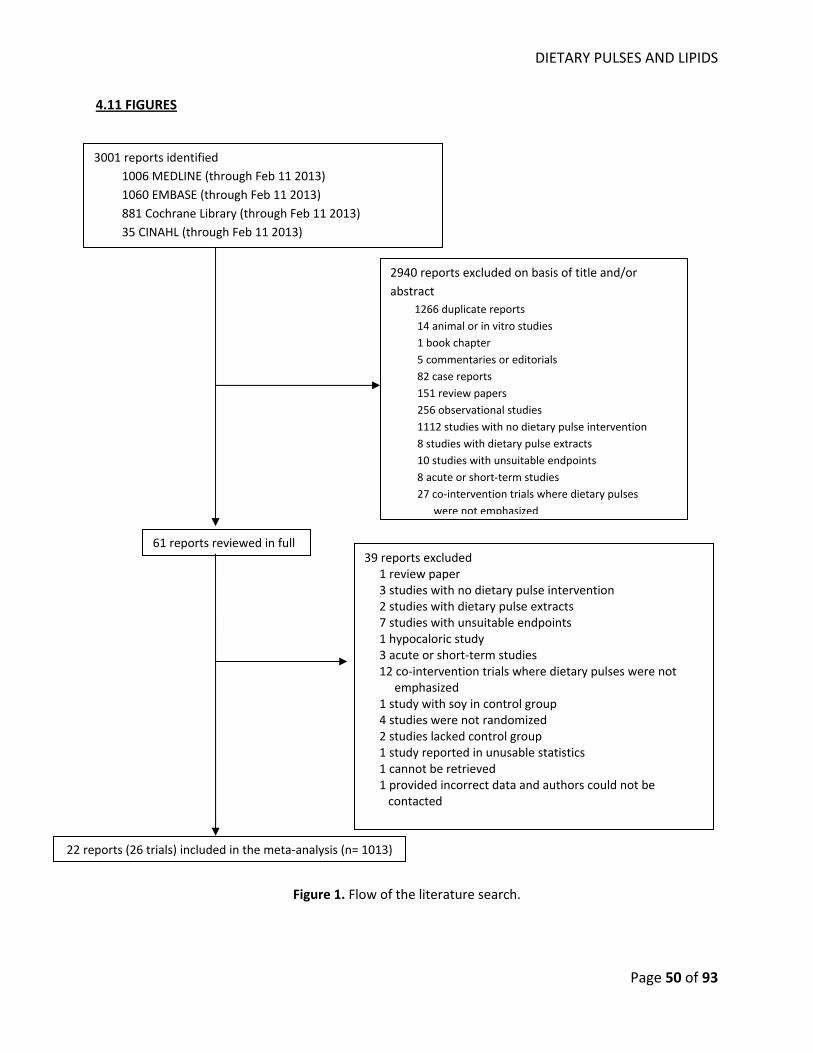
DIETARY PULSES AND LIPIDS
Page 50 of 93
4.11 FIGURES
Figure 1. Flow of the literature search.
61 reports reviewed in full
22 reports (26 trials) included in the meta‐analysis (n= 1013)
39 reports excluded 1 review paper 3 studies with no dietary pulse intervention 2 studies with dietary pulse extracts 7 studies with unsuitable endpoints 1 hypocaloric study 3 acute or short‐term studies 12 co‐intervention trials where dietary pulses were not emphasized 1 study with soy in control group 4 studies were not randomized 2 studies lacked control group 1 study reported in unusable statistics 1 cannot be retrieved 1 provided incorrect data and authors could not be
contacted
3001 reports identified 1006 MEDLINE (through Feb 11 2013) 1060 EMBASE (through Feb 11 2013) 881 Cochrane Library (through Feb 11 2013) 35 CINAHL (through Feb 11 2013)
2940 reports excluded on basis of title and/or abstract
1266 duplicate reports 14 animal or in vitro studies 1 book chapter 5 commentaries or editorials 82 case reports 151 review papers 256 observational studies 1112 studies with no dietary pulse intervention 8 studies with dietary pulse extracts 10 studies with unsuitable endpoints 8 acute or short‐term studies 27 co‐intervention trials where dietary pulses
were not emphasized
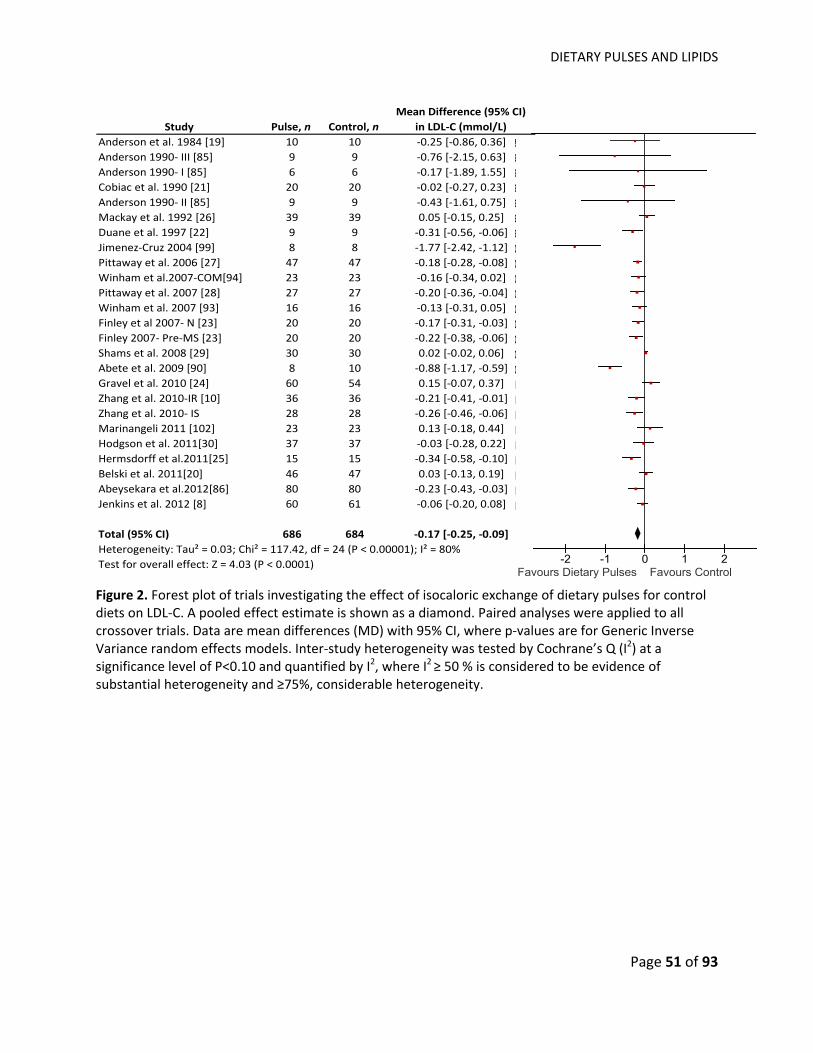
DIETARY PULSES AND LIPIDS
Page 51 of 93
84909090909297040607070707070809101010111111111212
-2 -1 0 1 2Favours Dietary Pulses Favours Control
Study Pulse, n Control, nMean Difference (95% CI)
in LDL‐C (mmol/L) Anderson et al. 1984 [19] 10 10 ‐0.25 [‐0.86, 0.36]Anderson 1990‐ III [85] 9 9 ‐0.76 [‐2.15, 0.63]Anderson 1990‐ I [85] 6 6 ‐0.17 [‐1.89, 1.55]Cobiac et al. 1990 [21] 20 20 ‐0.02 [‐0.27, 0.23]Anderson 1990‐ II [85] 9 9 ‐0.43 [‐1.61, 0.75]Mackay et al. 1992 [26] 39 39 0.05 [‐0.15, 0.25]Duane et al. 1997 [22] 9 9 ‐0.31 [‐0.56, ‐0.06]Jimenez‐Cruz 2004 [99] 8 8 ‐1.77 [‐2.42, ‐1.12]Pittaway et al. 2006 [27] 47 47 ‐0.18 [‐0.28, ‐0.08]Winham et al.2007‐COM[94] 23 23 ‐0.16 [‐0.34, 0.02]Pittaway et al. 2007 [28] 27 27 ‐0.20 [‐0.36, ‐0.04]Winham et al. 2007 [93] 16 16 ‐0.13 [‐0.31, 0.05]Finley et al 2007‐ N [23] 20 20 ‐0.17 [‐0.31, ‐0.03]Finley 2007‐ Pre‐MS [23] 20 20 ‐0.22 [‐0.38, ‐0.06]Shams et al. 2008 [29] 30 30 0.02 [‐0.02, 0.06]Abete et al. 2009 [90] 8 10 ‐0.88 [‐1.17, ‐0.59]Gravel et al. 2010 [24] 60 54 0.15 [‐0.07, 0.37]Zhang et al. 2010‐IR [10] 36 36 ‐0.21 [‐0.41, ‐0.01]Zhang et al. 2010‐ IS 28 28 ‐0.26 [‐0.46, ‐0.06]Marinangeli 2011 [102] 23 23 0.13 [‐0.18, 0.44]Hodgson et al. 2011[30] 37 37 ‐0.03 [‐0.28, 0.22]Hermsdorff et al.2011[25] 15 15 ‐0.34 [‐0.58, ‐0.10]Belski et al. 2011[20] 46 47 0.03 [‐0.13, 0.19]Abeysekara et al.2012[86] 80 80 ‐0.23 [‐0.43, ‐0.03]Jenkins et al. 2012 [8] 60 61 ‐0.06 [‐0.20, 0.08]
Total (95% CI) 686 684 ‐0.17 [‐0.25, ‐0.09]Heterogeneity: Tau² = 0.03; Chi² = 117.42, df = 24 (P < 0.00001); I² = 80%Test for overall effect: Z = 4.03 (P < 0.0001)
Figure 2. Forest plot of trials investigating the effect of isocaloric exchange of dietary pulses for control diets on LDL‐C. A pooled effect estimate is shown as a diamond. Paired analyses were applied to all crossover trials. Data are mean differences (MD) with 95% CI, where p‐values are for Generic Inverse Variance random effects models. Inter‐study heterogeneity was tested by Cochrane’s Q (I2) at a significance level of P<0.10 and quantified by I2, where I2 ≥ 50 % is considered to be evidence of substantial heterogeneity and ≥75%, considerable heterogeneity.
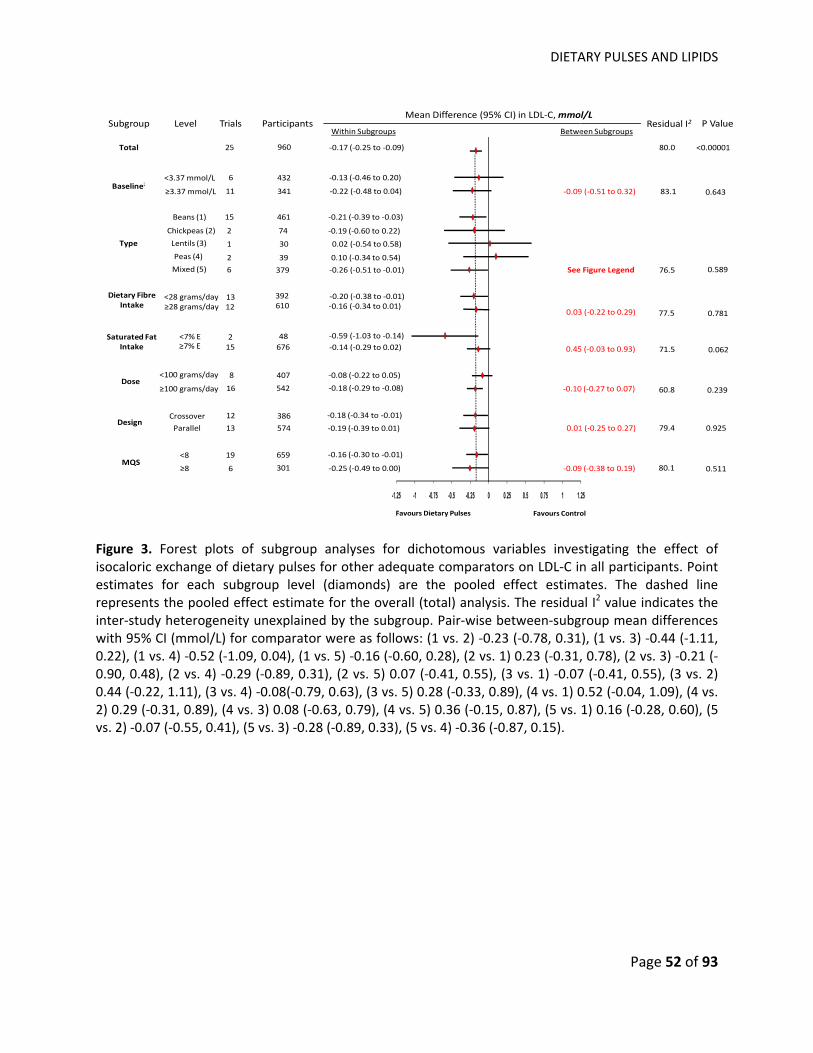
DIETARY PULSES AND LIPIDS
Page 52 of 93
Mean Difference (95% CI) in LDL‐C, mmol/L
Favours ControlFavours Dietary Pulses
Between SubgroupsWithin SubgroupsResidual I2 P ValueSubgroup Level
Total
Trials Participants
25 960 ‐0.17 (‐0.25 to ‐0.09)
11Baseline24
<3.37 mmol/L
≥3.37 mmol/L
6 432
341
‐0.13 (‐0.46 to 0.20)
‐0.22 (‐0.48 to 0.04)
Type
Beans (1)
Chickpeas (2)
1
15 461
30
‐0.21 (‐0.39 to ‐0.03)
0.02 (‐0.54 to 0.58)
Dose
Crossover
<100 grams/day
12
MQS
83.1 0.643‐0.09 (‐0.51 to 0.32)
80.0 <0.00001
2 74 ‐0.19 (‐0.60 to 0.22)
Lentils (3)
Peas (4) 2 39 0.10 (‐0.34 to 0.54) Mixed (5) 6 379 ‐0.26 (‐0.51 to ‐0.01) 0.58976.5See Figure Legend
≥100 grams/day
8 407
16 542
‐0.08 (‐0.22 to 0.05)
‐0.18 (‐0.29 to ‐0.08) ‐0.10 (‐0.27 to 0.07) 60.8 0.239
DesignParallel
386
‐0.19 (‐0.39 to 0.01) 13 574
‐0.18 (‐0.34 to ‐0.01)
<8
≥8
19 659 ‐0.16 (‐0.30 to ‐0.01)
6 301 ‐0.25 (‐0.49 to 0.00)
0.01 (‐0.25 to 0.27)
‐0.09 (‐0.38 to 0.19)
79.4 0.925
80.1 0.511
-1.25 -1 -0.75 -0.5 -0.25 0 0.25 0.5 0.75 1 1.25
Saturated Fat Intake ≥7% E
<7% E67615 ‐0.14 (‐0.29 to 0.02)
‐0.59 (‐1.03 to ‐0.14) 482
0.45 (‐0.03 to 0.93) 71.5 0.062
Dietary FibreIntake
<28 grams/day 13 392 ‐0.20 (‐0.38 to ‐0.01) ≥28 grams/day 12 610 ‐0.16 (‐0.34 to 0.01)
0.03 (‐0.22 to 0.29) 77.5 0.781
Figure 3. Forest plots of subgroup analyses for dichotomous variables investigating the effect of isocaloric exchange of dietary pulses for other adequate comparators on LDL‐C in all participants. Point estimates for each subgroup level (diamonds) are the pooled effect estimates. The dashed line represents the pooled effect estimate for the overall (total) analysis. The residual I2 value indicates the inter‐study heterogeneity unexplained by the subgroup. Pair‐wise between‐subgroup mean differences with 95% CI (mmol/L) for comparator were as follows: (1 vs. 2) ‐0.23 (‐0.78, 0.31), (1 vs. 3) ‐0.44 (‐1.11, 0.22), (1 vs. 4) ‐0.52 (‐1.09, 0.04), (1 vs. 5) ‐0.16 (‐0.60, 0.28), (2 vs. 1) 0.23 (‐0.31, 0.78), (2 vs. 3) ‐0.21 (‐0.90, 0.48), (2 vs. 4) ‐0.29 (‐0.89, 0.31), (2 vs. 5) 0.07 (‐0.41, 0.55), (3 vs. 1) ‐0.07 (‐0.41, 0.55), (3 vs. 2) 0.44 (‐0.22, 1.11), (3 vs. 4) ‐0.08(‐0.79, 0.63), (3 vs. 5) 0.28 (‐0.33, 0.89), (4 vs. 1) 0.52 (‐0.04, 1.09), (4 vs. 2) 0.29 (‐0.31, 0.89), (4 vs. 3) 0.08 (‐0.63, 0.79), (4 vs. 5) 0.36 (‐0.15, 0.87), (5 vs. 1) 0.16 (‐0.28, 0.60), (5 vs. 2) ‐0.07 (‐0.55, 0.41), (5 vs. 3) ‐0.28 (‐0.89, 0.33), (5 vs. 4) ‐0.36 (‐0.87, 0.15).
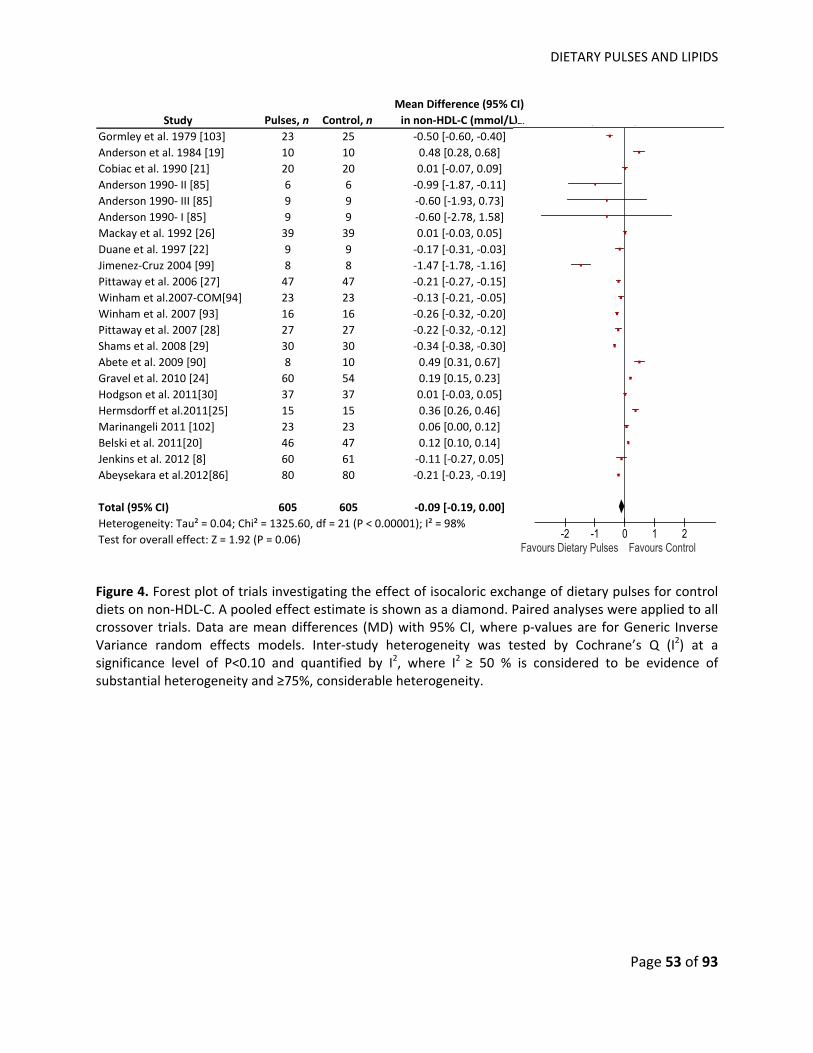
DIETARY PULSES AND LIPIDS
Page 53 of 93
Study Pulses, n Control, nMean Difference (95% CI) in non‐HDL‐C (mmol/L)
Gormley et al. 1979 [103] 23 25 ‐0.50 [‐0.60, ‐0.40]Anderson et al. 1984 [19] 10 10 0.48 [0.28, 0.68]Cobiac et al. 1990 [21] 20 20 0.01 [‐0.07, 0.09]Anderson 1990‐ II [85] 6 6 ‐0.99 [‐1.87, ‐0.11]Anderson 1990‐ III [85] 9 9 ‐0.60 [‐1.93, 0.73]Anderson 1990‐ I [85] 9 9 ‐0.60 [‐2.78, 1.58]Mackay et al. 1992 [26] 39 39 0.01 [‐0.03, 0.05]Duane et al. 1997 [22] 9 9 ‐0.17 [‐0.31, ‐0.03]Jimenez‐Cruz 2004 [99] 8 8 ‐1.47 [‐1.78, ‐1.16]Pittaway et al. 2006 [27] 47 47 ‐0.21 [‐0.27, ‐0.15]Winham et al.2007‐COM[94] 23 23 ‐0.13 [‐0.21, ‐0.05]Winham et al. 2007 [93] 16 16 ‐0.26 [‐0.32, ‐0.20]Pittaway et al. 2007 [28] 27 27 ‐0.22 [‐0.32, ‐0.12]Shams et al. 2008 [29] 30 30 ‐0.34 [‐0.38, ‐0.30]Abete et al. 2009 [90] 8 10 0.49 [0.31, 0.67]Gravel et al. 2010 [24] 60 54 0.19 [0.15, 0.23]Hodgson et al. 2011[30] 37 37 0.01 [‐0.03, 0.05]Hermsdorff et al.2011[25] 15 15 0.36 [0.26, 0.46]Marinangeli 2011 [102] 23 23 0.06 [0.00, 0.12]Belski et al. 2011[20] 46 47 0.12 [0.10, 0.14]Jenkins et al. 2012 [8] 60 61 ‐0.11 [‐0.27, 0.05]Abeysekara et al.2012[86] 80 80 ‐0.21 [‐0.23, ‐0.19]
Total (95% CI) 605 605 ‐0.09 [‐0.19, 0.00]Heterogeneity: Tau² = 0.04; Chi² = 1325.60, df = 21 (P < 0.00001); I² = 98%Test for overall effect: Z = 1.92 (P = 0.06)
ear979984990990990990992997004006007007007008009010011011011011012012
IV, Random, 95% CI
-2 -1 0 1 2Favours Dietary Pulses Favours Control
Figure 4. Forest plot of trials investigating the effect of isocaloric exchange of dietary pulses for control diets on non‐HDL‐C. A pooled effect estimate is shown as a diamond. Paired analyses were applied to all crossover trials. Data are mean differences (MD) with 95% CI, where p‐values are for Generic Inverse Variance random effects models. Inter‐study heterogeneity was tested by Cochrane’s Q (I2) at a significance level of P<0.10 and quantified by I2, where I2 ≥ 50 % is considered to be evidence of substantial heterogeneity and ≥75%, considerable heterogeneity.
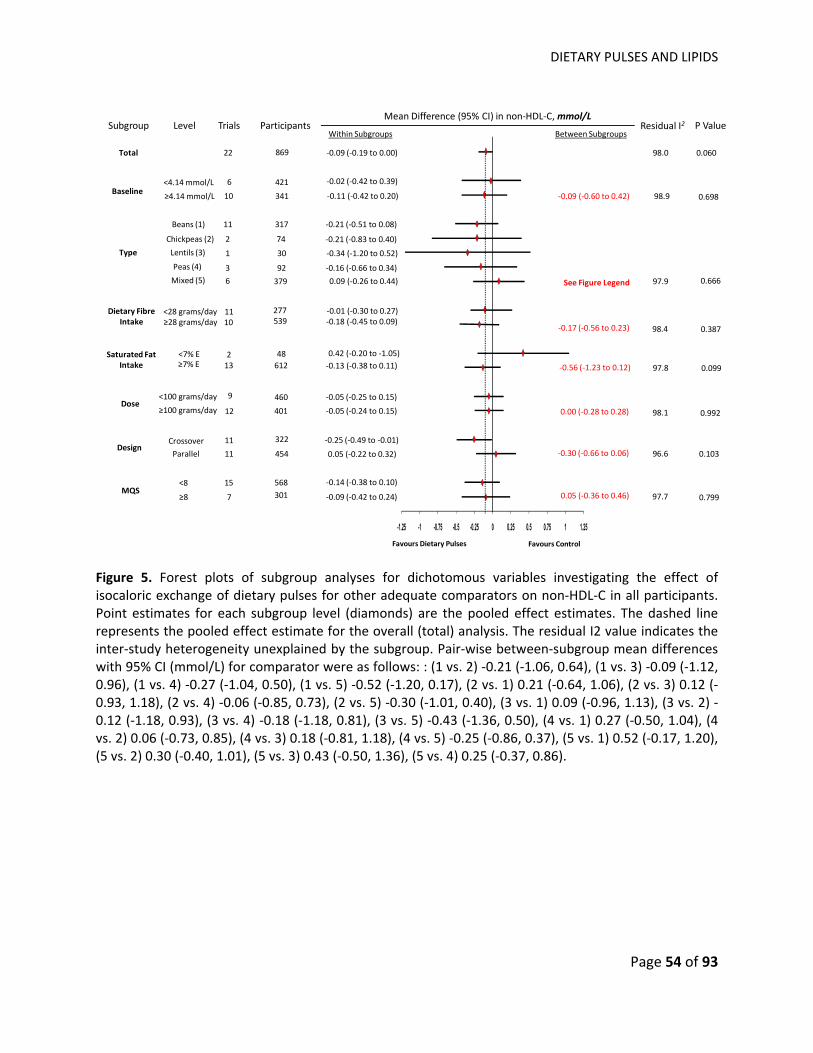
DIETARY PULSES AND LIPIDS
Page 54 of 93
-1.25 -1 -0.75 -0.5 -0.25 0 0.25 0.5 0.75 1 1.25
Mean Difference (95% CI) in non‐HDL‐C, mmol/L
Favours ControlFavours Dietary Pulses
Between SubgroupsWithin SubgroupsResidual I2 P ValueSubgroup Level
Total
Trials Participants
22 869 ‐0.09 (‐0.19 to 0.00)
10Baseline24<4.14 mmol/L
≥4.14 mmol/L
6 421
341
‐0.02 (‐0.42 to 0.39)
‐0.11 (‐0.42 to 0.20)
Type
Beans (1)
Chickpeas (2)
1
11 317
30
‐0.21 (‐0.51 to 0.08)
‐0.34 (‐1.20 to 0.52)
Dose
Crossover
<100 grams/day
11
MQS
98.9 0.698‐0.09 (‐0.60 to 0.42)
98.0 0.060
2 74 ‐0.21 (‐0.83 to 0.40)
Lentils (3)
Peas (4) 3 92 ‐0.16 (‐0.66 to 0.34) Mixed (5) 6 379 0.09 (‐0.26 to 0.44) 0.66697.9See Figure Legend
≥100 grams/day
9 460
12 401
‐0.05 (‐0.25 to 0.15)
‐0.05 (‐0.24 to 0.15) 0.00 (‐0.28 to 0.28) 98.1 0.992
DesignParallel
322
0.05 (‐0.22 to 0.32) 11 454
‐0.25 (‐0.49 to ‐0.01)
<8
≥8
15 568 ‐0.14 (‐0.38 to 0.10)
7 301 ‐0.09 (‐0.42 to 0.24)
‐0.30 (‐0.66 to 0.06)
0.05 (‐0.36 to 0.46)
96.6 0.103
97.7 0.799
Saturated Fat Intake ≥7% E
<7% E61213 ‐0.13 (‐0.38 to 0.11)
0.42 (‐0.20 to ‐1.05) 482
‐0.56 (‐1.23 to 0.12) 97.8 0.099
Dietary FibreIntake
<28 grams/day 11 277 ‐0.01 (‐0.30 to 0.27) ≥28 grams/day 10 539 ‐0.18 (‐0.45 to 0.09)
‐0.17 (‐0.56 to 0.23) 98.4 0.387
Figure 5. Forest plots of subgroup analyses for dichotomous variables investigating the effect of isocaloric exchange of dietary pulses for other adequate comparators on non‐HDL‐C in all participants. Point estimates for each subgroup level (diamonds) are the pooled effect estimates. The dashed line represents the pooled effect estimate for the overall (total) analysis. The residual I2 value indicates the inter‐study heterogeneity unexplained by the subgroup. Pair‐wise between‐subgroup mean differences with 95% CI (mmol/L) for comparator were as follows: : (1 vs. 2) ‐0.21 (‐1.06, 0.64), (1 vs. 3) ‐0.09 (‐1.12, 0.96), (1 vs. 4) ‐0.27 (‐1.04, 0.50), (1 vs. 5) ‐0.52 (‐1.20, 0.17), (2 vs. 1) 0.21 (‐0.64, 1.06), (2 vs. 3) 0.12 (‐0.93, 1.18), (2 vs. 4) ‐0.06 (‐0.85, 0.73), (2 vs. 5) ‐0.30 (‐1.01, 0.40), (3 vs. 1) 0.09 (‐0.96, 1.13), (3 vs. 2) ‐0.12 (‐1.18, 0.93), (3 vs. 4) ‐0.18 (‐1.18, 0.81), (3 vs. 5) ‐0.43 (‐1.36, 0.50), (4 vs. 1) 0.27 (‐0.50, 1.04), (4 vs. 2) 0.06 (‐0.73, 0.85), (4 vs. 3) 0.18 (‐0.81, 1.18), (4 vs. 5) ‐0.25 (‐0.86, 0.37), (5 vs. 1) 0.52 (‐0.17, 1.20), (5 vs. 2) 0.30 (‐0.40, 1.01), (5 vs. 3) 0.43 (‐0.50, 1.36), (5 vs. 4) 0.25 (‐0.37, 0.86).
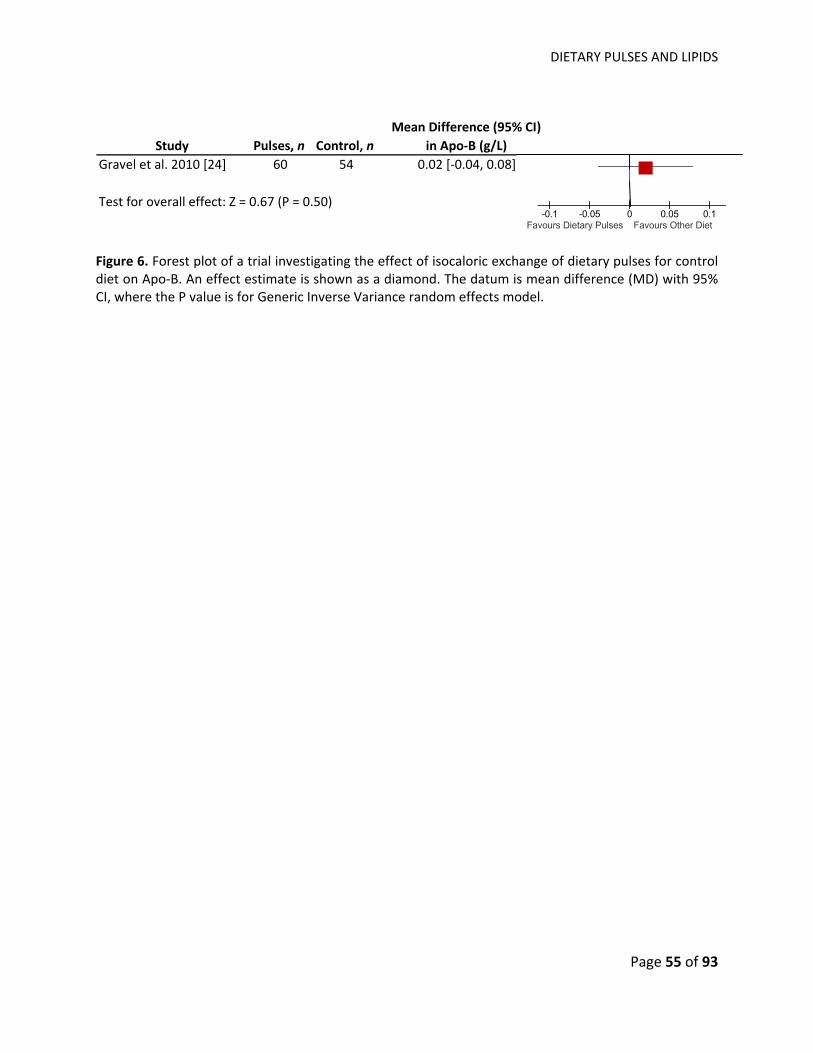
DIETARY PULSES AND LIPIDS
Page 55 of 93
Study Pulses, n Control, nMean Difference (95% CI)
in Apo‐B (g/L)Gravel et al. 2010 [24] 60 54 0.02 [‐0.04, 0.08]
Test for overall effect: Z = 0.67 (P = 0.50)
CI8]
8]
IV, Random, 95% CI
-0.1 -0.05 0 0.05 0.1Favours Dietary Pulses Favours Other Diet
Figure 6. Forest plot of a trial investigating the effect of isocaloric exchange of dietary pulses for control diet on Apo‐B. An effect estimate is shown as a diamond. The datum is mean difference (MD) with 95% CI, where the P value is for Generic Inverse Variance random effects model.
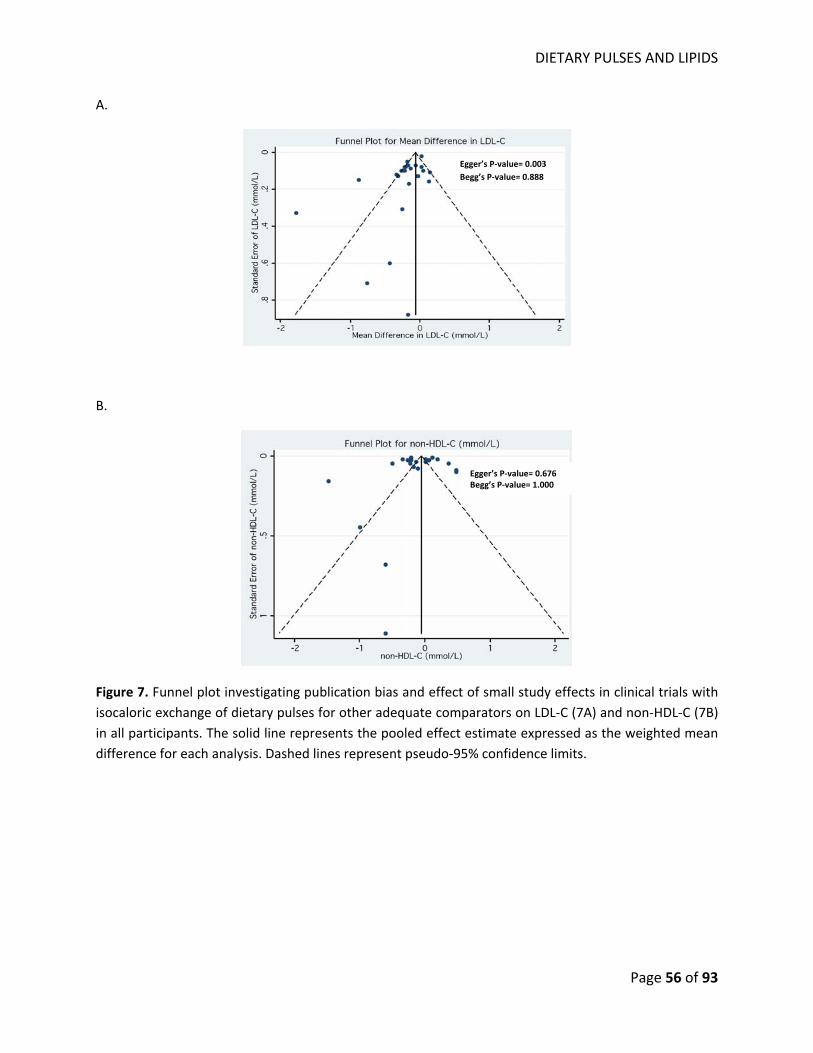
DIETARY PULSES AND LIPIDS
Page 56 of 93
A.
B.
Figure 7. Funnel plot investigating publication bias and effect of small study effects in clinical trials with isocaloric exchange of dietary pulses for other adequate comparators on LDL‐C (7A) and non‐HDL‐C (7B) in all participants. The solid line represents the pooled effect estimate expressed as the weighted mean difference for each analysis. Dashed lines represent pseudo‐95% confidence limits.
Egger’s P‐value= 0.003 Begg’s P‐value= 0.888
Egger’s P‐value= 0.676 Begg’s P‐value= 1.000
DIETARY PULSES AND OXIDATIVE STRESS
Page 57 of 93
CHAPTER V‐ EFFECT OF A HIGH DIETARY PULSES, LOW GLYCEMIC INDEX DIET ON OXIDATIVE STRESS MARKERS IN TYPE 2 DIABETES
DIETARY PULSES AND OXIDATIVE STRESS
Page 58 of 93
EFFECT OF A HIGH DIETARY PULSES, LOW GLYCEMIC INDEX DIET ON OXIDATIVE STRESS MARKERS IN
TYPE 2 DIABETES
Vanessa Ha HBSc1,4, John L Sievenpiper MD PhD1,8, Russell J de Souza RD ScD1,9, Arash Mirrahimi1,11,
Richard P Bazinet PhD4, Robert G Josse MBBS1,2,3,4,5, Cyril WC Kendall PhD1,4,10, Joseph Beyene6,7,9,
David JA Jenkins MD PhD DSc1,2,3,4,5,
1Clinical Nutrition and Risk Factor Modification Centre, 2Keenan Research Centre of the Li Ka Shing
Knowledge Institute, and 3Division of Endocrinology, St. Michael’s Hospital, Toronto, ON, CANADA; 4Departments of Nutritional Sciences, and 5Medicine, 6Dalla Lana School of Public Health, Faculty of
Medicine, University of Toronto, Toronto, ON, CANADA; 7The Hospital for Sick Children Research
Institute, Toronto, ON, CANADA; 8Departments of Pathology and Molecular Medicine, 9Clinical
Epidemiology & Biostatistics, McMaster University, Hamilton, ON, CANADA; 10College of Pharmacy and
Nutrition, University of Saskatchewan, Saskatoon, SK, CANADA; 11School of Medicine, Faculty of
Medicine, Queen’s University, Kingston, ON, CANADA
Corresponding author:
David JA Jenkins MD PhD DSc University Professor Canada Research Chair in Nutrition and Metabolism University of Toronto 150 College St., Toronto, Ontario, M5S 3M2, CANADA Tel: 416 867 7475 Fax: 416 867 7495 Email: [email protected]
DIETARY PULSES AND OXIDATIVE STRESS
Page 59 of 93
5.1 ABSTRACT
Background: Diets high in vegetable protein such as dietary pulses (beans, chickpeas, lentils, and peas)
have been inversely associated with coronary heart disease (CHD). Whether dietary pulses reduce CHD
by reducing oxidative stress is unclear. We conducted a secondary analysis of a randomized controlled
clinical trial to assess the effect of a diet emphasizing dietary pulses on oxidative damage in type 2
diabetes (T2DM).
Methods and Results: This secondary analysis compared 113 T2DM participants who had serum
available and completed either 12 week dietary intervention trial high in dietary pulses, which was used
to lower the glycemic index of the diet, or high in wheat fibre diets in a randomized parallel design.
Markers of oxidative stress were measured using thiobarbituric acid reactive substances (TBARS) and
conjugated dienes (CDs) in the LDL fraction, and protein thiols in serum. There were no treatment
differences in oxidative stress markers, although pooling data from both treatments showed a
significant inverse correlation between changes in dietary pulse intake with changes in CDs (r=‐0.225;
p=0.016), suggesting a higher dietary pulse intake is associated with improved oxidative stress status.
Estimated glucose excursions, however, were not significantly associated with markers of oxidative
damage.
Conclusions: This secondary analysis of a randomized controlled trial did not detect treatment
differences in markers of oxidative damage although dietary pulse intake tended to be inversely related
to one marker of oxidative stress. Appropriately powered intervention trials of dietary pulses on
oxidative damage as the primary outcome are warranted.
Clinical Trial Registration: NCT01063361
Abstract Word Count: 237
Keywords: clinical trial, legumes, dietary pulses, oxidative stress, oxidative damage, cardiovascular
disease
DIETARY PULSES AND OXIDATIVE STRESS
Page 60 of 93
5.2 INTRODUCTION
Diets emphasizing vegetable proteins have been shown to reduce coronary heart disease (CHD)
mortality risk when substituting for carbohydrates or animal protein in the Iowa Women’s Study17.
Similarly, human dietary intervention trials have shown high plant protein intake that replaced
carbohydrate improve lipid levels31, 72. These findings are suggestive that foods that are high in vegetable
proteins may offer cardio‐protective effects. However other than soy proteins64, and a study on wheat
gluten31 and barley71, few studies have explored other food sources of plant protein, or assessed the
mechanism by which vegetable protein may have to reduce cardiovascular risk.
Dietary non‐oil‐seed pulses (beans, peas, chickpeas, and lentils) are a good source of vegetable
protein and they have been shown to reduce CHD risk factors, including LDL‐C and systolic blood
pressure (SBP) 8, 25. One cup of dietary pulses, on average, can provide 16.3 grams of the 50 grams of
daily protein intake as recommended by United States Department of Agriculture (USDA)107. Similar to
soy, dietary pulses contain the 7S globulin peptide which has been shown to increase uptake and
degradation of LDL‐C in human hepatic cells18. However, the effect of dietary pulses on ox‐LDL‐C, an
emerging risk factor of CVD, is unclear. Dietary patterns such as Dietary Strategies to Stop Hypertension
(DASH)108, low glycemic index (GI)109, and Mediterranean11 diets, which may contain dietary pulses, have
been shown to reduce markers of oxidative stress. We have therefore assessed the effect of a low‐GI
diet specifically emphasizing dietary pulses on oxidative stress markers in a secondary analysis of
participant serum from a trial of pulse consumption in type 2 diabetes (T2DM).
5.3 METHODS
This trial has been registered at clinicaltrials.gov (number, NCT01063361). Details of the
methods and results of the original study of 121 participants have been reported previously8.
DIETARY PULSES AND OXIDATIVE STRESS
Page 61 of 93
5.3.1 PARTICIPANTS
Participants were recruited from newspaper and public transport advertisements as well as
hospital clinics. A total of 131 eligible participants were randomized (Figure 1). Eligible participants had
an existing diagnosis of T2DM for at least 6 months, were taking a stable dose of oral anti‐hyperglycemic
agents for at least the previous 2 months, and had hemoglobin A1c (HbA1c) values that were between
6.5% to 8.5% of total hemoglobin both at initial screening and at the visit 1 week prior to commencing
the study. No participants had clinically significant cardiovascular, renal, or liver disease or a history of
cancer. The present analysis focuses on the 113 participants who completed the study, and had serum
samples available for analysis for oxidative damage markers at weeks 8, 10, or 12.
5.3.2 PROTOCOL
The study followed a randomized, parallel design with 2 treatment arms of 3 months’ duration
consisting of 1) a low‐GI diet emphasizing dietary pulse consumption (high dietary pulse diet), and 2) a
high wheat fibre diet (high fibre diet). Eligible participants were randomized by a statistician based on
sex and HbA1c value (HbA1c value ≤7.1% or >7.1% of total hemoglobin). Neither the dietitians nor the
participants were blinded, but equal emphasis was placed on healthiness of both diets.
Participants attended the research centre for screening and at week −1, baseline (week 0), and
weeks 2, 4, 8, 10, and 12 of the study. Participants were considered as completers of the study if they
made their last visit at week 8, 10, or 12. At each visit, anthropometric outcomes (body weight and waist
circumference) were measured and a fasting blood sample was taken. If HbA1c values rose above 8.5%
of total hemoglobin on 2 successive occasions, and could not be explained by specific circumstances,
participants were withdrawn from the study and referred back to their physician.
The study was approved by the research ethics board of St. Michael’s Hospital and the
University of Toronto, Toronto, Ontario, Canada. Written consent was obtained from all participants.
DIETARY PULSES AND OXIDATIVE STRESS
Page 62 of 93
5.3.3 DIETARY INTERVENTION
The emphasis of the treatment diet was to consume low GI foods as achieved primarily through
increased consumption of dietary pulses. The target dietary pulse consumption was 1 cup per day
(approximately 190 g per day, or 2 servings per day) of cooked beans, chickpeas or lentils. While a high
fibre diet was achieved by consumption of whole wheat and whole grain carbohydrate foods (whole
wheat breakfast cereals, breads, brown rice, etc). Participants were provided with a checklist of 15‐
grams carbohydrate portions of recommended foods and the quantities they were expected to consume
daily. Seven‐day food records covering the week prior to each visit were discussed with the dietitian and
assessed for adherence to prescribed dietary interventions.
5.3.4 BIOCHEMICAL ANALYSIS
Fasting HbA1c, glucose, and lipids were measured a fresh sample in the hospital routine clinical
laboratory. Measures of oxidative damage were made in batches at the end of the study on serum from
fasting blood samples stored at ‐70°C. Oxidative stress was measured as thiobarbituric acid reactive
substances (TBARS), (CV=5.0%) and conjugated dienes (CDs) (CV=3.6%) in the LDL‐C fraction by the
methods of Jentzsch et al.110 and Ahotupa et al.111, respectively. Total protein thiols were also measured
on stored serum as a marker of oxidized plasma proteins by the method of Hu et al.112 (CV=2.3%).
Diets were assessed for macronutrients, fatty acids, cholesterol, fibre and glycemic index using
ESHA food processor software (version 10.9.0), a program based on USDA data and international GI
tables.
5.3.5 STATISTICAL ANALYSIS
The primary outcome of the original study was HbA1c8. The present analysis focused on oxidized
products in serum of participants who had sufficient serum at both zero and week 8, 10, or 12 (n=113).
The treatment differences in markers of oxidative stress were assessed using an unpaired 2‐
tailed Student’s t‐test. Pearson correlations and partial correlations were undertaken on pooled data
DIETARY PULSES AND OXIDATIVE STRESS
Page 63 of 93
from both treatment arms to determine the relation of change in oxidized products to measures of
study outcomes and change in dietary pulse intake.
We indirectly assessed the impact of postprandial glycemic excursions on oxidative damage by
stratifying participants into 4 groups based on their changes in fasting blood glucose (FBG) and HbA1c
(See Table 1 for classification of participants). If participants showed no changes in both FBG and HbA1c,
then they were excluded from the analysis (n= 2). A 2‐sample t‐test compared participants in the lowest
glucose excursion quadrant with those in the highest glucose excursion quadrant, and with those in the
other 3 quadrants combined.
All analyses were carried out using SAS software (version 9.3). Results are expressed as absolute
mean changes from baseline with 95% confidence intervals (CI), unless otherwise noted. Significance
was set at p< 0.05.
5.4 RESULTS
Fifty‐eight individuals (91%) in the high fibre diet and 55 individuals (82%) in the high dietary
pulse diet completed the study and provided blood samples for oxidative stress measurements (Figure
1). There were no significant differences between the 2 treatment arms at baseline (Table 2). Dietary
variables were not significantly different between treatment groups at baseline. There were, however,
significant treatment differences in the dietary variables as change from baseline (Table 3). Notably, the
dietary pulse arm had greater changes in dietary pulse, percent energy from dietary protein, vegetable
protein, and fibre intake than the fibre diet (p<0.05). There was a greater reduction and lower GI at the
end of the study on the dietary pulse than the high‐fibre arm. In contrast, the dietary pulse diet had
smaller changes in percent energy from saturated fat (SFA) and polyunsaturated fatty acid (PUFA)
intakes, although SFA was still lower and PUFA still higher at the end of the study than the fibre diet.
HbA1c was reduced significantly in the treatment compared to control as was SBP. The effects
have been repeated previously8.
DIETARY PULSES AND OXIDATIVE STRESS
Page 64 of 93
5.4.1 OXIDATIVE STRESS MARKERS There was no significant baseline or treatment difference in markers of oxidative stress: TBARS,
CDs, and protein thiols (Table 4). However in the pooled analysis, change in dietary pulse intake was
inversely correlated with change in CDs (Figure 2 and Table 5).
Pooled data from both treatments showed significant positive associations between changes in
TBARS and CDs with changes in LDL‐C, TC:HDL‐C and TG (Table 5). A positive correlation was also found
between change in CDs and change in diastolic blood pressure (DBP) and mean arterial pressure (MAP),
while change in protein thiols was positively correlated with heart rate reduction. Partial Pearson
correlations adjusting for change in body weight did not change results except for the correlation
between change in protein thiols with change in LDL‐C, changing from non‐significant to significant after
adjustment (Table 5).
5.4.2 GLYCEMIC EXCURSION
Both treatment arms were pooled to assess the effects of estimated postprandial glycemic
excursions on markers of oxidative stress. Within each quadrant, we did not find significant changes in
any of the oxidative stress markers from baseline except for quadrant C where it showed improvements
of protein thiol level (p= 0.0014).
We further assessed whether participants with different levels of glycemic excursion would
effect levels of oxidative stress markers. Comparing participants with the lowest estimated glycemic
excursions (Group D) with those with the highest estimated glycemic excursions (Group A), there were
no significant differences on TBARS, CDs, and protein thiols. Nor was there a significant effect on
oxidative stress markers when participants with the lowest glycemic excursion was compared to those in
all other groups combined (Group D vs. combined Groups A, B, and C).
5.5 DISCUSSION
Our results indicated a diet high in plant protein from dietary pulses (beans, chickpeas, lentils,
peas) has no greater reduction on markers of oxidative stress than a high fibre comparator diet in 113
DIETARY PULSES AND OXIDATIVE STRESS
Page 65 of 93
T2DM participants after 12 weeks of intervention. However, an inverse correlation was found between
change in dietary pulse intake and change in CDs, suggesting higher intakes of dietary pulses improved
levels of CDs. Lower estimated glycemic excursions did not significantly affect levels of oxidative stress
markers.
5.5.1 RELATIONS TO OTHER STUDIES
To our knowledge, no randomized trials have assessed the effects of diets high in plant protein
on oxidative stress. Most dietary intervention studies have focused on investigating specific food
sources of plant protein such as soy31, 113, wheat gluten31, and barley71. In comparison to these results,
our analysis of dietary pulses did not show improvements to oxidative damage. However, we did
observe a significant inverse relationship between dietary pulse intake and CDs. Although a high dietary
pulse diet may not reduce oxidative stress, there is still evidence suggesting a high dietary pulse intake
may reduce levels of ox‐LDL‐C32. A previous weight‐loss trial in 30 obese individuals found a diet high in
dietary pulses compared to a standard American diet significantly reduced levels of ox‐LDL‐C without
reducing levels of oxidative stress as measured by malondialdehyde (MDA) and 8‐isoprostane F2α32.
These results suggest dietary pulses may reduce levels of ox‐LDL‐C by reducing the number of LDL‐C
particles that are available for oxidation. Indeed, 2 previous meta‐analyses have shown that diets
emphasizing dietary pulses significantly reduce LDL‐C levels compared to control diets13, 83. Furthermore,
dietary pulses are high in 7S globulin, a protein that has also been shown to increase uptake and
degradation of LDL‐C in humans18. Consequently, lower levels of LDL‐C available for oxidation after
dietary pulse consumption may reduce CVD risk by lowering LDL‐C particle size.
We found no effect of estimated glucose excursion on markers of oxidative stress in our pooled
analysis of both treatment arms. The lack of an effect is unexpected. Dietary pulses have a low‐GI and
some are high in protein and fibre, both of which lower postprandial blood glucose, a factor which has
been strongly associated with oxidative stress109, 114, 115. Previous randomized dietary trials of low‐GI
DIETARY PULSES AND OXIDATIVE STRESS
Page 66 of 93
diets have shown reductions in oxidative stress markers109. It is possible that our study did not find
significant changes in oxidative stress markers with glycemic excursion reductions because our
measurements were calculated and indirect; we used a combination of changes in FBG and HbA1c levels
as a proxy for changes in postprandial glycemia. In addition, the use of a healthy control group that is
high in fibre (i.e. a positive control group), may have minimized the opportunity to see treatment
differences in our analysis since whole wheat lignans and other phenolics have antioxidant properties116.
5.5.2 LIMITATIONS
There are several limitations to our work. First and most importantly, the present analysis on
oxidative stress levels represents a secondary analysis. The trial was designed to provide good power for
measures of HbA1c8 which may not have had sufficient power to detect significant treatment
differences in markers of oxidative damage. Second, we did not adjust for antioxidants found in foods
and supplementations. The use of Oxygen Radical Absorbance Capacity (ORAC) values to measure the
antioxidant capacity of foods is discouraged by the USDA, citing reasons that the values were tested in
vitro and the antioxidant effects cannot be confidently extrapolated to human physiology117. The use of
antioxidant supplements was not adjusted for in our analysis because the frequency of use was not
different between the 2 treatment arms at baseline and at the end of the trial (data not shown). Third,
there are limitations to the methods we used to measure TBARS, CDs, and protein thiols. Each of these
oxidative stress markers has its own inherent limitations including measurement and may not be
representative of overall oxidative stress levels because they are rapidly degraded in vivo110‐112. Further
our methods of oxidative stress measurement may not be sensitive enough to measure levels of
oxidative stress markers in participants’ serum. For examples, while we reported TBARS values in the
range between 0.217‐ 0.294 μmol/L and measurements can be made between 0.1 to 2.1 μmol/L,
measurements of TBARS are most accurate at levels >0.3μmol/L110. Taking together all these issues
associated with measuring oxidative stress, we tried to increase the sensitivity of our analysis by using 3
DIETARY PULSES AND OXIDATIVE STRESS
Page 67 of 93
different methods of measurement of oxidative stress. We found no treatment differences on oxidative
stress regardless of the methods used. Last, although our original study did not show a significant LDL‐C
reduction, we still reported a significant non‐HDL reduction8, suggesting that a high dietary pulse intake
may still improve cardiovascular risk by reducing serum atherogenic lipids.
5.6 CONCLUSIONS
A diet high in vegetable protein from dietary pulses (beans, chickpeas, lentils, and peas) of
approximately 213 grams per day does not appear to reduce markers of oxidative damage when
compared to a high fibre diet in individuals with T2DM. Although our secondary analysis did not show
treatment differences in measures of oxidative stress, meta‐analyses have reported high dietary pulse
intake can still reduce CVD risk by improving levels of LDL‐C13, 83. As our analysis was secondary in nature
and the methods of measuring oxidative stress were relatively insensitive, we cannot rule out a
potential oxidative stress benefit of high vegetable protein diets. Therefore further large, long‐term,
high‐quality trials powered to assess the effect of high vegetable protein diets on oxidative stress are
needed. To identify research gaps and provide a more precise estimate of the effect of vegetable
proteins on these endpoints, our group has undertaken a series of systematic reviews and meta‐
analyses of randomized trials. Results from this project will guide our understanding of the role of
vegetable protein in cardiovascular risk reduction.
5.7 SOURCE OF FUNDING
This work was supported by ABIP through the PURENet and the Saskatchewan Pulse Growers.
VH was supported by an Ontario Graduate Scholar (OGS) award. RJD was funded by a Canadian
Institutes for Health Research (CIHR) Postdoctoral Fellowship Award. DJAJ was funded by the
Government of Canada through the Canada Research Chair Endowment. None of the sponsors had a
role in any aspect of the present study, including design and conduct of the study; collection,
DIETARY PULSES AND OXIDATIVE STRESS
Page 68 of 93
management, analysis, and interpretation of the data; and preparation, review, or approval of the
manuscript.
5.8 CONFLICTS OF INTEREST/DISCLOSURE
JLS has received several unrestricted travel grants from The Coca‐Cola Company to present
research at meetings and is a co‐investigator on an unrestricted research grant from The Coca‐Cola
Company. JLS has also received travel funding and honoraria from Abbott Laboratories, Archer Daniels
Midland, and the International Life Sciences Institute (ILSI) North America and Brazil; and research
support, consultant fees, and travel funding from Pulse Canada. Spouse of JLS works for Unilever
Canada. RJD, JB, and CWCK are co‐investigators on an unrestricted grant from The Coca‐Cola Company.
CWCK has served on the scientific advisory board, received research support, travel funding, consultant
fees, or honoraria from Pulse Canada, Barilla, Solae, Unilever, Hain Celestial, Loblaws Inc., Oldways
Preservation Trust, the Almond Board of California, the International Nut Council, Paramount Farms, the
California Strawberry Commission, the Canola and Flax Councils of Canada, and Saskatchewan Pulse
Growers. CWCK also receives partial salary funding from research grants provided by Unilever, Loblaw’s,
and the Almond Board of California. DJAJ has served on the Scientific Advisory Board of Sanitarium
Company, Agri‐Culture and Agri‐Food Canada (AAFC), Canadian Agriculture Policy Institute (CAPI),
California Strawberry Commission, Loblaw Supermarket, Herbal Life International, Nutritional
Fundamental for Health, Pacific Health Laboratories, Metagenics, Bayer Consumer Care, Orafti, Dean
Foods, Kellogg’s, Quaker Oats, Procter & Gamble, Coca‐Cola, NuVal Griffin Hospital, Abbott, Pulse
Canada, Saskatchewan Pulse Growers, and Canola Council of Canada; received honoraria for scientific
advice from Sanitarium Company, Orafti, the Almond Board of California, the American Peanut Council,
International Tree Nut Council Nutrition Research and Education Foundation and the Peanut Institute,
Herbal Life International, Pacific Health Laboratories, Nutritional Fundamental for Health, Barilla,
Metagenics, Bayer Consumer Care, Unilever Canada and Netherlands, Solae, Oldways, Kellogg’s, Quaker

DIETARY PULSES AND OXIDATIVE STRESS
Page 69 of 93
Oats, Procter & Gamble, Coca‐Cola, NuVal Griffin Hospital, Abbott, Canola Council of Canada, Dean
Foods, California Strawberry Commission, Haine Celestial, Pepsi, and Alpro Foundation; has been on the
speakers panel for the Almond Board of California; received research grants from Saskatchewan Pulse
Growers, the Agricultural Bioproducts Innovation Program (ABIP) through the Pulse Research Network
(PURENet), Advanced Food Materials Network (AFMNet), Loblaw, Unilever, Barilla, Almond Board of
California, Coca‐Cola, Solae, Haine Celestial, Sanitarium Company, Orafti, International Tree Nut Council
Nutrition Research and Education Foundation and the Peanut Institute, the Canola and Flax Councils of
Canada, Calorie Control Council, Canadian Institutes of Health Research, Canada Foundation for
Innovation, and the Ontario Research Fund; and received travel support to meetings from the Solae,
Sanitarium Company, Orafti, AFMNet, Coca‐Cola, The Canola and Flax Councils of Canada, Oldways
Preservation Trust, Kellogg’s, Quaker Oats, Griffin Hospital, Abbott Laboratories, Dean Foods, the
California Strawberry Commission, American Peanut Council, Herbal Life International, Nutritional
Fundamental for Health, Metagenics, Bayer Consumer Care, AAFC, CAPI, Pepsi, Almond Board of
California, Unilever, Alpro Foundation, International Tree Nut Council, Barilla, Pulse Canada, and the
Saskatchewan Pulse Growers. Dr Jenkins' wife is a director of Glycemic Index Laboratories, Toronto,
Ontario, Canada.
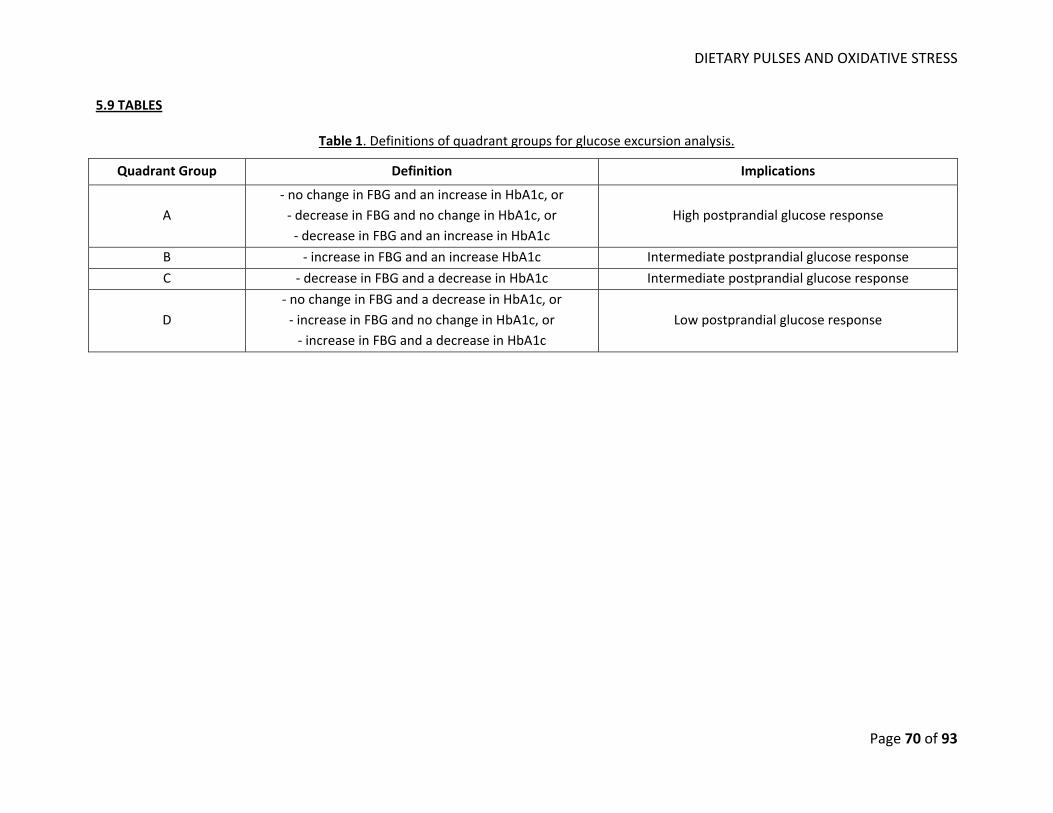
DIETARY PULSES AND OXIDATIVE STRESS
Page 70 of 93
5.9 TABLES
Table 1. Definitions of quadrant groups for glucose excursion analysis.
Quadrant Group Definition Implications
A ‐ no change in FBG and an increase in HbA1c, or ‐ decrease in FBG and no change in HbA1c, or ‐ decrease in FBG and an increase in HbA1c
High postprandial glucose response
B ‐ increase in FBG and an increase HbA1c Intermediate postprandial glucose response
C ‐ decrease in FBG and a decrease in HbA1c Intermediate postprandial glucose response
D ‐ no change in FBG and a decrease in HbA1c, or ‐ increase in FBG and no change in HbA1c, or ‐ increase in FBG and a decrease in HbA1c
Low postprandial glucose response
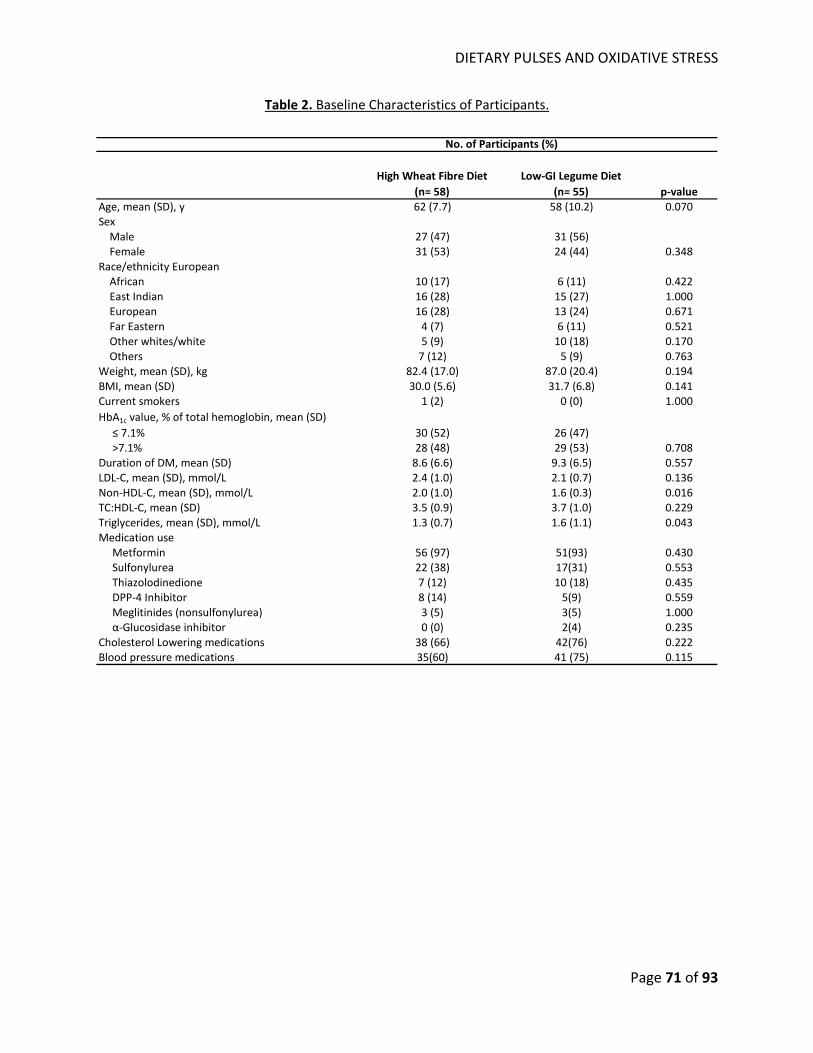
DIETARY PULSES AND OXIDATIVE STRESS
Page 71 of 93
Table 2. Baseline Characteristics of Participants.
High Wheat Fibre Diet(n= 58)
Low‐GI Legume Diet(n= 55) p‐value
Age, mean (SD), y 62 (7.7) 58 (10.2) 0.070Sex Male 27 (47) 31 (56) Female 31 (53) 24 (44) 0.348Race/ethnicity European African 10 (17) 6 (11) 0.422 East Indian 16 (28) 15 (27) 1.000 European 16 (28) 13 (24) 0.671 Far Eastern 4 (7) 6 (11) 0.521 Other whites/white 5 (9) 10 (18) 0.170 Others 7 (12) 5 (9) 0.763Weight, mean (SD), kg 82.4 (17.0) 87.0 (20.4) 0.194BMI, mean (SD) 30.0 (5.6) 31.7 (6.8) 0.141Current smokers 1 (2) 0 (0) 1.000HbA1c value, % of total hemoglobin, mean (SD) ≤ 7.1% 30 (52) 26 (47) >7.1% 28 (48) 29 (53) 0.708Duration of DM, mean (SD) 8.6 (6.6) 9.3 (6.5) 0.557LDL‐C, mean (SD), mmol/L 2.4 (1.0) 2.1 (0.7) 0.136Non‐HDL‐C, mean (SD), mmol/L 2.0 (1.0) 1.6 (0.3) 0.016TC:HDL‐C, mean (SD) 3.5 (0.9) 3.7 (1.0) 0.229Triglycerides, mean (SD), mmol/L 1.3 (0.7) 1.6 (1.1) 0.043Medication use Metformin 56 (97) 51(93) 0.430 Sulfonylurea 22 (38) 17(31) 0.553 Thiazolodinedione 7 (12) 10 (18) 0.435 DPP‐4 Inhibitor 8 (14) 5(9) 0.559 Meglitinides (nonsulfonylurea) 3 (5) 3(5) 1.000 α‐Glucosidase inhibitor 0 (0) 2(4) 0.235Cholesterol Lowering medications 38 (66) 42(76) 0.222Blood pressure medications 35(60) 41 (75) 0.115
No. of Participants (%)
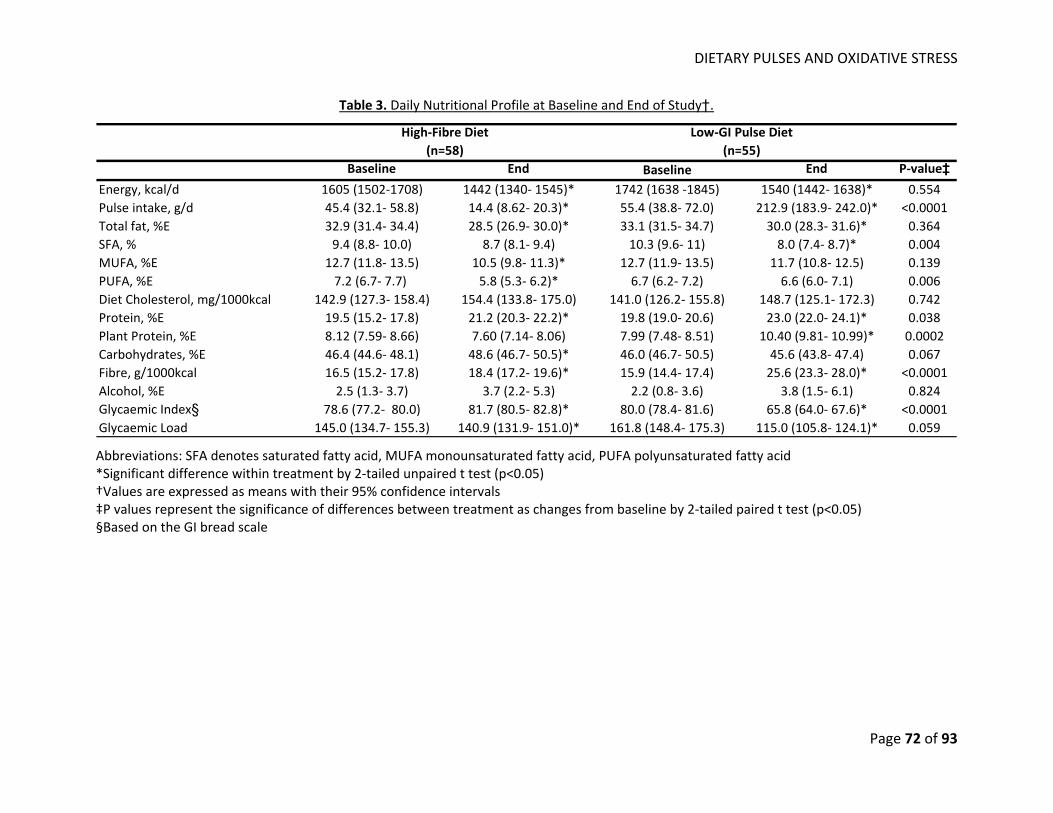
DIETARY PULSES AND OXIDATIVE STRESS
Page 72 of 93
Table 3. Daily Nutritional Profile at Baseline and End of Study†.
Baseline End Baseline End P‐value‡Energy, kcal/d 1605 (1502‐1708) 1442 (1340‐ 1545)* 1742 (1638 ‐1845) 1540 (1442‐ 1638)* 0.554Pulse intake, g/d 45.4 (32.1‐ 58.8) 14.4 (8.62‐ 20.3)* 55.4 (38.8‐ 72.0) 212.9 (183.9‐ 242.0)* <0.0001Total fat, %E 32.9 (31.4‐ 34.4) 28.5 (26.9‐ 30.0)* 33.1 (31.5‐ 34.7) 30.0 (28.3‐ 31.6)* 0.364SFA, % 9.4 (8.8‐ 10.0) 8.7 (8.1‐ 9.4) 10.3 (9.6‐ 11) 8.0 (7.4‐ 8.7)* 0.004MUFA, %E 12.7 (11.8‐ 13.5) 10.5 (9.8‐ 11.3)* 12.7 (11.9‐ 13.5) 11.7 (10.8‐ 12.5) 0.139PUFA, %E 7.2 (6.7‐ 7.7) 5.8 (5.3‐ 6.2)* 6.7 (6.2‐ 7.2) 6.6 (6.0‐ 7.1) 0.006Diet Cholesterol, mg/1000kcal 142.9 (127.3‐ 158.4) 154.4 (133.8‐ 175.0) 141.0 (126.2‐ 155.8) 148.7 (125.1‐ 172.3) 0.742Protein, %E 19.5 (15.2‐ 17.8) 21.2 (20.3‐ 22.2)* 19.8 (19.0‐ 20.6) 23.0 (22.0‐ 24.1)* 0.038Plant Protein, %E 8.12 (7.59‐ 8.66) 7.60 (7.14‐ 8.06) 7.99 (7.48‐ 8.51) 10.40 (9.81‐ 10.99)* 0.0002Carbohydrates, %E 46.4 (44.6‐ 48.1) 48.6 (46.7‐ 50.5)* 46.0 (46.7‐ 50.5) 45.6 (43.8‐ 47.4) 0.067Fibre, g/1000kcal 16.5 (15.2‐ 17.8) 18.4 (17.2‐ 19.6)* 15.9 (14.4‐ 17.4) 25.6 (23.3‐ 28.0)* <0.0001Alcohol, %E 2.5 (1.3‐ 3.7) 3.7 (2.2‐ 5.3) 2.2 (0.8‐ 3.6) 3.8 (1.5‐ 6.1) 0.824Glycaemic Index§ 78.6 (77.2‐ 80.0) 81.7 (80.5‐ 82.8)* 80.0 (78.4‐ 81.6) 65.8 (64.0‐ 67.6)* <0.0001Glycaemic Load 145.0 (134.7‐ 155.3) 140.9 (131.9‐ 151.0)* 161.8 (148.4‐ 175.3) 115.0 (105.8‐ 124.1)* 0.059
High‐Fibre Diet(n=58)
Low‐GI Pulse Diet(n=55)
Abbreviations: SFA denotes saturated fatty acid, MUFA monounsaturated fatty acid, PUFA polyunsaturated fatty acid *Significant difference within treatment by 2‐tailed unpaired t test (p<0.05) †Values are expressed as means with their 95% confidence intervals ‡P values represent the significance of differences between treatment as changes from baseline by 2‐tailed paired t test (p<0.05) §Based on the GI bread scale
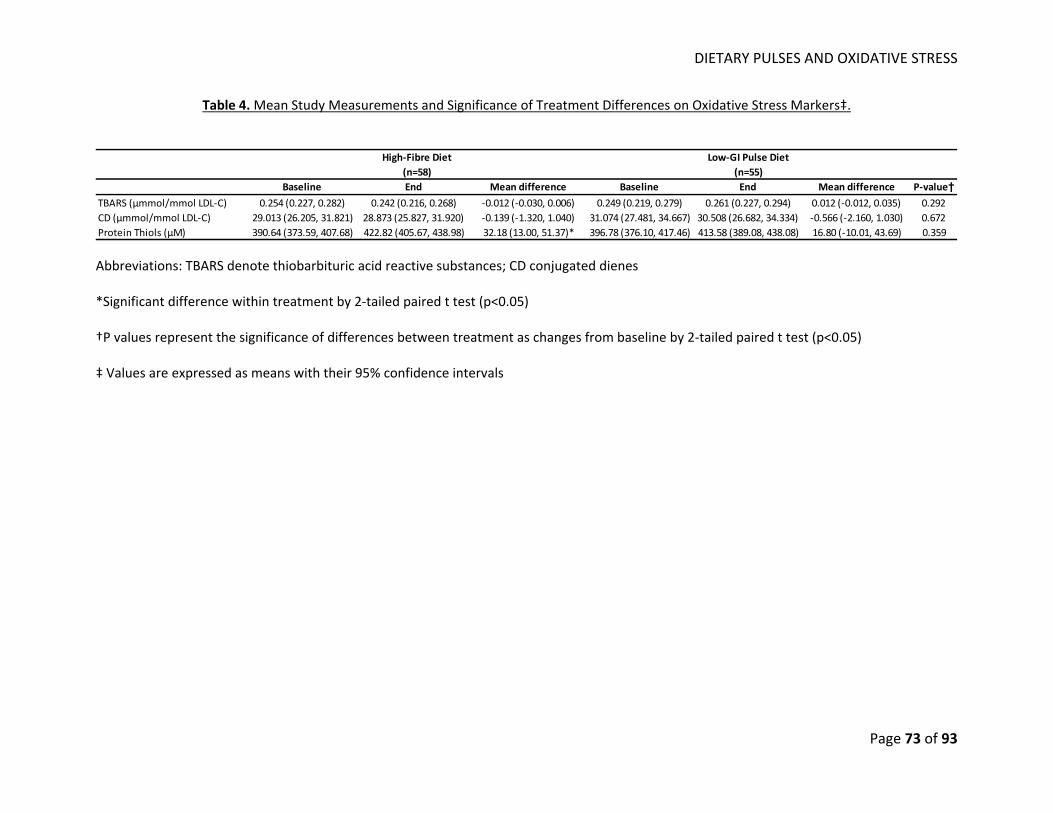
DIETARY PULSES AND OXIDATIVE STRESS
Page 73 of 93
Table 4. Mean Study Measurements and Significance of Treatment Differences on Oxidative Stress Markers‡.
Baseline End Mean difference Baseline End Mean difference P‐value†TBARS (μmmol/mmol LDL‐C) 0.254 (0.227, 0.282) 0.242 (0.216, 0.268) ‐0.012 (‐0.030, 0.006) 0.249 (0.219, 0.279) 0.261 (0.227, 0.294) 0.012 (‐0.012, 0.035) 0.292CD (μmmol/mmol LDL‐C) 29.013 (26.205, 31.821) 28.873 (25.827, 31.920) ‐0.139 (‐1.320, 1.040) 31.074 (27.481, 34.667) 30.508 (26.682, 34.334) ‐0.566 (‐2.160, 1.030) 0.672Protein Thiols (μM) 390.64 (373.59, 407.68) 422.82 (405.67, 438.98) 32.18 (13.00, 51.37)* 396.78 (376.10, 417.46) 413.58 (389.08, 438.08) 16.80 (‐10.01, 43.69) 0.359
High‐Fibre Diet(n=58)
Low‐GI Pulse Diet(n=55)
Abbreviations: TBARS denote thiobarbituric acid reactive substances; CD conjugated dienes *Significant difference within treatment by 2‐tailed paired t test (p<0.05) †P values represent the significance of differences between treatment as changes from baseline by 2‐tailed paired t test (p<0.05) ‡ Values are expressed as means with their 95% confidence intervals
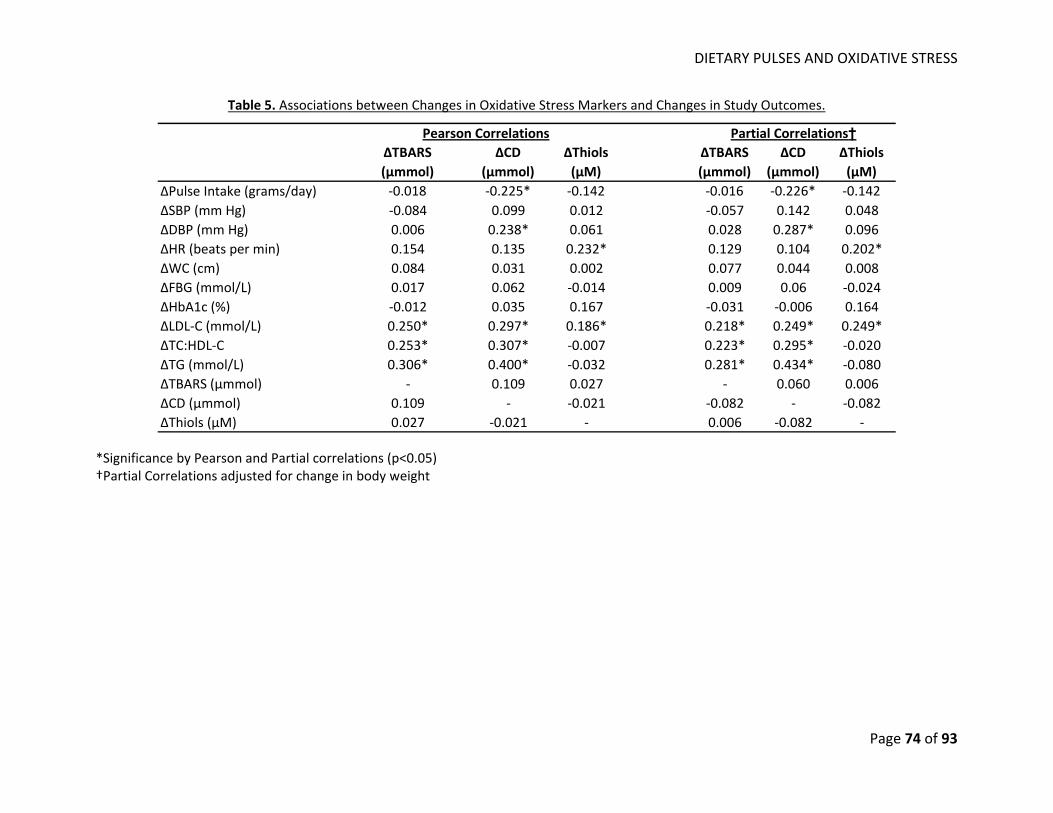
DIETARY PULSES AND OXIDATIVE STRESS
Page 74 of 93
Table 5. Associations between Changes in Oxidative Stress Markers and Changes in Study Outcomes.
∆TBARS(μmmol)
∆CD(μmmol)
∆Thiols(μM)
∆TBARS(μmmol)
∆CD(μmmol)
∆Thiols(μM)
∆Pulse Intake (grams/day) ‐0.018 ‐0.225* ‐0.142 ‐0.016 ‐0.226* ‐0.142∆SBP (mm Hg) ‐0.084 0.099 0.012 ‐0.057 0.142 0.048∆DBP (mm Hg) 0.006 0.238* 0.061 0.028 0.287* 0.096∆HR (beats per min) 0.154 0.135 0.232* 0.129 0.104 0.202*∆WC (cm) 0.084 0.031 0.002 0.077 0.044 0.008∆FBG (mmol/L) 0.017 0.062 ‐0.014 0.009 0.06 ‐0.024∆HbA1c (%) ‐0.012 0.035 0.167 ‐0.031 ‐0.006 0.164∆LDL‐C (mmol/L) 0.250* 0.297* 0.186* 0.218* 0.249* 0.249*∆TC:HDL‐C 0.253* 0.307* ‐0.007 0.223* 0.295* ‐0.020∆TG (mmol/L) 0.306* 0.400* ‐0.032 0.281* 0.434* ‐0.080∆TBARS (μmmol) ‐ 0.109 0.027 ‐ 0.060 0.006∆CD (μmmol) 0.109 ‐ ‐0.021 ‐0.082 ‐ ‐0.082∆Thiols (μM) 0.027 ‐0.021 ‐ 0.006 ‐0.082 ‐
Pearson Correlations Partial Correlations†
*Significance by Pearson and Partial correlations (p<0.05) †Partial Correlations adjusted for change in body weight
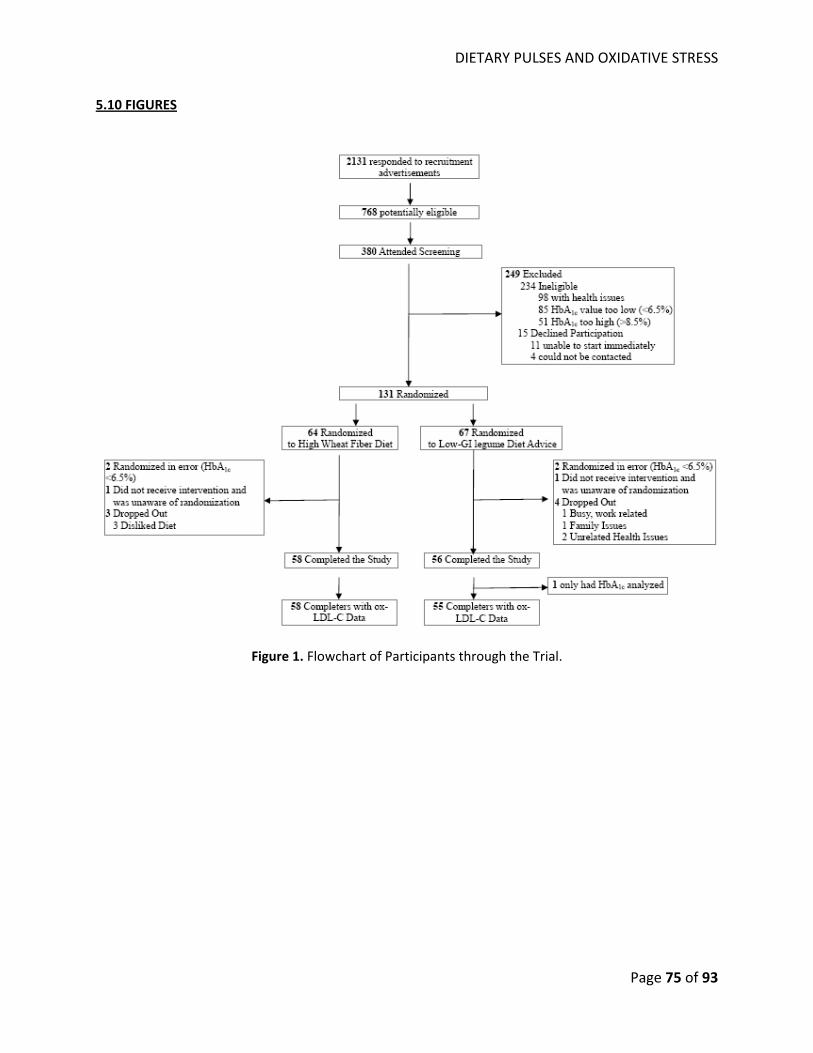
DIETARY PULSES AND OXIDATIVE STRESS
Page 75 of 93
5.10 FIGURES
Figure 1. Flowchart of Participants through the Trial.
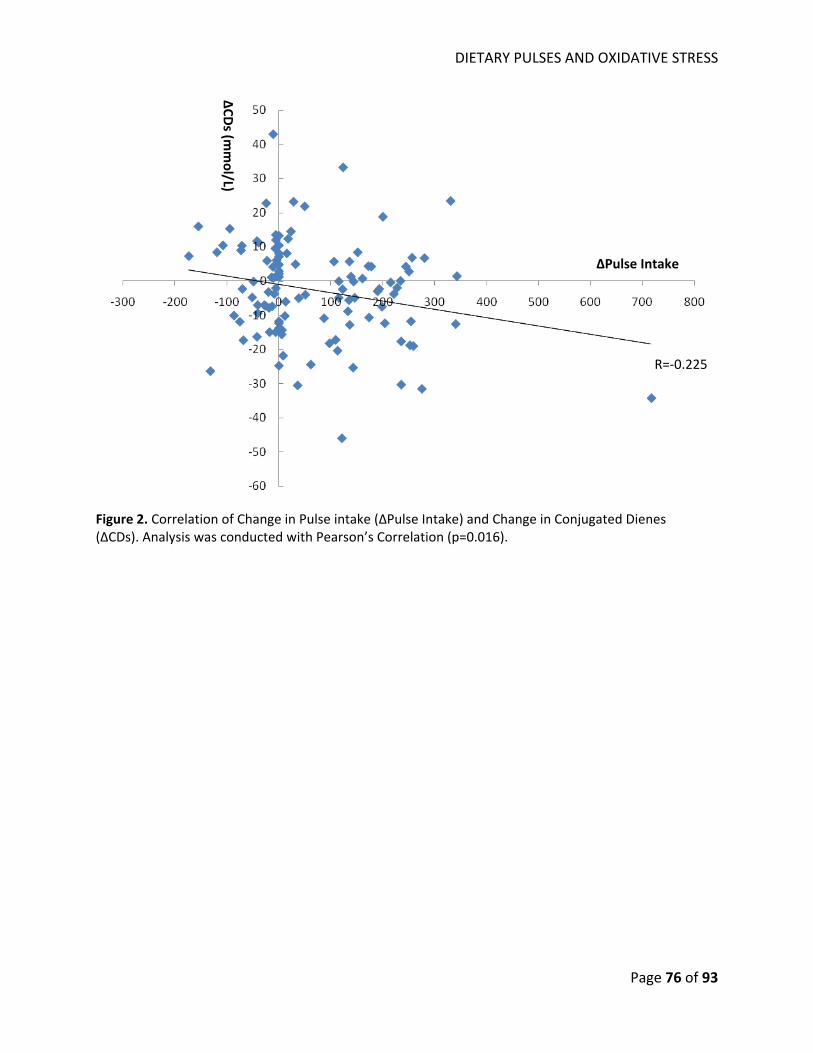
DIETARY PULSES AND OXIDATIVE STRESS
Page 76 of 93
Figure 2. Correlation of Change in Pulse intake (∆Pulse Intake) and Change in Conjugated Dienes (∆CDs). Analysis was conducted with Pearson’s Correlation (p=0.016).
R=‐0.225
∆Pulse Intake
∆CD
s (mmol/L)

OVERALL DISCUSSION AND LIMITATIONS
Page 77 of 93
CHAPTER VI‐ OVERALL DISCUSSION AND LIMITATIONS
OVERALL DISCUSSION AND LIMITATIONS
Page 78 of 93
6.1 OVERALL DISCUSSION
Two studies have been undertaken to assess the effects of dietary pulses (beans, chickpeas,
lentils, and peas) on oxidative stress and lipid measures associated with cardiovascular risk. Our
systematic review and meta‐analysis found that high dietary pulse consumption compared to control
diets reduced LDL‐C by 0.17 mmol/L or 5% from baseline, but found no significant effects on secondary
lipid targets of CVD risk including Apo‐B and non‐HDL‐C. Moreover, although our intervention trial,
which emphasized dietary pulse intake as a means to lower glycemic index, did not significantly reduce
oxidative stress markers compared to a high fibre control diet, an inverse correlation was observed
between dietary pulse intake and one of the oxidative stress markers. Taken together, our results
suggest that a diet high in dietary pulses may improve cardiovascular risk through lowering levels of LDL‐
C.
Our results support previous findings from other studies. Our systematic review and meta‐
analysis of 26 trials found dietary pulse intervention compared to control diets reduced LDL‐C by 0.17
mmol/L. These results are in agreement with 2 previous meta‐analyses assessing dietary pulse intakes
which have also reported significant LDL‐C reductions13, 83. Similarly, our results for oxidative stress
markers are congruent with previous findings. A previous human feeding trial of 30 obese participants
on a high dietary pulse diet compared to a typical American diet had also found no differences in
oxidative damage using measurements of malendialdehyde (MDA) and isoprostane‐F2α. Despite these
findings, the investigators still reported significant reductions of serum ox‐LDL‐C32. Our feeding trial
suggests that high dietary pulse intake may not directly reduce levels of oxidative stress, however, they
may still reduce levels of ox‐LDL‐C by lowering the number of LDL‐C particles available for oxidation as
suggested by our meta‐analysis. Consequently, lower levels of LDL‐C available for oxidation after dietary
pulse consumption may reduce CVD risk by lowering LDL‐C particle size.
OVERALL DISCUSSION AND LIMITATIONS
Page 79 of 93
Several hypotheses have been generated in understanding the mechanism of action with
respect to the lipid‐lowering effects of dietary pulses. Dietary pulses are high in fibre and have a low‐
glycemic index, both of which are associated with reduced lipid levels and CHD risk15, 118. Possibly, more
important is that dietary pulses and common to all legumes including soy and peanuts, is that they are
all high in a protein called 7S globulin. This protein fraction has been considered responsible for the
hypolipidemic effect of soy proteins18. Prospective cohort studies have shown high intakes of legumes
(dietary pulse and soy/peanuts) are associated with reduced risk of CHD and stroke80, 81 but prospective
cohort study has been conducted to date to assess the association of dietary pulse intake on
cardiovascular events. More studies are needed to understand whether higher pulse intake can lower
the risk of CVD hard endpoints such as myocardial infarctions, stroke, and CVD‐related mortality.
6.2 LIMITATIONS
6.2.1 SYSTEMATIC REVIEW AND META‐ANALYSIS
Limitations of our systematic review and meta‐analysis include: 1) the majority of studies were
of low quality (MQS<8), short duration (<3 months), and did not report enough data to judge risk of bias;
2) the majority the non‐HDL‐C values had to be calculated and SDs imputed. 3) only one trial provided
Apo‐B data. These observations reinforce the need for longer, better‐designed clinical trials that report
data more systematically and transparently to better understand the effect of dietary pulses on serum
lipids as they are important biomarkers of cardiovascular health.
6.2.2 DIETARY INTERVENTION TRIAL
Limitations of our dietary intervention trial include: 1) the analysis on oxidative stress levels
represents a secondary analysis which was not sufficiently powered to detect significant treatment
differences in markers of oxidative damage; 2) adjustments for antioxidants found in foods and
supplementations were not possible. The use of Oxygen Radical Absorbance Capacity (ORAC) values to
measure the antioxidant capacity of foods is discouraged by the USDA, citing reasons that the values
OVERALL DISCUSSION AND LIMITATIONS
Page 80 of 93
were tested in vitro and the antioxidant effects cannot be confidently extrapolated to human
physiology117. The antioxidant supplements was not adjusted for in our analysis because the frequency
of use was not different between the 2 treatment arms at baseline and at the end of the trial (data not
shown); 3. we did not directly measure levels of ox‐LDL‐C but used markers of oxidative stress (TBARS,
conjugated dienes, and protein thiols) as surrogates. As these markers are rapidly degraded in vivo, they
may not be representative of the level of ox‐LDL‐C in circulation. There is a need for future trials to
improve the existing evidence on the effects of dietary pulses on ox‐LDL‐C.
6.3 MECHANISM OF ACTION
The mechanism by which dietary pulses lower cholesterol levels is unclear; however, the effect
can be broadly divided into 2 pathways: extrinsic and intrinsic. The extrinsic pathway proposes that
dietary pulses reduce serum cholesterol by displacing saturated and trans fat intake57, 82. High saturated
and trans fat intake has been associated with animal protein intake which has also been associated with
increased cardiovascular risk119. Possibly more importantly, dietary pulses are high in 7S globulins, a
peptide which has been shown to increase uptake and degradation of LDL‐C in human hepatic cells, and
is also hypothesized to confer the hypocholesterolemic effects of soybeans18. Dietary pulses are also
high in soluble fibre which is known to bind to dietary cholesterol in the intestine and prevent its
absorption85, 86. Of the intrinsic pathway proposes that in addition to binding to dietary cholesterol, the
viscous soluble fibre in dietary pulses can bind to bile acids to prevent its re‐absorption. Consequently,
there is an increase in the production of bile acids by the liver, which decreases the liver pool of
cholesterol and increases uptake of serum cholesterol by the liver thereby decreasing circulating
cholesterol in the blood22. Further fermentation of fibre in the colon produces short chain fatty acids
(SCFA) which have been associated with inhibition of cholesterol synthesis19, 23.
OVERALL DISCUSSION AND LIMITATIONS
Page 81 of 93
6.4 CLINICAL IMPLICATIONS
Dietary patterns that emphasize dietary pulses can lower the risk for CVD. Although we did not
show a significant difference on oxidative stress marker with higher dietary pulse intake, our systematic
review and meta‐analysis found a significant LDL‐C reduction in diets that emphasize dietary pulse
intake. Our data also reinforce the evidence from and support existing recommendations for heart
healthy dietary patterns of which pulses are a key component: Portfolio, DASH, and Mediterranean3‐6.
The median dietary pulse intake in our meta‐analyses was of 130g/day (~1.5 servings/day), a higher
intake target than that proposed by the AHA of ≥4‐5 servings/week. Achieving a high level of intake may
prove a challenge in some Western countries, given that current U.S. level of intake is 0.2 serving/day82.
However, a dietary pulse intake of ~1.5 servings/d is very reasonable as this level is currently consumed
by many cultures without reports of side effects that would limit consumption. As the majority of these
trials were conducted on a background heart‐healthy NCEP‐like diet, including >20‐25g/d of fibre and
<10%E of saturated fat, these results can be considered in addition to the 5‐10% LDL‐C lowering
expected from these diets alone53. Whereas guidelines have largely focused on dietary pulses as part of
a healthy dietary pattern in the prevention and management of diabetes and CVD, these data support
lipid‐lowering and cardiovascular risk reduction recommendations.
6.5 FUTURE DIRECTIONS
Future research is needed. The reducing effects of dietary pulses on LDL‐C has been shown in
our and 2 previous meta‐analyses13, 83; therefore future analyses should focus on assessing the effects of
dietary pulses on other established lipid endpoints. More importantly, human feeding trials measuring
Apo‐B is needed. Our analysis had only identified one trial that met the inclusion criteria24; therefore it is
likely we were under‐powered to accurately detect the effects of dietary pulses on Apo‐B. Secondly,
there is an urgent need for further large, long‐term, high‐quality trials to assess the effect of high
vegetable protein diets on oxidative stress and other major cardiovascular risk factors including body
OVERALL DISCUSSION AND LIMITATIONS
Page 82 of 93
weight, glycemic control, lipids, and blood pressure. To identify research gaps and provide a more
precise estimate of the effect of vegetable proteins on these endpoints, our group has undertaken a
series of systematic reviews and meta‐analyses of randomized trials. Results from this project will guide
our understanding of the role of vegetable protein in cardiovascular risk reduction. Lastly, although
dietary intervention trials have shown favourable effects of dietary pulses on biomarkers of CVD risk, no
prospective cohort studies have assessed specifically the association of dietary pulses on hard endpoints
of CVD. Most observational studies have reported high legume intakes which include dietary pulses and
soy or peanuts, have favourable effects on CVD risk13, 83, but none have assessed legume intake
independent of soy or peanuts. More studies are needed to understand the effects of dietary pulses on
CHD or stroke risk. Lastly, the role of ox‐LDL‐C in human cardiovascular health is uncertain. Although
animal and cell culture studies have supported the hypothesis of ox‐LDL‐C and CVD risk35, large human
clinical trials supplementing dietary patterns with anti‐oxidants have reported no improvements on
incidence of CHD and stroke120, 121. Consequently, no major dyslipidemic guidelines including NCEP‐ATP
III and Canadian Cardiovascular Society (CCS) have recognized and set target goals for serum ox‐LDL‐C or
have made recommendations for anti‐oxidant supplements for reducing cardiovascular risk3, 4. The role
of ox‐LDL‐C needs to be more directly assessed in relation to cardiovascular outcomes.

CONCLUSIONS
Page 83 of 93
CHAPTER VII‐ CONCLUSIONS
CONCLUSIONS
Page 84 of 93
7.1 CONCLUSIONS Dietary patterns that emphasize dietary pulses (beans, chickpeas, lentils, and peas) improve
cardiovascular risk by reducing LDL‐C levels but not oxidative stress.
This thesis work demonstrated the following:
1. In a systematic review and meta‐analysis of 26 randomized trials (n= 1013), diets
emphasizing dietary pulses significantly lowered LDL‐C compared with isocaloric control
diets (mean difference= ‐0.17 mmol/L [95% CI: ‐0.25, ‐0.09]; p<0.0001). No treatment
effects were observed for Apo‐B and non‐HDL‐C.
2. In a secondary endpoint analysis of a feeding trial in 113 participants, there were no
significant differences between a high dietary pulse diet as a means to lower the glycemic
index to a high fibre comparator diet on markers of oxidative stress including thiobarbituric
acid reactive substances (TBARS), conjugated dienes (CDs), and protein thiols.

REFERENCES
Page 85 of 93
CHAPTER VIII‐ REFERENCES
REFERENCES
Page 86 of 93
8.1 REFERENCES
1. Yusuf S, Hawken S, Ounpuu S, Dans T, Avezum A, Lanas F, McQueen M, Budaj A, Pais P, Varigos J, Lisheng L, Investigators IS. Effect of potentially modifiable risk factors associated with myocardial infarction in 52 countries (the interheart study): Case‐control study. Lancet. 2004;364:937‐952
2. Law MR, Wald NJ, Rudnicka AR. Quantifying effect of statins on low density lipoprotein cholesterol, ischaemic heart disease, and stroke: Systematic review and meta‐analysis. Bmj. 2003;326:1423
3. Anderson TJ, Gregoire J, Hegele RA, Couture P, Mancini GB, McPherson R, Francis GA, Poirier P, Lau DC, Grover S, Genest J, Jr., Carpentier AC, Dufour R, Gupta M, Ward R, Leiter LA, Lonn E, Ng DS, Pearson GJ, Yates GM, Stone JA, Ur E. 2012 update of the canadian cardiovascular society guidelines for the diagnosis and treatment of dyslipidemia for the prevention of cardiovascular disease in the adult. The Canadian journal of cardiology. 2013;29:151‐167
4. National Cholesterol Education Program Expert Panel on Detection E, Treatment of High Blood Cholesterol in A. Third report of the national cholesterol education program (ncep) expert panel on detection, evaluation, and treatment of high blood cholesterol in adults (adult treatment panel iii) final report. Circulation. 2002;106:3143‐3421
5. Dworatzek PD AK, Gougeon R, Husein N, Sievenpiper JL, Williams SL. Canadian diabetes association 2013 clinical practice guidelines for the prevention and management of diabetes in canada: Nutrition therapy. Canadian Journal of Diabetes. 2013;37:S46‐S55
6. Association AD. 2013 clinical practice recommendations. Diabetes Care. 2013;36:S1‐ S110 7. Stampfer MJ, Hu FB, Manson JE, Rimm EB, Willett WC. Primary prevention of coronary heart
disease in women through diet and lifestyle. The New England journal of medicine. 2000;343:16‐22
8. Jenkins DJ, Kendall CW, Augustin LS, Mitchell S, Sahye‐Pudaruth S, Blanco Mejia S, Chiavaroli L, Mirrahimi A, Ireland C, Bashyam B, Vidgen E, de Souza RJ, Sievenpiper JL, Coveney J, Leiter LA, Josse RG. Effect of legumes as part of a low glycemic index diet on glycemic control and cardiovascular risk factors in type 2 diabetes mellitus: A randomized controlled trial. Archives of internal medicine. 2012;172:1653‐1660
9. Sacks FM, Svetkey LP, Vollmer WM, Appel LJ, Bray GA, Harsha D, Obarzanek E, Conlin PR, Miller ER, 3rd, Simons‐Morton DG, Karanja N, Lin PH, Group DA‐SCR. Effects on blood pressure of reduced dietary sodium and the dietary approaches to stop hypertension (dash) diet. Dash‐sodium collaborative research group. The New England journal of medicine. 2001;344:3‐10
10. Zhang Z, Lanza E, Kris‐Etherton PM, Colburn NH, Bagshaw D, Rovine MJ, Ulbrecht JS, Bobe G, Chapkin RS, Hartman TJ. A high legume low glycemic index diet improves serum lipid profiles in men. Lipids. 2010;45:765‐775
11. Ambring A, Friberg P, Axelsen M, Laffrenzen M, Taskinen MR, Basu S, Johansson M. Effects of a mediterranean‐inspired diet on blood lipids, vascular function and oxidative stress in healthy subjects. Clinical science. 2004;106:519‐525
12. Barnard ND, Cohen J, Jenkins DJ, Turner‐McGrievy G, Gloede L, Green A, Ferdowsian H. A low‐fat vegan diet and a conventional diabetes diet in the treatment of type 2 diabetes: A randomized, controlled, 74‐wk clinical trial. The American journal of clinical nutrition. 2009;89:1588S‐1596S
13. Bazzano LA, Thompson AM, Tees MT, Nguyen CH, Winham DM. Non‐soy legume consumption lowers cholesterol levels: A meta‐analysis of randomized controlled trials. Nutrition, metabolism, and cardiovascular diseases : NMCD. 2011;21:94‐103
REFERENCES
Page 87 of 93
14. Jenkins DJ, Wolever TM, Taylor RH, Ghafari H, Jenkins AL, Barker H, Jenkins MJ. Rate of digestion of foods and postprandial glycaemia in normal and diabetic subjects. British medical journal. 1980;281:14‐17
15. Pereira MA, O'Reilly E, Augustsson K, Fraser GE, Goldbourt U, Heitmann BL, Hallmans G, Knekt P, Liu S, Pietinen P, Spiegelman D, Stevens J, Virtamo J, Willett WC, Ascherio A. Dietary fiber and risk of coronary heart disease: A pooled analysis of cohort studies. Archives of internal medicine. 2004;164:370‐376
16. Mirrahimi A, de Souza RJ, Chiavaroli L, Sievenpiper JL, Beyene J, Hanley AJ, Augustin LS, Kendall CW, Jenkins DJ. Associations of glycemic index and load with coronary heart disease events: A systematic review and meta‐analysis of prospective cohorts. Journal of the American Heart Association. 2012;1:e000752
17. Kelemen LE, Kushi LH, Jacobs DR, Jr., Cerhan JR. Associations of dietary protein with disease and mortality in a prospective study of postmenopausal women. American journal of epidemiology. 2005;161:239‐249
18. Lovati MR, Manzoni C, Corsini A, Granata A, Fumagalli R, Sirtori CR. 7s globulin from soybean is metabolized in human cell cultures by a specific uptake and degradation system. The Journal of nutrition. 1996;126:2831‐2842
19. Anderson JW, Story L, Sieling B, Chen WJ, Petro MS, Story J. Hypocholesterolemic effects of oat‐bran or bean intake for hypercholesterolemic men. The American journal of clinical nutrition. 1984;40:1146‐1155
20. Belski R, Mori TA, Puddey IB, Sipsas S, Woodman RJ, Ackland TR, Beilin LJ, Dove ER, Carlyon NB, Jayaseena V, Hodgson JM. Effects of lupin‐enriched foods on body composition and cardiovascular disease risk factors: A 12‐month randomized controlled weight loss trial. International journal of obesity. 2011;35:810‐819
21. Cobiac L, McArthur R, Nestel PJ. Can eating baked beans lower plasma cholesterol? European journal of clinical nutrition. 1990;44:819‐822
22. Duane WC. Effects of legume consumption on serum cholesterol, biliary lipids, and sterol metabolism in humans. Journal of lipid research. 1997;38:1120‐1128
23. Finley JW, Burrell JB, Reeves PG. Pinto bean consumption changes scfa profiles in fecal fermentations, bacterial populations of the lower bowel, and lipid profiles in blood of humans. The Journal of nutrition. 2007;137:2391‐2398
24. Gravel K LS, Asselin G, Dufresne A, Lemay A, Forest JC, Dodin S. Effects of pulse consumption in women presenting components of the metabolic syndrome: A randomized controlled trial. Mediterranean Journal of Nutrition and Metabolism. 2010;3:143‐151
25. Hermsdorff HH, Zulet MA, Abete I, Martinez JA. A legume‐based hypocaloric diet reduces proinflammatory status and improves metabolic features in overweight/obese subjects. European journal of nutrition. 2011;50:61‐69
26. Mackay S, Ball MJ. Do beans and oat bran add to the effectiveness of a low‐fat diet? European journal of clinical nutrition. 1992;46:641‐648
27. Pittaway JK, Ahuja KD, Cehun M, Chronopoulos A, Robertson IK, Nestel PJ, Ball MJ. Dietary supplementation with chickpeas for at least 5 weeks results in small but significant reductions in serum total and low‐density lipoprotein cholesterols in adult women and men. Annals of nutrition & metabolism. 2006;50:512‐518
28. Pittaway JK, Ahuja KD, Robertson IK, Ball MJ. Effects of a controlled diet supplemented with chickpeas on serum lipids, glucose tolerance, satiety and bowel function. Journal of the American College of Nutrition. 2007;26:334‐340
29. Shams H TF, EntezariM, Abadi A. Effects of cooked lentils on gycemic control and blood lipids of patients with type 2 diabetes. ARYA Atherosclerosis Journal. 2008;4:1‐5
REFERENCES
Page 88 of 93
30. Hodgson JM, Lee YP, Puddey IB, Sipsas S, Ackland TR, Beilin LJ, Belski R, Mori TA. Effects of increasing dietary protein and fibre intake with lupin on body weight and composition and blood lipids in overweight men and women. International journal of obesity. 2010;34:1086‐1094
31. Jenkins DJ, Kendall CW, Vidgen E, Augustin LS, van Erk M, Geelen A, Parker T, Faulkner D, Vuksan V, Josse RG, Leiter LA, Connelly PW. High‐protein diets in hyperlipidemia: Effect of wheat gluten on serum lipids, uric acid, and renal function. The American journal of clinical nutrition. 2001;74:57‐63
32. Crujeiras AB, Parra D, Abete I, Martinez JA. A hypocaloric diet enriched in legumes specifically mitigates lipid peroxidation in obese subjects. Free radical research. 2007;41:498‐506
33. Albertini R, Moratti R, De Luca G. Oxidation of low‐density lipoprotein in atherosclerosis from basic biochemistry to clinical studies. Current molecular medicine. 2002;2:579‐592
34. Steinberg D, Parthasarathy S, Carew TE, Khoo JC, Witztum JL. Beyond cholesterol. Modifications of low‐density lipoprotein that increase its atherogenicity. The New England journal of medicine. 1989;320:915‐924
35. Steinbrecher UP, Zhang HF, Lougheed M. Role of oxidatively modified ldl in atherosclerosis. Free radical biology & medicine. 1990;9:155‐168
36. Halton TL, Willett WC, Liu S, Manson JE, Albert CM, Rexrode K, Hu FB. Low‐carbohydrate‐diet score and the risk of coronary heart disease in women. The New England journal of medicine. 2006;355:1991‐2002
37. Hu FB, Willett WC. Optimal diets for prevention of coronary heart disease. JAMA : the journal of the American Medical Association. 2002;288:2569‐2578
38. Go AS, Mozaffarian D, Roger VL, Benjamin EJ, Berry JD, Borden WB, Bravata DM, Dai S, Ford ES, Fox CS, Franco S, Fullerton HJ, Gillespie C, Hailpern SM, Heit JA, Howard VJ, Huffman MD, Kissela BM, Kittner SJ, Lackland DT, Lichtman JH, Lisabeth LD, Magid D, Marcus GM, Marelli A, Matchar DB, McGuire DK, Mohler ER, Moy CS, Mussolino ME, Nichol G, Paynter NP, Schreiner PJ, Sorlie PD, Stein J, Turan TN, Virani SS, Wong ND, Woo D, Turner MB, American Heart Association Statistics C, Stroke Statistics S. Executive summary: Heart disease and stroke statistics‐‐2013 update: A report from the american heart association. Circulation. 2013;127:143‐152
39. Canada PHAo. 2009 tracking heart disease and stroke in canada. 2009 40. Munro JM, Cotran RS. The pathogenesis of atherosclerosis: Atherogenesis and inflammation.
Laboratory investigation; a journal of technical methods and pathology. 1988;58:249‐261 41. D'Agostino RB, Wolf PA, Belanger AJ, Kannel WB. Stroke risk profile: Adjustment for
antihypertensive medication. The framingham study. Stroke; a journal of cerebral circulation. 1994;25:40‐43
42. Castelli WP, Anderson K, Wilson PW, Levy D. Lipids and risk of coronary heart disease. The framingham study. Annals of epidemiology. 1992;2:23‐28
43. Nissen SE, Wolski K. Effect of rosiglitazone on the risk of myocardial infarction and death from cardiovascular causes. The New England journal of medicine. 2007;356:2457‐2471
44. Ray KK, Seshasai SR, Erqou S, Sever P, Jukema JW, Ford I, Sattar N. Statins and all‐cause mortality in high‐risk primary prevention: A meta‐analysis of 11 randomized controlled trials involving 65,229 participants. Archives of internal medicine. 2010;170:1024‐1031
45. Cholesterol Treatment Trialists C, Baigent C, Blackwell L, Emberson J, Holland LE, Reith C, Bhala N, Peto R, Barnes EH, Keech A, Simes J, Collins R. Efficacy and safety of more intensive lowering of ldl cholesterol: A meta‐analysis of data from 170,000 participants in 26 randomised trials. Lancet. 2010;376:1670‐1681
46. Mancini GBJ HR, Leiter LA. Canadian diabetes association 2013 clinical practice guidelines for the prevention and management of diabetes in canada: Dyslipidemia. Canadian Journal of Diabetes. 2013;37:S110‐S116
REFERENCES
Page 89 of 93
47. Singh U, Devaraj S, Jialal I. Vitamin e, oxidative stress, and inflammation. Annual review of nutrition. 2005;25:151‐174
48. Blaier O, Lishner M, Elis A. Managing statin‐induced muscle toxicity in a lipid clinic. Journal of clinical pharmacy and therapeutics. 2011;36:336‐341
49. Saha SA, Kizhakepunnur LG, Bahekar A, Arora RR. The role of fibrates in the prevention of cardiovascular disease‐‐a pooled meta‐analysis of long‐term randomized placebo‐controlled clinical trials. American heart journal. 2007;154:943‐953
50. Group HTC. Hps2‐thrive randomized placebo‐controlled trial in 25 673 high‐risk patients of er niacin/laropiprant: Trial design, pre‐specified muscle and liver outcomes, and reasons for stopping study treatment. European heart journal. 2013;34:1279‐1291
51. Keys A, Menotti A, Karvonen MJ, Aravanis C, Blackburn H, Buzina R, Djordjevic BS, Dontas AS, Fidanza F, Keys MH, et al. The diet and 15‐year death rate in the seven countries study. American journal of epidemiology. 1986;124:903‐915
52. Hu FB. Globalization of food patterns and cardiovascular disease risk. Circulation. 2008;118:1913‐1914
53. Jenkins DJ, Jones PJ, Lamarche B, Kendall CW, Faulkner D, Cermakova L, Gigleux I, Ramprasath V, de Souza R, Ireland C, Patel D, Srichaikul K, Abdulnour S, Bashyam B, Collier C, Hoshizaki S, Josse RG, Leiter LA, Connelly PW, Frohlich J. Effect of a dietary portfolio of cholesterol‐lowering foods given at 2 levels of intensity of dietary advice on serum lipids in hyperlipidemia: A randomized controlled trial. JAMA : the journal of the American Medical Association. 2011;306:831‐839
54. Estruch R, Ros E, Salas‐Salvado J, Covas MI, Corella D, Aros F, Gomez‐Gracia E, Ruiz‐Gutierrez V, Fiol M, Lapetra J, Lamuela‐Raventos RM, Serra‐Majem L, Pinto X, Basora J, Munoz MA, Sorli JV, Martinez JA, Martinez‐Gonzalez MA, Investigators PS. Primary prevention of cardiovascular disease with a mediterranean diet. The New England journal of medicine. 2013;368:1279‐1290
55. Hu FB, Rimm EB, Stampfer MJ, Ascherio A, Spiegelman D, Willett WC. Prospective study of major dietary patterns and risk of coronary heart disease in men. The American journal of clinical nutrition. 2000;72:912‐921
56. Astrup A, Dyerberg J, Elwood P, Hermansen K, Hu FB, Jakobsen MU, Kok FJ, Krauss RM, Lecerf JM, LeGrand P, Nestel P, Riserus U, Sanders T, Sinclair A, Stender S, Tholstrup T, Willett WC. The role of reducing intakes of saturated fat in the prevention of cardiovascular disease: Where does the evidence stand in 2010? The American journal of clinical nutrition. 2011;93:684‐688
57. Hu FB. Plant‐based foods and prevention of cardiovascular disease: An overview. The American journal of clinical nutrition. 2003;78:544S‐551S
58. Osler M, Heitmann BL, Gerdes LU, Jorgensen LM, Schroll M. Dietary patterns and mortality in danish men and women: A prospective observational study. The British journal of nutrition. 2001;85:219‐225
59. Fung TT, Rimm EB, Spiegelman D, Rifai N, Tofler GH, Willett WC, Hu FB. Association between dietary patterns and plasma biomarkers of obesity and cardiovascular disease risk. The American journal of clinical nutrition. 2001;73:61‐67
60. Heidemann C, Schulze MB, Franco OH, van Dam RM, Mantzoros CS, Hu FB. Dietary patterns and risk of mortality from cardiovascular disease, cancer, and all causes in a prospective cohort of women. Circulation. 2008;118:230‐237
61. Rao V, Al‐Weshahy A. Plant‐based diets and control of lipids and coronary heart disease risk. Current atherosclerosis reports. 2008;10:478‐485
62. Key TJ, Appleby PN, Rosell MS. Health effects of vegetarian and vegan diets. The Proceedings of the Nutrition Society. 2006;65:35‐41
REFERENCES
Page 90 of 93
63. Jenkins DJ, Kendall CW, Marchie A, Jenkins AL, Augustin LS, Ludwig DS, Barnard ND, Anderson JW. Type 2 diabetes and the vegetarian diet. The American journal of clinical nutrition. 2003;78:610S‐616S
64. Hu FB. Protein, body weight, and cardiovascular health. The American journal of clinical nutrition. 2005;82:242S‐247S
65. Knekt P, Reunanen A, Jarvinen R, Seppanen R, Heliovaara M, Aromaa A. Antioxidant vitamin intake and coronary mortality in a longitudinal population study. American journal of epidemiology. 1994;139:1180‐1189
66. Hung HC, Joshipura KJ, Jiang R, Hu FB, Hunter D, Smith‐Warner SA, Colditz GA, Rosner B, Spiegelman D, Willett WC. Fruit and vegetable intake and risk of major chronic disease. Journal of the National Cancer Institute. 2004;96:1577‐1584
67. Sauvaget C, Nagano J, Hayashi M, Yamada M. Animal protein, animal fat, and cholesterol intakes and risk of cerebral infarction mortality in the adult health study. Stroke; a journal of cerebral circulation. 2004;35:1531‐1537
68. Iso H, Stampfer MJ, Manson JE, Rexrode K, Hu F, Hennekens CH, Colditz GA, Speizer FE, Willett WC. Prospective study of fat and protein intake and risk of intraparenchymal hemorrhage in women. Circulation. 2001;103:856‐863
69. Anderson JW, Johnstone BM, Cook‐Newell ME. Meta‐analysis of the effects of soy protein intake on serum lipids. The New England journal of medicine. 1995;333:276‐282
70. Zhang X, Shu XO, Gao YT, Yang G, Li Q, Li H, Jin F, Zheng W. Soy food consumption is associated with lower risk of coronary heart disease in chinese women. The Journal of nutrition. 2003;133:2874‐2878
71. Jenkins DJ, Srichaikul K, Wong JM, Kendall CW, Bashyam B, Vidgen E, Lamarche B, Rao AV, Jones PJ, Josse RG, Jackson CJ, Ng V, Leong T, Leiter LA. Supplemental barley protein and casein similarly affect serum lipids in hypercholesterolemic women and men. The Journal of nutrition. 2010;140:1633‐1637
72. Jenkins DJ, Wong JM, Kendall CW, Esfahani A, Ng VW, Leong TC, Faulkner DA, Vidgen E, Greaves KA, Paul G, Singer W. The effect of a plant‐based low‐carbohydrate ("eco‐atkins") diet on body weight and blood lipid concentrations in hyperlipidemic subjects. Archives of internal medicine. 2009;169:1046‐1054
73. Nation WHOFaAOotU. Cereals, pulses, legumes and vegetable proteins, 1st ed. Rome, Italy; 2007.
74. Organization WH. The world health report 2010. 2010 75. Canada HMtQiRo. Research gaps and priorities related to health claim validation in: Agriculture
and agri‐food canada. 2010 76. American Heart Association Nutrition C, Lichtenstein AH, Appel LJ, Brands M, Carnethon M,
Daniels S, Franch HA, Franklin B, Kris‐Etherton P, Harris WS, Howard B, Karanja N, Lefevre M, Rudel L, Sacks F, Van Horn L, Winston M, Wylie‐Rosett J. Diet and lifestyle recommendations revision 2006: A scientific statement from the american heart association nutrition committee. Circulation. 2006;114:82‐96
77. (EASD) DaNSGDotEAftSoD. Evidence‐based nutritional approaches to the treatment and prevention of diabetes mellitus. Nutrition, Metabolism & Cardiovascular Diseases. 2004;14:373‐394
78. Chobanian AV, Bakris GL, Black HR, Cushman WC, Green LA, Izzo JL, Jr., Jones DW, Materson BJ, Oparil S, Wright JT, Jr., Roccella EJ, Joint National Committee on Prevention DE, Treatment of High Blood Pressure. National Heart L, Blood I, National High Blood Pressure Education Program Coordinating C. Seventh report of the joint national committee on prevention, detection, evaluation, and treatment of high blood pressure. Hypertension. 2003;42:1206‐1252
REFERENCES
Page 91 of 93
79. CHEP H. 2013 chep recommendations: Lifestyle management. 2013 80. Bernstein AM, Sun Q, Hu FB, Stampfer MJ, Manson JE, Willett WC. Major dietary protein sources
and risk of coronary heart disease in women. Circulation. 2010;122:876‐883 81. Bazzano LA, He J, Ogden LG, Loria C, Vupputuri S, Myers L, Whelton PK. Legume consumption
and risk of coronary heart disease in us men and women: Nhanes i epidemiologic follow‐up study. Archives of internal medicine. 2001;161:2573‐2578
82. Mitchell DC, Lawrence FR, Hartman TJ, Curran JM. Consumption of dry beans, peas, and lentils could improve diet quality in the us population. Journal of the American Dietetic Association. 2009;109:909‐913
83. Anderson JW, Major AW. Pulses and lipaemia, short‐ and long‐term effect: Potential in the prevention of cardiovascular disease. The British journal of nutrition. 2002;88 Suppl 3:S263‐271
84. Siri‐Tarino PW, Sun Q, Hu FB, Krauss RM. Saturated fat, carbohydrate, and cardiovascular disease. The American journal of clinical nutrition. 2010;91:502‐509
85. Anderson JW, Gustafson NJ, Spencer DB, Tietyen J, Bryant CA. Serum lipid response of hypercholesterolemic men to single and divided doses of canned beans. The American journal of clinical nutrition. 1990;51:1013‐1019
86. Abeysekara S, Chilibeck PD, Vatanparast H, Zello GA. A pulse‐based diet is effective for reducing total and ldl‐cholesterol in older adults. The British journal of nutrition. 2012;108 Suppl 1:S103‐110
87. Sievenpiper JL, Kendall CW, Esfahani A, Wong JM, Carleton AJ, Jiang HY, Bazinet RP, Vidgen E, Jenkins DJ. Effect of non‐oil‐seed pulses on glycaemic control: A systematic review and meta‐analysis of randomised controlled experimental trials in people with and without diabetes. Diabetologia. 2009;52:1479‐1495
88. Jenkins DJ, Ghafari H, Wolever TM, Taylor RH, Jenkins AL, Barker HM, Fielden H, Bowling AC. Relationship between rate of digestion of foods and post‐prandial glycaemia. Diabetologia. 1982;22:450‐455
89. Hanefeld M, Cagatay M, Petrowitsch T, Neuser D, Petzinna D, Rupp M. Acarbose reduces the risk for myocardial infarction in type 2 diabetic patients: Meta‐analysis of seven long‐term studies. European heart journal. 2004;25:10‐16
90. Abete I, Parra D, Martinez JA. Legume‐, fish‐, or high‐protein‐based hypocaloric diets: Effects on weight loss and mitochondrial oxidation in obese men. Journal of medicinal food. 2009;12:100‐108
91. Streppel MT, Arends LR, van 't Veer P, Grobbee DE, Geleijnse JM. Dietary fiber and blood pressure: A meta‐analysis of randomized placebo‐controlled trials. Archives of internal medicine. 2005;165:150‐156
92. FDA. Evidence‐based review system for the scientific evaluation of health claims. 2009 93. Winham DM, Hutchins A.M. Baked bean consumption reduces serum cholesterol in
hypercholesterolmeic adults. Nutrition Research. 2007;27:380‐386 94. Winham DM, Hutchins AM, Johnston CS. Pinto bean consumption reduces biomarkers for heart
disease risk. Journal of the American College of Nutrition. 2007;26:243‐249 95. USDA. Dietary guidelines for americans. Washington D.C.: US Government Printing Office; 2010. 96. Association AH. How do i follow a healthy diet? 2010;2013 97. JPT H. Cochrane handbook for systematic review of interventions Great Britain: Antony Rowe
Ltd; 2012. 98. Moher D, Liberati A, Tetzlaff J, Altman DG, Group P. Preferred reporting items for systematic
reviews and meta‐analyses: The prisma statement. Bmj. 2009;339:b2535
REFERENCES
Page 92 of 93
99. Jimenez‐Cruz A TW, Bacardi‐Gascon M, Rosales‐Garay P. A high‐fiber, moderate‐glycemic‐index, mexican style diet improves dyslipidemia in individuals with type 2 diabetes. Nutrition Research. 2004;24:19‐27
100. Heyland DK, Novak F, Drover JW, Jain M, Su X, Suchner U. Should immunonutrition become routine in critically ill patients? A systematic review of the evidence. JAMA : the journal of the American Medical Association. 2001;286:944‐953
101. Elbourne DR, Altman DG, Higgins JP, Curtin F, Worthington HV, Vail A. Meta‐analyses involving cross‐over trials: Methodological issues. International journal of epidemiology. 2002;31:140‐149
102. Marinangeli CP, Jones PJ. Whole and fractionated yellow pea flours reduce fasting insulin and insulin resistance in hypercholesterolaemic and overweight human subjects. The British journal of nutrition. 2011;105:110‐117
103. Gormley TR KJ, O'Donnell B, McFarlane R. Effect of peas on serum cholesterol levels in humans. Irish Journal of Food Science and Technology. 1979;3:101‐109
104. Jenkins DJ, Wolever TM, Rao AV, Hegele RA, Mitchell SJ, Ransom TP, Boctor DL, Spadafora PJ, Jenkins AL, Mehling C, et al. Effect on blood lipids of very high intakes of fiber in diets low in saturated fat and cholesterol. The New England journal of medicine. 1993;329:21‐26
105. WH C. Key determinants of the health and well‐being of men and boys. International Journal of Men's Health. 2003;2:1‐30
106. Reyna‐Villasmil N, Bermudez‐Pirela V, Mengual‐Moreno E, Arias N, Cano‐Ponce C, Leal‐Gonzalez E, Souki A, Inglett GE, Israili ZH, Hernandez‐Hernandez R, Valasco M, Arraiz N. Oat‐derived beta‐glucan significantly improves hdlc and diminishes ldlc and non‐hdl cholesterol in overweight individuals with mild hypercholesterolemia. American journal of therapeutics. 2007;14:203‐212
107. Association NPG. Pulses: The perfect food. 2012;2013 108. Miller ER, 3rd, Erlinger TP, Sacks FM, Svetkey LP, Charleston J, Lin PH, Appel LJ. A dietary pattern
that lowers oxidative stress increases antibodies to oxidized ldl: Results from a randomized controlled feeding study. Atherosclerosis. 2005;183:175‐182
109. Botero D, Ebbeling CB, Blumberg JB, Ribaya‐Mercado JD, Creager MA, Swain JF, Feldman HA, Ludwig DS. Acute effects of dietary glycemic index on antioxidant capacity in a nutrient‐controlled feeding study. Obesity. 2009;17:1664‐1670
110. Jentzsch AM, Bachmann H, Furst P, Biesalski HK. Improved analysis of malondialdehyde in human body fluids. Free radical biology & medicine. 1996;20:251‐256
111. Ahotupa M, Ruutu M, Mantyla E. Simple methods of quantifying oxidation products and antioxidant potential of low density lipoproteins. Clinical biochemistry. 1996;29:139‐144
112. Hu ML. Measurement of protein thiol groups and glutathione in plasma. Methods in enzymology. 1994;233:380‐385
113. Jenkins DJ, Kendall CW, Jackson CJ, Connelly PW, Parker T, Faulkner D, Vidgen E, Cunnane SC, Leiter LA, Josse RG. Effects of high‐ and low‐isoflavone soyfoods on blood lipids, oxidized ldl, homocysteine, and blood pressure in hyperlipidemic men and women. The American journal of clinical nutrition. 2002;76:365‐372
114. Ceriello A, Esposito K, Piconi L, Ihnat M, Thorpe J, Testa R, Bonfigli AR, Giugliano D. Glucose "peak" and glucose "spike": Impact on endothelial function and oxidative stress. Diabetes research and clinical practice. 2008;82:262‐267
115. Ceriello A, Esposito K, Piconi L, Ihnat MA, Thorpe JE, Testa R, Boemi M, Giugliano D. Oscillating glucose is more deleterious to endothelial function and oxidative stress than mean glucose in normal and type 2 diabetic patients. Diabetes. 2008;57:1349‐1354
116. RH L. Whole grain phytochemicals and health. Journal of Cereal Science. 2007;46:207‐219 117. USDA. Oxygen radical absorbance capacity (orac) of selected foods, release 2 (2010). 2012
REFERENCES
Page 93 of 93
118. Goff LM, Cowland DE, Hooper L, Frost GS. Low glycaemic index diets and blood lipids: A systematic review and meta‐analysis of randomised controlled trials. Nutrition, metabolism, and cardiovascular diseases : NMCD. 2013;23:1‐10
119. Pan A, Sun Q, Bernstein AM, Schulze MB, Manson JE, Stampfer MJ, Willett WC, Hu FB. Red meat consumption and mortality: Results from 2 prospective cohort studies. Archives of internal medicine. 2012;172:555‐563
120. Omenn GS, Goodman GE, Thornquist MD, Balmes J, Cullen MR, Glass A, Keogh JP, Meyskens FL, Valanis B, Williams JH, Barnhart S, Hammar S. Effects of a combination of beta carotene and vitamin a on lung cancer and cardiovascular disease. The New England journal of medicine. 1996;334:1150‐1155
121. Lonn E, Bosch J, Yusuf S, Sheridan P, Pogue J, Arnold JM, Ross C, Arnold A, Sleight P, Probstfield J, Dagenais GR, Hope, Investigators H‐TT. Effects of long‐term vitamin e supplementation on cardiovascular events and cancer: A randomized controlled trial. JAMA : the journal of the American Medical Association. 2005;293:1338‐1347