Embed Size (px)
Citation preview
Effects of cryptic mortality and the hidden costs
of using length limits in fishery management
Lewis G Coggins Jr1, Matthew J Catalano1, Micheal S Allen1, William E Pine III1 & Carl J Walters2
1Department of Fisheries and Aquatic Sciences, University of Florida, 7922 Northwest 71st Street, Gainesville, FL 32653,
USA; 2Fisheries Centre, 2202 Main Mall, The University of British Columbia, Vancouver, BC, Canada V6T 1Z4
Introduction 197
Methods 197
Model formulation 198
Parameter value specification 199
Results 200
Discussion 203
Abstract
Fishery collapses cause substantial economic and ecological harm, but common
management actions often fail to prevent overfishing. Minimum length limits are
perhaps the most common fishing regulation used in both commercial and
recreational fisheries, but their conservation benefits can be influenced by discard
mortality of fish caught and released below the legal length. We constructed a
computer model to evaluate how discard mortality could influence the conservation
utility of minimum length regulations. We evaluated policy performance across two
disparate fish life-history types: short-lived high-productivity (SLHP) and long-lived
low-productivity (LLLP) species. For the life-history types, fishing mortality rates and
minimum length limits that we examined, length limits alone generally failed to
achieve sustainability when discard mortality rate exceeded about 0.2 for SLHP
species and 0.05 for LLLP species. At these levels of discard mortality, reductions in
overall fishing mortality (e.g. lower fishing effort) were required to prevent
recruitment overfishing if fishing mortality was high. Similarly, relatively low discard
mortality rates (>0.05) rendered maximum yield unobtainable and caused a
substantial shift in the shape of the yield response surfaces. An analysis of fishery
efficiency showed that length limits caused the simulated fisheries to be much less
efficient, potentially exposing the target species and ecosystem to increased negative
effects of the fishing process. Our findings suggest that for overexploited fisheries with
moderate-to-high discard mortality rates, reductions in fishing mortality will be
required to meet management goals. Resource managers should carefully consider
impacts of cryptic mortality sources (e.g. discard mortality) on fishery sustainability,
especially in recreational fisheries where release rates are high and effort is increasing
in many areas of the world.
Keywords catch and release, discard mortality, length limits, recruitment overfish-
ing, spawning potential ratio, yield
Correspondence:
Lewis G. Coggins, US
Geological Survey –
Grand Canyon Monit-
oring and Research
Center, 2255 North
Gemini Drive, Flag-
staff, AZ 86001, USA
Tel.: +1 928 556
7376
Fax: +1 928 556
7092
E-mail: lcoggins@
usgs.gov
Received 17 Nov 2006
Accepted 2 May 2007
� 2007 Blackwell Publishing Ltd
196 No Claim to Original Government Works
F I S H and F I S H E R I E S , 2007, 8, 196–210
Acknowledgements 209
References 209
Introduction
The ability of human users to alter aquatic ecosys-
tems through direct and indirect consequences of
harvest fisheries has received substantial attention
from conservationist, scientist and international
regulatory agencies (Stevens et al. 2000; Jackson
et al. 2001), and has led to a growing shift in the
conceptual framework for managing fisheries. This
shift is reflected in recent international and US
Federal fisheries policy discussions (FAO 2005) that
acknowledge the role of fishing in causing signifi-
cant and possibly irreversible ecosystem change
(NRC 2006a). Humans have a long and successful
history of efficiently harvesting marine organisms,
even to the point of extinction (Jackson et al. 2001),
and currently about 24% of the world’s fisheries are
considered imperilled (FAO 2005).
Recruitment overfishing (where harvest exceeds
the ability of a population to replace itself) of fish
stocks has major ecological and economic impacts
on both aquatic ecosystems and the human users
who depend on these ecosystems (Walters and
Maquire 1996; Fogarty and Murawski 1998; Pauly
et al. 1998; Lotze and Milewski 2004; Bearzi et al.
2006). The global scope of overfishing extends
beyond well-documented marine commercial fish-
eries examples (cod and herring) and has recently
been examined in freshwater and marine recre-
ational fisheries (Post et al. 2002; Coleman et al.
2004). Thus, overfishing impacts transcend com-
mercial and recreational fisheries in both marine
and freshwater environments, and effective man-
agement strategies to prevent overfishing are
critical.
Efforts to regulate fisheries for sustainability have
ranged from calls to end directed fishing for certain
species (e.g. orange roughy, Hoplostethus atlanticus,
Trachichthyidae), to management of fishing activ-
ities with spatial and temporal fishing closures, or
(most commonly) regulations limiting fish harvest
based on quotas, length limits, gear restrictions, or a
combination of each. However, in many fisheries,
regulating spatial and temporal dynamics or total
catch and effort are extremely costly or politically
unfeasible. In such situations, length limits are an
attractive management tool because they require no
control of spatial and temporal fishing effort pat-
terns. Instead, length limits operate under the
assumption that undersized (or oversized) fish can
be released alive and survive to either contribute to
the breeding stock or grow and be harvested at a
more desirable size in future.
However, if this assumption is not met, cryptic
sources of fishing mortality via discard deaths from
physical injury, handling stress or post-release
predation, can influence the efficacy of length limits
to sustain fisheries. Despite much research effort to
quantify discard mortality rates across a range of
fisheries (reviewed by Bartholomew and Bohnsack
2005) and recent reviews of fish life-history param-
eters (Goodwin et al. 2006), no review has evalu-
ated the population-level consequences of discard
mortality on fishery sustainability and performance
across a range of life-history types. This is of
particular concern for recreational fisheries as effort
is increasing in many parts of the world and release
rates for some fish species are very high (>90%,
Bartholomew and Bohnsack 2005). We evaluated
the effects of discard mortality (i.e. the proportion of
released fish that die) on the efficacy of minimum
legal length regulations to conserve fish stocks and
optimize fishery performance. Our evaluation used a
simulation model to examine trade-offs that occur
between fisheries performance and conservation
goals when managing stocks using length limits.
Results of this study have broad implications for the
sustainability and performance of fisheries where
regulations require release of some portion of
captured fish.
Methods
We constructed an age- and size-structured popula-
tion model to evaluate recruitment overfishing and
fishery performance across a range of minimum
length limits, discard mortality rates and fishing
mortality rates for two life-history types. These life-
history types were based on recent meta-analyses of
globally important fisheries (Myers et al. 1999;
Goodwin et al. 2006) and represent a wide spectrum
in longevity, growth and recruitment compensation.
Discarded catch mortality L G Coggins Jr et al.
� 2007 Blackwell Publishing Ltd, F I S H and F I S H E R I E S , 8, 196–210
No Claim to Original Government Works 197
The two life-history types were a short-lived and
high-productivity species and a long-lived and low-
productivity species. Recruitment overfishing was
evaluated by calculating spawning potential ratio
(SPR) and fishery performance was assessed by
calculating yield and efficiency (i.e. proportion of
fishery-related biomass losses attributable to har-
vest). The model segregated the populations into
subpopulations with differential growth trajectories
to account for variability in length within age classes
(Walters and Martell 2004).
Model formulation
The model simulated an age-structured population
composed of G growth trajectories, each with a
different growth curve [von Bertalanffy (LVB)
growth function; Bertalanffy 1938]. The set of
curves differ from one another only in terms of the
asymptotic length parameter as:
La;g ¼ L1;gð1� e�kða�t0ÞÞ; ð1Þ
where La;g is the length of an age-a fish (a ¼ 1 to A)
in growth trajectory g (g ¼ 1 to G), L1;g is the
asymptotic length of fish belonging to trajectory g, k
and t0 have conventional interpretations in fisheries
with k determining how fast length approaches the
maximum and t0 predicting the fish age at length
equal to zero (Quinn and Deriso 1999). To define
the L1;g for each growth trajectory, we first specified
a population-level mean asymptotic length (�L1).
We then specified minimum, L1;min, and maximum,
L1;max, values representing 20% variation around�L1 and assigned L1;g values for each growth
trajectory by choosing G equally spaced values
between L1;min and L1;max. A key motivation to
include growth variability as different growth tra-
jectories was to explicitly account for differences in
size-specific fecundity and fishery vulnerability
among different growth trajectories.
Equilibrium abundance for each growth traject-
ory was calculated by multiplying age-specific
survivorship and equilibrium recruitment using:
Na;g ¼ pgla;gR; ð2Þ
where pg is the proportion of fish recruited to growth
trajectory g, la;g is the age- and growth trajectory-
specific survivorship, and R is the equilibrium total
recruitment. Proportions, pg, recruited to each
growth trajectory were calculated from a normal
probability density with standard deviation, rg, and
g equally spaced intervals between )2 and 2.
Recruitment was calculated using equilibrium
solutions developed by Botsford (1981) for the
Beverton–Holt model using the compensation ratio
(Walters and Martell 2004) form of the model such
that equilibrium recruitment is:
R ¼ R0CR� ð�0=�fÞ
CR� 1; ð3Þ
where R0 is the average recruitment in the unfished
population, CR is the compensation ratio describing
the ratio of juvenile survival at low spawner
abundance to juvenile survival in the unfished
population (Goodyear 1980), and �0 and �f repre-
sent equilibrium lifetime egg production per recruit
for the unfished and fished stocks respectively.
Equilibrium expected egg production was calculated
as:
� ¼X
a
Xg
pgla;g fa;g; ð4Þ
where fa,g is the fecundity.
To model the common relationship between
fecundity and weight (Quinn and Deriso 1999),
fecundity was calculated as:
fa;g ¼Wa;g
Wmat
� �fmat; ð5Þ
where Wa;g is the weight of an age-a fish belonging
to growth trajectory g, Wmat is the weight of a
mature fish, and fmatis the fecundity of a fish that
has just reached maturity (i.e. a fish of mass Wmat).
The age- and growth trajectory-specific fecundity
ðfa;gÞ is set to zero if Wa;g < Wmat. Finally, we
calculated weight at a particular length as:
W ¼ �L�; ð6Þ
where a is a length–weight constant and b is the
allometric parameter.
Survivorship was calculated recursively as:
l1;g ¼ 1 la;g ¼ la�1;g e�Za;g ; ð7Þ
where Za,g is the instantaneous total mortality rate.
Each simulated population experienced natural
mortality, harvest mortality and discard mortality.
Instantaneous natural mortality rate M was con-
stant across ages, but instantaneous harvest Ha,g
and discard mortality Da,g rates varied among ages
and growth trajectories via length-dependent
Discarded catch mortality L G Coggins Jr et al.
198� 2007 Blackwell Publishing Ltd, F I S H and F I S H E R I E S , 8, 196–210
No Claim to Original Government Works
vulnerability schedules. Instantaneous total mortal-
ity rate was partitioned into its additive components
using:
Za;g ¼ M þ Ha;g þ Da;g: ð8Þ
Formulating the fishery-specific mortality compo-
nents as instantaneous rates allowed the possibility
that individual fish may be captured and discarded
multiple times within a year.
Instantaneous harvest mortality rate was calcu-
lated as:
Ha;g ¼ Fvhða;gÞ; ð9Þ
where F is an overall instantaneous fishing mortal-
ity rate and vhða;gÞ is the age- and growth trajectory-
specific relative vulnerability to harvest. Similarly,
instantaneous discard mortality rate was calculated
as:
Da;g ¼ Fdvdða;gÞ; ð10Þ
where d is the discard mortality rate (proportion of
discards not surviving), and vdða;gÞ is the vulnerab-
ility to discarding. The vulnerability to harvest vhða;gÞwas calculated as the proportion of fish of age a in
growth trajectory g whose total length (TL)
exceeded the minimum length limit (MLL) assuming
TL is normally distributed with mean La;g and
coefficient of variation cvL. The vulnerability to
discard was similarly calculated as the proportion of
fish whose TL was less than MLL but larger than the
minimum size vulnerable to the fishing gear Lvul.
We approximated changes in vulnerability with
growth throughout the year by calculating mean
length La;g at mid-year (i.e. age ¼ a + 0.5).
Spawning potential ratio is a commonly used
reference to assess fisheries sustainability and
measures the extent to which fishing mortality has
reduced the potential reproductive output (Good-
year 1993):
SPR ¼ �f
�0: ð11Þ
Recruitment overfishing is generally prevented by
maintaining an SPR ‡ 0.4 (Mace 1994). However,
target SPR values vary with stock resiliency, with
lower SPR required for sustaining highly productive
stocks (e.g. SPR ‡ 0.35; Clark 2002).
Fishery performance was evaluated by calcula-
ting equilibrium yield and fishery efficiency. Equi-
librium yield (Y) was calculated as:
Y ¼X
a
Xg
Na;gWa;gHa;gð1� e�Za;gÞ
Za;g: ð12Þ
Fishery efficiency (E) was used to assess waste due
to discard mortality and was calculated as the ratio
of yield to total deaths attributable to the fishing
process (i.e. harvest + discard deaths):
E ¼ YPa
Pg
Na;gWa;gðHa;g þ Da;gÞ½ð1� e�Za;gÞ=Za;g�;
ð13Þ
where the denominator represents the total biomass
lost to fishing mortality. Low efficiency values
would indicate that most losses are due to discard
mortality.
We evaluated SPR, yield and efficiency across a
range of length limits, discard mortality rates and
fishing mortality rates. Minimum length limits
ranged from 0:4�L1 to �L1 and fishing mortality (F)
ranged from 0 to 2 years)1. We simulated six
discard mortality rates (d): 0, 0.05, 0.10, 0.20, 0.35
and 0.80. Equilibrium solutions for SPR, yield and
efficiency were calculated for all combinations of
length limits, discard mortality rates and fishing
mortality rates.
Parameter value specification
We expected fish life-history strategy to influence
the efficacy of length regulations across a range of
discard and fishing mortality rates. Therefore, we
simulated two species that could be placed roughly
at opposite ends of a life-history continuum boun-
ded by a short-lived high-productivity strategy
(SLHP) at one extreme, and a long-lived low-
productivity strategy (LLLP) at the other. The SLHP
strategy represented a small-bodied, early-maturing
species, with a relatively weak compensatory
recruitment process. The LLLP represented a large-
bodied, late-maturing species, with relatively strong
compensatory recruitment. These strategies gener-
ally reflect life-history categorizations from a recent
meta-analyses of exploited fish species (Goodwin
et al. 2006).
To assign parameters to each life-history strategy,
we first defined longevity (A) for each and used
published correlations among vital rates of fish
species to assign natural mortality rate, growth
parameters and maturity schedules based on A
(Table 1). We chose a maximum age of 10 years for
the SLHP and 30 years for the LLLP. Following
Discarded catch mortality L G Coggins Jr et al.
� 2007 Blackwell Publishing Ltd, F I S H and F I S H E R I E S , 8, 196–210
No Claim to Original Government Works 199
Hoenig (1983), we assigned an M of 0.44 years)1
for the SLHP and 0.15 years)1 for the LLLP. We
assigned LVB k parameter values of 0.35 for the
SLHP and 0.1 for the LLLP based on Jensen’s (1996)
relationship between M and k.
We simulated a total of 11 growth trajectories for
each life-history strategy, set t0 ¼ 0, and allowed
L1;g to vary between 400 and 600 mm for the SLHP
and between 800 and 1200 mm for the LLLP. These
values were chosen to reflect variability in maxi-
mum size common with maximum fish age for
important exploited fish stocks. Coefficient of vari-
ation in length at age (cvL) was set at 0.1. We used
allometric parameters � ¼ 3:5 e�5 and � ¼ 2:8 for
both life-history strategies based on a survey of the
online database FISHBASE (Froese and Pauly 2006).
Minimum size of fish vulnerable to the fishery was
defined to equal length at maturity Lmin ¼ Lmat as is
frequently observed. Finally, we assigned
Lmat ¼ 0:4L1 based on general results from Bever-
ton’s (1992) meta-analysis of the life-history char-
acteristics for a large number of fish stocks.
We specified the strength of density dependence
in the recruitment process via the compensation
ratio parameter (CR). We assigned a relatively low
CR to the SLHP life-history type (CR ¼ 5) and a
relatively high CR for the LLLP (CR ¼ 25) based
on meta-analyses across species (Myers et al.
1999; Goodwin et al. 2006). We arbitrarily
defined R0 as one million and fmat as one because
these are scaling parameters that have no influ-
ence on the overall behaviour of the simulated
populations. We used target SPR values of 0.35
and 0.4 for the SLHP and LLLP life-history types,
respectively, to determine which combinations of
length limit, discard mortality and fishing mortal-
ity resulted in recruitment overfishing (i.e.
SPR < target value).
Results
We found that relatively low levels of discard
mortality can negate the ability of length limits
alone to maintain fishery sustainability. Our results
show that if F is high and discard mortality exceeds
about 0.2 for short-lived high-productivity species
or about 0.05 for long-lived low-productivity spe-
cies, then measures to reduce F (i.e. effort) would
be required to protect these fisheries from recruit-
ment overfishing and to maximize fishery efficiency.
In situations where fishing effort restrictions are not
amenable to resource user groups, then discard
mortality rates would need to be reduced to achieve
sustainability and optimize yield. While these effects
on fishery performance vary with length limit,
discard mortality rate and fishing mortality rate,
the overall pattern of large reductions in fishery
performance was similar between life-history type.
In general, increasing the length limit resulted in
higher SPR values, especially when d was nil (Figs 1
and 2). For the SLHP strategy, discard mortality
rate did not substantially influence SPR unless
d > 0.2 (Fig. 1). However, length limits were in-
effective in preventing recruitment overfishing (i.e.
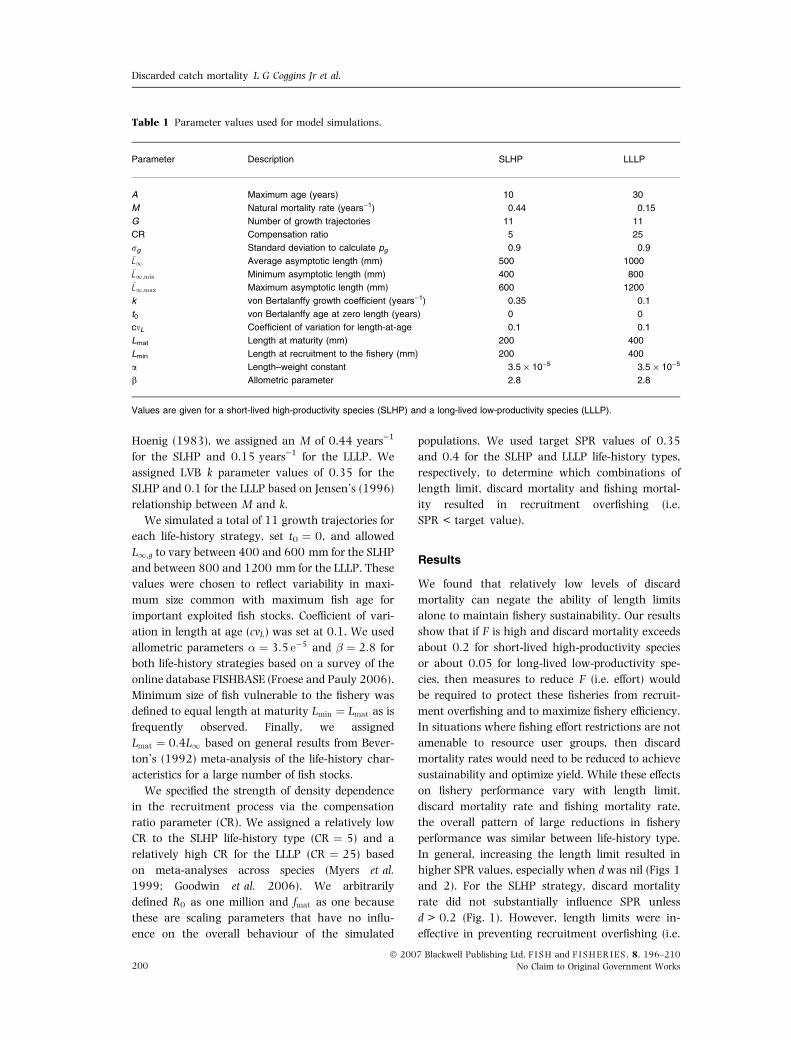
Table 1 Parameter values used for model simulations.
Parameter Description SLHP LLLP
A Maximum age (years) 10 30
M Natural mortality rate (years)1) 0.44 0.15
G Number of growth trajectories 11 11
CR Compensation ratio 5 25
rg Standard deviation to calculate pg 0.9 0.9�L1 Average asymptotic length (mm) 500 1000�L1;min Minimum asymptotic length (mm) 400 800�L1;max Maximum asymptotic length (mm) 600 1200
k von Bertalanffy growth coefficient (years)1) 0.35 0.1
t0 von Bertalanffy age at zero length (years) 0 0
cmL Coefficient of variation for length-at-age 0.1 0.1
Lmat Length at maturity (mm) 200 400
Lmin Length at recruitment to the fishery (mm) 200 400
a Length–weight constant 3.5 · 10)5 3.5 · 10)5
b Allometric parameter 2.8 2.8
Values are given for a short-lived high-productivity species (SLHP) and a long-lived low-productivity species (LLLP).
Discarded catch mortality L G Coggins Jr et al.
200� 2007 Blackwell Publishing Ltd, F I S H and F I S H E R I E S , 8, 196–210
No Claim to Original Government Works
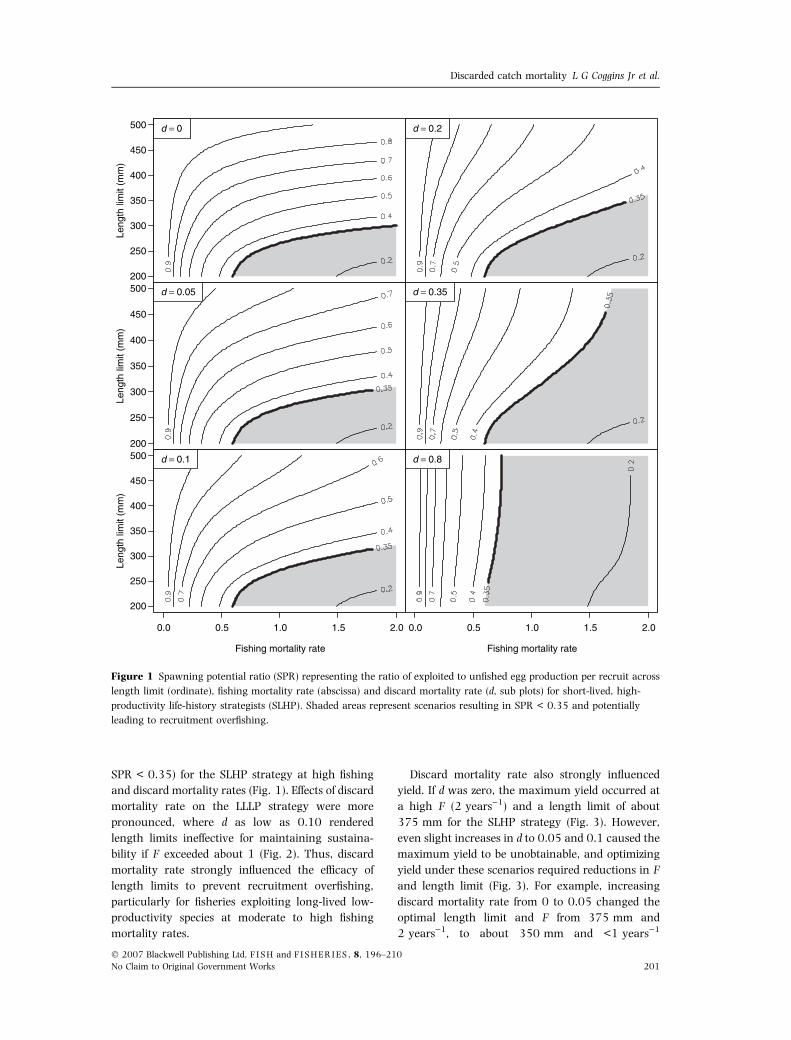
SPR < 0.35) for the SLHP strategy at high fishing
and discard mortality rates (Fig. 1). Effects of discard
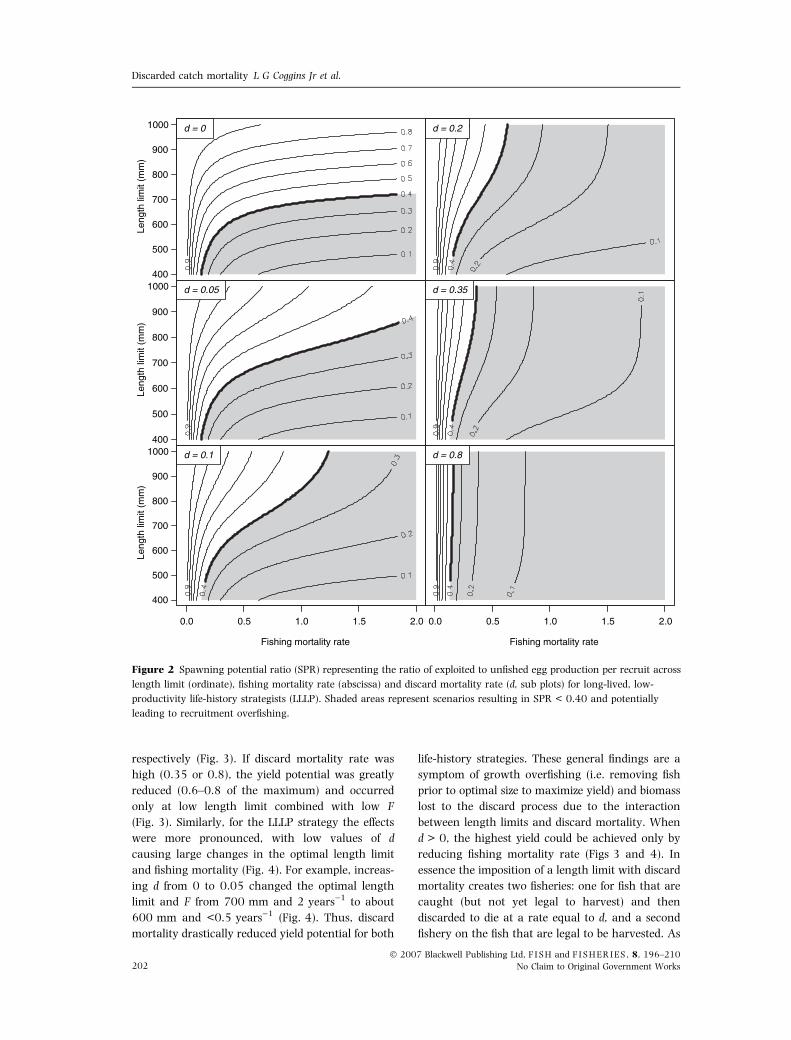
mortality rate on the LLLP strategy were more
pronounced, where d as low as 0.10 rendered
length limits ineffective for maintaining sustaina-
bility if F exceeded about 1 (Fig. 2). Thus, discard
mortality rate strongly influenced the efficacy of
length limits to prevent recruitment overfishing,
particularly for fisheries exploiting long-lived low-
productivity species at moderate to high fishing
mortality rates.
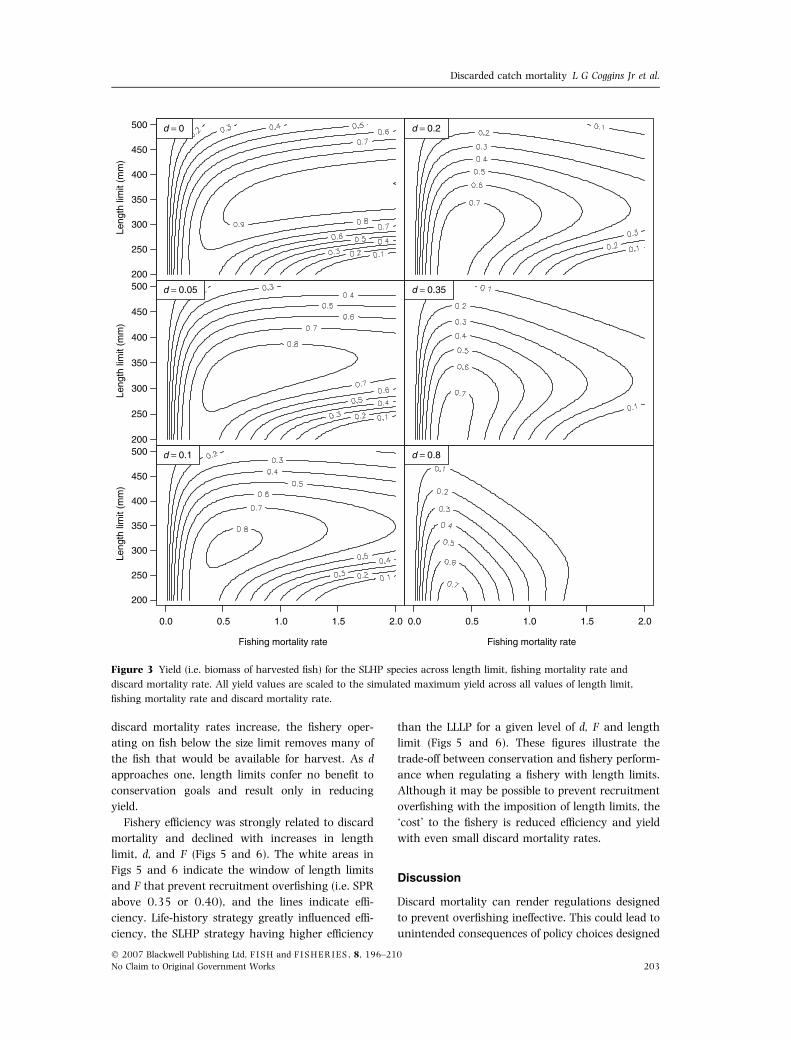
Discard mortality rate also strongly influenced
yield. If d was zero, the maximum yield occurred at
a high F (2 years)1) and a length limit of about
375 mm for the SLHP strategy (Fig. 3). However,
even slight increases in d to 0.05 and 0.1 caused the
maximum yield to be unobtainable, and optimizing
yield under these scenarios required reductions in F
and length limit (Fig. 3). For example, increasing
discard mortality rate from 0 to 0.05 changed the
optimal length limit and F from 375 mm and
2 years)1, to about 350 mm and <1 years)1
Leng
th li
mit
(mm
)
200
250
300
350
400
450
500 d = 0Le
ngth
lim
it (m
m)
200
250
300
350
400
450
500 d = 0.05
Fishing mortality rate
Leng
th li
mit
(mm
)
0.0 0.5 1.0 1.5 2.0
200
250
300
350
400
450
500 d = 0.1
d = 0.2
d = 0.35
Fishing mortality rate
0.0 0.5 1.0 1.5 2.0
d = 0.8
Figure 1 Spawning potential ratio (SPR) representing the ratio of exploited to unfished egg production per recruit across
length limit (ordinate), fishing mortality rate (abscissa) and discard mortality rate (d, sub plots) for short-lived, high-
productivity life-history strategists (SLHP). Shaded areas represent scenarios resulting in SPR < 0.35 and potentially
leading to recruitment overfishing.
Discarded catch mortality L G Coggins Jr et al.
� 2007 Blackwell Publishing Ltd, F I S H and F I S H E R I E S , 8, 196–210
No Claim to Original Government Works 201
respectively (Fig. 3). If discard mortality rate was
high (0.35 or 0.8), the yield potential was greatly
reduced (0.6–0.8 of the maximum) and occurred
only at low length limit combined with low F
(Fig. 3). Similarly, for the LLLP strategy the effects
were more pronounced, with low values of d
causing large changes in the optimal length limit
and fishing mortality (Fig. 4). For example, increas-
ing d from 0 to 0.05 changed the optimal length
limit and F from 700 mm and 2 years)1 to about
600 mm and <0.5 years)1 (Fig. 4). Thus, discard
mortality drastically reduced yield potential for both
life-history strategies. These general findings are a
symptom of growth overfishing (i.e. removing fish
prior to optimal size to maximize yield) and biomass
lost to the discard process due to the interaction
between length limits and discard mortality. When
d > 0, the highest yield could be achieved only by
reducing fishing mortality rate (Figs 3 and 4). In
essence the imposition of a length limit with discard
mortality creates two fisheries: one for fish that are
caught (but not yet legal to harvest) and then
discarded to die at a rate equal to d, and a second
fishery on the fish that are legal to be harvested. As
Leng
th li
mit
(mm
)
400
500
600
700
800
900
1000 d = 0Le
ngth
lim
it (m
m)
400
500
600
700
800
900
1000 d = 0.05
Fishing mortality rate
Leng
th li
mit
(mm
)
0.0 0.5 1.0 1.5 2.0
400
500
600
700
800
900
1000 d = 0.1
d = 0.2
d = 0.35
Fishing mortality rate
0.0 0.5 1.0 1.5 2.0
d = 0.8
Figure 2 Spawning potential ratio (SPR) representing the ratio of exploited to unfished egg production per recruit across
length limit (ordinate), fishing mortality rate (abscissa) and discard mortality rate (d, sub plots) for long-lived, low-
productivity life-history strategists (LLLP). Shaded areas represent scenarios resulting in SPR < 0.40 and potentially
leading to recruitment overfishing.
Discarded catch mortality L G Coggins Jr et al.
202� 2007 Blackwell Publishing Ltd, F I S H and F I S H E R I E S , 8, 196–210
No Claim to Original Government Works
discard mortality rates increase, the fishery oper-
ating on fish below the size limit removes many of
the fish that would be available for harvest. As d
approaches one, length limits confer no benefit to
conservation goals and result only in reducing
yield.
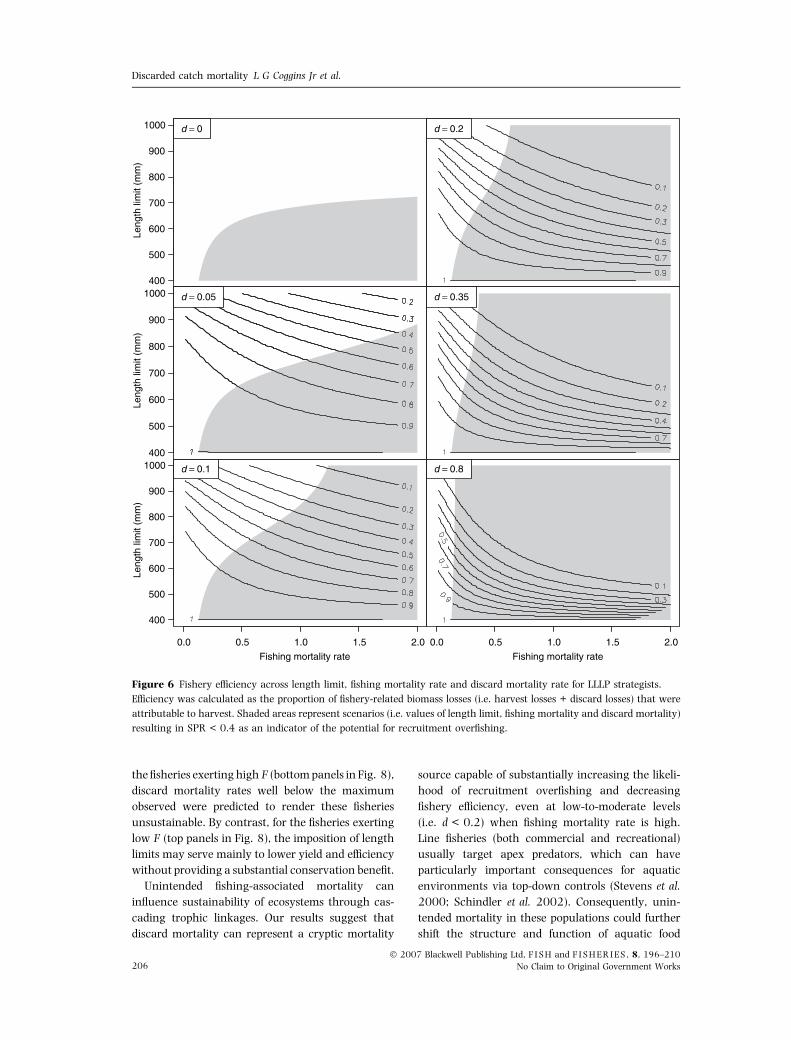
Fishery efficiency was strongly related to discard
mortality and declined with increases in length
limit, d, and F (Figs 5 and 6). The white areas in
Figs 5 and 6 indicate the window of length limits
and F that prevent recruitment overfishing (i.e. SPR
above 0.35 or 0.40), and the lines indicate effi-
ciency. Life-history strategy greatly influenced effi-
ciency, the SLHP strategy having higher efficiency
than the LLLP for a given level of d, F and length
limit (Figs 5 and 6). These figures illustrate the
trade-off between conservation and fishery perform-
ance when regulating a fishery with length limits.
Although it may be possible to prevent recruitment
overfishing with the imposition of length limits, the
‘cost’ to the fishery is reduced efficiency and yield
with even small discard mortality rates.
Discussion
Discard mortality can render regulations designed
to prevent overfishing ineffective. This could lead to
unintended consequences of policy choices designed
Leng
th li
mit
(mm
)
200
250
300
350
400
450
500 d = 0Le
ngth
lim
it (m
m)
200
250
300
350
400
450
500 d = 0.05
Fishing mortality rate
Leng
th li
mit
(mm
)
0.0 0.5 1.0 1.5 2.0
200
250
300
350
400
450
500 d = 0.1
d = 0.2
d = 0.35
Fishing mortality rate
0.0 0.5 1.0 1.5 2.0
d = 0.8
Figure 3 Yield (i.e. biomass of harvested fish) for the SLHP species across length limit, fishing mortality rate and
discard mortality rate. All yield values are scaled to the simulated maximum yield across all values of length limit,
fishing mortality rate and discard mortality rate.
Discarded catch mortality L G Coggins Jr et al.
� 2007 Blackwell Publishing Ltd, F I S H and F I S H E R I E S , 8, 196–210
No Claim to Original Government Works 203
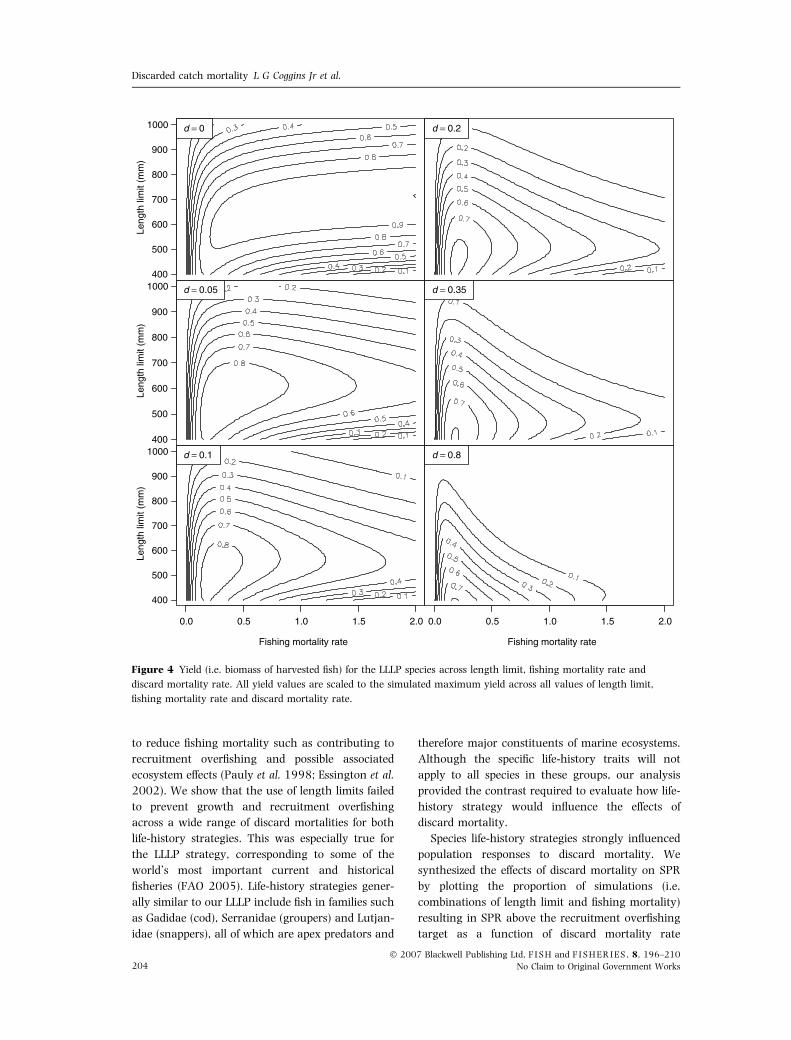
to reduce fishing mortality such as contributing to
recruitment overfishing and possible associated
ecosystem effects (Pauly et al. 1998; Essington et al.
2002). We show that the use of length limits failed
to prevent growth and recruitment overfishing
across a wide range of discard mortalities for both
life-history strategies. This was especially true for
the LLLP strategy, corresponding to some of the
world’s most important current and historical
fisheries (FAO 2005). Life-history strategies gener-
ally similar to our LLLP include fish in families such
as Gadidae (cod), Serranidae (groupers) and Lutjan-
idae (snappers), all of which are apex predators and
therefore major constituents of marine ecosystems.
Although the specific life-history traits will not
apply to all species in these groups, our analysis
provided the contrast required to evaluate how life-
history strategy would influence the effects of
discard mortality.
Species life-history strategies strongly influenced
population responses to discard mortality. We
synthesized the effects of discard mortality on SPR
by plotting the proportion of simulations (i.e.
combinations of length limit and fishing mortality)
resulting in SPR above the recruitment overfishing
target as a function of discard mortality rate
Leng
th li
mit
(mm
)
400
500
600
700
800
900
1000 d = 0Le
ngth
lim
it (m
m)
400
500
600
700
800
900
1000 d = 0.05
Fishing mortality rate
Leng
th li
mit
(mm
)
0.0 0.5 1.0 1.5 2.0
400
500
600
700
800
900
1000 d = 0.1
d = 0.2
d = 0.35
Fishing mortality rate
0.0 0.5 1.0 1.5 2.0
d = 0.8
Figure 4 Yield (i.e. biomass of harvested fish) for the LLLP species across length limit, fishing mortality rate and
discard mortality rate. All yield values are scaled to the simulated maximum yield across all values of length limit,
fishing mortality rate and discard mortality rate.
Discarded catch mortality L G Coggins Jr et al.
204� 2007 Blackwell Publishing Ltd, F I S H and F I S H E R I E S , 8, 196–210
No Claim to Original Government Works
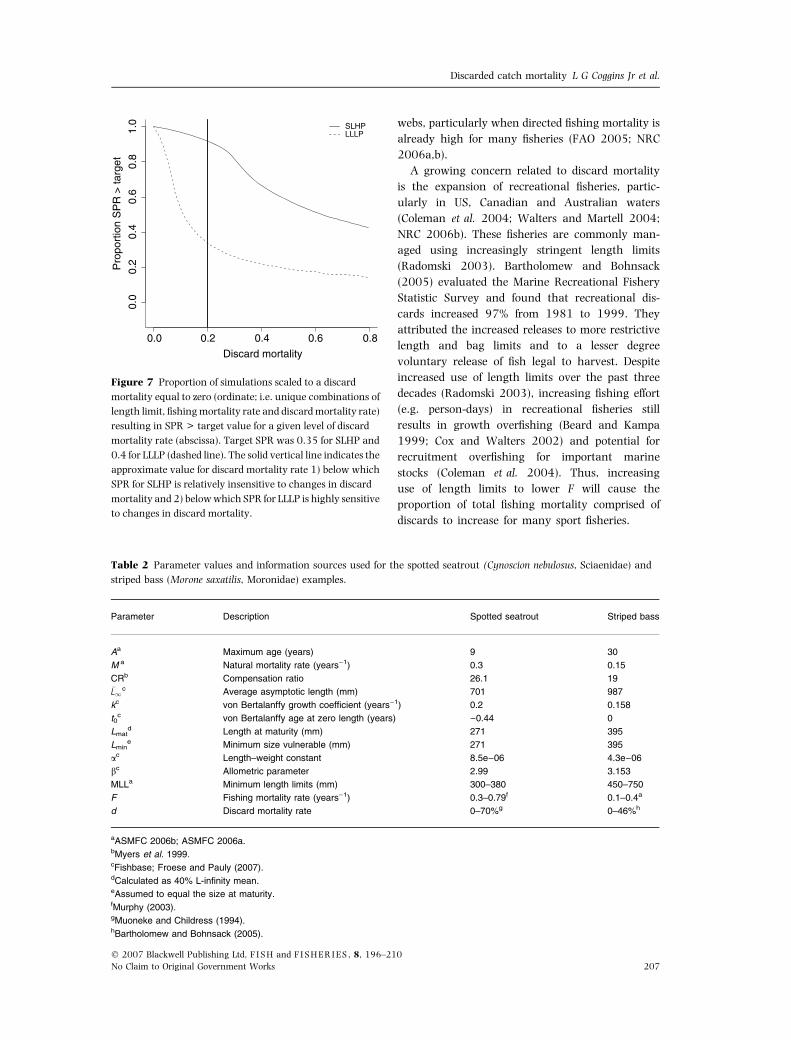
(Fig. 7). The response varied between life-history
strategies, with SLHP strategists not influenced
greatly until discard mortality rate exceeded about
0.2. Conversely, LLLP strategists were strongly
influenced by minor changes in discard mortality
rate up to 0.2. Thus, fish life-history strategy will
influence the effect of discard mortality.
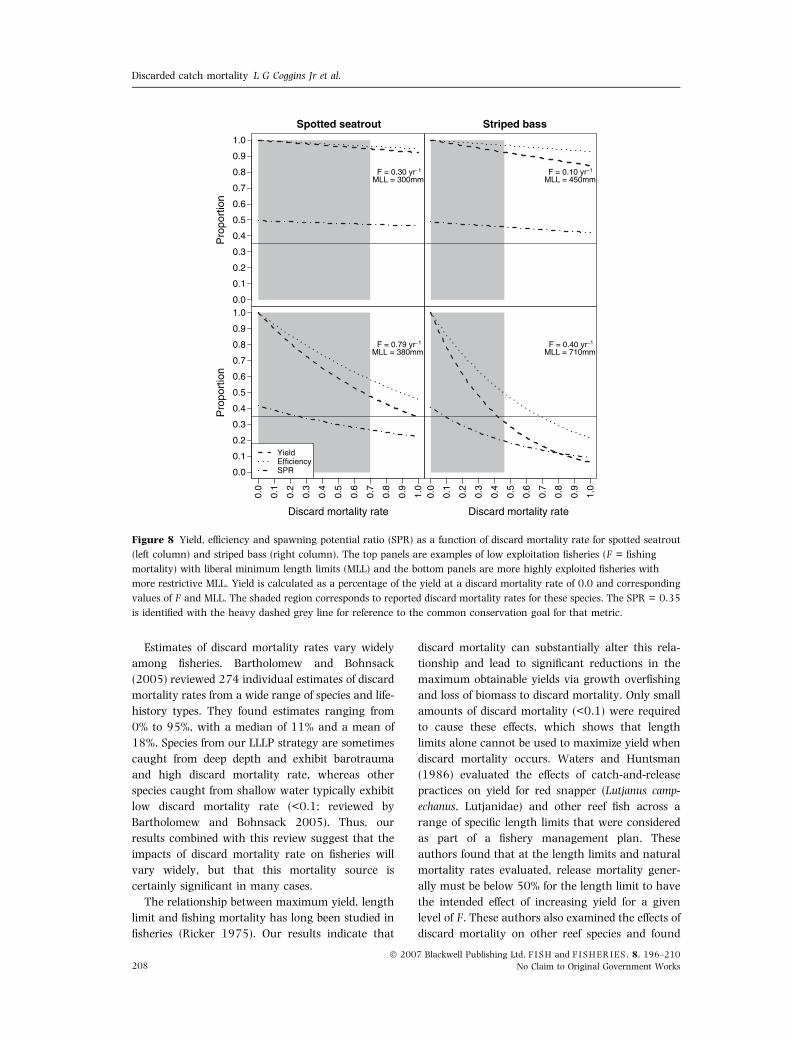
To place our simulation findings in a specific
management context, we evaluated the population
effects of discard mortality on striped bass (Morone
saxatilis, Moronidae) and spotted seatrout (Cynoscion
nebulosus, Sciaenidae), two species found along the
US Atlantic and Gulf of Mexico coast with well-
established fisheries managed using length limits. All
input parameters were taken from recent stock
assessments, published manuscripts and unpub-
lished agency reports (Table 2). These species repre-
sent contrasting life-history strategies with striped
bass most closely approximating our LLLP species
and spotted seatrout corresponding more to a SLHP
species. As predicted, striped bass populations were
more susceptible to population-level impacts of dis-
card mortality than spotted seatrout primarily due to
their longer life span and slower growth (Fig. 8). For
Leng
th li
mit
(mm
)
200
250
300
350
400
450
500 d = 0Le
ngth
lim
it (m
m)
200
250
300
350
400
450
500 d = 0.05
Fishing mortality rate
Leng
th li
mit
(mm
)
0.0 0.5 1.0 1.5 2.0
200
250
300
350
400
450
500 d = 0.1
d = 0.2
d = 0.35
Fishing mortality rate
0.0 0.5 1.0 1.5 2.0
d = 0.8
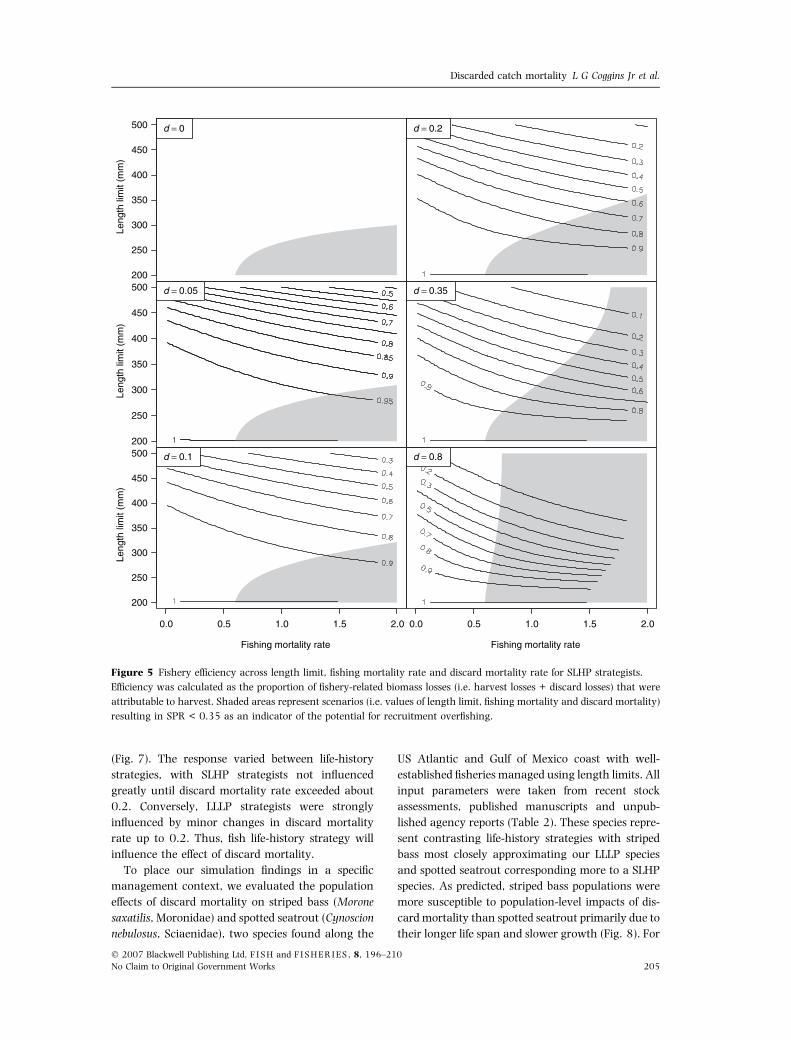
Figure 5 Fishery efficiency across length limit, fishing mortality rate and discard mortality rate for SLHP strategists.
Efficiency was calculated as the proportion of fishery-related biomass losses (i.e. harvest losses + discard losses) that were
attributable to harvest. Shaded areas represent scenarios (i.e. values of length limit, fishing mortality and discard mortality)
resulting in SPR < 0.35 as an indicator of the potential for recruitment overfishing.
Discarded catch mortality L G Coggins Jr et al.
� 2007 Blackwell Publishing Ltd, F I S H and F I S H E R I E S , 8, 196–210
No Claim to Original Government Works 205
the fisheries exerting high F (bottom panels in Fig. 8),
discard mortality rates well below the maximum
observed were predicted to render these fisheries
unsustainable. By contrast, for the fisheries exerting
low F (top panels in Fig. 8), the imposition of length
limits may serve mainly to lower yield and efficiency
without providing a substantial conservation benefit.
Unintended fishing-associated mortality can
influence sustainability of ecosystems through cas-
cading trophic linkages. Our results suggest that
discard mortality can represent a cryptic mortality
source capable of substantially increasing the likeli-
hood of recruitment overfishing and decreasing
fishery efficiency, even at low-to-moderate levels
(i.e. d < 0.2) when fishing mortality rate is high.
Line fisheries (both commercial and recreational)
usually target apex predators, which can have
particularly important consequences for aquatic
environments via top-down controls (Stevens et al.
2000; Schindler et al. 2002). Consequently, unin-
tended mortality in these populations could further
shift the structure and function of aquatic food
Leng
th li
mit
(mm
)
400
500
600
700
800
900
1000 d = 0Le
ngth
lim
it (m
m)
400
500
600
700
800
900
1000 d = 0.05
Fishing mortality rate
Leng
th li
mit
(mm
)
0.0 0.5 1.0 1.5 2.0
400
500
600
700
800
900
1000 d = 0.1
d = 0.2
d = 0.35
Fishing mortality rate
0.0 0.5 1.0 1.5 2.0
d = 0.8
Figure 6 Fishery efficiency across length limit, fishing mortality rate and discard mortality rate for LLLP strategists.
Efficiency was calculated as the proportion of fishery-related biomass losses (i.e. harvest losses + discard losses) that were
attributable to harvest. Shaded areas represent scenarios (i.e. values of length limit, fishing mortality and discard mortality)
resulting in SPR < 0.4 as an indicator of the potential for recruitment overfishing.
Discarded catch mortality L G Coggins Jr et al.
206� 2007 Blackwell Publishing Ltd, F I S H and F I S H E R I E S , 8, 196–210
No Claim to Original Government Works
webs, particularly when directed fishing mortality is
already high for many fisheries (FAO 2005; NRC
2006a,b).
A growing concern related to discard mortality
is the expansion of recreational fisheries, partic-
ularly in US, Canadian and Australian waters
(Coleman et al. 2004; Walters and Martell 2004;
NRC 2006b). These fisheries are commonly man-
aged using increasingly stringent length limits
(Radomski 2003). Bartholomew and Bohnsack
(2005) evaluated the Marine Recreational Fishery
Statistic Survey and found that recreational dis-
cards increased 97% from 1981 to 1999. They
attributed the increased releases to more restrictive
length and bag limits and to a lesser degree
voluntary release of fish legal to harvest. Despite
increased use of length limits over the past three
decades (Radomski 2003), increasing fishing effort
(e.g. person-days) in recreational fisheries still
results in growth overfishing (Beard and Kampa
1999; Cox and Walters 2002) and potential for
recruitment overfishing for important marine
stocks (Coleman et al. 2004). Thus, increasing
use of length limits to lower F will cause the
proportion of total fishing mortality comprised of
discards to increase for many sport fisheries.
Discard mortality
Pro
port
ion
SP
R >
targ
et
0.0 0.2 0.4 0.6 0.8
0.0
0.2
0.4
0.6
0.8
1.0 SLHP
LLLP
Figure 7 Proportion of simulations scaled to a discard
mortality equal to zero (ordinate; i.e. unique combinations of
length limit, fishing mortality rate and discard mortality rate)
resulting in SPR > target value for a given level of discard
mortality rate (abscissa). Target SPR was 0.35 for SLHP and
0.4 for LLLP (dashed line). The solid vertical line indicates the
approximate value for discard mortality rate 1) below which
SPR for SLHP is relatively insensitive to changes in discard
mortality and 2) below which SPR for LLLP is highly sensitive
to changes in discard mortality.
Table 2 Parameter values and information sources used for the spotted seatrout (Cynoscion nebulosus, Sciaenidae) and
striped bass (Morone saxatilis, Moronidae) examples.
Parameter Description Spotted seatrout Striped bass
Aa Maximum age (years) 9 30
M a Natural mortality rate (years)1) 0.3 0.15
CRb Compensation ratio 26.1 19�L1
c Average asymptotic length (mm) 701 987
kc von Bertalanffy growth coefficient (years)1) 0.2 0.158
t0c von Bertalanffy age at zero length (years) )0.44 0
Lmatd Length at maturity (mm) 271 395
Lmine Minimum size vulnerable (mm) 271 395
ac Length–weight constant 8.5e)06 4.3e)06
bc Allometric parameter 2.99 3.153
MLLa Minimum length limits (mm) 300–380 450–750
F Fishing mortality rate (years)1) 0.3–0.79f 0.1–0.4a
d Discard mortality rate 0–70%g 0–46%h
aASMFC 2006b; ASMFC 2006a.bMyers et al. 1999.cFishbase; Froese and Pauly (2007).dCalculated as 40% L-infinity mean.eAssumed to equal the size at maturity.fMurphy (2003).gMuoneke and Childress (1994).hBartholomew and Bohnsack (2005).
Discarded catch mortality L G Coggins Jr et al.
� 2007 Blackwell Publishing Ltd, F I S H and F I S H E R I E S , 8, 196–210
No Claim to Original Government Works 207
Estimates of discard mortality rates vary widely
among fisheries. Bartholomew and Bohnsack
(2005) reviewed 274 individual estimates of discard
mortality rates from a wide range of species and life-
history types. They found estimates ranging from
0% to 95%, with a median of 11% and a mean of
18%. Species from our LLLP strategy are sometimes
caught from deep depth and exhibit barotrauma
and high discard mortality rate, whereas other
species caught from shallow water typically exhibit
low discard mortality rate (<0.1; reviewed by
Bartholomew and Bohnsack 2005). Thus, our
results combined with this review suggest that the
impacts of discard mortality rate on fisheries will
vary widely, but that this mortality source is
certainly significant in many cases.
The relationship between maximum yield, length
limit and fishing mortality has long been studied in
fisheries (Ricker 1975). Our results indicate that
discard mortality can substantially alter this rela-
tionship and lead to significant reductions in the
maximum obtainable yields via growth overfishing
and loss of biomass to discard mortality. Only small
amounts of discard mortality (<0.1) were required
to cause these effects, which shows that length
limits alone cannot be used to maximize yield when
discard mortality occurs. Waters and Huntsman
(1986) evaluated the effects of catch-and-release
practices on yield for red snapper (Lutjanus camp-
echanus, Lutjanidae) and other reef fish across a
range of specific length limits that were considered
as part of a fishery management plan. These
authors found that at the length limits and natural
mortality rates evaluated, release mortality gener-
ally must be below 50% for the length limit to have
the intended effect of increasing yield for a given
level of F. These authors also examined the effects of
discard mortality on other reef species and found
Spotted seatrout
Pro
port
ion
0.0
0.1
0.2
0.3
0.4
0.5
0.6
0.7
0.8
0.9
1.0
F = 0.30 yr−1
MLL = 300mm
Discard mortality rate
Pro
port
ion
0.0
0.1
0.2
0.3
0.4
0.5
0.6
0.7
0.8
0.9
1.0
0.0
0.1
0.2
0.3
0.4
0.5
0.6
0.7
0.8
0.9
1.0
YieldEfficiencySPR
F = 0.79 yr−1
MLL = 380mm
Striped bass
F = 0.10 yr−1
MLL = 450mm
Discard mortality rate
0.0
0.1
0.2
0.3
0.4
0.5
0.6
0.7
0.8
0.9
1.0
F = 0.40 yr−1
MLL = 710mm
Figure 8 Yield, efficiency and spawning potential ratio (SPR) as a function of discard mortality rate for spotted seatrout
(left column) and striped bass (right column). The top panels are examples of low exploitation fisheries (F = fishing
mortality) with liberal minimum length limits (MLL) and the bottom panels are more highly exploited fisheries with
more restrictive MLL. Yield is calculated as a percentage of the yield at a discard mortality rate of 0.0 and corresponding
values of F and MLL. The shaded region corresponds to reported discard mortality rates for these species. The SPR = 0.35
is identified with the heavy dashed grey line for reference to the common conservation goal for that metric.
Discarded catch mortality L G Coggins Jr et al.
208� 2007 Blackwell Publishing Ltd, F I S H and F I S H E R I E S , 8, 196–210
No Claim to Original Government Works
that release mortality must be less than 40% for
length limits to increase yield.
Our results reveal important trade-offs between
conservation and performance goals when making
management decisions to reduce F in the face of
discard mortality. In these situations, management
options include either: (1) directly reducing fishing
effort through restrictive harvest quotas, temporal
or spatial closures and gear or fishing effort restric-
tions; or (2) requiring no change in directed fishing
effort and attempting to reduce fishing mortality
with length limits. The first option is appealing from
the perspective of minimizing the ecosystem impacts
of fishing, but it has been infrequently chosen due to
political and economic pressures from communities
that depend on the fisheries (Walters and Martell
2004). However, the second option reduces effi-
ciency and yield if discard mortality is high, thereby
exposing the target species and ecosystem to
increased negative effects of the fishing process.
Essington et al. (2002) showed how changes in
tuna fishing practices, which were originally moti-
vated by concerns over marine mammal interac-
tions with the tuna fishing fleet, ultimately led to
more destructive fishing practices from an ecosys-
tem perspective. We demonstrate that discard mor-
tality will strongly influence the efficiency of the
harvest process. This may force fishers to increase
effort in an attempt to maintain landings, which
could lead to negative consequences to the target
organism and ecosystem.
We suggest a third option is one where fishers
and resource managers seek fishing practices that
result in lower discard mortality rate. This may
represent a ‘best case’ as in some fisheries it may be
possible to maintain current fishing effort while still
allowing high yield and efficiency fisheries. We
further suggest that models such as ours can help to
focus the discussion between managers and fishers
on the key factors contributing to the realization of
both fishery conservation and performance goals.
Such examination of trade-offs will undoubtedly
provide incentives to reduce discard mortality as an
alternative to other more restrictive options such as
direct effort controls, harvest quotas or closures.
Acknowledgements
B. Muller and two anonymous reviewers provided
helpful comments that improved the clarity of the
manuscript. We thank the Queensland Department
of Primary Industries for support of this project,
T. Courtney, W. Sumpton and M. O’Neill for helping
to conceptualize the problem of discard mortality for
line fisheries, and Billie Carlton with the Florida Fish
and Wildlife Conservation Commission, Cedar Key
Laboratory for her hospitality. M. Catalano was
supported by a University of Florida Foundation
Alumni Fellowship.
References
ASMFC (2006a) 2005 Stock Assessment for Atlantic Striped
Bass: Catch-at-Age Based VPA and Tag Release/Recovery
Based Survival Information. Atlantic States Marine Fish-
eries Commission, Washington, DC.
ASMFC (2006b) 2006 Review of the Fishery Management
Plan for Spotted Seatrout Cynoscion nebulosus. Atlantic
States Marine Fisheries Commission, Washington, DC.
Bartholomew, A. and Bohnsack, J.A. (2005) A review of
catch-and-release angling mortality with implications
for no-take reserves. Reviews in Fish Biology and Fisheries
15, 129–154.
Beard, T.D. and Kampa, J.M. (1999) Changes in bluegill,
black crappie, and yellow perch populations in Wisconsin
during 1967–1991. North American Journal of Fisheries
Management 19, 1037–1043.
Bearzi, G., Politi, E., Agazzi, S. and Azzellino, A. (2006) Prey
depletion caused by overfishing and the decline of marine
megafauna in eastern Ionian Sea coastal waters (central
Mediterranean). Biological Conservation 127, 373–382.
Bertalanffy, L.V. (1938) A quantitative theory of organic
growth. Human Biology 10, 181–213.
Beverton, R.J.H. (1992) Patterns of reproductive strategy
parameters in some marine teleost fishes. Journal of Fish
Biology 41, 137–160.
Botsford, L.W. (1981) Optimal fishery policy for size-
specific density-dependent population models. Journal of
Mathematical Biology 12, 265–293.
Clark, W.C. (2002) F35% revisited ten years later. North
American Journal of Fisheries Management 22, 251–257.
Coleman, F.C., Figueira, W.F., Ueland, J.S. and Crowder, L.B.
(2004) The impact of United States recreational fisheries
on marine fish populations. Science 305, 1958–1960.
Cox, S.P. and Walters, C. (2002) Modeling exploitation in
recreational fisheries and implications for effort man-
agement on British Columbia rainbow trout lakes. North
American Journal of Fisheries Management 22, 21–34.
Essington, T.E., Schindler, D.E., Olson, R.J., Kitchell, J.F.,
Boggs, C. and Hilborn, R. (2002) Alternative fisheries
and the predation rate of yellowfin tuna in the eastern
Pacific Ocean. Ecological Applications 12, 724–734.
FAO (2005) Review of the State of World Marine Fishery
Resources.Foodand Agriculture Organizationof the United
Nations Fisheries Technical Paper 457. Rome, Italy.
Fogarty, M.J. and Murawski, S.A. (1998) Large-scale
disturbance and the structure of marine systems: fishery
Discarded catch mortality L G Coggins Jr et al.
� 2007 Blackwell Publishing Ltd, F I S H and F I S H E R I E S , 8, 196–210
No Claim to Original Government Works 209
impacts on Georges Bank. Ecological Applications 8, S6–
S22.
Froese, R. and Pauly, D. (eds) (2006) FishBase. World
Wide Web electronic publication. http://www.fish-
base.org, version (04/2007).
Goodwin, N.B., Grant, A., Perry, A.L., Dulvy, N.K. and
Reynolds, J.D. (2006) Life history correlates of density-
dependent recruitment in marine fishes. Canadian Journal
of Fisheries and Aquatic Sciences 63, 494–509.
Goodyear, C.P. (1980) Compensation in fish populations.
In: Biological Monitoring of Fish (eds C.H. Hocutt and
J.R. Stauffer). DC Heath and Company, Lexington, MA,
pp. 253–280.
Goodyear, C.P. (1993) Spawning stock biomass per recruit
in fisheries management: foundation and current use.
In: Risk Evaluation and Biological Reference Points for
Fisheries Management. Canadian Special Publication of
Fisheries and Aquatic Sciences 120 (eds S.J. Smith, J.J.
Hunt and D. Rivard), NRC Press, Ottawa, Canada.
Hoenig, J.M. (1983) Empirical use of longevity data to
estimate mortality rates. Fishery Bulletin 82, 898–903.
Jackson, J.B.C., Kirby, M.X., Berger, W.H. et al. (2001)
Historical overfishing and the recent collapse of coastal
ecosystems. Science 293, 629–638.
Jensen, A.L. (1996) Beverton and Holt life history invar-
iants result from optimal trade-off of reproduction and
survival. Canadian Journal of Fisheries and Aquatic Sciences
53, 820–822.
Lotze, H.K. and Milewski, I. (2004) Two centuries of multiple
human impacts and successive changes in a north
Atlantic food web. Ecological Applications 14, 1428–1447.
Mace, P.M. (1994) Relationships between common biolo-
gical reference points used as thresholds and targets of
fisheries management strategies. Canadian Journal of
Fisheries and Aquatic Sciences 51, 110–122.
Muoneke, M.I. and Childress, W.M. (1994) Hooking
mortality: a review for recreational fisheries. Reviews in
Fisheries Science 2, 123–156.
Murphy, M.D. (2003) A Stock Assessment of Spotted Seatrout
Cynoscion nebulosus in Florida: Status of the Stocks
Through 2001. Florida Fish and Wildlife Conservation
Commission, Tallahassee, FL.
Myers, R.A., Bowen, K.G. and Barrowman, N.J. (1999)
Maximum reproductive rates of fish at low population
sizes. Canadian Journal of Fisheries and Aquatic Sciences
56, 2402–2419.
NRC (2006a) Fishing, food webs, and future options. In:
Committee on Ecosystem Effects of Fishing: Phase II –
Assessments of the Extent of Change and the Implications for
Policy. National Research Council. National Aca-
demic Press. Washington, DC, http://books.nap.edu/
catalog.php?record_id=11608.
NRC (2006b) Review of Recreational Fisheries Survey
Methods.National Research Council. National Aca-
demic Press. Washington, DC, http://books.nap.edu/
catalog.php?record_id=11616.
Pauly, D., Christensen, V., Dalsgaard, J., Froese, R. and
Torres, F. Jr (1998) Fishing down marine food webs.
Science 279, 860–863.
Post, J.R., Sullivan, M., Cox, S. et al. (2002) Canada’s
recreational fisheries: the invisible collapse? Fisheries 27,
6–17.
Quinn, T.J. II and Deriso, R.B. (1999) Quantitative Fish
Dynamics. Oxford University Press, New York.
Radomski, P. (2003) Initial attempts to actively manage
recreational fishery harvest in Minnesota. North Ameri-
can Journal of Fisheries Management 23, 1329–1342.
Ricker, W.E. (1975) Computation and interpretation of
biological statistics of fish populations. Bulletin of the
Fisheries Research Board of Canada 191, 1–381.
Schindler, D.E., Essington, T.E., Kitchell, J.F., Boggs, C. and
Hilborn, R. (2002) Sharks and tunas: fisheries impacts
on predators with contrasting life histories. Ecological
Applications 12, 735–748.
Stevens, J.D., Bonfil, R., Dulvy, N.K. and Walker, P.A.
(2000) The effects of fishing on sharks, rays, and
chimaeras (chondrichthyans), and the implications for
marine ecosystems. ICES Journal of Marine Science 57,
476–494.
Walters, C.J. and Maquire, J.-J. (1996) Lessons for stock
assessment from the northern cod collapse. Reviews in
Fish Biology and Fisheries 6, 125–137.
Walters, C.J. and Martell, S.J.D. (2004) Fisheries Ecology and
Management. Princeton University Press, Princeton, NJ.
Waters, J.R. and Huntsman, G.R. (1986) Incorporating
mortality from catch and release into yield-per-recruit
analyses of minimum-size limits. North American Journal
of Fisheries Management 6, 463–471.
Discarded catch mortality L G Coggins Jr et al.
210� 2007 Blackwell Publishing Ltd, F I S H and F I S H E R I E S , 8, 196–210
No Claim to Original Government Works