Embed Size (px)
Citation preview
Portland State University Portland State University
PDXScholar PDXScholar
Center for Urban Studies Publications and Reports Center for Urban Studies
7-30-2005
Effects of Comprehensive Plan Amendments on Effects of Comprehensive Plan Amendments on
Interchange Traffic in Oregon Interchange Traffic in Oregon
James G. Strathman Portland State University
Thomas J. Kimpel Portland State University
Paul Roland Leistner Portland State University, [email protected]
Kenneth Dueker Portland State University
Follow this and additional works at: https://pdxscholar.library.pdx.edu/cus_pubs
Part of the Transportation Commons, and the Urban Studies and Planning Commons
Let us know how access to this document benefits you.
Citation Details Citation Details Strathman, James G.; Kimpel, Thomas J.; Leistner, Paul Roland; and Dueker, Kenneth, "Effects of Comprehensive Plan Amendments on Interchange Traffic in Oregon" (2005). Center for Urban Studies Publications and Reports. 1. https://pdxscholar.library.pdx.edu/cus_pubs/1
This Working Paper is brought to you for free and open access. It has been accepted for inclusion in Center for Urban Studies Publications and Reports by an authorized administrator of PDXScholar. Please contact us if we can make this document more accessible: [email protected].

EFFECTS OF COMPREHENSIVE PLAN AMENDMENTSON INTERCHANGE TRAFFIC IN OREGON
James G. StrathmanThomas J. Kimpel
Paul LeistnerKenneth J. Dueker
Center for Urban StudiesCollege of Urban and Public Affairs
Portland State UniversityP.O. Box 751
Portland, OR 97207(503) 725-4068
[email protected]@[email protected]@aol.com
July 30, 2005Word Count: 7,451

Strathman, Kimpel, Leistner & Dueker 1
ABSTRACTIn this paper we examine the effects of amendments to local comprehensive plans oninterchange performance. Plan amendments over a 15-year period in Oregon resulting inchanges to industrial or commercial land use were reviewed to identify those thatoccurred within one mile of an interchange. Regression analysis was then performed toestimate the impact of nearby plan amendments on subsequent interchange ADT. Planamendments were found to have a substantial ADT effect on rural interchanges, but theirincidence was very limited. In urban core areas, the estimated effect of plan amendmentswas negligible, possibly due to interchange congestion or effective land use planning. Inurban fringe areas, plan amendments were estimated to account for about 5 percent of thesubsequent interchange ADT, equivalent to about two years of the design life of thesefacilities.

Strathman, Kimpel, Leistner & Dueker 2
INTRODUCTIONInterchanges serve two primary functions. They are the sole entry and exit points
connecting freeways to nearby communities, and they provide access to freeway users’services – fuel, food and lodging. Tracts of land near freeway interchanges are accessibleto a wide region and have become highly desirable locations for commercial andindustrial uses. The convergent land development demands of the multiple functions ofserving highway users, shoppers, and employees have produced traffic volumes that haveoften grown faster than the forecasts upon which the design of interchanges has beenbased, resulting in congestion and safety problems. Interchange congestion and safetyproblems are often exacerbated by the proximity of freeway ramps to driveways andaccess roads, resulting in conflicting turning movements that have to be managed bysignals and access management within restricted rights-of-way. Responding to freewayinterchange congestion requires a variety of improvements, such as signalization,widening of cross roads, and new turn lanes at freeway ramps. The ability to expandinterchange capacity is often financially constrained by intensely developed abuttingproperty.
Whatever the option pursued to mitigate interchange area congestion, an over-arching need is to take a longer-term view of planning interchange capacity andmanaging interchange areas, including integrated management of access and landdevelopment. Even in circumstances where land development and traffic trends can bepredicted with relative confidence, resource constraints can preclude building to meetlong-range needs. Consequently, the issue is to allow for flexibility to facilitateexpansion and, at the same time, to better manage traffic growth to mitigate the need forexpansion. Balancing these issues over time is the essence of interchange planning andmanagement.
This paper explores the effect of comprehensive plan amendments on interchangetraffic volumes on the Oregon highway system. The Oregon Department ofTransportation (ODOT) has implemented a practice of preparing interchange areamanagement plans (IAMPs) in connection with interchange construction or improvementon the state highway system. Generally, these plans are adopted through anintergovernmental agreement between ODOT and the local jurisdiction where theinterchange is located. As directed by the Oregon Transportation Commission (OTC),interchange project programming is now conditioned on the adoption of an IAMP.
The IAMPs cover factors affecting interchange performance over time, includingaccess management, the design of the local transportation system, and the planningregulations governing land use and development. These plans represent a departure fromthe traditional focus on access management by addressing the circulation of traffic in thesurrounding area and the land development process that affects traffic generation.
While it has been generally thought that comprehensive plan amendments havecontributed to the growth of interchange traffic volumes on the state highway system,there has not yet been a systematic analysis of either the geographic incidence ofcomprehensive plan amendments or their subsequent impacts on interchangeperformance.
This paper is organized as follows. Literature related to interchange managementis reviewed in the next section. This is followed by an overview of the policies andpractices related to interchange area management in Oregon. Following this is an
Strathman, Kimpel, Leistner & Dueker 3
empirical analysis, including an assessment of the geographical incidence ofcomprehensive plan amendments in Oregon over a 15-year period (1988-2002), as wellas a statistical analysis relating traffic growth over the study period on more than 270interchanges to comprehensive plan amendment activity. The paper concludes with asummary of findings and a discussion of their implications.
LITERATURE REVIEWWhile the need to better integrate land use and transportation planning is
increasingly noted in the access management literature, its basic orientation still treats theland development process as exogenous (1). Plazak notes that “one of the majorobstacles to the successful implementation of access management principles is theseeming disconnect between the activities of agencies responsible for administeringroadways and the activities of agencies responsible for local land use planning andregulation.” (2: 159). A historical tension exists between the desire of local governmentsand property owners to gain access to state highway facilities, and the state’s interest inmaintaining the capacity and safety of the system for through traffic. Local governmentsoften approach access management and traffic impacts on a case-by-case basis in thedevelopment approval process, which overlooks the cumulative effects of developmenton congestion and safety (3).
States with comprehensive land use planning systems appear to have an advantage inintegrating state transportation system management with local land use planning systems(3). In these states, land use planning goals commonly call for coordination of land useand transportation planning. In Oregon, the adoption of the Transportation Planning Ruleby the Land Conservation and Development Commission has made such coordination arequirement. The rule requires local transportation and land use plans to be compatiblewith the ODOT’s State Highway Plan.
State growth management statutes provide substantial authority to local governmentsin coordinating transportation planning, access management and land development. Suchstatutes support a variety of planning mechanisms, including a) concurrency, whichrequires that that the necessary infrastructure (including transportation) be in place toaccommodate new development; b) urban growth boundaries, which containdevelopment and facilitate coordination of land use and infrastructure planning; c)impact fees, which levy marginal system infrastructure development costs on landdevelopment; and d) comprehensive plans that discourage strip commercial developmentand promote mixed-use clustered development.
Local zoning and subdivision regulations can include a variety of provisions thatserve access and interchange area management objectives (4). These include 1) setbackrequirements that recognize planned/future right-of-way needs; 2) limits on the numberand location of driveways per parcel; 3) driveway density limits and spacing minimumsin designated corridors; 3) minimum lot sizes and frontages in designated corridors; 4)limits on lot splits and “flag lot” subdivision; 5) requiring reverse frontage service roadsfor subdivisions abutting major thoroughfares and interchanges; and 6) limitingdriveway permits in commercially zoned corridors to promote joint and cross access toparking facilities.

Strathman, Kimpel, Leistner & Dueker 4
Induced TrafficThe consideration of induced traffic effects can be traced to the earliest cost-
benefit studies of highway improvements. A considerable amount recent research hasfocused on estimation of the magnitude of the induced traffic response to new capacity,following the work of Hanson and Huang (5), who estimated traffic growth after freewayexpansion in California. Noland and Lem (6) provide a synthesis of recent inducedtraffic research.
It is important to distinguish between short and long run changes in inducedtraffic. In the short run, induced traffic responses to capacity changes reflect theexpression of latent travel demand occasioned by the reduction in the generalized cost oftravel. In the longer term, the initial expression of latent demand is supplemented bychanges in land development patterns that are occasioned by the improvement inaccessibility associated with the change in highway capacity.
The longer-term changes in development patterns are of particular interest in thecase of freeway interchanges, given that new interchanges are capable of producingsubstantial improvements in accessibility. In this context, work by Cervero (7) andBoarnet and Chalermpong (8) provide good examples of the role that land developmentplays in induced traffic responses to highway capacity changes.
Cervero developed an empirical model that reflects four key effects: 1) increase intravel speeds following road improvements; 2) the change in urban development(accounting for institutional delays) following road and speed improvements; 3) theincrease in travel demand following speed improvements and changes in urbandevelopment; and 4) the eventual effects of increases in travel demand on the need forroad improvements.
The study by Boarnet and Chalermpong offers strong evidence that the constructionof toll roads in California produced accessibility benefits that were capitalized in thehousing market. The authors argue that the increase in property values is evidence of an“accessibility premium.” They find that the willingness to pay for an improvement inaccessibility influences both development patterns and induced travel.
INTERCHANGE AREA MANAGEMENT IN OREGONOregon’s well-established comprehensive planning system gives transportation
planners an advantage by formally requiring coordination of transportation and land useplanning at the local level, as well as coordination between local and state-level plans.State law requires every city and county to adopt a comprehensive plan and to implementzoning and land division regulations. ODOT has no formal role in reviewing orapproving local comprehensive plans; this responsibility is vested in the Department ofLand Conservation and Development (DLCD).
Oregon’s Transportation Planning Rule (TPR) sets out administrative rules toimplement transportation planning goals. With the exception of smaller communities,cities and counties are required to adopt Transportation System Plans (TSPs). A localTSP establishes a transportation network to serve state, regional, and local transportationneeds.
The 1999 Oregon Highway Plan (9) includes a number of policies and actionsrelated to the planning and management of interchanges and interchange areas. Thegeneral objective of these policies is to preserve the function of interchanges in serving

Strathman, Kimpel, Leistner & Dueker 5
system-level mobility needs and to manage access associated with local traffic. Relatedto this objective, the Highway Plan directs ODOT to develop coordinated approacheswith local governments to ensure that local comprehensive and transportation systemplans are compatible with the system-level mobility goals.
Policy 3C addresses interchange access management areas and is directly relevantto the present analysis. Under this policy, ODOT is directed to develop interchange areamanagement plans (IAMPs) to protect the function of interchanges and to minimize theneed for major improvements of existing interchanges. The policy calls for adherence torecently-revised interchange access standards (10) in new interchange construction and inimprovements to existing interchanges. Where feasible, it also encourages ODOT topurchase access rights in order to meet access standards, with primary considerationgiven to limiting access on interchange crossroads for a minimum of 1320 feet. Prior tointerchange construction, any necessary improvements in the local road network ininterchange areas must be identified in the local comprehensive plan, along with fundingcommitments.
Policy 1G directs ODOT to design major improvements to limit access andprotect through-traffic movement. The policy also directs ODOT to developintergovernmental agreements to establish necessary supporting actions that localgovernments must take in their comprehensive plans. When major improvements to statefacilities are identified in local transportation system and comprehensive plans, ODOTsupport is made contingent on the existence of local plan measures that would protect thefunction of the facility.
Policy 1B also relates to interchange area traffic management. This policy directsODOT to work with local government to limit the expansion of development along statehighways by promoting compact development away from state highways and avoidingexpansion of urban growth boundaries near interchanges. When UGB expansions occur,the Plan calls for ODOT to work with local governments to develop an interchangemanagement plan to protect interchange operation.
Interchange Area Management PlansTo date, four IAMPs have been completed in advance of interchange construction
projects in Oregon, and an additional 26 plans are in preparation. Two of the completedIAMPs provide a notable contrast. The first, covering two new interchanges at OR22/OR 99W and OR 22/Dallas Rickreall Highway, addresses two rural interchanges, andits general objective is to ensure that the interchanges will be protected from futuredevelopment. The second, addressing the Woodburn interchange of I-5 and OR 214,deals with an area that has experienced rapid commercial development over the past 15years, and its general purpose is to manage future development in order to extend thefunctional life of an existing interchange.
The provisions of the Rickreall IAMP are intended to preserve the rural status ofthe area and to limit access to the interchange. The plan calls for the preservation ofexisting land uses in the nearby unincorporated community of Rickreall, as well asmeasures that would prevent the City of Dallas (located about two miles away) fromexpanding its UGB toward the interchange. The county would maintain Exclusive FarmUse zoning and continue protection of resource and exception lands in the area. Thecounty would also construct an access road to divert local traffic from the interchange.

Strathman, Kimpel, Leistner & Dueker 6
Access rights of selected properties would be purchased to meet state access managementstandards. The final provision of the plan calls for early inclusion of ODOT in the reviewof any proposed development or redevelopment in the interchange areas that wouldsubstantially increase trip generation.
The Woodburn IAMP is represented in an interchange area overlay district, to beadopted by the City of Woodburn in its comprehensive plan. The primary objectives ofthe IAMP are two-fold: 1) to establish a “trip budget” in connection with future (20-year)development of vacant land in the interchange area; and 2) to limit comprehensive planamendments and zoning changes that would increase trip generation. The trip budget isapplied to future development of 962 vacant acres contained in four interchange sub-areas. The City of Woodburn can approve development of any parcel whose tripgeneration would exceed its proportional trip budget, and the proportional trip budgetsfor any sub-area can be exceeded as long as the overall trip budget for the overlay districtis not exceeded over the 20-year period. Comprehensive plan amendments in the overlaydistrict would be subject to several limitations: 1) amendments that would increasecommercial land area would be prohibited; and 2) amendments that would allow landuses generating trips in excess of the trip budget would be prohibited.
EMPIRICAL ANALYSISTo what extent do comprehensive plan amendments affect interchange traffic? In
this section we assess the geographic incidence of comprehensive plan amendments andstatistically analyze the relationship between plan amendments and interchange trafficvolume. With respect to plan amendments, our focus is on changes in designated landuse where the subject area is reclassified to either industrial or commercial use. Withrespect to geographic incidence, our interest relates to the proximity of plan amendmentsto interchanges on the state highway system. In this analysis, we define an amendment tobe proximate if it is located within one mile of an interchange.
The time frame of the analysis is influenced by data availability. The DLCD hasmaintained a consistent record of comprehensive plan amendments in the state from 1987to the present. Annual traffic count data for interchanges has been maintained by ODOTover a longer period, with the most recent report covering 2002. Thus, the time periodstudied is 1987-2002.
Geographic IncidenceAnalysis of the incidence of comprehensive plan amendments begins with the
selection of 273 grade-separated interchanges on the state highway system. Excludedfrom the analysis are rest area exits, and recently-constructed interchanges for whichtraffic count data does not exist prior to 2002.
The next step involved the use of GIS to create a one-mile buffer around eachinterchange to represent a traffic impact zone, where comprehensive plan amendmentsand subsequent development could be expected to have the greatest consequence oninterchange performance.
The locations of the 273 interchanges selected vary considerably with respect tourbanization status. Three categories were thus defined to distinguish interchangelocation in relation to UGBs. The first category (rural) includes 103 interchanges whoseone-mile buffer lies entirely outside a UGB. The second category (urban) includes 63
Strathman, Kimpel, Leistner & Dueker 7
interchanges whose buffer lies entirely inside a UGB. The final category (urban fringe)includes 107 interchanges whose buffer crosses a UGB and includes both urban and ruralland.
The next step involved the review of comprehensive plan amendments wherein adesignated land use was changed to either commercial or industrial activity. Thelocations of amendments meeting the defined land use change were established todetermine whether they resided inside an interchange buffer area. A total of 1,565amendments to commercial or industrial use occurred between 1987 and 2001 in which alocation could be established. (The location of an additional 39 amendments could not bedetermined). Nearly 29 percent (448) of these amendments were located within aninterchange buffer area.
The general incidence of plan amendments varies considerably (see Figure 1).Overall, about 54 percent of the study interchanges experienced no plan amendmentsbetween 1987 and 2001. The incidence was smallest for rural interchanges, where 95 of103 interchange areas (92.2%) did not contain an amendment. In the urban fringecategory, 39 of 107 interchanges (36.4%) did not contain an amendment within theirbuffers, while in the urban category, 14 of 63 interchange areas (22.2%) did not containan amendment. Seventy-eight interchanges (7 rural, 45 urban fringe and 26 urban) –about 29 percent of those in the study – contained one to three amendments. Theremaining 47 interchanges (about 17% of the total) experienced more than threeamendments, up to a maximum of 17 amendments in the cases of one urban and oneurban fringe interchange.
(Figure 1 about here)Regarding the geographic incidence of comprehensive plan amendments, a central
question is whether the likelihood of amendments occurring inside interchange buffers isgreater than the likelihood of them occurring outside the buffers. This can be representedby a location quotient, which is a measure of relative geographic incidence (12).
In the present analysis, the location quotient could be distorted by the smallnumber of rural plan amendments in relation to the very large rural area of Oregon.Thus, the location quotient is calculated for the urban and urban fringe interchanges, andis defined as follows:
LQ = Amendments Inside Urban & Fringe Buffers / Total Urban Buffer Area Amendments Outside Urban & Fringe Buffers / Net Total Urban Area
The urban buffer area is defined as the area lying inside a UGB, while the net total urbanarea is defined as the total area in Oregon within all UGBs less the urban area containedin the urban and fringe interchange buffers. In excluding rural interchanges, we assumethat the percentage of rural plan amendments located outside interchange buffers is equalto the overall percentage for all interchanges. Given the small number of planamendments inside rural interchange buffers, the sensitivity of the amended locationquotient to this assumption is very weak. We also assume that all amendments occurringoutside urban and fringe interchange buffers are still located inside a UGB. The value ofthe location quotient will be depressed by extent to which this assumption is violated,making it a fairly conservative estimate of relative geographic incidence. The resultinglocation quotient value is as follows:

Strathman, Kimpel, Leistner & Dueker 8
ALQ = 424 Amendments / 199,104 Acres 1093 Amendments / 618,383 Acres
= 1.25
Thus, it can be concluded that comprehensive plan amendments in urban areas are about25 percent more likely to occur in interchange areas than elsewhere.
Statistical AnalysisA statistical analysis was designed to estimate traffic volumes on interchanges as
influenced by mainline throughput volumes, the functional classification of intersectingroutes, selected locational characteristics, a proxy for growth (and traffic generation) inthe wider area, and the incidence of comprehensive plan amendments in interchangeareas. The primary purpose of the statistical analysis is to isolate the effects of planamendment activity from a variety of other factors that influence interchange trafficvolumes.
The model to be estimated takes the following general form:
IADTit = f(CPNOit, RAMPSit, DISTit, TADTit, IRCLSit, APOTit),
where i = interchange (= 1, … 273); t = year (= 1988, … 2002);
IADT = interchange ADT; CPNO = the cumulative number of plan amendments;RAMPS = the number of ramps comprising the interchange; DIST = the distance between interchanges; TADT = throughput ADT; IRCLS = intersecting route functional classification; APOT = population potential of the interchange travel shed.
ODOT’s Transportation Volume Tables (13) provide the data for the interchange andthroughput ADT variables. Between 1982 and 1992, ADT on highways and interchangeswas counted on a two-year cycle. In 1993, the counts went to a three-year cycle. In theintervening years, ADT estimates were based on data from automatic traffic recordersand ramp meters in urban areas.
Throughput ADT (TADT) represents the average daily traffic volumes recordedon the mainline between interchanges. This measure is the average of the bi-directionaltraffic volumes associated with an interchange in a given year. The RAMPS variable is acount of the number of exit and entry ramps associated with an interchange.
The CPNO variable measures the cumulative number of comprehensive planamendments that have been adopted within the interchange buffer area. Each incrementin the value of this variable occurs in the year following adoption, under the assumptionthat the subsequent year represents the earliest opportunity to observe a change in
Strathman, Kimpel, Leistner & Dueker 9
interchange ADT associated with traffic from plan amendment-related development.Thus, a plan amendment adopted in 1987 is given a value of one in 1988 and every yearthereafter. For a second amendment occurring in 1990, the value of the variable wouldincrease to two in 1991 and subsequent years.
IRCLS is a set of dummy variables representing the functional classification ofthe intersecting route at each interchange. It would have been useful to have trafficvolume data for intersecting routes, but consistent traffic count data over the study periodwere not available for county and local roads. Thus, a series of dummy variables is usedto designate the following categories: interstate highways; U.S. highways; statehighways; and county or local roads.
The population potential variable reflects the general level and growth of trip-making in the larger travel shed beyond the interchange buffer. It is a gravity formulationthat is directly related to the population of surrounding jurisdictions and their access to agiven interchange. Annual values of this variable were calculated using populationestimates for Oregon municipalities produced by the Center for Population Research atPortland State University. Distances from interchanges to municipalities were calculatedusing a GIS. Maximum perimeter distance and distance decay parameters were setaccording to whether an interchange was located in an urban or rural area. The perimeterdistance limit for urban interchanges was set at 5 miles. For rural interchanges, theperimeter distance limit was set at 20 miles. A distance decay value of 2.0 was set forurban areas, and a value of 1.5 for rural areas. The larger decay value for urbaninterchanges reflects generally lower speeds and closer spacing of interchanges there.
The DIST variable measures the average distance between a given interchange andthe facilities that precede and follow it, and was calculated using a GIS. Controlling forother determinants of interchange ADT, it is expected that interchanges that are moreseparated will experience greater traffic volumes.
Descriptive statistics for the variables across rural, urban fringe and urban interchangecategories are presented in Table 1. Interchange spacing clearly differs by level ofurbanization, averaging nearly 4 miles between rural interchanges, 2.5 miles betweenurban fringe interchanges, and 1.3 miles between urban interchanges. The meanpopulation potential associated with urban interchanges is more than seven times thecorresponding value for urban fringe interchanges, and more than a thousand timesgreater than the value for rural interchanges. The low population potential linked to ruralinterchanges reflects the limited number of municipalities outside Oregon’s metropolitanareas. With respect to the functional classification of intersecting routes, freeway-interstate connections range from about 11 percent for urban to about 1 percent for ruralinterchanges. US highway intersections are most prevalent among urban fringeinterchanges (18%), and occur at less than half that average frequency among urban andrural interchanges. State highway intersections occur at more than 25% of urban andurban fringe interchanges and at about 17% of rural interchanges. The remaininginterchanges intersect with county and local roads, which account for about 75% of ruralinterchanges and more than half of the urban and urban fringe interchanges. The meancumulative incidence of comprehensive plan amendments over the study period rangesfrom a high of 2.0 for urban interchanges to a low of .2 for rural interchanges. Averagethroughput volumes range from about 2,300 ADT for rural interchanges to more than40,500 ADT for urban interchanges.

Strathman, Kimpel, Leistner & Dueker 10
(Table 1 about here)Interchange ADT models were estimated by ordinary least-squares regression.
Several issues were addressed in the estimation process. The first issue concerned thequestion of whether the parameter estimates differed across rural, urban fringe, and urbaninterchanges. This was evaluated using the Chow test (14), which tests for parameterequivalence across sub-models. The hypothesis of parameter equivalence was rejected atthe .001 level. The second issue related to serial correlation across the temporalobservations in the sample. A Durbin-Watson test revealed significant serial correlation,and the Cochrane-Orcutt estimation procedure (14) was used to correct the problem. Thefinal issue related to the state highway intersecting route dummy variable, which wasnearly co-linear with the US highway dummy in several submodels. It was thus deleted,and the reference case for interpreting the coefficients of the remaining interstate and UShighway dummies becomes the composite of state, county and local roads.
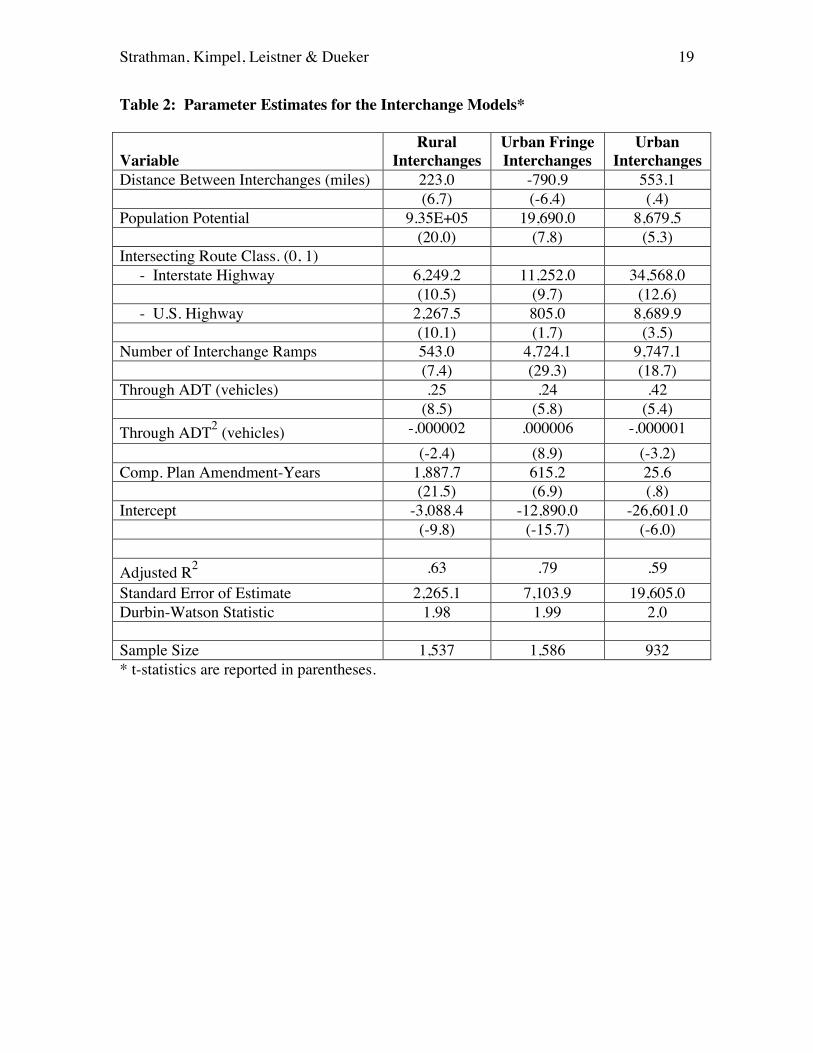
Regression results for the rural, urban fringe and urban interchange ADT modelsare presented in Table 2. Overall, the models fit the data fairly well, explaining between60 and 80 percent of the variation in interchange ADT. Most of the parameter estimatesare significant, with t-statistics exceeding the .05 critical value of 1.96.
(Table 2 about here)Spacing was estimated to have a significant positive effect on rural interchange
ADT, with a one-mile increment estimated to result in a 223 vehicle increase in ADT. Incontrast, a one-mile increment in urban fringe interchange spacing was estimated tolower ADT by about 790 vehicles, likely reflecting the transition from urban to exurbantraffic conditions. Urban interchange ADT was not found to be influenced by changes inspacing.
Increases in population potential were estimated to have a positive effect oninterchange ADT across all categories. Evaluated at the mean population potential, theestimated marginal interchange ADT effect is 168 vehicles for rural, 653 vehicles forurban fringe, and 2,130 vehicles for urban interchanges, respectively.
Relative to the reference case of state, county, and local intersecting roads, afreeway intersection with an interstate highway is estimated to produce an increment ofabout 6,250 vehicles on rural, 11,250 vehicles on urban fringe, and 34,570 vehicles onurban interchanges. The ADT increment associated with a US highway intersection issubstantially smaller, estimated at about 2,270 vehicles on rural, 805 vehicles on urbanfringe, and 8,690 vehicles on urban interchanges.
Given the definition of interchange ADT, additional ramps are estimated tocontribute to increases in total interchange traffic. On a per-ramp basis, the estimatedADT increment is about 540 vehicles on rural, 4,720 vehicles on urban fringe, and 9,750vehicles on urban interchanges.
Interchange ADT is estimated to be positively affected by changes in through-traffic volume. In this case, through traffic is represented by both linear and quadraticterms. When the linear term is positive and the quadratic term is negative (as is the casefor rural and urban interchanges), this indicates that interchange ADT increases at adecreasing rate with the growth of through traffic. When both terms are positive (as theyare for urban fringe interchanges), this indicates that interchange ADT increases at anincreasing rate (i.e., exponentially) with the growth of through traffic. The combinedmarginal effects of the linear and quadratic terms can be derived at the mean through

Strathman, Kimpel, Leistner & Dueker 11
traffic values for the three interchange categories. The resulting marginal interchangeADT effect associated with through traffic is .228 for rural, .348 for urban fringe, and.344 for urban interchanges. In other words, a 10-vehicle increase in through traffic ADTis estimated to result in a 2.3 vehicle increase in rural interchange ADT, a 3.5-vehicleincrease in urban fringe interchange ADT, and a 3.4-vehicle increase in urbaninterchange ADT.
The final term in the regressions relates to the effects of comprehensive planamendments on interchange ADT. In this case, an amendment is estimated to result in asubsequent, sustained 1,890-vehicle increase in rural interchange ADT and a 615-vehicleincrease in urban fringe interchange ADT. The estimated plan amendment effect onurban interchange ADT is quite small and not significant.
Given the limited number of plan amendments near rural interchanges, thesubstantial estimated traffic impact may reflect specialized traffic-serving or traffic-generating development. Interpreting the negligible impact of plan amendments nearurban interchanges is complicated by competing possibilities. One possible explanationis that a number of plan amendments in the Portland area, where a majority of the urbaninterchanges are located, have sought to intensify commercial and mixed-useddevelopment in town centers and corridors served by bus transit, and in light rail stationareas. These town centers, corridors, and station areas also tend to be fairly proximate tointerchanges. It may be that the incremental trips resulting from the intensifieddevelopment have been effectively served by transit and other alternative modes, withlittle vehicular impact on interchanges. An alternative interpretation is that with manyurban interchanges already experiencing congestion, additional development is simplycontributing to latent interchange traffic demand, with the consequence being a diversionof traffic to less congested alternative routes and trips that are rescheduled to lesscongested periods or foregone altogether, reflecting Down’s (15) triple convergenceprinciple. If so, it would complicate future design capacity decisions relating to urbaninterchange construction or improvement in terms of accounting for non-trivial induceddemand effects.
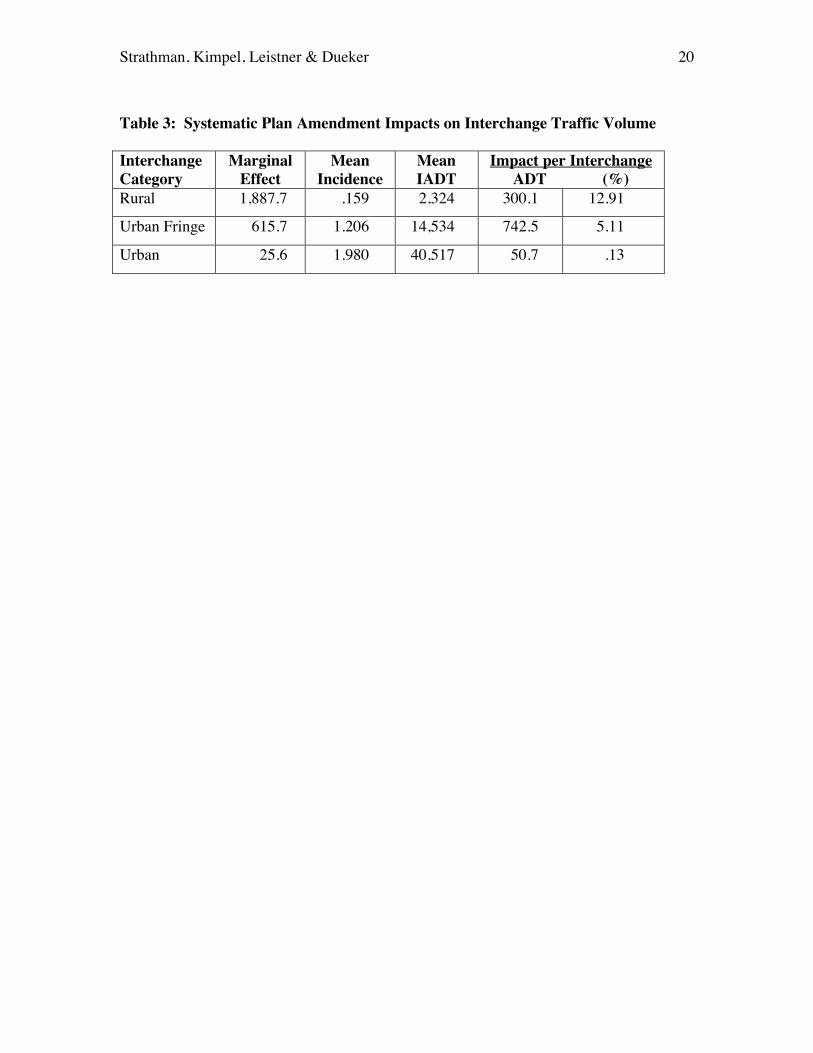
One way of summarizing the system-level interchange ADT effects ofcomprehensive plan amendments is to jointly consider their estimated marginal effectsand their incidence in relation to the mean interchange ADT, as expressed in thefollowing equation:
Impact (%) = (Marginal Effect * Mean Incidence / Mean Interchange ADT) * 100
As Table 3 shows, in circumstances where the estimated marginal effect of planamendments is quite large and the incidence of amendments is fairly limited, as is thecase for rural interchanges, the resulting ADT impact per interchange in that category issubstantially reduced. The alternative also holds where the incidence of amendments ismuch greater and the marginal effect is very small, as is the case for urban interchanges.
(Table 3 about here)The resulting ADT impact of plan amendments per rural interchange is about 300
vehicles, which represents nearly 13 percent of average interchange ADT. This is still afairly substantial impact in percentage terms, equivalent to over five years of the historicADT growth in that interchange category. However, nearly all of these rural facilities are
Strathman, Kimpel, Leistner & Dueker 12
diamond interchanges, and given their low mean ADT, it may be more relevant to relatethe nominal impact (i.e., 300 ADT) to their design capacity.
The ADT impact of plan amendments on urban fringe interchanges is more thantwice that of rural facilities, but given that the traffic these facilities accommodate ismore than six times the rural amount, the impact in percentage terms is much smaller.Nevertheless, at more than 5 percent of mean interchange ADT, the impact ofamendments is equivalent to just under two years of historic growth of urban fringeinterchange traffic. Finally, for urban interchanges, the impact of amendments isnegligible in both ADT and percentage terms, representing just over one month ofhistoric traffic growth on those facilities.
CONCLUSIONSIn this paper we have examined the effects of comprehensive plan amendments on
interchange performance on the Oregon highway system. Our examination has includeda review of literature related to interchange and access management, induced traffic, andthe experiences of other states. The review also covered ODOT policies and practicesrelated to land development in interchange areas, including the recent practice ofpreparing interchange area management plans in connection with interchangeconstruction or improvement. We documented the geographic incidence of planamendment activity in Oregon, finding a relatively greater likelihood of plan amendmentsoccurring near interchanges than elsewhere in urban areas. We estimated ADT modelsfor rural, urban fringe, and urban interchanges, and found that plan amendments accountfor a significant (though not necessarily substantial) share of interchange traffic volumein the cases of rural and urban fringe facilities. The absence of significant effects onurban interchange traffic can potentially be ascribed to either effective land use planningor a growth in latent demand.
While our findings provide insights to some questions, they also lead to theidentification of other issues that may deserve future investigation. First, although wehave documented the geographic incidence of comprehensive plan amendment activity,we do not yet have a good understanding of why this activity occurs where it does,recognizing that amendments were entirely absent in the vicinity of more than half of theinterchanges studied and varied considerably among the remainder. From a statisticalperspective, investigating this question would entail moving plan amendments from theright hand to the left hand side of the regressions, and then identifying a new set offactors representing key determinants of the land use regulation and developmentprocesses. It is possible that the resulting specification would include some of the samevariables employed in this study, recognizing that traffic and population accessibility canalso drive the land development process, especially in the commercial market.Statistically, this suggests that a simultaneous equations approach, wherein planamendment/development and interchange performance are jointly determined, mayprovide a more comprehensive treatment of these two processes.
Second, given that plan amendment activity has been found to affect interchangetraffic, the rationale for preparing IAMPs has been substantiated. These plans can beseen as a means of ensuring that interchanges achieve their design life. The agreementsalso act to reduce the uncertainty associated with the traffic forecasting process thatcontributes to the determination of interchange design capacity. Reduced uncertainty is
Strathman, Kimpel, Leistner & Dueker 13
likely to lead to more efficient use of resources when interchange design capacitycorresponds more closely to future traffic growth.
Although the agreements supporting the IAMPs do not contain languageaddressing future amendment, their 20-year time horizon raises the possibility thatchanging conditions could warrant re-negotiation. In her review of agreements betweenstate DOTs and local governments related to corridor management plans, Williams(2004: 27) concludes that the most effective agreements are sustained by a recognition ofthe need “… to make compromises from time to time to keep an agreement alive.”Oftentimes, compromise or change in such agreements can also raise fundamentalquestions related to financing and cost responsibility.
Presently, with most of the IAMPs in Oregon still in the process of preparation,there is no compelling reason to take up questions of re-negotiation and financing. In thefuture, however, consideration of a financial approach that will create a revenue stream tofund infrastructure expansion in interchange areas may be needed. Given the differingdevelopment circumstances prevailing in rural, urban fringe, and urban settings, severalgeneral alternatives can be envisioned.
In the case of new interchanges, impact fees on new trips could be levied to createa revenue stream to pay for improved access roads and/or expansion of interchange crossroads. The local government could administer the impact fee program and the IAMPcould provide for sharing revenue with ODOT if improvements were needed for stateroutes. In the case of interchange areas that have already experienced development thathas overtaxed the interchange and connecting roads, a Local Improvement District (LID)could be formed to create a revenue stream to finance both local road improvements andfreeway interchange expansion. The Interchange Management Plan would have toinclude an estimate of the total cost of improvements. The local government would needto agree to a cost-sharing arrangement for financing interchange expansion or otherrelated improvements to state facilities. Shares of the LID could be assigned to propertybased on floor area that is recalculated annually. This approach would allocate thefinancial responsibility of infrastructure expansion to both existing and new development.
ACKNOWLEDGEMENTFinancial support for this research was provided by the Research Unit of the OregonDepartment of Transportation. The authors thank the following individuals for theircomments and contributions to this effort: Jerri Bohard, Gretchen Harvey, Mark Joerger,Barnie Jones, Alan Kirk, Todd Putnam, Dick Reynolds and Anna Russo.
Strathman, Kimpel, Leistner & Dueker 14
REFERENCES1. Transportation Research Board. Access Management Manual. Washington, D.C.:
Transportation Research Board, National Research Council. 2003.
2. Plazak, D. “Bridging the Gap Between Access Management and Local Land UsePolicies,” Proceedings of the 1998 National Conference on Access Management,Session 8. Transportation Research Board Committee on Access Management.1998. 159-163.
3. Williams, K. and J. Forrester. Land Development Regulations that Promote AccessManagement. Synthesis of Highway Practice 233, National Cooperative HighwayResearch Program, Transportation Research Board, National Research Council.1996.
4. Land, L. and K. Williams. Land Development and Access Management Strategiesfor Florida Interchange Areas. Center for Urban Transportation Research,University of South Florida. 2000.
5. Hansen, M. and Y. Huang. Road supply and traffic in urban areas: A panel study.Transportation Research A, 31 (3), 1997. 205-218.
6. Noland, R. and L. Lem. A review of the evidence for induced travel and changes intransportation and environmental policy in the US and the UK. TransportationResearch D, 7 (1), 2002. 1-26.
7. Cervero, R. Road expansion, urban growth, and induced travel: A path analysis.Journal of the American Planning Association, 69 (2), 2003. 145-163.
8. Boarnet, M. and S. Chalermpong. New highways, house prices, and urbandevelopment: A case study of toll roads in Orange County, California. HousingPolicy Debate, 12 (3), 2001. 575-605.
9. Oregon Department of Transportation. 1999 Oregon Highway Plan. Salem, OR:Transportation Development Division. Planning Section. 1999.
10. Oregon Administrative Rules. Department of Transportation, Highway Division.Division 51. Highway Approaches, Access Control, Spacing Standards andMedians. OAR 734-051-0010 through 0560.
11. Isard, W. Methods of Regional Analysis. Cambridge MA: MIT Press. 1960.
12. Oregon Department of Transportation. Transportation Volume Tables. Salem, OR.Transportation Data Section. Transportation Systems Monitoring Unit. Variousyears.

Strathman, Kimpel, Leistner & Dueker 15
13. Pindyck, R. and D. Rubinfeld. Econometric Models and Economic Forecasts.Boston, MA: Irwin/McGraw Hill. 1998.
14. Downs, A. The law of peak-hour expressway congestion. Traffic Quarterly, 16 (3),1962. 393-409.

Strathman, Kimpel, Leistner & Dueker 16
List of Tables and Figures
Figure 1: Frequency Distribution of Plan Amendments in Interchange AreasTable 1: Means and Standard Deviations of Interchange Model VariablesTable 2: Parameter Estimates for the Interchange ModelsTable 3: Systematic Plan Amendment Impacts on Interchange Traffic Volume

Strathman, Kimpel, Leistner & Dueker 17
Figure 1: Frequency Distribution of Plan Amendments in Interchange Areas
0
20
40
60
80
100
120
140
160
0 1 2 3 4 5 6 7 8 9 10 >10No. of Plan Amendments
No. o
f Int
erch
ange
s
Rural Fringe Urban

Strathman, Kimpel, Leistner & Dueker 18
Table 1: Means and Standard Deviations of Interchange Model Variables
VariableRural
InterchangesUrban FringeInterchanges
UrbanInterchanges
Distance Between Interchanges (miles) 3.94 2.48 1.27S.D. (1.91) (1.52) (.58)Population Potential .00018 .033 .245
(.0014) (.075) (.440)Intersecting Route Class. (0, 1) - Interstate Highway .010 .028 .113
(.098) (.166) (.316) - U.S. Highway .078 .180 .086
(.268) (.384) (.280) - State Highway .166 .277 .258
(.372) (.448) (.438)Number of Interchange Ramps 3.66 4.17 4.35
(.87) (1.21) (1.46)Through ADT (vehicles) 8,448.2 18,645.0 51,100.0
(6,259.0) (15,271.0) (17,051.0)Through ADT2 (vehicles) 110.5E+06 580.7E+06 290.2E+07
(204.6E+06) (975.5E+06) (286.0E+07)Comp. Plan Amendment-Years .159 1.206 1.908
(.776) (2.07) (2.77)Interchange ADT (vehicles) 2,323.6 14,534.0 40,517.0
(3,717.5) (15,652.0) (30,733.0)
Sample Size 1,537 1,586 932
Strathman, Kimpel, Leistner & Dueker 19
Table 2: Parameter Estimates for the Interchange Models*
VariableRural
InterchangesUrban FringeInterchanges
UrbanInterchanges
Distance Between Interchanges (miles) 223.0 -790.9 553.1(6.7) (-6.4) (.4)
Population Potential 9.35E+05 19,690.0 8,679.5(20.0) (7.8) (5.3)
Intersecting Route Class. (0, 1) - Interstate Highway 6,249.2 11,252.0 34,568.0
(10.5) (9.7) (12.6) - U.S. Highway 2,267.5 805.0 8,689.9
(10.1) (1.7) (3.5)Number of Interchange Ramps 543.0 4,724.1 9,747.1
(7.4) (29.3) (18.7)Through ADT (vehicles) .25 .24 .42
(8.5) (5.8) (5.4)Through ADT2 (vehicles) -.000002 .000006 -.000001
(-2.4) (8.9) (-3.2)Comp. Plan Amendment-Years 1,887.7 615.2 25.6
(21.5) (6.9) (.8)Intercept -3,088.4 -12,890.0 -26,601.0
(-9.8) (-15.7) (-6.0)
Adjusted R2 .63 .79 .59Standard Error of Estimate 2,265.1 7,103.9 19,605.0Durbin-Watson Statistic 1.98 1.99 2.0
Sample Size 1,537 1,586 932* t-statistics are reported in parentheses.
Strathman, Kimpel, Leistner & Dueker 20
Table 3: Systematic Plan Amendment Impacts on Interchange Traffic Volume
InterchangeCategory
MarginalEffect
MeanIncidence
MeanIADT
Impact per InterchangeADT (%)
Rural 1,887.7 .159 2,324 300.1 12.91
Urban Fringe 615.7 1.206 14,534 742.5 5.11
Urban 25.6 1.980 40,517 50.7 .13