Embed Size (px)
Citation preview

/EFFECTS OF COMMUNAL AND INDIVIDUAL LAND
TENURE SYSTEMS ON LAND USE AND FOOD SECURITY IN KAJIADO DISTRICT, KENYA
u*"vrpsrr?
BY
TAMWATA AKINYI DOROTHY /
(B.Sc! Range Management) \ ' K^v'o
A THESIS SUBMITTED TO THE DEPARTMENT OF RANGE MANAGEMENT, UNIVERSITY OF NAIROBI, IN PARTIAL FULFILMENT OF THE REQUIREMENTS
FOR THE DEGREE OF MASTER OF SCIENCE IN RANGE MANAGEMENT(ECONOMICS OPTION)
O " 7 o ^
**1*OB, u H r\n ^
AUGUST 2004

DECLARATION
I hereby declare that the work contained in this thesis is my original work and has
never been submitted for a degree in any other University.
Amvvata Akinyi Dorothy
Signature
Dale
l
This thesis has been submitted for examination with our approval as University
Supervisors.
1. Prof. Dickson M.
Signature..
D a le ...9 .f/.Q & ,..P .t i'.
11
ACKNOWLEDGEMENT
I am highly indebted to my supervisors, Prof. Dickson M. Nyariki and Dr. Patrick, 1.
D. Kinyua, for their invaluable contribution and patience. 1 am also grateful to the
Kajiado District Range Officer, Mr. Otieno Osunga, and the extension officers in
Loitokitok Division for the role they played during data collection. Without their
support, the study would have been impossible to accomplish.
Special thanks go to the University of Nairobi for offering a scholarship for my M.Sc.
studies. Lastly, I thank the entire Range Management staff for their comments and
encouragement throughout the study.
iii
DEDICATION
This thesis is dedicated to my husband Julius Ogutu and my children Florence Akoth,
Theresa Awuor and Mike Akeyo.
IV

TABLE OF CONTENTS
PAGEDECLARATION.....................................................................................................................iiACKNOWLEDGEMENT.....................................................................................................iiiDEDICATION........................................................................................................................ ivTABLE OF CONTENTS........................................................................................................ vLIST OF TABLES.................................................................................................................viiLIST OF FIGURES............................................................................................................. viiiABSTRACT............................................................................................................................ixCHAPTER ONE.......................................................................................................................1INTRODUCTION................................................................................................................... 1
1.1 INTRODUCTION................................................................................................... 11.2 PROBLEM STATEMENT..................................................................................... 41.4 OBJECTIVES...........................................................................................................6
1.4.1 Specific Objectives........................................................................................... 61.5 HYPOTHESES........................................................................................................ 6
CHAPTER TWO..................................................................................................................... 7LITERATURE REVIEW....................................................................................................... 7
2.1 PASTORAL PRODUCTION SYSTEMS.............................................................72.2 PASTORALISM.................................................................................................... 72.3 LAND TENURE...................................................................................................... 9
2.3.1 History of Pastoral Maasai Land Tenure........................................................102.3.2 Land Tenure Regimes..................................................................................... 112.3.3 Land Tenure and Agricultural Productivity....................................................13
2.4 LIVESTOCK PRODUCTION.............................................................................. 152.5 FOOD SECURITY................................................................................................ 152.6 PASTORALISTS AND POLICY INTERVENTIONS..................................... 212.7 CONCLUSIONS.................................................................................................... 22
CHAPTER THREE................................................................................................................24RESEARCH METHODOLOGY......................................................................................... 24
3.1 INTRODUCTION.................................................................................................243.2 STUDY AREA...................................................................................................... 24
3.2.1 Location........................................................................................................... 243.2.2 Climate............................................................................................................. 253.2.3 Vegetation........................................................................................................ 253.2.4 Human Population and Land U se.................................................................. 26
3.3 SAMPLING DESIGN........................................................................................... 283.4 DATA COLLECTION......................................................................................... 28
3.4.1 Types o f Data Collected..................................................................................293.5 DATA ANALYSIS................................................................................................29
3.5.1 Descriptive Statistics....................................................................................... 293.5.2 Model Specification........................................................................................ 303.5.2.1 Multiple linear regression............................................................................. 303.5.2.2 Logistic regression........................................................................................ 323.5.3 Measurement and Definition of Variables used in the Models................. 333.5.3.1 Food security................................................................................................. 333.5.3.2 Household size...............................................................................................343.5.3.3 Total cash income..........................................................................................353.5.3.4 Livestock holdings.........................................................................................35

3.5.3.5 Sex of the household head............................................................................ 353.5.3.6 Level of education of household head.........................................................363.5.3.7 Age of the household head........................................................................... 363.5.3.8 Diversification...............................................................................................363.5.3.9 Land tenure.................................................................................................... 363.5.3.10 Number of malnourished children.............................................................373.5.3.11 Remittances.................................................................................................37
CHAPTER FOUR..................................................................................................................38RESULTS AND DISCUSSIONS........................................................................................ 38
4.1 INTRODUCTION.................................................................................................384.2 PASTORAL PERCEPTIONS............................................................................... 38
4.2.1 Current Land Use in Loitokitok Division..................................................... 384.2.2 Transhumant Pastoralists in Imbirikani Group Ranch..................................404.2.2.1 Grazing movement in Imbirikani group ranch...........................................414.2.2.2 Water resources in Imbirikani group ranch................................................414.2.3 Agropastoraiists in Rombo............................................................................41
4.3 SAMPLE CHARACTERISTICS.........................................................................434.3.1 The Maasai....................................................................................................... 434.3.2 Household S ize ................................................................................................444.3.3 Education......................................................................................................... 454.3.4 Age....................................................................................................................464.3.5 Herd Sizes........................................................................................................ 474.3.6 Milk Yield........................................................................................................ 484.3.7 Income from M ilk........................................................................................... 494.3.8 Land Sizes........................................................................................................ 504.3.9 Remittance....................................................................................................... 514.3.10 Employment................................................................................................... 524.3.11 Maize Relief................................................................................................... 524.3.12 Cash Income................................................................................................... 534.3.13 Food Production............................................................................................ 544.3.14 Expenditure on Food.....................................................................................554.3.15 Livestock Production....................................................................................56
4.4 OVERALL FOOD SECURITY AMONG TRANSHUMANT ANDAGROPASTORAL HOUSEHOLDS...................................................................57
4.5 REGRESSIONS......................................................................................................60CHAPTER FIVE.................................................................................................................... 65CONCLUSION AND RECOMMENDATIONS.................................................................65
5.1 CONCLUSION.......................................................................................................655.2 RECOMMENDATIONS...................................................................................... 66
REFERENCES....................................................................................................................... 68Appendix 1: Questionnaire................................................................................................... 79
M
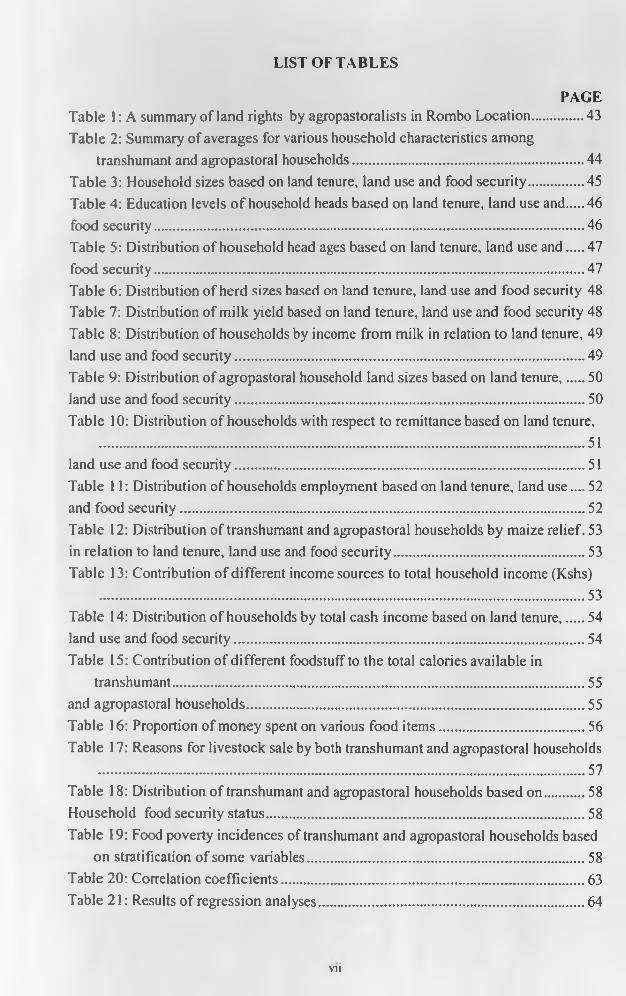
LIST OF TABLES
PAGETable 1: A summary of land rights by agropastoralists in Rombo Location............. 43Table 2: Summary of averages for various household characteristics among
transhumant and agropastoral households.............................................................. 44Table 3: Household sizes based on land tenure, land use and food security.............. 45Table 4: Education levels o f household heads based on land tenure, land use and 46food security......................................................................................................................46Table 5: Distribution of household head ages based on land tenure, land use and.... 47food security......................................................................................................................47Table 6: Distribution of herd sizes based on land tenure, land use and food security 48 Table 7: Distribution of milk yield based on land tenure, land use and food security 48 Table 8: Distribution of households by income from milk in relation to land tenure, 49land use and food security...............................................................................................49Table 9: Distribution of agropastoral household land sizes based on land tenure,.... 50land use and food security...............................................................................................50Table 10: Distribution of households with respect to remittance based on land tenure,
..................................................................................................................................... 51land use and food security...............................................................................................51Table 11: Distribution of households employment based on land tenure, land use.... 52and food security............................................................................................................... 52Table 12: Distribution of transhumant and agropastoral households by maize relief. 53 in relation to land tenure, land use and food security....................................................53Table 13: Contribution of different income sources to total household income (Kshs)
..................................................................................................................................... 53Table 14: Distribution of households by total cash income based on land tenure,.... 54land use and food security................................................................................................ 54Table 15: Contribution of different foodstuff to the total calories available in
transhumant................................................................................................................. 55and agropastoral households............................................................................................. 55Table 16: Proportion of money spent on various food items........................................ 56Table 17: Reasons for livestock sale by both transhumant and agropastoral households
......................................................................................................................................57Table 18: Distribution of transhumant and agropastoral households based on.......... 58Household food security status........................................................................................58Table 19: Food poverty incidences of transhumant and agropastoral households based
on stratification of some variables............................................................................ 58Table 20: Correlation coefficients................................................................................... 63Table 21: Results o f regression analyses......................................................................... 64
Vll
LIST OF FIGURES
PAGE
Figure 1: Location of the study area 27
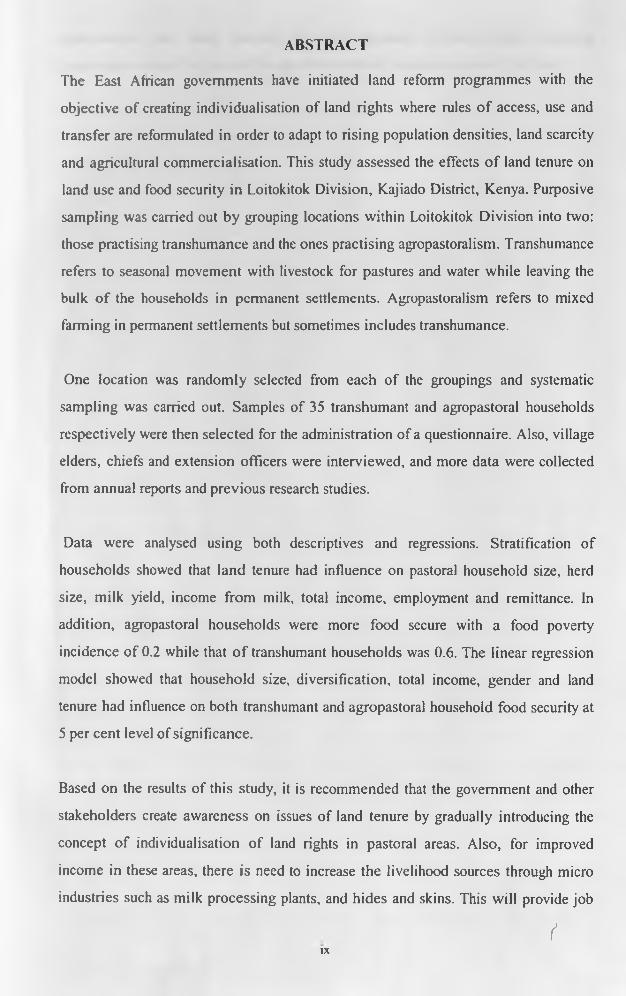
ABSTRACT
The East African governments have initiated land reform programmes with the
objective of creating individualisation of land rights where rules o f access, use and
transfer are reformulated in order to adapt to rising population densities, land scarcity
and agricultural commercialisation. This study assessed the effects o f land tenure on
land use and food security in Loitokitok Division, Kajiado District, Kenya. Purposive
sampling was carried out by grouping locations within Loitokitok Division into two:
those practising transhumance and the ones practising agropastoralism. Transhumance
refers to seasonal movement with livestock for pastures and water while leaving the
bulk o f the households in permanent settlements. Agropastoralism refers to mixed
farming in permanent settlements but sometimes includes transhumance.
One location was randomly selected from each of the groupings and systematic
sampling was carried out. Samples of 35 transhumant and agropastoral households
respectively were then selected for the administration of a questionnaire. Also, village
elders, chiefs and extension officers were interviewed, and more data were collected
from annual reports and previous research studies.
Data were analysed using both descriptives and regressions. Stratification of
households showed that land tenure had influence on pastoral household size, herd
size, milk yield, income from milk, total income, employment and remittance. In
addition, agropastoral households were more food secure with a food poverty
incidence of 0.2 while that o f transhumant households was 0.6. The linear regression
model showed that household size, diversification, total income, gender and land
tenure had influence on both transhumant and agropastoral household food security at
5 per cent level of significance.
Based on the results of this study, it is recommended that the government and other
stakeholders create awareness on issues of land tenure by gradually introducing the
concept of individualisation of land rights in pastoral areas. Also, for improved
income in these areas, there is need to increase the livelihood sources through micro
industries such as milk processing plants, and hides and skins. This will provide job
<IX

opportunities and ready markets for their products. Further, family planning
programmes should be provided to ensure household dependency ratio is reduced.
CHAPTER ONE
INTRODUCTION
1.1 INTRODUCTION
The United Nations strives to attain global food security through its agencies such as
Food and Agriculture Organisation (FAO), and the World Food Programme (WFP)
(FAO, 2000). This goal has remained elusive especially in the arid and semi-arid
areas that are often inhabited by the nomadic pastoralists. A good example is the hom
of Africa, where a catastrophic famine was experienced in Ethiopia in 1984 and
feverish efforts were on to avert future occurrences (Mulaku, 2000). Besides these
big international news making famines, there is always some more limited episode of
food insecurity in one or more of the countries in the hom of Africa at any given time.
Studies have shown that pastoralists lack cereal stocks and their animal prices tumble
in drought, grossly eroding their purchasing power (Sunya, 2003). All these, coupled
with their scattered distribution in often harsh and inaccessible terrain, generally make
them more vulnerable to famine than their agricultural counterparts (Mulaku, 2000).
A plurality of factors acting either singly or in concert has been cited as being
responsible for this trend (Ayan, 1981; Bonfiglioli, 1992; Farah and Haji, 1990; Bovin
and Manger, 1990). These factors include increased livestock and human populations;
breakdowns in traditional authorities regulating access to range resources; and
developments inconsistent with proper principles o f range management. In addition,
reduction of the range resource base due to encroachment by cultivators on the
reserve pastures and permanent water resources crucial for dry season grazing have
increased the occurrence o f droughts claiming a heavy toll on pastoralists and their
livestock (Noor et al., 1999).
I

The usual scenario of the international community responding with food aid when
people begin dying en masse can never be a long-term solution. Already there are
clear signs of donor fatigue in response to famine. The long-term solution lies in the
adoption of a long-term development strategy in the pastoral areas such that there will
be increased food production and conservation of natural resources in a more
sedentarised environment (Mulaku, 2000).
Food security is attained when sufficient growth in food crops and livestock is
achieved not only to maintain output per person, but also to reduce food calorie
deficits and to lower food imports (Nyariki and Wiggins, 1999). Land tenure refers to
the manner in which rights, restraints and responsibilities in land are allocated, held
and passed on in any jurisdiction determining who may do what with the land (Dale
and McLaughlin, 1999; Juma and Ojwang’, 1996; Mulaku, 2000). As all such
development must take place on land, one cannot plan and carry it out without regard
to prevailing land tenure arrangements (Kigutha, 1994; Mulaku, 2000).
Land use refers to the utilisation of the available land resources at the disposal of an
individual for the satisfaction and fulfillment o f human wants (Wandera, 1997). The
major land uses in the arid and semi-arid areas have been nomadism in the arid
regions, transhumance in the semi-arid regions and agropastoral ism in sub-humid
regions. Nomadism is characterised by frequent migration from place to place of a
whole community usually in search o f water and pasture. The nomads live in
temporary structures that they carry along as they move. Transhumance is the
occasional migration of part of a community to far away pasture while leaving the
bulk o f the community in permanent settlements. The transhumant pastoralists exploit
the good grazing grounds o f the arid and semi-arid lands (ASAL) in the rainy season,
but are forced to move to the savannahs due to lack o f water. Not only is the quality
of pasture low in savannahs, but also the risk of diseases is much higher. The
relationship between transhumant pastoralists and agropastoralists has always been
close through the exchange o f goods and services, despite the fact that these different
types o f land use are increasingly in conflict. These conflicts are attributed to the
occupation of better soils by agriculturists, which are the key dry season grazing
2
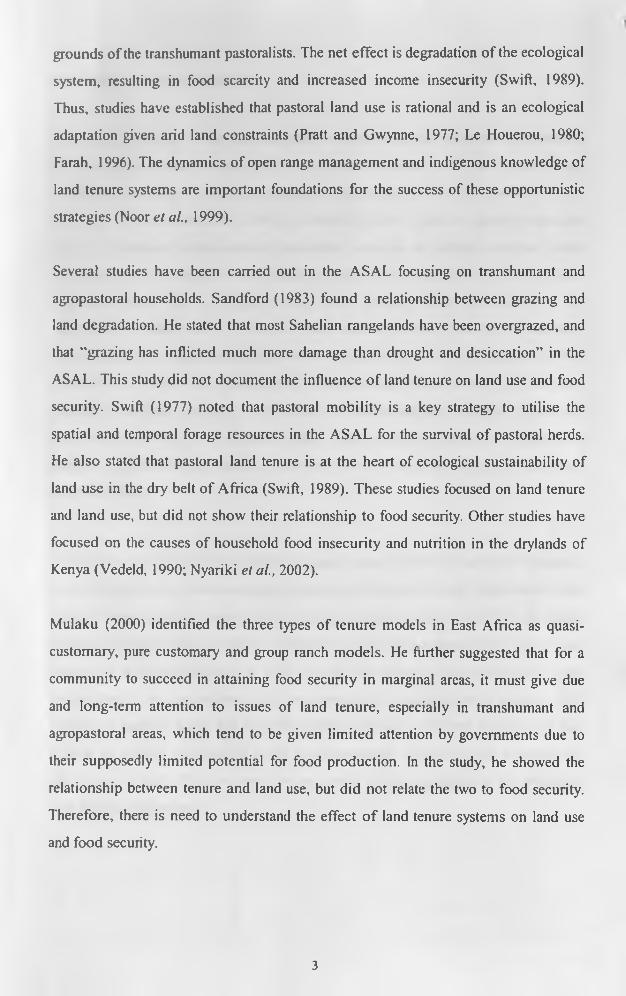
grounds of the transhumant pastoralists. The net effect is degradation of the ecological
system, resulting in food scarcity and increased income insecurity (Swift, 1989).
Thus, studies have established that pastoral land use is rational and is an ecological
adaptation given arid land constraints (Pratt and Gwynne, 1977; Le Houerou, 1980;
Farah, 1996). The dynamics of open range management and indigenous knowledge of
land tenure systems are important foundations for the success of these opportunistic
strategies (Noor et al., 1999).
Several studies have been carried out in the ASAL focusing on transhumant and
agropastoral households. Sandford (1983) found a relationship between grazing and
land degradation. He stated that most Sahelian rangelands have been overgrazed, and
that “grazing has inflicted much more damage than drought and desiccation” in the
ASAL. This study did not document the influence o f land tenure on land use and food
security. Swift (1977) noted that pastoral mobility is a key strategy to utilise the
spatial and temporal forage resources in the ASAL for the survival o f pastoral herds.
He also stated that pastoral land tenure is at the heart of ecological sustainability of
land use in the dry belt of Africa (Swift, 1989). These studies focused on land tenure
and land use, but did not show their relationship to food security. Other studies have
focused on the causes of household food insecurity and nutrition in the drylands of
Kenya (Vedeld, 1990; Nyariki et al., 2002).
Mulaku (2000) identified the three types of tenure models in East Africa as quasi-
customary, pure customary and group ranch models. He further suggested that for a
community to succeed in attaining food security in marginal areas, it must give due
and long-term attention to issues of land tenure, especially in transhumant and
agropastoral areas, which tend to be given limited attention by governments due to
their supposedly limited potential for food production. In the study, he showed the
relationship between tenure and land use, but did not relate the two to food security.
Therefore, there is need to understand the effect o f land tenure systems on land use
and food security.
3
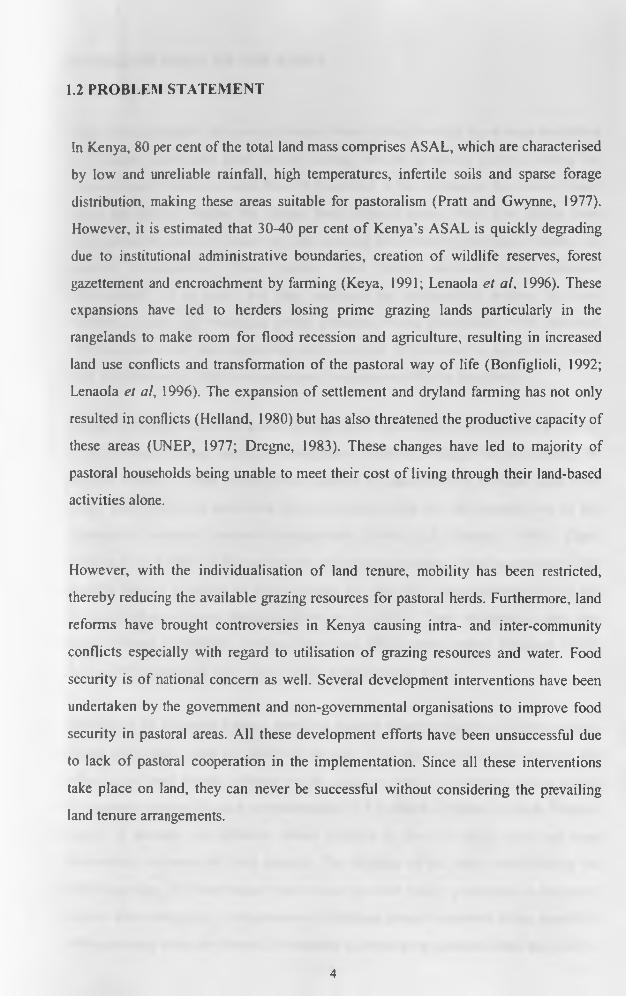
1.2 PROBLEM STATEMENT
In Kenya, 80 per cent of the total land mass comprises ASAL, which are characterised
by low and unreliable rainfall, high temperatures, infertile soils and sparse forage
distribution, making these areas suitable for pastoralism (Pratt and Gwynne, 1977).
However, it is estimated that 30-40 per cent o f Kenya’s ASAL is quickly degrading
due to institutional administrative boundaries, creation o f wildlife reserves, forest
gazettement and encroachment by farming (Keya, 1991; Lenaola et al. 1996). These
expansions have led to herders losing prime grazing lands particularly in the
rangelands to make room for flood recession and agriculture, resulting in increased
land use conflicts and transformation of the pastoral way o f life (Bonfiglioli, 1992;
Lenaola et al, 1996). The expansion of settlement and dryland farming has not only
resulted in conflicts (Helland, 1980) but has also threatened the productive capacity of
these areas (UNEP, 1977; Dregne, 1983). These changes have led to majority of
pastoral households being unable to meet their cost of living through their land-based
activities alone.
However, with the individualisation of land tenure, mobility has been restricted,
thereby reducing the available grazing resources for pastoral herds. Furthermore, land
reforms have brought controversies in Kenya causing intra- and inter-community
conflicts especially with regard to utilisation o f grazing resources and water. Food
security is of national concern as well. Several development interventions have been
undertaken by the government and non-governmental organisations to improve food
security in pastoral areas. All these development efforts have been unsuccessful due
to lack of pastoral cooperation in the implementation. Since all these interventions
take place on land, they can never be successful without considering the prevailing
land tenure arrangements.
4
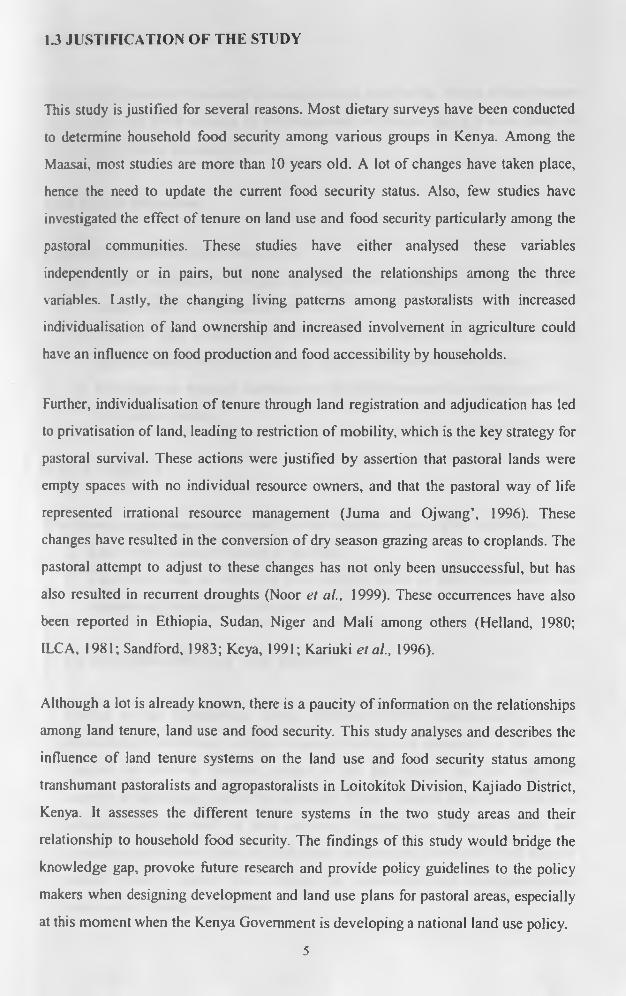
1J JUSTIFICATION OF THE STUDY
This study is justified for several reasons. Most dietary surveys have been conducted
to determine household food security among various groups in Kenya. Among the
Maasai, most studies are more than 10 years old. A lot of changes have taken place,
hence the need to update the current food security status. Also, few studies have
investigated the effect of tenure on land use and food security particularly among the
pastoral communities. These studies have either analysed these variables
independently or in pairs, but none analysed the relationships among the three
variables. Lastly, the changing living patterns among pastoralists with increased
individualisation o f land ownership and increased involvement in agriculture could
have an influence on food production and food accessibility by households.
Further, individualisation o f tenure through land registration and adjudication has led
to privatisation of land, leading to restriction of mobility, which is the key strategy for
pastoral survival. These actions were justified by assertion that pastoral lands were
empty spaces with no individual resource owners, and that the pastoral way of life
represented irrational resource management (Juma and Ojwang’, 1996). These
changes have resulted in the conversion o f dry season grazing areas to croplands. The
pastoral attempt to adjust to these changes has not only been unsuccessful, but has
also resulted in recurrent droughts (Noor et al., 1999). These occurrences have also
been reported in Ethiopia, Sudan, Niger and Mali among others (Helland, 1980;
ILCA, 1981; Sandford, 1983; Keya, 1991; Kariuki et al., 1996).
Although a lot is already known, there is a paucity o f information on the relationships
among land tenure, land use and food security. This study analyses and describes the
influence of land tenure systems on the land use and food security status among
transhumant pastoralists and agropastoralists in Loitokitok Division, Kajiado District,
Kenya. It assesses the different tenure systems in the two study areas and their
relationship to household food security. The findings of this study would bridge the
knowledge gap, provoke future research and provide policy guidelines to the policy
makers when designing development and land use plans for pastoral areas, especially
at this moment when the Kenya Government is developing a national land use policy.
5

1.4 OBJECTIVES
The broad objective of this study is to analyse and describe the effects of land tenure
on land use and food security in the rangelands of Kenya, taking a case study of
Loitokitok Division, Kajiado District.
1.4.1 Specific Objectives
The specific objectives of the study are to:
a) Identify and describe the types of land tenure systems in the study area, and
examine the effect o f each on land use.
b) Compare and contrast the livelihoods of transhumant pastoralists and
agropastoralists in the study area in relation to household food security.
c) Investigate the types o f institutions in the study area and their roles regarding
land tenure system.
1.5 HYPOTHESES
The following hypotheses were tested in order to achieve some of the objectives:
a) Land tenure has no influence on land use.
b) Land tenure has no effect on food security status of both transhumant and
agropastoral households in the study area.
1.6 ORGANISATION OF THE THESIS
Further to the introduction above, literature review, methodology, results,
discussions, conclusions and the recommendations are presented in the thesis.
Chapter two reviews literature related to the land tenure, land use and food
security in developing countries, including Kenya. Chapter three discusses data
collection and methods o f data analysis. Chapter four presents results and
discussion on different types of land tenure systems and household food security
models. Finally, chapter five provides the conclusions and recommendations
based on the findings of the study.
6
CHAPTER TWO
LITERATURE REVIEW
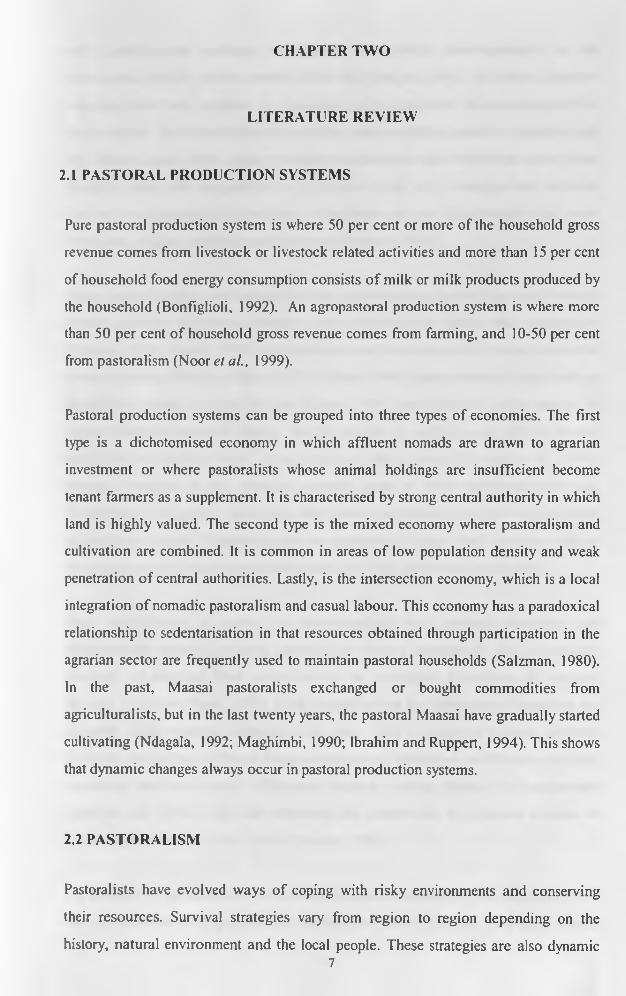
2.1 PASTORAL PRODUCTION SYSTEMS
Pure pastoral production system is where 50 per cent or more of the household gross
revenue comes from livestock or livestock related activities and more than 15 per cent
of household food energy consumption consists o f milk or milk products produced by
the household (Bonfiglioli, 1992). An agropastoral production system is where more
than 50 per cent of household gross revenue comes from farming, and 10-50 per cent
from pastoralism (Noor et al., 1999).
Pastoral production systems can be grouped into three types of economies. The first
type is a dichotomised economy in which affluent nomads are drawn to agrarian
investment or where pastoralists whose animal holdings are insufficient become
tenant farmers as a supplement. It is characterised by strong central authority in which
land is highly valued. The second type is the mixed economy where pastoralism and
cultivation are combined. It is common in areas o f low population density and weak
penetration of central authorities. Lastly, is the intersection economy, which is a local
integration o f nomadic pastoralism and casual labour. This economy has a paradoxical
relationship to sedentarisation in that resources obtained through participation in the
agrarian sector are frequently used to maintain pastoral households (Salzman, 1980).
In the past, Maasai pastoralists exchanged or bought commodities from
agriculturalists, but in the last twenty years, the pastoral Maasai have gradually started
cultivating (Ndagala, 1992; Maghimbi, 1990; Ibrahim and Ruppert, 1994). This shows
that dynamic changes always occur in pastoral production systems.
2.2 PASTORALISM
Pastoralists have evolved ways of coping with risky environments and conserving
their resources. Survival strategies vary from region to region depending on the
history, natural environment and the local people. These strategies are also dynamic7

with modifications evolving in response to gradual transformations in the
environment and the social context (Bovin and Manger, 1990). Traditional adaptive
strategies have been adopted as a response to the uncertain characteristics of the
dryland areas. Traditional adaptation practices stress mobility, social co-operation and
high labour inputs. These coping mechanisms attempt to deal with crisis arising from
drought, famine and marginalisation. Apart from these, other strategies have arisen to
deal with environmental degradation, while some are new adjustments to the more
immediate impacts o f development projects (Helland, 1980).
Other pastoral coping mechanisms include maintenance of more than one livestock
species; splitting of livestock holdings into units based on species and management
(Morton, 1990; Niamir, 1991); establishment and maintenance of a social system for
resource sharing (Dahl and Hjort, 1979; Raikes, 1981); maintenance o f large herds as
possible to restock after the drought (Niamir, 1991) and reduction in the number of
reliant household members during drought periods by sending away all able bodied
people not required to work in adjacent agricultural areas (Kariuki et al., 1996).
Pastoral strategies o f risk aversion generally focus on herd modifications through
diversification of species, dispersion, distribution and expansion to provide protection
against heavy losses. These strategies are analogous to agricultural practices such as
multi-cropping and reserve granaries in areas of risky agricultural production.
Herd modification is central to understanding both pastoral strategies and
redistribution systems. Herding activities are thus a response to the household’s
necessity of adapting food production to the ecological limitations of marginal
drylands (Dahl and Hjort, 1976). Herd diversification has advantage o f spreading the
available food resources throughout the year. This is achieved because different
livestock species have different forage requirements, adaptation to different ecological
conditions and behavioural differences creating varying degrees in management
(Noor et al., 1999). This has motivated the pastoralists to optimise number of
livestock per unit area of the ASAL (Cossins, 1983).
The attempt by the pastoralists to optimise livestock numbers per unit o f arid land has
been misunderstood by government officials and some scholars. They have viewed
8
pastoralists as having excessive numbers of livestock that overgraze and ultimately
degrade the land by practising an inefficient “out of date” type of economy (Lane,
1991). This has led to policies for destocking of pastoral herds and transformation of
pastoral land use through village settlement schemes, rangeland enclosures and
alienation of pastures for non-pastoral purposes. Although pastoralists have been able
to either accommodate or avoid most of these impositions, they have to date failed to
prevent widespread alienation from their lands. This inability stems from the
difficulty they have in defending variable and sometimes transitory occupation of
land, and the particular susceptibility of common land to encroachment by settlers and
appropriation by the state (Lane, 1991). The result o f misconceptions about the nature
of pastoralism and pastoral land tenure have not only provided justification for its
transformation, but also facilitated the alienation process itself. Furthermore, these
misconceptions have led government actions and policies that are contrary to pastoral
way of life (Dahl and Hjort, 1976).
2.3 LAND TENURE
Land is a productive asset essential for the production of both food and raw materials.
It determines income distribution and access to food in the rural areas. It therefore
follows that nutrition among the rural people is closely related to land tenure status
and the size of land holdings (Kigutha, 1994). For this reason, the distribution of rural
wealth and food poverty incidence are related to socio-economic order that
determines the type o f access to land and its use in society (FAO, 1986; Kigutha,
1994; Otsuka and Place, 2001).
Land tenure system is defined as possession or holding of the rights associated with
each parcel of land. It has three dimensions, namely people, space and time (Ogolla
and Mugabe, 1996). It helps define people’s relationship to the land and the limits of
rights any person has to a given parcel of land. Time aspect determines the duration of
one’s right on land, whether freehold or rental. In freehold, landowners have full
private ownership that is free o f any obligations to the state other than payment of
taxes and observance o f land use controls, imposed in the public interest. In rental
arrangements, there is an agreement for temporary use by a lessee, who pays rent to
9

the lessor (Juma and Ojwang’, 1996) and the spatial dimension limits the physical
area over which the rights are to be exercised (Robinson. 1994; Ogolla and Mugabe,
1996; FAO, 2001).
2.3.1 History of Pastoral Maasai Land Tenure
From the dawn o f colonialism through independence, the Maasai experienced
continuous disruption of their indigenous cultural ties to the ecosystems. The colonial
authorities perceived the Maasai as fearless and warlike. Traditionally, the Maasai had
no centralised government. The political authority was vested in elders who reached
decisions by consensus. The colonial and post-colonial authorities viewed the Maasai
as obstacles to development. This was because of their adherence to traditional
customs and economic way o f life presented problems of administrative control,
public security and administration of justice (Porohoryles and Szeskin, 1973).
The economic style o f the Maasai depends on communal systems of land holding that
maximises the feeding of the whole community. Maasai land was divided among
clans in such a way that each portion constituted a self-sustaining economic and
environmental unit. This was achieved by determination of claims according to the
existence o f water points and availability o f water for the herds of each clan.
Mulaku (2000) categorised land tenure systems in pastoral areas of East Africa into
three models, namely customary model, quasi-customary model, and group ranch
model. The customary model was previously common among the Maasai of Kenya
and Tanzania; land belonged to a large family, most of whose members had already
died, some were alive, and a great majority, yet to be bom (Porohoryles and Szeskin,
1973). The tribal elders allocated grazing resources such as watering points,
multipurpose trees and shmbs to various family groups within the clan. The clan
elders also regulated the migration patterns of different clans as dictated by the forage
conditions. However, this model ceased to exist when East African governments
declared pastoral areas as trust land in 1968.
10
The quasi-customary model was introduced after declaration o f pastoral areas as trust
land by East African governments. There was little change in the ways pastoral
communities held land. The government failed to penetrate pastoral areas due to poor
communication, making aid agencies and non-governmental organisations more
visible in these areas. Despite the invisible hand o f the government, it was able to
interfere with management o f land. This led to confusion and conflicts of interest,
making the Kenyan government to introduce the concept of group ranching.
In 1968, the Kenya Government developed the group ranch model in an attempt to
commercialise livestock production as well as sedentanse the Maasai. The Group
Representatives Act (GOK, 1968) governs the constitution and administration of
groups, while adjudication rights and registration are governed by agricultural
legislations. The group elects its members as group representatives, who are
registered by the government as trustees. The trustees regulate and control land use
and also mortgage the land on behalf of members. Disputes among group members in
relation to land are settled through the regular government court system. Examples of
group ranches are found in Kajiado and Narok Districts. At present this model is
facing problems due to conflicts arising between group members and their trustees
who are corrupt. As a result, group ranch sub-divisions are underway, with
individuals preferring to own pieces of land. Examples of already sub-divided group
ranches are Rombo and Kaputiei in Kajiado District.
2.3.2 Land Tenure Regimes
African land tenure is complex and could perhaps be best described at various points
on a tenure continuum. This continuum tends to be reduced at the national level to
three essential types: customary tenure, private tenure and state controlled land, in
which the latter may potentially be subject to either of the foregoing (Juma and
Ojwang’, 1996). The difference between customary tenure and open access is that
under customary tenure those in power ("the owners") exercise their rights to exclude
non-members, who in turn have a duty to respect that exclusion. The members ("the
co-owners") are responsible for the exercise of both rights and duties related to the use
and maintenance of the natural resources held in common by the members. The
II

breakdown of the tribal institutions in regulating a communal resource gives rise to
open access (Bromley, 1989).
There are three classifications of land tenure based on property regimes, namely
private property, communal property and state controlled property (Ogolla and
Mugabe, 1996). Private or individual property (ownership) denotes a bundle of rights
defining the owners’ rights, privileges and use o f a resource. State property occurs in
situations where the government regulates and controls access to land. The state
claims exclusive rights to land resource through sovereign application. The
government may directly control and utilise land through its administrative arms or
grant use rights to communities or individuals. In this process government took most
o f properties previously held by communities. Therefore, common property is
controlled by a single entity and its access is limited to an identifiable community,
which has set rules on the way the resource is managed and can exclude others from
accessing the resource (Ongugo and Mwangi, 1996).
In the absence of property rights in resource use, the situation that exists is open
access or res nullius. Nobody owns the resource, and access is on first come first
served basis. However, unlike common property, open access resource users are not
subject to any limits in the usage of property. In addition, open access users have no
responsibility to a collective group to utilise resources in a manner that does not
adversely affect the rights of other users. Failure to regulate resources results in open
access, hence the tragedy of the commons.
2.3.2.1 Tragedy of the commons
Even if the rationality o f pastoral production is accepted by many, a few have argued
against traditional pastoralism (Lane, 1991). Lane and Swift (1989) found that
African pastoralists have land tenure systems that are incapable of efficient land use.
This is because pastoralists move their herd in response to the spatial and seasonal
variation in range resources due to common land tenure arrangement. The problem
has been the inability of the pastoralists to control individual land use of the
commons. Individual herders are interested in increasing their livestock holdings, and
it is thought that there is no limit to the use of the common resource. Therefore, stock12
numbers will inevitably increase until they overgraze and degrade the land. The
tragedy of the commons is based on two assumptions: that access is open to all
without restraint and herders possess self-interest (Hardins, 1926).
2.3.3 Land Tenure and Agricultural Productivity
The most common way that security and land tenure issues are linked in the literature
is in discussions of security o f tenure on farmland (Atwood, 1990; Conway and
Barbier, 1990; Migot-Adholla et al., 1991; Migot-Adholla et al., 1994). However,
discussions of security-tenure connections in relation to communal, state and open
access are more limited. The importance of common property resources for the poor is
sometimes mentioned in literature on security and livelihoods or on common property
(Davis et al., 1991; Djoura et al., 1991; Migot-Adholla et al., 1994; Robinson, 1994),
but seldom is any detailed analysis of the relationship between these tenure systems
and food security done.
Currently, there is little consensus among scholars on the effects of land tenure on
productivity in Africa, and particularly in Kenya. Conclusions tend to vary depending
on the period o f analysis. For instance, between 1960 and early 1970s production rose
at a high rate, which some scholars attributed to land reform. In the highlands and
high-density settlement schemes, small-scale farmers realised higher yields than those
in low-density, large-scale farms. However, in the 1980s and 1990s, production levels
failed to match increases in population due in part to land tenure problems such as
continuous land sub-divisions and poor agricultural land use policies (Ondiege, 1996).
Other scholars have questioned the casual relationship between individual tenure and
increased agricultural productivity (Heyer et al., 1976). These researchers argue that
increased agricultural productivity in Kenya seen during the 1950s and 1960s was due
to the lifting of the ban prohibiting Africans from growing high-value crops, rather
than the introduction of individual tenure systems. Also, most surveys have been
carried out in the rainfed famiing areas rather than in the ASAL (Migot-Adholla etal.,
1991). A weak relationship was found between individualisation of land rights and
agricultural productivity in Kenya and Ghana. In contrast, the result from Rwanda
13
showed that individualisation o f land rights improved agricultural production in areas
with low land-labour ratio. These researchers also found that communal tenure
systems are flexible and responsive to changing economic conditions. For example,
with increased population pressure and commercialisation, communal rights systems
evolve to individual rights. Tiffen et al. (1994) confirmed this view that by 1930 in
Machakos, customary tenure had already recognised private rights, particularly in
cultivated areas.
Feder et al. (1988) and Feder and Fenny (1991) noted a positive relationship between
land rights and productivity in Thailand. They found that with individualisation of
land rights, individuals are motivated to use land improvements and inputs that
increase output per unit area of land. These findings were challenged by Migot-
Adholla et al. (1994) and Bruce et al. (1994) who concluded that the effects of land
rights do not appear to constrain agricultural productivity. They argued that farmers
are likely to feel secure in their ability to continuously cultivate their land regardless
o f the rights category. The above was further refuted by Mulaku (2000) who
suggested that individualisation of group ranches is the best way to improve food
security in pastoral areas by explaining that with registration of individual pieces of
land, households would concentrate on agriculture and avoid infiltration of other
groups through land purchases.
Pastureland tenure is described as most politically sensitive and socio-economically
complex. Land tenure system, as already discussed, can have a profound consequence
on food security by affecting, which livelihood assets people will rely upon and will
invest in. For example, where pastureland is open access, users will usually be
unwilling to invest in the land because there is no way to exclude “freeriders”. When
open access is compared to customary tenure where inter-community boundaries are
strictly enforced, access is more limited, but it is more feasible to invest in land. Land
will tend to hold more value as a resource in customary tenure than under open
access. In conclusion, land tenure system is likely to influence the nature of land use,
whether livestock production or mixed farming that influence livelihood strategies
(Robinson, 1994).
14

2.4 LIVESTOCK PRODUCTION
Livestock production is characterised by three principles, namely: adaptation to the
environment that involves matching the erratic and seasonal patterns of primary
productivity for continuous forage supply for the livestock; risk aversion that involves
adoption of special management strategies of herd modifications; and adaptation to
the institutional environment allowing institutional linkages that control and regulate
common grazing resources (Porohoryles and Szeskin, 1973; Jahnke, 1982). Failure of
the local institutions to perform their roles, “the tragedy of the commons” sets in the
communally owned resources (Hercovits, 1926). Therefore, sound livestock
management is necessary for sustainability.
Livestock has over the years played important functions in pastoral households. These
include output, input, social, cultural, risk and security functions. The output function
is where livestock provides food and can also be converted into cash to purchase food
for households in times of hardship (Dahl and Hjort, 1976; Jahnke, 1982; Tangka et
al„ 2000). Input function is use of livestock as a capital good in the production
process by providing traction and manure for agropastoral households, and raw
materials for use in leather industries. Social and cultural functions are use of
livestock to pay for bride price, an indication of wealth and status. Lastly, the asset
and security functions are when livestock is sold to obtain cash to solve family
financial problems and as a guarantee against soft loans. To this extent, livestock
contributes to food security through increased livestock output and non-livestock
products, employment creation and income generation, assuring access to food
(Nyariki, 1998).
2.5 FOOD SECURITY
Since 1970s food security has been an important focus of the international
development, although lately this seems to have been overshadowed by
environmental concerns. The driving force for food security has been the recurrent
famine o f the early 1970s and mid 1980s, and discussions on food security often
revolve around famine definition, explanation and prevention (Muthoka, 1996;
Nyariki and Wiggins, 1999). Discussions on food security have also focused on15
various levels from individual to international, but food security is “most often
conceptualised as a macro phenomenon-deviation from trend in aggregate
consumption” (Clay, 1981). It is frequently discussed in relation to topics such as
international markets, macro-economic policy, national food distribution systems and
political instability.
Food security may be defined as access by all people at all times to adequate food for
active life (Kigutha, 1994; Nyariki and Wiggins, 1997). Although food is a defining
concept, it is not all that matters. Food security encompasses food availability through
production, storage or imports; and the access that people have to food through their
purchasing power in the markets (Nyariki and Wiggins, 1997). Access derives from the
entitlements a household has to food, either through its own production o f foodstuffs or
through command over food in markets or other circuits, decisions over the amount
and kind of food produced or bought, the internal distribution of household food
amongst residents, and the health of individuals which affects the ability to secure
nourishments from food (Nyariki et al., 2002). Therefore food security issues are
important for planning and managing natural resources to improve pastoral livelihoods.
This is because they underscore the complexity o f ever-changing rural livelihoods,
especially in terms of changing access to physical resources essential for survival
(FAO, 1989).
The food situation in Kenya today is drastically different from that of the mid 1970s.
Much effort has been geared towards increasing food production in order to cope with
the massive food shortages faced due to rapidly growing population. Policies aimed at
increasing agricultural production were stressed and many of the modern improved
agricultural technologies have gone a long way in reducing hunger (Kennedy and
Haddad, 1994). Reduction in hunger has been attained through increased agriculture,
employment as well as indirectly through lower food prices and non-agricultural
employment.
In literature, there are several discussions on food security at national and household
levels. However, the problem o f food security at micro level is formulated in different
ways and the focus is not always set narrowly on food. For example, in some
16
formulations, “food security is essentially a proxy for poverty” (Maxwell, 1990).
Some writers have gone further to argue that poverty is the central focal point and that
food security must be seen as only one aspect o f poverty. In support of the above,
Robinson (1994) stated that “there are risks that using food security approach might
impart a biased or partial understanding o f poverty by neglecting aspects such as asset
holding or dependency, or might lead to over-emphasis on consumption-oriented
interventions, which prove to be unsustainable.
The concept of “sustainable livelihood security” has been suggested as a replacement
for “food security” (Chambers, 1987). This is because poor rural people seldom limit
themselves to agriculture in constructing a living; the concept o f “livelihood security”,
therefore, should more accurately reflect the needs and concerns of the rural poor than
food security”. For the purpose of this study, the term “food security” is used even
though it is often associated with more macro issues. This is because the livelihood
security concept suggested by Chambers (1987) is relative and quite general.
Furthermore, studies that have focused on national food security have either under
estimated or overestimated the actual calories available for the households. For
example, Kennedy and Haddad (1994) reported that in studies where national food
sufficiency has been seen as a proxy for household food security, 20-30 per cent of
the populations consume less than 80 per cent of the calories requirement, even when
the per cappita supply is at or above 100 per cent o f need. Therefore, the household
food security approach would be the most appropriate because it is also dependent
upon the people’s livelihood strategies, which are defined as ways used by rural poor
to cope with the threats that face their livelihoods (Chambers and Conway, 1992).
They are general patterns of behaviour that can be based on conscious decisions and
habitual practice imbedded in culture.
In discussing how the rural people cope with vulnerability to famine, Swift (1989)
refers to three broad categories of assets that can be relied upon: investments, stores
and claims. Investments are those assets that are expected to contribute to production
and can include education, farming equipment, wells and soil conservation. Stores
refer to food stores, jewelry, money and bank accounts. Investments and stores are
generally under the control of households. On the other hand, claims refer to a wide
17
range of wider social and political processes, whose activation depends on some level
of collective decisions. Claims in a household include claims on patrons and big men,
claims on the government, and claims on the international community. Unfortunately,
land, especially common land, does not fit easily into this scheme. Instead, stores,
investments and claims are types of assets that may be cashed in when households
face a crisis, production assets are sold, granaries are emptied, jewelry is sold, bank
accounts emptied, loaned animals recalled, labour debts called in and community
support mechanisms activated.
Chambers and Conway (1992) have rearranged Swift’s grouping o f assets and
developed it further in an attempt to produce a holistic model of rural livelihood. It
has three components that include people (and livelihood capabilities), tangible assets
(stores and resources) and intangible assets (claims and access). These are brought
together to produce a living. Robinson (1994) argued that what Chambers and
Conway call “livelihood capabilities” might be more familiarly termed “human
resources”. But either label is incomplete in that it includes people’s capabilities and
not their goals. People with same capabilities and same assets may choose to produce
a living different ways. They may grow different crops, may choose a different
balance between cultivation and livestock keeping, or choose a different mixture of
agricultural and non-agricultural activities.
Estimation of pastoral household welfare
There are a number o f approaches to measuring the economic welfare of the rural
households. The approaches used differ in terms o f the importance attached to the
individuals’ own judgement o f well-being versus a concept of welfare decided upon
by somebody else. The indices used to measure the welfare o f people include head
count, gini coefficient, poverty gap and squared poverty gap (Nyariki and Wiggins,
1997; http / www. poverty. Com).
The head count index refers to the proportion o f the population whose economic
welfare is less than the poverty line. It measures how widespread poverty is in any
social setting. It is the most commonly used approach in developing countries because
18
the welfare of the people is best indicated by the nutritional attainments that are easy
to estimate. The Gini coefficient is not commonly used because it gives consideration
to income levels that are difficult to estimate and also greatly fluctuates over time.
The poverty gap index measures how poor the poor are while the squared poverty gap
index measures the severity o f poverty by giving more weight to the poorest of the
poor (Nyariki and Wiggins, 1997; http / www. poverty, com). For this study, the head
count index with respect to food consumption (food poverty incidence) was employed
to assess the food security status o f pastoral households.
Researchers have used the poverty incidence to determine food security status of
households. Food poverty incidence is the ratio o f food poor households to all
households in a community (Sunya, 2003). The ratio gives the food poverty status of
the community under investigation (Nyariki and Wiggins, 1997; GOK, 2000a). This
approach involves the collection of day-to-day data on household food consumption.
The food consumed on a weekly basis was estimated for a period of six months, and
then converted to its calorie value based on values by Nyariki et al. (2002). The
calorie value o f each foodstuff consumed was calculated and then summed up to
obtain the total calorie consumption per household per day. The total calories
consumed per day were then divided by the sum o f Active African Man Equivalence
(AAME) to obtain the calories consumed per AAME. The value obtained was
compared with the standard calorie requirement o f 2,250 kcal. If the ratio was less
than one, the household was food insecure and if it was one or more the household
was considered food secure (GOK, 2000a; Nyariki et al., 2002; Sunya, 2003).
Standard units to compare the nutritional requirements of people of different ages and
gender exist. The daily caloric intake by members o f households is used as a measure
of household food security (Nyariki and Wiggins, 1999). The assumption is that the
daily food energy requirement o f one AAME is 2,250 kcal (ILCA, 1981; Nyariki and
Wiggins, 1997; Sunya, 2003). The consumption weights by ages are 0-4 years, 0.24
AAME; 5-14 years, 0.65 AAME and above 15 years, 1.00 AAME (GOK, 2000a).
Child nutrition has also been reported to be essential in determining household food
security, especially when the security of intra-household nutrition is a concern raised
19
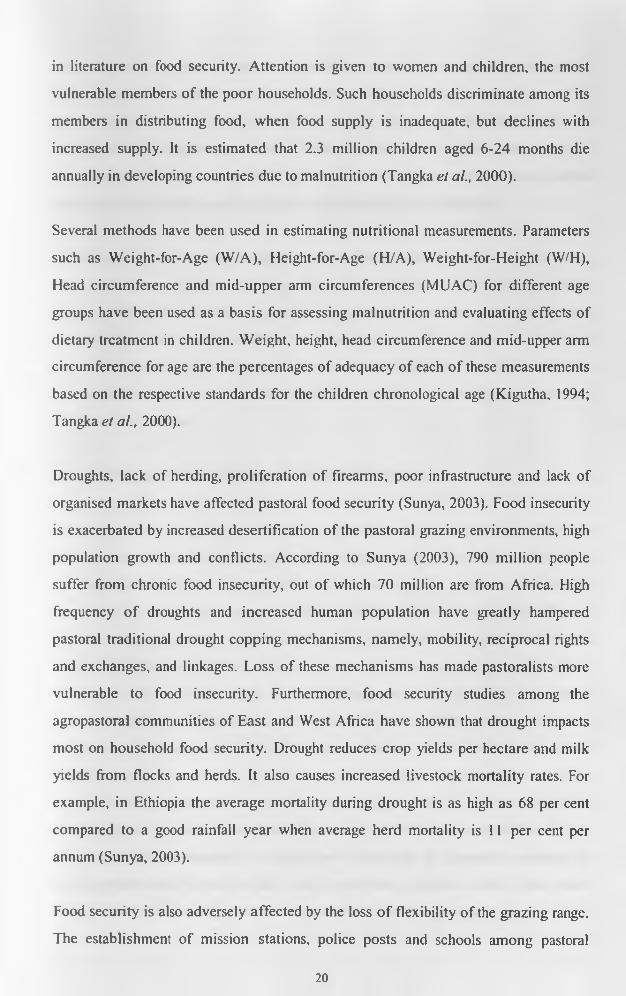
in literature on food security. Attention is given to women and children, the most
vulnerable members of the poor households. Such households discriminate among its
members in distributing food, when food supply is inadequate, but declines with
increased supply. It is estimated that 2.3 million children aged 6-24 months die
annually in developing countries due to malnutrition (Tangka et al., 2000).
Several methods have been used in estimating nutritional measurements. Parameters
such as Weight-for-Age (W/A), Height-for-Age (H/A), Weight-for-Height (W/H),
Head circumference and mid-upper arm circumferences (MUAC) for different age
groups have been used as a basis for assessing malnutrition and evaluating effects of
dietary treatment in children. Weight, height, head circumference and mid-upper arm
circumference for age are the percentages of adequacy of each of these measurements
based on the respective standards for the children chronological age (Kigutha, 1994;
Tangka et al., 2000).
Droughts, lack of herding, proliferation of firearms, poor infrastructure and lack of
organised markets have affected pastoral food security (Sunya, 2003). Food insecurity
is exacerbated by increased desertification of the pastoral grazing environments, high
population growth and conflicts. According to Sunya (2003), 790 million people
suffer from chronic food insecurity, out of which 70 million are from Africa. High
frequency o f droughts and increased human population have greatly hampered
pastoral traditional drought copping mechanisms, namely, mobility, reciprocal rights
and exchanges, and linkages. Loss of these mechanisms has made pastoralists more
vulnerable to food insecurity. Furthermore, food security studies among the
agropastoral communities of East and West Africa have shown that drought impacts
most on household food security. Drought reduces crop yields per hectare and milk
yields from flocks and herds. It also causes increased livestock mortality rates. For
example, in Ethiopia the average mortality during drought is as high as 68 per cent
compared to a good rainfall year when average herd mortality is 11 per cent per
annum (Sunya, 2003).
Food security is also adversely affected by the loss o f flexibility of the grazing range.
The establishment of mission stations, police posts and schools among pastoral
20
communities have attracted some pastoralists to settle more or less permanently,
limiting household mobility. As a result, the ability to graze livestock in areas far
from the settlements is low. Pastoralists are also increasingly affected by lack of
herding labour as a growing number of children go to school with the introduction of
free education in Kenya since 2003. These, coupled with poor infrastructure, lead to
inefficient transportation and exploitation o f pastoralists by middlemen.
In the past, pastoralists were slightly involved in external economies. They were,
nevertheless, more food secure than at present (Sobania, 1988; Sobania, 1979;
Spencer, 1973). The colonial administration maintained minimum contact with them
because their land was unsuitable for alienation, and they produced little that
interested the colonial administration. However, pastoralists are now integrated in the
broader national economies, which have influenced them to diversify their sources of
livelihood for survival.
2.6 PASTORALISTS AND POLICY INTERVENTIONS
Pastoral communal grazing systems are also blamed for overgrazing. They are
thought to be incapable of limiting the level of pasture use. The origins of this view
are found in Hardin’s “Tragedy of the commons”, which proposes that private
ownership o f livestock on common land inevitably leads to overgrazing. This is
because there is no incentive to limit use as the individual herder, since the herders
fully benefit from the addition o f an extra animal in the common grazing resource,
whilst the cost of depleting (or degrading) common resources is shared
proportionately by all (Sandford, 1983). In fact, most academicians, government
officials and aid agencies share a “mainstream view” of how the decline of the
rangelands has come about. This view holds that land degradation is caused by
pastoralists keeping more livestock than the carrying capacity o f the land (Sandford,
1983). Support from this comes from Herskovits (1926) “Cattle complex”, which has
been erroneously interpreted to explain how pastoralists are primarily motivated to
build up herd sizes for their social value beyond their economic needs. Hence, wide
disparities o f views have grown between pastoralists and the government.
21

Arguments on over-population and overgrazing in which pastoralists are stereotyped
as irrational and destructive users of land has led to lack of support for the pastoralists
and their form of production. To the government and policy makers, pastures are
regarded as either abused or under-utilised, thereby acquiring scant regard for the
rights and needs of pastoralists. This has caused antagonism, reducing government
perceptions of pastoralists to that of recalcitrant and irrational adherents to tradition.
Pastoralists, on the other hand, fear the government will not take their interest into
account when formulating development plans. In this way, relations between
pastoralists and the government have at times deteriorated to the point of open
conflict (Lane, 1991). These misconceptions inherent in the “mainstream view” can
only be replaced if there is greater understanding o f the nature of pastoral production
and the way land is used. The policies need to reflect new realities to replace the “old
orthodoxy” for development and improved performance in pastoral areas (Lane and
Shift, 1989).
The scholars of various disciplines hold different views on the causes of land
degradation. Hjort (1985) explained the causes of degradation as ecological
degradation of a sensitive environment, political and economic marginalisation of a
local population, starvation and disaster. For instance, people are forced to penetrate
into vulnerable marginal areas to increase the cultivated area for compensating for
low yields due to population pressure and the recurrent drought in northeastern
Ethiopia (Helland, 1980; Ali, 1995; Lusigi, 1984). Studies done in northern Kenya
showed that direct human activities and overgrazing of rangelands are the major
causes o f land degradation (Lusigi, 1984). Evidence from several areas of dryland
Africa showed that an increase in human populations is not always damaging to the
resource base. For example, population pressure was found to be a necessary
condition for intensification o f more conservative land use practices in Machakos,
Kenya (Tiffen et al., 1994).
2.7 CONCLUSIONS
Land tenure policies have changed considerably within Kenyan pastoral areas over
the last 40 years. Until mid 1960s, lands in the pastoral areas were held communally.
After independence, the government encouraged group tenure in pastoral areas, with22
the aim o f commercialising livestock production. The initial step towards land
privatisation was the introduction of the Group Representatives Act in 1968, which
provided for adjudication of group ranches under the Kenya Livestock Development
Project funded by World Bank. The pastoralists later perceived the concept of group
ranching as a way of alienating them from their ancestral land. In this context, the
government did not achieve its objective and the pastoralists continued with their
traditional land ownership in the group ranches. Because of this, the group ranches
collapsed and the Maasai started pressurising for sub-division. The government
officially authorised the sub-division of group ranches in mid 1983. After sub-division
of group ranches, land fragmentation and sales have increased tremendously
(Kristjanson et al., 2002). Research studies among the pastoral communities show that
pastoral production systems were rational, but currently, there is increased food
insecurity in these areas. Hence, the need to study the relationships among different
tenure systems, land use and food security.
23
CHAPTER THREE
RESEARCH METHODOLOGY
3.1 INTRODUCTION
This chapter presents a brief description of the study area, the methodology used in
data collection, sampling design and the analytical framework. Descriptive statistics
and the regression analyses were used to summarise the data and establish
interrelationships among variables. Household socio-economic data such as livestock
holdings, land tenure systems, household sizes, land sizes, remittances, total cash
income, milk yields and income form milk were analysed.
3.2 STUDY AREA
3.2.1 Location
Fieldwork for this study was carried out in Rombo and Imbirikani Locations,
Loitokotok Division, Kajiado District in the Rift Valley Province of Kenya. Kajiado
District covers an area o f 21,105 km2 (Muthoka, 1996). It has five divisions, namely
Ngong, Magadi, Loitokitok, Central and Mashuru. Loitokitok Division is situated in
the southern part of the district along the Kenya-Tanzania border, which follows a
northwest to southeast axis across the lower slopes o f Mt. Kilimanjaro; it is situated
between 38.00" and 36.45° east and between 2.20° and 2.70° south of the equator. It
constitutes the lower northeastern slopes of Mt. Kilimanjaro, together with the
Amboseli ecosystem or the Amboseli plains (Hampson, 1975; Chabari, 1986; Berger,
1993). The distance between the two locations is about 60 km and they have similar
climatic conditions.
Imbirikani Group Ranch lies along the Emali-Loitokitok road and occupies about
129,895 hectares. It is one of the six group ranches o f the division besides Selengei,
Olgulului, Kimana, Kuku and Rombo. The bigger portion of the ranch lies within
agro-climatic zones IV and V, but some small pockets fall in zone VI. Only two per
24

cent is classified as ecological zones II and III. These households move with their
livestock from one place to another at certain times o f the year in search o f sufficient
pasture and water for their livestock (GOK, 2001a).
3.2.2 Climate
Loitokitok Division receives low rainfall that ranges between 300-900 mm per
annum. Characteristically, rainfall is unpredictable, localised, and geographically
uncertain. Group ranches between Mt. Kilimanjaro and the Chyulu Hills fall within
the rain shadow of Mt. Kilimanjaro. There are two small areas that receive high
precipitation o f up to 1,100 mm located on the slopes o f Mt. Kilimanjaro and Chyulu
Hills. Rainfall is bimodal, with two rainy and two dry seasons. The seasonality in this
division differs from the rest of the district. The short rains occur in March-May, with
the highest intensity in April, while the long rains occur in November-December. The
longest dry season is between June and October (Berger, 1993). The short rains are
more critical because the number of rainy days indicates that rains are better
distributed over this period. Many droughts that have occurred in this area have
always been associated with the failure of this rain season. The two seasons coincide
with the overhead movement of the sun (Masila, 2004).
3.2.3 Vegetation
Vegetation in Loitokitok Division differs spatially and temporally. Vegetation is
classified as wooded and bushed grassland, grassland and dwarf shrub grassland (Pratt
and Gwynne, 1977) characterised by dry thorny bushland dominated by Acacia and
Commiphora (Hampson, 1975). Acacia dominance may be associated with many
years o f habitat degradation through overgrazing (Pratt and Gwynne, 1977). The key
vegetation types include Acacia xanthophlea riverine habitat, Acacia tortilis
woodland, and Acacia melifera bushland. The ground layer is dominated by dwarf
shrubs mixed with grasses such as Panicum maximum, Digitaria species, Cenchrus
ciliaris, Enteropogon macrostachyus,Chloris roxhurgiana and Cynodon dactylon.
Livestock has a dominant effect on the health of the grassland with all season grazing
25

areas being highly degraded (Kioko, 2000). Most o f the tree species are deciduous
with leaves falling during the dry season.
The quality and quantity of vegetation is primarily a function of the available
moisture. The quality o f forage increases in the rain season and at the riverine or
swamps and at high altitudes in the dry season. In the dry season the productivity may
greatly vary from place to place due to the localisation of the rains. The vegetation
cover will increase and decrease with season (Masila, 2004). The dry season is
therefore a period of forage scarcity.
3.2.4 Human Population and Land Use
According to the 1999 population census, the average population density of
Loitokitok Division was 7 persons per km2 1979, which then rose to a population
density of 15 persons per km: by 1999 (GOK, 1999). The projected average
population density in 2001 was 24 persons per km" (GOK, 2001b). From the
projection, human population is continuously increasing, putting pressure on the land
resources.
The area of the division is 0.6 million hectares. About 168,000 hectares is arable and
13 per cent has potential for crop production. Only three per cent of the arable land is
currently under cultivation, one per cent is under irrigation, while the remainder of the
land is used for grazing (Herlocker, 1999). Currently, the area has been sub-divided
into five independent land use systems. These are smallholding zone, individual
ranches, irrigation in swamps, group ranches and national parks. After the sub
division and adjudication, Maasai title-deed holders sold their land, resulting in loss of
higher altitude wetlands, which provided dry season grazing areas and refuge during
drought. Most Maasai cattle are now confined throughout the year to lower drier areas
o f the division that has a significant impact on the condition of the rangelands in the
lower zone. Agriculture is increasingly extending down below the upper zone of
smallholder agriculture to the ranch land. Figure 1 is the map o f Loitokitok Division
showing Imbirikani and Rombo Locations.
26
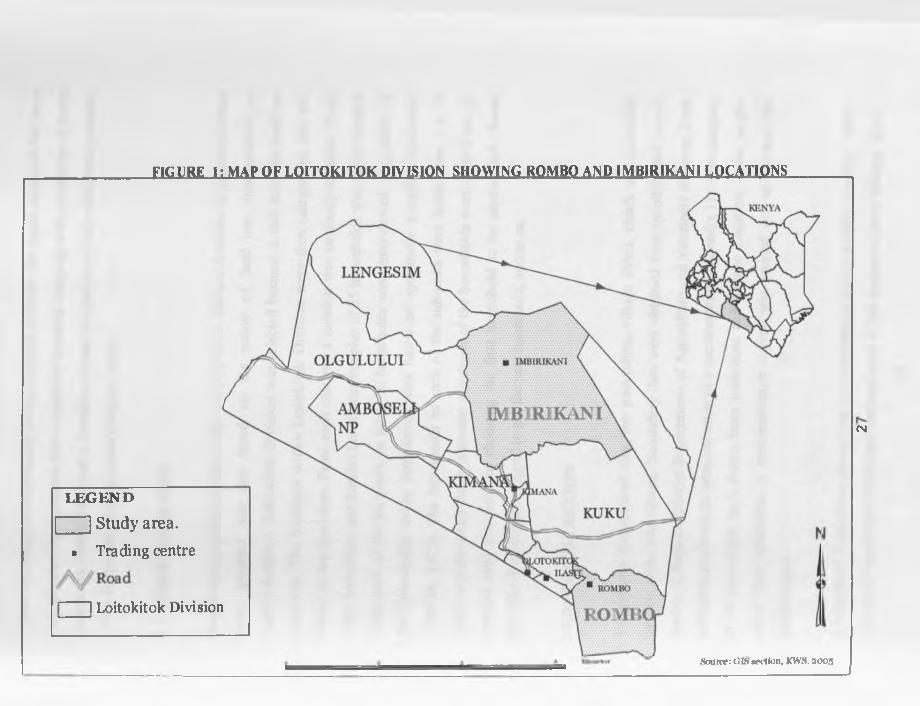
FIGURE 1; MAP OF LOITOKITOK DIVISION SHOWING RQMBQ AND 1MB1RIKAN1 LOCATIONS
KENYA
LENGESIM
OLGULULUI ■ IMB1RIKANI
[MB1RIKANI
KUKU
ROMK
LEGEND
1 1 Study area.> Trading centre
1 Loitokitok Division
CM
Source: lifc> ucctlon, KWS. 8003

There is a strip of individually owned ranches between the upper zone and the lower
rangelands. These ranches have combined livestock keeping with production o f maize
and beans. Part of the land is leased to private companies or individual entrepreneurs,
often from outside the division (Berger, 1993).
3.3 SAMPLING DESIGN
The sampling method in this study was purposive. The six divisions in Kajiado District
were grouped into two based on the nature o f land use; transhumance or
agropastoralism. Loitokitok Division was selected because it had both the land use
practices. The locations within Loitokitok Division were then categorised into two
based on the land uses. From each category a location was randomly selected. These
were Imbirikani and Rombo Locations. Samples of 35 households were then obtained
from each o f the locations. In total, 70 households were interviewed. The choice of
the households to be interviewed was based on systematic sampling procedure
(Prewitt, 1975). The households in each of the sub-units were listed from 1 to N
(N=group size) and then systematic selections of the households were carried out. A
random start was used in choosing the first household to be interviewed. Seven
households were then skipped to get the next household, and so on.
3.4 DATA COLLECTION
To generate the required data, the pastoralists, village elders, chiefs and extension
officers were interviewed. Secondary data were obtained from monthly and annual
reports of Kajiado District Departments of Agriculture and Veterinary Services. Data
collection involved the administration of a questionnaire (Appendix 1) to two samples
of 35 households each drawn from Imbirikani and Rombo Locations. Prior to the
actual data collection, a reconnaissance survey was carried out to pre-test the
questionnaire.
A household is the basic production decision-making unit in pastoral systems. Since
resource management inputs and outputs occur at the household level (Sunya, 2003),
28
data must be collected at this level in order to understand pastoral production systems.
A good understanding o f the perceptions, goals, strategies and decision-making of
individual pastoral households is necessary in order to effectively design any
development intervention in transhumant and agropastoral areas. Pastoral households
were categorised into two wealth groups based on livestock units, “poor” and “rich”.
Poor households were those owning less than 11 tropical livestock units (TLU) while
rich households were those owning more than 30 TLU (Muthoka, 1996).
3.4.1 Types of Data Collected
Information on households’ socio-economic and land tenure systems were collected
from sampled household heads, village elders, chiefs and extension officers.
Secondary data were obtained mainly from the Ministry of Agriculture reports and
manuals. Data were collected on the types of land tenure systems and related access
rights, and current household sizes, livestock holdings and composition, household
cash expenditure, daily household food consumption, livestock cash income, sources
o f livelihood and sex, age and level of education of the household head.
3.5 DATA ANALYSIS
Descriptive statistics such as percentages, means and stratification were used to
compare the survey data from the transhumant and agropastoral households.
Regression models were constructed for both continuous and discrete dependent
variables. A multiple linear regression was used in the case of the continuous
dependent variable while the logistic regression was adopted in the binary model.
3.5.1 Descriptive Statistics
The descriptive statistics on livestock units owned, the pastoralists’ perception of food
security and household monthly cash incomes and expenditure were derived.
Different sources of cash, namely livestock sales, monthly remittances, employment
and wages, were compared between transhumant and agropastoral households. Mean
29
household sizes for both transhumant and agropastoral households were also
computed and compared.
Cash income is the money obtained or earned from various household activities.
Incomes from various sources such as sale of livestock, labour, employment,
remittances and land lease were computed to obtain the total income. The contribution
o f different income sources to the total cash income was calculated as percentages. In
addition, a relationship was drawn to establish how income influences expenditure.
Livestock production is o f vital importance to the millions of pastoralists who live in
these high-risk arid and semi-arid environments. Livestock holdings were
standardised into Tropical Livestock Units (TLU), where 1 TLU is equivalent to 250
kg live weight. The TLU converts different ages and species of livestock into a
homogeneous unit for livestock owned across clusters. The average weights of
different sex and age categories o f cattle, sheep and goats were estimated based on
previous studies (King et al., 1984; Bekure ef a/., 1991 and KARI/ODA, 1996).
3.5.2 Model Specification
Two regression models were used to determine the effect of a number o f variables on
transhumant and agropastoral household food security. These models are discussed
below.
3.5.2.1 Multiple linear regression
A regression analysis that involves one dependent variable (y) and a set of
independent variables (x ) is a Multiple Linear Regression. This model requires the
dependent variable to be quantitative and continuous while the set o f independent
variables may be both quantitative and qualitative. The underlying assumption in a
linear regression model is that the relationship between the y and the x is either
linear or non-linear. The ordinary least squares (OLS) model is as follows:
30

Y = a + PiX\ + P 2X 2 + - + P n X n + *
Where
a = Constant term
e = Error term
f i i . f i2, ...,fin = Regression coefficients
X 1, X 2,-..,Xn = Independent variables
The specified model used to estimate food security in this study was:
F = a + p , x 1 + P2X2 + P 1 X 1 + P4X4 + Ps X 5 + P c M + P 1 X 1 + P%Xx + P9X9 + / W 1 0 + e
Where:
F = Total available calories for the ilh household.
a = Constant term.
X\ - Household size in adult equivalents for the iIh household.
X 2~ Dummy variable for sex of the i'h household, male =1, female =0.
£ 3= Remittance received by the i,h household.
XA = Total income for the ilh household.
- Herd size for the i,h household.
Dummy variable for land ownership for the i,h household, communal =1,
individual tenure = 0 .
Xi = Age of the ilh household head.
Xs~ Level o f education for the head of the ilh household.
%9= Dummy variable for diversification for the i,h household, diversified =1, not
diversified = 0 .
^ 10 = Number of malnourished children for the i,h household,
e = Error term for the ith household.
31

3.5.2.2 Logistic regression
Binary choice has become the standard method of analysing discrete binary data, in
which the dependent variable evokes a yes or no, or present or absent response. The
approaches used to estimate models involving dichotomous response variables are the
logit, probit and linear probability model (LPM) regressions. Ordinary least squares
regression is not appropriate since the residuals do not satisfy the condition E (ji\)= 0,
that is required to derive the unbiased estimates (Pindyck and Rubinfeld, 1991). The
logit and probit models guarantee that the estimated probability lies in the range of 0 -
1, and that they are non-linearly related to the explanatory variables. Of these two, the
logit has a great advantage in that it gives crosstabulation tables to explore data or
verify specific hypotheses. It allows one to test the different factors that are used in
the crosstabulation and their interaction for statistical significance.
The logistic function was chosen because the properties of the estimation procedure
are more desirable than those associated with the choice of a uniform distribution,
leading to the specification of a LPM, or normal probability distribution, resulting in a
probit model. For more details on the logit formulation, see Pindyck and Rubinfield
(1991).
The logit model is derived from a simple Linear Probability Model (LPM), which is
expressed as:
Yf = ia + flXj+H,
This can be expressed as:
Pt = E(Y- 1/ X ,) = 1/1 + <fA + (3.1)
The expression in (3.1) can be rewritten as:
Pi =l / l + e-2'
Where
z, = ft +p 2x ,
32

Thus if the probability of an event occurring is pjt then the probability of an event not
occurring is 1 - p{, expressed as:
\ - P j = \ / \ + e~z‘
This can be rewritten as
p . / \ - p. = 1 + ez‘ / 1 + = ez' (3.2)
Taking the natural log of (3.2) we obtain
P A - P i = P \+ P 2Xi+Hi
Where
p = Probability that y, =1 (that is the event occurs)
1- p, = Probability that y, = 0 (that is the event does not occur)
/), = Probability that event occurs when Xj increases say by a unit
jU, = Stochastic disturbance
3.5.3 Measurement and Definition of Variables used in the Models
The variables that were assumed to influence food security in pastoral and
agropastoral households were land tenure system, household size, livestock units,
level of education, gender of the household head, number of malnourished children,
income diversification and household income.
3.5.3.1 Food security
Food security refers to availability of adequate diet all year round, that is, 2250 kcal/
AAME/Day (ILCA, 1981; GOK, 2000a; Nyariki et al., 2002). Despite the fact that
33
members of the households may not share out food according to their nutritional
requirements, there is no better way o f assessing food requirements other than using
AAME. The numbers of household members were converted into adult equivalents
(AEs) energy requirement per day based on ages were calculated (GOK, 2000b).
Household food calories requirement per day is given by multiplying household size
in AEs by the daily calorie requirements per AAME (2,250 kcal). The result is then
compared to the actual available calories per household per day.
The dependent variable was derived from food consumption reported in the surveys.
The lists and quantities o f different foodstuffs prepared were converted into their
calorie energy content, summed up for each household, and divided by the number of
residents expressed as adult equivalents. Those households with a ratio falling below
one were considered food insecure, those on or above one were food secure.
3.5.3.2 Household size
Household size reflects resident household members. Kjgutha et al. (1994) and
Kavishe and Mushi (1993) reported that increased household size favours resource
contribution to the household. As such, there is more food available for household
consumption and, consequently, an improvement in the nutritional status of the
household members. They further argued that in cases where the dependency ratio is
high, the numbers o f consumers o f the available resources in the household are more
than the contributors; hence, less is available to share among them, thus negatively
affecting their nutritional well-being.
For the current analysis o f the survey findings at household level, the household size
was standardised to AEs. The concept of AE is based on the differences in nutritional
requirements according to age and sometimes sex. It assumes the life-cycle stages
have an important influence on the needs of members or individuals o f the same
household (Kristjanson et al., 2002). Various consumption weights have been
proposed over time. This study has adopted consumption weights by age where 0-4
years is 0.24; 5-14 years, 0.65; and over 15 years, 1.00 (GOK, 2000b).
34
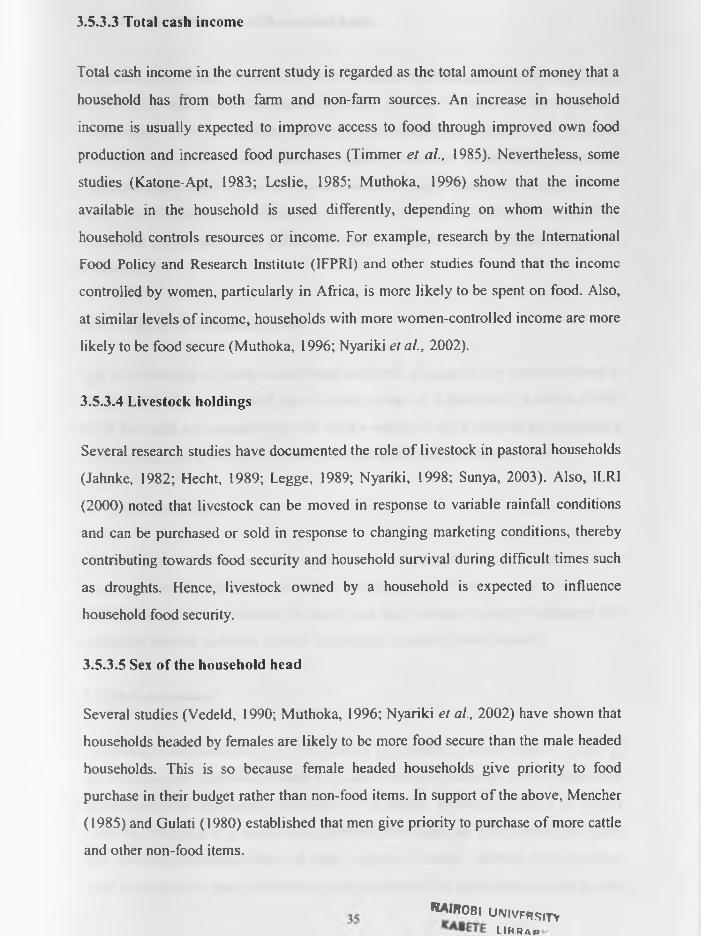
3.S.3.3 Total cash income
Total cash income in the current study is regarded as the total amount of money that a
household has from both farm and non-farm sources. An increase in household
income is usually expected to improve access to food through improved own food
production and increased food purchases (Timmer et al., 1985). Nevertheless, some
studies (Katone-Apt, 1983; Leslie, 1985; Muthoka, 1996) show that the income
available in the household is used differently, depending on whom within the
household controls resources or income. For example, research by the International
Food Policy and Research Institute (IFPRI) and other studies found that the income
controlled by women, particularly in Africa, is more likely to be spent on food. Also,
at similar levels o f income, households with more women-controlled income are more
likely to be food secure (Muthoka, 1996; Nyariki et al., 2002).
3.5.3.4 Livestock holdings
Several research studies have documented the role o f livestock in pastoral households
(Jahnke, 1982; Hecht, 1989; Legge, 1989; Nyariki, 1998; Sunya, 2003). Also, ILRI
(2 0 0 0 ) noted that livestock can be moved in response to variable rainfall conditions
and can be purchased or sold in response to changing marketing conditions, thereby
contributing towards food security and household survival during difficult times such
as droughts. Hence, livestock owned by a household is expected to influence
household food security.
3.5.3.5 Sex of the household head
Several studies (Vedeld, 1990; Muthoka, 1996; Nyariki et al., 2002) have shown that
households headed by females are likely to be more food secure than the male headed
households. This is so because female headed households give priority to food
purchase in their budget rather than non-food items. In support of the above, Mencher
(1985) and Gulati (1980) established that men give priority to purchase o f more cattle
and other non-food items.
NAIROBI UMIVF«55IT>
L I f < r a p
3.5.3.6 Level of education of household head
Education is here taken to mean the level of formal schooling. The level o f education
attained influences individual decision-making because it tends to reduce farmers’
risk aversion, thus enabling them to try out new innovations (Asambu, 1993). Besides,
individuals who are well educated acquire enhanced information processing
capabilities that enable them to demand and utilise agricultural technologies. By so
doing, their technical and allocative efficiency is improved (Ntege et al., 1997).
Household heads with below primary education were coded as 0, while those above
primary as 1.
3.5.3.7 Age of the household head
Age is the number of years an individual has lived. The age of the household head is
likely to affect the household food security status o f a household. Asambu (1993)
noted that with an increase in age, the head would have more wisdom and experience
on farming, leading to increased food production and calories improvement.
3.5.3.S Diversification
Household diversification is here defined as household involvement in other
economic activities besides pastoralism and agropastoralism (see also Noor et al.,
1999). Household involvement in more than one economic activity influences the
household income level and is likely to influence household food security.
3.5.3.9 Land tenure
Land tenure influences the type o f land use by a household. The two types o f tenure in
the study area are individual (coded as 0 ) and communal (coded as 1) for agropastoral
and transhumant households respectively. As already indicated, Feder et al. (1988)
noted the existence of a relationship between land rights and productivity. He found
that increased individualisation o f rights improves farmers’ abilities to reap returns
from investment on land. This leads to greater demand for land improvements as well
36

as complementary inputs. Increased individualisation o f rights may also improve
credit worthiness of a farmer, enhancing his chances o f receiving formal credit. Both
of these demand and supply side mechanisms interact to increase investments on land
thus leading to greater land productivity.
3.5.3.10 Number of malnourished children
Children aged five years or less and those shorter than 110 cm were considered. Their
wrists were measured and readings o f their mid-upper arm circumference (MUAC)
were classified into three categories: severe malnourishment, less than 125 mm;
moderate malnutrition, more than 125 mm but less than 134 mm; and well nourished,
more than 134 mm for transhumant and agropastoral households. The number of
malnourished children is likely to influence household food security.
3.5.3.11 Remittances
Remittances are the donations or gifts given to the household within a specified
period of time. Remittance is common in pastoral households especially in severe
drought and it includes gifts and presents from friends, relatives and well-wishers.
Remittance is expected to influence the household income by improving the food
purchasing power.
37
CHAPTER FOUR
RESULTS AND DISCUSSIONS
4.1 INTRODUCTION
This chapter presents the analysis of data in three sections. The first section
characterises the land tenure systems in the two study areas. This is followed by a
presentation of the respondents’ perceptions regarding the factors affecting household
food security. The third section describes the sample characteristics with reference to
the variables in chapter three for hypothesis testing. It also presents and discusses the
results of both the multiple linear and logistic regression analyses.
4.2 PASTORAL PERCEPTIONS
In order to facilitate a better understanding of the pastoral perceptions on land tenure
systems and the factors influencing household food security, the data are first
evaluated with a view to establishing the different land tenure types in the two study
areas. This evaluation leads to characterisation of the existing land tenure systems,
which are then presented in the following sub-section.
4.2.1 Current Land Use in Loitokitok Division
Loitokitok Division comprises o f transhumant pastoralists, agropastoralists and
agriculturalists (mainly involved in irrigation). Transhumant pastoralists and
agropastoralists who constitute the sample used in this study fall into a profile that is
consistent, to a great extent, with that commonly mentioned (Mulaku, 2000) in
literature as describing the inhabitants of semi-arid regions of Kenya. The major land
uses in the division are mixed agriculture, irrigation agriculture and livestock keeping
under extensive system and group ranching. The two major land tenure systems in the
study areas are communal tenure, practised under group ranches by transhumant
38

pastoralists, and individual tenure system, practised under individual holdings by
agropastoralists.
The concept o f group ranches was started in Kenya in 1968 as part of a land reform
strategy contained in the Swynnerton plan o f 1954. The objectives o f the group
ranches were to increase livestock output per unit area as well as sedentarise the
Maasai. These objectives suffered setbacks due to differences in priorities between
implemented and ranchers (Aboud, 1982). Smucker (2002) and Vedeld (1990)
reported that these land reforms were not suitable for the semi-arid areas due to the
flexibility required in time and space by pastoralists and their livestock. Moreover,
pastoral mobility was seriously hampered and reduced by land privatisation, thus
reducing the total productivity of the ASAL areas. In addition, increase in population
and lack of trust among group ranch members due to corrupt practices led to further
sub-division o f the group ranches, such as Rombo group ranch (RGR), into individual
holdings in the early 1980s.
Typically, group ranch representatives were elected from Maasai households within
an administrative location and boundaries that cut across clans, and have similar
customary belief (Porohoryles and Szeiskin, 1973; Mulaku, 2000). The government
registered the group representatives as trustees. The Land (group representatives) Act
(GOK, 1968), was enacted to govern the constitution and administration of the
groups, while the adjudication of rights and subsequent survey and registration were
governed by existing relevant legislation for agricultural areas. The concept of group
ranch completely breaks down the customary structure for the administration of
pasture. Each group elects about ten o f its members as group representatives, who are
registered by the government as trustees, holding the land in trust for their members.
The trustees allocate land for use by members, maintain a register of family heads,
and can mortgage the land on behalf of the group. All disputes arising on land are
settled through the regular government court system (Mulaku, 2000).
39
4.2.2 Transhumant Pastoralists in Imbirikani Group Ranch
The land tenure system in Imbirikani group ranch (1GR) is communal with
pastoralism as a source o f livelihood. Land use is mainly livestock production with
the objective o f satisfying subsistence. In the past, blood formed an integral part of
their diet, but today blood consumption is rare. Pastoralists in this ranch do not
practise crop cultivation, though some of them have portions of land sub-divided
along the river valleys for cultivation. These parcels o f land are either leased out to
cultivators or to their relatives at a cost, but most o f them lie fallow because
transhumant pastoralists have no time to cultivate, as they have to move long
distances looking for pasture and water for their animals. This is worsened further by
lack o f herding labour as children attend school with the introduction of free
education.
The group ranch was initiated for livestock production, but today the ranch has
diversified into wildlife-related projects to supplement income from livestock. These
projects include bird shooting, wildlife cropping, and campsite charges, even though
the income from wildlife projects is low and the flow is irregular. For example, in
1987 IGR leased some land for tourism at an annual cost of Kshs 50,000 while
between 1984 and 1986 it received Kshs 23,100 from bird hunting. The current
income from private investors stands at about Kshs 1.5 million, and this includes gate
fee, bed night levy and lease (Group Ranch Treasurer Pers. Com, 2003). In IGR, as in
all group ranches, land and grazing resources are owned communally, but livestock is
owned individually. Members earn income from sale o f natural products such as
firewood, charcoal, sand, and stones, even though the income is low. Despite the
various sources of income for the ranch, members complained of poor financial
management and unfair distribution of earnings. This is attributed to lack of
understanding of the role o f the group ranch committee and ignorance of members on
their rights. This was evident through the sale of part o f the ranch for the development
of a wildlife sanctuary without consultation with the group ranch members.
40
4.2.2.1 Grazing movement in Imbirikani group ranch
The group ranch committee mainly controls grazing movement within the ranch by
regulating movement patterns of different clans with their animals. Lactating cows
and the calves are left behind to graze around Imbirikani so as to continue providing
milk to the household while the il murans (warriors) move with the satellite herds for
sufficient pasture to Chyulu Hills. The movement starts at the beginning o f the dry
season and the livestock are grazed as they move until they reach the top o f Chyulu
Hills. The pastoralists have adapted to this grazing movement at certain times o f the
year to ensure efficient utilisation of the sparse forage resources.
4.2.2.2 Water resources in Imbirikani group ranch
Initially, the ranch had ten boreholes, but currently only one borehole is functional
for watering the animals, others have broken down and there are no resources to
repair them. One borehole is not sufficient to water all the ranch animals; therefore
individuals have constructed private boreholes to meet the water needs of their
animals. This is advantageous as it reduces congestion at watering points, thereby
reducing land degradation through reduced trampling. In the dry season, non
members pay for watering their large stock in the private watering points at five
shillings per month, and small stock are watered for free. During the wet season,
animals are grazed around the homesteads within the ranch. At this time water is
plentiful within the ranch and the pastoralists do not incur extra costs on watering.
4.2.3 Agropastoralists in Rombo
Agropastoralists in Rombo share similar cultural and traditional with practices their
transhumant counterparts. In the dry season, the transhumant and agropastoral
households share grazing resources in Chyulu Hills. The grazing tenure becomes even
more complex with kinship. Some transhumant households allow their agropastoral
relatives to graze their animals within the ranch through their own private
arrangement. This has made the group ranch committee unable to regulate the
stocking rate o f the ranch.
41

Agropastoralists in Rombo location practise individual ownership tenure with
livestock and crop production as the main livelihood. The households acquired land as
a result o f the sub-division o f Rombo group ranch in the early 1980’s. The parcels of
agricultural land are owned individually, but the individuals do not possess title deeds.
The grazing resources are communally owned and the village elders are charged with
the responsibility o f managing these resources. Individual tenure system applies only
to crop fields while the dry season grazing resources are still shared communally.
The agropastoral households have rights to make decisions on the use o f cropland,
and the use can be maintained for a long period o f time but does not entitle an
individual to private property. For common grazing resources, the village elders play
crucial roles in controlling and regulating access and use of these resources. The
agropastoralists in Rombo have several tenure arrangements for access to and use of
resources, which are risk-sharing strategies to buffer against socio-economic,
demographic, environmental and political pressures. This is achieved by ensuring that
the welfare of community members who are resource poor due to unequal distribution
of resources is taken into consideration.
Land redistribution is done on the basis of household size. In many cases, large
households accessed more land due to their obligation to feed more people. On the
other hand, the traditional authorities have no animals to distribute to members but
can make grazing contracts with the rich households to permit the poor households to
build their herds and exercise their access rights on common grazing pastures, making
animal-grazing rights more complex to handle because animal resources are owned
individually while the grazing resources are communal. Table 1 shows the land rights
by agropastoral households in Rombo.
42

Table 1: A summary of land rights by agropastoralists in Rombo Location
R ainy se a so n D ry seasonR ights R a n g e resource
(F a llo w or b u sh )L a n d fo r a g r ic u ltu re (C u lt iv a te d land)
R a n g e re so u rce (F a l lo w o r bush)
L and f o r a g r ic u ltu re (C u lt iv a te d land)
A ccess r ig h ts G ra n te d to e v e ry o n e p ro v id e d th a t p a s to ra l ac tiv itie s d o n o t in te rfe re w ith ag ricu ltu re (n eg o tia tio n w ith v il la g e e lders)
U su fru c t-r ig h th o ld e r
E v e ry o n e U su fru c t-r ig h th o ld e r
W ith d raw al rig h ts E v ery o n e p ro v id e d th a t p a s to ra l ac tiv itie s d o n o t in te rfe re w ith ag ricu ltu re (n eg o tia tio n w ith v il la g e e lders)
U su fru c t-r ig h th o ld e r
E v e ry o n e U su fru c t-r ig h th o ld e r
M an ag em en t V illa g e e ld e rs and U su fru c t-r ig h t V illa g e e ld e rs and U su fru c t-r ig h t
righ ts c h ie fs h o ld e r w ith no lim ita t io n s on d e c is io n s to lan d im p ro v em en ts
c h ie f s h o ld e r w ith no lim ita t io n s on d e c is io n s to land im p ro v e m e n ts
A lien a tio n righ ts V illag e e ld e rs and c h ie fs
U su fru c t-r ig h t h o ld e r w ith no lim ita tio n s on d e c is io n s to land im p ro v em en ts
V illa g e e ld e rs an d c h ie f s
P rim a ry o r se c o n d a ry righ t h o ld e rs
The issue of land tenure in pastoral households is complex. Despite all the complexity
in land tenure arrangements, there is a clear-cut distinction between communal and
individual tenure systems. The difference is attributed to the strength o f the local
institutions and the access options.
4J SAMPLE CHARACTERISTICS
4.3.1 The Maasai
The Maasai in the study area are both transhumant pastoralists and agropastoralists
who originated from Southern Rift. Their traditional residential pattern is based upon
the ekang, meaning homestead, an enclosure that holds about 10-12 households. Four
or five of these ekang are then grouped to form clusters referred to as emurua, which
represents the basic social unit holding about 40-50 households. These households
share common resources such as water points and grazing resources. The Masaai
43
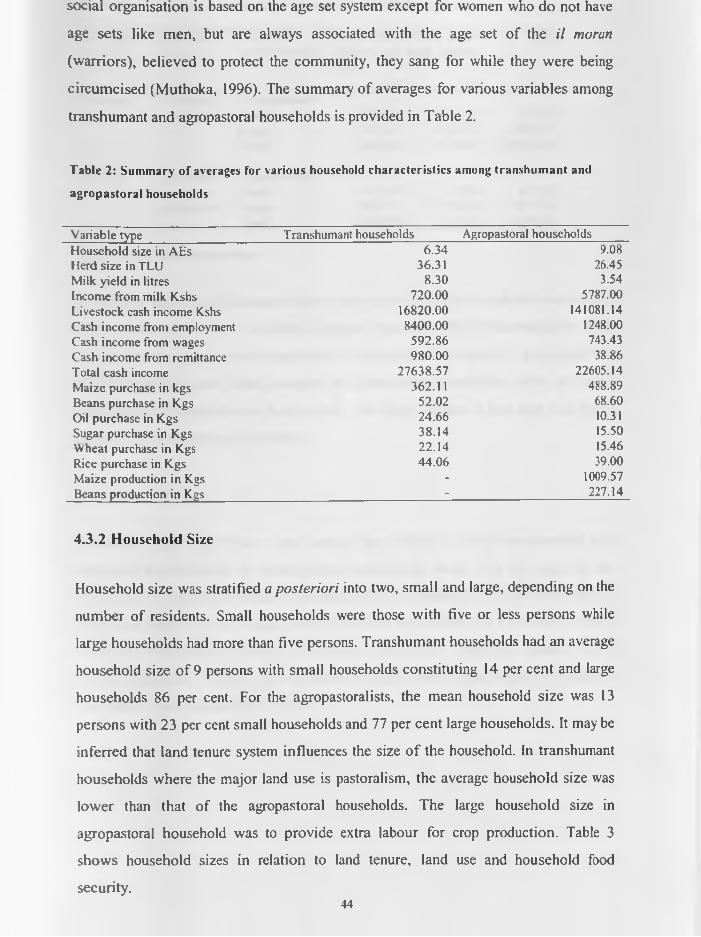
social organisation is based on the age set system except for women who do not have
age sets like men, but are always associated with the age set of the il morati
(warriors), believed to protect the community, they sang for while they were being
circumcised (Muthoka, 1996). The summary of averages for various variables among
transhumant and agropastoral households is provided in Table 2.
T a b le 2 : S u m m a r y o f a v e ra g e s f o r v a r io u s h o u se h o ld c h a r a c t e r i s t i c s a m o n g t r a n s h u m a n t a n d
a g r o p a s to r a l h o u s e h o ld s
V a r ia b le ty p e T ra n sh u m a n t h o u se h o ld s A g ro p asto ra l h o u se h o ld s
H o u se h o ld size in A E s 6 .3 4 9.08
H e rd s iz e in T L U 3 6 .3 1 26.45
M ilk y ie ld in litre s 8 .3 0 3.54
In c o m e fro m m ilk K sh s 7 2 0 .0 0 5787 .00
L iv e s to c k cash in c o m e K shs 1 6 8 2 0 .0 0 141081.14
C a sh in c o m e fro m em p lo y m en t 8 4 0 0 .0 0 1248.00
C a sh in c o m e fro m w ag es 5 9 2 .8 6 743.43
C a sh in c o m e fro m rem ittan ce 9 8 0 .0 0 38.86
T o ta l c a s h incom e 2 7 6 3 8 .5 7 2 2 6 05 .14
M a iz e p u rc h a se in k g s 3 6 2 .1 1 488 .89
B e a n s p u rc h a se in K g s 5 2 .0 2 68 .60
O il p u rc h a s e in K g s 2 4 .6 6 10.31
S u g a r p u rc h a se in K g s 3 8 .1 4 15.50
W h e a t p u rc h a se in K gs 2 2 .1 4 15.46
R ice p u rc h a s e in K g s 4 4 .0 6 39 .00
M a iz e p ro d u c tio n in K gs - 1009.57
B e a n s p ro d u c tio n in K gs - 227 .14
4.3.2 Household Size
Household size was stratified a posteriori into two, small and large, depending on the
number of residents. Small households were those with five or less persons while
large households had more than five persons. Transhumant households had an average
household size o f 9 persons with small households constituting 14 per cent and large
households 86 per cent. For the agropastoralists, the mean household size was 13
persons with 23 per cent small households and 77 per cent large households. It may be
inferred that land tenure system influences the size o f the household. In transhumant
households where the major land use is pastoralism, the average household size was
lower than that of the agropastoral households. The large household size in
agropastoral household was to provide extra labour for crop production. Table 3
shows household sizes in relation to land tenure, land use and household food
security.44
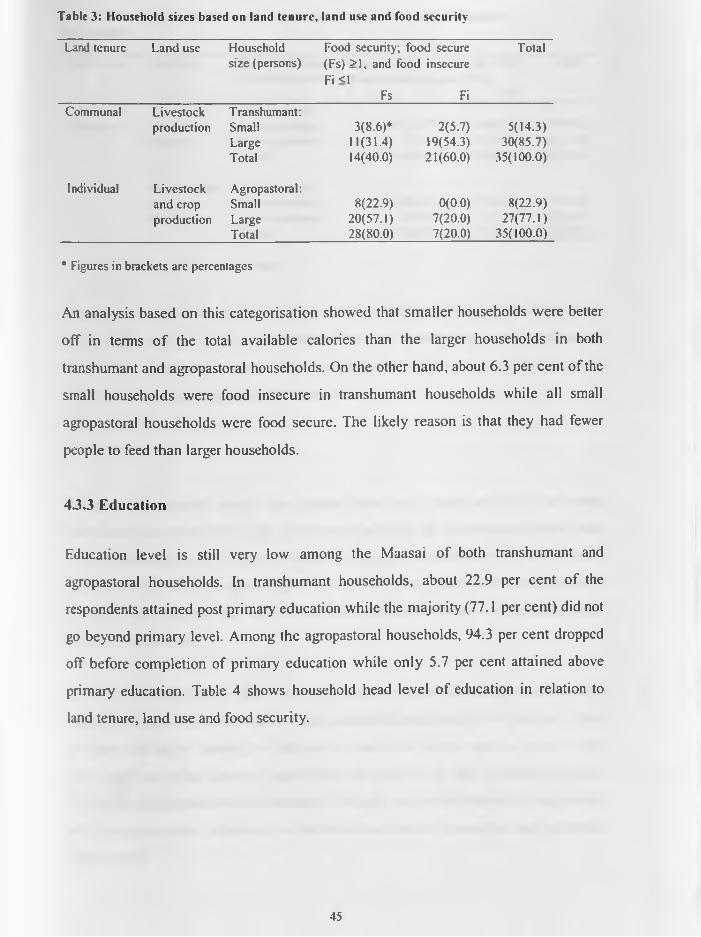
Table 3: Household sizes based on land tenure, land use and food security
L and te n u re L a n d u se H o u se h o ld s iz e (p e rso n s)
F o o d secu rity ; fo o d secu re
(F s ) > 1 , an d fo o d in secu re
Fi <1Fs Fi
T o ta l
C o m m u n al L iv e s to c kp ro d u c tio n
T ra n sh u m a n t:S m allL arg eT o ta l
3 (8 .6 )*1 1 (3 1 .4 )1 4 (40 .0 )
2 (5 .7 )19(5 4 .3 )2 1 (6 0 .0 )
5 (1 4 .3 )3 0 (8 5 .7 )
3 5 (1 0 0 .0 )
In d iv id u a l L iv e s to c k a n d c ro p p ro d u c tio n
A g ro p a s to ra l:S m allL a rg eT o ta l
8 (2 2 .9 )2 0 (5 7 .1 )2 8 (8 0 .0 )
0 (0 .0 )7 (2 0 .0 )7 (2 0 .0 )
8 (2 2 .9 )2 7 (7 7 .1 )
3 5 (1 0 0 .0 )
* F igu res in b ra c k e ts a re p e rcen tag es
An analysis based on this categorisation showed that smaller households were better
off in terms o f the total available calories than the larger households in both
transhumant and agropastoral households. On the other hand, about 6.3 per cent of the
small households were food insecure in transhumant households while all small
agropastoral households were food secure. The likely reason is that they had fewer
people to feed than larger households.
4J.3 Education
Education level is still very low among the Maasai of both transhumant and
agropastoral households. In transhumant households, about 22.9 per cent of the
respondents attained post primary education while the majority (77.1 per cent) did not
go beyond primary level. Among the agropastoral households, 94.3 per cent dropped
off before completion of primary education while only 5.7 per cent attained above
primary education. Table 4 shows household head level o f education in relation to
land tenure, land use and food security.
45
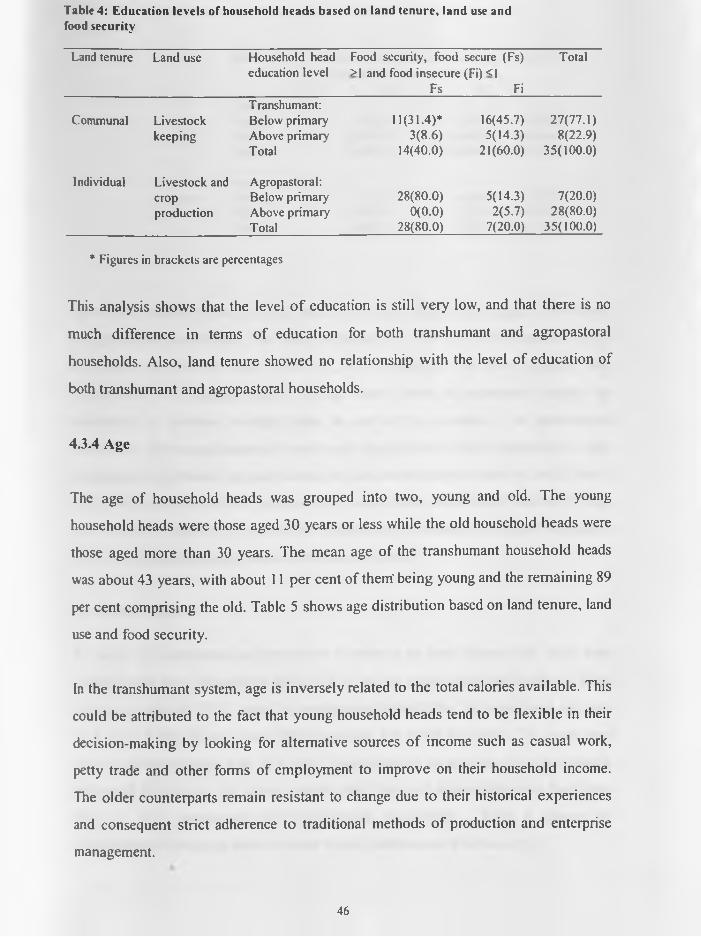
Table 4: Education levels of household heads based on land tenure, land use andfood security
L and te n u re L a n d u se H o u se h o ld h e a d e d u c a tio n le v e l
F ood secu rity , fo o d secure (F s )
>1 a n d food in s e c u re (F i) <1F s Fi
T o ta l
C o m m u n al L iv e s to c kk e e p in g
T ra n sh u m a n t: B e lo w p r im a ry A b o v e p r im a ry T o ta l
1 1 (3 1 .4 )* 3 (8 .6 )
1 4 (4 0 .0 )
16(4 5 .7 )5 (1 4 .3 )
2 1 (6 0 .0 )
2 7 (7 7 .1 )8 (2 2 .9 )
3 5 (1 0 0 .0 )
In d iv id u a l L iv e s to c k and c ro pp ro d u c t io n
A g ro p a s to ra l: B e lo w p r im a ry A b o v e p r im a ry T o ta l
2 8 (8 0 .0 )0 (0 .0 )
2 8 (8 0 .0 )
5 (1 4 .3 )2 (5 .7 )
7 (2 0 .0 )
7 (2 0 .0 )2 8 (8 0 .0 )
3 5 (1 0 0 .0 )
* F ig u re s in b ra c k e ts a re p e rcen tag es
This analysis shows that the level o f education is still very low, and that there is no
much difference in terms of education for both transhumant and agropastoral
households. Also, land tenure showed no relationship with the level of education of
both transhumant and agropastoral households.
4.3.4 Age
The age of household heads was grouped into two, young and old. The young
household heads were those aged 30 years or less while the old household heads were
those aged more than 30 years. The mean age of the transhumant household heads
was about 43 years, with about 11 per cent of them' being young and the remaining 89
per cent comprising the old. Table 5 shows age distribution based on land tenure, land
use and food security.
In the transhumant system, age is inversely related to the total calories available. This
could be attributed to the fact that young household heads tend to be flexible in their
decision-making by looking for alternative sources o f income such as casual work,
petty trade and other forms of employment to improve on their household income.
The older counterparts remain resistant to change due to their historical experiences
and consequent strict adherence to traditional methods of production and enterprise
management.
46
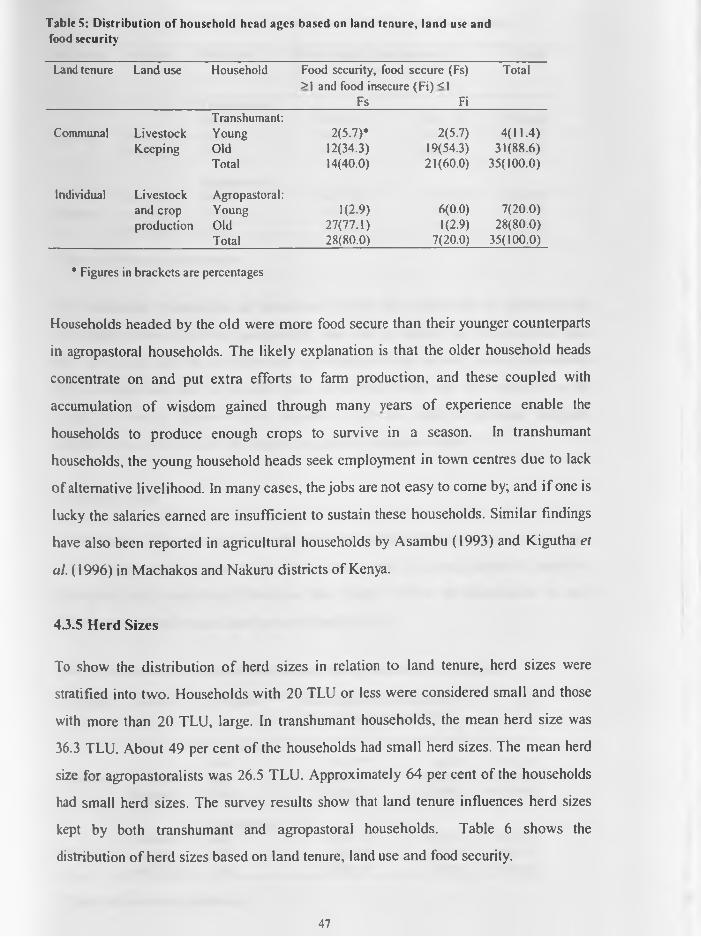
Table 5: Distribution of household head ages based on land tenure, land use andfood security
Land te n u re L a n d u se H o u se h o ld F o o d secu rity , food s e c u r e (Fs)
>1 and fo o d in secu re (F i ) <1T o ta l
F s FiT ran sh u m an t:
C om m unal L iv e s to c k Y o u n g 2 (5 .7 )* 2 (5 .7 ) 4 (1 1 .4 )K e e p in g O ld 12(34 .3 ) 19(54 .3) 3 1 (8 8 .6 )
T o ta l 14 (40 .0 ) 2 1 (6 0 .0 ) 3 5 (1 0 0 .0 )
Ind iv idual L iv e s to c k A g ro p a s to ra l:an d c ro p Y o u n g 1(2 .9) 6 (0 .0 ) 7 (2 0 .0 )
p ro d u c tio n O ld 2 7 (7 7 .1 ) H 2 .9 ) 2 8 (8 0 .0 )
T o ta l 2 8 (8 0 .0 ) 7 (2 0 .0 ) 3 5 (1 0 0 .0 )
* F ig u re s in b ra c k e ts a re p e rcen tag es
Households headed by the old were more food secure than their younger counterparts
in agropastoral households. The likely explanation is that the older household heads
concentrate on and put extra efforts to farm production, and these coupled with
accumulation o f wisdom gained through many years o f experience enable the
households to produce enough crops to survive in a season. In transhumant
households, the young household heads seek employment in town centres due to lack
of alternative livelihood. In many cases, the jobs are not easy to come by; and if one is
lucky the salaries earned are insufficient to sustain these households. Similar findings
have also been reported in agricultural households by Asambu (1993) and Kigutha et
al. (1996) in Machakos and Nakuni districts of Kenya.
4J.5 Herd Sizes
To show the distribution o f herd sizes in relation to land tenure, herd sizes were
stratified into two. Households with 20 TLU or less were considered small and those
with more than 20 TLU, large. In transhumant households, the mean herd size was
36.3 TLU. About 49 per cent of the households had small herd sizes. The mean herd
size for agropastoralists was 26.5 TLU. Approximately 64 per cent of the households
had small herd sizes. The survey results show that land tenure influences herd sizes
kept by both transhumant and agropastoral households. Table 6 shows the
distribution of herd sizes based on land tenure, land use and food security.
47

Table 6: Distribution of herd sizes based on land tenure, land use and food security
L and tenure L an d u se H erd s iz e s F o o d secu rity , F ood s e c u re (F s) T o ta l>1 a n d F ood in secu re ( F i ) < l
Fs Fi
T ran sh u m an t:Sm all 4 (1 1 .4 )* 1 3 (3 7 .1 ) 1 7 (4 8 .6 )
C om m unal L iv e s to c k L arge 10(28 .6 ) 8 (2 2 .9 ) 1 8 (5 1 .4 )K e e p in g T o ta l 14 (4 0 .0 ) 2 1 (6 0 .0 0 ) 3 5 (1 0 0 )
A g ro p asto ra l:L iv e s to c k Sm all 18 (51 .4 ) 4 (1 1 .4 ) 2 2 (6 2 .9 )
Individual and c ro p L arge 1 0 (28 .6 ) 3 (8 .6 ) 1 3 (3 7 .1 )
p ro d u c tio n T otal 2 8 (8 0 .0 ) 7 (2 0 .0 ) 3 5 (1 0 0 .0 )
* F igures in b ra c k e ts a r e p e rc e n ta g e s
The transhumant pastoralists are motivated to keep large herd sizes to maximise use
of common resources while agropastoral herd size is limited by the available land
size. Also, herd size has an influence on household food security status; households
with more animals tend to be more food secure than those with few animals, as the
former can easily dispose o f the animals to provide cash to purchase adequate
foodstuffs that will provide the calories required to maintain active life.
4J.6 Milk Yield
The influence o f land tenure on milk yield was determined by grouping milk yield
into low milk yields for households with 2 litres or less a day and high milk yields for
households with more than 2 litres per day. Table 7 shows the distribution of milk
yields based on land tenure, land use and food security.
T a b le 7: D is t r ib u t io n o f m ilk y ie ld b a se d o n la n d te n u r e , la n d u s e a n d food s e c u r i ty
Land ten u re L an d u se M ilk y ield F o o d secu rity . F ood se c u re (Fs)
>1 and F o o d in secu re (F i) <1
T o ta l
Fs Fi
T ran sh u m an t:L ow 2 (5 .7 )* 2(5 .7 ) 4 (1 1 .4 )
C om m unal L iv e s to c k H igh 12(34 .3 ) 19(54.3) 3 1 (8 8 .6 )
k e e p in g T o ta l 14(40 .0) 21(6 0 .0 ) 3 5 (1 0 0 .0 )
A g ro p asto ra l:L iv e s to c k L o w 2 0 (5 7 .1 ) 6 (17 .1 ) 2 6 (7 4 .3 )
Individual a n d c ro p H ig h 8 (2 2 .9 ) 1(2-9) 9 (2 5 .7 )p ro d u c tio n T o ta l 2 8 (8 0 .0 ) 7(20 .0 ) 3 5 (1 0 0 .0 )
F igures in b ra c k e ts a re p e rcen tag es
48

The mean milk yield in transhumant households was 8.2 litres per day while it was
3.5 litres per day for agropastoral households. The difference in milk yield could be
attributed to flexibility in mobility by the transhumant herds to exploit pastures and
water, which is favoured by the communal tenure. For the agropastoral system,
individual tenure restricts mobility; hence there is continuous use o f pasture, which
reduces milk output per animal due to poor feed quality. The milk yield was higher in
transhumant households than in agropastoral households, yet a greater number (60 per
cent) were food insecure than their agropastoral counterparts (20 per cent). The likely
explanation for high food insecurity in the transhumant system despite the high milk
yield is that they lack the purchasing power during distress because they tend to
purchase more cattle rather than keep cash money. During this period, animal prices
are much lower leading to loss of income.
4.3.7 Income from Milk
Income from milk was grouped into two: households with an income of Kshs 5,000 or
less from milk were considered low and those with more than Kshs 5,000 were
considered high. Sale of milk is minimal in a transhumant system and is only possible
when there is plenty, especially during the wet season. Table 8 shows the distribution
of income from milk based on land tenure, land use and food security.
T a b le 8 : D is t r ib u t io n o f h o u s e h o ld s by in c o m e fro m m ilk in r e l a t i o n to lan d te n u r e , lan d u se a n d fo o d s e c u r i ty
Land ten u re L a n d u se In co m e fro m m ilk
F o o d secu rity . F o o d se c u re (Fs) >1 and F o o d in se c u re (F i) <1
F s Fi
T o ta l
C om m unal L iv e s to c kk e e p in g
T ran sh u m an t:L o wH ighT o ta l
2 (5 .7 )*12(34 .3 )14(40 .0)
2(5 .7)19(54.3)2 1 (6 0 .0 )
4 (1 1 .4 )3 1 (8 8 .6 )
3 5 (1 0 0 .0 )
IndividualL iv e s to c k a n d c ro p p ro d u c tio n
A g ro p asto ra l:L owH ig hT o ta l
2 0 (5 7 .1 )8 (2 2 .9 )
2 8 (8 0 .0 )
6 (1 7 .1 )1(2.9)
7 (20 .0)
2 6 (7 4 .3 )9 (2 5 .7 )
3 5 (1 0 0 .0 )
* F igu res in b ra c k e ts a re p e rc e n ta g e s
49

The data show that about 14 per cent o f the transhumant households sold milk while
the rest was for home consumption. In the agropastoral system, income from milk
formed an integral part of total household income, with about 87 per cent o f them
selling milk. Figures close to these have been reported by Thompson et al. (2000)
among the Maasai o f Narok District, Kenya. It can, therefore, be concluded that land
tenure influences the amount of income from milk. In the agropastoral system,
households with large herds obtain more income from milk, which improves the total
income and food purchasing power. For transhumant households, the amount of
income from milk seems not to have influence on the food security status likely
because it is occasional.
4.3.8 Land Sizes
The analysis o f land size is only applicable to agropastoral households, since in the
transhumant system land is communal and size cannot be determined. Household land
sizes were categorised into two: small and large. Households with small land sizes
were those owning one-acre or less and households with large land sizes were those
owning more than one acre. Table 9 shows the distribution of land size based on land
tenure, land use and food security.
T a b le 9 : D is t r ib u t io n o f a g r o p a s to r a l h o u s e h o ld la n d s izes b a s e d o n la n d te n u r e , la n d u se a n d fo o d s e c u r i ty
H o u seh o ld land s iz e s Food secu rity . F o o d secu re (F s) >1
in secu re (F i) <1F s
a n d F o o d
Fi
T o ta l
Sm all 2 (5 .7 )* 2 (5 .7 ) 4 (1 1 .4 )
L arge 2 6 (7 4 .3 ) 5 (1 4 .3 ) 3 1 (8 8 .6 )T otal 2 8 (8 0 .0 ) 7 (2 0 .0 ) 3 5 (1 0 0 .0 )
* F igures in b ra c k e ts a re p e rcen tag es
The average land size for the agropastoral households was 2.5 acres. About 11 per
cent owned small land sizes. Households with large land sizes tend to be more food
secure than those with small sizes. This implies that an increase in land size leads to
increased production or output per unit area. Similar findings have also been reported
by Victoria et al. (1986) in Brazil, Kaseje el al. (1983), Kigutha et al. (1994) and
Ntege et al. (1997) in Kenya. They stated that in countries where land is not50

communally owned, land size is an important asset in determining the amount o f food
that can be produced for a household in terms of livestock and crops at any given
time. Therefore, landlessness means lack of an important production resource and a
sign of poverty, especially in rural areas. Melville (1988) further established that
unequal distribution of land is the most widespread cause of poverty in most
developing countries. As a result, some nutrition planners advocate for land
redistribution as a means of ending malnutrition in these countries (Omawale and
McLeod, 1984; Melville, 1988).
4.3.9 Remittance
The mean remittance received by the transhumant households was Kshs 980
compared to Kshs 319 for the agropastoral households. About 31 per cent of the
households reported to have received money from friends and relatives in
transhumant and agropastoral systems. Table 10 shows the distribution of remittance
based on land tenure, land use and food security.
T a b le 10: D is t r ib u t io n o f h o u s e h o ld s w ith r e s p e c t to r e m i t ta n c e b a s e d o n la n d te n u r e , la n d u se a n d fo o d s e c u r i ty
L and ten u re L and u se R em ittance F o o d secu rity , F o o d s e c u re (Fs) >1 an d F ood in se c u re (F i) <1
F s Fi
T o ta l
C o m m u n alL iv e s to c kK e e p in g
T ranshum an t: R em ittance N o rem ittan ce T o ta l
13(37 .1)1(2 .9)
1 4 (4 0 .0 )
18(51.4)3 (8 .6 )
2 1 (6 0 .0 )
3 1 (8 8 .6 )4 (1 1 .4 )
3 5 (1 0 0 .0 )
Ind iv idualL iv esto ck an d c ro p p ro d u c tio n
A g ropasto ra l: R em ittance N o rem ittan ce T o ta l
4 (1 1 .4 )2 4 (6 8 .6 )2 8 (8 0 .0 )
3 (8 .6 )4 (1 1 .4 )7 (2 0 .0 )
7 (2 0 .0 )2 8 (8 0 .0 )
3 5 (1 0 0 .0 )
* F igures in b ra c k e ts a re p e rcen tag es
Remittance was more common in transhumant households than in the agropastoral
households. This shows that more transhumant household members have migrated to
towns and cities in search of alternative employment because transhumance can no
longer sustain these households. The wages earned by these members formed part of
remittance. Moreover, most agropastoral households did not receive remittance but a
greater percentage (80 per cent) were more food secure than transhumant households51

(40 per cent). This implies that remittance does not influence food security status of
these households because it is rare and unpredictable.
4.3.10 Employment
Among the transhumant pastoralists, the mean employment income was Kshs 8,400.
Only 25.7 per cent o f the transhumant households reported to have been employed.
For the agropastoralists, the mean employment income was Kshs 1,248 with only 9
per cent reporting to be employed. The survey shows that land tenure influences
employment. Table 11 shows the distribution of employment income based on land
tenure, land use and food security.
T a b le 11 : D is t r ib u t io n o f h o u s e h o ld s e m p lo y m e n t b a s e d o n la n d t e n u r e , lan d u se a n d food s e c u r i ty
L an d ten u re L and u se E m ploym en t F o o d secu rity . F ood s e c u re (F s) T o ta l>1 a n d F ood in secu re (F i) <1
Fs Fi
C om m unal L iv esto ckK eep in g
T ran sh u m an t: E m p lo y ed N ot em p lo y ed T otal
4 (1 1 .4 )*10(28 .6 )14(40 .0 )
5 (1 4 .3 )16(45 .7 )2 1 (6 0 .0 )
9 (2 5 .7 )2 6 (7 4 .3 )
3 5 (1 0 0 .0 )
Ind iv idual L iv e s to c k an d c ro p p ro d u c tio n
A gropasto ra l: R em ittance N o rem ittan ce T otal
1 (2 .9 ) 2 7 (7 7 .1 ) 2 8 (8 0 .0 )
2 (5 .7 )5 (1 4 .3 )7 (20 .0 )
3 (8 .6 )3 2 (9 1 .4 )
3 5 (1 0 0 .0 )
* F igu res in b ra c k e ts a re p e rcen tag es
There are more people seeking employment elsewhere in the transhumant system to
supplement livestock production than in the agropastoral system. When the ratio of
the employed is compared in relation to food security, a greater percentage is food
insecure. The likely reason is that the earnings from employment are low since most
of these opportunities are season based.
4.3.11 Maize Relief
The mean maize relief received by transhumant households was 7.1 kgs. About 80 per
cent of transhumant households received maize relief. In contrast, the agropastoral
households did not received maize relief during the study period. Maize relief has no
influence on food security status of transhumant households. Comparing transhumant52
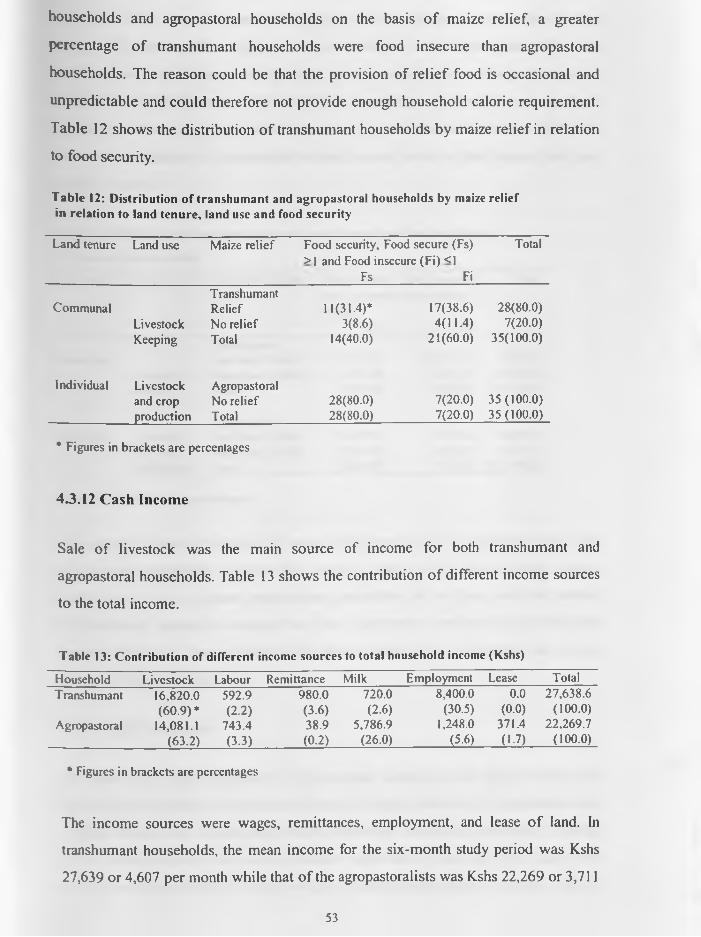
households and agropastoral households on the basis o f maize relief, a greater
percentage o f transhumant households were food insecure than agropastoral
households. The reason could be that the provision of relief food is occasional and
unpredictable and could therefore not provide enough household calorie requirement.
Table 12 shows the distribution o f transhumant households by maize relief in relation
to food security.
T a b le 12: D is t r ib u t io n o f t r a n s h u m a n t a n d a g r o p a s to r a l h o u s e h o ld s b y m aize r e l ie f in r e l a t i o n to la n d t e n u r e , la n d u se a n d fo o d s e c u r i ty
L a n d te n u re L and u se M aize r e l ie f F o o d secu rity , F ood s e c u re (F s ) T o ta l>1 a n d F ood in secu re (F i ) <1
Fs Fi
C o m m u n a lL iv es to ckK eep in g
T ra n sh u m a n t R e lie f N o re l ie f T o ta l
11(31 .4)*3 (8 .6 )
1 4 (40 .0 )
1 7 (3 8 .6 )4 (1 1 .4 )
2 1 (6 0 .0 )
2 8 (8 0 .0 )7 (2 0 .0 )
3 5 (1 0 0 .0 )
In d iv id u a l L iv esto ck an d c ro p p ro d u c tio n
A g ro p asto ra l N o r e l ie f T otal
2 8 (8 0 .0 )2 8 (8 0 .0 )
7 (2 0 .0 )7 (2 0 .0 )
3 5 (1 0 0 .0 )3 5 (1 0 0 .0 )
* F ig u re s in b ra c k e ts a re p e rc e n ta g e s
43.12 Cash Income
Sale o f livestock was the main source of income for both transhumant and
agropastoral households. Table 13 shows the contribution o f different income sources
to the total income.
T a b le 13 : C o n t r ib u t io n o f d i f f e r e n t in c o m e s o u r c e s to to ta l h o u s e h o ld in co m e (K sh s )
H o u seh o ld L iv e s to c k L ab o u r R em ittan ce M ilk E m p lo y m en t L ease T o ta l
T ran sh u m an t 1 6 ,8 2 0 .0 5 9 2 .9 9 8 0 .0 7 2 0 .0 8 ,40 0 .0 0 .0 2 7 ,6 3 8 .6
( 6 0 .9 ) * (2 .2 ) (3 .6 ) (2 .6 ) (30 .5 ) (0 .0 ) (1 0 0 .0 )
A g ro p asto ra l 14 ,081 .1 7 4 3 .4 3 8 .9 5 ,7 8 6 .9 1,248.0 371 .4 2 2 ,2 6 9 .7
(6 3 .2 ) (3 .3 ) (0 -2 ) (2 6 .0 ) (5 .6 ) (1 .7 ) (1 0 0 .0 )
* F ig u res in b ra c k e ts a re p e rc e n ta g e s
The income sources were wages, remittances, employment, and lease o f land. In
transhumant households, the mean income for the six-month study period was Kshs
27,639 or 4,607 per month while that o f the agropastoral ists was Kshs 22,269 or 3,711
53
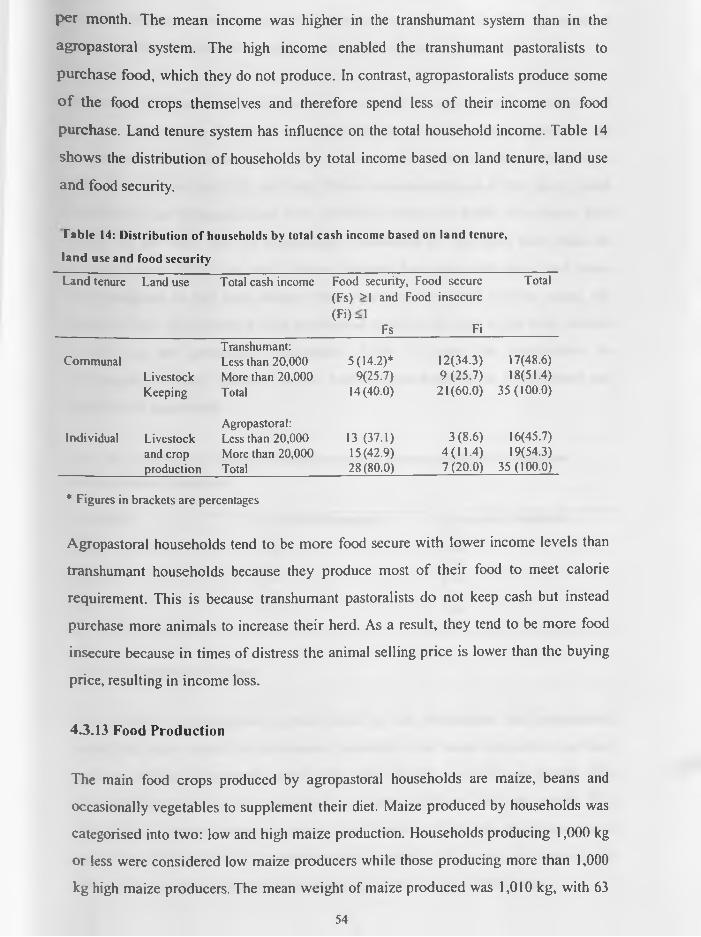
per month. The mean income was higher in the transhumant system than in the
agropastoral system. The high income enabled the transhumant pastoralists to
purchase food, which they do not produce. In contrast, agropastoralists produce some
o f the food crops themselves and therefore spend less o f their income on food
purchase. Land tenure system has influence on the total household income. Table 14
shows the distribution o f households by total income based on land tenure, land use
and food security.
T a b le 14: D is t r ib u t io n o f h o u s e h o ld s b y to ta l c a s h in co m e b a s e d o n l a n d te n u r e ,
l a n d u se a n d fo o d s e c u r i ty
L a n d ten u re L an d u se T o ta l c a sh in co m e F o o d secu rity , F o o d s e c u re (F s ) >1 an d F ood in s e c u re
(P i) - 1F s Fi
T o ta l
C o m m u n a lL iv esto ckK eep in g
T ran sh u m an t: L ess th an 2 0 ,0 0 0 M ore th a n 2 0 .0 0 0 T otal
5 (1 4 .2 )*9 (2 5 .7 )
1 4 (4 0 .0 )
1 2 (3 4 .3 ) 9 (2 5 .7 )
2 1 (6 0 .0 )
17(48 .6)18(51 .4 )
3 5 (1 0 0 .0 )
In d iv id u a l L iv es to ck an d c ro p p ro d u c tio n
A g ro p asto ra l:L ess th an 2 0 ,0 0 0 M ore th an 2 0 ,0 0 0 T otal
13 (3 7 .1 ) 1 5 (4 2 .9 ) 2 8 (8 0 .0 )
3 ( 8 .6 ) 4 ( 1 1 .4 ) 7 (2 0 .0 )
16(45 .7)19(54 .3)
3 5 (1 0 0 .0 )
* F ig u re s in b ra c k e ts a rc p e rcen tag es
Agropastoral households tend to be more food secure with lower income levels than
transhumant households because they produce most of their food to meet calorie
requirement. This is because transhumant pastoralists do not keep cash but instead
purchase more animals to increase their herd. As a result, they tend to be more food
insecure because in times of distress the animal selling price is lower than the buying
price, resulting in income loss.
43.13 Food Production
The main food crops produced by agropastoral households are maize, beans and
occasionally vegetables to supplement their diet. Maize produced by households was
categorised into two: low and high maize production. Households producing 1,000 kg
or less were considered low maize producers while those producing more than 1,000
kg high maize producers. The mean weight of maize produced was 1,010 kg, with 63
54

per cent o f agropastoral households obtaining low maize yields. The agropastoral
households that obtained maize yields above 1,000 kg were food secure.
Land tenure influences food production because in an agropastoral system where
tenure is individual a household can make decisions on the crops to grow. In the
transhumant system, where land tenure is communal, households have no authority to
make decisions on land use and only follow recommendations of the group ranch
committee. The agropastoralists who produced maize and beans were more food
secure (80 per cent) than the transhumant households (40 per cent) who relied on
purchased food. When the total calories obtained from produced maize and beans
were compared to the total calories from purchased foodstuff, such as sugar, oil,
wheat and rice, the produced food contributed about 60 per cent of the total calories
available to the agropastoral households. Table 15 shows the contribution (in
percentages) of every foodstuff to the total calories available in transhumant and
agropastoral households.
I a b le IS : C o n t r ib u t io n o f d if f e re n t fo o d s tu f f to th e to ta l r a ln r ie s a v a i l a b le in t r a n s h u m a n t
a n d a g r o p a s to r a l h o u s e h o ld s
F o o d s tu ffs T ra n sh u m a n t h o u se h o ld s A g ro p asto ra l h o u se h o ld sM a iz e 4 7 .2 8 7 2 .3 2B e a n s 6 .3 8 5 .3 0S u g a r 5.41 3 .9 8W h e a t 2 .8 7 1.86R ic e 5 .7 8 2.31M ilk 25.21 2 .9 6O il and fats 6 .5 3 1.27
4.3.14 Expenditure on Food
The average cash expenditure on food items by both transhumant and agropastoral
households were varied. In transhumant households, the mean expenditure on food
purchase within a six-month period was Kshs 15,461 or 2,577 per month. The
agropastoral ists had a mean expenditure o f Kshs 12,178 or 2,030 per month. The
proportion of money spent on various food items by both the transhumant and
agropastoral households in decreasing order are maize, oil, sugar, rice, beans, and
wheat. Table 16 shows the proportion o f money spent on various food items.
55
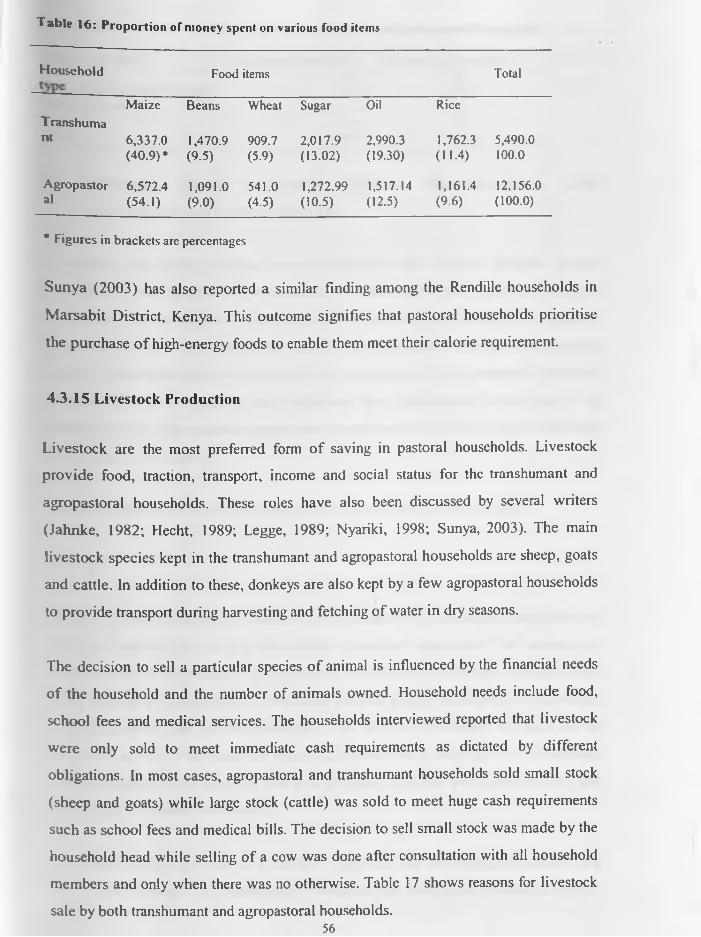
T ab le 16: Proportion of money spent on various food items
H o u s e h o ld F o o d item s T o ta l
M a iz e B e a n s W h ea t S u g a r Oil R ic e
T r a n s h u m an t 6 ,3 3 7 .0 1 ,4 7 0 .9 9 0 9 .7 2 ,0 1 7 .9 2 ,9 9 0 .3 1 ,7 6 2 .3 5 ,4 9 0 .0
( 4 0 .9 ) * (9 .5 ) (5 .9 ) (1 3 .0 2 ) (1 9 .3 0 ) (1 1 .4 ) 100 .0
A g r o p a s t o r 6 ,5 7 2 .4 1 ,0 9 1 .0 5 4 1 .0 1 ,2 7 2 .9 9 1 ,517 .14 1 ,1 6 1 .4 12 ,1 5 6 .0a l (5 4 .1 ) (9 .0 ) (4 .5 ) (1 0 .5 ) (1 2 .5 ) (9 .6 ) (1 0 0 .0 )
* F ig u r e s in b ra c k e ts a re p e rc e n ta g e s
Sunya (2003) has also reported a similar finding among the Rendille households in
M arsabit District, Kenya. This outcome signifies that pastoral households prioritise
the purchase o f high-energy foods to enable them meet their calorie requirement.
4.3.15 Livestock Production
Livestock are the most preferred form o f saving in pastoral households. Livestock
provide food, traction, transport, income and social status for the transhumant and
agropastoral households. These roles have also been discussed by several writers
(Jahnke, 1982; Hecht, 1989; Legge, 1989; Nyariki, 1998; Sunya, 2003). The main
livestock species kept in the transhumant and agropastoral households are sheep, goats
and cattle. In addition to these, donkeys are also kept by a few agropastoral households
to provide transport during harvesting and fetching of water in dry seasons.
The decision to sell a particular species o f animal is influenced by the financial needs
o f the household and the number of animals owned. Household needs include food,
school fees and medical services. The households interviewed reported that livestock
were only sold to meet immediate cash requirements as dictated by different
obligations. In most cases, agropastoral and transhumant households sold small stock
(sheep and goats) while large stock (cattle) was sold to meet huge cash requirements
such as school fees and medical bills. The decision to sell small stock was made by the
household head while selling o f a cow was done after consultation with all household
members and only when there was no otherwise. Table 17 shows reasons for livestock
sale by both transhumant and agropastoral households.56

T ab le 17: Reasons for livestock sale by both transhumant and agropastoral households
Reason f o r sa le T ra n sh u m a n t h o u se h o ld s A g ro p asto ra l h o u se h o ld sF o o d s t u f f s 6 0 .5 5 2 .2S c h o o l f e e s an d m e d ic a l b ills 34 .2 3 8 .8Build u p s to c k 2.3 6 .6D r o u g h t 3 .0 2 .4T o t a l 100 .0 1 0 0 .0
4 .4 OVERALL FOOD SECURITY AMONG TRANSHUMANT AND
AGROPASTORAL HOUSEHOLDS
T o analyse the factors affecting overall household food security situation among
transhumant and agropastoral households, both descriptive and regression analyses
w ere done. The minimum cash expenditure sufficient to meet the caloric requirement
o f one AAME was first established and then the daily cash available to each o f the
resident households was worked out. The assumption is that household members
consume food according to their nutritional food requirements when food is in
adequate supply. The minimum requirement was taken to be 2,250 kcal per AAME per
day (Nyariki et al., 2002).
For the calculation of food poverty incidence, the equation below was used:
fp = q/n
Where fp is the food poverty incidence, q is the number of households that fall below
the food poverty line and n is the number of sampled households. The incidence of
food poverty of households is the proportion of food poor households compared to the
total number of households. To determine the food poverty incidence o f households,
the food poverty line was first determined. The food poor households are those that do
not have access to food that can supply 2,250 kcal per AAME per day. Households
whose members have access to food that provides 2,250 kcal per AAME per day and
above are considered food secure.
The study was carried out in a ‘normal’ year when the environmental factors were
considered average. The transhumant households had food poverty incidence (pj) of
57
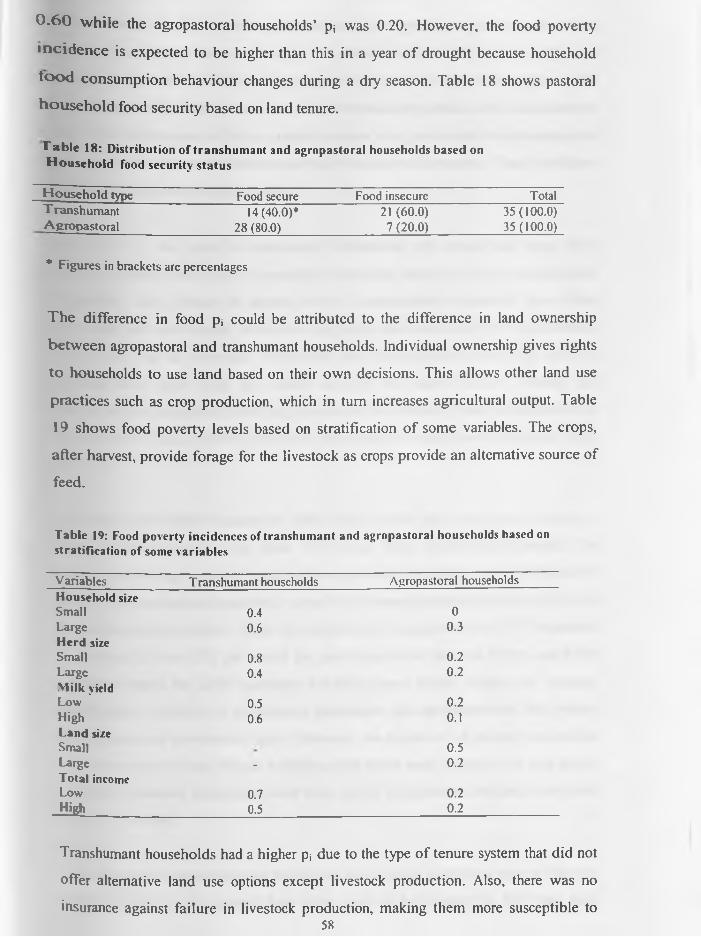
0 .6 0 w hile the agropastoral households’ p; was 0.20. However, the food poverty
in c id en ce is expected to be higher than this in a year o f drought because household
fo o d consumption behaviour changes during a dry season. Table 18 shows pastoral
ho u seh o ld food security based on land tenure.
T a b l e 1 8 : D is t r ib u t io n o f t r a n s h u m a n t a n d a g r o p a s to r a l h o u s e h o ld s b a s e d o n H o u s e h o l d fo o d s e c u r i ty s t a t u s
H o u s e h o l d type F o o d secu re F o o d in secu re T o ta lT r a n s h u m a n t 1 4 (4 0 .0 )* 21 (6 0 .0 ) 3 5 (1 0 0 .0 )A g r o p a s t o r a l 2 8 (80 .0) 7 (2 0 .0 ) 35 (1 0 0 .0 )
* F ig u r e s in b ra c k e ts a re p e rc e n ta g e s
T he difference in food pj could be attributed to the difference in land ownership
betw een agropastoral and transhumant households. Individual ownership gives rights
to households to use land based on their own decisions. This allows other land use
practices such as crop production, which in turn increases agricultural output. Table
19 shows food poverty levels based on stratification of some variables. The crops,
after harvest, provide forage for the livestock as crops provide an alternative source of
feed.
T a b le 19: F o o d p o v e r ty in c id e n c e s o f t r a n s h u m a n t a n d a g r o p a s to r a l h o u s e h o ld s b a s e d on s t r a t i f i c a t i o n o f so m e v a r i a b le s
V a r ia b le s T ra n sh u m a n t h o u seh o ld s A g ro p a s to ra l h o u seh o ld s
H o u s e h o ld s ize S m a ll 0.4 0L a rg e 0.6 0 .3H e r d size S m a ll 0.8 0 .2L a rg e 0.4 0 .2V lilk y ie ldL o w 0.5 0 .2H ig h 0.6 0.1L a n d size S m a ll 0 .5L a rg e - 0 .2T o ta l incom eL o w 0.7 0 .2H ig h 0.5 0 .2
Transhumant households had a higher pi due to the type o f tenure system that did not
offer alternative land use options except livestock production. Also, there was no
insurance against failure in livestock production, making them more susceptible to58
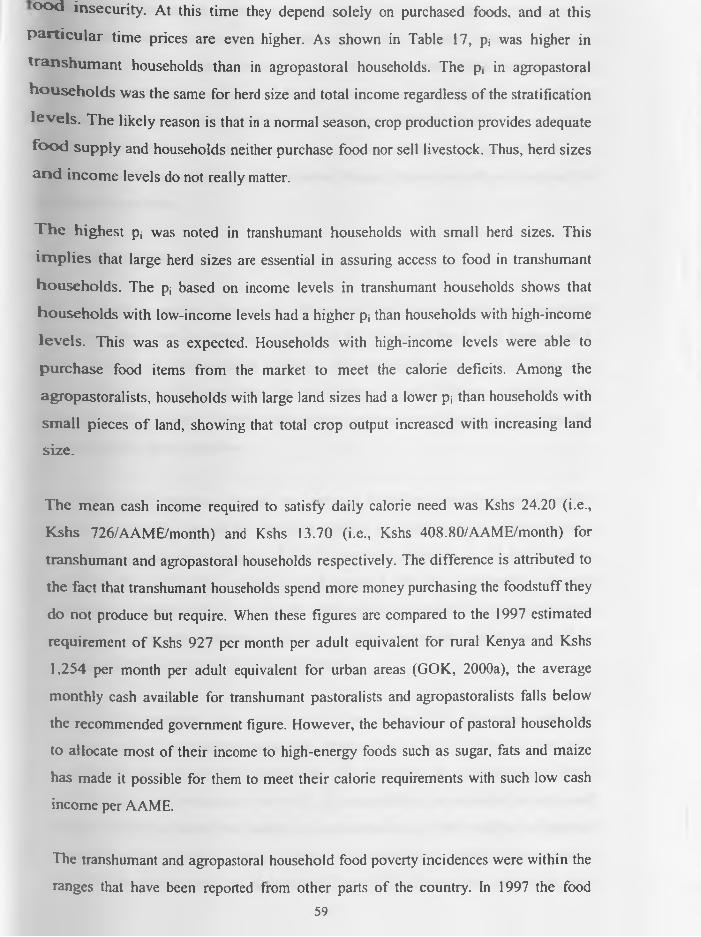
°°< i insecurity. At this time they depend solely on purchased foods, and at this
p a r t ic u la r time prices are even higher. As shown in Table 17, pi was higher in
tra n sh u m a n t households than in agropastoral households. The p, in agropastoral
h o u se h o ld s was the same for herd size and total income regardless of the stratification
le v e ls . The likely reason is that in a normal season, crop production provides adequate
fo o d supply and households neither purchase food nor sell livestock. Thus, herd sizes
a n d incom e levels do not really matter.
T h e highest pj was noted in transhumant households with small herd sizes. This
im p lie s that large herd sizes are essential in assuring access to food in transhumant
households. The pj based on income levels in transhumant households shows that
households with low-income levels had a higher pj than households with high-income
levels. This was as expected. Households with high-income levels were able to
purchase food items from the market to meet the calorie deficits. Among the
agropastoralists, households with large land sizes had a lower p* than households with
sm all pieces o f land, showing that total crop output increased with increasing land
size.
The mean cash income required to satisfy daily calorie need was Kshs 24.20 (i.e.,
Kshs 726/AAME/month) and Kshs 13.70 (i.e., Kshs 408.80/AAME/month) for
transhumant and agropastoral households respectively. The difference is attributed to
the fact that transhumant households spend more money purchasing the foodstuff they
do not produce but require. When these figures are compared to the 1997 estimated
requirement o f Kshs 927 per month per adult equivalent for rural Kenya and Kshs
1,254 per month per adult equivalent for urban areas (GOK, 2000a), the average
monthly cash available for transhumant pastoralists and agropastoralists falls below
the recommended government figure. However, the behaviour of pastoral households
to allocate most of their income to high-energy foods such as sugar, fats and maize
has made it possible for them to meet their calorie requirements with such low cash
income per AAME.
The transhumant and agropastoral household food poverty incidences were within the
ranges that have been reported from other parts o f the country. In 1997 the food59
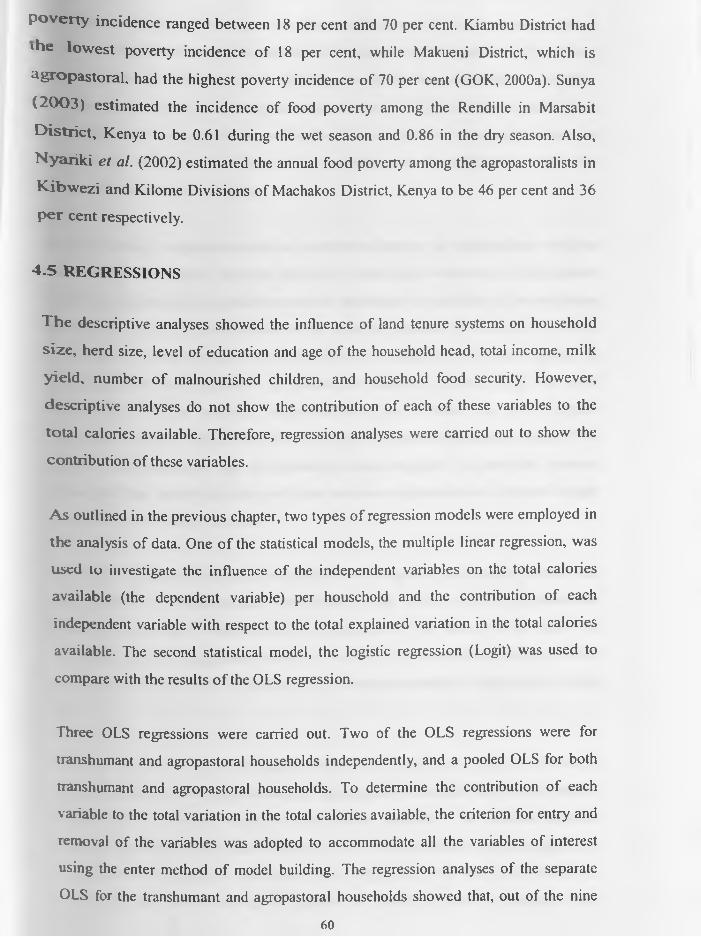
p o v e r ty incidence ranged between 18 per cent and 70 per cent. Kiambu District had
‘he low est poverty incidence o f 18 per cent, while Makueni District, which is
a gropastoral, had the highest poverty incidence of 70 per cent (GOK, 2000a). Sunya
(2 0 0 3 ) estimated the incidence of food poverty among the Rendille in Marsabit
D istrict, Kenya to be 0.61 during the wet season and 0.86 in the dry season. Also,
N y a rik i et al. (2002) estimated the annual food poverty among the agropastoralists in
K ib w e z i and Kilome Divisions of Machakos District, Kenya to be 46 per cent and 36
p e r cent respectively.
4 .5 REGRESSIONS
T he descriptive analyses showed the influence of land tenure systems on household
s ize , herd size, level of education and age o f the household head, total income, milk
y ield , number o f malnourished children, and household food security. However,
descriptive analyses do not show the contribution of each o f these variables to the
to tal calories available. Therefore, regression analyses were carried out to show the
contribution o f these variables.
A s outlined in the previous chapter, two types of regression models were employed in
the analysis of data. One o f the statistical models, the multiple linear regression, was
used to investigate the influence o f the independent variables on the total calories
available (the dependent variable) per household and the contribution of each
independent variable with respect to the total explained variation in the total calories
available. The second statistical model, the logistic regression (Logit) was used to
compare with the results o f the OLS regression.
Three OLS regressions were carried out. Two of the OLS regressions were for
transhumant and agropastoral households independently, and a pooled OLS for both
transhumant and agropastoral households. To determine the contribution o f each
variable to the total variation in the total calories available, the criterion for entry and
removal of the variables was adopted to accommodate all the variables of interest
using the enter method of model building. The regression analyses of the separate
OLS for the transhumant and agropastoral households showed that, out of the nine
60
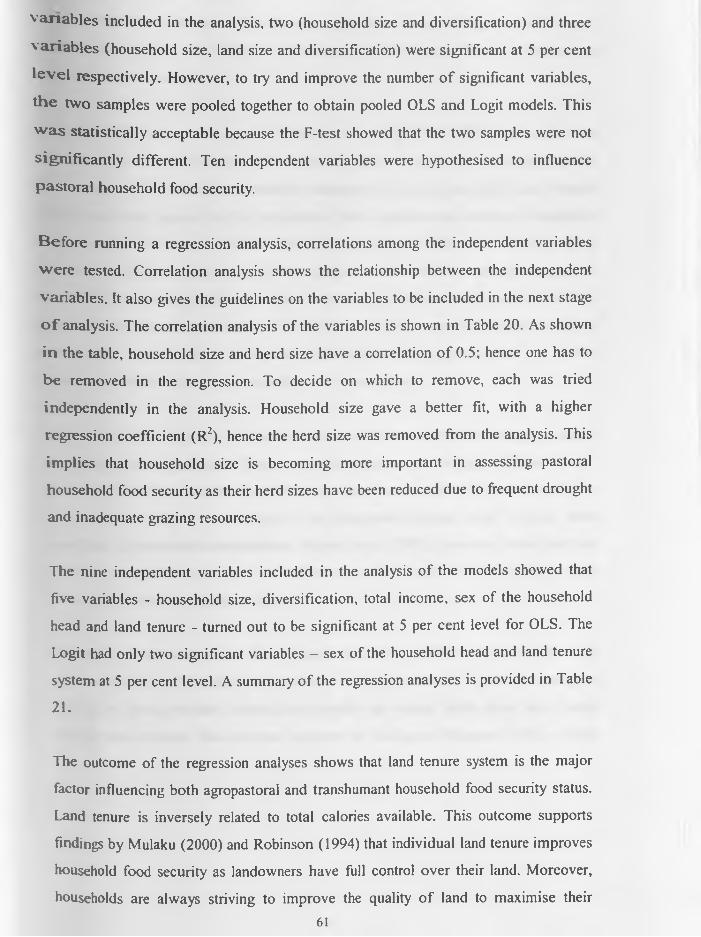
v a ria b le s included in the analysis, two (household size and diversification) and three
v a ria b le s (household size, land size and diversification) were significant at 5 per cent
le v e l respectively. However, to try and improve the number o f significant variables,
th e two samples were pooled together to obtain pooled OLS and Logit models. This
w a s statistically acceptable because the F-test showed that the two samples were not
significantly different. Ten independent variables were hypothesised to influence
pasto ral household food security.
B efore running a regression analysis, correlations among the independent variables
w ere tested. Correlation analysis shows the relationship between the independent
variables. It also gives the guidelines on the variables to be included in the next stage
o f analysis. The correlation analysis of the variables is shown in Table 20. As shown
in the table, household size and herd size have a correlation o f 0.5; hence one has to
b e removed in the regression. To decide on which to remove, each was tried
independently in the analysis. Household size gave a better fit, with a higher
regression coefficient (R2), hence the herd size was removed from the analysis. This
implies that household size is becoming more important in assessing pastoral
household food security as their herd sizes have been reduced due to frequent drought
and inadequate grazing resources.
The nine independent variables included in the analysis of the models showed that
five variables - household size, diversification, total income, sex of the household
head and land tenure - turned out to be significant at 5 per cent level for OLS. The
Logit had only two significant variables — sex of the household head and land tenure
system at 5 per cent level. A summary o f the regression analyses is provided in Table
21.
The outcome of the regression analyses shows that land tenure system is the major
factor influencing both agropastoral and transhumant household food security status.
Land tenure is inversely related to total calories available. This outcome supports
findings by Mulaku (2000) and Robinson (1994) that individual land tenure improves
household food security as landowners have full control over their land. Moreover,
households are always striving to improve the quality o f land to maximise their61

returns from land. However, this finding contradicts those o f Migot-Adholla et al.
(1994) and Place et al. (1994), which indicate that land tenure has no influence on
agricultural production.
Diversification influences household food security negatively. This implies that the
more the involvement o f households in the non-farm activities, the more they become
food insecure. This outcome contradicts findings by Nyariki et al. (2002) and Vedeld
(1990) and runs counter to the expectation that diversification improves household
food security. The reason could be that there is inadequate labour to be involved in
alternative activities, as pastoralists and agropastoralists have increasingly recognised
the need to take their children to school with the introduction of free education. The
outcome could also be attributed to lack o f credit facilities and inadequate extension
services to educate the transhumant pastoralists and agropastoralists on viable
alternative livelihood sources compatible with pastoralism.
An increase in household size leads to increased food security for both agropastoral
and transhumant households. This outcome is similar to the findings of Kigutha et al.
(1994) and Kavishe and Mushi (1993) that large households with low dependency
ratio favour resource contribution to the household because there is more food
available for household consumption. Nyariki et al. (2002), however, found out that
smaller household sizes lead to higher household food security because their
households have less people to feed.
According to the results, sex of the household head is positively related to the total
calories available. The likely reason is that households headed by men do not give
priority to food purchase; instead they rebuild up animal herds since large herds
indicate social status. This outcome supports the findings o f Mencher (1985), Gulati
62
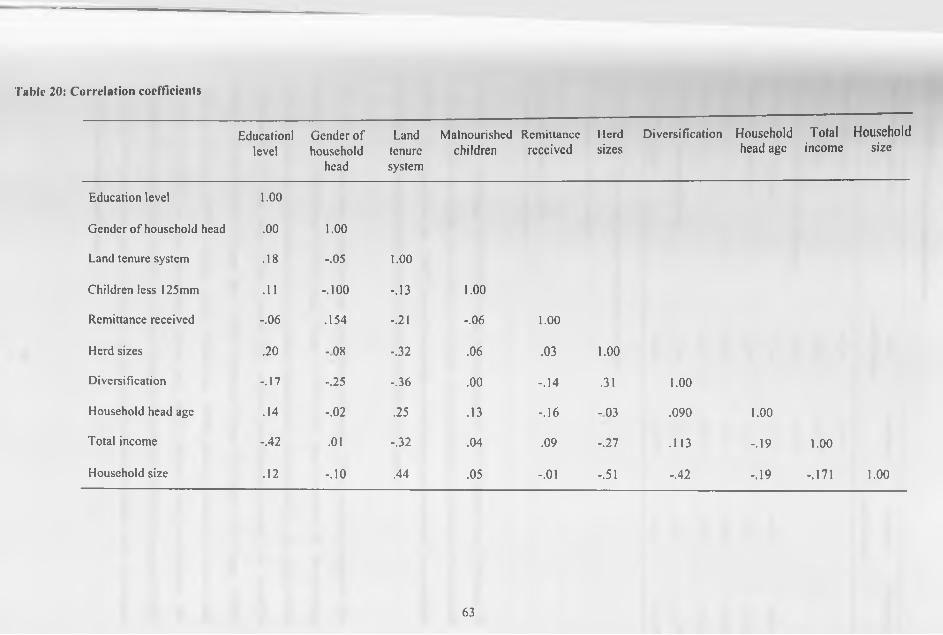
Tabic 20: Correlation coefficients
E d u ca tio n llevel
G e n d e r o f h o u se h o ld
h ead
L andten u resy s tem
M a ln o u rish edc h ild re n
R e m itta n c ere c e iv e d
H erds ize s
D iv e rs if ic a tio n H o u se h o ld h e a d a g e
Totalin c o m e
Households iz e
E d u c a tio n lev e l 1.00
G e n d e r o f h o u se h o ld h ead .00 1.00
L an d te n u re sy s tem .18 -.0 5 LOO
C h ild re n le ss 125m m .11 -.1 0 0 -.1 3 1.00
R em ittan ce re ce iv ed -.0 6 .1 5 4 -.21 -.0 6 1.00
H erd s izes .2 0 1 © 00 - .3 2 .06 .03 1.00
D iv e rs if ic a tio n -.1 7 -.25 -.3 6 .00 -.1 4 .31 1.00
H o u se h o ld h ead ag e .14 -.0 2 .25 .13 -.1 6 1 © u> .0 9 0 1.00
T o ta l in co m e -.4 2 .01 -.3 2 .04 .09 - .2 7 .113 -.1 9 LOO
H o u se h o ld size .12 -.1 0 .44 .05 -.01 -.51 - .4 2 -.1 9 -.171 1 .00
63
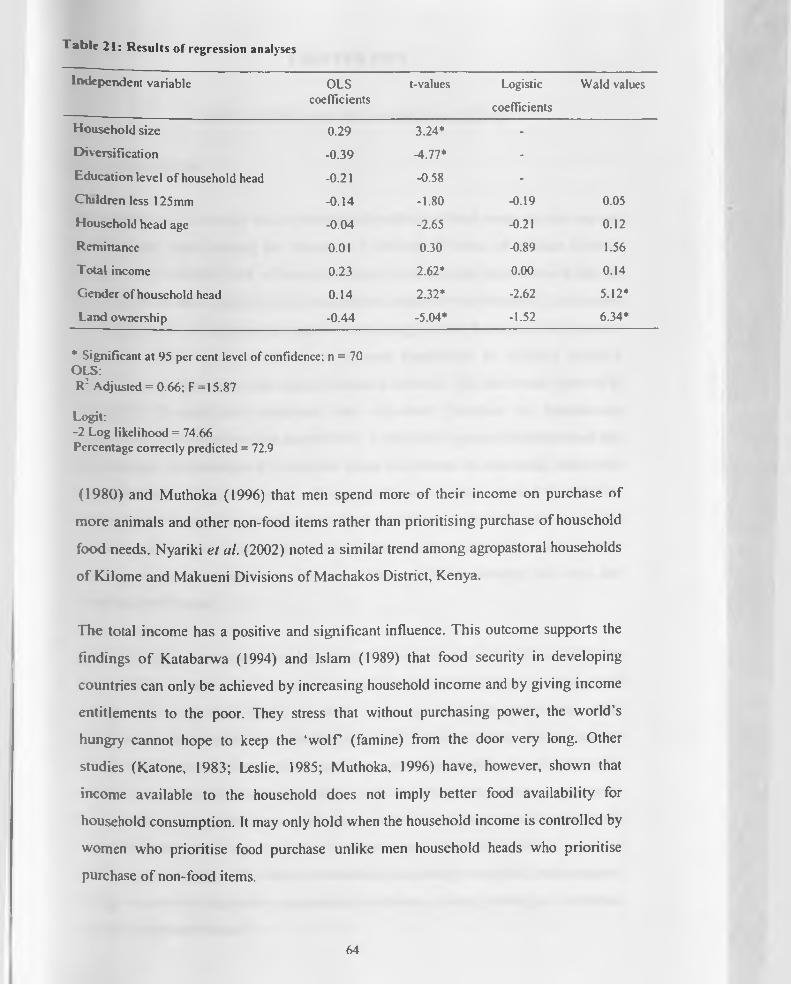
T ab le 21: Results of regression analyses
I n d e p e n d e n t v a r ia b le O L Sc o e ff ic ie n ts
t-v a lu es L og istic
c o e ff ic ie n ts
W a ld values
H o u s e h o ld s iz e 0 .2 9 3 .2 4 * -
D iv e r s i f i c a t io n -0 .3 9 -4 .7 7 * -
E d u c a t i o n le v e l o f h o u se h o ld h ead -0 .2 1 -0 .5 8 -
C h i l d r e n le s s 1 2 5 m m -0 .1 4 -1 .8 0 -0 .19 0 .05
H o u s e h o ld h e a d a g e -0 .0 4 -2 .6 5 -0.21 0 .1 2
R e m itta n c e 0 .0 1 0 .3 0 -0 .89 1.56
T o ta l in c o m e 0 .2 3 2.62* 0 .0 0 0 .1 4
G e n d e r o f h o u s e h o ld h e a d 0 .1 4 2 .32* -2 .62 5 .12*
L a n d o w n e rs h ip -0 .4 4 -5 .0 4 * -1 .5 2 6 .3 4 *
* S ig n if ic a n t a t 9 5 p e r c e n t lev e l o f co n fid en ce ; n = 70 O L S :R : A d ju s te d = 0 .6 6 ; F = 1 5 .8 7
L o g it ;- 2 L o g lik e lih o o d = 7 4 .6 6 P e rc e n ta g e c o r r e c t ly p re d ic te d = 72 .9
(1980) and Muthoka (1996) that men spend more of their income on purchase of
more animals and other non-food items rather than prioritising purchase of household
food needs. Nyariki et al. (2002) noted a similar trend among agropastoral households
o f Kilome and Makueni Divisions of Machakos District, Kenya.
The total income has a positive and significant influence. This outcome supports the
findings o f Katabarwa (1994) and Islam (1989) that food security in developing
countries can only be achieved by increasing household income and by giving income
entitlements to the poor. They stress that without purchasing power, the world’s
hungry cannot hope to keep the 'wolT (famine) from the door very long. Other
studies (Katone, 1983; Leslie, 1985; Muthoka, 1996) have, however, shown that
income available to the household does not imply better food availability for
household consumption. It may only hold when the household income is controlled by
women who prioritise food purchase unlike men household heads who prioritise
purchase of non-food items.
64

CHAPTER FIVE
CONCLUSION AND RECOMMENDATIONS
5.1 CONCLUSION
The objective of this study was to determine the effects of land tenure on land use and
food security status among the Maasai in Loitokitok Division of Kajiado District,
Kenya. Also, variables that influence household food security were assessed and the
contribution o f each variable to the total calories available was estimated. Land tenure
was found to be an important parameter in assessing pastoral household food security
status. It makes up an integral part o f rural livelihoods by defining people’s
relationships to the nature and value of land as a resource. The land tenure systems in
Loitokitok Division are communal and individual, practised by transhumant
pastoralists and agropastoralists respectively. Land tenure system influences land use.
For instance, in transhumant households where land tenure is communal, land use is
restricted to livestock production. This type of tenure is characterised by mobility.
Agropastoral households practise individual tenure on crop fields and communal
tenure on grazing resources. The individual tenure is characterised by access options
and rights to make decisions on the use of the crop fields allowing both crop and
livestock production.
Variables that influence pastoral household food security are also influenced by the
land tenure system. For instance, household sizes are larger in agropastoral
households to provide labour for both crop and livestock production, while
transhumant households have smaller household sizes providing labour only to
livestock production. Also, herd sizes are larger in transhumant households due to the
motivation of the transhumant pastoralists to increase livestock numbers to maximise
the use of common resources; while agropastoralists herd sizes are limited by the
available land sizes. Large herd sizes in transhumant households result in increased
milk output. The high milk output is favoured by the ability to exploit a wide range of
forage resources as opposed to agropastoral continuous grazing, leading to a reduction
in milk output per animal.65

The total income is derived from sale o f livestock, employment, wages, remittance,
sale of milk and lease of land. Income from livestock contributes the highest
proportion o f the total income while incomes from lease of land the least. In
transhumant households, income sources include livestock, employment, remittances,
milk, wages and land lease in a descending order. For agropastoral household’s
income sources include livestock, milk, employment, wages, lease of land and
remittances in that order. Most household female income is remitted from relatives,
most of which becomes part o f the food budget. Transhumant households have higher
income levels than the agropastoralists because they rely wholly on food purchase
compared to the agropastoralists who grow crops to supplement animal protein.
In terms of household food security status, agropastoralists are more food secure with
a low pi of 0.2, in comparison to the transhumant pastoralists pi of 0.6. The difference
in food security status may be attributed to the difference in tenure systems. Apart
from land tenure system, other variables that explain pastoral household food security
are diversification, household size, total income and gender of the household head.
These results cannot be generalised for all pastoral communities. There is need to
increase the sample size and compare the findings.
5.2 RECOMMENDATIONS
From this study, the following recommendations are suggested to help reduce
household food insecurity in transhumant and agropastoral households in Loitokitok
Division, Kajiado District, Kenya:
• Educate and introduce the concept of individualisation of land rights among the
pastoral households, since households practising individual tenure are more food
secure.
• For most women, their income was from remittance and much o f it became part of
the food budget. Women should be encouraged to participate more in income
generating activities in order to ensure more contribution o f women towards
access to food. This can be achieved by formation o f women groups to provide a
forum for sharing ideas and teamwork.66
• There is need for the establishment of alternative livelihood sources that are
compatible with transhumance and agropastoral ism so as to improve cash
incomes. They include activities such as establishment of micro industries for
hides and skins, milk processing plants to provide ready markets and avoid
exploitation by the middlemen.
67

REFERENCES
Aboud, A. A. 1982. Range Management Extension Services on Pastoral Societies of
Kenya. M.Sc. Thesis, Ohio State University.
Alemu, T. D. 1998. Impact o f Land use on Woody Vegetation in the Semi-arid area
o f Abala District, North Afar, Ethiopia: M.Sc. Thesis, Department o f Range
Management, University of Nairobi, Kenya.
Ali, S. 1995. Pastoral Systems o f Ethiopia and Sustainable Development: The Case of
Afar in the Awash Valley of Ethiopia. Paper presented at Pastoral Information
Network Programme (PINEP) Regional Workshop, Department o f Range
Management, University of Nairobi, Kenya.
Asambu, F. K. 1993. Farmers’ Perceptions and Economic Analysis o f Factors
Affecting Farm Level Maize Enterprise Performance and Adoption of
Agricultural Technological Innovations in Semi-arid South Eastern Kenya:
M.Sc. Thesis University of Nairobi, Kenya.
Atwood, D. A. 1990. Land Registration in Africa: The Impact on Agricultural
Production. World Development, 18:659-671.
Avan, M. A. 1981. Nomadism and Development in Africa. M.Sc. Thesis, University
o f Arizona, USA.
Bekure, S., Dc Leew, P. N., Grandin, B. E and Neale, P. J. H. (eds). 1991. Maasai
Herding: Analysis of the Livestock Production System of Maasai Pastoralists
in Eastern Kajiado District, Kenya. ILCA Systems 4. ILCA Addis Ababa,
Ethiopia.
Berger, D. J. 1993. Wildlife Extension: Participatory Conservation by the Maasai of
Kenya. ACTS Press, Nairobi, Kenya.
Bonfiglioli, A. M. 1992. Pastoralists at Crossroads: Survival and Development Issues
in African Pastoralism. NOPA, UN1CEF/UNSO Project for Nomadic
Pastoralists in Africa, Nairobi, Kenya.
Bovin, M. and Manger, L. (eds) 1990. Adaptive Strategies in African Arid Lands.
Scandinavian Institute of African Studies, Uppsala, Sweden.
Bromley, D. \V. 1989. Property Relations and Economic Development: The other
Land Reform. World Development, 17 (6): 857-877.
68

Bruce W. J., Migot-Adholla, S. E. and Atherton, J. 1994. The Findings and their
Policy Implications: Institutional adaptation or Replacement. In Searching for
Land Tenure Security in Africa, Migot-Adholla, S. and Bruce, W (eds),
Dubuque: Kendall/ Hunt, London.
Chabari, F.VV. 1986. The Marketing o f Sheep and Goats from two Pastoral Systems
in Kenya. A Comparative of Market Offtake from Maasailand and Baringo.
M.Sc. Thesis, University of Nairobi, Kenya.
Chambers, R. 1987. Sustainable Livelihood, Environment and Development: Putting
Poor Rural People first. Institute o f Development Studies Discussion Paper
240. University of Sussex, Institute of Development Studies Briton, England.
Chambers, R. and Conway, G. R. 1992. Sustainable Rural Livelihoods: Practical
Concepts for the Twenty-first Century. Institute o f Development Studies
Discussion Paper 29. University of Sussex, Institute o f Development Studies,
Briton, England.
Clay, E. 1981. Food Policy Issues in Low-Income Countries: An Overview: In Food
Policy Issues in Low-income Countries. World Bank Staff Working Paper 473.
Clay, E., Chambers, R., Singer, H. and Lipton, M. (eds). World Bank
Washington DC.
Conable, B. B. 1989. Sub-Saharan Africa: From Crisis to Sustainable Growth. The
World Bank, Washington DC.
Conway, G. R. and Barbier, E. B. 1990. After the Green Revolution: Sustainable
Agriculture for Development, Earthscan Publications, Ltd, London.
Cossins, N. J. 1983. Production Strategies and Pastoral Man in ILCA. Pastoral
Systems Research in Sub-Saharan Africa. ILCA, Nairobi, Kenya.
Dahl, G. and Hjort, A. 1976. Having Herds: Pastoral Growth and Household
Economy: Studies in Social Anthropology 2, University of Stockholm,
Stockholm.
Dahl, G. and Hjort, A. 1979. Pastoral Change and the Role of Drought. SAREC
Report 2R
Dale, P. F. and McLaughlin, J. D. 1999. Land Administration. Oxford University
Press, Oxford.
69
Davis, S. L, Melissa, L. and Roaslind, D. 1991. Food Security and the Environment:
Conflict or Complementary? Institute of Development Studies Discussion
Paper 285. University o f Sussex, Institute of Development Studies, Briton,
England.
Djoura, H., Rita, J. and Margo, K. 1991. Village Management o f Natural
Resources: A Difficult Challenge. Paper Presented at the 11th Annual
Symposium, Farming Systems Research Extension in 1990s: Critical Issues
and Future Directions.”Royal Tropical Institute, Amsterdam.
FAO. 1986. Food and Fruit Bearing Species. Examples from South East Asia. FAO
Forestry Paper 44, Rome.
FAO. 1989. Household Food Security and Forestry: An Analysis of Socio-Economic
Issues. FAO, Rome.
FAO. 2000. Website of the Food and Agricultural Organisation of the United
Nations, http: // www.fao.org/unfao/whatitis.
FAO. 2001. Soil Fertility Management Support of Food Security in Sub-Saharan
Africa. FAO, Rome.
Farah, K. O. and Haji, A. J. 1990. African Pastoral Nomadism in Transition: The
Case of North-Eastern Kenya. A Paper Presented at the Social Science
Research Council Symposium 6-20 December, Harare, Zimbabwe.
Farah, K. O. 1996. Management and Development o f the Arid Communal
Rangelands of North-Eastern Kenya: An Analysis of Past and Present. The
African Pastoral Forum, Working Series 7, PINEP, Department o f Range
Management, University of Nairobi, Kenya.
Feder, G., Tongroj, O., Chalamwong, Y. and Hongladaroin, C. 1988. Land
Policies and Farm Productivity in Thailand. Baltimore, Md: Johns Hopkins
University Press, USA.
Feder, G., and Feenv, D. 1991. Land Tenure and Property Rights: Theory and
Implications for Development Policy. World Bank Review, 5: 135-153.
GOK (Government of Kenya). 1968. The Land (Group Representatives) Act,
Chapter 287, Laws o f Kenya, Government Printer, Nairobi, Kenya.
GOK. 1994. Populations and Housing Census. Central Bureau of Statistics,
Government Printer, Nairobi, Kenya.
70
GOK. 1999. Population and House Census. Central Bureau of Statistics, Government
Printer, Nairobi, Kenya.
GOK. 2000a. Second Report on Poverty in Kenya. Welfare Indicator. A Report
Prepared by Central Bureau o f Statistics and Human Resources and Social
Services Department. Government Printer, Nairobi, Kenya.
GOK. 2000b. The 1999 Population and Housing Census. Central Bureau of Statistics.
Government Printer, Nairobi, Kenya.
GOK. 2001a. Ministry of Agriculture, Loitokitok Division Annual Reports, Kajiado
District, Kenya.
GOK. 2001a. Kajiado District Development Plan, Government Printers, Nairobi,
Kenya.
Gulati, L. 1980. Profile o f a Female Agricultural Labourer. In Economic and
Politically Weekly, March 25.
Hampson, M. 1975. Conceptual Approach to Some Land Use Problems in Kajiado
District. M.Sc. Thesis University of Nairobi, Kenya.
Hecht, S. B. 1989. Sacred Cows in the Green Hell: Why Livestock makes sense to
Producers. Unpublished Mimeograph.
Helland, J. 1980. Some Aspects and Implications of the Development o f Grazing
Blocks in North Eastern Province Kenya-ILCA Nairobi, Kenya.
Herlocker, D. 1999. Rangeland Resources in Eastern Africa. Their Ecology and
Development. German Technical Co-operation (GTZ), Nairobi, Kenya.
Herskovits, M. 1926. The Cattle Complex in East Africa. American
Anthropologists, 28: 270-644.
Heyer, J., Maitha, J. and Senga, W. 1976. Agricultural Development in Kenya.
Nairobi: Oxford University Press, Oxford.
Hjort, A. 1985. Interdisciplinary views on Land Management and Introduction. In
Land Management and Survival, Hjort, A (ed). Nordiska African Institutes,
Sweden.
Ibrahim, F. N. and Ruppert, H. 1994. Process of Identity Change among the Maasai
under Present Tanzania Land Use Policy.
ILCA. 1981. New Ways for Old Worlds: Development and Research, New Approach
to the Ethiopian Rangelands Development Project. ILCA, Addis Ababa,
71
Ethiopia.
Islam, N. 1989. Food Strategy and Development in Bangladesh. International Food
Policy Research Institute, Reprint.
Jahnke, H. E. 1982. Livestock Production Systems and Livestock Development in
Tropical Africa. Keiler Wissenschafts Verlag Vauk, West Germany.
Juma, C. and Ojwang’, J. B. (eds). 1996. In Land We Trust: Environment, Private
Property and Constitutional Change. Zed Books, London.
KARI/ODA. 1996. Manual of Livestock Systems in Kenya. Livestock
Socioeconomic and Epidemiology Project. National Veterinary Research
Center, Kikuyu Kenya.
Kariuki, G. K., Tadingar, T. and Farah, K. O. 1996. Socio-economic Impacts of
Smallholder Irrigation Schemes among the Borana Nomads o f Isiolo District,
Kenya. African Pastoral Forum, Working Paper Series 12, PINEP,
Department of Range Management, University o f Nairobi, Kenya.
Kaseje, D., Thuo, M. N. and Thorup, H. 1983. A Nutrition Baseline Survey Report.
Family Life Training Program, Lwaka Centre Electricity House: FLTP,
Nairobi, Kenya.
Katabarwa, N. 1994. Agricultural Supply Response and Prospects for Food Security
for Uganda. Unpublished PhD Thesis, Department o f Agricultural Economics,
University o f Nairobi, Kenya.
Katone-Apt, J. 1983. A Social Cultural Perspective on the Significance of Sex roles
in Agriculture. In Nutritional Impact o f Agricultural Projects. Papers and
Proceedings of a Workshop held by the UN ACC/SCN, Nairobi, Kenya.
Kavishe, F. P. and Mushi, S. S. 1993. Nutrition-Relevant Actions in Tanzania. UN
ACC/SCN Country Case Study for the XV Congress o f International Union of
the Nutritional Sciences. UNICEF, Tanzania.
Kennedy, E. and Haddad, L. 1994. Are Pre-schoolers from Female headed
households less Malnourished? A Comparative Analysis of Results from
Ghana and Kenya. The Journal o f Development Studies, 30(3): 680-695.
Keya, G. A. 1991. Alternative Policies and Models for Arid and Semi-Arid Lands in
Kenya: In Development Intervention in African Drylands Seminar
Proceedings. When the Grass is Gone, 25. Scandinavian Institute o f African
Studies, Uppsala, Sweden.
72
kigutha, H. N. 1994. Household Food Security and Nutrition Status of Vulnerable
Groups in Kenya: A Seasonal Study among Low Income Smallholder Rural
Households. Ph.D. Thesis, Wageningen University, The Netherlands.
Kigutha, H. N., Van Stareven, W. A., Veerman, W. and Haustvast, J. 1994. Child
Malnutrition in Poor Small Holder Household in Rural Kenya: An In-depth
Situation Analysis: In Household Food Security and Nutritional Status o f
Vulnerable Groups o f Kenya. Ph.D. Thesis University of Wageningen, The
Netherlands.
King, J. M., Sayers, A. R. Peacock, C. P. and Kontrohr, E. 1984. Maasai Herd and
Flock Structure in Relation to Livestock Wealth, Climate and Development.
Agricultural Systems, 13: 21-56.
Kioko, J. M. 2000. Range Condition Assessment o f Kuku Group Ranch. A
Preliminary Survey on the Impact of Pastoral Herd Management on Kuku
Conservation Area. Unpublished Report, Kenya Wildlife Service, Nairobi,
Kenya.
Kristjanson, P., Rademy, M., Nkediane, D., Kruska R., Reid, R., Gichoni, H.,
Atieno, F. and Sanford, R. 2002. Valuing Alternative Land-use Options in
Kitengela Wildlife Dispersal area of Kenya. ILRI Impact Assessment Series
10, ILRI, Nairobi, Kenya.
Lane, C. R. 1991. Cattle Economy, Drought and Settlement Patterns in the Pangani
River Valley. In Pastoral Economies in Africa and Long-Term Responses to
Drought, J. C. Stone (ed). Proceedings o f a Colloquium at the University of
Aberdeen, Scotland.
Lane, C R. and Swift, J. 1989. East African Pastoralism: Common Land, Common
Problems Issues Paper 8, Drylands Programme, International Institute for
Environment and Development (IIED), London.
Legge, K. 1989. Changing Responses to Drought among the Wadaabe of Niger: In
Bad Year Economics: Cultural Responses to Risk and Unceratainity. Halstead,
P and O’Shea, J. (eds). Cambridge University Press, Cambridge.
Le Houerou, H. 1980. The Rangelands of the Sahel. Journal o f Range Management,
33:41-45.
73
Lenaola, I., Jenner, H. H. and Wichert, T. 1996. Land Tenure in Pastoral Lands. In
Land We Trust: Environment, Private Property and Constitutional Change.
Zed Books, London.
Leslie, J. 1985. Women’s work load and Allocation of time to Food chain Activities;
Implications for Child nutrition: In Women's Role in Food Chain Activities
and Implications fo r Nutrition. ACC/SCN, Geneva, Switzerland.
Lusigi, W. J. 1984. Integrated Resources Assessment and Management Plan for
Western Marsabit District, Northern Kenya. UNESCO: IPAL Technical
Report A-6 (Part I and 2), Nairobi, Kenya.
Maghimbi, S. 1990. The Riverside Maasai: Cattle Economy, Drought and Settlement
Pattern in Pangani River Valley. In Pastoral Economies: Pastoral Economies
in Africa and Long-term Responses to Drought, J. C. Stone (ed). Proceedings
o f a Colloquium at the University of Aberdeen, Scotland.
Masila, K. J. 2004. Spatial-Temporal Distribution of African Elephants {Loxodanla
Afrcana Africana, Blumenbach) and their Interaction with Humans in Kuku-
Kimana areas of Tsavo-Amboseli Ecosystem. MSc. Thesis University of
Greenwich, UK.
Maxwel, S. 1990. Food Security in Developing Countries: Issues and Options for the
1990s. IDS Bulletin, 2 1 (3): 2-13.
M cCarthy, N., Swallow, Mirk, M. and Haell, P. (eds). 2000. Property Rights, Risks
and Livestock Development in Africa. ILRI, Kenya.
Melville, B. F. 1988. Are Land Availability and Cropping Pattern Critical Factors in
Determining Nutritional Status? Food and Nutrition Bulletin. 10: 44-48
Mencher, J. P. 1985. The Forgotten Ones. Females Landlessness Labourers in
Southern India. In Women Creating Wealth: Transforming Economic
Development. Gallin, R. S., and Spring, A. (eds/ Association for Women in
Development Conference, Washington DC.
Migot-Adholla, S., Hazell, P., Blarel, B. and Place, F. 1991. Indigenous Land
Rights Systems in Sub-Saharan Africa: A Constraint to Productivity. World
Bank Review, 5: 155-175.
Migot-Adholla, S., Frank, P. and Oluoch-Kosura, W. 1994. Security of Tenure and
Land Productivity in Kenya. In Searching for Land Tenure Security in Africa,
74
Migot-Adholla, S. and Bruce, W (eds), Dubuque: Kendall/ Hunt, London.
Morton, J. 1990. Aspects of Labour in an Agropastoral Economy: The Northern Beja
o f Sudan. Pastoral Development Network Paper, No. 30b, London.
Mulaku, C.G. 2000. In Search of Appropriate Land Tenure Models for Pastoral
Communities. African Pastoral Forum. Working Paper Series 22, P1NEP,
Department o f Range Management, University of Nairobi, Kenya.
Muthoka, S. 1996. Household Food Adequacy and the Nutritional Status o f Pre
school children in a Child Survival Project, Namelok, Kajiado District, M.Sc.
Thesis University of Nairobi, Kenya.
Ndagala, D. K. 1992. Territory, Pastoralists, and Livestock: Resource Control
among Kisongo Maasai, Uppsala, Sweden.
Ngugi P. E. N and YVaiganjo, C. 2001. The Effects of existing Land Tenure on Land
use in Kenya Today. Spatial Information for Sustainable Development
International Conference 2-5 October, Nairobi, Kenya.
Niamir, M. 1991. Traditional African Range Management Techniques: Implications
for Rangeland Management. Pastoral Development Network Paper, No. 3 Id,
London.
Noor, A. A., Farah, K. O. and Musimba, N. K. 1999. Socio-Economic Impact of
Small Holder Irrigation Schemes on the Pastoral Nomads o f Garissa District,
North Eastern Kenya. African Pastoral Forum, Working Paper Series 19,
PINEP, Department of Range Management, University of Nairobi, Kenya.
Norusis, J. M. 1991. The SPSS Guide to Data Analysis fo r SPSS/ PC+ (2end Edition).
SPSS Inc., Chicago, USA.
Ntege, N. W., Mutetikka, M. M., Mwangi, W. and Verkuijl, H. 1997. An
Assessment o f Factors Affecting Adoption of Maize Technologies in Iganga
District, Uganda. Addis Ababa Ethiopia: National Agricultural Research
Organisation (NARO) and International Maize and Wheat Improvement
Centre (CIMMYT), Nairobi, Kenya.
Nyariki, D. M. 1998. The Role of Livestock as Capital and in Ex-Ante and Ex-Post
Management of Food Security in Sub-Saharan Africa: The Case of
Agropastoralists in Southeast Kenya. African Pastoral Forum, Working Paper
Series 13, PINEP, Department of Range Management, University o f Nairobi,
Kenya.
75
Nyariki, D. M. and Wiggins, S. 1997. Household Food Insecurity in Sub-Saharan
Africa: Lessons from Kenya. British Food Journal, 99 (7): 249-262.
Nyariki. D. M. and Wiggins, S. 1999. Livestock as Capital and a Tool for Ex- ante and
Ex-post Management o f Food Insecurity in Semi-traditional Agropastoral
Societies: An Example from Southeast Kenya. Journal o f Social Sciences, 3
(3): 117-126.
Nyariki, D. M., Wiggins, S. L. and Imungi, J. K. 2002. Levels and Causes of
Household Food and Nutrition Insecurity in Dryland Kenya. Ecology o f Food
and Nutrition, 41(2): 155-167.
Ogolla, B. D and Mugabe, J. 1996. Land Tenure Systems and Resource Management.
In Land We Trust: Environment, Private Property and Constitutional Change.
Zed Books, London.
Omwale and McLeod, J. C. 1984. Food Consumption Poverty in Rural Jamaica
Ecology o f Food and Nutrition, 14: 297-306.
Ondiege, P. 1996. Land Tenure and Soil Conservation. In Land We Trust: Environment,
Private Property and Constitutional Change. Zed Books, London.
Ongugo P. O. and Mwangi, E. 1996. Common Property Forest Management in Kenya.
Mimeographed Paper Presented at the East African Regional Symposium on
Common Property Resource Management, Kampala Uganda.
Otsuka, K. and Place F. (eds) 2001. Land Tenure and Resource Management. A
Comparative study o f Agrarian Communities in Asia and Africa.
Http/www. Ifpri.org/Pubs/Jhu/Land Tenure Nrm.Htm.
Pindyck, R. S and Rubinfeld, D. L. 1991. Econometric Models and Economic
Forecasts. Mcgraw-Hill, New York.
Place, F., Roth, M. and Hael, P. 1994. Land Tenure Security and Agricultural
Performance in Africa: Overview of Research Methodology. In Searching for
Land Tenure Security in Africa, Migot-Adhola, S and Bruce, W (eds),
Dubuque: Kendall/ Hunt, London.
Porohoryles, S. and Szeiskin, A. 1973. Land Tenure in Africa and its Effects on
Economic Growth. The David Horowitz Institute for Research of Developing
Countries, University o f Jerusalem. Tel Aviv.
Pratt, D. J. and Gwynne, M. D. 1977. Rangeland Management and Ecology of East
76
Africa. Hodder and Stoughtem, London.
Prewitt, K. 1975. Introductory Research Methodology East African Applications.
Institute o f Development Studies, Occasion Paper 10, University of Nairobi,
Kenya.
Raikes, P. L. 1981. Livestock Development in East Africa. Centre fo r Development
Research Publication No.6. Scandinavian Institute for African Studies,
Uppsala, Sweden.
Robinson, L. VV. 1994. Grazing Land Tenure and Livelihood Security: A Study of
Two Clusters o f Villages in the Gambia. M.Sc Thesis, University o f Guelph
Canada.
Salzman, P. C. (ed) 1980. Process of Sedentarization among the Nomads of
Baluchistan. In When Nomads Settle: Process o f Sedentarization as
Adaptation Response. One Hanson Place, Brooklyn, New York.
Sanford, S. 1983. Management of Pastorasl Development in the Third World. John
Wiley and sons, London.
Smucker, T. 2002. Land Tenure Reform and Changes in Land Use and Land
Management in Semi-Arid Tharaka, Kenya. LUCID Working Paper Series 11,
Michigan State University. USA.
Sobania, N. 1979. Background of Mt. Region of Kenya. IPAL Technical Report A-2.
Nairobi, Kenya.
Sobania, N. 1988. Pastoralism Migration and Colonial Policy: A Case study from
Northern Kenya, in Johnson D. H. and Anderson, D. M. (eds). Lester Crook
Academic Publishing, New York
Spencer, P. 1973. Nomads in Alliance: Symbiosis and Growth among the Rendille
and Samburu o f Kenya. Oxford University Press, Oxford.
Sunya, O. 2003. Marketing o f Sheep and Goats and its Role in Food Security among
Pastoral Communities in Marsabit District. M.Sc. Thesis, University of
Nairobi, Kenya.
Swift, J. 1977. Sahelian Pastoralists: Underdevelopment, Desertification and Famine.
American Anthropologists, 6: 457-478.
Swift, J. 1989. Why are Rural People Vulnerable to Famine? IDS Bulletin, 20 (2): 8-
15.
77

Tangka, F. K., Jabbar, M .A. and Shapiro, B. I. 2000. Gender Roles and Child
Nutrition in Livestock Production Systems in Developing Countries: Critical
Review Paper series 27, ILRI, Nairobi, Kenya.
Thompson, D. M., Mwang’ombe, A. W. and Nyariki, D. M. 2000. Mara Ecosystem
Natural Resources Management Planning: Pilot Management Zoning Plan for
Koiyaki-Lamek and Olchoro Oiroua Wildlife Trusts, Narok District Kenya.
Unpublished Consultancy Report.
Tiffen, M., Martimore, M., and Gichuki, F. 1994. More People, Less Erosion.
Environmental Recovery in Kenya. London and Nairobi: John Wiley and
ACTS Press, Nairobi, Kenya.
Timmer, C. P., Falcon, W. P. and Pearson, S. R. 1985. Analysis o f Food
Consumption and Nutrition: In Food Policy Analysis. John Hopkins Press,
Baltimore, U.S.A.
UNEP (United Nations Environmental Program. 1977). Desertification its Causes
and Consequences. Secretariat o f the United Nations Conference on
Desertification, Nairobi, Kenya.
Vedeld, P. 1990. Household Viability and Change among Tugens: A Case Study of
Household Resource Allocation in Semi-arid Baringo District, Kenya.
Victoria, C. G., Vaughan, J. P., Kirkwood, B., Martines, J. C. and Barcellos, L.
B. 1986. Malnutrition and Land Ownership in Southern Brazil. Ecology o f
Food and Nutrition, 18:265-275.
Wandera, J. 1997. Land Use Planning in Kajiado District Guidelines for Community
Level Land Use Planning, ASAL Programme, Kajiado, Kenya.
78

Appendix 1: Questionnaire
D O C U M E N T A T I O N O F T H E E F F E C T S O F L A N D T E N U R E O N L A N D U S E A N D F O O D
S E C U R IT Y I N K A JIA D O D I S T R I C T , K E N Y A
A . L o c a t io n / v i l la g e /c o m m u n ity ______________________________________
Q u e s tio n n a ire n u m b er:________________________________________________
N a m e o f E n u m e ra to r:______________________________________________
H o u se h o ld n u m b e r :______________
D a te :_________________________________ T r ib e : _____________________
S E C T IO N 1: R E S P O N D E N T IN F O R M A T IO N
N a m e :________________________________________________________
1.1 Sex: 0 . M ale 1. F e m a le .......................................................
1.2 A ge o f th e h o u se h o ld h e a d
0 ) L ess th a n 3 0 y e a rs (y o u n g ) 1) M o re th a n 30 y e a rs (o ld )
1.3 Level o f fo rm al e d u c a tio n
0 ) B elow P rim ary 1) a b o v e p rim ary
1.4 H ow lo n g have y o u liv ed in th is a re a ?
0 ) L ess th a n 2 0 y e a rs 1) M ore th a n 2 0 years
1.5 W hat is y o u r h o u s e h o ld ’s m ain so u rc e o f liv e lih o o d ?
0 ) P asto ra l 1) A g ro p asto ra l 2) A g ricu ltu re
S E C T IO N 2 : A N IM A L P R O D U C T IO N
2.1 W hat k in d / ty p e o f an im als do y o u keep?
1) C a ttle 2 ) S h e e p 3 ) G o a ts 4 ) D o n k ey s
2 .2 H ow m any a n im a ls w e re b o m in y o u r h o u seh o ld herd , in the las t s ix m o n th s ’
1) C a ttle 2 ) S h e e p 3 ) G oats 4 ) D o n k ey s
2 .3 H ow m any a n im a ls d ie d in y o u r h o u seh o ld h e rd in the la s t six m o n th s .’ (S p ec ify cause o f th e dea th )
1 ) C a ttle 2 ) S h e e p 3 ) G o a t s 4 ) D onkeys
2 .4 In d ica te the n u m b e r o f anim al so ld and th e av erag e p ric e p e r a n im a l, P P A )
a ) C a ttle ............P P A ............... b ) S h e e p .......... P P A .. . .
c ) G o a ts ................P P A . . . d ) C am e ls ............... P P A .. . .
2 .5 W h at p e rio d o f th e y e a r do y o u no rm ally se ll y o u r an im a ls and w h y ?
2.6 R ank th e p o ss ib le reaso n s fo r se llin g y o u r an im als in o rd e r o f im p o rtan ce .’
79

a ) D ro u g h t
b ) S c h o o l fees
c ) B u y ce rea l fo o d
d ) O th e rs (s p e c ify )
2.7 W h a t a re th e p ro b le m s y o u e n c o u n te r in s e l l in g y o u r an im als?
2 .8 M e n tio n th e to ta l n u m b e r o f an im a ls y o u c u rre n tly o w n ?
a) C a ttle ________________________ b ) S h e e p _______________________
c) G o a ts________________________ d ) o th e rs sp ec ify _______________
2 .9 M ilk p ro d u c tio n
2.9 .1 H ow m an y co w s w e re in m ilk in th e las t s ix m o n th s ...
2 .9 .2 W h at w as the a v e ra g e da ily m ilk y ie ld p e r c o w p e r d a y . . . (In li tre s )
2 .9 .3 H ow m u ch o f th e d a ily p ro d u c tio n w as so ld a n d c o n su m ed ?
C o n s u m e d .. . litre s
s o ld ....................litre s p rice p e r litre ( P P L ) . . .
3 .0 H ave y o u e x p e rie n c e d change in n u m b er o f liv e s to ck o w n e d in th e p a s t o n e y ear.’
Y e s (w h y )
W h y .........................................................................................................................................................................
0 ) N o ................................................................................................................................................................
S E C T IO N 3 : A G R IC U L T U R A L P R O D U C T IO N
H a s y o u r h o u seh o ld p ra c t ic e d any a g ricu ltu ra l a c tiv ity d u rin g the la s t s ix m on ths.’
I f N o , w h y ? 1) D ro u g h t 2) seed u n a v a ila b ility 3) o th e r re a s o n s (sp ec ify )
3 .2 In d ica te m ain c e re a l c ro p s cu ltiv a ted
1) M aize 2) O th e rs
3 .3 A c reag e u n d er c u lt iv a t io n .. .
3 .4 N o o f b ag s h a rv e s te d ....................................
3 .5 In d ica te m ain le g u m e s cu ltiv a ted
1) B ean s 2 ) o thers
3 .6 A c reag e u n d er c u lt iv a t io n .............. N o o f b a g s h a rv e s te d .....................................
3 .7 In d ica te m ain fru it c ro p s cu ltiv a ted
3 .8 F or c ro p s so ld , m e n tio n the to ta l am o u n t so ld d u rin g th e last s ix m o n th s and th e p rice p e r un it.
C ro p s A m oun t s o l d ........ ( in K g) P rice p e r u n i t . . .
3 .9 H av e any p e s ts / d isea se s a ffec ted an y c ro p s u n d er c u ltiv a tio n o r in s to rag e d u rin g th e last six
m o n th s? l ) Y e s 0 )N o
D etails
80

S E C T IO N 4 : A N IM A L - L A N D I N T E R A C T I O N S
4.1 W h e re d o y o u g raze y o u r an im als :
1) In th e d ry s e a s o n s .................................... 2 ) In th e w et sea so n s
w h y ? .............................................................
.......................................................................... W h y ? ..................................
4 2 H o w d o y o u re la te th e g ra z in g p a tte rn s o f d if fe re n t an im al/ c la s s to fo ra g e and w a te r a v a ilab ility ?
4 .3 W h a t is y o u r g ra z in g / to p o lo g y c a le n d a r sh o w in g g raz in g m o v e m e n ts a c ro ss the y ea r?
5 .0 L A N D T E N U R E
5 .0 W h a t is th e land te n u re system p ra c tic e d b y y o u r h o u seh o ld ?
0 ) In d iv id u a l
1) C o m m u n a l
2 ) C o rp o ra te / c o m p a n y
3) O th e rs (sp ec ify )
5.1 W h at w a s th e a v e ra g e lan d size fo r y o u r h o u se h o ld 20 y e a rs ago? ( F o r h o u seh o ld h ead s w h o are
o v e r 4 0 y e a rs )
5.2 W h a t is th e cu rren t a v e ra g e land s iz e for y o u r h o u seh o ld ?
In c a se o f ch an g e in la n d s ize , w hat a rc likely c a u s e s o f ch an g e in the la n d sizes?
5 .3 H ow h a s change in lan d size a f fe c te d the f re q u e n c y o f m o b ility o f liv e s to ck ?
5 .4 H ow d o you c u rre n tly co p e w ith ch an g es in lan d size in m an ag in g
l iv e s to c k ? .............................................................................................................................
D o you h av e any in s ti tu tio n a l lin k ag es reg u la tin g th e use o f y o u r lan d ?
5 .6 If y e s . w hat is th e ro le o f each in s titu tio n ?
81
6 .0 O T H E R E C O N O M I C A C T I V I T I E S
6.1 L a b o u r
6.1.1 D id any m e m b e r o f y o u r fam ily lo o k fo r c a s u a l lab o u r d u rin g the la s t s ix m on ths.’ I ) Y es, h o w
m a n y ? _____________0 ) N o ______________
6 .1 .2 H ow m a n y m e m b e rs o f y o u r fam ily w ere a c tu a lly en g ag ed in casu a l la b o u r in th e la s t six m o n th s .’
6.1 .3 W hat w e re th e d a i ly la b o u r ra te s o b ta in e d ? ( in K s h s )___________
6.2 C h a r c o a l
10.1 D id y o u r h o u se h o ld e n g a g e in c h a rc o a l p ro d u c tio n du ring th e last s ix m o n th s ’
1) Y e s 0 ) N o
10.2 I f yes, h o w m an y b a g s w e re so ld a n d at w h a t p r ic e p e r b a g ? (In K s h s ) _____________
6 J R em ittances
6.3.1 D id y o u r h o u se h o ld re c e iv e any p \ re m it ta n c e s o r g ifts fro m re la tiv e s , friends n o t c u rre n tly liv in g
in th e h o u se h o ld ?
I) Y es , w h a t w a s its v a lu e in K s h s _____________________
0) N o _____________
S E C T IO N 6 : F O O D P U R C H A S E S
7.1 C e rea l/ leg u m e p u rc h a s e s
7 .2 D id y o u r h o u se h o ld b u y c e re a ls / leg u m es in th e last six m o n th s .’ Y e s / N o
7.3 W hat w e re the q u a n ti ty p u rc h a se d a n d the p r ic e p e r k ilo g ram (P P K G ).’
W h o le M aize : 1 Y es 0. N o Q ty P P K G
P osho ( lo c a lly m illed ): 1 Y es 0. N o Q ty P P K G
B eans: 1 Y es 0. N o Q ty P P K G
R ice: 1 Y es 0. N o Q ty P P K G
S u g ar 1 Y es 0. N o Q ty P P K G
O th ers (s p e c ify ) 1 Y es 0. N o Q ty P P K G
7.4 O th e r s ig n if ic a n t in c o m e g e n e r a t in g a c t iv i t ie s (sp ec ify )
7.4.1 D id y o u r h o u se h o ld g e t in v o lv e d in a n y o th e r in co m e g e n e ra tin g ac tiv itie s a p a rt fro m livestock
p ro d u c tio n in the las t s ix m on th s?
1) Y es 0 ) N o
7.4 .2 W h a t are th e se o th e r e c o n o m ic ac tiv itie s?
7.4.3 H o w d o you s p e n d in co m e fro m these e c o n o m ic ac tiv ities .’
1) S choo l fees 2 ) F o o d p u rch ases 3 ) H e a lth ca re 4 ) B an k in g
7.4.5 H av e you e v e r o b ta in e d c red it from an y o f th e fo llo w in g in s titu tio n in the la s t six m o n th s?
1) G o v ern m en t
2 ) R e la tiv es and F r ie n d s
3 ) N on- g o v ern m en ta l o rg an isa tio n s
4 ) O th ers specify
82

7 .4 .6 W h a t fo rm w a s th e c r e d i t? 1) K in d 2 ) C ash
7 .4 .7 E s tim a te th e v a lu e o f th e c re d it in K s h s ____________________
8 .0 D E C IS I O N -M A K I N G
8.1 W h o p a r t ic ip a te in d e c is io n -m a k in g w ith re g a rd to th e use a n d m a n a g e m e n t o f lan d re so u rc e s?
9 .0 . W E L F A R E
9.1 R e lie f
9 .2 D id y o u r h o u se h o ld r e c e iv e any a id d u rin g th e last six m o n th s? 1. Y e s 0. N o
(IF N o g o to q u e s t io n s l7 .0 )
9 .3 M e n tio n th e ty p e o f a id rece iv ed in th e last s ix m onths
(R e l ie f fo o d / fo o d fo r w o rk / c a sh fo r w o rk /o th e rs )
9 .4 .M e n tio n th e q u a n tity o f fo o d a id y o u r ho u se h o ld rece ived in k ilo g ra m d u rin g th e las t six m o n th s
N o . o f K gs r e l ie f fo o d (c e re a ls ) p e r h o u seh o ld :
N o o f K g s fro m F F W s (c e re a ls ) p e r h o u se h o ld ________________________________________ _
9 .5 D id a n y o f y o u r c h ild re n rece iv e U N IM IX a n d / o r Soya d u rin g th e la s t s ix m on th s? 1. Y es 0 . N o
9 .6 M e n tio n the n u m b e r o f k ilo g ra m s o f U N IM IX an d / o r S o y a y o u r c h ild re n rece iv ed d u rin g th e last
6 m o n th s__________________________________________
9 .7 N u m b e r o f k ilo g ra m s o f U N IM IX a n d / o r S o y a rece iv ed p e r ch ild __________________
1 0 .0 N U T R IT IO N A L S T A T U S
10.1 M easu re the M id U p p e r A rm C irc u m fe re n c e (M U A C ) o f th e c h ild re n o ld e r than o n e y e a r but
u n d e r five y e a rs o f a g e (1 2 -1 9 m o n th s ) . In c lu d e qualify ing ch ild ren in th e sam ple h o u seh o ld a s w ell as
th e c h ild re n in the n e ig h b o u r in g h o u se h o ld (s). M easu re a m in im u m o f f iv e ch ild ren .
N am e o f th e ch ild A g e - in m o n th s -M U A C in m illim etres ( I f im p o ss ib le to get accu ra te a g e include
c h ild re n w h o a re ab le to w a lk bu t s h o r te r ten cen tim etres) .
N am e o f th e ch ild M U A C S
1
2
3
4
5
18.0 F o o d c o n s u m p tio n
18.1 w h a t am oun t o f m aize f lo u r o r p o sh o docs y o u r h o u se h o ld co n su m e p e r m e a l? (in
k ilog ram )_______________________K g s.
83