Embed Size (px)
Citation preview
Journal of Environmental Protection, 2017, 8, 1424-1434 http://www.scirp.org/journal/jep
ISSN Online: 2152-2219 ISSN Print: 2152-2197
DOI: 10.4236/jep.2017.811086 Oct. 31, 2017 1424 Journal of Environmental Protection
Effects of Co-Existing Ions on the Phosphorus Potassium Ratio of the Precipitate Formed in the Potassium Phosphate Crystallization Process
Hiroyuki Harada1*, Yumi Katayama1, Asmak Afriliana2, Minori Inoue1, Ryota Teranaka1, Yoshiharu Mitoma1
1Faculty of Environmental Science, Prefectural University of Hiroshima, Hiroshima, Japan 2Faculty of Agricultural Technology, Univerity of Jember, Jember, Indonesia
Abstract Livestock wastewater is mainly treated with activated sludge, but ions such as phosphorus, potassium, ammonium, nitrate and sulfate remain in the efflu-ent. In this study, the effects of residual ions on phosphorus recovery using the magnesium potassium phosphate crystallization method were investigated when magnesium was added to increase the pH. If co-existing ions affect the products, the phosphorus to potassium molar ratio (K/P ratio) of the precipi-tate will deviate from being equimolar. Artificial wastewater test solutions containing 5.6 - 20.3 mM ammonium, 25.6 mM potassium, 6.5 mM phos-phorus, 0 - 7.35 mM nitrate, and 0 - 3.06 mM sulfate were used. First, the op-timum operating pH and amount of magnesium added to give a high phos-phorus removal rate and recovery rate were determined. The experimental setup was a 10 L aerated and stirred reactor, and a 5 L settling tank. The K/P ratio in precipitate was approximately 1 using the optimum conditions. Con-tinuous 2 h treatment allowed a white precipitate containing about 30 g of needle-like crystals to be obtained. Next, the effects of varying the ammo-nium, nitrate, and sulfate ion concentrations in the artificial effluent were in-vestigated. Ammonium and sulfate ion concentrations of 8 mM or more and 3 mM or more, respectively, caused the K/P ratio to decrease to about 0.7 and 0.5, respectively. Varying the nitrate concentration did not affect the K/P ra-tio, even at a nitrate concentration of 7.35 mM.
Keywords Magnesium Potassium Phosphate, Ammonium, Sulfate, Nitrate, K/P Ratio,
How to cite this paper: Harada, H., Ka-tayama, Y., Afriliana, A., Inoue, M., Teranaka, R. and Mitoma, Y. (2017) Effects of Co-Existing Ions on the Phosphorus Potas-sium Ratio of the Precipitate Formed in the Potassium Phosphate Crystallization Process. Journal of Environmental Protection, 8, 1424-1434. https://doi.org/10.4236/jep.2017.811086 Received: September 18, 2017 Accepted: October 28, 2017 Published: October 31, 2017 Copyright © 2017 by authors and Scientific Research Publishing Inc. This work is licensed under the Creative Commons Attribution International License (CC BY 4.0). http://creativecommons.org/licenses/by/4.0/
Open Access
H. Harada et al.
DOI: 10.4236/jep.2017.811086 1425 Journal of Environmental Protection
pH, hComponent, Formatting, Style, Styling
1. Introduction
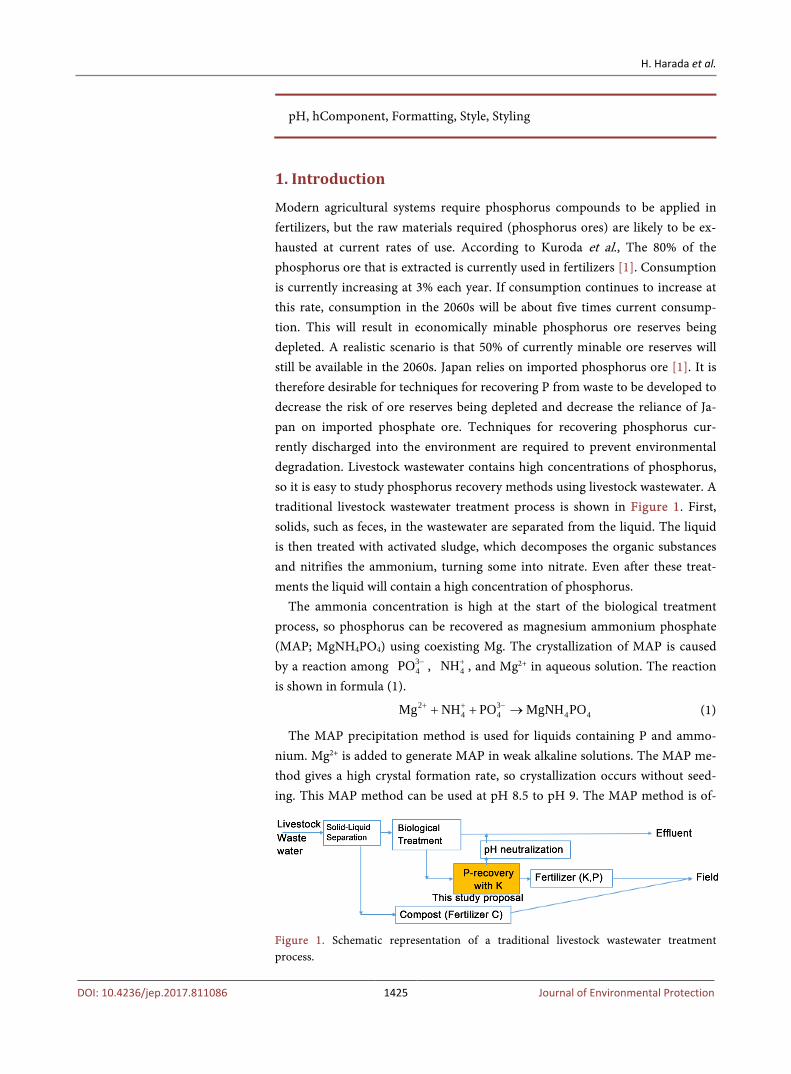
Modern agricultural systems require phosphorus compounds to be applied in fertilizers, but the raw materials required (phosphorus ores) are likely to be ex-hausted at current rates of use. According to Kuroda et al., The 80% of the phosphorus ore that is extracted is currently used in fertilizers [1]. Consumption is currently increasing at 3% each year. If consumption continues to increase at this rate, consumption in the 2060s will be about five times current consump-tion. This will result in economically minable phosphorus ore reserves being depleted. A realistic scenario is that 50% of currently minable ore reserves will still be available in the 2060s. Japan relies on imported phosphorus ore [1]. It is therefore desirable for techniques for recovering P from waste to be developed to decrease the risk of ore reserves being depleted and decrease the reliance of Ja-pan on imported phosphate ore. Techniques for recovering phosphorus cur-rently discharged into the environment are required to prevent environmental degradation. Livestock wastewater contains high concentrations of phosphorus, so it is easy to study phosphorus recovery methods using livestock wastewater. A traditional livestock wastewater treatment process is shown in Figure 1. First, solids, such as feces, in the wastewater are separated from the liquid. The liquid is then treated with activated sludge, which decomposes the organic substances and nitrifies the ammonium, turning some into nitrate. Even after these treat-ments the liquid will contain a high concentration of phosphorus.
The ammonia concentration is high at the start of the biological treatment process, so phosphorus can be recovered as magnesium ammonium phosphate (MAP; MgNH4PO4) using coexisting Mg. The crystallization of MAP is caused by a reaction among 3
4PO − , 4NH+ , and Mg2+ in aqueous solution. The reaction is shown in formula (1).
2 34 4 4 4Mg NH PO MgNH PO+ + −+ + → (1)
The MAP precipitation method is used for liquids containing P and ammo-nium. Mg2+ is added to generate MAP in weak alkaline solutions. The MAP me-thod gives a high crystal formation rate, so crystallization occurs without seed-ing. This MAP method can be used at pH 8.5 to pH 9. The MAP method is of-
Figure 1. Schematic representation of a traditional livestock wastewater treatment process.
H. Harada et al.
DOI: 10.4236/jep.2017.811086 1426 Journal of Environmental Protection
ten used for solutions containing relatively high P or ammonium concentra-tions, such as livestock wastewater and side stream wastewater produced during activated sludge treatments [2]-[7].
The ammonium concentration will decrease and MAP treatment will be dif-ficult when a long treatment time is used and the nitrification efficiency is high. In this study, we investigated the recovery of phosphorus as magnesium potas-sium phosphate (MPP) through the reaction shown in formula (2) using a high potassium concentration.
2 34 4Mg K PO MgKPO+ + −+ + → (2)
The MPP crystallization method has been used for wastewater with a high phosphorous concentration (30 mM or more, e.g., in urine) and a high potas-sium concentration [8]. Wastewater treated using activated sludge contains a low ammonium concentration, so it is difficult to use the MAP method to re-move phosphorous from treated water. However, the relatively high K concen-trations in wastewater treated using activated sludge can be appropriate for MPP treatment. The MPP treatment method has been used to remove relatively low phosphorus concentrations from wastewater treated using activated sludge in very few studies. The optimum pH for MPP treatment depends on the target phosphorous concentration because hydroxy ions are involved in the solubilities of the products. The optimum pH for treating wastewater containing 30 mM P in synthetic urine to give an equimolar precipitate of P, Mg, and K is pH 8 [8] [9], and the optimum pH for treating synthetic wastewater containing 7.6 mM P is pH 10 [10]. In the study described here, a P concentration of 6.5 mM was used to approximate the typical concentration in livestock wastewater, and the effects of the pH, Mg dosage, and coexisting substances on the formation of MPP were investigated using an experimental system that consisted of a reactor and a set-tling tank. The synthetic wastewater was designed to simulate effluent from pig-gery wastewater treated with activated sludge [11].
2. Methods 2.1. Apparatus and Standard Experimental Conditions
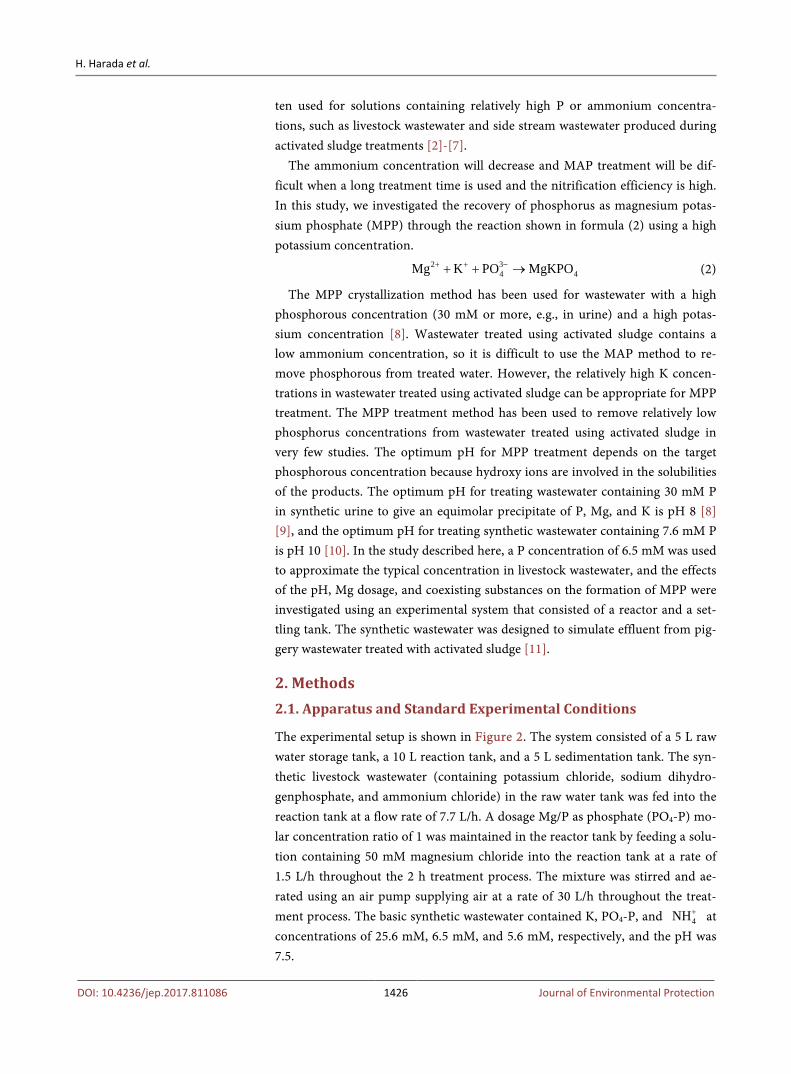
The experimental setup is shown in Figure 2. The system consisted of a 5 L raw water storage tank, a 10 L reaction tank, and a 5 L sedimentation tank. The syn-thetic livestock wastewater (containing potassium chloride, sodium dihydro-genphosphate, and ammonium chloride) in the raw water tank was fed into the reaction tank at a flow rate of 7.7 L/h. A dosage Mg/P as phosphate (PO4-P) mo-lar concentration ratio of 1 was maintained in the reactor tank by feeding a solu-tion containing 50 mM magnesium chloride into the reaction tank at a rate of 1.5 L/h throughout the 2 h treatment process. The mixture was stirred and ae-rated using an air pump supplying air at a rate of 30 L/h throughout the treat-ment process. The basic synthetic wastewater contained K, PO4-P, and 4NH+ at concentrations of 25.6 mM, 6.5 mM, and 5.6 mM, respectively, and the pH was 7.5.
H. Harada et al.
DOI: 10.4236/jep.2017.811086 1427 Journal of Environmental Protection
Figure 2. Experimental setup.
2.2. Effects of Varying the pH and Mg Dosage on the Formation of MPP
The pH of the solution in the reactor was varied between pH 8 and pH 12 using a pH controller. The dosage Mg/P ratio was changed from 1 to 2 by changing the rate at which magnesium chloride solution was added.
2.3. Effects of Coexisting Substances
Tests were performed using ammonium concentrations of 8.36 mM, 11.4 mM, and 22.3 mM at the standard conditions. Tests were also performed at nitrate concentrations of 0 mM, 4.02 mM, and 8.04 mM, and at sulfate concentrations of 1.02 mM, 2.04 mM, and 3.06 mM.
2.4. Precipitate
The white precipitate that formed in the reaction tank was moved to the settling tank in the overflowing solution and settled in the cone of the sedimentation tank. After a reaction, the mixture was allowed to stand for a specified time, then the reaction solution in the settling tank was passed through a filter. The white precipitate adhering to the filter paper was dried for 24 h in flowing air at 60˚C. The filtrate was passed through a 0.45 μm membrane filter.
2.5. Analysis
The Magnesium concentrations in the samples were determined using an AA- 6300 atomic absorption spectrometer (Shimadzu, Kyoto, Japan). The potassium and sodium concentrations were measured by flame photometry using the same atomic absorption spectrometer. The phosphate and ammonium concentrations were measured using the molybdenum blue and ascorbic acid method and using
H. Harada et al.
DOI: 10.4236/jep.2017.811086 1428 Journal of Environmental Protection
the indophenol method, respectively, and a V-530 ultraviolet-visible spectro-photometer (JASCO, Halifax, Canada) [12]. The precipitates were inspected us-ing an ECLIPSE E-600 optical microscope (Nikon, Tokyo, Japan) and a JSM- 6510 A scanning electron microscope (JEOL, Tokyo, Japan). The crystals were analyzed using energy dispersive X-ray spectrometry (EDS) using an EDX-LE instrument (Shimadzu, Kyoto, Japan).
3. Results and Discussion 3.1. Optimum pH
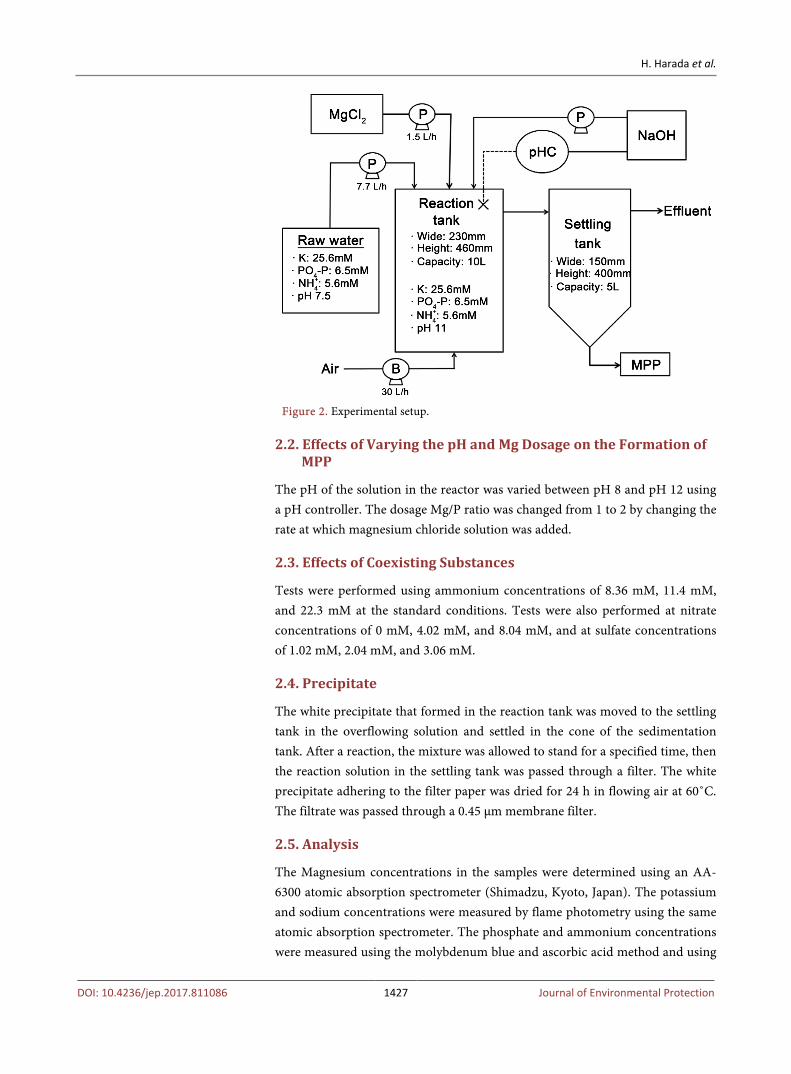
The MPP crystallization method can be used as a post-treatment for effluent treated with activated sludge, so we assessed the effects of the presence of nitrate, ammonium, and sulfate ions on the MPP production process. Table 1 and Fig-ure 3 shows the Effects of pH control in component of precipitate, and Electron microscopy images of crystals produced. These components Mg, P, K of the crystals were almost equimolar at pH 11. Needle-like crystals peculiar to MAP and MPP were found at pH 9 or higher, but at pH 12 the components of the crystals stopped being equimolar because too much sodium hydroxide was present.
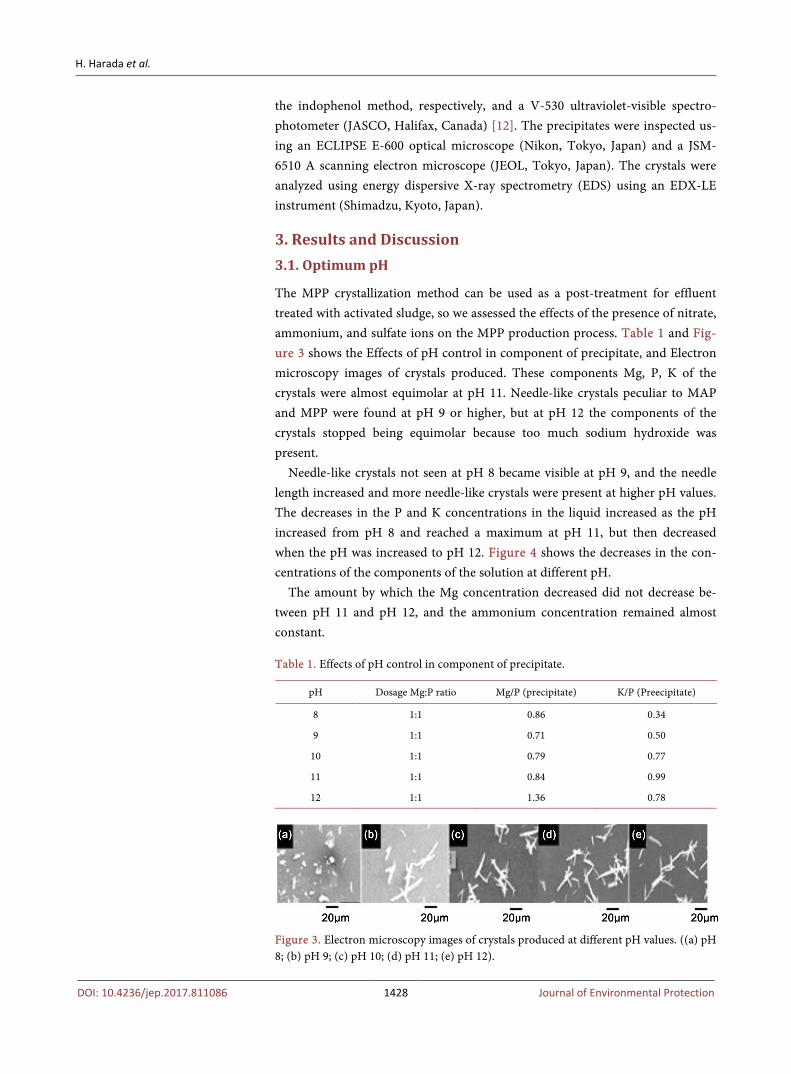
Needle-like crystals not seen at pH 8 became visible at pH 9, and the needle length increased and more needle-like crystals were present at higher pH values. The decreases in the P and K concentrations in the liquid increased as the pH increased from pH 8 and reached a maximum at pH 11, but then decreased when the pH was increased to pH 12. Figure 4 shows the decreases in the con-centrations of the components of the solution at different pH.
The amount by which the Mg concentration decreased did not decrease be-tween pH 11 and pH 12, and the ammonium concentration remained almost constant.
Table 1. Effects of pH control in component of precipitate.
pH Dosage Mg:P ratio Mg/P (precipitate) K/P (Preecipitate)
8 1:1 0.86 0.34
9 1:1 0.71 0.50
10 1:1 0.79 0.77
11 1:1 0.84 0.99
12 1:1 1.36 0.78
Figure 3. Electron microscopy images of crystals produced at different pH values. ((a) pH 8; (b) pH 9; (c) pH 10; (d) pH 11; (e) pH 12).
H. Harada et al.
DOI: 10.4236/jep.2017.811086 1429 Journal of Environmental Protection
Figure 4. Decreases in the concentrations of the components of the solution at different pH.
Table 2. Phosphorus removal ratios and recovery ratios at different pH values.
pH 8 9 10 11 12
Removal rate (%) 74.8 82.0 92.5 98.8 55.1
Recovery rate (%) 93.2 96.1 97.7 95.5 99.7
At pH 11, the decreases in the phosphorous potassium, and magnesium Con-
centrations in the liquid were almost equimolar. The molar ratios of the precipi-tates, determined by EDS, were 0.84 and 0.95, and the ammonium and sodium contents were 4% and 8%, respectively. It therefore seems that the contents of the components of the precipitate reflected the decreases in the concentrations of the components of the solution. We will examine this using the removal rate and recovery rate using the equations below [13].
44
4
PO -P in white precipitateRecovery rate of PO -P
PO -P decrement= (3)
4 initial 4 equilibrium4
4 initial
PO -P PO -PRecovery rate of PO -P
PO -P−
= (4)
The results are shown in Table 2. The removal rate and recovery rate at pH 10 and pH 11 were 90% or higher. Finer crystals were produced at pH 11 than at pH 10, and this may have caused the recovery rates at pH 10 and pH 11 to be different. However, the difference was slight, so we conducted further tests at pH 11.
3.2. Optimum Dosage Magnesium
The effects of the magnesium dosage on the three components are shown in Ta-ble 3. The magnesium content of the precipitate was higher at a dosage Mg/P ra-tio of 1.3 than at lower ratios because magnesium hydroxide was precipitated. It appeared that the optimum magnesium concentration was the same as the phosphorus concentration.
H. Harada et al.
DOI: 10.4236/jep.2017.811086 1430 Journal of Environmental Protection
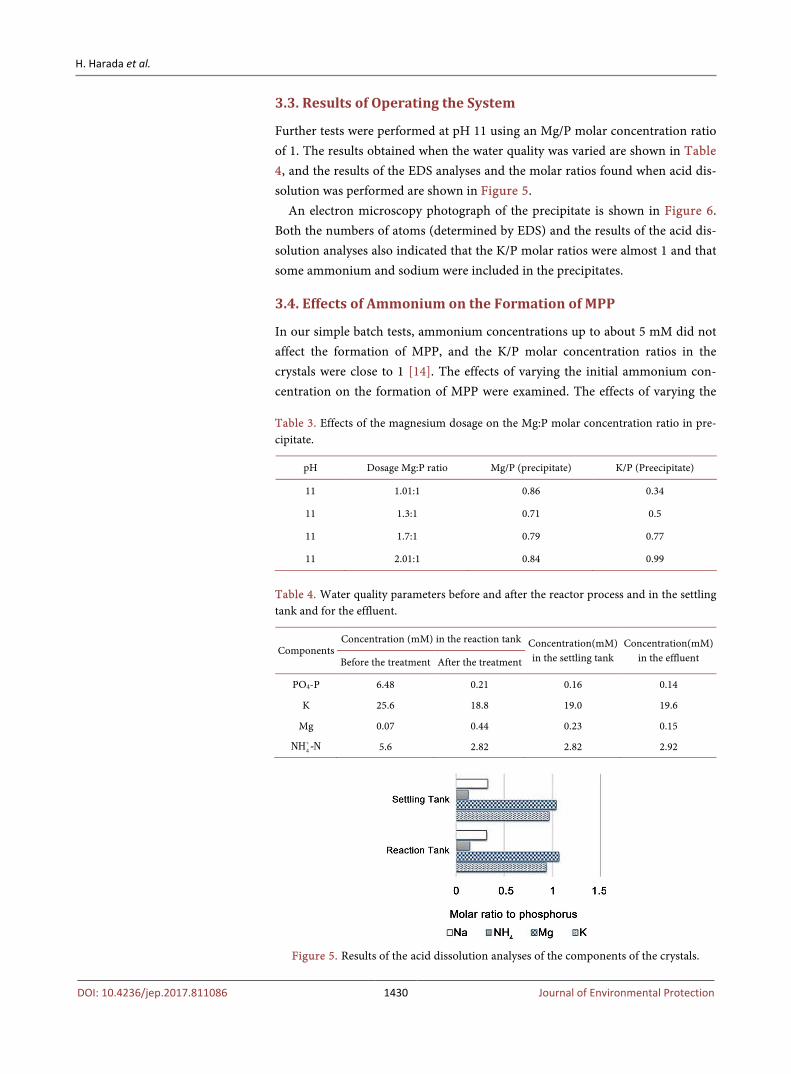
3.3. Results of Operating the System
Further tests were performed at pH 11 using an Mg/P molar concentration ratio of 1. The results obtained when the water quality was varied are shown in Table 4, and the results of the EDS analyses and the molar ratios found when acid dis-solution was performed are shown in Figure 5.
An electron microscopy photograph of the precipitate is shown in Figure 6. Both the numbers of atoms (determined by EDS) and the results of the acid dis-solution analyses also indicated that the K/P molar ratios were almost 1 and that some ammonium and sodium were included in the precipitates.
3.4. Effects of Ammonium on the Formation of MPP
In our simple batch tests, ammonium concentrations up to about 5 mM did not affect the formation of MPP, and the K/P molar concentration ratios in the crystals were close to 1 [14]. The effects of varying the initial ammonium con-centration on the formation of MPP were examined. The effects of varying the
Table 3. Effects of the magnesium dosage on the Mg:P molar concentration ratio in pre-cipitate.
pH Dosage Mg:P ratio Mg/P (precipitate) K/P (Preecipitate)
11 1.01:1 0.86 0.34
11 1.3:1 0.71 0.5
11 1.7:1 0.79 0.77
11 2.01:1 0.84 0.99
Table 4. Water quality parameters before and after the reactor process and in the settling tank and for the effluent.
Components Concentration (mM) in the reaction tank Concentration(mM)
in the settling tank Concentration(mM)
in the effluent Before the treatment After the treatment
PO4-P 6.48 0.21 0.16 0.14
K 25.6 18.8 19.0 19.6
Mg 0.07 0.44 0.23 0.15
4NH -N+ 5.6 2.82 2.82 2.92
Figure 5. Results of the acid dissolution analyses of the components of the crystals.
H. Harada et al.
DOI: 10.4236/jep.2017.811086 1431 Journal of Environmental Protection
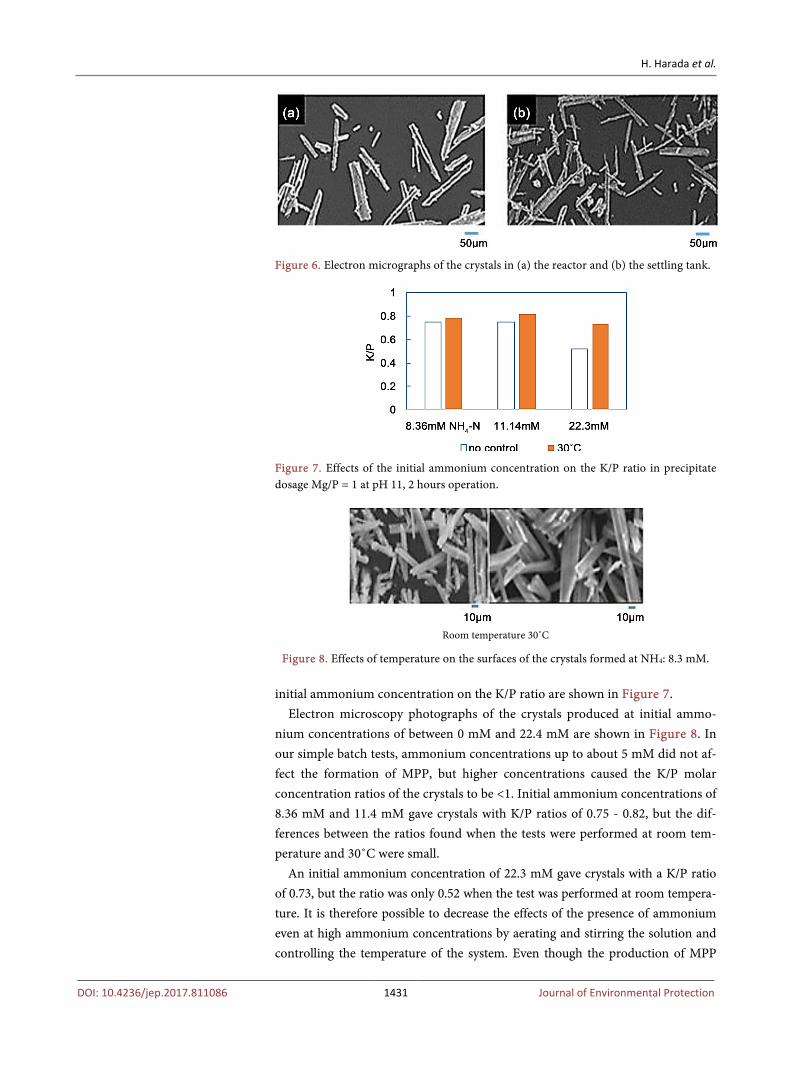
Figure 6. Electron micrographs of the crystals in (a) the reactor and (b) the settling tank.
Figure 7. Effects of the initial ammonium concentration on the K/P ratio in precipitate dosage Mg/P = 1 at pH 11, 2 hours operation.
Room temperature 30˚C
Figure 8. Effects of temperature on the surfaces of the crystals formed at NH4: 8.3 mM.
initial ammonium concentration on the K/P ratio are shown in Figure 7. Electron microscopy photographs of the crystals produced at initial ammo-
nium concentrations of between 0 mM and 22.4 mM are shown in Figure 8. In our simple batch tests, ammonium concentrations up to about 5 mM did not af-fect the formation of MPP, but higher concentrations caused the K/P molar concentration ratios of the crystals to be <1. Initial ammonium concentrations of 8.36 mM and 11.4 mM gave crystals with K/P ratios of 0.75 - 0.82, but the dif-ferences between the ratios found when the tests were performed at room tem-perature and 30˚C were small.
An initial ammonium concentration of 22.3 mM gave crystals with a K/P ratio of 0.73, but the ratio was only 0.52 when the test was performed at room tempera-ture. It is therefore possible to decrease the effects of the presence of ammonium even at high ammonium concentrations by aerating and stirring the solution and controlling the temperature of the system. Even though the production of MPP
H. Harada et al.
DOI: 10.4236/jep.2017.811086 1432 Journal of Environmental Protection
was affected by the higher ammonium concentrations, needle-like crystals were found in the precipitate formed at each ammonium concentration that was tested.
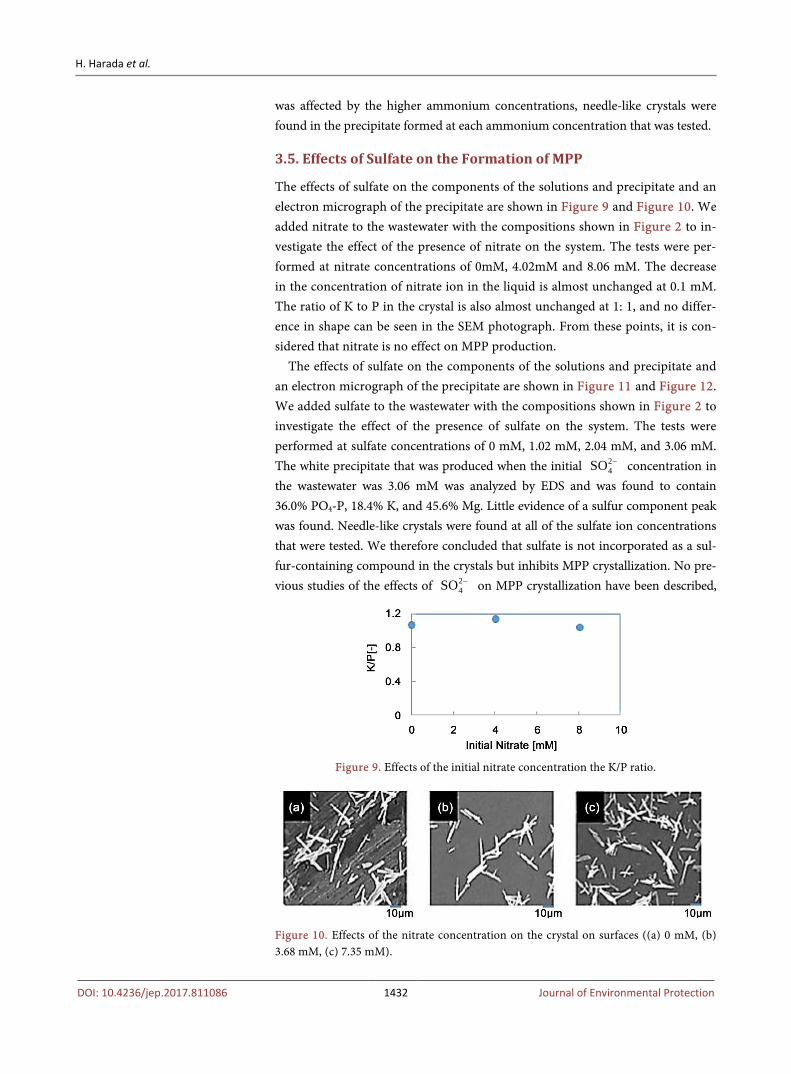
3.5. Effects of Sulfate on the Formation of MPP
The effects of sulfate on the components of the solutions and precipitate and an electron micrograph of the precipitate are shown in Figure 9 and Figure 10. We added nitrate to the wastewater with the compositions shown in Figure 2 to in-vestigate the effect of the presence of nitrate on the system. The tests were per-formed at nitrate concentrations of 0mM, 4.02mM and 8.06 mM. The decrease in the concentration of nitrate ion in the liquid is almost unchanged at 0.1 mM. The ratio of K to P in the crystal is also almost unchanged at 1: 1, and no differ-ence in shape can be seen in the SEM photograph. From these points, it is con-sidered that nitrate is no effect on MPP production.
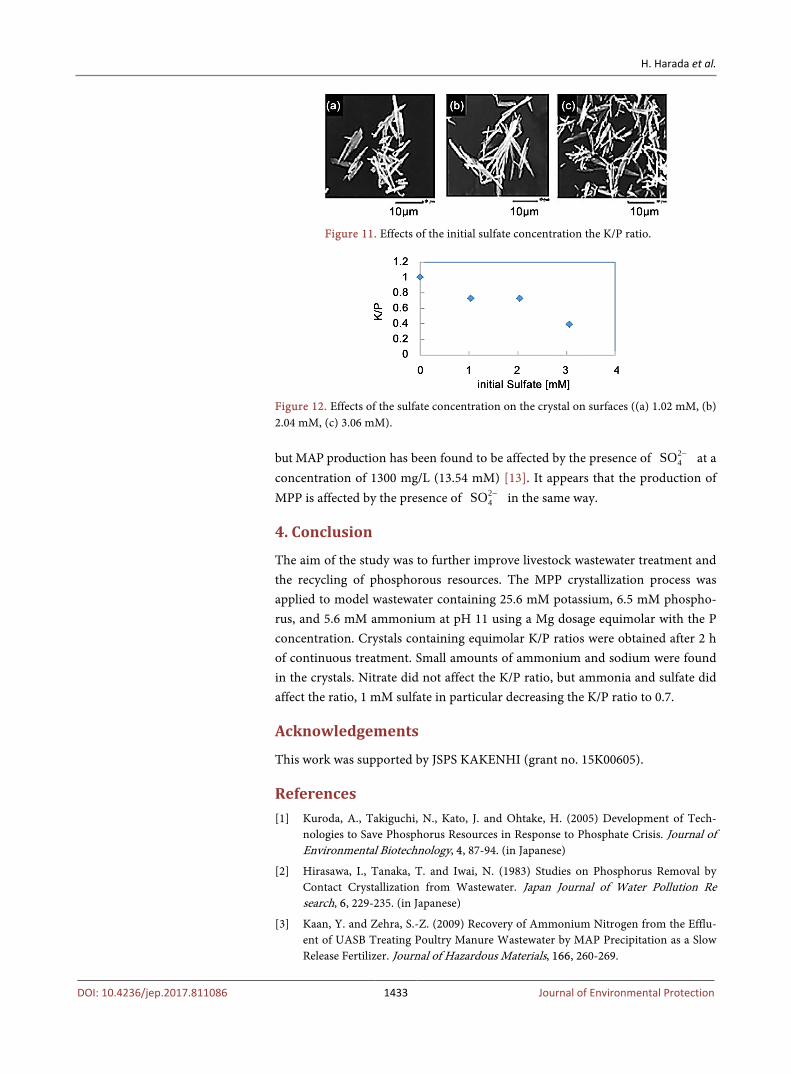
The effects of sulfate on the components of the solutions and precipitate and an electron micrograph of the precipitate are shown in Figure 11 and Figure 12. We added sulfate to the wastewater with the compositions shown in Figure 2 to investigate the effect of the presence of sulfate on the system. The tests were performed at sulfate concentrations of 0 mM, 1.02 mM, 2.04 mM, and 3.06 mM. The white precipitate that was produced when the initial 2
4SO − concentration in the wastewater was 3.06 mM was analyzed by EDS and was found to contain 36.0% PO4-P, 18.4% K, and 45.6% Mg. Little evidence of a sulfur component peak was found. Needle-like crystals were found at all of the sulfate ion concentrations that were tested. We therefore concluded that sulfate is not incorporated as a sul-fur-containing compound in the crystals but inhibits MPP crystallization. No pre-vious studies of the effects of 2
4SO − on MPP crystallization have been described,
Figure 9. Effects of the initial nitrate concentration the K/P ratio.
Figure 10. Effects of the nitrate concentration on the crystal on surfaces ((a) 0 mM, (b) 3.68 mM, (c) 7.35 mM).
H. Harada et al.
DOI: 10.4236/jep.2017.811086 1433 Journal of Environmental Protection
Figure 11. Effects of the initial sulfate concentration the K/P ratio.
Figure 12. Effects of the sulfate concentration on the crystal on surfaces ((a) 1.02 mM, (b) 2.04 mM, (c) 3.06 mM).
but MAP production has been found to be affected by the presence of 2
4SO − at a concentration of 1300 mg/L (13.54 mM) [13]. It appears that the production of MPP is affected by the presence of 2
4SO − in the same way.
4. Conclusion
The aim of the study was to further improve livestock wastewater treatment and the recycling of phosphorous resources. The MPP crystallization process was applied to model wastewater containing 25.6 mM potassium, 6.5 mM phospho-rus, and 5.6 mM ammonium at pH 11 using a Mg dosage equimolar with the P concentration. Crystals containing equimolar K/P ratios were obtained after 2 h of continuous treatment. Small amounts of ammonium and sodium were found in the crystals. Nitrate did not affect the K/P ratio, but ammonia and sulfate did affect the ratio, 1 mM sulfate in particular decreasing the K/P ratio to 0.7.
Acknowledgements
This work was supported by JSPS KAKENHI (grant no. 15K00605).
References [1] Kuroda, A., Takiguchi, N., Kato, J. and Ohtake, H. (2005) Development of Tech-
nologies to Save Phosphorus Resources in Response to Phosphate Crisis. Journal of Environmental Biotechnology, 4, 87-94. (in Japanese)
[2] Hirasawa, I., Tanaka, T. and Iwai, N. (1983) Studies on Phosphorus Removal by Contact Crystallization from Wastewater. Japan Journal of Water Pollution Re search, 6, 229-235. (in Japanese)
[3] Kaan, Y. and Zehra, S.-Z. (2009) Recovery of Ammonium Nitrogen from the Efflu-ent of UASB Treating Poultry Manure Wastewater by MAP Precipitation as a Slow Release Fertilizer. Journal of Hazardous Materials, 166, 260-269.
H. Harada et al.
DOI: 10.4236/jep.2017.811086 1434 Journal of Environmental Protection
https://doi.org/10.1016/j.jhazmat.2008.11.025
[4] Sibel, U.-D. and Maazuza, O. (2009) Removal of Ammonium and Phosphate from the Supernatant of Anaerobically Digested Waste Activated Sludge by Chemical Precipitation. Bioresource Technology, 100, 3236-3244. https://doi.org/10.1016/j.biortech.2009.02.030
[5] Song, Y-H., Qiu, G.-L., Yuan, P., Cui, X.-Y., Peng, J.-F., Zeng, P., et al. (2011) Nu-trients Removal and Recovery from Anaerobically Digested Swine Wastewater by Struvite Crystallization without Chemical Additions. Journal of Hazardous Mate-rials, 190, 140-149. https://doi.org/10.1016/j.jhazmat.2011.03.015
[6] Suzuki, K., Tanaka, Y., Kuroda, K., Hanajima, D. and Fukumoto, Y. (2005) Recov ery of Phosphorus from Swine Wastewater through Crystallization. Bioresource Technology, 96, 1544-1550. https://doi.org/10.1016/j.biortech.2004.12.017
[7] Suzuki, K., Tanaka, Y., Kuroda, K., Hanajima, D., Fukumoto, Y., Yasuda, T. and Waki, M. (2007) Removal and Recovery of Phosphorus from Swine Wastewater by Demonstration Crystallization Reactor and Struvite Accumulation Device. Biore-source Technology, 98, 1573-1578. https://doi.org/10.1016/j.biortech.2006.06.008
[8] Xu, K., Li, J., Zheng, M., Zhang, C., Xie, T. and Wang, C. (2015) The Precipitation of Magnesium Potassium Phosphate Hexahydrate for P and K Recovery from Syn-thetic Urine. Water Research, 80, 71-79. https://doi.org/10.1016/j.watres.2015.05.026
[9] Xu, K., Wang, K., Wang, X. and Qian, Y. (2012) Laboratory Experiments on Simul-taneous Removal of K and P from Synthetic and Real Urine for Nutrient Recycle by Crystallization of Magnesium-Potassium-Phosphate-Hexahydrate in a Draft Tube and Baffle Reactor. Chemosphere, 88, 219-223. https://doi.org/10.1016/j.chemosphere.2012.02.061
[10] Ymaguchi, S., Ohura, S., Harada, H., Akagi, K., Mitoma, Y., Kawakita, H. and Bis-was, B.K. (2013) Simultaneous Crystallization of Phosphate and Potassium as Mag-nesium Potassium Phosphate Using Bubble Column Reactor with Draught Tube. Journal of Environmental Chemical Engineering, 1, 1154-1158. https://doi.org/10.1016/j.jece.2013.08.032
[11] Tanaka, T. and Miyamaoto, T. (2013) Simultaneous Recovery of Phosphorus and Po tassium from Livestock by an Electrolytic Crystallization Method. Journal of Ja-pan Society of Civil Engineers Series G Environmental Research, 69, 1-9.(in Japa-nese)
[12] Eugene, W., Rice, R.B.B., Andrew, D.E. and Lenore, S.C. (2012) Standard Methods for Examination of Water and Wastewater. 21st Edition, American Public Health Association, Washington DC.
[13] Shih, Y.-J., Ruffel, M.A.R., Daniel, G.de L.M., Huang, Y.-H. and Lu, M.-C. (2017) Recovery of Phosphorus from Synthetic Wastewaters by Struvite Crystallization in a Fluidized-Bed Reactor: Effects of pH, Phosphate Concentration and Coexisting Ions. Chemosphere, 173, 466-473. https://doi.org/10.1016/j.chemosphere.2017.01.088
[14] Akagi, K., Teranaka, R., Harada, H., Katayama, M.Y. and Biswas, B.K. (2016) Gen eration of Magnesium Potassium Phosphate from Synthetic Livestock Wastewater Containing High Levels Phosphorus and Potassium. Journal of Water Pollution and Treatment, 1, 1-7.