Embed Size (px)
Citation preview

Effects of Clogging, Argon Injection and Casting Conditions
on Flow Rate and Air Aspiration in Submerged Entry Nozzles
Hua Bai and Brian G. Thomas
Continuous Casting Consortium University of Illinois at Urbana-Champaign

Continuous Casting Consortium University of Illinois at Urbana-Champaign
� Continuous Casting Consortium (CCC)Allegheny Ludlum, (Brackenridge, PA) Armco Inc. (Middletown, OH),
Columbus Stainless (South Africa) Inland Steel Corp. (East Chicago, IN),
LTV Steel (Cleveland, OH) Stollberg, Inc., (Niagara Falls, NY)
� National Science Foundation (Grant #: DMI-98-00274) � Inland Steel, LTV Steel -- Casting Data� The National Center for Supercomputing Applications -- CPU time� AEA technology -- CFX4.2
Acknowledgments
Continuous Casting Consortium University of Illinois at Urbana-Champaign
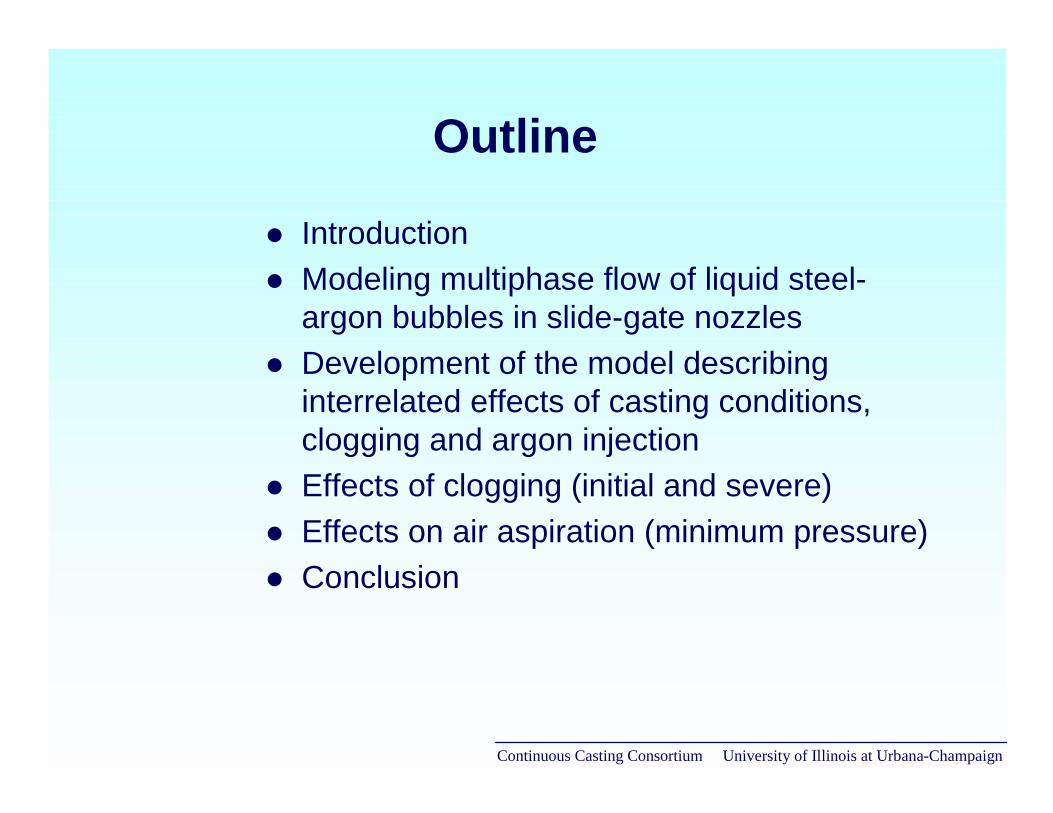
Outline
� Introduction� Modeling multiphase flow of liquid steel-
argon bubbles in slide-gate nozzles� Development of the model describing
interrelated effects of casting conditions, clogging and argon injection
� Effects of clogging (initial and severe)� Effects on air aspiration (minimum pressure)� Conclusion

Continuous Casting Consortium University of Illinois at Urbana-Champaign
Introduction
� Argon injection into the nozzle is an efficient and widely employed method to reduce nozzle clogging
� Both clogging and argon injection greatly affect flow pattern in nozzle and mold
� Tundish nozzle geometry is one of the few variables that is both very influential on the continuous casting process and relatively inexpensive to change
� Casting operation variables are interrelated
Continuous Casting Consortium University of Illinois at Urbana-Champaign
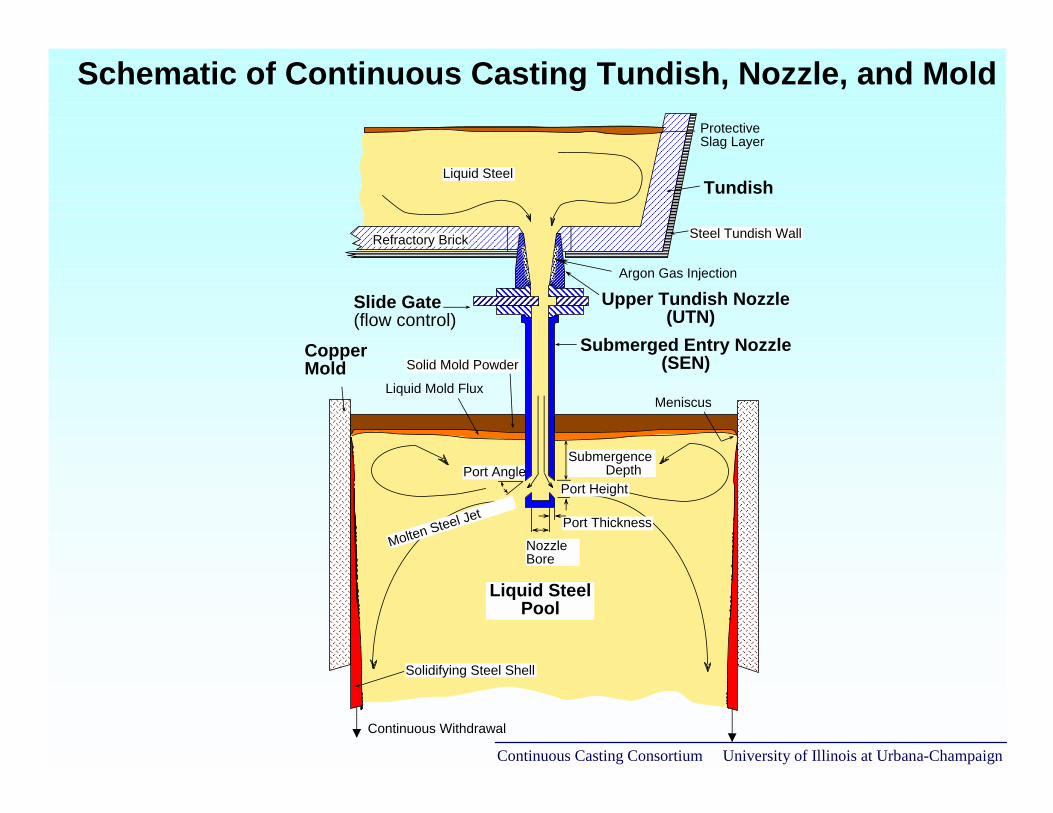
Schematic of Continuous Casting Tundish, Nozzle, and Mold
Submerged Entry Nozzle (SEN)
Meniscus
Copper Mold
AAAAAAAAAAAAAAAAAAAAAAAAAAAAAAAA
Slide Gate(flow control)
Submergence Depth
Liquid Steel Pool
Liquid Mold Flux
Solidifying Steel Shell
AAA
AAAAAAAAAAAAAAAAAAAAAAAAAAAAAAAAAA
Continuous Withdrawal
Port Thickness
Port HeightPort Angle
Nozzle Bore
Upper Tundish Nozzle (UTN)
Molten Steel Jet
AAAAAAAAAAA
AAAAAAAAAAAAAAAAAAAAAAAAAAAAAAAAAAAAAAAAAAAAAAAAAAAAAAAAAAAAAAAAAAAAAAAAAAAAAAAAA
Tundish
AAAAAAAAAAAAAAAAAAAAAAAAAAAAAAAAAAAAAAAAAAAAAAAAAAAAAAAAAAAAAAAAAAAAAAAA
AAAAAAAAAAAAAAAAAAAAAA
Liquid Steel
Protective Slag Layer
AAAAAAAAAAARefractory Brick Steel Tundish Wall
AAAA
AAAA
AAAAAA
Solid Mold Powder
AAAA
AAAAAAAA
AAA
AAA
Argon Gas Injection

Continuous Casting Consortium University of Illinois at Urbana-Champaign
Computational Domain and Boundary Conditions
Liquid Inlet from tundishnormal liquid velocity = constantK=constantε =constantLiquid volume fraction =1
Gas Injectionnormal gas velocity = constantArgon volume fraction =1
Outlets (both ports)pressure = constantzero normal gradients for velocities, K and ε
Tundish Well (Nozzle Top)
UTN(Upper Tundish Nozzle)
Slide-Gate Opening
SEN(Submerged Entry Nozzle)
Nozzle Ports
Shrould Holder
Continuous Casting Consortium University of Illinois at Urbana-Champaign
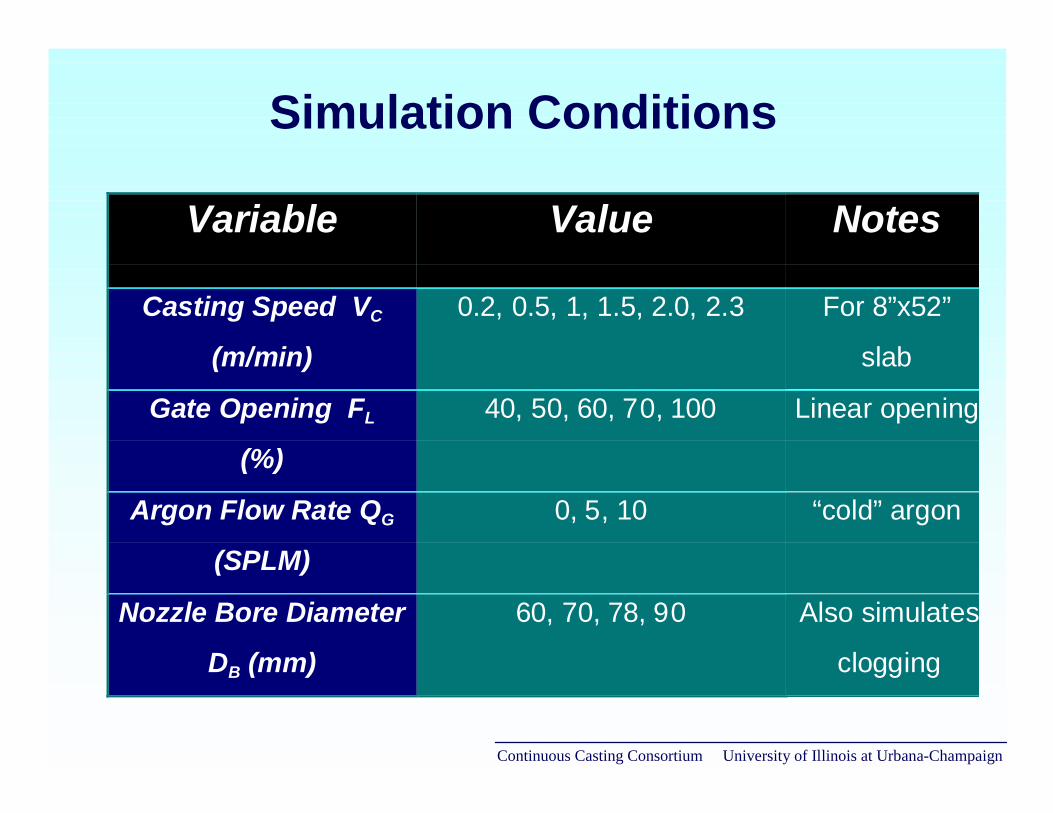
Simulation Conditions
Variable Value Notes
Casting Speed VC
(m/min)
0.2, 0.5, 1, 1.5, 2.0, 2.3 For 8”x52”
slab
Gate Opening FL
(%)
40, 50, 60, 70, 100 Linear opening
Argon Flow Rate QG
(SPLM)
0, 5, 10 “cold” argon
Nozzle Bore Diameter
DB (mm)
60, 70, 78, 90 Also simulates
clogging

Continuous Casting Consortium University of Illinois at Urbana-Champaign
Definitions of Slide-Gate Opening and Their Conversions
T
SL
D
Ref
eren
ce li
ne
Slide-gate plate Bore
AAAAAAAAAAAA
0
20
40
60
80
100
0 20 40 60 80 100
Slid
e-ga
te o
peni
ng (%
)
Slide-gate opening-linear fraction FL (%)
FP (M=41.7%)
FP (M=24%)
FL
FA
FL =LD
FP =ST
FA =Shadow Area
Bore Area
FP = (1− M)FL + M M =T − D
T
FA =2π
cos−1 1 − FL( )−2π
1 − FL( ) 1 − 1− FL( )2
Continuous Casting Consortium University of Illinois at Urbana-Champaign
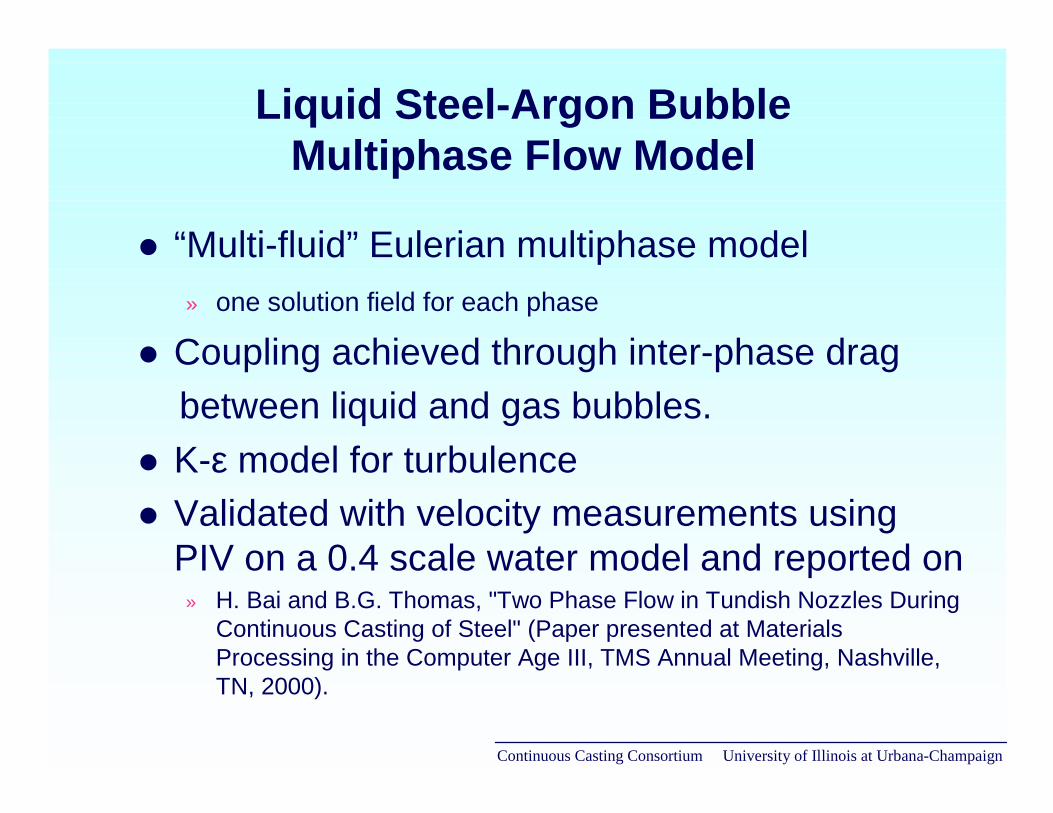
Liquid Steel-Argon BubbleMultiphase Flow Model
� “Multi-fluid” Eulerian multiphase model» one solution field for each phase
� Coupling achieved through inter-phase drag between liquid and gas bubbles.
� K-ε model for turbulence� Validated with velocity measurements using
PIV on a 0.4 scale water model and reported on» H. Bai and B.G. Thomas, "Two Phase Flow in Tundish Nozzles During
Continuous Casting of Steel" (Paper presented at Materials Processing in the Computer Age III, TMS Annual Meeting, Nashville, TN, 2000).
Continuous Casting Consortium University of Illinois at Urbana-Champaign
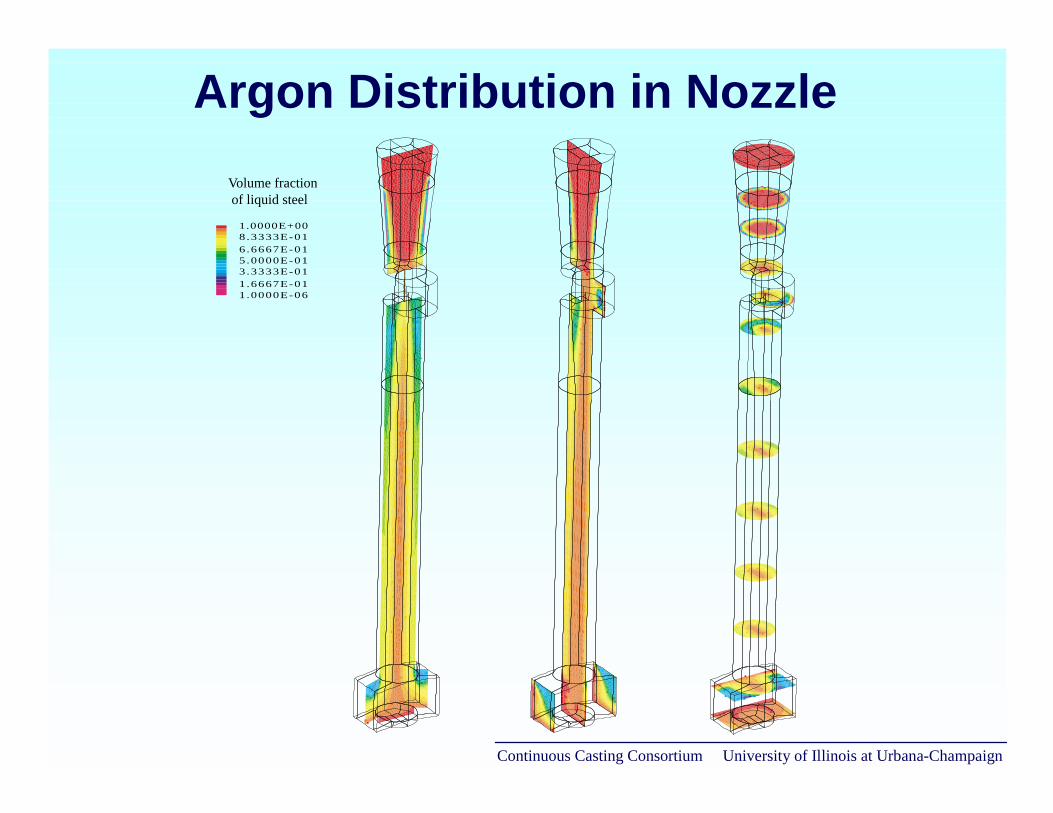
Argon Distribution in Nozzle
1.0000E-061.6667E-013.3333E-015.0000E-016.6667E-018.3333E-011.0000E+00
Volume fraction of liquid steel
Continuous Casting Consortium University of Illinois at Urbana-Champaign
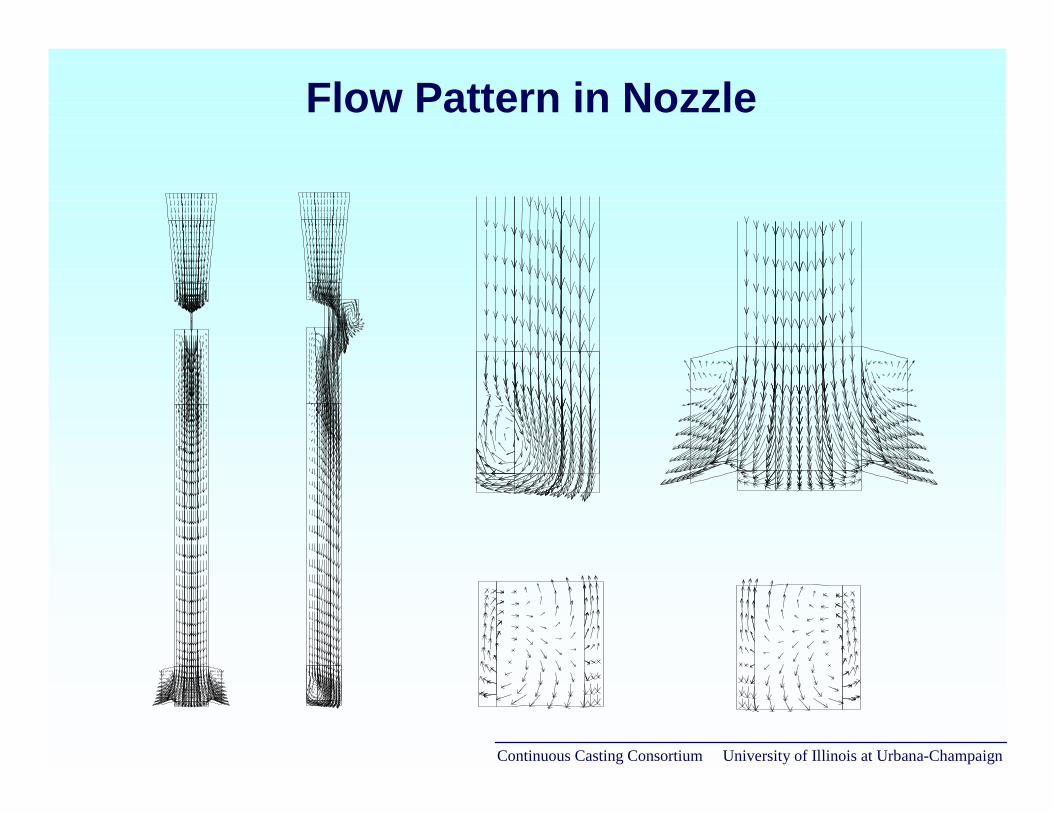
Flow Pattern in Nozzle
Fe

Continuous Casting Consortium University of Illinois at Urbana-Champaign
Pressure Distribution in Nozzle
0 20 40 60 80 100
0
200
400
600
800
1000
FL=40%, HT=1.545m
FL=50%, HT=0.904m
FL=60%, HT=0.653m
FL=70%, HT=0.583m
FL=100%, HT=0.513m
(b) Pressure (KPa)
Dis
tanc
e fr
om th
e po
int O
at t
he c
ente
r lin
e (m
m)
Argon injection QG=10 SLPMCasting speed VC=1m/minNozzle bore diameter DB=78mm
Gate opening FL Tundish level HT
FL=40%
50%60%FL=100%
FL=70%
z
x
o
HighPressure
LowPressure
(a)
z
xo
Continuous Casting Consortium University of Illinois at Urbana-Champaign
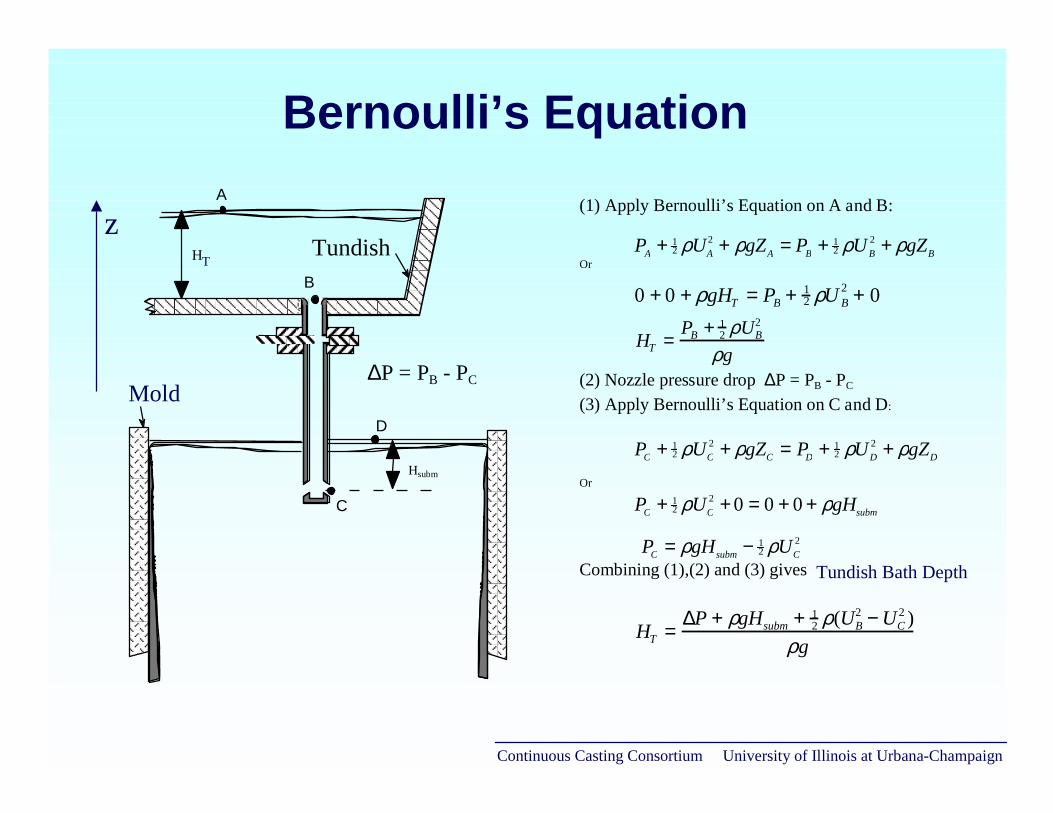
Bernoulli’s Equation
TundishH
A
B
C
D
Hsubm
∆P = PB - PC
(1) Apply Bernoulli’s Equation on A and B:
Or
(2) Nozzle pressure drop ∆P = PB - PC
(3) Apply Bernoulli’s Equation on C and D:
Or
Combining (1),(2) and (3) gives
0 + 0 + ρgHT = PB + 12 ρU B
2 + 0
PA + 12 ρUA
2 + ρgZA = PB + 12 ρUB
2 + ρgZB
HT =PB + 1
2 ρUB2
ρg
PC + 12 ρUC
2 + ρgZC = PD + 12 ρUD
2 + ρgZD
PC + 12 ρUC
2 +0 = 0 + 0 + ρgHsubm
PC = ρgHsubm − 12 ρUC
2
HT =∆P + ρgHsubm + 1
2 ρ(UB2 − UC
2 )ρg
zT
Mold
Tundish Bath Depth
Continuous Casting Consortium University of Illinois at Urbana-Champaign
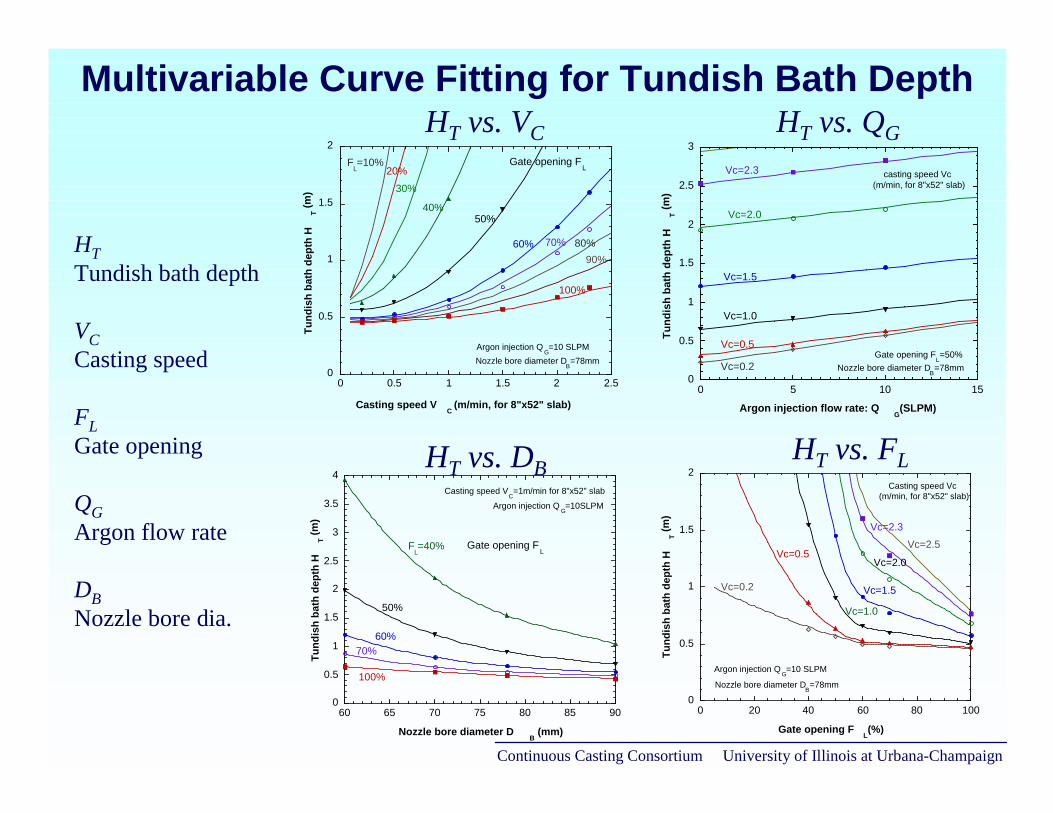
Multivariable Curve Fitting for Tundish Bath Depth
0
0.5
1
1.5
2
0 0.5 1 1.5 2 2.5
Tund
ish
bath
dep
th H
T (m)
Casting speed VC
(m/min, for 8"x52" slab)
Argon injection QG=10 SLPM
FL=10%
20%30%
40%50%
60% 70% 80%90%
100%
Gate opening FL
Nozzle bore diameter DB=78mm
0
0.5
1
1.5
2
2.5
3
0 5 10 15
Tund
ish
bath
dep
th H
T (m)
Argon injection flow rate: QG(SLPM)
Gate opening FL=50%
casting speed Vc (m/min, for 8"x52" slab)
Vc=2.3
Vc=2.0
Vc=1.5
Vc=1.0
Vc=0.5
Vc=0.2 Nozzle bore diameter DB=78mm
0
0.5
1
1.5
2
2.5
3
3.5
4
60 65 70 75 80 85 90
Tund
ish
bath
dep
th H
T (m)
Nozzle bore diameter DB (mm)
FL=40%
50%
60%70%
100%
Casting speed VC=1m/min for 8"x52" slab
Argon injection QG=10SLPM
Gate opening FL
0
0.5
1
1.5
2
0 20 40 60 80 100
Tund
ish
bath
dep
th H
T (m)
Gate opening FL(%)
Casting speed Vc (m/min, for 8"x52" slab)
Vc=2.5Vc=2.3
Vc=2.0
Vc=1.5
Vc=0.5
Vc=1.0
Vc=0.2
Nozzle bore diameter DB=78mm
Argon injection QG=10 SLPM
HT vs. VC
HT vs. FL
HT vs. QG
HT vs. DB
HT Tundish bath depth
VCCasting speed
FLGate opening
QGArgon flow rate
DBNozzle bore dia.
Continuous Casting Consortium University of Illinois at Urbana-Champaign
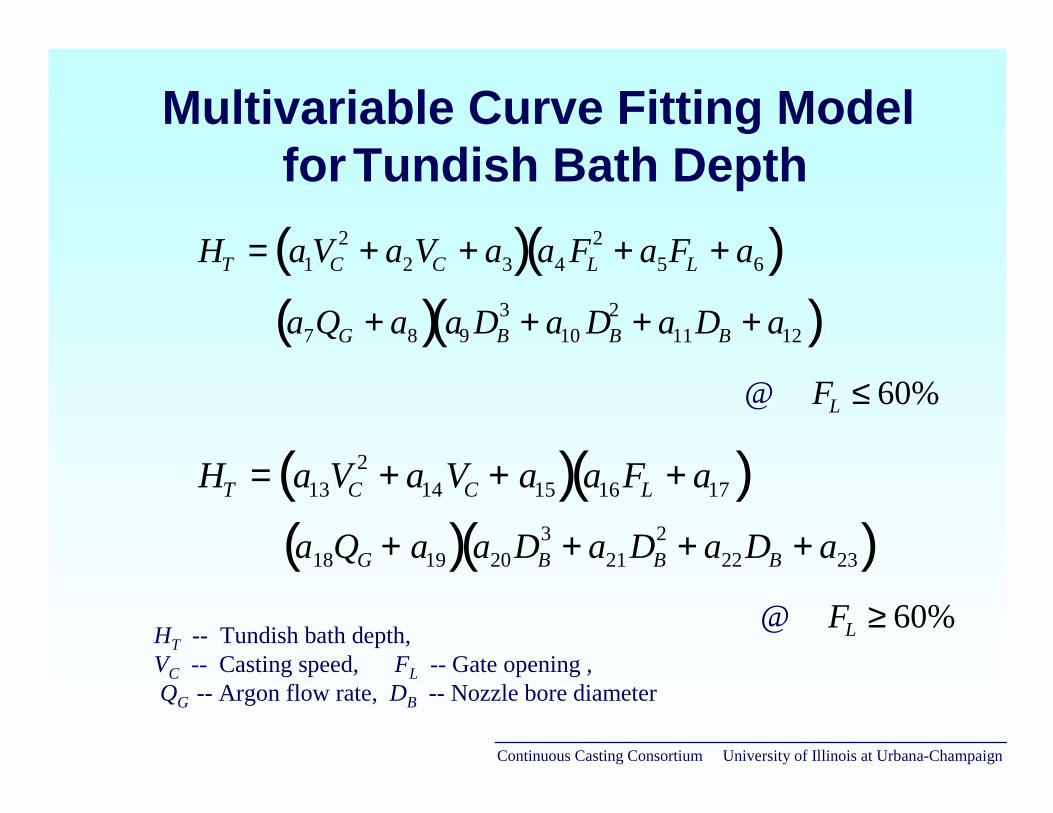
Multivariable Curve Fitting Model for Tundish Bath Depth
FL ≤ 60%
FL ≥ 60%
@
@HT -- Tundish bath depth, VC -- Casting speed, FL -- Gate opening , QG -- Argon flow rate, DB -- Nozzle bore diameter
HT = a1VC2 + a2VC + a3( ) a4 FL
2 + a5FL + a6( )a7QG + a8( ) a9 DB
3 + a10 DB2 + a11DB + a12( )
HT = a13VC2 + a14VC + a15( ) a16FL + a17( )
a18QG + a19( ) a20DB3 + a21DB
2 + a22DB + a23( )

Continuous Casting Consortium University of Illinois at Urbana-Champaign
Effect of Argon Injection on Casting Speed
0
0.5
1
1.5
2
0
0.1
0.2
0.3
0.4
0.5
0 2 4 6 8 10
Cas
ting
spee
d V
C (m
/min
, for
8"x
52"
slab
)Steel flow
rate (m3/m
in)
Argon injection flow rate: QG(SLPM)
HT=1.6m
HT=1.4m
HT=1.2m
HT=1.0m
HT=0.8m
HT=0.6m
HT=0.4m
HT=0.2m
Tundish bath depth: HT
Gate opening FL=50%
Nozzle bore diameter DB=78mm
Continuous Casting Consortium University of Illinois at Urbana-Champaign
Casting Speed, Gate Opening and Tundish Bath Depth Relation
0
1
2
3
4
5
0
0.2
0.4
0.6
0.8
1
1.2
0 20 40 60 80 100
Gate opening : Area fraction FA(%)
Cas
ting
spee
d V
C(m
/min
, 8"x
52"
slab
)
Steel flow rate (m
3/min)
Gate opening : Linear fraction FL(%)
0 20 40 60 80 100
Argon injection: QG=10 SLPM
Nozzle bore diameter DB=78mm
Tundish bath depth: HT
HT=1.6m
HT=1.4m
HT=1.2m
HT=1.0m
HT=0.8m
HT=0.6m

Continuous Casting Consortium University of Illinois at Urbana-Champaign
Casting Speed, Gate Opening and Tundish Bath Depth Relation
0
1
2
3
4
5
0
0.2
0.4
0.6
0.8
1
1.2
0 20 40 60 80 100
Gate opening : Area fraction FA(%)
Cas
ting
spee
d V
C(m
/min
, 8"x
52"
slab
)
Steel flow rate (m
3/min)
Gate opening : Linear fraction FL(%)
Tundish bath depth: HT
Argon injection: QG=5 SLPM
Nozzle bore diameter DB=78mm
HT=1.6m
HT=1.4m
HT=1.2m
HT=1.0m
HT=0.8m
HT=0.6m H
T=0.4m
0 20 40 60 80 100

Continuous Casting Consortium University of Illinois at Urbana-Champaign
Comparison of Model Predictions with Plant Measurements
0.5 1.0 1.5 2.0 2.5 3.0 3.5 4.0 4.50.0
10
20
30
40
50
60
70
80
0
Model prediction(standard nozzle)
CFX simulation (actual nozzle)
Measured data fitting curve
Measured dataA ~ Z
Steel throughput (tonne/min)
Slid
e-g
ate
op
enin
g F
p (
%, p
lan
t d
efin
itio
n) Measured data legend: A = 1 obs, B = 2 obs, etc.
All data for the first heat
AAAAAAAAAAAAAA
AAAAAAAAAAAA
AAAAAAAAAAAAAAAAAAAAAAA
AAAAAAAAA
AA
Slid
e-g
ate
op
enin
g F
L (
%)
0
10
20
30
40
50
60
70
0.0 0.25 0.50 0.75 1.00 1.25 1.50 1.75 2.00 2.25
Casting speed VC (m/min, for 8”x52” slab)

Continuous Casting Consortium University of Illinois at Urbana-Champaign
Schematic of Initial Clogging and Rounded Edges in Vicinity of the Slide-Gate
AAAA
AAAAAAA
AAAAAAAA
AAAA
AAAAAA AA
AAAA
(a) Sharp edges (b) Rounded edges (c) Sharp edges with (d)Sharp edges with initial clogging more inital clogging

Continuous Casting Consortium University of Illinois at Urbana-Champaign
Effects of Initial Clogging and Rounded Edges
0
0.2
0.4
0.6
0.8
1
1.2
1.4
0.927m
1.340m
1.102m1.015m
0.856m
Tund
ish
bath
dep
th (
m)
Prediction
Sharp edges
Roundedges
Sharp edgeswith initial clogging
Sharp edgeswith moreinitial clogging
Measurement(a) (b) (c) (d)

Continuous Casting Consortium University of Illinois at Urbana-Champaign
Effects of Initial Clogging and Rounded Edges on Flow Pattern
Sharp edge Round edge Initial clogging More initial(a) (b) (c) (d)
clogging

Continuous Casting Consortium University of Illinois at Urbana-Champaign
Effects of Clogging or Nozzle Bore Size
0
20
40
60
80
100
50 60 70 80 90 100
Gat
e op
enin
g F
L (%
)
Nozzle bore diameter DB(mm)
HT=0.6m
HT=0.8m
HT=1.0m
HT=1.2m
HT=1.4m
HT=1.6m
Tundish bath depth: HT
Argon injection QG=10SLPM
Casting speed VC=1m/min for 8"x52" slab

Continuous Casting Consortium University of Illinois at Urbana-Champaign
Effects of Clogging or Nozzle Bore Size
0
0.5
1
1.5
2
2.5
50 60 70 80 90 100
Cas
ting
spee
d V
C (m
/min
, 8"x
52"s
lab)
Nozzle bore diameter DB(mm)
HT=0.6mH
T=0.8m
HT=1.0m
HT=1.2m
HT=1.4m
HT=1.6m
Tundish bath depth: HT
Gate opening FL=50%
Argon injection QG=10SLPM

Continuous Casting Consortium University of Illinois at Urbana-Champaign
Curve Fitting for Minimum Pressure in Nozzle
-100
-80
-60
-40
-20
0
20
0 0.5 1 1.5 2 2.5
Low
est p
ress
ure
in n
ozzl
e P
L (k
Pa)
Casting speed VC
(m/min, for 8"x52" slab)
40%
50%
60%
70%
FL=100%
Argon injection QG=10 SLPM
Gate opening FL
Nozzle bore diameter DB=78mm
-100
-80
-60
-40
-20
0
20
0 2 4 6 8 10
Low
est p
ress
ure
in n
ozzl
e P
L (k
Pa)
Argon injection flow rate: QG(SLPM)
Vc=0.2Vc=0.5
Vc=1.0
Vc=1.5
Vc=2.0
Vc=2.3casting speed Vc
(m/min, for 8"x52" slab)
Gate opening FL=50%
Nozzle bore diameter DB=78mm
-50
-40
-30
-20
-10
0
10
20
60 65 70 75 80 85 90
Low
est P
ress
ure
in N
ozzl
e P
L(k
Pa)
Nozzle bore diameter DB(mm)
Argon injection QG=10SLPM
Casting speed VC=1m/min for 8"x52" slab
Gate opening FL
100%
70%60%
50%
FL=40%
-100
-80
-60
-40
-20
0
20
30 40 50 60 70 80 90 100
Low
est p
ress
ure
in n
ozzl
e P
L (k
Pa)
Gate 0pening FL(%)
Vc=0.2Vc=0.5
Vc=1.0
Vc=1.5
Vc=2.0
Vc=2.3
Vc=2.5
Casting speed Vc (m/min, for 8"x52" slab)
Argon injection QG=10 SLPM
Nozzle bore diameter DB=78mm
PL vs.VC PL vs.QG
PL vs.DB PL vs.FL
PL Minimum pressurein nozzle
VCCasting speed
FLGate opening
QGArgon flow rate
DBNozzle bore dia.
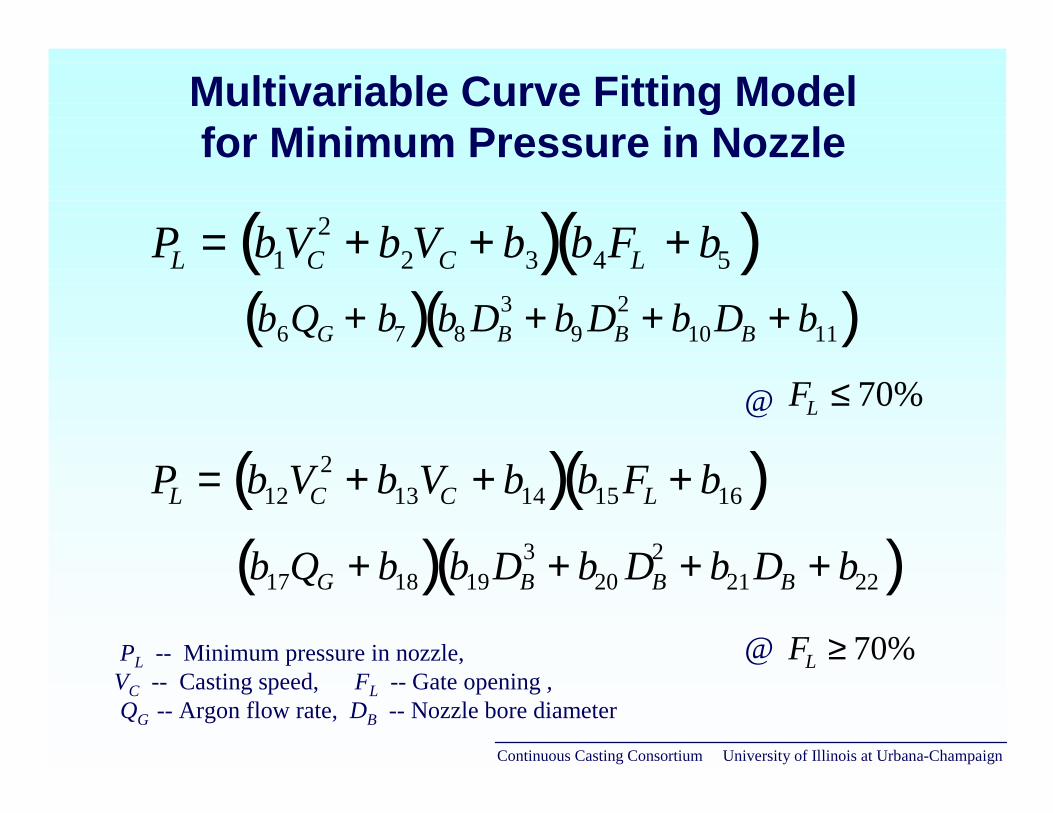
Continuous Casting Consortium University of Illinois at Urbana-Champaign
Multivariable Curve Fitting Model for Minimum Pressure in Nozzle
PL = b1VC2 + b2VC + b3( ) b4FL + b5( )
b6QG + b7( ) b8 DB3 + b9 DB
2 + b10DB + b11( )
PL = b12VC2 + b13VC + b14( ) b15FL + b16( )
b17QG + b18( ) b19DB3 + b20 DB
2 + b21DB + b22( )
FL ≤ 70%
FL ≥ 70%
@
@PL -- Minimum pressure in nozzle, VC -- Casting speed, FL -- Gate opening , QG -- Argon flow rate, DB -- Nozzle bore diameter

Continuous Casting Consortium University of Illinois at Urbana-Champaign
Effects of Casting Conditions on Air Aspiration
Low
est p
ress
ure
in n
ozzl
e P
L(kP
a)
Casting speed (Vc) and argon injection volume fraction (fg)
Vc(m/min) 8"x52"slab
1020
10203040
30
fg(%,hot)
fg(%,cold)
10090807060504030
20 90807060504030
20 90807060504030
20 807060504030
20 706050403010
20 6050403010
-60
-50
-40
-30
-20
-10
0
10
20
0 0.5 1 1.5 2 2.5
HT=0.6m
HT=0.8m
HT=1.0m
HT=1.2m
HT=1.4m
HT=1.6m
Argon injection flow rate QG=10SLPM
Tundish bath depth: HT
Nozzle bore diameter DB=78mm
Gate opening FL(%)
@HT=0.6m
@HT=0.8m
@HT=1.0m@HT=1.2m
@HT=1.4m@HT=1.6m

Continuous Casting Consortium University of Illinois at Urbana-Champaign
Effect of Argon Injection on Air Aspiration in Nozzle
1020
102030
100807060504030
908070605040
2010 807060504030
30 7060504010
20 6050403010
20 50403010
90
3020
20
60
-80
-60
-40
-20
0
20
0 0.5 1 1.5 2 2.5
Low
est p
ress
ure
in n
ozzl
e P
L(kP
a)
Casting speed (Vc) and argon injection volume fraction (fg)
fg(%,hot)
fg(%,cold)
Vc(m/min) 8"x52"slab
Argon injection flow rate QG=5SLPM
Tundish bath depth: HT
Nozzle bore diameter DB=78mm
HT=0.6m
HT=0.8m
HT=1.0m
HT=1.2m
HT=1.4m
HT=1.6m
Gate opening FL(%)
@HT=0.6m
@HT=0.8m
@HT=1.0m@HT=1.2m
@HT=1.4m@HT=1.6m

Continuous Casting Consortium University of Illinois at Urbana-Champaign
Effect of Argon Injection on Air Aspiration in Nozzle
0 0.5 1 1.5 2 2.5-50
-40
-30
-20
-10
0
10
1020
10203040
100807060504030
908070605040
20 807060504030
30 70605040
20 6050403010
20 50403010
90
3020
20
60
100
90
80
70 80
70Lo
wes
t pre
ssur
e in
noz
zle
PL(
kPa)
Casting speed (Vc) and argon injection volume fraction (fg)
Vc(m/min) 8"x52"slabfg(%,hot)
fg(%,cold)
Argon injection flow rate QG=5SLPM
Tundish bath depth: HT
Nozzle bore diameter DB=70mm
HT=0.6m
HT=0.8m
HT=1.0m
HT=1.2m
HT=1.4m
HT=1.6m
Gate opening FL(%)
@HT=0.6m
@HT=0.8m
@HT=1.0m@HT=1.2m
@HT=1.4m@HT=1.6m

Continuous Casting Consortium University of Illinois at Urbana-Champaign
Effect of Argon Injection on Air Aspiration in Nozzle
Argon injection flow rate (QG) and volume fraction (fg)
QG(SLPM)
1 2
102 4 6
58 706052 54 56
5048
44 4846
444240
424038
3634
52
38
8 12 14
3
-15
-10
-5
0
5
10
15
0 2 4 6 8 10
Casting speed Vc =1m/min
Tundish bath depth: HT
Nozzle bore diameter DB=78mm
Low
est p
ress
ure
in n
ozzl
e P
L(kP
a)
fg(%,hot)
fg(%,cold)
HT=0.6m
HT=0.8m
HT=1.0mHT=1.2m
HT=1.4m
HT=1.6m
Gate opening FL(%)
@HT=0.6m
@HT=0.8m
@HT=1.0m@HT=1.2m
@HT=1.4m@HT=1.6m

Continuous Casting Consortium University of Illinois at Urbana-Champaign
Effect of Argon Injection on Air Aspiration in Nozzle
64
1 2
102 4 6
85 959070 75 80
6257
54 5655
535250
504948
4746 48
8
Tundish bath depth: HTHT=0.6m
HT=0.8m
HT=1.0mHT=1.2mHT=1.4m
HT=1.6m
-40
-30
-20
-10
0
10
20
0 2 4 6 8 10
51
53
58 59 60 66 68 70
Casting speed Vc =1.5 m/minNozzle bore diameter DB=78mm
Argon injection flow rate (QG) and volume fraction (fg)
QG(SLPM)
Low
est p
ress
ure
in n
ozzl
e P
L(kP
a)
fg(%,hot)
fg(%,cold)
Gate opening FL(%)
@HT=0.6m
@HT=0.8m
@HT=1.0m@HT=1.2m
@HT=1.4m@HT=1.6m

Continuous Casting Consortium University of Illinois at Urbana-Champaign
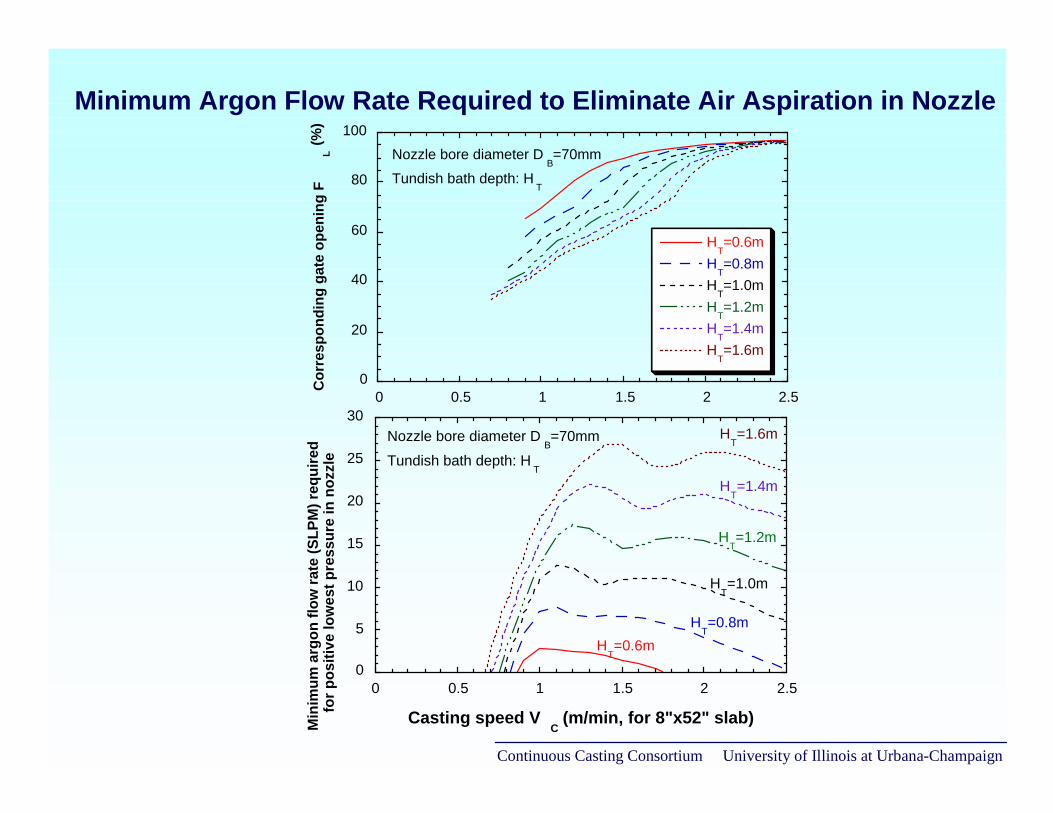
Minimum Argon Flow Rate Required to Eliminate Air Aspiration in Nozzle
0
20
40
60
80
100
0 0.5 1 1.5 2 2.5
HT=0.6m
HT=0.8m
HT=1.0m
HT=1.2m
HT=1.4m
HT=1.6m
Cor
resp
ondi
ng g
ate
open
ing
FL (%
)
Nozzle bore diameter DB=78mm
Tundish bath depth: HT
0
5
10
15
20
25
30
35
40
0 0.5 1 1.5 2 2.5
Min
imum
arg
on fl
ow ra
te (S
LPM
) req
uire
d fo
r pos
itive
low
est p
ress
ure
in n
ozzl
e
Casting speed VC
(m/min, for 8"x52" slab)
HT=0.6m
HT=0.8m
HT=1.0m
HT=1.2m
HT=1.4m
HT=1.6mNozzle bore diameter D
B=78mm
Tundish bath depth: HT
Continuous Casting Consortium University of Illinois at Urbana-Champaign
Minimum Argon Flow Rate Required to Eliminate Air Aspiration in Nozzle
0
20
40
60
80
100
0 0.5 1 1.5 2 2.5
HT=0.6m
HT=0.8m
HT=1.0m
HT=1.2m
HT=1.4m
HT=1.6m
V
Nozzle bore diameter DB=70mm
Tundish bath depth: HT
Cor
resp
ondi
ng g
ate
open
ing
FL (%
)
0
5
10
15
20
25
30
0 0.5 1 1.5 2 2.5
Casting speed VC
(m/min, for 8"x52" slab)
HT=0.6m
HT=0.8m
HT=1.0m
HT=1.2m
HT=1.4m
HT=1.6mNozzle bore diameter D
B=70mm
Tundish bath depth: HT
Min
imum
arg
on fl
ow ra
te (S
LPM
) req
uire
d fo
r pos
itive
low
est p
ress
ure
in n
ozzl
e
Continuous Casting Consortium University of Illinois at Urbana-Champaign
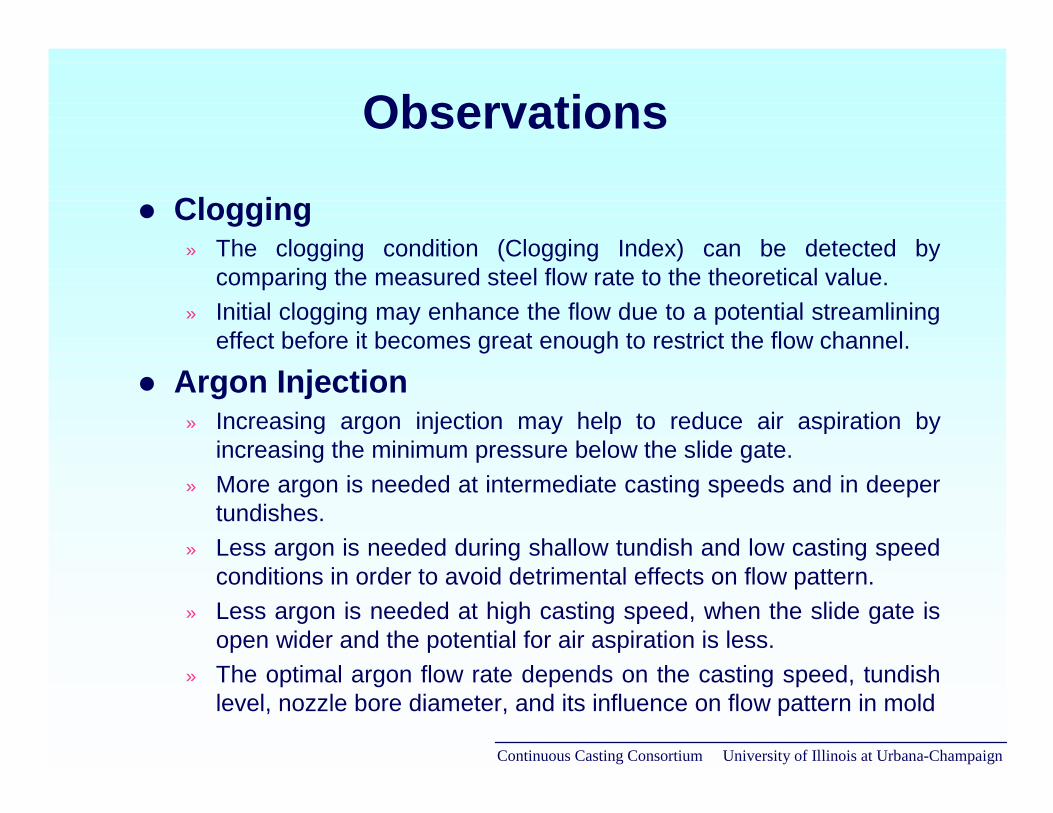
Observations
� Clogging» The clogging condition (Clogging Index) can be detected by
comparing the measured steel flow rate to the theoretical value.» Initial clogging may enhance the flow due to a potential streamlining
effect before it becomes great enough to restrict the flow channel.
� Argon Injection» Increasing argon injection may help to reduce air aspiration by
increasing the minimum pressure below the slide gate. » More argon is needed at intermediate casting speeds and in deeper
tundishes. » Less argon is needed during shallow tundish and low casting speed
conditions in order to avoid detrimental effects on flow pattern. » Less argon is needed at high casting speed, when the slide gate is
open wider and the potential for air aspiration is less. » The optimal argon flow rate depends on the casting speed, tundish
level, nozzle bore diameter, and its influence on flow pattern in mold

Continuous Casting Consortium University of Illinois at Urbana-Champaign
Observations
� A small change in bath depth causes a larger change in casting speed at low casting speed than it does at high casting speed
� To maintain a constant low casting speed, a larger change in gate opening is needed to compensate for small changes in bath depth than maintaining a constant high casting speed
� For a fixed tundish bath depth, increasing argon injection will slightly slow down the casting speed unless the gate opening increases to compensate
� For a fixed tundish bath depth, casting speed is the most sensitive to gate opening changes at very large openings (FL>90%) and in the intermediate range of gate opening (FL=40%~60%).
Operation Variables’ Relation
Continuous Casting Consortium University of Illinois at Urbana-Champaign
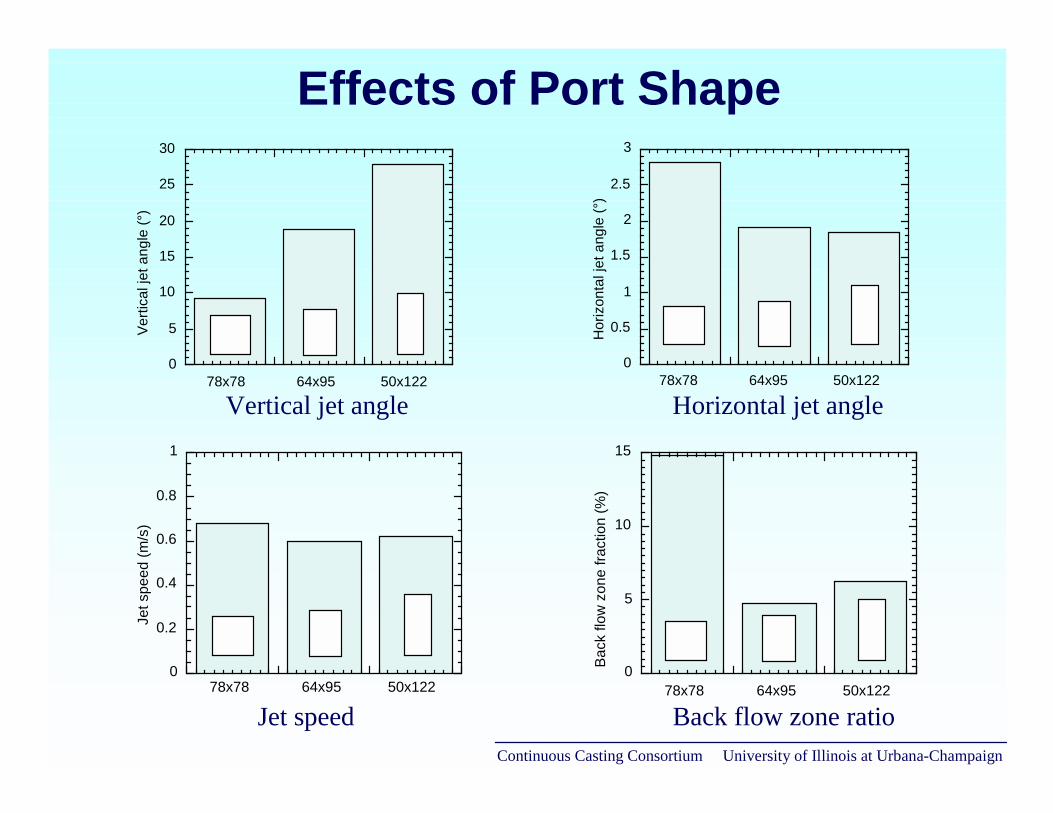
Effects of Port Shape
0
5
10
15
20
25
30
78x78 64x95 50x122
Verti
cal j
et a
ngle
(°)
0
0.5
1
1.5
2
2.5
3
78x78 64x95 50x122
Hor
izon
tal j
et a
ngle
(°)
0
0.2
0.4
0.6
0.8
1
78x78 64x95 50x122
Jet s
peed
(m/s
)
0
5
10
15
78x78 64x95 50x122
Back
flow
zon
e fra
ctio
n (%
)
Vertical jet angle Horizontal jet angle
Jet speed Back flow zone ratio
Continuous Casting Consortium University of Illinois at Urbana-Champaign
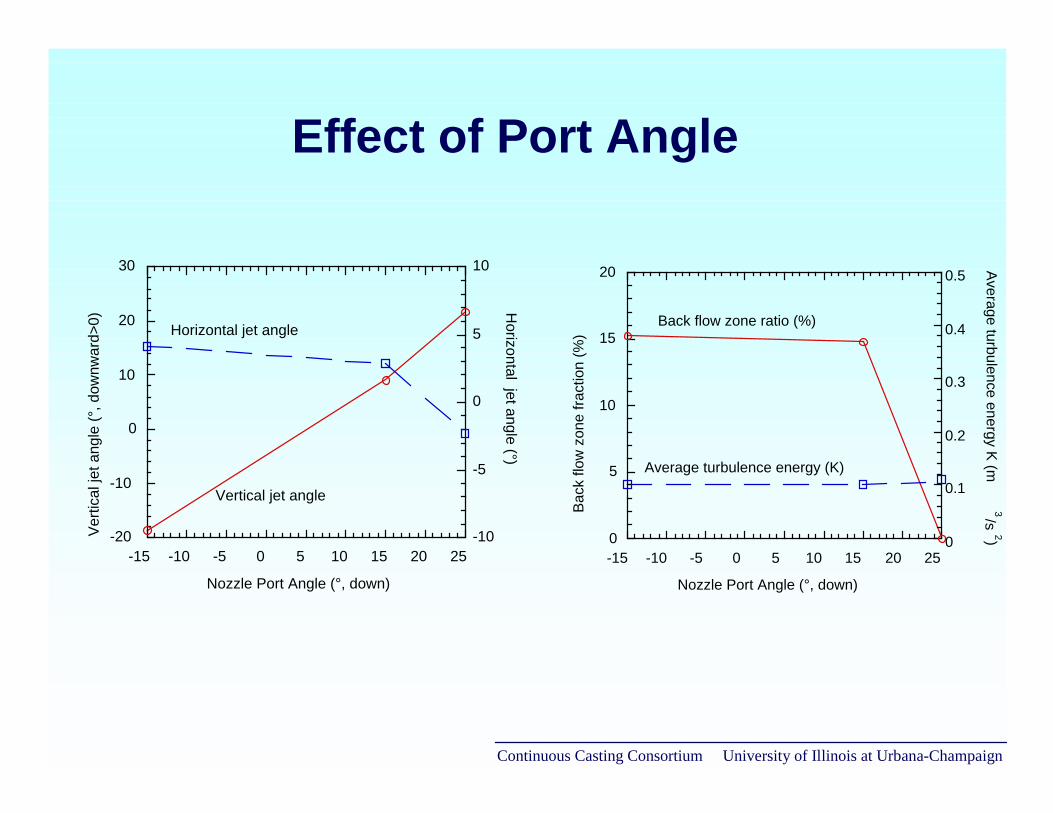
Effect of Port Angle
-20
-10
0
10
20
30
-10
-5
0
5
10
-15 -10 -5 0 5 10 15 20 25
Verti
cal j
et a
ngle
(°, d
ownw
ard>
0)
Horizontal jet angle (°)
Nozzle Port Angle (°, down)
Vertical jet angle
Horizontal jet angle
0
5
10
15
20
0
0.1
0.2
0.3
0.4
0.5
-15 -10 -5 0 5 10 15 20 25Ba
ck fl
ow z
one
fract
ion
(%)
Average turbulence energy K (m3/s
2)
Nozzle Port Angle (°, down)
Back flow zone ratio (%)
Average turbulence energy (K)
Continuous Casting Consortium University of Illinois at Urbana-Champaign
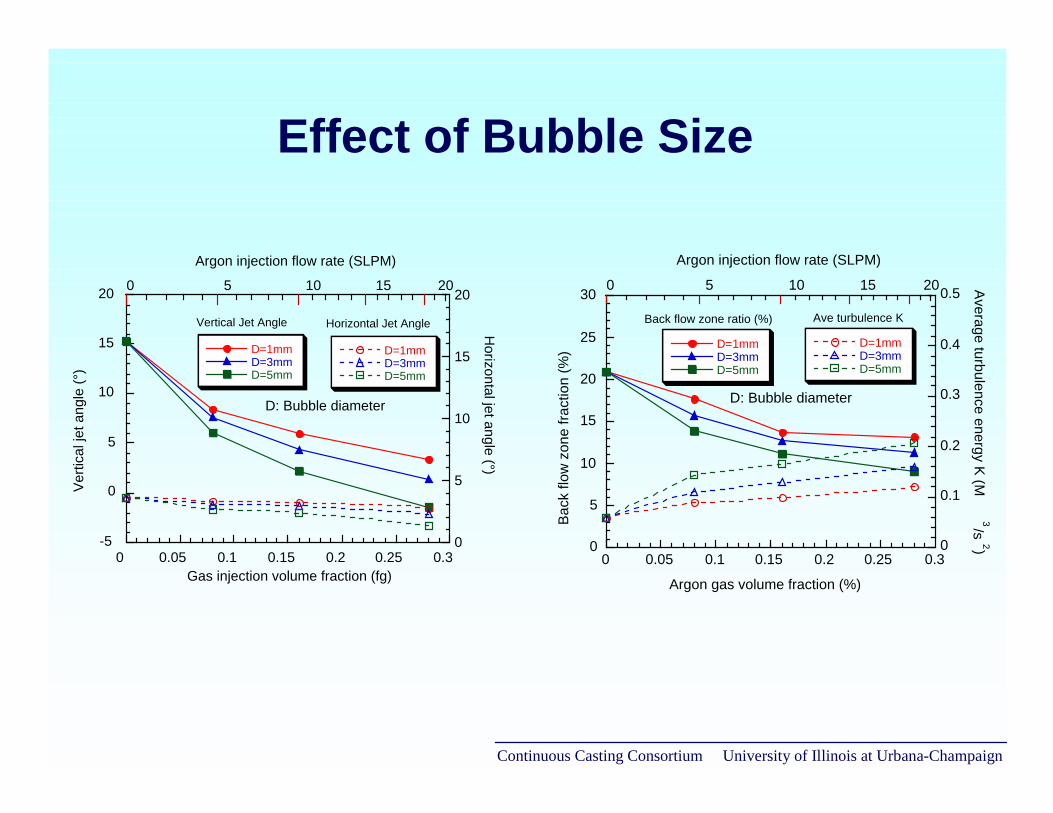
Effect of Bubble Size
-5
0
5
10
15
20
0
5
10
15
20
0 0.05 0.1 0.15 0.2 0.25 0.3
D=1mmD=3mmD=5mm
D=1mmD=3mmD=5mm
Verti
cal j
et a
ngle
(°)
Horizontal jet angle (°)
Vertical Jet Angle Horizontal Jet Angle
D: Bubble diameter
0 5 10 15 20
Argon injection flow rate (SLPM)
Gas injection volume fraction (fg)
0
5
10
15
20
25
30
0
0.1
0.2
0.3
0.4
0.5
0 0.05 0.1 0.15 0.2 0.25 0.3
D=1mmD=3mmD=5mm
D=1mmD=3mmD=5mm
Back
flow
zon
e fra
ctio
n (%
)
Average turbulence energy K (M3/s
2)
Argon gas volume fraction (%)
D: Bubble diameter
Back flow zone ratio (%) Ave turbulence K
0 5 10 15 20
Argon injection flow rate (SLPM)

Continuous Casting Consortium University of Illinois at Urbana-Champaign
Effect of Gate Opening
0
2
4
6
8
10
12
0
2
4
6
8
10
12
40 50 60 70 80 90 100
Verti
cal j
et a
ngle
(°, d
ownw
ard)
Horizontal jet angle (°)
Slide gate opening FL (%)
Gate orientation: 90°Casting speed: Vc=1 m/minGas injection rate: Q
G=10SLPM
Vertical jet angle
Horizontal jet angle
0
0.2
0.4
0.6
0.8
1
0
5
10
15
20
40 50 60 70 80 90 100
Jet s
peed
(m/s
)
Back flow zone fraction (%
)
Back flow zone fraction
Jet speed
Gate orientation: 90°Casting speed: Vc=1 m/minGas injection rate: Q
G=10SLPM
Slide gate opening FL (%)
0
0.1
0.2
0
0.5
1
1.5
40 50 60 70 80 90 100
Turb
ulen
ce e
nerg
y (m
^2/s
^2)
Turbulence dissipation (m^2/s^3)
Turbulence energy
Slide gate opening FL (%)
Gate orientation: 90°Casting speed: Vc=1 m/minGas injection rate: Q
G=10SLPM
Turbulence dissipation

Continuous Casting Consortium University of Illinois at Urbana-Champaign
Two Jets on Each Port
Jet d
ivis
ion
line
Jet d
ivis
ion
line
z,w
y,vz,w
y,v
z,wy,v x,u
Back flow zone
Upward jet
Downward jet
Left port view Right port view

Continuous Casting Consortium University of Illinois at Urbana-Champaign
Comparing One Overall Jet with Two Separate Jets
Left Port Right PortJet mode Two-jets One-jet Two-jets One-jet
Jet Upwardjet
Downwardjet
Overallone-jet
Upwardjet
Downwardjet
Overallone-jet
Vertical jet angle 21.65°upward
8.30°downward
4.55°downward
20.59°upward
7.86°downward
2.41°downward
Jet speed (m/s) 0.56 0.81 0.76 0.67 0.87 0.81
Horizontal jetangle *
-4.70° 1.86° 1.06 -1.43 2.89 2.09
Back flow zonefraction
8.3% 20.1%
Area fraction ofport occupied
by jet
34.0% 57.7% 91.7% 31.3% 48.6% 79.9%
Liquid flowfraction carried
by jet
8.7% 48.1% 56.8% 9.2% 34.0% 43.2%
Jet gas fraction 61.5% 10.9% 25.8% 61.3% 11.7% 30.7%
Gas flow fractioncarried by jet
35.8% 15.1% 50.9% 37.5% 11.6% 49.1%