Embed Size (px)
Citation preview
1 2 3
PUBLIC COMMENT DRAFT 4 5 6 7
EFFECTS OF CLIMATE CHANGE ON 8
ENERGY PRODUCTION AND USE IN 9
THE UNITED STATES 10
11 12 13 14 15 16 17 18 19 20 21 22 23 24 25
U.S. CLIMATE CHANGE SCIENCE PROGRAM 26 Synthesis and Assessment Product 4.5 27
28 29 30
31 32
November 30, 2006 33 34 35
Synthesis and Assessment Product 4.5 Public Comments Draft – November 2006
iii
TABLE OF CONTENTS 1 2 3 Page 4 5 Preface (To Be Added) .................................................................................................... vii 6
7
Summary......................................................................................................................... viii 8
9
CHAPTER 1: INTRODUCTION....................................................................................1 10
11
1.1 Background ............................................................................................................2 12
13
1.2 The Topic of this Synthesis and Assessment Report...........................................3 14
15
1.3 Previous Assessments of This Topic .....................................................................4 16
17
1.4 How the Report Was Developed ...........................................................................5 18
19
1.5 How to Use This Report ........................................................................................6 20
21
CHAPTER 2: EFFECTS OF CLIMATE CHANGE ON ENERGY USE IN THE 22 UNITED STATES..............................................................................................................8 23 24
2.1 Introduction ...........................................................................................................8 25
26
2.2 Energy Consumption in Buildings .......................................................................9 27
28
2.3 Effects of Climate Warming on Energy Use for Space Heating ......................16 29
2.3.1 Residential Space Heating ...........................................................................16 30
2.3.2 Commercial Space Heating..........................................................................19 31
32
2. 4 Effects of Climate Warming on Energy Use for Space Cooling ......................20 33
2.4.1 Residential Space Cooling ..........................................................................20 34
Synthesis and Assessment Product 4.5 Public Comments Draft – November 2006
iv
2.4.2 Commercial Space Cooling ........................................................................ 23 1
2.4.3 Other Considerations: Market Penetration of Air Conditioning, Heat 2 Pumps (All-Electric Heating and Cooling) and Changes In Humidity..................25 3 4
2.5 Overall Effects of Climate Change on Energy Use in Buildings .....................26 5
2.5.1 Annual Consumption .................................................................................26 6
2.5.2 Peak Electricity Consumption......................................................................32 7
8
2.6 Adaptation: Increased Efficiency and Urban Form .........................................36 9
10
2.7 Other Possible Effects, Including Energy Use in Key Sectors .........................38 11
2.7.1 Transportation ..............................................................................................39 12
2.7.2 Construction.................................................................................................41 13
2.7.3 Agriculture ...................................................................................................41 14
15
2.8 Summary of Knowledge About Possible Effects ................................................42 16
17
CHAPTER 3. EFFECTS OF CLIMATE CHANGE ON ENERGY PRODUCTION 18 AND DISTRIBUTION IN THE UNITED STATES.....................................................47 19 20
3.1 Effects on Fossil and Nuclear Energy ................................................................48 21
3.1.1 Thermoelectric Power Generation ................................................................50 22
3.1.2 Energy Resource Production and Delivery..................................................57 23
3.1.3 Transportation of Fuels ................................................................................58 24
3.1.4 Extreme Events ............................................................................................62 25
3.1.5 Adaptation to Extreme Events .....................................................................65 26
27
3.2 Effects on Renewable Energy Production ........................................................66 28
3.2.1 Hydroelectric Power....................................................................................67 29
3.2.2 Biomass Power and Fuels............................................................................70 30
3.2.3 Wind Energy................................................................................................73 31
3.2.4 Solar Energy ................................................................................................75 32
Synthesis and Assessment Product 4.5 Public Comments Draft – November 2006
v
3.2.5 Other Renewable Energy Sources ...............................................................75 1
3.2.6 Summary .....................................................................................................76 2
3
3.3 Effects on Energy Transmission, Distribution, And System Infrastructure ..77 4
3.3.1 Electricity Transmission and Distribution .................................................77 5
3.3.2 Energy Resource Infrastructure .................................................................77 6
3.3.3 Storage and Landing Facilities...................................................................80 7
3.3.4 Infrastructure Planning and Considerations for New Power Plant Siting..80 8
9
3.4 Summary of Knowledge About Possible Effects ...............................................81 10
11
CHAPTER 4. POSSIBLE INDIRECT EFFECTS OF CLIMATE CHANGE ON 12 ENERGY PRODUCTION AND USE IN THE UNITED STATES ............................83 13 14
4.1 Introduction..........................................................................................................83 15
16
4.2 Current Knowledge About Indirect Effects ......................................................84 17
4.2.1 Possible Effects on Energy Planning ...........................................................84 18
4.2.2 Possible Effects on Energy Production and Use Technologies ...................88 19
4.2.3 Possible Effects on Energy Production and Use Institutions.......................90 20
4.2.3.1 Effects on the Institutional Structure of the Energy Industry .........90 21
4.2.3.2 Effects on Electric Utility Restructuring.........................................91 22
4.2.3.3 Effects on the Health of Fossil Fuel-Related Industries..................91 23
4.2.3.4 Effects on Other Supporting Institutions ........................................92 24
25 4.3 Possible Effects on Energy-Related Dimensions of Regional And National 26
Economies .............................................................................................................92 27 28
4.4 Possible Relationships with Other Energy-Related Issues ..................................95 29
4.4.1 Effects of Climate Change in Other Countries on U.S. Energy Production 30
and Use ..................................................................................................................95 31
4.4.2 Effects of Climate Change on Energy Prices...............................................96 32
4.4.3 Effects of Climate Change on Environmental Emissions............................97 33
Synthesis and Assessment Product 4.5 Public Comments Draft – November 2006
vi
4.4.4 Effects of Climate Change on Energy Security ..........................................97 1
4.4.5 Effects of Climate Change on Energy Technology and Service Exports ...98 2
3
4.5 Summary of Knowledge about Indirect Effects ................................................98 4
5
CHAPTER 5: CONCLUSIONS AND RESEARCH PRIORITIES .........................100 6
7
5.1 Introduction........................................................................................................100 8
5.2 Conclusions about Effects .................................................................................101 9
5.3 Considering Prospects for Adaptation.............................................................105 10
5.4 Needs for Expanding the Knowledge Base ......................................................108 11
5.4.1 General Needs.............................................................................................108 12
5.4.2 Needs Related to Major Technology Areas ................................................110 13
14
REFERENCES...............................................................................................................111 15
16
ANNEXES (To be added) ..................................................................................................... 17
a. Organizations and Individuals Consulted ................................................126 18
b. Glossary ...................................................................................................127 19
c. List of Acronyms .....................................................................................128 20
21
22 23 24

Synthesis and Assessment Product 4.5 Public Comments Draft – November 2006
vii
PREFACE 1 2
(To be added) 3
Synthesis and Assessment Product 4.5 Public Comments Draft – November 2006
viii
SUMMARY 1 2 3
Climate change is expected to have noticeable effects in the United States: a rise in 4
average temperatures in most regions, changes in precipitation amounts and seasonal 5
patterns in many regions, changes in the intensity and pattern of extreme weather events, 6
and sea level rise. Some of these effects have clear implications for energy production 7
and use. For instance, average warming can be expected to increase energy requirements 8
for cooling and reduce energy requirements for warming. Changes in precipitation could 9
affect prospects for hydropower, positively or negatively. Increases in storm intensity 10
could threaten further disruptions of the sorts experienced in 2005 with Hurricane 11
Katrina. Concerns about climate change impacts could change perceptions and 12
valuations of energy technology alternatives. Any or all of these types of effects could 13
have very real meaning for energy policies, decisions, and institutions in the United 14
States, affecting discussions of courses of action and appropriate strategies for risk 15
management. 16
17
This report summarizes what is currently known about effects of climate change on 18
energy production and use in the United States. It focuses on three questions, which are 19
listed below along with general short answers to each. Generally, it is important to be 20
careful about answering these questions, for two reasons. One reason is that the available 21
research literatures on many of the key issues are limited, supporting a discussion of 22
issues but not definite conclusions about answers. A second reason is that, as with many 23
other categories of climate change effects in the U.S., the effects depend on more than 24
climate change alone, such as patterns of economic growth and land use, patterns of 25
population growth and distribution, technological change, and social and cultural trends 26
that could shape policies and actions, individually and institutionally. 27
28
The report concludes that, based on what we know now, there are reasons to pay close 29
attention to possible climate change impacts on energy production and use and to 30
consider ways to adapt to possible adverse impacts and take advantage of possible 31
Synthesis and Assessment Product 4.5 Public Comments Draft – November 2006
ix
positive impacts. Although the report includes considerably more detail, here are the 1
three questions along with a brief summary of the answers: 2
3
• How might climate change affect energy consumption in the United States? The 4
research evidence is relatively clear that climate warming will mean reductions in 5
total U.S. heating requirements and increases in total cooling requirements for 6
buildings. These changes will vary by region and by season, but they will affect 7
household and business energy costs and their demands on energy supply 8
institutions. In general, the changes imply increased demands for electricity, 9
which supplies virtually all cooling energy services but only some heating 10
services. Other effects on energy consumption are less clear. 11
12
• How might climate change affect energy production and supply in the United 13
States? The research evidence about effects is not as strong as for energy 14
consumption, but climate change could affect energy production and supply (a) if 15
extreme weather events become more intense, (b) where regions dependent on 16
water supplies for hydropower and/or thermal power plant cooling face reductions 17
in water supplies, (c) where temperature increases decrease overall thermoelectric 18
power generation efficiencies, and (d) where changed conditions affect facility 19
siting decisions. Most effects are likely to be modest except for possible regional 20
effects of extreme weather events and water shortages. 21
22
• How might climate change have other effects that indirectly shape energy 23
production and consumption in the United States? The research evidence about 24
indirect effects ranges from abundant information about possible effects of 25
climate change policies on energy technology choices to extremely limited 26
information about such issues as effects on energy prices or energy security. 27
Based on this mixed evidence, it appears that climate change is likely to affect 28
risk management in the investment behavior of some energy institutions, and it is 29
very likely to have some effects on energy technology R&D investments and 30
energy resource and technology choices. In addition, climate change can be 31
Synthesis and Assessment Product 4.5 Public Comments Draft – November 2006
x
expected to affect other countries in ways that in turn affect U.S. energy 1
conditions through their participation in global and hemispheric energy markets, 2
and climate change concerns could interact with some driving forces behind 3
policies focused on U.S. energy security. 4
5
Because of the lack of research to date, prospects for adaptation to climate change effects 6
by energy providers, energy users, and society at large are speculative, although the 7
potentials are considerable. It is possible that the greatest challenges would be in 8
connection with possible increases in the intensity of extreme weather events and 9
possible significant changes in regional water supply regimes. But adaptation prospects 10
depend considerably on the availability of information about possible climate change 11
effects to inform decisions about adaptive management, along with technological change 12
in the longer term. 13
14
Given that the current knowledge base is so limited, this suggests that expanding the 15
knowledge base is important to energy users and providers in the United States. Needs 16
for such research – which should be seen as a broad-based collaboration among federal 17
and state governments, industry, non-governmental institutions, and academia – are 18
identified in the report. 19
20
Synthesis and Assessment Product 4.5 Public Comments Draft – November 2006
1
CHAPTER 1. INTRODUCTION 1 2
3 As a major expression of its objective to provide the best possible scientific information 4
to support decision-making and public discussion on key climate-related issues, the U.S. 5
Climate Change Science Program (CCSP) has commissioned 21 “synthesis and 6
assessment products” (SAPs) to summarize current knowledge and identify priorities for 7
research, observation, and decision support in order to strengthen contributions by 8
climate change science to climate change related decisions. 9
10
These reports arise from the five goals of CCSP (http://www.climatescience.gov), the 11
fourth of which is to “understand the sensitivity and adaptability of different natural and 12
managed ecosystems and human systems to climate and related global changes.” One of 13
the seven SAPs related to this particular goal is concerned with analyses of the effects of 14
global change on energy production and use (SAP 4.5). The resulting SAP, this report, 15
has been titled “Effects of Climate Change on Energy Production and Use in the United 16
States.” 17
18
This topic is relevant to policy-makers and other decision-makers because most 19
discussions to date of relationships between the energy sector and responses to concerns 20
about climate have been very largely concerned with roles of energy production and use 21
in climate change mitigation. Along with these roles of the energy sector as a driver of 22
climate change, the energy sector is also subject to effects of climate change; and these 23
possible effects – along with adaptation strategies to reduce any potential negative costs 24
from them – have received much less attention. For instance, the U.S. National 25
Assessment of Possible Consequences of Climate Variability and Change (NACC, 2001) 26
considered effects on five sectors, such as water and health; but energy was not one of 27
those sectors, even though the Global Change Research Act of 1990 had listed energy as 28
one of several sectors of particular interest. 29
30
Because the topic has not been a high priority for research support and institutional 31
analysis, the formal knowledge base is in many ways limited. As a starting point for 32
Synthesis and Assessment Product 4.5 Public Comments Draft – November 2006
2
discussion, this product compiles and reports what is known about likely or possible 1
effects of climate change on energy production and use in the United States, within a 2
more comprehensive framework for thought about this topic, and it identifies priorities 3
for expanding the knowledge base to meet needs of key decision-makers. 4
5
1.1 BACKGROUND 6
7
Climate change is expected to have certain effects in the United States: a rise in average 8
temperatures in most regions, changes in precipitation amounts and seasonal patterns in 9
many regions, changes in the intensity and pattern of extreme weather events, and sea 10
level rise [(IPCC, 2001a; NACC, 2001; also see other SAPs, including 2.1b and 3.2)]. 11
12
Some of these effects have clear implications for energy production and use. For 13
instance, average warming can be expected to increase energy requirements for cooling 14
and reduce energy requirements for warming. Changes in precipitation patterns and 15
amounts could affect prospects for hydropower, positively or negatively. Increases in 16
storm intensity could threaten further disruptions of the sorts experienced in 2005 with 17
Hurricanes Katrina and Rita. Concerns about climate change impacts could change 18
perceptions and valuations of energy technology alternatives. Any or all of these types of 19
effects could have very real meaning for energy policies, decisions, and institutions in the 20
United States, affecting discussions of courses of action and appropriate strategies for 21
risk management. 22
23
According to CCSP, an SAP has three end uses: (1) informing the evolution of the 24
research agenda; (2) supporting adaptive management and planning; and (3) supporting 25
policy formulation. This product will inform policymakers, stakeholders, and the general 26
public about issues associated with climate change implications for energy production 27
and use in the United States, increase awareness of what is known and not yet known, 28
and support discussions of technology and policy options at a stage where the knowledge 29
base is still at an early stage of development. 30
Synthesis and Assessment Product 4.5 Public Comments Draft – November 2006
3
1
The central questions addressed by SAP 4.5 are: 2
3
• How might climate change affect energy consumption in the United States? 4
5
• How might climate change affect energy production and supply in the United 6
States? 7
8
• How might climate change affect various contexts that indirectly shape energy 9
production and consumption in the United States, such as energy technologies, 10
energy institutions, regional economic growth, energy prices, energy security, and 11
environmental emissions? 12
13
SAP 4.5 is to be completed by the end of the second quarter of CY 2007 (June 30, 2007), 14
following a number of steps required for all SAPs in scoping the study, conducting it, and 15
reviewing it at several stages (see the section below on How the Report Was Developed). 16
17
1.2 THE TOPIC OF THIS SYNTHESIS AND ASSESSMENT 18 REPORT 19
20
This report summarizes the current knowledge base about possible effects of climate 21
change on energy production and use in the United States as a contributor to further 22
studies of the broader topic of effects of global change on energy production and use. It 23
also identifies where research could reduce uncertainties about vulnerabilities, possible 24
effects, and possible strategies to reduce negative effects and increase adaptive capacity 25
and considers priorities for strengthening the knowledge base. As is the case for most of 26
the SAPs, it does not include new analyses of data, new scenarios of climate change or 27
impacts, or other new contributions to the knowledge base, although its presentation of a 28
framework for thought about energy sector impacts is in many ways new. 29
30
As indicated above, the content of SAP 4.5 includes attention to the following issues: 31
32
Synthesis and Assessment Product 4.5 Public Comments Draft – November 2006
4
• Possible effects (both positive and negative) of climate change on energy 1
consumption in the United States (Chapter 2) 2
3
• Possible effects (both positive and negative) on energy production and supply in 4
the United States (Chapter 3) 5
6
• Possible indirect effects on energy consumption and production (Chapter 4) 7
8
These chapters are followed by a final chapter which provides conclusions about what is 9
currently known, prospects for adaptation, and priorities for improving the knowledge 10
base. 11
12
1.3 PREVIOUS ASSESSMENTS OF THIS TOPIC 13
14
As mentioned on page 1, unlike some of the other sectoral assessment areas identified in 15
the Global Change Research Act of 1990—such as agriculture, water, and human 16
health—energy was not the subject of a sectoral assessment in the National Assessment of 17
Possible Consequences of Climate Variability and Change, completed in 2001 (NACC, 18
2001). As a result, SAP 4.5 draws upon a less organized knowledge base than these other 19
sectoral impact areas. On the other hand, by addressing an assessment area not covered in 20
the initial national assessment, SAP 4.5 will provide new information and perspectives. 21
22
The subject matter associated with SAP 4.5 is incorporated in two chapters of the 23
Working Group II contribution to the Intergovernmental Panel on Climate Change 24
(IPCC) Fourth Assessment Report (Impacts, Adaptation, and Vulnerability), scheduled 25
for completion in 2007. Chapter 7, “Industry, Settlement, and Society,” section 7.4.2.1, 26
is briefly summarizing the global knowledge base about possible impacts of climate 27
change on energy production and use, reporting relevant research from the United States 28
but not assessing impacts on the United States. Chapter 14, “North America,” is 29
summarizing the knowledge base about possible impacts of climate change in this 30
continent, including the U.S., in sections 14.2.8 and 14.4.8. 31
Synthesis and Assessment Product 4.5 Public Comments Draft – November 2006
5
1
1.4 HOW THE REPORT WAS DEVELOPED 2
3
SAPs are developed according to guidelines established by CCSP based on processes that 4
are open and public. These processes include a number of steps before approval to 5
proceed, emphasizing both stakeholder participation and CCSP reviews of a formal 6
prospectus for the report, a number of review steps including both expert reviewers and 7
public comments, and final reviews by the CCSP Interagency Committee and the 8
National Science and Technology Council (NSTC). 9
10
The process for producing the report was focused on a survey and assessment of the 11
available literature, in many cases including documents that were not peer-reviewed but 12
the authors determined to be valid. using established analytic-deliberative practices. It 13
included identification and consideration of relevant studies carried out in connection 14
with CCSP, the Climate Change Technology Program (CCTP), and other programs of 15
CCSP agencies (e.g., the Energy Information Administration), and consultation with 16
stakeholders such as the electric utility and energy industries, environmental non-17
governmental organizations, and the academic research community to determine what 18
analyses have been conducted and reports have been issued. Where quantitative research 19
results are limited, the process considers the degree to which qualitative statements of 20
possible effects may be valid as outcomes of expert deliberation, utilizing the extensive 21
review processes built into the SAP process to contribute to judgments about the validity 22
of the statements. 23
24
SAP 4.5 is authored by staff from the DOE national laboratories, drawing on their own 25
expertise and knowledge bases and also upon other knowledge bases, including those 26
within energy corporations and utilities, consulting firms, non-governmental 27
organizations, state and local governments, and the academic research community. DOE 28
has assured that authorship by DOE national laboratory staff will in no way exclude any 29
relevant research or knowledge, and every effort is being made to identify and utilize all 30
Synthesis and Assessment Product 4.5 Public Comments Draft – November 2006
6
relevant expertise, materials, and other sources. For the author team of SAP 4.5, see Box 1
1.1. 2
3
Box 1.1. SAP 4.5 Author Team
Thomas J. Wilbanks Oak Ridge National Laboratory, Coordinator Vatsal Bhatt Brookhaven National Laboratory Daniel E. Bilello National Renewable Energy Laboratory Stanley R. Bull National Renewable Energy Laboratory James Ekmann National Energy Technology Laboratory William C. Horak Brookhaven National Laboratory Y. Joe Huang Lawrence Berkeley National Laboratory Mark D. Levine Lawrence Berkeley National Laboratory Michael J. Sale Oak Ridge National Laboratory David K. Schmalzer Argonne National Laboratory Michael J. Scott Pacific Northwest National Laboratory Sherry B. Wright Oak Ridge National Laboratory,
Administrative Coordinator
4
Stakeholders participated during the scoping process, have provided comments on the 5
prospectus, and will submit comments on the product during a public comment period, as 6
well as other comments via the SAP 4.5 web site. The development of SAP 4.5 has 7
included active networking by authors with centers of expertise and stakeholders to 8
assure that the process is fully informed about their knowledge bases and viewpoints. 9
10
1.5 HOW TO USE THIS REPORT 11
12 The audience for SAP 4.5 includes scientists in related fields, decision-makers in the 13
public sector (federal, state, and local governments), the private sector (energy 14
companies, electric utilities, energy equipment providers and vendors, and energy-15
dependent sectors of the economy), energy and environmental policy interest groups, and 16
the general public. Even though this report is unable—based on existing knowledge—to 17
answer all relevant questions that might be asked by these interested parties, the intent is 18
Synthesis and Assessment Product 4.5 Public Comments Draft – November 2006
7
to provide information and perspectives to inform discussions about the issues and to 1
clarify priorities for research to reduce uncertainties in answering key questions. 2
As indicated above, because of limitations in available research literatures, in some cases 3
the report is only able to characterize categories of possible effects without evaluating 4
what the effects are likely to be. In other cases, the report offers preliminary judgments 5
about effects, related to degrees of likelihood: likely (2 chances out of 3), very likely (9 6
chances out of 10), or virtually certain (99 chances out of 100). 7
8
This report avoids the use of highly technical terminology, but a glossary and list of 9
acronyms are included at the end of the report (to be completed). 10
11 12
Synthesis and Assessment Product 4.5 Public Comments Draft – November 2006
8
1 CHAPTER 2. EFFECTS OF CLIMATE CHANGE ON 2
ENERGY USE IN THE UNITED STATES 3 4
Michael J. Scott, Pacific Northwest National Laboratory 5 Y. Joe Huang, Lawrence Berkeley National Laboratory 6
7 8
2.1 INTRODUCTION 9
10
As the climate of the world warms, the consumption of energy in climate-sensitive 11
sectors is likely to change. Possible effects include: 1) decreases in the amount of 12
energy consumed in residential, commercial, and industrial buildings for space heating 13
and increases for space cooling; 2) decreases in energy used directly in certain processes 14
such as residential, commercial, and industrial water heating, and increases in energy 15
used for residential and commercial refrigeration, and industrial process cooling (e.g., in 16
thermal power plants or steel mills); 3) increases in energy used to supply other resources 17
for climate-sensitive processes, such as pumping water for irrigated agriculture and 18
municipal uses; 4) changes in the balance of energy use among delivery forms and fuel 19
types, as between electricity used for air conditioning and natural gas used for heating; 20
and 5) changes in energy consumption in key climate-sensitive sectors of the economy, 21
such as transportation, construction, agriculture, and others. 22
23
In the United States, some of these effects of climate change on energy consumption have 24
been studied to the extent that there is a body of literature with empirical results. This is 25
the case with energy demand in residential and commercial buildings, where studies of 26
the effects of climate change have been occurring for about 20 years. There is very little 27
literature for any of the other effects mentioned above. 28
29
This chapter summarizes current knowledge concerning potential effects of climate 30
change on energy demand in the United States. The chapter mainly focuses on the effects 31
of climate change on energy consumption in buildings (including mainly space heating 32
and space cooling, but also addressing net energy use, peak loads, and adaptation) The 33
Synthesis and Assessment Product 4.5 Public Comments Draft – November 2006
9
chapter briefly address impacts of climate change on energy use in other sectors, 1
including transportation, construction, and agriculture, for which empirical studies are far 2
less available. The final section presents conclusions and issues for future research. 3
4
2.2 ENERGY CONSUMPTION IN BUILDINGS 5
6
U.S. residential and commercial buildings currently use about 20 quadrillion Btus (quads) 7
of delivered energy per year (about 38 quads of primary energy, allowing for electricity 8
related losses). This energy consumption accounts directly or indirectly for 0.6 GT of 9
carbon emitted to the atmosphere (38% of U.S. total emissions of 1.6 GT and 10
approximately 9% of the world fossil-fuel related anthropogenic emissions of 6.7 GT 11
(EIA, 2006). The U.S. Energy Information Administration (EIA) has projected that 12
residential and commercial consumption of delivered energy would increase to 26 quads 13
(53 quads primary) and corresponding carbon emissions to 0.9 GT by the year 2030 (EIA 14
2006). However, these routine EIA projections do not account for the effects any 15
temperature increases on building energy use that occur as a result of global warming, 16
nor do they account for consumer reactions to a warmer climate. 17
18
To perform an assessment of the impact of climate change on energy demand, it is 19
helpful to have as context a set of climate scenarios. The Intergovernmental Panel on 20
Climate Change (IPCC) projected in 2001 that climate could warm relative to 1990 by 21
0.4˚C to 1.2˚C by the year 2030 and by 1.4˚C to 5.8˚C by the end of the 21st century 22
(Cubasch et al., 2001). Although additional scenario work has been done since then by 23
the IPCC, it is not yet published, so we have adopted the 2001 projections for this 24
chapter. In particular, Ruosteenoja et al. (2003) performed a reanalysis of the seventeen 25
2001 IPCC climate simulations by seven different climate models at the regional level. 26
Their results for the United States are reported for three sub-regions, four seasons, and 27
three major time steps, as summarized in Table 2.1. While this is not the only set of 28
climate scenarios available, and while the energy calculations in this chapter often used 29
other scenarios, Table 2.1 broadly characterizes the range of average temperature 30
31

Synthesis and Assessment Product 4.5 Public Comments Draft – November 2006
10
Table 2.1. Seasonal Temperature Increases For Three U.S. Regions In ˚C In Winter 1 (DJF), Spring (MAM), Summer (JJA), And Fall (SON). Derived From Ruosteenoja 2 et al. (2003). 3 4
Time Step 2010-2039 (2020) 2040-2069 (2050) 2070-2099 (2080) Region and
Season Median Range Median Range Median Range Western U.S. -DJF 1.6 0.5-2.4 2.3 1.0-4.2 4.1 2.0-7.6 -MAM 1.4 0.5-1.9 2.5 1.1-4.1 3.8 1.0-7.6 -JJA 1.8 0.8-2.6 2.8 1.7-5.2 4.2 2.8-9.1 -SON 1.3 0.5-2.1 2.8 1.4-4.6 3.9 1.6-8.0 Central U.S -DJF 1.6 0.0-2.6 3.0 1.2-4.5 4.2 1.9-7.9 -MAM 1.8 0.5-2.8 2.9 1.2-5.1 4.4 1.9-8.0 -JJA 1.8 0.9-2.2 3.0 1.5-5.4 4.4 1.9-8.5 -SON 1.3 0.4-2.3 2.8 1.2-5.0 4.1 1.8-8.8 Eastern U.S. -DJF 1.8 0.4-2.6 2.6 1.4-5.8 4.6 2.2-10.2 -MAM 1.7 0.6-3.2 2.7 1.4-6.0 4.4 1.9-9.6 -JJA 1.6 0.8-1.9 2.8 1.4-5.5 4.2 1.8-8.6 -SON 1.5 0.6-2.3 2.8 1.4-5.4 4.0 1.8-9.0 5 6
changes that might occur in the United States in the 21st century and can provide context 7
for the various energy impact analyses that have been done. 8
9
Approximately 20 studies have been done since about 1990 concerning the effect of 10
projected climate change on energy consumption in residential and commercial buildings 11
in the United States. Some of these studies concern particular states or regions, and the 12
impacts estimated depend crucially on local conditions. 13
14
Some of the studies analyze only electricity, which is the likeliest form of energy to 15
suffer adverse impacts. Almost all of the studies show both an increase in electricity 16
consumption and an increase in the consumption of primary fuels used to generate it, 17
except in the few regions that provide space heating with electricity (for example, the 18
Pacific Northwest). 19
20
Synthesis and Assessment Product 4.5 Public Comments Draft – November 2006
11
The few studies that examine effects on peak electricity demand emphasize that increases 1
in peak demand would cause disproportionate increases in energy infrastructure 2
investment. 3
4
Some studies provide demand estimates for heating fuels such as natural gas and distillate 5
fuel oil in addition to electricity. These all-fuels studies provide empirical support for the 6
idea that climate warming causes significant decreases in space heating; however, 7
whether energy savings in heating fuels offset increases in energy demand for cooling 8
depends on the initial balance of energy consumption between heating and cooling, 9
which in turn depends upon geography. Empirical studies show that the overall effect is 10
more likely to be a significant net savings in delivered energy consumption in northern 11
parts of the country (those with more than 4,000 heating degree-days per year) and a 12
significant net increase in energy consumption in the south for both residential and 13
commercial buildings, with the national balance slightly favoring net savings of delivered 14
energy, 15
16
Empirical studies vary in their treatment of the expected demographic shifts in the United 17
States, expected evolution of building stock, and consumer reaction to warmer 18
temperatures. Roughly half of the studies use building energy simulation models and 19
account explicitly for the current trend in U.S. population moving toward the south and 20
west, as well as increases in square footage per capita in newer buildings, and increases 21
in market penetration of air conditioning in newer buildings (See the Appendix at the end 22
of this chapter on methods). However, they do not include consumer reactions to 23
warming itself. For example, the market penetration of air conditioning is not directly 24
influenced by warming in these studies. The other half of the studies uses econometric 25
modeling of energy consumption choices. Many of these studies emphasize that the 26
responsiveness of climate change of energy use to climate change (elasticity) is greater in 27
the long-run than in short run—for example, consumers not only run their air 28
conditioners more often in response to higher temperatures, but may also adopt air 29
conditioning for the first time in regions such as New England, which still feature 30
relatively low market penetration of air conditioning. Commercial building designs may 31
Synthesis and Assessment Product 4.5 Public Comments Draft – November 2006
12
evolve to reduce the need for heating by making better use of internal energy gains and 1
warmer weather. Rising costs of space conditioning could modify the current trend in 2
floorspace per capita. Most econometric studies of building energy consumption estimate 3
effects like this statistically from databases on existing buildings such as the Energy 4
Information Administration’s (EIA’s) Residential Energy Consumption Survey (RECS) 5
(EIA 2001b) and Commercial Building Energy Consumption Survey (CBECS) (EIA, 6
2003b). 7
8
When losses in energy conversion and delivery of electricity are taken into account, 9
primary energy consumption (source energy) at the national level increases in some 10
studies and decreases in others, with the balance of studies projecting a net increase in 11
primary energy consumption. When the higher costs per delivered Btu of electricity are 12
taken into account, the national-level consumer expenditures on energy increase in some 13
studies and decrease in others, with the balance of studies favoring an increase in 14
expenditures. 15
16
The various studies include a range of climate warming scenarios as well as different 17
time frames and methods. Table 2.2 summarizes the main qualitative conclusions that can 18
be drawn from an overview of this literature concerning the marginal effect of climate 19
warming on energy use in buildings. These effects are discussed further in Sections 2.3 20
through 2.5. 21
22
The net impact of climate warming on the consumption of delivered heating fuel and 23
electricity is that for regions with more than about 4000 heating degree-days Fahrenheit 24
(EIA Climate Zones 1-3, roughly the dividing line between "north" and "south" in most 25
national studies—see Figure 2.1) is that climate warming tends to reduce consumption of 26
heating fuel more than it increases the consumption of electricity (e.g. Hadley et al. 2004, 27
2006). The reverse is true south of that line. By coincidence, the national gains and 28
losses in delivered energy approximately balance. The existing studies do not agree on 29
whether there is small increase or decrease. The picture is different for primary energy 30
and carbon dioxide. Because the generation, transmission, and distribution of electricity 31

Synthesis and Assessment Product 4.5 Public Comments Draft – November 2006
13
Table 2.2. Summary of Qualitative Effects of Global Warming on Energy 1 Consumption in the United States 2 3
Sector National Effects Regional Effects Other Effects Comments Residential and Commercial Buildings Annual Energy Use
Slight decrease or increase in net annual delivered energy; Likely net increase in primary energy
Space heating savings dominate in North; space cooling increases dominate in South
Overall increase in carbon emissions
Studies agree on the direction of regional effects; national direction varies with the study
Peak Electricity Consumption
Probable increase Increase in summer peaking regions; probable decline in winter peaking regions
Increase in carbon emissions
Most regions are summer-peaking due to air conditioning
Market Penetration of Energy-Using Equipment
Increase in market penetration of air conditioning
Air conditioning market share increases primarily in North
--
Very few studies. Strength of the effect is not clear.
4
is subject to significant energy losses, national primary energy demand tends to increase 5
with warmer temperatures. Finally, because electricity is about 50% generated with coal, 6
which is a high-carbon fuel, and about 3.2 Btu of primary energy are consumed for every 7
Btu of delivered electricity (EIA, 2006), carbon dioxide emissions also tend to increase. 8
The extent of this national shift in energy use is expected to depend in part on the 9
strength of residential adoption of air conditioning as the length of the air conditioning 10
season and the warmth of summer increases in the north, where the market penetration of 11
air conditioning is still relatively low. The potential reaction of consumers to a longer 12
and more intense cooling season in the future has been addressed in only a handful of 13
studies (e.g., Sailor and Pavlova, 2003) and must be considered highly uncertain. There 14
is even less information available on the offsetting effects of adaptations such as 15
improved energy efficiency or changes in urban form that might reduce exacerbating 16
factors such as urban heat island effects. 17
18
Box 2.1 provides insight into the recent trends in the intensity of energy consumption in 19
residential and commercial buildings in the United States. There are a number of 20
underlying trends, such as an ongoing population shift to the South and West, increases in 21
the floor space per building occupant in both the residential and commercial sectors, and 22
23
Synthesis and Assessment Product 4.5 Public Comments Draft – November 2006
14
1 2
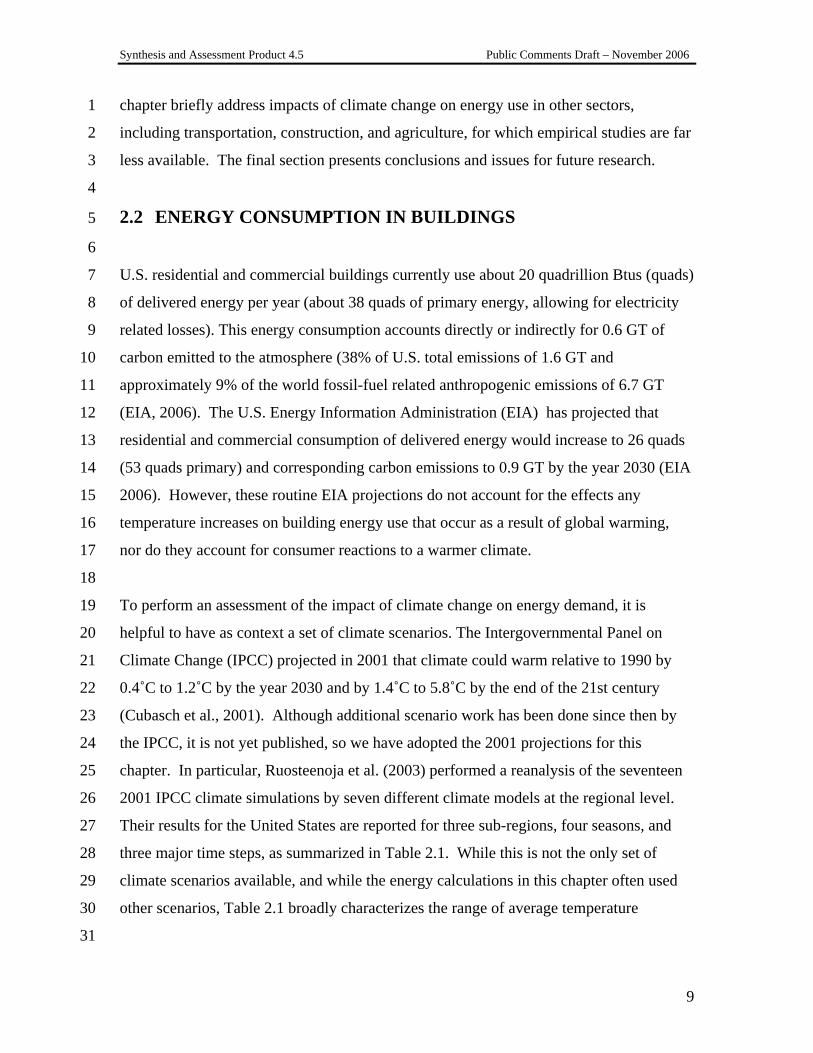
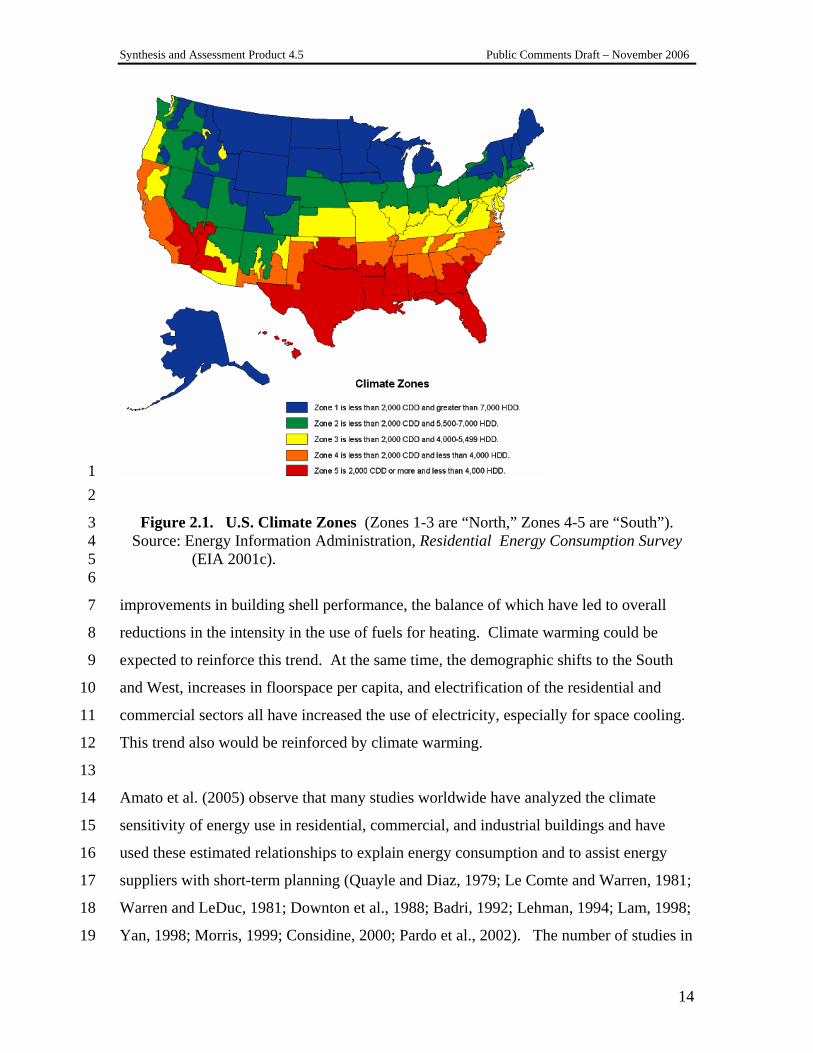
Figure 2.1. U.S. Climate Zones (Zones 1-3 are “North,” Zones 4-5 are “South”). 3 Source: Energy Information Administration, Residential Energy Consumption Survey 4
(EIA 2001c). http://www.eia.doe.gov/emeu/recs/climate_zone.html 5 6
improvements in building shell performance, the balance of which have led to overall 7
reductions in the intensity in the use of fuels for heating. Climate warming could be 8
expected to reinforce this trend. At the same time, the demographic shifts to the South 9
and West, increases in floorspace per capita, and electrification of the residential and 10
commercial sectors all have increased the use of electricity, especially for space cooling. 11
This trend also would be reinforced by climate warming. 12
13
Amato et al. (2005) observe that many studies worldwide have analyzed the climate 14
sensitivity of energy use in residential, commercial, and industrial buildings and have 15
used these estimated relationships to explain energy consumption and to assist energy 16
suppliers with short-term planning (Quayle and Diaz, 1979; Le Comte and Warren, 1981; 17
Warren and LeDuc, 1981; Downton et al., 1988; Badri, 1992; Lehman, 1994; Lam, 1998; 18
Yan, 1998; Morris, 1999; Considine, 2000; Pardo et al., 2002). The number of studies in 19
Synthesis and Assessment Product 4.5 Public Comments Draft – November 2006
15
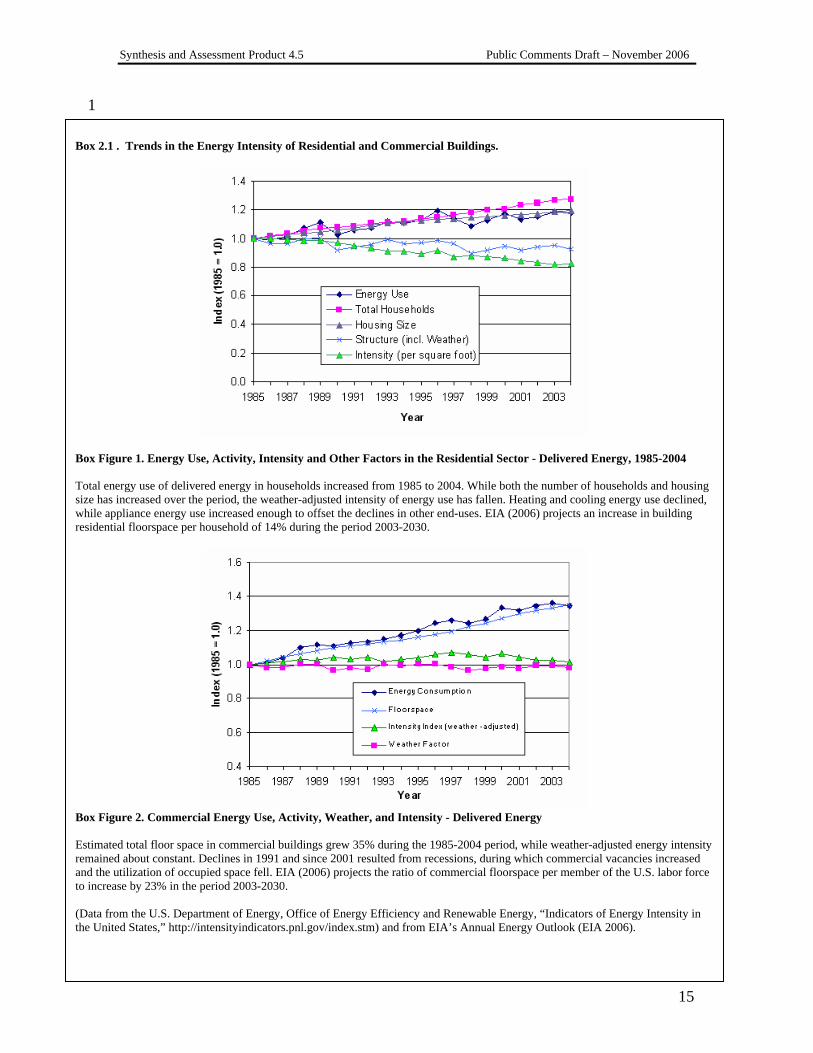
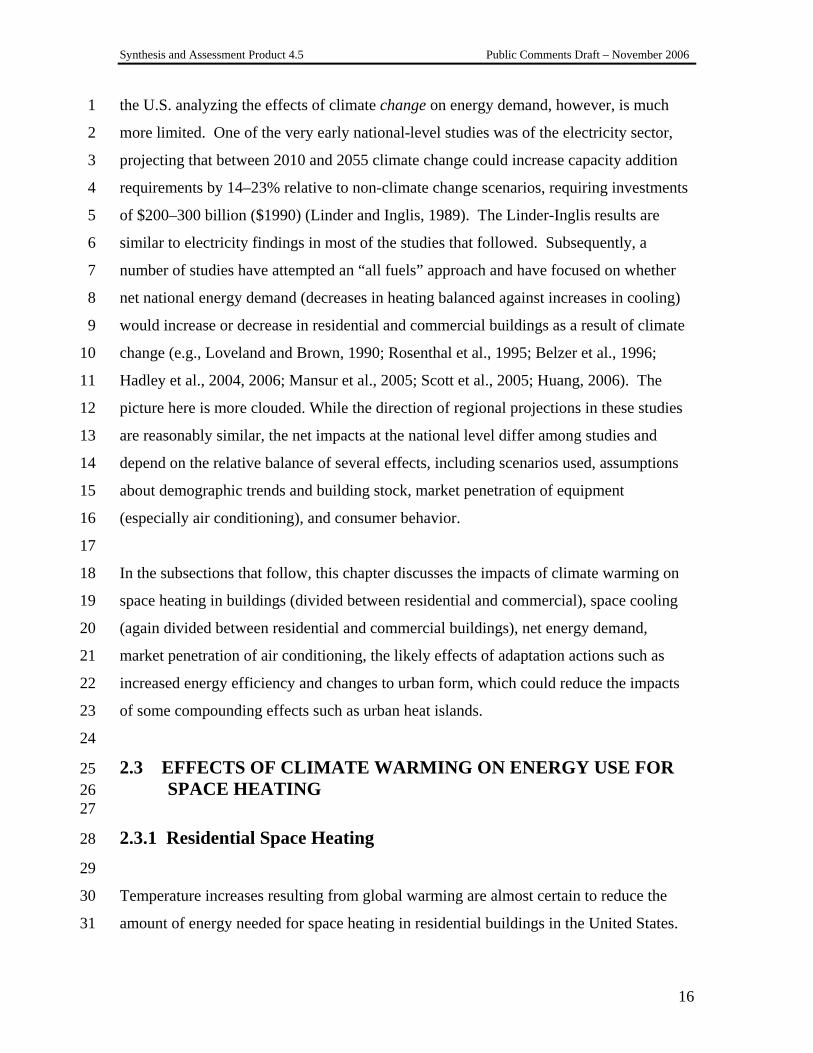
1 Box 2.1 . Trends in the Energy Intensity of Residential and Commercial Buildings.
Box Figure 1. Energy Use, Activity, Intensity and Other Factors in the Residential Sector - Delivered Energy, 1985-2004 Total energy use of delivered energy in households increased from 1985 to 2004. While both the number of households and housing size has increased over the period, the weather-adjusted intensity of energy use has fallen. Heating and cooling energy use declined, while appliance energy use increased enough to offset the declines in other end-uses. EIA (2006) projects an increase in building residential floorspace per household of 14% during the period 2003-2030.
Box Figure 2. Commercial Energy Use, Activity, Weather, and Intensity - Delivered Energy Estimated total floor space in commercial buildings grew 35% during the 1985-2004 period, while weather-adjusted energy intensity remained about constant. Declines in 1991 and since 2001 resulted from recessions, during which commercial vacancies increased and the utilization of occupied space fell. EIA (2006) projects the ratio of commercial floorspace per member of the U.S. labor force to increase by 23% in the period 2003-2030. (Data from the U.S. Department of Energy, Office of Energy Efficiency and Renewable Energy, “Indicators of Energy Intensity in the United States,” http://intensityindicators.pnl.gov/index.stm) and from EIA’s Annual Energy Outlook (EIA 2006).
Synthesis and Assessment Product 4.5 Public Comments Draft – November 2006
16
the U.S. analyzing the effects of climate change on energy demand, however, is much 1
more limited. One of the very early national-level studies was of the electricity sector, 2
projecting that between 2010 and 2055 climate change could increase capacity addition 3
requirements by 14–23% relative to non-climate change scenarios, requiring investments 4
of $200–300 billion ($1990) (Linder and Inglis, 1989). The Linder-Inglis results are 5
similar to electricity findings in most of the studies that followed. Subsequently, a 6
number of studies have attempted an “all fuels” approach and have focused on whether 7
net national energy demand (decreases in heating balanced against increases in cooling) 8
would increase or decrease in residential and commercial buildings as a result of climate 9
change (e.g., Loveland and Brown, 1990; Rosenthal et al., 1995; Belzer et al., 1996; 10
Hadley et al., 2004, 2006; Mansur et al., 2005; Scott et al., 2005; Huang, 2006). The 11
picture here is more clouded. While the direction of regional projections in these studies 12
are reasonably similar, the net impacts at the national level differ among studies and 13
depend on the relative balance of several effects, including scenarios used, assumptions 14
about demographic trends and building stock, market penetration of equipment 15
(especially air conditioning), and consumer behavior. 16
17
In the subsections that follow, this chapter discusses the impacts of climate warming on 18
space heating in buildings (divided between residential and commercial), space cooling 19
(again divided between residential and commercial buildings), net energy demand, 20
market penetration of air conditioning, the likely effects of adaptation actions such as 21
increased energy efficiency and changes to urban form, which could reduce the impacts 22
of some compounding effects such as urban heat islands. 23
24
2.3 EFFECTS OF CLIMATE WARMING ON ENERGY USE FOR 25 SPACE HEATING 26
27
2.3.1 Residential Space Heating 28
29
Temperature increases resulting from global warming are almost certain to reduce the 30
amount of energy needed for space heating in residential buildings in the United States. 31
Synthesis and Assessment Product 4.5 Public Comments Draft – November 2006
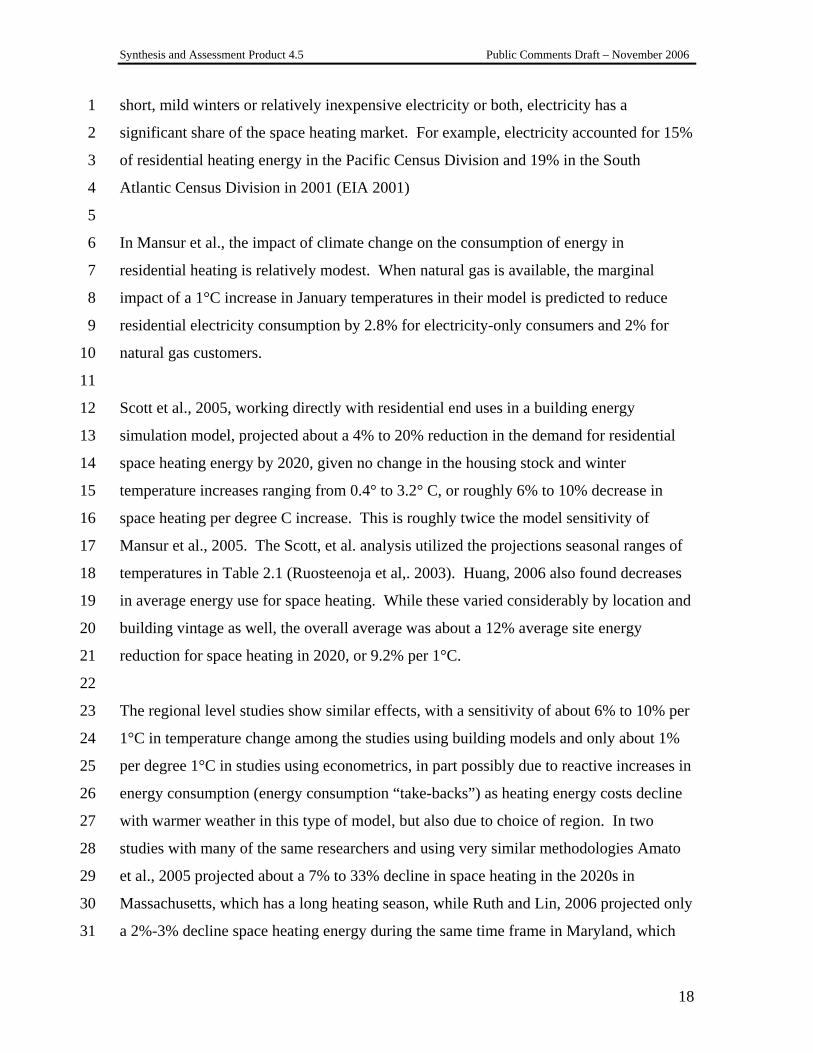
17
The amount of the reduction in projected in U.S. studies has varied, mainly depending on 1
the amount of temperature change in the climate scenario, the calculated sensitivity of the 2
building stock to warming, and the adjustments allowed in the building stock over time 3
(Table 2.3). 4
5
Table 2.3. Effects of Climate Change on Residential Space Heating in U.S. Energy 6 Studies 7 8
Study: Author(s) and Date
Change in Energy Consumption
(%)
Temperature Change (˚C) and Date for Change
National Studies Rosenthal et al 1995 -14% +1°C (2010)
Scott et al. 2005 -4% to -20% +About 1.7°C median (varies from 0.4° to 3.2°C regionally and seasonally) (2020)
Mansur et al. 2005
-2.8% for electricity-only customers; -2% for gas customers; -5.7% for fuel oil customers
+1° C January temperatures (2050)
Huang 2006
varies by loc. and bldg. vintage average HVAC changes: -12% heating in 2020 -24% heating in 2050 -34% heating in 2080
18 US locations, (varies by location, month, and time of day) Average winter temperature increases 1.3° C in 2020 2.6° C in 2050 4.1° C in 2080
Regional Studies Loveland and Brown 1990 -44 to -73% 3.7°C to 4.7°C (Individual Cities) (No
Date Given)
Amato et al 2005 (Massachusetts)
-7 to -14% , natural gas -15 to 20%, fuel oil -15 to -25%, natural gas -15 to -33%, fuel oil
-8.7% in HDD (2020)
-11.5% in HDD (2030)
Ruth and Lin 2006 (Maryland)
-2.5% natural gas
-2.7% fuel oil 1.7°C-2.2°C (2025)
9
In most cases where it is available, the fuel of choice for residential and commercial 10
space heating is natural gas, which is burned directly in a furnace in the building in 11
question. There are some exceptions. In the Northeast, some of these savings will be in 12
fuel oil, since fuel oils still provides about 36 % of residential space heating in that 13
region, according to the 2001 RECS. In some other parts of the country with relatively 14
Synthesis and Assessment Product 4.5 Public Comments Draft – November 2006
18
short, mild winters or relatively inexpensive electricity or both, electricity has a 1
significant share of the space heating market. For example, electricity accounted for 15% 2
of residential heating energy in the Pacific Census Division and 19% in the South 3
Atlantic Census Division in 2001 (EIA 2001) 4
5
In Mansur et al., the impact of climate change on the consumption of energy in 6
residential heating is relatively modest. When natural gas is available, the marginal 7
impact of a 1°C increase in January temperatures in their model is predicted to reduce 8
residential electricity consumption by 2.8% for electricity-only consumers and 2% for 9
natural gas customers. 10
11
Scott et al., 2005, working directly with residential end uses in a building energy 12
simulation model, projected about a 4% to 20% reduction in the demand for residential 13
space heating energy by 2020, given no change in the housing stock and winter 14
temperature increases ranging from 0.4° to 3.2° C, or roughly 6% to 10% decrease in 15
space heating per degree C increase. This is roughly twice the model sensitivity of 16
Mansur et al., 2005. The Scott, et al. analysis utilized the projections seasonal ranges of 17
temperatures in Table 2.1 (Ruosteenoja et al,. 2003). Huang, 2006 also found decreases 18
in average energy use for space heating. While these varied considerably by location and 19
building vintage as well, the overall average was about a 12% average site energy 20
reduction for space heating in 2020, or 9.2% per 1°C. 21
22
The regional level studies show similar effects, with a sensitivity of about 6% to 10% per 23
1°C in temperature change among the studies using building models and only about 1% 24
per degree 1°C in studies using econometrics, in part possibly due to reactive increases in 25
energy consumption (energy consumption “take-backs”) as heating energy costs decline 26
with warmer weather in this type of model, but also due to choice of region. In two 27
studies with many of the same researchers and using very similar methodologies Amato 28
et al., 2005 projected about a 7% to 33% decline in space heating in the 2020s in 29
Massachusetts, which has a long heating season, while Ruth and Lin, 2006 projected only 30
a 2%-3% decline space heating energy during the same time frame in Maryland, which 31
Synthesis and Assessment Product 4.5 Public Comments Draft – November 2006
19
has a much milder heating season and many days where warmer weather would have no 1
impact on heating degree-days or heating demand. 2
3
2.3.2 Commercial Space Heating 4
5
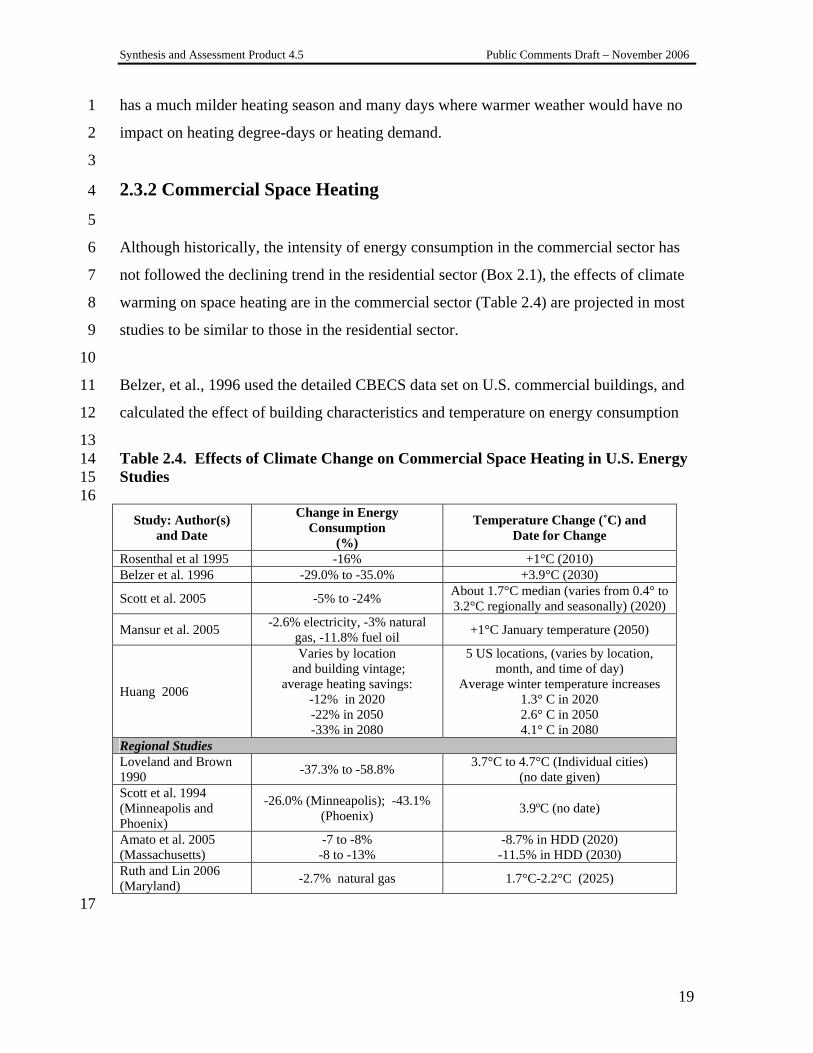
Although historically, the intensity of energy consumption in the commercial sector has 6
not followed the declining trend in the residential sector (Box 2.1), the effects of climate 7
warming on space heating are in the commercial sector (Table 2.4) are projected in most 8
studies to be similar to those in the residential sector. 9
10
Belzer, et al., 1996 used the detailed CBECS data set on U.S. commercial buildings, and 11
calculated the effect of building characteristics and temperature on energy consumption 12
13 Table 2.4. Effects of Climate Change on Commercial Space Heating in U.S. Energy 14 Studies 15 16
Study: Author(s) and Date
Change in Energy Consumption
(%)
Temperature Change (˚C) and Date for Change
Rosenthal et al 1995 -16% +1°C (2010) Belzer et al. 1996 -29.0% to -35.0% +3.9°C (2030)
Scott et al. 2005 -5% to -24% About 1.7°C median (varies from 0.4° to 3.2°C regionally and seasonally) (2020)
Mansur et al. 2005 -2.6% electricity, -3% natural gas, -11.8% fuel oil +1°C January temperature (2050)
Huang 2006
Varies by location and building vintage;
average heating savings: -12% in 2020 -22% in 2050 -33% in 2080
5 US locations, (varies by location, month, and time of day)
Average winter temperature increases 1.3° C in 2020 2.6° C in 2050 4.1° C in 2080
Regional Studies Loveland and Brown 1990 -37.3% to -58.8% 3.7°C to 4.7°C (Individual cities)
(no date given) Scott et al. 1994 (Minneapolis and Phoenix)
-26.0% (Minneapolis); -43.1% (Phoenix) 3.9ºC (no date)
Amato et al. 2005 (Massachusetts)
-7 to -8% -8 to -13%
-8.7% in HDD (2020) -11.5% in HDD (2030)
Ruth and Lin 2006 (Maryland) -2.7% natural gas 1.7°C-2.2°C (2025)
17
Synthesis and Assessment Product 4.5 Public Comments Draft – November 2006
20
in all U.S. commercial buildings. With building equipment and shell efficiencies frozen 1
at 1990 baseline levels and a 3.9°C temperature change, the Belzer model predicted a 2
decrease in annual space heating energy requirements of 29% to 35%, or about 7.4% to 3
9.0% per 1°C. Mansur et al., 2005 projected that a 1°C increase in January temperatures 4
would produce a reduction in electricity consumption of about 3% for electricity for all-5
electric customers. The warmer temperatures also would reduce natural gas consumption 6
by 3% and fuel oil demand by a sizeable 12% per 1°C. This larger impact on fuel oil 7
consumption likely occurs because warming has its largest impacts on heating degree 8
days in the Northeast and in some other northern tier states where fuel oil is most 9
prevalent. Another factor may be the fact that commercial buildings that use fuel oil may 10
be older vintage buildings whose energy consumption is more sensitive to outdoor 11
temperatures. In Huang, 2006 similar to its residential findings, this study showed that 12
the impact of climate change on commercial building energy use varies greatly depending 13
on climate and building type. For the entire US commercial sector, the simulations 14
showed 12% decrease in energy use for space heating or 9.2% per 1°C. 15
16
Again, the regional level studies produce more dramatic decreases in energy demand in 17
colder regions than in warmer ones; however, the differences are less between cold 18
regions and warm regions because commercial buildings are more dominated by internal 19
loads such as lighting and equipment than are residential buildings. 20
21 22 2. 4 EFFECTS OF CLIMATE WARMING ON ENERGY USE FOR 23
SPACE COOLING 24 25
2.4.1 Residential Space Cooling 26
27
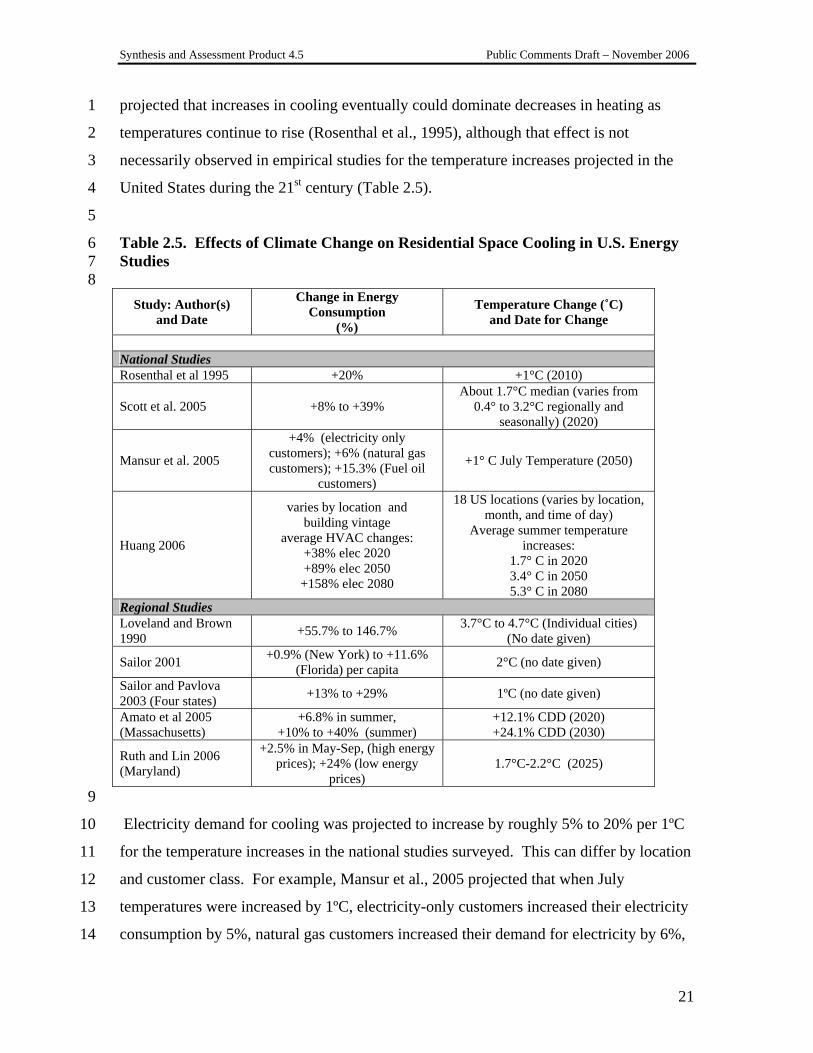
According to all studies surveyed for this chapter, climate warming is expected to 28
significantly increase the energy demand in all regions for space cooling, which is 29
provided almost entirely by electricity. The effect in most studies is non-linear with 30
respect to temperature and humidity, such that the percentage impact increases more than 31
proportionately with increases in temperature (Sailor, 2001). Some researchers have 32
Synthesis and Assessment Product 4.5 Public Comments Draft – November 2006
21
projected that increases in cooling eventually could dominate decreases in heating as 1
temperatures continue to rise (Rosenthal et al., 1995), although that effect is not 2
necessarily observed in empirical studies for the temperature increases projected in the 3
United States during the 21st century (Table 2.5). 4
5
Table 2.5. Effects of Climate Change on Residential Space Cooling in U.S. Energy 6 Studies 7 8
Study: Author(s) and Date
Change in Energy Consumption
(%)
Temperature Change (˚C) and Date for Change
National Studies Rosenthal et al 1995 +20% +1°C (2010)
Scott et al. 2005 +8% to +39% About 1.7°C median (varies from
0.4° to 3.2°C regionally and seasonally) (2020)
Mansur et al. 2005
+4% (electricity only customers); +6% (natural gas customers); +15.3% (Fuel oil
customers)
+1° C July Temperature (2050)
Huang 2006
varies by location and building vintage
average HVAC changes: +38% elec 2020 +89% elec 2050
+158% elec 2080
18 US locations (varies by location, month, and time of day)
Average summer temperature increases:
1.7° C in 2020 3.4° C in 2050 5.3° C in 2080
Regional Studies Loveland and Brown 1990 +55.7% to 146.7% 3.7°C to 4.7°C (Individual cities)
(No date given)
Sailor 2001 +0.9% (New York) to +11.6% (Florida) per capita 2°C (no date given)
Sailor and Pavlova 2003 (Four states) +13% to +29% 1ºC (no date given)
Amato et al 2005 (Massachusetts)
+6.8% in summer, +10% to +40% (summer)
+12.1% CDD (2020) +24.1% CDD (2030)
Ruth and Lin 2006 (Maryland)
+2.5% in May-Sep, (high energy prices); +24% (low energy
prices) 1.7°C-2.2°C (2025)
9
Electricity demand for cooling was projected to increase by roughly 5% to 20% per 1ºC 10
for the temperature increases in the national studies surveyed. This can differ by location 11
and customer class. For example, Mansur et al., 2005 projected that when July 12
temperatures were increased by 1ºC, electricity-only customers increased their electricity 13
consumption by 5%, natural gas customers increased their demand for electricity by 6%, 14
Synthesis and Assessment Product 4.5 Public Comments Draft – November 2006
22
and fuel oil customers bought 15% more electricity. The impact on all electricity 1
consumption is somewhat lower because electricity also is used for a variety of non-2
climate-sensitive loads in all regions and for space heating and water heating in some 3
regions. Looking specifically at residential sector cooling demand (rather than all 4
electricity) with a projected 2020 building stock, Scott et al., 2005 projected nationally 5
that an increase of 0.4° to 3.2°C summer temperatures (Table 2.5) results in a 6
corresponding 8% to 39% increase in national annual cooling energy consumption, or 7
roughly a 12% to 20% increase per 1°C. Huang’s, 2006 projections show an even 8
stonger increase of about a 38% increase in 2020 for a 1.7°C increase in temperature, or 9
22.4% per 1°C, perhaps in part because of differences in the in the details of locations 10
and types of new buildings in particular, which tend to have more cooling load and less 11
heating load. 12
13
Among the state studies, Loveland and Brown, 1990 found very high residential cooling 14
sensitivities in a number of different locations across the country. Cooling energy 15
consumption increased by 55.7% (Fort Worth, from a relatively high base) up to 146% 16
(Seattle, from a very low base) for a temperature increase of 3.7°C to 4.7°C. This implies 17
about a 17% to 31% increase in cooling energy consumption per degree C. Using a 18
similar model in the special case of California, where space heating is already dominated 19
by space cooling, Mendelsohn, 2003 projected that total energy expenditures for 20
electricity used for space cooling would increase non-linearly and that net overall energy 21
expenditures would increase with warming in the range of 1.5°C, more for higher 22
temperatures. In such mild cooling climates, relatively small increases in temperature 23
can have a large impact on air-conditioning energy use by reducing the potentials for 24
natural ventilation or night cooling. The residential electricity results in Sailor, 2001, 25
Sailor and Pavlova, 2003 for several locations, and Amato et al., 2005 for Massachusetts 26
are consistent with the national studies, with the expected direction of climate effects and 27
about the expected magnitude, but the Ruth et al., 2006 results for the more southerly 28
state of Maryland turn out to be very sensitive to electricity prices, ranging from +2.5% at 29
high prices (about 8 cents per kWh, 1990$) prices to +24% if prices were low (about 6 30
cents per kWh, 1990$). 31
Synthesis and Assessment Product 4.5 Public Comments Draft – November 2006
23
1
2.4.2 Commercial Space Cooling 2
3
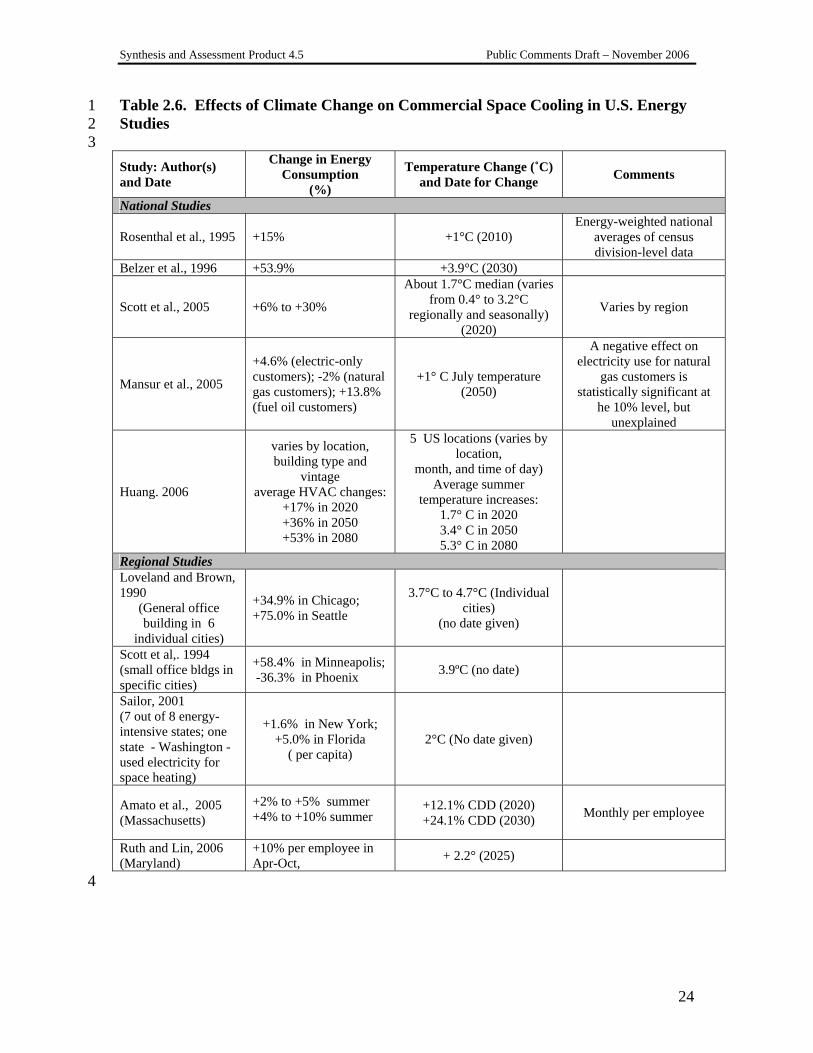
U.S. empirical studies also have projected a significant increase in energy demanded for 4
space cooling in commercial buildings as a result of climate warming, as summarized in 5
Table 2.6. 6
7
The commercial sector empirical studies show that the percentage increases in space 8
cooling energy consumption tend to be less sensitive to temperature than are the 9
corresponding energy increases in the residential sector for the same temperature 10
increase. For example, Rosenthal et al., 1995 found residential cooling increased 20% 11
but commercial sector cooling only 15% for a 1°C temperature increase. The increase in 12
Scott et al., 2005 had a range of 9.4% to 15% per 1°C for commercial and 12% to 20% 13
per 1°C for residential customers. As with heating, in both cases this is likely to be in 14
part because of the relatively greater sensitivity of space conditioning to internal loads in 15
commercial buildings. Mansur et al., 2005 econometric results were less clear in this 16
regard, possibly because geographic and behavioral differences among customer classes 17
tend to obscure the overall effects of the buildings themselves. With building equipment 18
and shell efficiencies frozen at 1990 baseline levels, Belzer et al., 1996 found impacts in 19
the same range as the other studies. A 3.9°C temperature change decreased annual space 20
cooling energy requirements by 53.9% or about 9.0% to 13.8% per 1°C. Huang, 2006 21
also showed strong increases in cooling energy consumption at the national level. In 22
2020, his average increase was 17% for a 1.7°C temperature increase, or +10% per 1°C. 23
24
State-level studies generally show impacts that are in the same range as their national 25
counterparts. Analyses performed with building energy models generally indicate a 10% 26
to 15% electric energy increase for cooling per 1°C. The econometric studies also show 27
increases, but because the numerator is generally the change in consumption of all 28
electricity (including lighting and plug loads, for example) rather than just that used for 29
space cooling, the percentage increases are much smaller. 30
31
Synthesis and Assessment Product 4.5 Public Comments Draft – November 2006
24
Table 2.6. Effects of Climate Change on Commercial Space Cooling in U.S. Energy 1 Studies 2 3 Study: Author(s) and Date
Change in Energy Consumption
(%)
Temperature Change (˚C) and Date for Change Comments
National Studies
Rosenthal et al., 1995 +15% +1°C (2010) Energy-weighted national
averages of census division-level data
Belzer et al., 1996 +53.9% +3.9°C (2030)
Scott et al., 2005 +6% to +30%
About 1.7°C median (varies from 0.4° to 3.2°C
regionally and seasonally) (2020)
Varies by region
Mansur et al., 2005
+4.6% (electric-only customers); -2% (natural gas customers); +13.8% (fuel oil customers)
+1° C July temperature (2050)
A negative effect on electricity use for natural
gas customers is statistically significant at
he 10% level, but unexplained
Huang. 2006
varies by location, building type and
vintage average HVAC changes:
+17% in 2020 +36% in 2050 +53% in 2080
5 US locations (varies by location,
month, and time of day) Average summer
temperature increases: 1.7° C in 2020 3.4° C in 2050 5.3° C in 2080
Regional Studies Loveland and Brown, 1990
(General office building in 6
individual cities)
+34.9% in Chicago; +75.0% in Seattle
3.7°C to 4.7°C (Individual cities)
(no date given)
Scott et al,. 1994 (small office bldgs in specific cities)
+58.4% in Minneapolis; -36.3% in Phoenix 3.9ºC (no date)
Sailor, 2001 (7 out of 8 energy-intensive states; one state - Washington - used electricity for space heating)
+1.6% in New York; +5.0% in Florida
( per capita) 2°C (No date given)
Amato et al., 2005 (Massachusetts)
+2% to +5% summer +4% to +10% summer
+12.1% CDD (2020) +24.1% CDD (2030) Monthly per employee
Ruth and Lin, 2006 (Maryland)
+10% per employee in Apr-Oct, + 2.2° (2025)
4
Synthesis and Assessment Product 4.5 Public Comments Draft – November 2006
25
2.4.3 Other Considerations: Market Penetration of Air Conditioning, 1 Heat Pumps (All-Electric Heating and Cooling) and Changes in 2 Humidity 3
4
Although the effects of air conditioning market penetration were not explicitly identified, 5
the late-1990s econometrically-based cross sectional studies of Mendelsohn and 6
colleagues might be argued to account for increased long run market saturations of air 7
conditioning. (This is because warmer locations in the cross sectional studies also have 8
higher market saturations of air conditioning as well as higher usage rates.) However, 9
more recent studies have examined the effects directly. In one example, Sailor and 10
Pavlova, 2003 have projected that potential increases in market penetration of air 11
conditioning in the residential sector in response to warming might have an effect on 12
electricity consumption larger than the warming itself. They projected that although the 13
temperature-induced increases in market penetration of air conditioning had little or no 14
effect on residential energy consumption in cities like Houston (93.6% market 15
saturation), in cooler cities like Buffalo (25.1% market saturation) and San Francisco 16
(20.9% market saturation), the extra market penetration of air conditioning induced by a 17
20% increase in CDD more than doubled the energy use due to temperature alone. Using 18
cross-sectional data and econometric techniques Mendelsohn, 2003) and Mansur et al., 19
2005 also have estimated the effects of the market penetration of space cooling into the 20
energy market. Mansur et al., found that warmer winter temperatures were associated 21
with higher likelihood of all-electric space conditioning systems in the sample survey of 22
buildings in EIA’s RECS and CBECS datasets. In warmer regions they noted that 23
electricity has a high marginal cost but a low fixed cost, making it desirable in moderate 24
winters. Electric heating is currently more prevalent in the South than in the North (EIA, 25
2001). In general, however, the effects of adaptive market response of air conditioning to 26
climate change have not been studied thoroughly in the United States. 27
28
High atmospheric humidity is known to have an adverse effect on the efficiency of 29
cooling systems in buildings in the context of climate change because of the energy 30
penalty associated with condensing water. This was demonstrated for a small 31
commercial building modeled with the DOE-2 building energy simulation model in Scott 32
Synthesis and Assessment Product 4.5 Public Comments Draft – November 2006
26
et al., 1994, where the impact of an identical temperature increase created a much greater 1
energy challenge for two relatively humid locations (Minneapolis and Shreveport), 2
compared with two drier locations (Seattle and Phoenix). The humidity effect does not 3
always show up in empirical studies (Belzer et al., 1996), but Mansur et al., 2005 4
modeled the effect of high humidity by introducing a rainfall as a proxy variable for 5
humidity into their cross-sectional equations. In their residential sector, a one-inch 6
increase in monthly precipitation resulted in more consumption by natural gas users of 7
both electricity (7%) and of natural gas (2%). In their commercial sector, a one-inch 8
increase in July precipitation resulted in more consumption of natural gas (6%) and of 9
fuel oil (40%). 10
11
2.5 OVERALL EFFECTS OF CLIMATE CHANGE ON ENERGY 12 USE IN BUILDINGS 13
14
2.5.1 Annual Energy Consumption 15
16
Many of the U.S. studies of the impact of climate change on energy use in buildings deal 17
with both heating and cooling and attempt to come to a “bottom line” net result for either 18
total energy consumed or total primary energy consumed (that is, both the amount of 19
natural gas and fuel oil consumed directly in buildings and the amount of natural gas, fuel 20
oil, and coal consumed indirectly to produce the electricity consumed in buildings.) 21
Some studies only deal with total energy consumption or total electricity consumption 22
and do not decompose end uses as has been done in this chapter. Recent studies show 23
similar net effects. Both net delivered energy and net primary energy consumption 24
increase or decrease only a few percent; however, there is a robust result that, in the 25
absence of an energy efficiency policy directed at space cooling, climate change would 26
cause a significant increase in the demand for electricity in the United States, which 27
would require the building of additional electric generation (and probably transmission 28
facilities) worth many billions of dollars. 29
30
Synthesis and Assessment Product 4.5 Public Comments Draft – November 2006
27
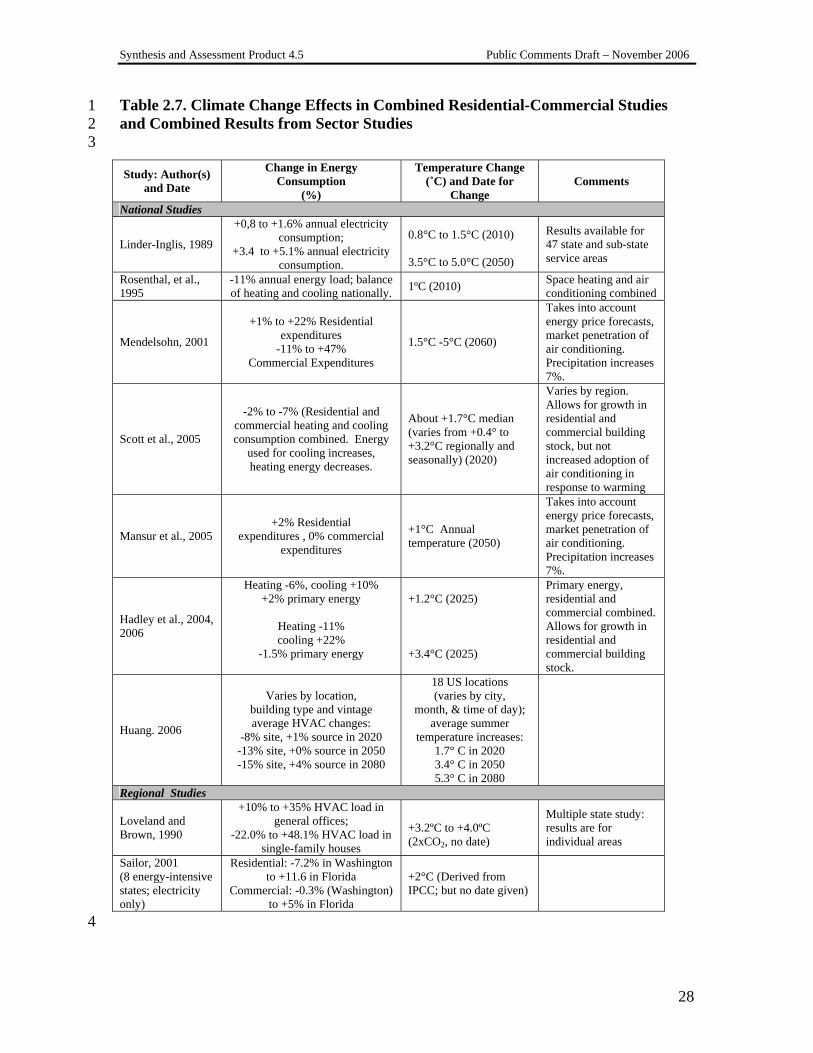
In much of the United States, annual energy used for space heating dominates energy use 1
for space cooling, so net use of delivered energy would be reduced by global warming. 2
Table 2.7 summarizes the results from a number of U.S. studies of the effects of climate 3
change on net energy demand in U.S. residential and commercial buildings. The studies 4
shown in Table 2.7 do not entirely agree with each other because of differences in 5
methods, time frame, scenario, and geography. However, they are all broadly consistent 6
with the finding that, at the national level, expected temperature increases through the 7
first third of 21st Century (Table 2.1) would not significantly increase or decrease net 8
energy use in buildings. The Linder and Inglis, 1989 projections concerning increases in 9
electricity consumption have been generally confirmed by later studies. However, there 10
are geographical differences. For example, Sailor’s state level econometric analyses 11
(Sailor and Muñoz, 1997, Sailor, 2001, Sailor and Pavlova, 2003) projected a range of 12
effects. A temperature increase of 2°C would be associated with an 11.6% increase in 13
residential per capita electricity used in Florida (a summer-peaking state dominated by air 14
conditioning demand), 5% increase per 1ºC warming. On the other hand, a 7.2% 15
decrease in Washington state (which uses electricity extensively for heating and is a 16
winter-peaking system), about a 3% decrease per 1ºC warming. 17
18 The Rosenthal et al., 1995 projections of reduced net total delivered energy consumption 19
and energy expenditure reductions have not been confirmed. Results of the more recent 20
studies follow. 21
22 Scott et al., 2005 projected that overall energy consumption in U.S. residential and 23
commercial buildings is likely to decrease by about 2% to 7% in 2020 (0.4°C to 3.2°C 24
warming). This amounts to about 2% per 1ºC warming, which is in the same direction of 25
the Rosenthal, et al. results, but smaller. This effect takes into account expected changes 26
in the building stock, but not increased market penetration of air conditioning that27
Synthesis and Assessment Product 4.5 Public Comments Draft – November 2006
28
Table 2.7. Climate Change Effects in Combined Residential-Commercial Studies 1 and Combined Results from Sector Studies 2 3
Study: Author(s) and Date
Change in Energy Consumption
(%)
Temperature Change (˚C) and Date for
Change Comments
National Studies
Linder-Inglis, 1989
+0,8 to +1.6% annual electricity consumption;
+3.4 to +5.1% annual electricity consumption.
0.8°C to 1.5°C (2010) 3.5°C to 5.0°C (2050)
Results available for 47 state and sub-state service areas
Rosenthal, et al., 1995
-11% annual energy load; balance of heating and cooling nationally. 1ºC (2010) Space heating and air
conditioning combined
Mendelsohn, 2001
+1% to +22% Residential expenditures
-11% to +47% Commercial Expenditures
1.5°C -5°C (2060)
Takes into account energy price forecasts, market penetration of air conditioning. Precipitation increases 7%.
Scott et al., 2005
-2% to -7% (Residential and commercial heating and cooling consumption combined. Energy
used for cooling increases, heating energy decreases.
About +1.7°C median (varies from +0.4° to +3.2°C regionally and seasonally) (2020)
Varies by region. Allows for growth in residential and commercial building stock, but not increased adoption of air conditioning in response to warming
Mansur et al., 2005 +2% Residential
expenditures , 0% commercial expenditures
+1°C Annual temperature (2050)
Takes into account energy price forecasts, market penetration of air conditioning. Precipitation increases 7%.
Hadley et al., 2004, 2006
Heating -6%, cooling +10% +2% primary energy
Heating -11% cooling +22%
-1.5% primary energy
+1.2°C (2025) +3.4°C (2025)
Primary energy, residential and commercial combined. Allows for growth in residential and commercial building stock.
Huang. 2006
Varies by location, building type and vintage average HVAC changes:
-8% site, +1% source in 2020 -13% site, +0% source in 2050 -15% site, +4% source in 2080
18 US locations (varies by city,
month, & time of day); average summer
temperature increases: 1.7° C in 2020 3.4° C in 2050 5.3° C in 2080
Regional Studies
Loveland and Brown, 1990
+10% to +35% HVAC load in general offices;
-22.0% to +48.1% HVAC load in single-family houses
+3.2ºC to +4.0ºC (2xCO2, no date)
Multiple state study: results are for individual areas
Sailor, 2001 (8 energy-intensive states; electricity only)
Residential: -7.2% in Washington to +11.6 in Florida
Commercial: -0.3% (Washington) to +5% in Florida
+2°C (Derived from IPCC; but no date given)
4
Synthesis and Assessment Product 4.5 Public Comments Draft – November 2006
29
specifically result from climate change. For a 1°C increase in year-round temperatures, 1
Mansur et al., 2005 provide only projections of net energy expenditures—a 2% increase 2
in total residential energy expenditures, and no net change in commercial energy demand 3
for the year 2060. In residences, electricity expenditures (presumably mainly for cooling) 4
generally increase, while use of other fuels generally decreases. Projected commercial 5
sector expenditures show increases in electricity expenditures that are almost exactly 6
offset by declines in the expenditures for natural gas and fuel oil. Since the Mansur et al. 7
analysis claims to estimate long-term climate elasticities that include fuel choices and 8
comfort choices as well as the direct effect of warmer temperatures on building energy 9
loads, the Mansur et al. results likely include at least some of the increased adoption of 10
air conditioning that would be expected in residences in currently cooler climates as 11
temperatures increase. This seems to be the case, since the residential sector electricity 12
use is projected to grow faster than electricity use in the commercial sector, where air 13
conditioning is more common and internal loads such as lighting dominate electricity use. 14
Hadley et al., 2004, 2006 also projects cooling energy consumption increasing and 15
heating energy consumption decreasing. The projected national net effect on delivered 16
energy consumption is slightly negative; but the impact on primary energy consumption 17
is a slight increase. For all three studies, the impact of 1°C to 2°C warming is small. At 18
the individual city level, Loveland and Brown, 1990 projected lower residential energy 19
load in northern cities such as Chicago, Minneapolis, and Seattle and increased energy 20
loads in southern cities such as Charleston, Ft. Worth, and Knoxville. A general office 21
building increased showed increased overall energy loads in all six cities. 22
23
Most recently, Huang, 2006 used results from the HADCM3 global climate model that 24
project the changes in temperature, daily temperature range, cloud cover, and relative 25
humidity by month for 0.5º grids of the earth’s surface to produce future weather files for 26
18 US locations. under four IPCC climate change scenarios (A1FI, A2M, B1, and B2M) 27
for three time periods (2020, 2050, and 2080). These weather files were then used with 28
the DOE-2 building energy simulation program to calculate the changes in space 29
conditioning energy use for a large set of prototypical residential and commercial 30
buildings to represent the US building stock. This study looked in detail at the technical 31
Synthesis and Assessment Product 4.5 Public Comments Draft – November 2006
30
impact of climate change on space conditioning energy use, but did not address socio-1
economic factors or adaptive strategies to climate change. 2
3
The simulations showed the overall impact of climate change by 2020 on the US building 4
stock would be a 7% reduction in site energy use, corresponding to a 1% reduction in 5
source energy, when the generation and transmission losses for electricity are taken into 6
account. The savings were noticeably larger for residential buildings (9 % reduction in 7
site and 2% reduction in source energy use) than for commercial buildings (7% reduction 8
in site, but a 3% increase in source energy use). The counterbalancing effect of heating 9
savings in the north tended to mask the appreciable impact that climate change can have 10
on cooling-dominant locations in the south. For example, cooling energy use in single-11
family houses in Miami and New Orleans was expected to increase by around 20%. In 12
the North or West, the percentage increase of cooling was actually much larger, but due 13
to the short cooling season, the savings were more than offset by the reductions in heating 14
energy use. For example, cooling energy use was expected to go up by 100% in San 15
Francisco, 60% in Boston and Chicago, and 50% in New York and Denver. 16
17
Because of their larger internal heat gains and less exposure to the outdoors, commercial 18
buildings tend to require less heating and more cooling than residential houses. 19
Consequently, some building types such as large hotels and supermarkets showed an 20
increase in site energy use with climate change, and almost all showed increases in 21
source energy use. In Los Angeles and Houston, commercial building energy use would 22
increase by 2% and 4% in site energy use, and by 15% and 25% in source energy use. 23
24
Huang 2006 also looked at the impact of climate change out to 2050 and 2080, where 25
there are cumulative effects of further temperature increases coupled with newer, tighter 26
buildings that require much less heating and proportionally more cooling than older 27
existing buildings. By 2050, heating loads were expected to be reduced by 28%, and 28
cooling loads increased by 85% due to climate change, averaged across all building types 29
and climates. By 2080, heating loads were expected to be reduced by nearly half (45%), 30
but cooling loads were expected to more than double (165%) due to climate change, 31
Synthesis and Assessment Product 4.5 Public Comments Draft – November 2006
31
averaged across all building types and climates. With falling energy use for heating and 1
rising energy use for cooling, by 2080 the ratio of cooling to heating energy use would be 2
60% in site energy, and close to 180% in source energy. 3
4
There are also a number of specific regional-level studies with similar outcomes. For 5
Massachusetts in 2020, Amato et al., 2005 projected a 6.6 % decline in annual heating 6
fuel consumption (8.7% decrease in heating degree days—overall temperature change not 7
given) and a 1.9% increase in summer electricity consumption (12% increase in annual 8
cooling degree-days). Amato et al. noted that per capita residential and commercial 9
energy demand in Massachusetts are sensitive to temperature and that a range of climate 10
warming scenarios may noticeably decrease winter heating fuel and electricity demands 11
and increase summer electricity demands. For 2030, the estimated residential summer 12
monthly electricity demand projected increases averaged about 20% to 40%. Wintertime 13
monthly natural gas demand declined by 10% to 20%. Fuel oil demand was down about 14
15% to 30%. For the commercial sector, electricity consumption rose about 6% to 10%. 15
Winter natural gas demand declined by 6% to 14%. 16
17
The Hadley et al., 2006 study used the DD-NEMS energy model. Two advantages of this 18
approach are that it provides a direct comparison at the regional level to official forecasts 19
and that it provides a fairly complete picture of energy supply, demand, and endogenous 20
price response in a market model. One disadvantage is that the DD-NEMS model only 21
forecasted out to 2025 in their work (now, 2030), which is only on the earliest part of the 22
period where climate change is expected to substantially affect energy demand. Hadley’s 23
regional results were broadly similar to those in Scott, et al., 2005. For example, they 24
showed decreases in energy demand for heating, more than offsetting the increased 25
demand for cooling in the north (New England, Mid-Atlantic, West North Central and 26
especially East North Central Census Division). In the rest of the country, the increase in 27
cooling was projected to dominate. Nationally, the site energy savings were shown to be 28
greater than the site energy increases, but because of energy losses in electricity 29
generation, primary energy consumption (source energy) increased by about 3% by 2025, 30
driving up the demand for coal and driving down the demand for natural gas. Also, 31
Synthesis and Assessment Product 4.5 Public Comments Draft – November 2006
32
because electricity costs more than natural gas per delivered Btu, the increase in total 1
energy cost per year was found to be about $15 billion (2001 dollars). 2
3
2.5.2 Peak Electricity Consumption 4
5
Studies published to date project that temperature increases with global warming would 6
increase peak demand for electricity in most regions of the country. The amount of the 7
increase in peak demand would vary with the region. Study findings vary with the region 8
or regions covered and the study methodology—in particular, whether the study allows 9
for changes in the building stock and increased market penetration of air conditioning in 10
response to warmer conditions. The Pacific Northwest, which has significant market 11
penetration of electric space heat, relatively low market penetration of air conditioning, 12
and a winter-peaking electric system, is likely to be an exception to the general rule of 13
increased peak demand. The Pacific Northwest power system annual and peak demand 14
would likely be lower as a result of climate warming (Northwest Power and Conservation 15
Council, 2005). 16
17
Concern for peak electricity demand begins with the earliest studies of the climate 18
impacts on of building energy demand. Linder and Inglis, 1989, in their multiregional 19
study of regional electricity demand, found that although annual electricity consumption 20
increased from +3.4 to +5.1% , peak electricity demand would increase between 8.6% 21
and 13.8% , and capacity requirements between 13.1% and 19.7%, costing tens of 22
billions of dollars. 23
24
One of the other few early studies of the effects of climate change on regional electricity 25
was conducted by Baxter and Calandri, 1992. Baxter and Calandri, 1992 used degree day 26
changes from General Circulation Model (GCM) projections for 2010 to adjust the 27
baseline heating and cooling energy uses in residential and commercial models that were 28
derived from building energy simulations of prototypical buildings. Two climate change 29
scenarios were considered - a low temperature increase scenario of 0.72°C in the winter, 30
0.60°C in the spring and fall, and 0.48°C in the summer, and a high temperature increase 31
Synthesis and Assessment Product 4.5 Public Comments Draft – November 2006
33
scenario of 2.28°C in the winter, 1.90°C in the spring and fall, and 1.58°C in the summer. 1
The results were presented for the 5 major utility districts, and showed a 0.28% decrease 2
in heating coupled with a 0.55% increase in cooling energy use for the low temperature 3
increase scenario, and a 0.85% decrease in heating coupled with a 2.54% increase in 4
cooling energy use for the high temperature increase scenario. The state-wide impacts on 5
energy demand were a 0.34-1.51% increase in cooling electricity demand for the low 6
temperature increase scenario, and a 2.57-2.99% increase in cooling electricity demand 7
for the high temperature increase scenario. 8
9
The authors concluded that the impacts of climate change appear moderate on a 10
percentage basis, but because California's electricity system is so large, moderate 11
percentage increase result in sizeable absolute impacts. For energy use, the 0.6% 12
and 2.6% increases for the two scenarios signify increases of 1741 GWh and 7516 GWh. 13
For electricity demand, the 0.34-1.51% and 2.57-2.99% increases correspond to increased 14
peak demand by 221-967 MW and 1648-1916 MW. To put these impacts in perspective, 15
uncertainties in the state’s economic growth rate would have had comparable or larger 16
impacts on electricity demand over this 20-year projected estimation. Actual growth in 17
non-coincident peak demand between 1990 and 2004 was actually 8,650 MW for total 18
end use load and 9,375 MW for gross generation (California Energy Commission, 2006). 19
20
Much more recently, using IPCC scenarios of climate change from the Hadley3, PCM, 21
and GFDL climate models downscaled for California, Franco and Sanstad, 2006 found 22
high correlation between the simple average daily temperature and daily peak electricity 23
demand in the California Independent System Operator region, which comprises most of 24
California. They evaluated three different periods: 2005-2034, 2035-2064, and 2070-25
2099. In the first period, depending on the scenario and model, peak summer demand 26
was projected to increase relative to a 1961-1990 base period before climate change by 27
1.0%-4.8%; in the second, 2.2%-10.9%; in the third, 5.6%-19.5%. 28
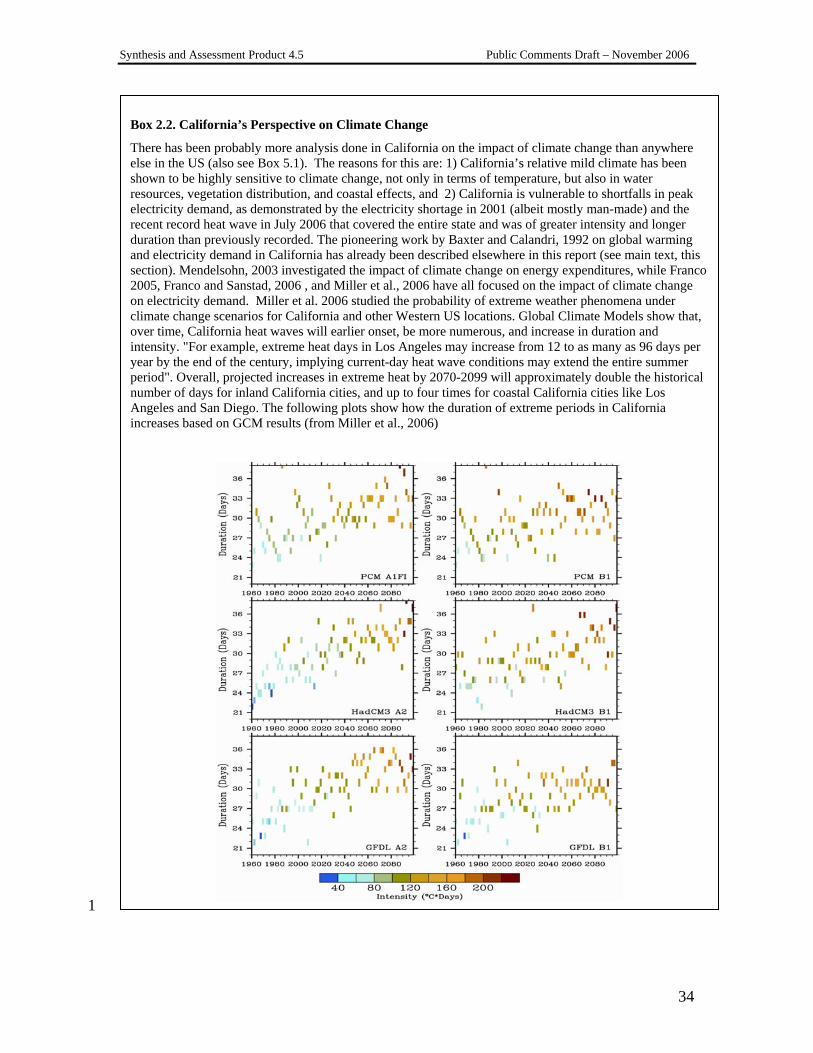
Synthesis and Assessment Product 4.5 Public Comments Draft – November 2006
34
1
Box 2.2. California’s Perspective on Climate Change
There has been probably more analysis done in California on the impact of climate change than anywhere else in the US (also see Box 5.1). The reasons for this are: 1) California’s relative mild climate has been shown to be highly sensitive to climate change, not only in terms of temperature, but also in water resources, vegetation distribution, and coastal effects, and 2) California is vulnerable to shortfalls in peak electricity demand, as demonstrated by the electricity shortage in 2001 (albeit mostly man-made) and the recent record heat wave in July 2006 that covered the entire state and was of greater intensity and longer duration than previously recorded. The pioneering work by Baxter and Calandri, 1992 on global warming and electricity demand in California has already been described elsewhere in this report (see main text, this section). Mendelsohn, 2003 investigated the impact of climate change on energy expenditures, while Franco 2005, Franco and Sanstad, 2006 , and Miller et al., 2006 have all focused on the impact of climate change on electricity demand. Miller et al. 2006 studied the probability of extreme weather phenomena under climate change scenarios for California and other Western US locations. Global Climate Models show that, over time, California heat waves will earlier onset, be more numerous, and increase in duration and intensity. "For example, extreme heat days in Los Angeles may increase from 12 to as many as 96 days per year by the end of the century, implying current-day heat wave conditions may extend the entire summer period". Overall, projected increases in extreme heat by 2070-2099 will approximately double the historical number of days for inland California cities, and up to four times for coastal California cities like Los Angeles and San Diego. The following plots show how the duration of extreme periods in California increases based on GCM results (from Miller et al., 2006)
Synthesis and Assessment Product 4.5 Public Comments Draft – November 2006
35
A few U.S. regions could benefit from lower winter demand for energy in Canada. An 1
example is in the New England-Middle Atlantic-East North Central region of the country, 2
where Ontario and Québec in particular are intertied with the U.S. system, and where 3
demand on either side of the international border could influence the other side. For 4
example, since much of the space heating in Québec is provided by hydro-generated 5
electricity, a decline in energy demand in the province could free up a certain amount of 6
capacity for bordering U.S. regions in the winter. In Québec, the Ouranos organization 7
(Ouranos, 2004) has projected that net energy demand for heating and air conditioning 8
across all sectors could fall by 30 trillion Btus, or 9.4 % of 2001 levels by 2100. 9
Seasonality of demand also would change markedly. Residential heating in Québec 10
would fall by 15% and air conditioning (currently a small source of demand) would 11
increase nearly four-fold. Commercial-institutional heating demand was projected to fall 12
by 13% and commercial air conditioning demand to double. Peak (winter) electricity 13
demand in Québec would decline. Unfortunately, Québec’s summer increase in air 14
conditioning demand would coincide with an increase of about 7% to 17% in the New 15
York metropolitan region (Ouranos, 2004), so winter savings might be only of limited 16
assistance in the summer cooling season, unless the water not used for hydroelectric 17
production in the winter could be stored until summer and the transmission capacity 18
existed to move the power south (Québec’s hydroelectric generating capacity is sized for 19
the winter peak and should not be a constraint). 20
21
Although they discuss the impacts of climate change on peak electricity demand, Scott et 22
al., 2005 did not directly compute them. However, they performed a sensitivity analysis 23
using nuclear power’s 90% average capacity factor for 2004 as an upper bound estimate 24
of base load power plant availability and projected that national climate sensitive demand 25
consumption (1.3 quads per year by 2080) would be equivalent of roughly 48 GW, or 48 26
base load power plants of 1,000 MW each. At the much lower 2003 average U.S. 27
generation/capacity ratio of 47%, 93 GW of additional generation capacity would be 28
required. This component of demand would be a factor in addition to any increases due 29
to additional climate-related market penetration of air conditioning and any other causes 30
Synthesis and Assessment Product 4.5 Public Comments Draft – November 2006
36
of increased demand for electricity the national electrical system will be dealing with for 1
the rest of the century. 2
3
2.6 ADAPTATION: INCREASED EFFICIENCY AND URBAN 4 FORM 5
6
Although improving building energy efficiency should help the nation cope with impacts 7
of climate change, there is relatively little specific empirical information available on the 8
potential impacts of such improvements. Partly this is because it has been thought that 9
warming would already be reducing energy consumption, so that the additional effects of 10
energy efficiency have not been of much interest. Scott et al., 1994 and Belzer et al., 11
1996 concluded that in the commercial sector, very advanced building designs could 12
increase the savings in heating energy due to climate warming alone. Loveland and 13
Brown, 1990, Scott, et al., 1994, Belzer, et al., 1996 and Scott et al., 2005, all estimated 14
the effects of energy-efficient buildings on energy consumption in the context of climate 15
change, and also concluded that much of the increase in cooling energy consumption due 16
to warming could be offset by increased energy efficiency. 17
18
Loveland and Brown, 1990, projected that changes leading to -50% lighting, +50% 19
insulation, +75% window shading would reduce total energy use in residential buildings 20
by 31.5% to 44.4% in the context of a 3.2° to 4°C warming. This suggests that advanced 21
building designs area promising approach to reducing energy consumption impacts of 22
warming but further verification and follow-up research is needed both to confirm results 23
and design strategies. 24
25
Scott et al.,1994, examined the impact of “advanced” building designs for a 48,000 26
square foot office building in the context of climate change in the DOE-2 building energy 27
simulation model. The building envelope was assumed to reduce heat transfer by about 28
70% compared to the ASHRAE 90.1 standard. It included extra insulation in the walls 29
and ceiling, reduction in window conductivity by a factor of 6, and window shading 30
devices. The result was that at a 3.9°C increase in annual average temperature, instead of 31
experiencing between an 8% savings in energy use (Minneapolis) and a 6.3% increase in 32
Synthesis and Assessment Product 4.5 Public Comments Draft – November 2006
37
overall energy use (Phoenix), an advanced design building would experience a 57.2% to 1
59.8% decrease in energy used. In addition, the cooling energy impact was reversed in 2
sign–a 47% to 60% decrease instead of a 35% to 93% increase. Cost, however, was not 3
analyzed. 4
5
Belzer et al.,1996, projected that with a 3.9°C increase in annual average temperature, the 6
use of advanced buildings would increase the overall energy savings in EIA’s year 2030 7
projected commercial building stock from 0.47 quads (20.4%) to 0.63 quads (27%). Use 8
of advanced building designs in the 2030 commercial building stock would increase the 9
overall energy savings by 1.15 quads (40.6%) relative to a 2030 building stock frozen at 10
1990 efficiency. The cooling component of building energy consumption was only 11
reduced rather than reversed by advanced designs in this study. 12
13
Finally, Scott et al., 2005, explicitly considered the savings that might be achieved under 14
the Department of Energy’s energy efficiency programs as projected in August 2004 for 15
the EIA building stock in the year 2020 (temperature changes of about 0.4°C at the low 16
end to about 2.8°C at the high end). This is the only study to have estimated the national 17
effects of actual energy efficiency programs in the context of global warming. (The 18
analysis did not count any potential increase in energy demand due to additional climate 19
change-induced market penetration of air conditioning). The efficiency programs, which 20
mainly targeted heating lighting and appliances instead of cooling, were less effective if 21
the climate did not change; however, buildings still saved between 2.0 and 2.2 quads. 22
This was a savings of about 4.5%, which would more than offset the growth in 23
temperature-sensitive energy consumption due to increases in cooling and growth in 24
building stock between 2005 and 2020. 25
26
Except for Scott et al., 2005, even where studies purport to address adaptive response 27
(e.g., Loveland and Brown, 1990; Belzer et al., 1996; Mendelsohn, 2001), they generally 28
do not involve particular combinations of technologies to offset the effects of future 29
climate warming. Regionally, Franco and Sanstad, 2006 did note that the very aggressive 30
energy efficiency and demand response targets for California’s investor-owned utilities 31
Synthesis and Assessment Product 4.5 Public Comments Draft – November 2006
38
such as those recently enacted by the California Public Utilities Commission could, if 1
extended beyond the current 2013 horizon, provide substantial “cushioning” of the 2
electric power system against the effects of higher temperatures. 3
4
2.7 OTHER POSSIBLE EFFECTS, INCLUDING ENERGY USE IN 5 KEY SECTORS 6
7
Except for energy used to heat and cool buildings, which is thought to be about 6% of 8
energy use in industry (EIA, 2001), and is generally not analyzed for manufacturing 9
activities in existing studies, it is not thought that industrial energy demand is particularly 10
sensitive to climate change. For example, Amato et al., 2005 stated that “industrial 11
energy demand is not estimated since previous investigations (Elkhafif, 1996; Sailor and 12
Munoz, 1997) and our own findings indicate that it is non-temperature-sensitive.” Ruth 13
and Lin, 2006 observe that in contrast to residential households, which use about 58% of 14
their energy for space conditioning, and commercial buildings, which use about 40%, 15
industrial facilities devote only about 6% of their energy use to space conditioning. In 16
absolute numbers, this is about a third of what the commercial sector uses and about 8% 17
of what the residential sector uses for this purpose. According to the 2002 Manufacturing 18
Energy Consumption Survey, among the energy uses that could be climate sensitive, U.S. 19
manufacturing uses about 4% of all energy for directly space conditioning, 22% for 20
process heating, and 1.5% for process cooling (EIA, 2002a). 21
22
This does not mean that industry is not sensitive to climate, or even that energy 23
availability as influenced by climate or weather does not affect industry; clearly it does. 24
Much of the energy used in industry is used for water heating; so energy use would likely 25
decline in industry if climate and water temperatures become warmer. Electrical outages 26
(some caused by extreme weather) cause many billions in business interruptions every 27
year, and large events that interrupt energy supplies are also nationally important (See 28
Chapter 3). However, little information exists on the impact of climate change on energy 29
use in industry. Considine, 2000 econometrically investigated industrial energy use data 30
from the EIA Short Term Energy Forecasting System based on HDD and CDD and 31
calculated that U.S. energy consumption per unit of industrial production would increase 32

Synthesis and Assessment Product 4.5 Public Comments Draft – November 2006
39
for an increase 0.0127% per increase in one heating degree day (Fahrenheit) or by 1
0.0032% per increase of one cooling degree day (Fahrenheit). On an annual basis with a 2
1°C temperature increase (1.8°F), there would be a maximum of 657 fewer HDD per year 3
and 657 more CDD (Fahrenheit basis, and assuming that all industry was located in 4
climates that experienced all of the potential HDD decrease and CDD increase). This 5
would translate into 6.2% less net energy demand in industry or a saving of roughly 0.04 6
quads. 7
8
A few studies have focused on a handful of exceptions where it was assumed that energy 9
consumption would be sensitive to warmer temperatures, such as agricultural crop drying 10
and irrigation pumping (e.g., Darmstadter, 1993; Scott et al., 1993). While it seems 11
logical that warmer weather or extended warm seasons should result in warmer water 12
inlet temperatures for industrial processes and higher rates of evaporation, possibly 13
requiring additional industrial water diversions, as well as additional municipal uses for 14
lawns and gardens, the literature review conducted for this chapter did not locate any 15
literature either laying out that logic or calculating any associated increases in energy 16
consumption for water pumping. Industrial pumping increases are likely to be small 17
relative to those in agriculture, which consumes the lion’s share (40%) of all fresh water 18
withdrawals in the United States (USGS, 2004). Some observations on energy use in 19
climate-sensitive economic sectors follow. 20
21
2.7.1 Transportation 22
23
Running the air conditioning in a car reduces its fuel efficiency by approximately 12% at 24
highway speeds (Parker 2005). A more extended hot season likely would increase the 25
use of automotive air conditioning units, but by how much and with what consequences 26
for fuel economy is not known. Virtually new all light duty vehicles sold (well over 99% 27
in 2005) in the United Sates come with factory-installed air conditioning installed (up 28
from about 90% in the mid-1990s)1, but no statistics appear to be available from public 29
1 Data supplied by Robert Boundy, Oak Ridge National Laboratory, based on Ward’s Automotive Yearbooks.
Synthesis and Assessment Product 4.5 Public Comments Draft – November 2006
40
sources on the overall numbers or percentage of vehicles in the fleet without air 1
conditioning. No projections appear to be available on the total impact of climate change 2
on energy consumption in automotive air conditioners; however, there are some estimates 3
of the response of vehicle air conditioning use to temperature. Based on a modeling of 4
consumer comfort, Johnson (2002) estimates that at ambient temperatures above 30°C 5
(86°F), drivers would have their air conditioning on 100% of the time; at 21°C-30°C 6
(70°F-86°F), 80%; at 13°C-20°C (55°F-70°F), 45%; and at 6°C-12°C (43°F-55°F), 20% 7
of the time.2 Data from the Environmental Protection Agency’s model of vehicular air 8
conditioning operation suggests that U.S. drivers on average currently have their air 9
conditioning systems turned on 23.9% of the time. With an increase in ambient air 10
temperature of 1°C (1.8°F), the model estimates that drivers would have their air 11
conditioning systems turned on 26.9% of the time, and increase of 3.0% of the time. 3 12
13
Much of the food consumed in the United States moves by refrigerated truck or rail. One 14
of the most common methods is via a refrigerated truck-trailer combination. As of the 15
year 2000, there were approximately 225,000 refrigerated trailers registered in the United 16
States, and their Trailer Refrigeration Units (TRUs) used on average 0.7 to 0.9 gallons of 17
fuel per hour to maintain 0°F. On a typical use cycle of 7200 hours per year (6 days per 18
week, 50 weeks per year), the typical TRU would use 5,000 to 6,000 gallons of diesel per 19
year (Shurepower, LLC 2005), or between 26 and 32 million barrels for the national fleet. 20
Even though diesel electric hybrid and other methods are making market inroads and 21
over time could replace a substantial amount of this diesel use with electricity from the 22
grid when the units are parked, climate warming would add to the energy use in these 23
systems. No data appear to be available on the total impact of climate change on energy 24
consumption in transportation, however. 25
26
2 Data supplied by Lawrence Chaney, National Renewable Energy Laboratory. 3 Data supplied by Richard Rykowski, Assessment Standards and Support Division, Environmental Protection Agency. The model used in this analysis is described in Chapter III of the Draft Technical Support Document to the proposed EPA rulemaking to revise EPA’s methodology for calculating the city and highway fuel economy values pasted on new vehicles.
Synthesis and Assessment Product 4.5 Public Comments Draft – November 2006
41
2.7.2 Construction 1
2
Warming the climate should result in more days when outdoor construction activities are 3
possible. In many parts of the northern states, the construction industry takes advantage 4
of the best construction weather to conduct activities such as some excavation, pouring 5
concrete, framing buildings, roofing, and painting, while sometimes enclosing buildings, 6
partially heating them with portable space heaters, and conducting inside finishing work 7
during “bad” weather. While the construction season may lengthen in the North, there 8
also may be an increasing number of high-temperature heat stress days during which 9
outdoor work may be hindered. The net effects on energy consumption on construction 10
are not clear. The literature survey conducted for this chapter was not able to locate any 11
studies in the United States that have investigated either the lengthening of the 12
construction season in response to global warming or any resulting impacts on energy 13
consumption. 14
15
2.7.3 Agriculture 16
17
Agricultural energy use generally falls into five main categories: equipment operations, 18
irrigation pumping, embodied energy in fertilizers and chemicals, product transport, and 19
drying and processing. A warmer climate implies increases in the demand for water in 20
irrigated agriculture and use of energy (either natural gas or electricity) for pumping. 21
Though not a factor in many parts of the country, irrigation energy is a significant source 22
of energy demand west of the 100th meridian, especially in the Pacific Southwest and 23
Pacific Northwest. For example, irrigation load in one early climate change impact 24
assessment increased from about 8.7% to about 9.8% of all Pacific Northwest electricity 25
load in July (Scott et al., 1993), even with no change in acreage irrigated. 26
27
In some parts of the country, the current practice is to keep livestock and poultry inside 28
for parts of the year, either because it is too cold or too hot outside. Often these facilities 29
are space-conditioned. In Georgia, for example, there are 11,000 poultry houses, and 30
many of the existing houses are air-conditioned due to the hot summer climate (and all 31

Synthesis and Assessment Product 4.5 Public Comments Draft – November 2006
42
new ones are) (University of Georgia and Fort Valley State University, 2005). Poultry 1
producers throughout the South also depend on natural gas and propane as sources of heat 2
to keep their birds warm during the winter (Subcommittee on Conservation, Credit, Rural 3
Development, and Research, 2001). The demand for cooling livestock and poultry would 4
be expected to increase in a warmer climate, while that for heating of cattle barns in 5
North, for example, likely would fall. There are no available quantitative estimates of the 6
effects on energy demand. 7
8
Food processing needs extensive refrigerated storage, which may take more energy in a 9
warmer climate. However, there seem to be no U.S. studies on this subject. 10
11
2.8 SUMMARY OF KNOWLEDGE ABOUT POSSIBLE EFFECTS 12
13
Generally speaking, the net effects of climate change in the United States on total energy 14
demand are projected to be modest, amounting to between perhaps a 5% increase and 15
decrease in demand per 1ºC in warming in buildings, about 1.1 Quads in 2020 based on 16
EIA 2006 projections (EIA, 2006). Existing studies do not agree on whether there would 17
a net increase or decrease in energy consumption with changed climate because a variety 18
of methodologies have been used, which has taken into account all of the potential effects 19
of warming. There are differences in climate sensitivities as well as differences in 20
methodological emphasis. For example, econometric models have incorporated some 21
market response to warming and fuel costs but not necessarily differences in building size 22
and technology over time and space, while the opposite is true of building simulation 23
approaches. There are also differences in climate and market scenarios. It appears likely 24
that some of the largest effects of climate change on energy use are in buildings, 25
however, with other sensitivities being of secondary or tertiary importance. 26
27
Another robust finding is that most of regions of the country can be expected to see 28
significant increases in the demand for electricity, due both to increases in the use of 29
existing space-cooling equipment and also to likely increases in the market penetration of 30
air conditioning in response to longer and hotter summers in Northern regions where 31
Synthesis and Assessment Product 4.5 Public Comments Draft – November 2006
43
market penetration of air conditioning is still relatively low. 1
2
To some extent, it is possible to control for differences in climate scenarios by comparing 3
percentage changes in energy use per a standardized amount of temperature change, as 4
has been done in this chapter. It is also possible to search for a set of robust results and to 5
compare impacts, for example, that come from models that have fixed technologies and 6
no market responses with those that allow technology to evolve and businesses and 7
individuals to respond to higher or lower energy bills. 8
9
Some of the conflicting results are more likely to be correct. Because of compensating 10
market and technological responses, impacts of climate change should be less with 11
models that allow technology to evolve and businesses and individuals to respond to 12
higher or lower energy bills. Because they also assess more realistically the factors 13
actually likely to be in play, they are likelier to be closer to correct. None of the models 14
actually does all of this, but Mansur et al., 2005 probably comes the closest on the market 15
side and Scott et al., 2005 or Huang, 2006 on the technology side. Using the results from 16
these two approaches, together with Sailor and Pavlova,2003 to inform and modify the 17
Hadley et al., 2006 special version of NEMS probably has the best chance of being 18
correct for buildings. 19
20
Technical Note: Methods for Estimating Energy Consumption in Buildings 21
22
Previous authors have taken a number of approaches to estimate the impact of climate 23
change on energy use in U.S. buildings. Many of the researchers translate changes in 24
average temperature change on a daily, seasonal, or annual basis into heating and cooling 25
degree days, which are then used in building energy simulation models to project demand 26
for space heating and space cooling (e.g., Rosenthal et al., 1995, Belzer et al., 1996, and 27
Amato et al., 2005). Building energy simulation is often done directly with average 28
climate changes used to modify daily temperature profiles at modeled locations (Scott et 29
Synthesis and Assessment Product 4.5 Public Comments Draft – November 2006
44
al., 2005, and Huang, 2006). (See Box 2.2 on heating and cooling degree-days.) 1
2 Building energy simulation models such as CALPAS3 (Atkinson et al., 1981), DOE-2 3
(Winkelmann et al., 1993), or FEDS and BEAMS (PNNL, 2002, Elliott et al., 2004) have 4
been used to analyze the impact of climate warming on the demand for energy in 5
individual commercial buildings only (Scott et al., 1994) and in groups of commercial 6
and residential buildings in a variety of locations (Loveland and Brown, 1990, Rosenthal 7
et al., 1995, Scott et al., 2005, and Huang,, 2006). 8
9
Other researchers have used econometrics and statistical analysis techniques (most 10
notably the various Mendelsohn papers discussed herein, but also the Belzer et al., 1996 11
study using the CBECS microdata, and Sailor and Muñoz, 1997, Sailor, 2001, Amato et 12
al., 2005, Ruth and Lin, 2006, and Franco and Sanstad, 2006, using various state-level 13
time series.) A sub-category of the econometric technique is cross-sectional analysis. For 14
example, Mendelsohn performed cross-sectional econometric analysis of the RECS and 15
CBECS microdata sets to determine how energy use in the residential and commercial 16
Box 2.2. Heating and Cooling Degree-Days and Building Energy Use Energy analysts often refer to concepts called heating and cooling degree-days when calculating the impact of outdoor temperature on energy use in buildings. Buildings are considered to have a minimum energy use temperature where the building is neither heated nor cooled and all energy use is considered to be non-climate sensitive. This is called the “balance point” for the building. Each degree deviation from that balance point temperature results in heating (if the temperature is below the balance point) or cooling (if the temperature is above the balance point. For example, if the balance point for a building is 60°F and the average outdoor temperature for a thirty day period is 55°F, then there are 5x30 heating degree days for that period. Energy demand is usually considered to increase or decrease proportionately with increases in either heating degree-days or cooling degree-days. Balance points by default are usually considered to be 65°F because many weather datasets come with degree-days already computed on that basis (See Amato et al 2005). However, empirical research on regional datasets and on the RECS and CBECS microdata sets suggests that regional variations are common. In Massachusetts, for example, Amato et al. found a balance point temperature for electricity in the residential sector of 60°F and 55°F for the residential sector. Belzer et al. (1996) found that the newer commercial buildings have even lower balance point temperatures, probably because of tighter construction and the dominance of lighting and other interior loads that both aid with heating and make cooling more of a challenge.
Synthesis and Assessment Product 4.5 Public Comments Draft – November 2006
45
building stock relates to climate (Morrison and Mendelsohn, 1999; Mendelsohn, 2001), 1
and then used the resulting equations to estimate the future impact of warmer 2
temperatures on energy consumption in residential and commercial buildings. 3
Mendelsohn, 2003 and Mansur et al., 2005 subsequently elaborated the approach into a 4
complete and separate set of discrete-continuous choice models of energy demand in 5
residential and commercial buildings. 6
7
Finally, Hadley et al., 2004, 2006, directly incorporated changes in heating degree-days 8
and cooling degree-days expected as a result of climate change into the residential and 9
commercial building modules of the Energy Information Administration’s National 10
Energy Modeling System, so that their results incorporated U.S. demographic trends, 11
changes in building stock and energy-using equipment, and (at least some) consumer 12
reactions to energy prices and climate at a regional level. Hadley et al. translated 13
temperatures from a single climate scenario of the Parallel Climate Model into changes in 14
heating degree days (HDD) and cooling degree-days (CDD) that are population-averaged 15
in each of the nine U.S. Census divisions (on a 65º F base –against the findings of 16
Rosenthal et al., Belzer et al., and Mansur et al., 2005, all of which projected a lower 17
balance point temperature for cooling and a variation in the balance point across the 18
country). They then compared these values with 1971-2000 average HDDs and CDDs 19
from the National Climate Data Center for the same regions. The changes in HDD and 20
CDD were then used to drive changes in a special version (DD-NEMS) of the National 21
Energy Modeling System (NEMS) of the U.S. Energy Information Administration, 22
generally used to provide official energy consumption forecasts for the Annual Energy 23
Outlook (EIA, 2006). Table 2.8 contains a summary of methods used in the various 24
studies employed in this chapter. 25
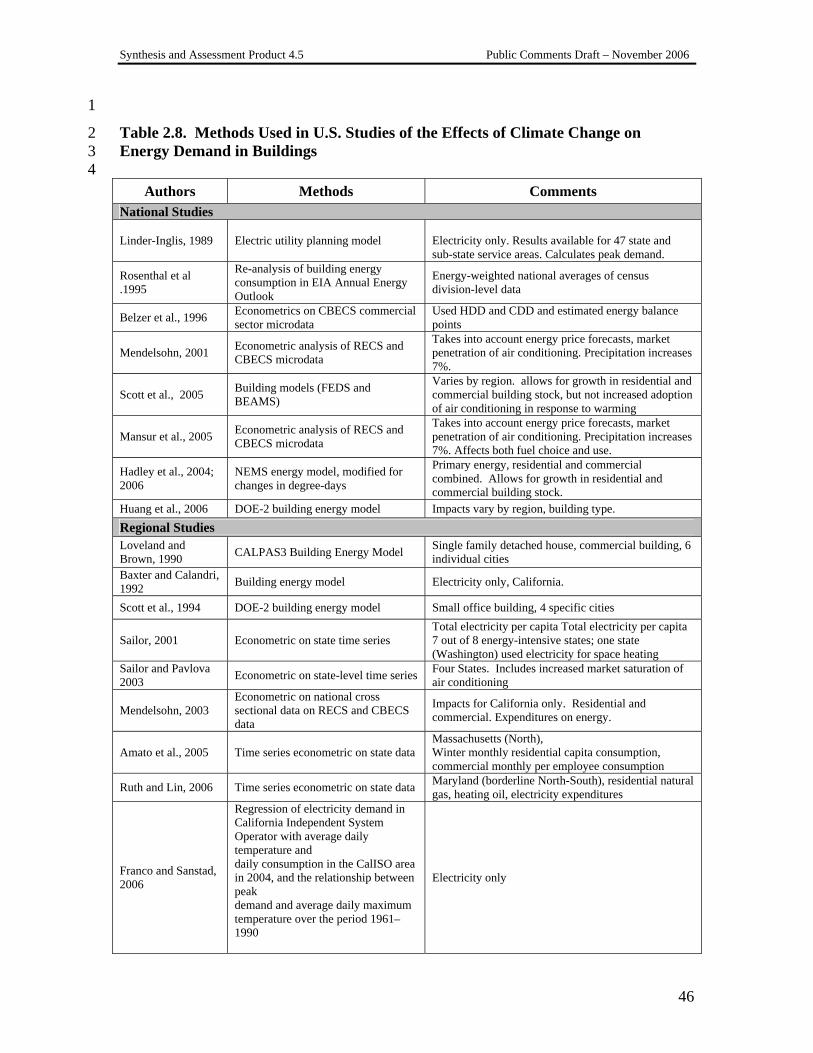
Synthesis and Assessment Product 4.5 Public Comments Draft – November 2006
46
1
Table 2.8. Methods Used in U.S. Studies of the Effects of Climate Change on 2 Energy Demand in Buildings 3 4
Authors Methods Comments National Studies
Linder-Inglis, 1989 Electric utility planning model Electricity only. Results available for 47 state and sub-state service areas. Calculates peak demand.
Rosenthal et al .1995
Re-analysis of building energy consumption in EIA Annual Energy Outlook
Energy-weighted national averages of census division-level data
Belzer et al., 1996 Econometrics on CBECS commercial sector microdata
Used HDD and CDD and estimated energy balance points
Mendelsohn, 2001 Econometric analysis of RECS and CBECS microdata
Takes into account energy price forecasts, market penetration of air conditioning. Precipitation increases 7%.
Scott et al., 2005 Building models (FEDS and BEAMS)
Varies by region. allows for growth in residential and commercial building stock, but not increased adoption of air conditioning in response to warming
Mansur et al., 2005 Econometric analysis of RECS and CBECS microdata
Takes into account energy price forecasts, market penetration of air conditioning. Precipitation increases 7%. Affects both fuel choice and use.
Hadley et al., 2004; 2006
NEMS energy model, modified for changes in degree-days
Primary energy, residential and commercial combined. Allows for growth in residential and commercial building stock.
Huang et al., 2006 DOE-2 building energy model Impacts vary by region, building type. Regional Studies Loveland and Brown, 1990 CALPAS3 Building Energy Model Single family detached house, commercial building, 6
individual cities Baxter and Calandri, 1992 Building energy model Electricity only, California.
Scott et al., 1994 DOE-2 building energy model Small office building, 4 specific cities
Sailor, 2001 Econometric on state time series Total electricity per capita Total electricity per capita 7 out of 8 energy-intensive states; one state (Washington) used electricity for space heating
Sailor and Pavlova 2003 Econometric on state-level time series Four States. Includes increased market saturation of
air conditioning
Mendelsohn, 2003 Econometric on national cross sectional data on RECS and CBECS data
Impacts for California only. Residential and commercial. Expenditures on energy.
Amato et al., 2005 Time series econometric on state data Massachusetts (North), Winter monthly residential capita consumption, commercial monthly per employee consumption
Ruth and Lin, 2006 Time series econometric on state data Maryland (borderline North-South), residential natural gas, heating oil, electricity expenditures
Franco and Sanstad, 2006
Regression of electricity demand in California Independent System Operator with average daily temperature and daily consumption in the CalISO area in 2004, and the relationship between peak demand and average daily maximum temperature over the period 1961–1990
Electricity only
Synthesis and Assessment Product 4.5 Public Comments Draft – November 2006
47
CHAPTER 3. EFFECTS OF CLIMATE CHANGE ON 1 ENERGY PRODUCTION AND DISTRIBUTION IN THE 2
UNITED STATES 3 4
Stanley R. Bull and Daniel E. Bilello, National Renewable Energy Laboratory 5 James Ekmann, National Energy Technology Laboratory 6
Michael J. Sale, Oak Ridge National Laboratory 7 David K. Schmalzer, Argonne National Laboratory 8
9 10
Energy production in the U.S. is dominated by fossil fuels: coal, natural gas, and 11
petroleum (Fig. 3.1). Every existing source of energy has some vulnerability to climate 12
variability (Table 3.1). Renewable energy sources tend to be more sensitive to climate 13
variables; but fossil energy production can also be adversely effected by air and water 14
temperatures and the thermoelectric cooling process that is critical to maintaining high 15
electrical generation efficiencies also applies to nuclear energy. In addition, extreme 16
weather events have adverse effects on energy production, distribution, and fuel 17
transportation as well. 18
19
This section discusses the specific impacts on energy production and distribution 20
associated with projected changes in temperature, precipitation, water resources, severe 21
weather events, and sea level rise. Overall, the effects on the existing infrastructure 22
might be categorized as modest; however, local and industry-specific impacts could be 23
large, especially in areas that may be prone to disproportional warming (Alaska) or 24
weather disruptions (Gulf Coast and Gulf of Mexico). The existing assemblage of power 25
plants and distribution systems is likely to be more affected by ongoing unidirectional 26
changes, compared with future systems, if future systems can be designed with the 27
upfront flexibility to accommodate the span of potential impacts. Possible adaptation 28
measures include technologies that minimize the impact of increases in ambient 29
temperatures on power plant equipment, technologies that conserve water use for power 30
plant cooling processes, planning at the local and regional level to anticipate storm and 31
drought impacts, and improved forecasting of the impacts of global warming on 32
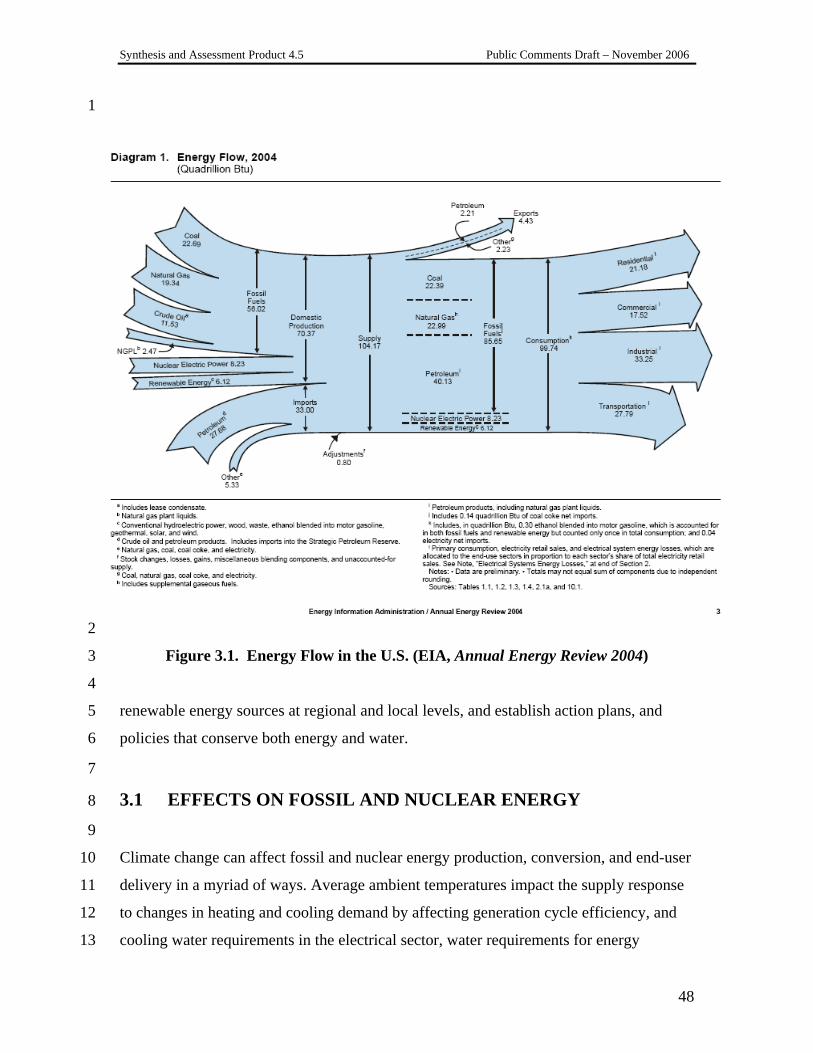
Synthesis and Assessment Product 4.5 Public Comments Draft – November 2006
48
1
2
Figure 3.1. Energy Flow in the U.S. (EIA, Annual Energy Review 2004) 3
4
renewable energy sources at regional and local levels, and establish action plans, and 5
policies that conserve both energy and water. 6
7
3.1 EFFECTS ON FOSSIL AND NUCLEAR ENERGY 8
9
Climate change can affect fossil and nuclear energy production, conversion, and end-user 10
delivery in a myriad of ways. Average ambient temperatures impact the supply response 11
to changes in heating and cooling demand by affecting generation cycle efficiency, and 12
cooling water requirements in the electrical sector, water requirements for energy 13
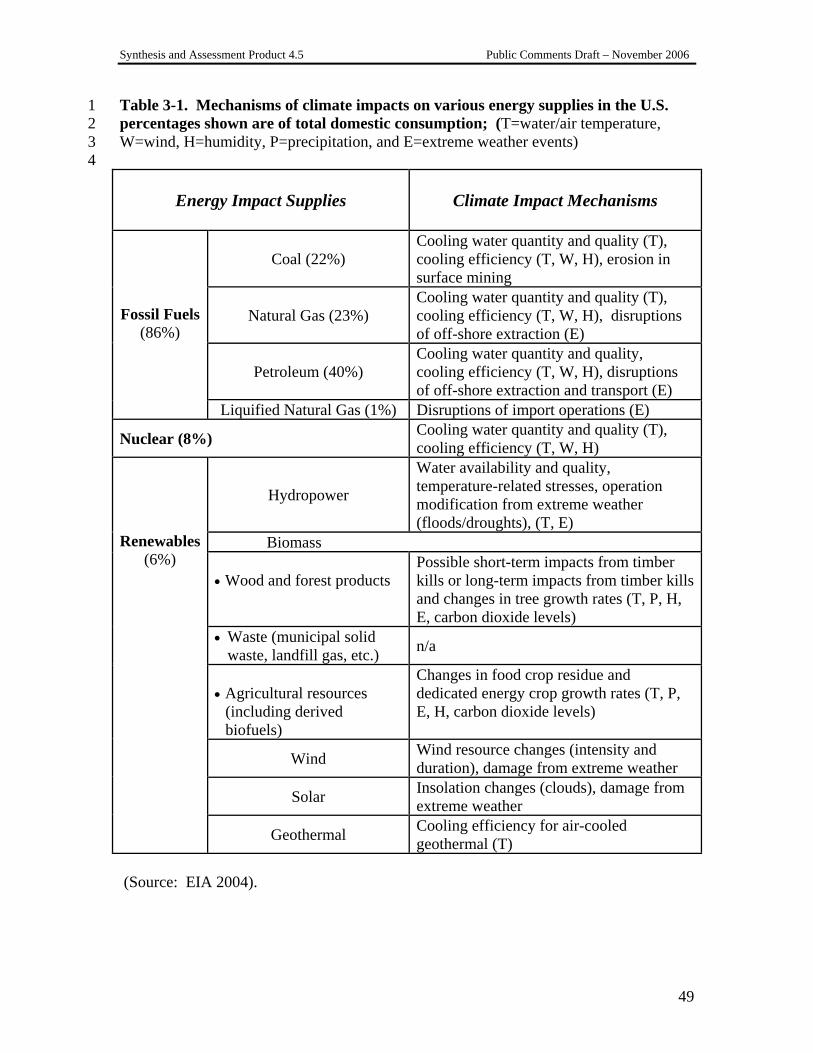
Synthesis and Assessment Product 4.5 Public Comments Draft – November 2006
49
Table 3-1. Mechanisms of climate impacts on various energy supplies in the U.S. 1 percentages shown are of total domestic consumption; (T=water/air temperature, 2 W=wind, H=humidity, P=precipitation, and E=extreme weather events) 3
4
Energy Impact Supplies
Climate Impact Mechanisms
Coal (22%) Cooling water quantity and quality (T), cooling efficiency (T, W, H), erosion in surface mining
Natural Gas (23%) Cooling water quantity and quality (T), cooling efficiency (T, W, H), disruptions of off-shore extraction (E)
Petroleum (40%) Cooling water quantity and quality, cooling efficiency (T, W, H), disruptions of off-shore extraction and transport (E)
Fossil Fuels
(86%)
Liquified Natural Gas (1%) Disruptions of import operations (E)
Nuclear (8%) Cooling water quantity and quality (T), cooling efficiency (T, W, H)
Hydropower
Water availability and quality, temperature-related stresses, operation modification from extreme weather (floods/droughts), (T, E)
Biomass • Wood and forest products
Possible short-term impacts from timber kills or long-term impacts from timber kills and changes in tree growth rates (T, P, H, E, carbon dioxide levels)
• Waste (municipal solid waste, landfill gas, etc.) n/a
• Agricultural resources
(including derived biofuels)
Changes in food crop residue and dedicated energy crop growth rates (T, P, E, H, carbon dioxide levels)
Wind Wind resource changes (intensity and duration), damage from extreme weather
Solar Insolation changes (clouds), damage from extreme weather
Renewables
(6%)
Geothermal Cooling efficiency for air-cooled geothermal (T)
(Source: EIA 2004).
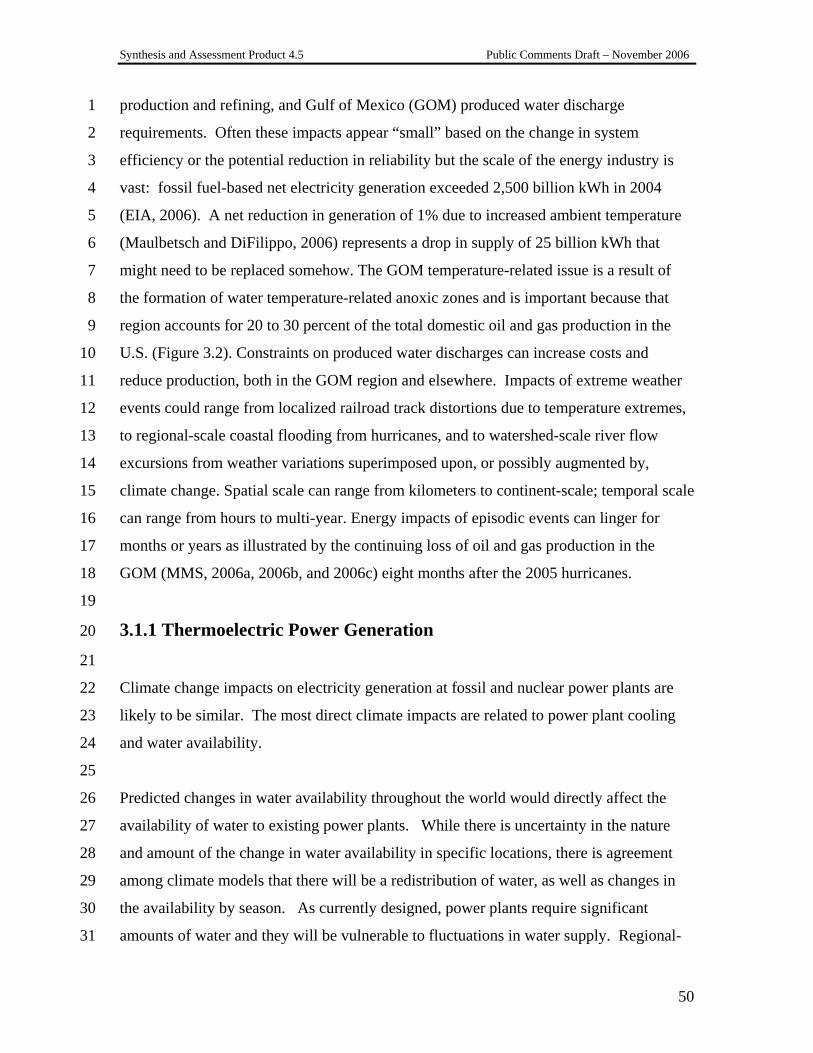
Synthesis and Assessment Product 4.5 Public Comments Draft – November 2006
50
production and refining, and Gulf of Mexico (GOM) produced water discharge 1
requirements. Often these impacts appear “small” based on the change in system 2
efficiency or the potential reduction in reliability but the scale of the energy industry is 3
vast: fossil fuel-based net electricity generation exceeded 2,500 billion kWh in 2004 4
(EIA, 2006). A net reduction in generation of 1% due to increased ambient temperature 5
(Maulbetsch and DiFilippo, 2006) represents a drop in supply of 25 billion kWh that 6
might need to be replaced somehow. The GOM temperature-related issue is a result of 7
the formation of water temperature-related anoxic zones and is important because that 8
region accounts for 20 to 30 percent of the total domestic oil and gas production in the 9
U.S. (Figure 3.2). Constraints on produced water discharges can increase costs and 10
reduce production, both in the GOM region and elsewhere. Impacts of extreme weather 11
events could range from localized railroad track distortions due to temperature extremes, 12
to regional-scale coastal flooding from hurricanes, and to watershed-scale river flow 13
excursions from weather variations superimposed upon, or possibly augmented by, 14
climate change. Spatial scale can range from kilometers to continent-scale; temporal scale 15
can range from hours to multi-year. Energy impacts of episodic events can linger for 16
months or years as illustrated by the continuing loss of oil and gas production in the 17
GOM (MMS, 2006a, 2006b, and 2006c) eight months after the 2005 hurricanes. 18
19
3.1.1 Thermoelectric Power Generation 20
21
Climate change impacts on electricity generation at fossil and nuclear power plants are 22
likely to be similar. The most direct climate impacts are related to power plant cooling 23
and water availability. 24
25
Predicted changes in water availability throughout the world would directly affect the 26
availability of water to existing power plants. While there is uncertainty in the nature 27
and amount of the change in water availability in specific locations, there is agreement 28
among climate models that there will be a redistribution of water, as well as changes in 29
the availability by season. As currently designed, power plants require significant 30
amounts of water and they will be vulnerable to fluctuations in water supply. Regional- 31
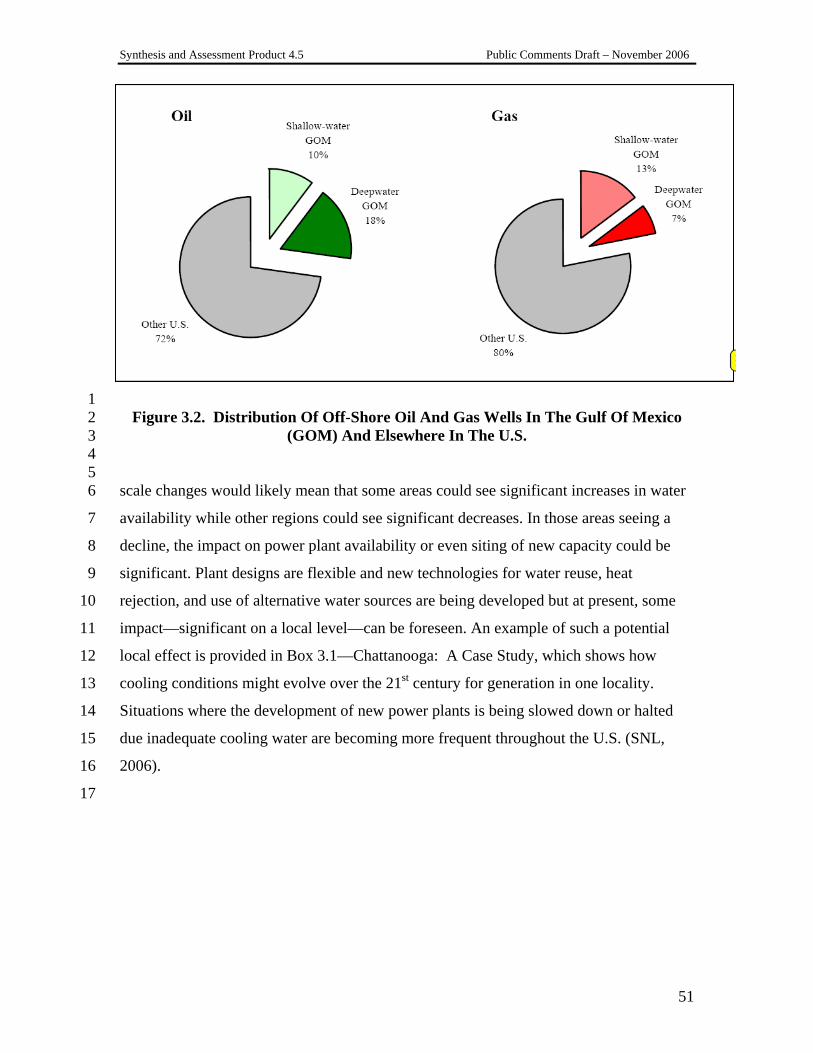
Synthesis and Assessment Product 4.5 Public Comments Draft – November 2006
51
1 Figure 3.2. Distribution Of Off-Shore Oil And Gas Wells In The Gulf Of Mexico 2
(GOM) And Elsewhere In The U.S. 3 4 5
scale changes would likely mean that some areas could see significant increases in water 6
availability while other regions could see significant decreases. In those areas seeing a 7
decline, the impact on power plant availability or even siting of new capacity could be 8
significant. Plant designs are flexible and new technologies for water reuse, heat 9
rejection, and use of alternative water sources are being developed but at present, some 10
impact—significant on a local level—can be foreseen. An example of such a potential 11
local effect is provided in Box 3.1—Chattanooga: A Case Study, which shows how 12
cooling conditions might evolve over the 21st century for generation in one locality. 13
Situations where the development of new power plants is being slowed down or halted 14
due inadequate cooling water are becoming more frequent throughout the U.S. (SNL, 15
2006). 16
17
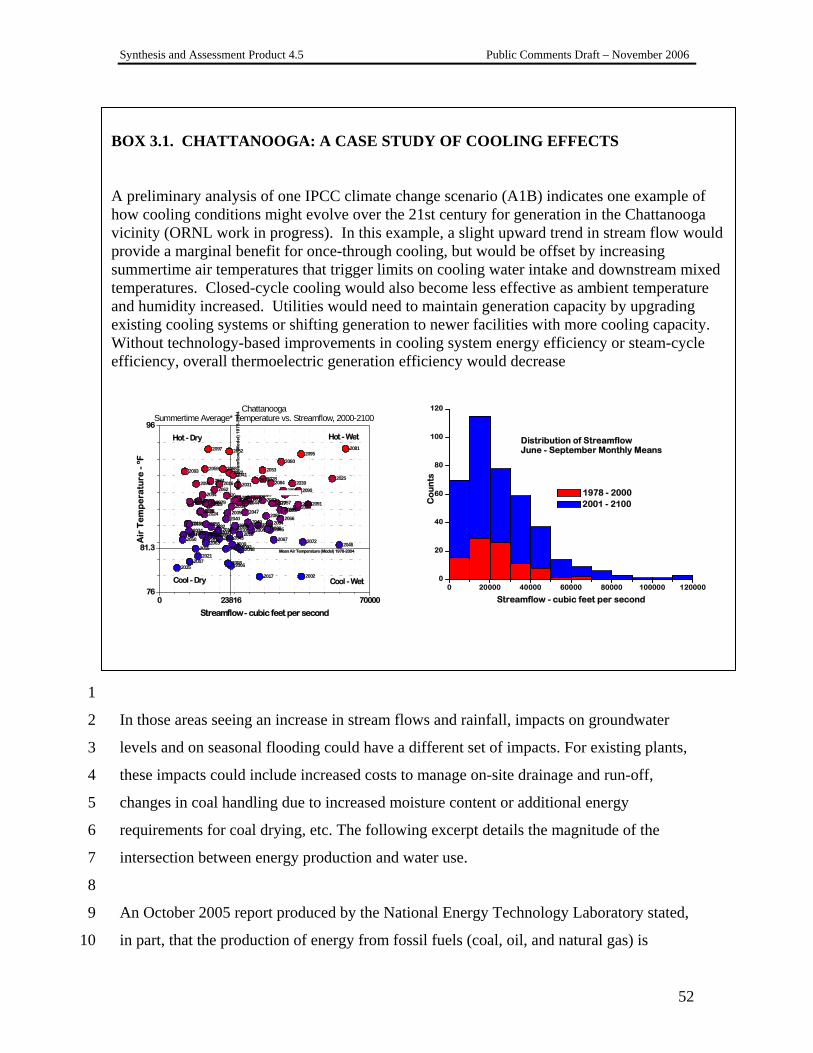
Synthesis and Assessment Product 4.5 Public Comments Draft – November 2006
52
BOX 3.1. CHATTANOOGA: A CASE STUDY OF COOLING EFFECTS
A preliminary analysis of one IPCC climate change scenario (A1B) indicates one example of how cooling conditions might evolve over the 21st century for generation in the Chattanooga vicinity (ORNL work in progress). In this example, a slight upward trend in stream flow would provide a marginal benefit for once-through cooling, but would be offset by increasing summertime air temperatures that trigger limits on cooling water intake and downstream mixed temperatures. Closed-cycle cooling would also become less effective as ambient temperature and humidity increased. Utilities would need to maintain generation capacity by upgrading existing cooling systems or shifting generation to newer facilities with more cooling capacity. Without technology-based improvements in cooling system energy efficiency or steam-cycle efficiency, overall thermoelectric generation efficiency would decrease
0 23816 7000076
81.3
96
2000
2001
2002
2003
2004
2005
20062007 2008
2009
20102011 2012
20132014
2015
2016
2017
2018
20192020
2021
2022
20232024
2025
20262027
2028
2029
2030
2031
20322033
2034
2035
20362037
2038
2039
2040
2041
2042 2043
20442045
2046
2047
2048
2049
2050
2051
2052
2053
2054
2055
2056
20572058
2059
2060
2061
2062
2063
20642065
2066
2067
2068
20692070 2071
2072
20732074
2075
207620772078 2079
2080
2081
2082
2083
2084
2085
2086
20872088
20892090
2091
2092
2093
2094
2095
2096
2097
2098
2099
Hot - Wet
Cool - WetCool - Dry
Me
an
Str
ea
mfl
ow
(M
od
el)
19
78
-20
04
Air
Te
mp
era
ture
- º
F
Streamflow - cubic feet per second
ChattanoogaSummertime Average* Temperature vs. Streamflow, 2000-2100
Mean Air Temperature (Model) 1978-2004
Hot - Dry
0
20
40
60
80
100
120
2001 - 2100Co
un
tsDistribution of StreamflowJune - September Monthly Means
0 20000 40000 60000 80000 100000 120000
1978 - 2000
Streamflow - cubic feet per second
1
In those areas seeing an increase in stream flows and rainfall, impacts on groundwater 2
levels and on seasonal flooding could have a different set of impacts. For existing plants, 3
these impacts could include increased costs to manage on-site drainage and run-off, 4
changes in coal handling due to increased moisture content or additional energy 5
requirements for coal drying, etc. The following excerpt details the magnitude of the 6
intersection between energy production and water use. 7
8
An October 2005 report produced by the National Energy Technology Laboratory stated, 9
in part, that the production of energy from fossil fuels (coal, oil, and natural gas) is 10
Synthesis and Assessment Product 4.5 Public Comments Draft – November 2006
53
inextricably linked to the availability of adequate and sustainable supplies of water. 1
While providing the United States with a majority of its annual energy needs, fossil fuels 2
also place a high demand on the Nation’s water resources in terms of both use and quality 3
impacts (EIA, 2005d). Thermoelectric generation is water intensive – on average each 4
kWh of electricity generated via the steam cycle requires approximately 25 gallons of 5
water (This number is a weighted average that captures total thermoelectric water 6
withdrawals and generation for both once-through and recirculating cooling systems) to 7
produce. According to the United States Geological Survey (USGS), power plants rank 8
only slightly behind irrigation in terms of freshwater withdrawals in the United States 9
(USGS, 2004), although irrigation withdrawals tend to be more consumptive). Water is 10
also required in the mining, processing, and transportation of coal to generate electricity 11
all of which can have direct impacts on water quality. Surface and underground coal 12
mining can result in acidic, metal-laden water that must be treated before it can be 13
discharged to nearby rivers and streams. In addition, the USGS estimates that in 2000 the 14
mining industry withdrew approximately 2 billion gallons per day of freshwater. 15
Although not directly related to water quality, about 10% of total U.S. coal shipments 16
were delivered by barge in 2003 (USGS, 2004). Consequently, low river flows can 17
create shortfalls in coal inventories at power plants. 18
19
Freshwater availability is also a critical limiting factor in economic development and 20
sustainability and directly impacts electric-power supply. A 2003 study conducted by the 21
Government Accountability Office indicates that 36 states anticipate water shortages in 22
the next ten years under normal water conditions, and 46 states expect water shortages 23
under drought conditions (GAO, 2003). Water supply and demand estimates by the 24
Electric Power Research Institute (EPRI) for the years 1995 and 2025 also indicate a high 25
likelihood of local and regional water shortages in the United States (EPRI, 2003). The 26
area that is expected to face the most serious water constraints is the arid southwestern 27
United States. 28
29
In any event, the demand for water for thermoelectric generation will increasingly 30
compete with demands from other sectors of the economy such as agriculture, domestic, 31
Synthesis and Assessment Product 4.5 Public Comments Draft – November 2006
54
commercial, industrial, mining, and in-stream use. EPRI projects the potential for future 1
constraints on thermoelectric power in 2025 for Arizona, Utah, Texas, Louisiana, 2
Georgia, Alabama, Florida, and all of the Pacific Coast states. Competition over water in 3
the western United States, including water needed for power plants, led to a 2003 4
Department of Interior initiative to predict, prevent, and alleviate water-supply conflicts 5
(DOI, 2003). Other areas of the United States are also susceptible to freshwater shortages 6
as a result of drought conditions, growing populations, and increasing demand. 7
8
Concern about water supply expressed by state regulators, local decision-makers, and the 9
general public is already impacting power projects across the United States. For example, 10
Arizona recently rejected permitting for a proposed power plant because of concerns 11
about how much water it would withdraw from a local aquifer (Land Letter, 2004). An 12
existing Entergy plant located in New York is being required to install a closed-cycle 13
cooling water system to prevent fish deaths resulting from operation of its once-through 14
cooling water system (Greenwire, 2003). Water availability has also been identified by 15
several Southern States Energy Board member states as a key factor in the permitting 16
process for new merchant power plants (Clean Air Task Force, 2004). In early 2005, 17
Governor Mike Rounds of South Dakota called for a summit to discuss drought-induced 18
low flows on the Missouri River and the impacts on irrigation, drinking-water systems, 19
and power plants (Billingsgazette.com. 2005). Residents of Washoe County, Nevada 20
expressed opposition to a proposed coal-fired power plant in light of concerns about how 21
much water the plant would use (Reno-Gazette Journal. 2005). Another coal-fired 22
power plant to be built in Wisconsin on Lake Michigan has been under attack from 23
environmental groups because of potential effects of the facility’s cooling-water-intake 24
structures on the Lake’s aquatic life (Milwaukee Journal Sentinel, 2005). 25
26
Such events point towards a likely future of increased conflicts and competition for the 27
water the power industry will need to operate their thermoelectric generation capacity. 28
These conflicts will be national in scope, but regionally driven. It is likely that power 29
plants in the west will be confronted with issues related to water rights, that is, who owns 30
the water and the impacts of chronic and sporadic drought. In the east, current and future 31

Synthesis and Assessment Product 4.5 Public Comments Draft – November 2006
55
environmental requirements, such as the Clean Water Act’s intake structure regulation, 1
could be the most significant impediment to securing sufficient water, although local 2
drought conditions can also impact water availability. If changing climatic conditions 3
affect historical patterns of precipitation, this may further complicate operations of 4
existing plants, and the design and site selection of new units. 5
6
EIA reports (EIA, 2004) net summer and winter capacity for existing generating capacity 7
by fuel source. Coal-fired and nuclear have summer/winter ratios of 0.99 and 0.98 and 8
average plant sizes of 220 MW and 1015 MW respectively. Petroleum, natural gas and 9
dual fuel-fired plants show summer/winter net capacity ratios of 0.90 to 0.93, indicating 10
higher sensitivity to ambient temperature. Average sizes of these plants ranged from 12 11
MW to 84 MW, consistent with them being largely peaking and intermediate load units. 12
Although large coal and nuclear generating plants report little degradation of net 13
generating capacity from winter to summer conditions, there are reports (University of 14
Missouri-Columbia, 2004) of plant derating and shutdowns caused by temperature-15
related river water level changes and thermal limits on water discharges. Actual 16
generation in 2004 (EIA, 2004) show coal-fired units with 32% of installed capacity 17
provided 49.8% of generation and nuclear units with 10% of installed capacity provided 18
17.8% of power generated, indicating that these sources are much more heavily 19
dispatched than are petroleum, natural gas and dual-fired sources. To date, this difference 20
has been generally attributed to the lower variable costs of coal and nuclear generation, 21
indicating that the lower average dispatch has been more driven by fuel costs than 22
temperature-related capacity constraints. 23
24
Gas turbines, in their varied configurations, provide about 20% of the electric power 25
produced in the U.S. (EIA, 2006). Gas turbines in natural gas simple cycle, combined 26
cycle (gas and steam turbine) and coal based integrated gasification combined cycle 27
applications are effected by local ambient conditions. These conditions include for the 28
most part local ambient temperature and pressure. Ambient temperature and pressure 29
conditions have an immediate impact on gas turbine performance. Turbine performance 30
is measured in terms of heat rate (efficiency) and power output. Davcock et al., 31
Synthesis and Assessment Product 4.5 Public Comments Draft – November 2006
56
(Davcock, DesJardins, and Fennell, 2004) found that a 60oF increase in ambient 1
temperature, as might be experienced daily in a desert environment, would have a 1-2
2 percentage point reduction in efficiency and a 20-25% reduction in power output. This 3
effect is nearly linear, so a 10 degree Fahrenheit increase in ambient temperature would 4
produce as much as a 0.5 percentage point reduction in efficiency and a 3-4% reduction 5
in power output in an existing gas turbine. Therefore, the impact of potential climate 6
change on the fleet of existing turbines would be driven by the impact that small changes 7
in overall performance would have on both the total capacity available at any time and 8
the actual cost of electricity. 9
10
Turbines for NGCC and IGCC facilities are designed to run 24 hours, seven days a week 11
but simple cycle turbines used in topping and intermediate service are designed for 12
frequent startups and rapid ramp rates to accommodate grid dispatch requirements. Local 13
ambient temperature conditions will normally vary by 10 – 20 oF on a 24 hour cycle and 14
many temperate-zone areas have winter-summer swings in average ambient temperature 15
of 25-35 oF. Consequently, any long term climate change that would impact ambient 16
temperature is believed to be on a scale within the design envelope of currently deployed 17
turbines. As noted earlier, both turbine power output and efficiency vary with ambient 18
temperature deviation from the design point. The primary impacts of longer periods of 19
off-design operation will be modestly reduced capacity and reduced efficiency. Currently 20
turbine-based power plants are deployed around the world in a wide variety of ambient 21
conditions and applications, indicating that new installations can be designed to address 22
long-term changes in operating conditions. In response to the range of operating 23
temperatures and pressures to which gas turbines are being subjected, turbine designers 24
have developed a host of tools for dealing with daily and local ambient conditions. These 25
tools include inlet guide vanes, inlet air fogging (essentially cooling and mass flow 26
addition), inlet air filters and compressor blade washing techniques (to deal with salt and 27
dust deposited on compressor blades). These tools could also be deployed to address 28
changes in ambient conditions brought about by long term climate change. 29
30
Synthesis and Assessment Product 4.5 Public Comments Draft – November 2006
57
3.1.2 Energy Resource Production And Delivery 1
2
Other than for renewable energy sources, energy resource production and delivery 3
systems are mainly vulnerable to effects of sea level rise and extreme weather events. 4
5
The IPCC (IPCC, 2001a) estimated a 50 cm. (20 inch) rise in sea level around North 6
America in the next century from climate change alone. This is well within the normal 7
tidal range and would not have any significant effect on off-shore oil and gas activities. 8
On-shore oil and gas activities could be much more impacted which could create 9
derivative impacts on off-shore activities. 10
11
A number of operational power plants are sited at elevations of 3 feet or less, making 12
them vulnerable to these rising sea levels. In addition, low lying coastal regions are being 13
considered for the siting of new plants due to the obvious advantages in delivering fuel 14
and other necessary feedstocks. Significant percentages of other energy infrastructure 15
assets are located in these same areas including a number of the nation's oil refineries as 16
well as most coal import/export facilities and liquefied natural gas terminals. Given that a 17
large percentage of the Nation’s energy infrastructure lies along the coast, rising sea 18
levels could lead to direct losses such as equipment damage from flooding or erosion, or 19
indirect effects such as the costs of raising vulnerable assets to higher levels or building 20
future energy projects further inland, thus increasing transportation costs. 21
22
IPCC, 2001a and USGS, 2000, have identified substantial areas of the US East Coast and 23
Gulf Coast as being vulnerable to sea-level rise. Roughly one-third of US refining and 24
gas processing physical plant lies on coastal plains adjacent to the GOM, hence is 25
vulnerable to inundation, shoreline erosion, and storm surges. On-shore, but non-coastal 26
oil and gas production and processing activities may be impacted by climate change 27
primarily as it impacts extreme weather events, phenomena not presently well 28
understood. 29
30
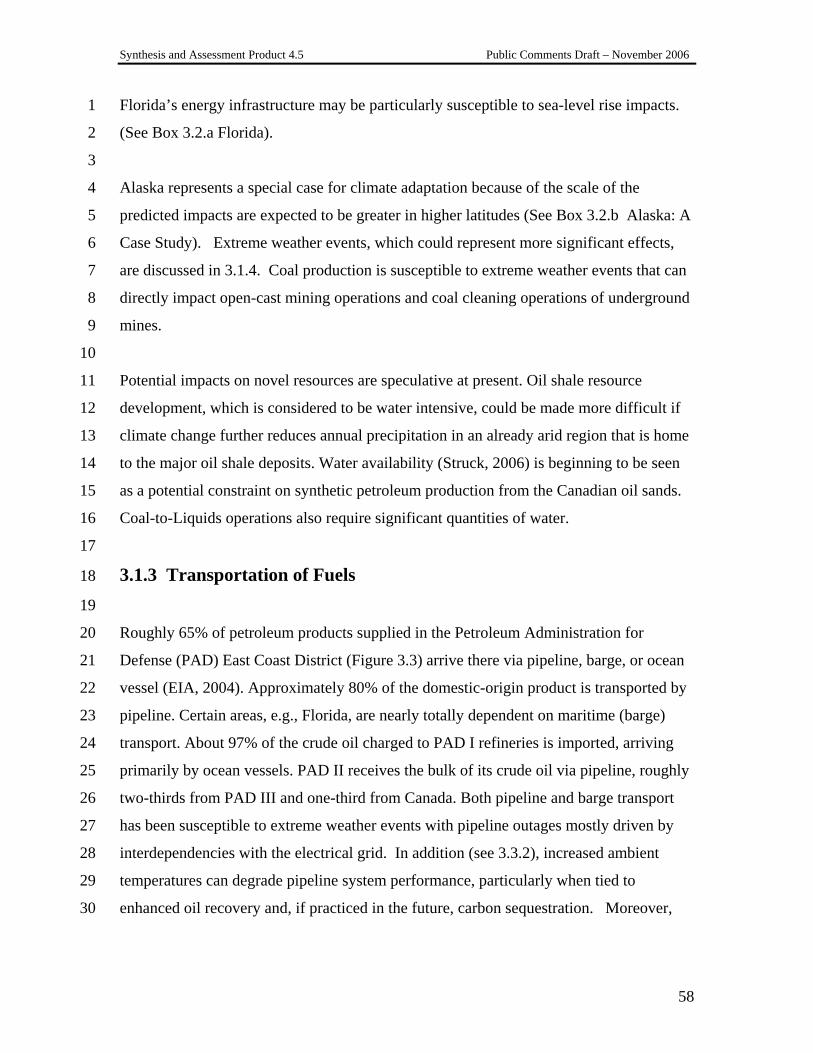
Synthesis and Assessment Product 4.5 Public Comments Draft – November 2006
58
Florida’s energy infrastructure may be particularly susceptible to sea-level rise impacts. 1
(See Box 3.2.a Florida). 2
3
Alaska represents a special case for climate adaptation because of the scale of the 4
predicted impacts are expected to be greater in higher latitudes (See Box 3.2.b Alaska: A 5
Case Study). Extreme weather events, which could represent more significant effects, 6
are discussed in 3.1.4. Coal production is susceptible to extreme weather events that can 7
directly impact open-cast mining operations and coal cleaning operations of underground 8
mines. 9
10
Potential impacts on novel resources are speculative at present. Oil shale resource 11
development, which is considered to be water intensive, could be made more difficult if 12
climate change further reduces annual precipitation in an already arid region that is home 13
to the major oil shale deposits. Water availability (Struck, 2006) is beginning to be seen 14
as a potential constraint on synthetic petroleum production from the Canadian oil sands. 15
Coal-to-Liquids operations also require significant quantities of water. 16
17
3.1.3 Transportation of Fuels 18
19
Roughly 65% of petroleum products supplied in the Petroleum Administration for 20
Defense (PAD) East Coast District (Figure 3.3) arrive there via pipeline, barge, or ocean 21
vessel (EIA, 2004). Approximately 80% of the domestic-origin product is transported by 22
pipeline. Certain areas, e.g., Florida, are nearly totally dependent on maritime (barge) 23
transport. About 97% of the crude oil charged to PAD I refineries is imported, arriving 24
primarily by ocean vessels. PAD II receives the bulk of its crude oil via pipeline, roughly 25
two-thirds from PAD III and one-third from Canada. Both pipeline and barge transport 26
has been susceptible to extreme weather events with pipeline outages mostly driven by 27
interdependencies with the electrical grid. In addition (see 3.3.2), increased ambient 28
temperatures can degrade pipeline system performance, particularly when tied to 29
enhanced oil recovery and, if practiced in the future, carbon sequestration. Moreover, 30
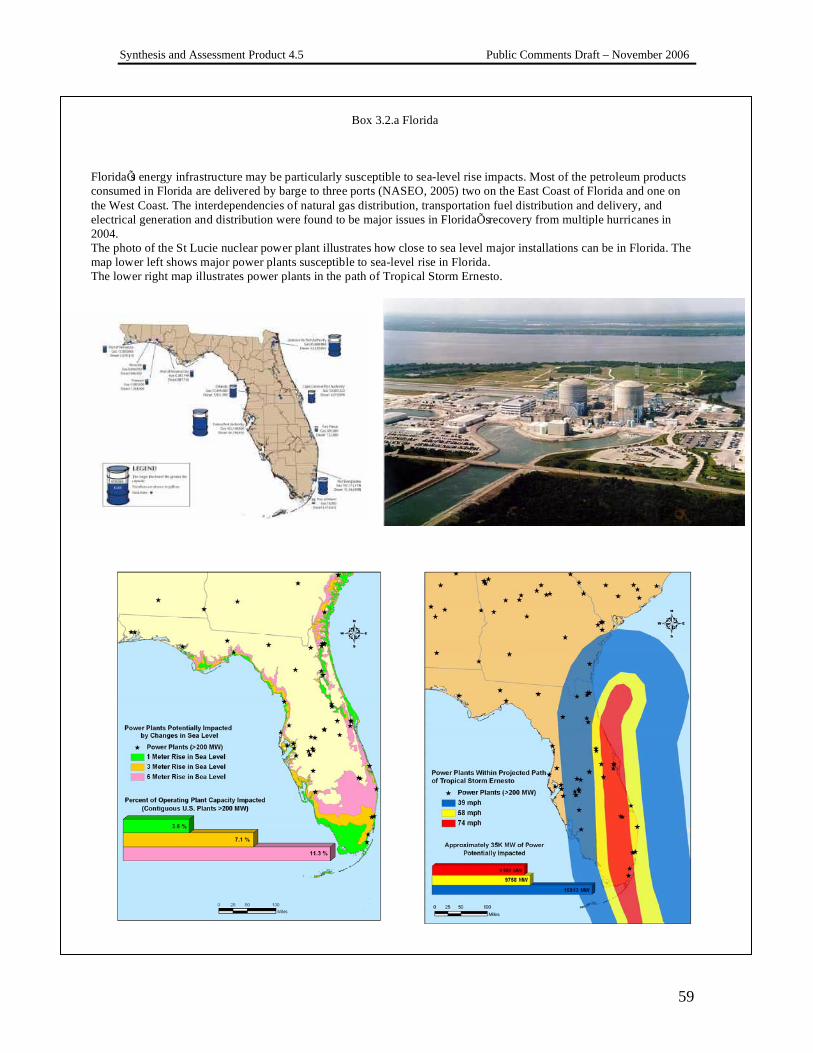
Synthesis and Assessment Product 4.5 Public Comments Draft – November 2006
59
Box 3.2.a Florida FloridaÕs energy infrastructure may be particularly susceptible to sea-level rise impacts. Most of the petroleum products consumed in Florida are delivered by barge to three ports (NASEO, 2005) two on the East Coast of Florida and one on the West Coast. The interdependencies of natural gas distribution, transportation fuel distribution and delivery, and electrical generation and distribution were found to be major issues in FloridaÕs recovery from multiple hurricanes in 2004. The photo of the St Lucie nuclear power plant illustrates how close to sea level major installations can be in Florida. The map lower left shows major power plants susceptible to sea-level rise in Florida. The lower right map illustrates power plants in the path of Tropical Storm Ernesto.

Synthesis and Assessment Product 4.5 Public Comments Draft – November 2006
60
BOX 3.2. ALASKA: A CASE STUDY Alaska represents a special case for climate adaptation where temperatures have risen (3°C) over the last few decades, a rate that is almost twice as that of the rest off the world. Some models predict this warming trend will continue, with temperatures possibly rising as much as 4-7C over the next 100 years. 1 In areas of Alaska’s North Slope, change is already being observed. The number of days allowed for winter tundra travel dropped significantly since the state began to set the tundra opening date in 1969, and a chart of that decline has been widely used to illustrate one effect of a warming Arctic. 1 There is a significant economic impact on oil and natural gas exploration from a shorter tundra travel season, especially since exploration targets have moved farther away from the developed Prudhoe Bay infrastructure, requiring more time for ice road building. It is unlikely that the oil industry can implement successful exploration and development plans with a winter work season consistently less than 120 days. Further, melting permafrost can cause subsidence of the soil, thereby threatening the structural integrity of infrastructure built upon it. It was anticipated that the Trans-Alaska Pipeline System would melt
surrounding permafrost in the areas where it would be buried. Therefore, extensive soil sampling was conducted, and in areas where permafrost soils were determined to be thaw-stable, conventional pipeline building techniques were utilized. But in ice-rich soils, the ground is generally not stable after the permafrost melts. Therefore, unique above ground designs integrating thermal siphons were used to remove heat transferred into the permafrost via the pilings used to support the pipeline. And in a few selected areas where above ground construction was not feasible, the ground around the pipeline is artificially chilled. 1,1 Such extensive soil testing and unique building techniques add substantial cost to large development projects undertaken in arctic climates, but are necessary to ensure the long term viability of the infrastructure. Exploration in the Arctic may benefit from thinning sea ice. Recent studies indicate extent of sea ice covering the Arctic Ocean may have reduced as much as 10 percent, and thinned by as much as 15 percent, over the past few decades. These trends suggest improved shipping accessibility around the margins of the Arctic Basin with major implications for the delivery of goods as well as products such as LNG and oil from high latitude basins.1 A reduction in sea ice may also mean increased off-shore oil exploration.
1
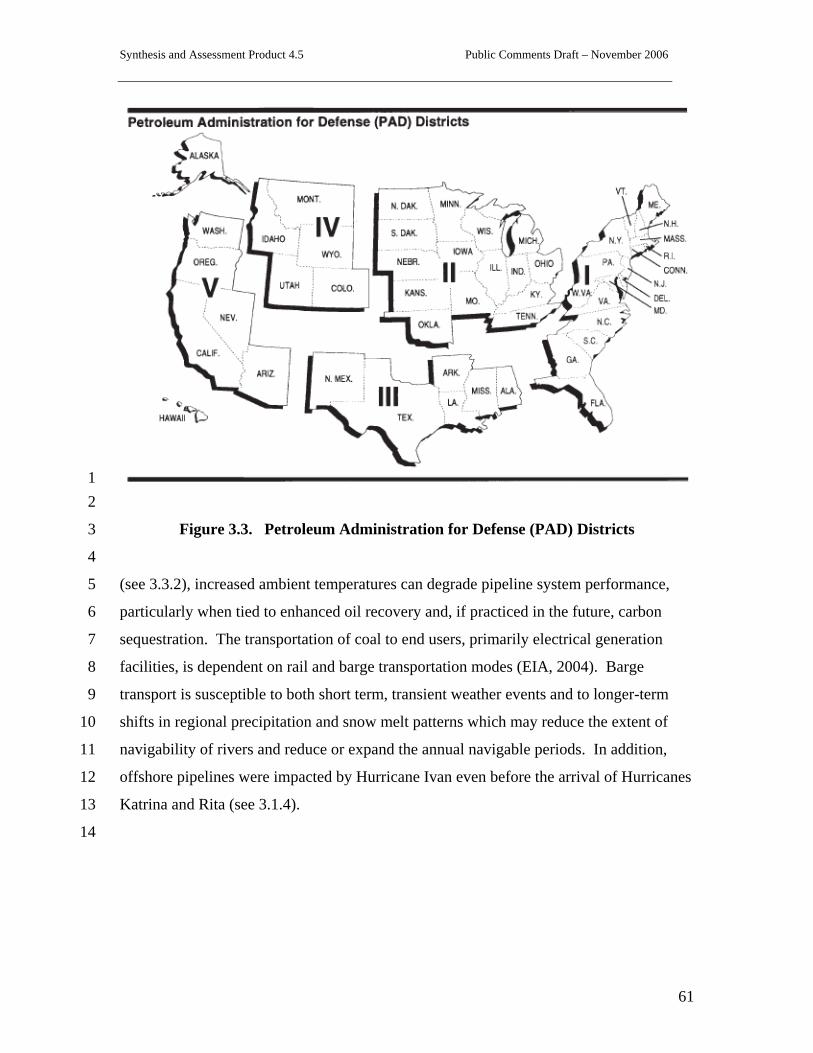
Synthesis and Assessment Product 4.5 Public Comments Draft – November 2006
61
1 2
Figure 3.3. Petroleum Administration for Defense (PAD) Districts 3
4
(see 3.3.2), increased ambient temperatures can degrade pipeline system performance, 5
particularly when tied to enhanced oil recovery and, if practiced in the future, carbon 6
sequestration. The transportation of coal to end users, primarily electrical generation 7
facilities, is dependent on rail and barge transportation modes (EIA, 2004). Barge 8
transport is susceptible to both short term, transient weather events and to longer-term 9
shifts in regional precipitation and snow melt patterns which may reduce the extent of 10
navigability of rivers and reduce or expand the annual navigable periods. In addition, 11
offshore pipelines were impacted by Hurricane Ivan even before the arrival of Hurricanes 12
Katrina and Rita (see 3.1.4). 13
14
Synthesis and Assessment Product 4.5 Public Comments Draft – November 2006
62
3.1.4 Extreme Events 1
2
Climate change may cause significant shifts in current weather patterns and increase the 3
severity and frequency of major storms (NRC, 2002). As witnessed in 2005, hurricanes 4
can have a debilitating impact on energy infrastructure. Direct losses to the energy 5
industry are estimated at $15 billion dollars (Marketwatch.com, 2006), with millions 6
more in restoration and recovery costs. Future energy projects located in storm prone 7
areas will face increased capital costs of hardening their assets due to both legislative and 8
insurance pressures. For example, the Yscloskey Gas Processing Plant was forced to 9
close for six months following Hurricane Katrina, resulting in both lost revenues to the 10
plant’s owners and higher prices to consumers as alternative gas sources had to be 11
procured. In general, the incapacitation of energy infrastructure – especially of 12
refineries, gas processing plants and petroleum product terminals – is widely credited 13
with driving a price spike in fuel prices across the country, which then in turn has 14
national consequences. The potential impacts of more severe weather are not limited to 15
hurricane-prone areas. Rail transportation lines, which transport approximately 2/3 of the 16
coal to the nation’s power plants (EIA, 2002), often closely follow riverbeds, especially 17
in the Appalachian region. More severe rain storms can lead to flooding of rivers which 18
then can wash out or degrade the nearby roadbeds. Flooding may also disrupt the 19
operation of inland waterways, the second-most important method of transporting coal. 20
With utilities carrying smaller stockpiles and projections showing a growing reliance on 21
coal for a majority of the nation’s electricity production, any significant disruption to the 22
transportation network has serious implications for the overall reliability of the grid as a 23
whole. 24
25
Off-shore production is susceptible to extreme weather events. Hurricane Ivan (2004) 26
destroyed seven GOM platforms, significantly damaged 24 platforms, and damaged 102 27
pipelines (MMS, 2006). Hurricanes Katrina and Rita in 2005 destroyed more than 100 28
platforms and damaged 558 pipelines (MMS, 2006). Figures 3.4a, b, c, and d show the 29
typhoon and Mars deepwater platforms before and after the 2005 hurricanes. The $250 30
million Typhoon platform was so severely damaged that Chevron is working with the 31
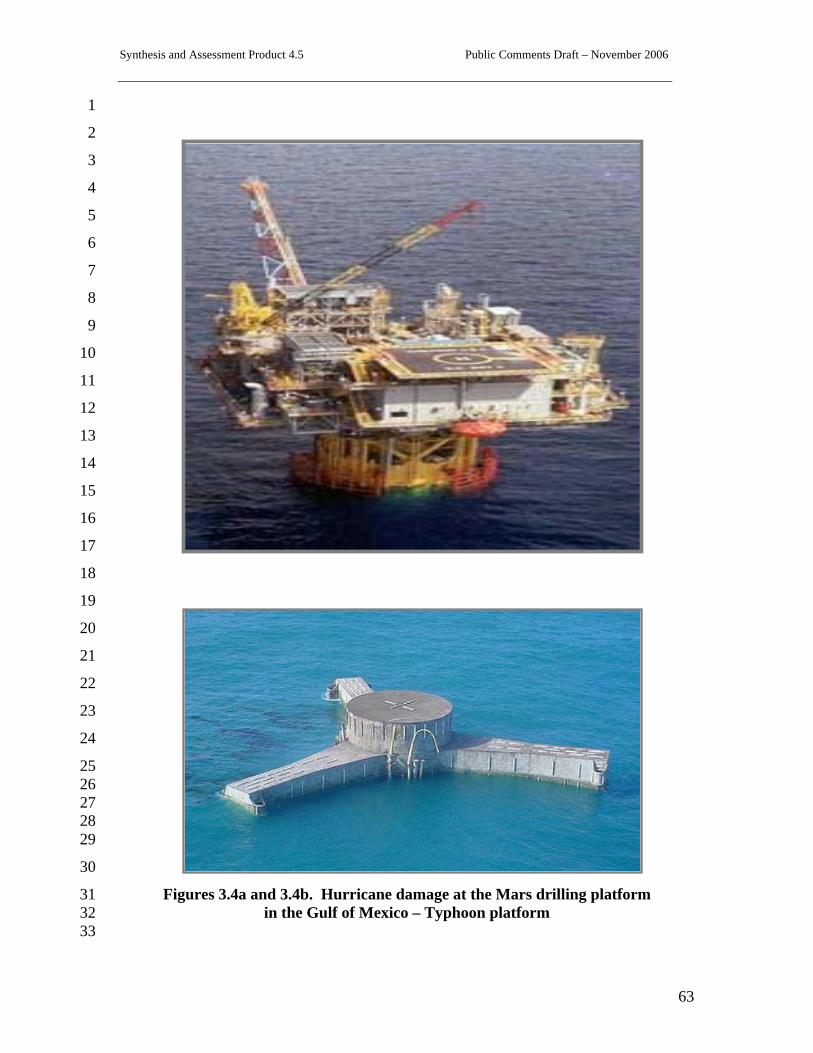
Synthesis and Assessment Product 4.5 Public Comments Draft – November 2006
63
1
2
3
4
5
6
7
8
9
10
11
12
13
14
15
16
17
18
19
20
21
22
23
24
25 26 27
28 29
30
Figures 3.4a and 3.4b. Hurricane damage at the Mars drilling platform 31 in the Gulf of Mexico – Typhoon platform 32
33
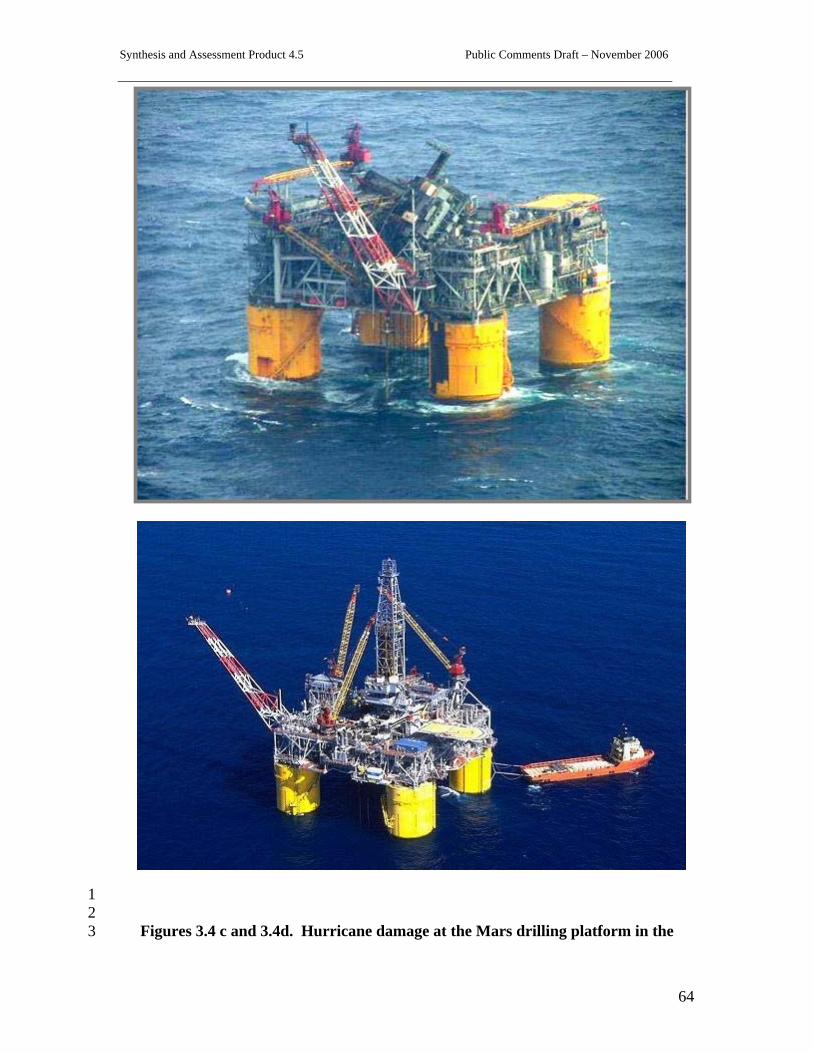
Synthesis and Assessment Product 4.5 Public Comments Draft – November 2006
64
1 2
Figures 3.4 c and 3.4d. Hurricane damage at the Mars drilling platform in the 3

Synthesis and Assessment Product 4.5 Public Comments Draft – November 2006
65
Gulf of Mexico – Mars platform 1 2
MMS to sink it as part of he artificial reef program in the GOM; the billion dollar plus 3
Mars platform has been repaired, and returned to production about eight months post-4
hurricane. 5
6
3.1.5 Adaptation to Extreme Events 7
8
Energy assets can be protected from these impacts both by protecting the facility or 9
relocating it to safer areas. Hardening could include reinforcements to walls and roofs, 10
the building of dikes to contain flooding or structural improvements to transmission 11
assets. However, the high cost of relocating or protecting energy infrastructure drives 12
many companies to hedge these costs against potential repair costs if a disaster does 13
strike. For example, it is currently estimated to cost up to $10 billion to build a new 14
refinery from the ground up (Petroleum Institute for Continuing Education, undated) and 15
significant additional costs to fully harden a typical at-risk facility against a hurricane, 16
compared to only a few million dollars in repairs that may or may not be required if a 17
hurricane does strike. Relocation of rail lines also faces a similar dilemma. BNSF’s 18
capacity additions in the Powder River Basin are expected to cost over $200 million 19
dollars to add new track in a relatively flat region with low land prices – changes to rail 20
lines in the Appalachian region would be many times more due to the difficult 21
topography and higher land acquisition costs. 22
23
Industry, government agencies, and the American Petroleum Institute met jointly in 24
March 2006 (API, 2006a) to plan for future extreme weather events. Interim guidelines 25
for jackup (shallow water) rigs (API, 2006b) and for floating rigs (API, 2006c) have been 26
developed. MMS, DOT, and several industry participants have formed a Joint Industry 27
Program (JIP) (Stress Subsea, Inc., 2005) to develop advanced capabilities to repair 28
damaged undersea pipelines. 29
30
31
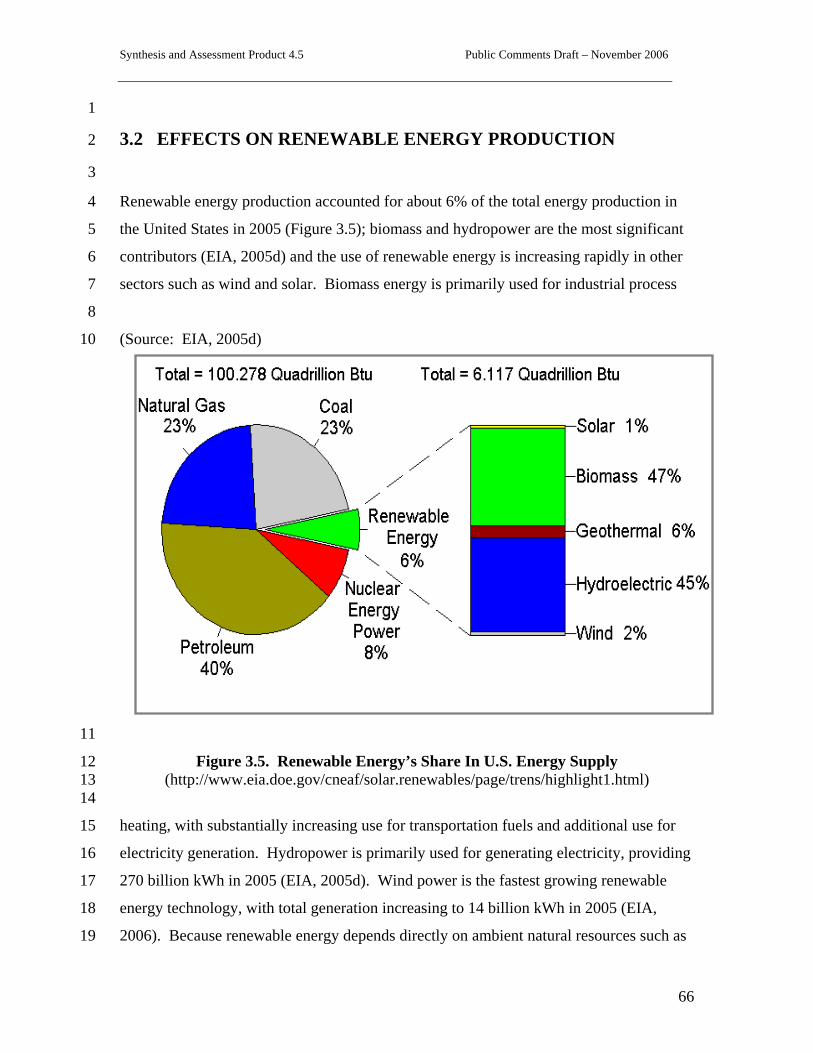
Synthesis and Assessment Product 4.5 Public Comments Draft – November 2006
66
1
3.2 EFFECTS ON RENEWABLE ENERGY PRODUCTION 2
3
Renewable energy production accounted for about 6% of the total energy production in 4
the United States in 2005 (Figure 3.5); biomass and hydropower are the most significant 5
contributors (EIA, 2005d) and the use of renewable energy is increasing rapidly in other 6
sectors such as wind and solar. Biomass energy is primarily used for industrial process 7
8
(Source: EIA, 2005d) 10
11
Figure 3.5. Renewable Energy’s Share In U.S. Energy Supply 12 (http://www.eia.doe.gov/cneaf/solar.renewables/page/trens/highlight1.html) 13
14
heating, with substantially increasing use for transportation fuels and additional use for 15
electricity generation. Hydropower is primarily used for generating electricity, providing 16
270 billion kWh in 2005 (EIA, 2005d). Wind power is the fastest growing renewable 17
energy technology, with total generation increasing to 14 billion kWh in 2005 (EIA, 18
2006). Because renewable energy depends directly on ambient natural resources such as 19
Synthesis and Assessment Product 4.5 Public Comments Draft – November 2006
67
hydrological resources, wind patterns and intensity, and solar radiation, it is likely to be 1
more sensitive to climate variability than fossil or nuclear energy systems that rely on 2
geological stores. Renewable energy systems are also vulnerable to damage from extreme 3
weather events. At the same time, increasing renewable energy production is a primary 4
means for reducing energy related greenhouse gas emissions and thereby mitigating the 5
impacts of potential climate change. Renewable energy sources are therefore connected 6
with climate change in very complex ways: their use can affect the magnitude of climate 7
change, while the magnitude of climate change can affect their prospects for use. 8
9
3.2.1 Hydroelectric Power 10
11
Hydropower is the largest renewable source of electricity in the United States. In the 12
period 2000-2004, hydropower produced approximately 75% of the electricity from all 13
renewable sources (EIA, 2005d). In addition to being a major source of base-load 14
electricity in some regions of the United States (e.g., Pacific Northwest states), 15
hydropower plays an important role in stabilizing electrical transmission grids, meeting 16
peak loads and regional reserve requirements for generation, and providing other 17
ancillary electrical energy benefits that are not available from other renewables. 18
Hydropower project design and operation is very diverse; projects vary from storage 19
projects with large, multipurpose reservoirs to small run-of-river projects that have little 20
or no active water storage. Approximately half of the U.S. hydropower capacity is 21
federally owned and operated (e.g., Corps of Engineers, Bureau of Reclamation, and the 22
Tennessee Valley Authority); the other half is at nonfederal projects that are regulated by 23
the Federal Energy Regulatory Commission. Nonfederal hydropower projects outnumber 24
federal projects by more than 10:1. 25
26
The interannual variability of hydropower generation in the United States is very high, 27
especially relative to other energy sources (Figure 3.6). The difference between the most 28
recent high (2003) and low (2001) generation years is 59 billion kWh, approximately 29
equal to the total electricity from biomass sources and much more than the generation 30
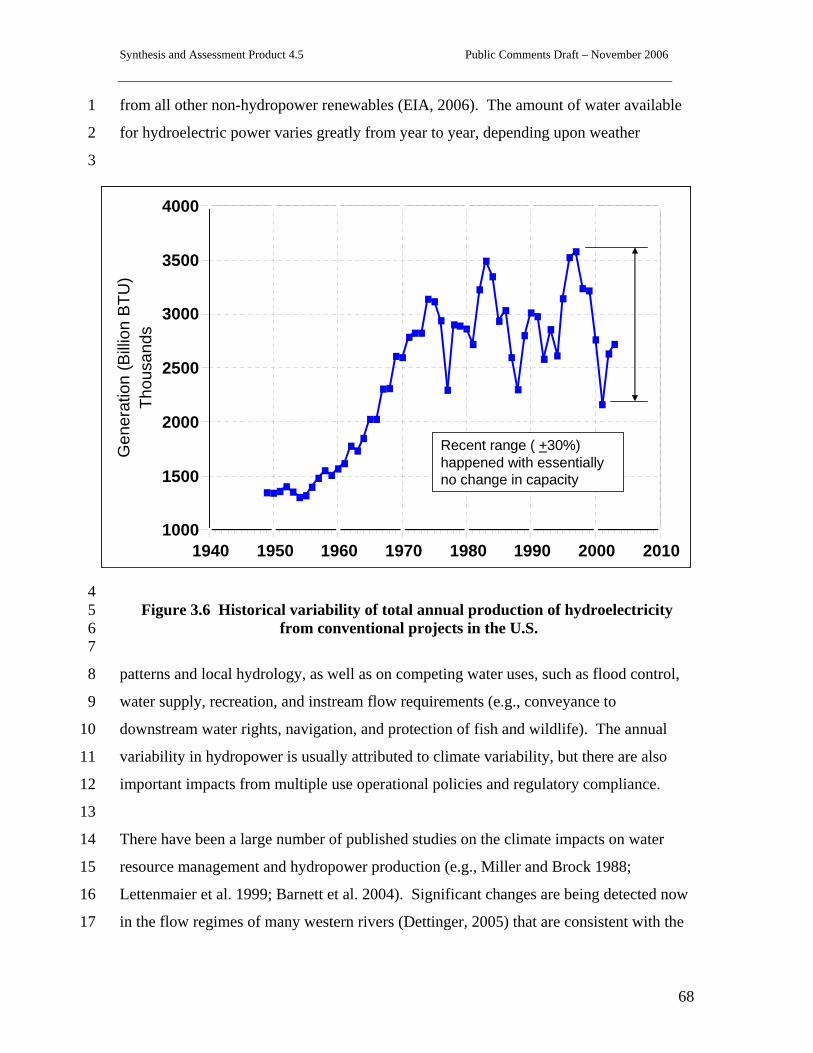
Synthesis and Assessment Product 4.5 Public Comments Draft – November 2006
68
from all other non-hydropower renewables (EIA, 2006). The amount of water available 1
for hydroelectric power varies greatly from year to year, depending upon weather 2
3
4 Figure 3.6 Historical variability of total annual production of hydroelectricity 5
from conventional projects in the U.S. 6 7
patterns and local hydrology, as well as on competing water uses, such as flood control, 8
water supply, recreation, and instream flow requirements (e.g., conveyance to 9
downstream water rights, navigation, and protection of fish and wildlife). The annual 10
variability in hydropower is usually attributed to climate variability, but there are also 11
important impacts from multiple use operational policies and regulatory compliance. 12
13
There have been a large number of published studies on the climate impacts on water 14
resource management and hydropower production (e.g., Miller and Brock 1988; 15
Lettenmaier et al. 1999; Barnett et al. 2004). Significant changes are being detected now 16
in the flow regimes of many western rivers (Dettinger, 2005) that are consistent with the 17
1940 1950 1960 1970 1980 1990 2000 20101000
1500
2000
2500
3000
3500
4000
Thou
sand
sG
ener
atio
n (B
illio
n B
TU)
Recent range ( +30%) happened with essentially no change in capacity
1940 1950 1960 1970 1980 1990 2000 20101000
1500
2000
2500
3000
3500
4000
Thou
sand
sG
ener
atio
n (B
illio
n B
TU)
Recent range ( +30%) happened with essentially no change in capacity
Synthesis and Assessment Product 4.5 Public Comments Draft – November 2006
69
predicted effects of global warming. The sensitivity of hydroelectric generation to both 1
changes in precipitation and river discharge is high, in the range 1.0 and greater (e.g., 2
sensitivity of 1.0 means 1% change in precipitation results in 1% change in generation). 3
For example, Nash and Gleick (1993) estimated sensitivities up to 3.0 between 4
hydropower generation and stream flow in the Colorado Basin (i.e., change in generation 5
three times the change in stream flow). Such magnifying sensitivities, greater than 1.0, 6
occur because water flows through multiple power plants in a river basin. Climate 7
impacts on hydropower occur when either the total amount or the timing of runoff is 8
altered, for example when natural water storage in snow pack and glaciers is reduced 9
under hotter climates (e.g., melting of glaciers in Alaska and the Rocky Mountains of the 10
U.S.). 11
12
Hydropower operations are also affected indirectly when air temperatures, humidity, or 13
wind patterns are affected by changes in climate, and these driving variables cause 14
changes in water quality and reservoir dynamics. For example, warmer air temperatures 15
and a more stagnant atmosphere cause more intense stratification of reservoirs behind 16
dams and a depletion of dissolved oxygen in hypolimnetic waters (Meyer et al., 1999). 17
Where hydropower dams have tailwaters supporting cold-water fisheries for trout or 18
salmon, warming of reservoir releases may have unacceptable consequences and require 19
changes in project operation that reduce power production. 20
21
Competition for available water resources is another mechanism for indirect impacts of 22
climate change on hydropower. These impacts can have far-reaching consequences 23
through the energy and economic sectors, as happened in the 2000-2001 energy crises in 24
California (Sweeney, 2002). 25
26
Recent stochastic modeling advances in California and elsewhere are showing how 27
hydropower systems may be able to adapt to climate variability by reexamining 28
management policies (Vicuña et al., 2006) The ability of river basins to adapt is 29
proportional to the total active storage in surface water reservoirs (e.g., Aspen 30
Environmental Group and M-Cubed, 2005). Adaptation to potential future climate 31
Synthesis and Assessment Product 4.5 Public Comments Draft – November 2006
70
variability has both near-term and long-term benefits in stabilizing water supplies and 1
energy production (e.g., Georgakakos et al., 2005), but water management institutions are 2
generally slow to take action on such opportunities (Chapter 4). 3
4
3.2.2 Biomass Power and Fuels 5
6
Total biomass energy production has surpassed hydroelectric energy for most years since 7
2000 as the largest U.S. source of renewable energy, providing 47% of renewable or 4% 8
of total U.S. energy in 2005 (EIA 2006). The largest source of that biomass energy 9
(29%) was black liquor from the pulp and paper industry combusted as part of a process 10
to recover pulping chemicals to provide process heat as well as generating electricity. 11
Wood and wood waste from sources such as lumber mills provide more than 19% 12
(industrial sector alone) and combusted municipal solid waste and recovered landfill gas 13
about 16%, respectively, of current U.S. biomass energy (EIA, 2005d). Because energy 14
resource generation is a byproduct of other activities in all these cases, direct impacts of 15
climate change on these or most other sources of biomass power production derived from 16
a waste stream may be limited unless there are significant changes to forest or 17
agricultural productivity that are a source of the waste stream. There are few examples of 18
literature addressing this area, though Edwards notes that climate-change-induced events 19
such as timber die-offs could present short-term opportunity or long-term loss for 20
California (Edwards, 1991). 21
22
Liquid fuel production from biomass is highly visible as a key renewable alternative to 23
imported oil. Current U.S. production is based largely on corn for ethanol and, to a lesser 24
extent, soybeans for biodiesel. Because both crops are used primarily for animal feed, 25
with only small portions going to fuel production, and because both are currently price 26
supported, changes in crop growth rates may not affect their use for fuel in the near term. 27
In the longer term, cellulosic feedstocks may supplant grain and oilseed crops for 28
transportation fuel production from biomass. Cellulosic crop residues such as corn stover 29
and wheat straw would likely be affected by climate change the same way as the crops 30
themselves due to a rise in average temperatures, more extreme heat days, and changes in 31
Synthesis and Assessment Product 4.5 Public Comments Draft – November 2006
71
precipitation patterns and timing, with greater impact on fuel production because that 1
would be their primary use. Potential dedicated cellulosic energy crops for biomass fuel, 2
such as grasses and fast-growing trees, would also be directly affected by climate change. 3
As discussed below, limited literature suggests that for at least one region, one primary 4
energy crop candidate—switchgrass — may benefit from climate change, both from 5
increased temperature and increased atmospheric carbon dioxide levels. 6
7
Approximately 10% of U.S. biomass energy production (EIA 2005d), enough to provide 8
about 2% of U.S. transportation motor fuel (Federal Highway Administration, 2003), 9
currently comes from ethanol made predominantly from corn grown in the Midwest 10
(Iowa, Illinois, Nebraska, Minnesota, and South Dakota are the largest ethanol 11
producers). Climate change sufficient to substantially affect corn production would likely 12
impact the resource base, but corn is price-supported and currently only about 13% of the 13
U.S. corn crop (livestock feed is the predominant use) (RFA, 2006) is used for fuel. 14
Although ethanol production did drop in 1996 following a poor corn crop and associated 15
high prices, the combined influence of various agricultural and fuel incentive and 16
regulatory policies would likely overshadow any near-term impacts of climate change on 17
ethanol production. Production of biodiesel from soybeans—growing rapidly, but still 18
very small—is likely a similar situation. In the long term, however, significant crop 19
changes—and trade-offs between them as they are generally rotated with each other—20
would likely have an impact in the future. Looking at Missouri, Iowa, Nebraska, and 21
Kansas, with an eye toward energy production, Brown, et al., 2000. used a combination 22
of the NCAR climate change scenario, regional climate, and crop productivity models to 23
predict how corn, sorghum, and winter wheat (potential ethanol crops) and soybeans 24
(biodiesel crop) would do under anticipated climate change. Negative impacts from 25
increased temperature, positive impacts from increased precipitation, and positive 26
impacts from increased atmospheric carbon dioxide combined to yield minimal negative 27
change under modest carbon dioxide level increases, but 5% to 12% yield increases with 28
high carbon dioxide level increases. This assessment did not, however, account for 29
potential impact of extreme weather events – particularly the frequency and intensity of 30
Synthesis and Assessment Product 4.5 Public Comments Draft – November 2006
72
events involving hail or prolonged droughts – that may also negatively impact energy 1
crop production. 2
3
Although ethanol production from corn can still increase substantially (mandated to 4
double under the recently enacted renewable fuel standard), it can still only meet a small 5
portion of the need for renewable liquid transportation fuels to displace gasoline if 6
dependence on petroleum imports is to be reduced. Processing the entire projected 2015 7
corn crop to ethanol (highly unrealistic, of course) would only yield about 35 billion 8
gallons of ethanol, less than 14% of the gasoline energy demand projected for that year. 9
Biomass fuel experts are counting on cellulosic biomass as the feedstock to make larger 10
scale renewable fuel production possible. A recent joint study by the U.S. Departments of 11
Agriculture and Energy (USDA and DOE), Biomass as Feedstock for a Bioenergy and 12
Bioproducts Industry: The Technical Feasibility of a Billion-Ton Annual Supply, 13
projected that by 2030, enough biomass could be made available to meet 40% of 2004 14
gasoline demand via cellulosic ethanol production and other technologies. The two 15
largest feedstocks identified are annual crop residues and perennial dedicated energy 16
crops (NREL 2006). 17
18
The primary potential annual crop residues are corn stover—the leaves, stalks, and husks 19
generally now left in the field—and wheat straw. Corn stover is the current DOE research 20
focus in part because it is a residue with no incremental cost to grow and modest cost to 21
harvest, but also particularly because of its potential large volume. Stover volume is 22
roughly equivalent to grain volume and corn is the largest U.S. agricultural crop. As such, 23
it would be affected by climate change in much the same way as the corn crop itself, as 24
described above. 25
26
Frequently discussed potential dedicated perennial energy crops include fast-growing 27
trees such as hybrid poplars and willows and grasses such as switchgrass (ORNL 2006) 28
Switchgrass is particularly attractive because of its large regional adaptability, fast 29
growth rate, and minimal adverse environmental impact. The primary objective of the 30
Brown, et. al. (2000) study referenced above for Missouri, Iowa, Nebraska, and Kansas 31
Synthesis and Assessment Product 4.5 Public Comments Draft – November 2006
73
was to see how climate change would affect growth of switchgrass. The study projected 1
that switchgrass may benefit from both higher temperatures (unlike the grain crops) and 2
higher atmospheric carbon dioxide levels, with yield increasing 74% with the modest 3
CO2 increase and nearly doubling with the higher CO2 increase. Care should be taken in 4
drawing definitive conclusions, however, from this one study. One may not expect the 5
projected impact to be as beneficial for southern regions already warm enough for rapid 6
switchgrass growth or more northern areas still colder than optimal even with climate 7
change, but this analysis has not yet been conducted. 8
9
3.2.3 Wind Energy 10
11
Wind energy currently accounts for about 2.5% of U.S. renewable energy generation but 12
its use is growing rapidly, and it has tremendous potential due to its cost-competitiveness 13
with fossil fuel plants for utility-scale generation and has significant environmental 14
benefits. In addition, wind energy does not use or consume water to generate electricity. 15
Unlike thermoelectric and fossil fuel generation that are inextricably linked to the 16
availability of adequate, sustainable water supplies, wind energy can offer communities 17
in water-stressed areas the option of economically meeting increasing energy needs 18
without increasing demands on valuable water resources. 19
20
Although wind energy will not be impacted by changing water supplies like the other fuel 21
sources, projected climate change impacts, such as changes in seasonal wind patterns or 22
strength, would likely have significant positive or negative impacts because wind energy 23
generation is a function of the cube of the wind speed. One of the barriers slowing wind 24
energy development today is the integration of a variable resource with the utility grid. 25
Increased variability in wind patterns could create additional challenges for accurate wind 26
forecasting for generation and dispatch planning and for the siting of new wind farms. 27
28
In addition to available wind resources, state and federal policy incentives have played a 29
key role in the growth of wind energy. Texas currently produces the most wind power 30
followed by California, Iowa, Minnesota, Oklahoma, and Oregon (AWEA, 31
Synthesis and Assessment Product 4.5 Public Comments Draft – November 2006
74
www.awea.org/projects, 9/06). These regions are expected to continue to be among the 1
leading wind-power areas in the near term. Although North Dakota and South Dakota 2
have modest wind development, they also have tremendous wind potential, particularly 3
as technology and economics allow for development of sites further from major load 4
centers. 5
6
The siting of utility-scale wind generation is highly dependent on proximity and access to 7
the grid and the local wind speed regime. Changes in wind patterns and intensity due to 8
climate change could have an effect on wind energy production at existing sites and 9
planning for future development, depending on the rate and scale of that change. One 10
study modeled wind speed change for the United States divided into northern and 11
southern regions under two climate-change circulation models. Overall, the Hadley 12
Center model suggested minimal decrease in average wind speed, but the Canadian 13
model predicted very significant decreases of 10%–15% (30%–40% decrease in power 14
generation) by 2095. Decreases were most pronounced after 2050, in the fall for both 15
regions, and in the summer for the northern region (Breslow and Sailor, 2002). 16
17
Another study mapped wind power changes in 2050 based on the Hadley Center General 18
Circulation Model—the one suggesting more modest change of the two used by Breslow 19
and Sailor above. For most of the United States, this study predicted decreased wind 20
resources by as much as 10% on an annual basis and 30% on a seasonal basis. Wind 21
power increased for the Texas-Oklahoma region and for the Northern California-Oregon-22
Washington region, although the latter had decreased power in the summer. For the 23
Northern Great Plains and for the mountainous West, however, the authors predicted 24
decreased wind power (Segal et al., 2001). Edwards suggests that warming-induced 25
offshore current changes could intensify summer winds for California and thus increase 26
its wind energy potential (Edwards, 1991). Changes in diurnal wind patters could also 27
have a significant impact on matching of wind power production with daily load 28
demands. 29
Synthesis and Assessment Product 4.5 Public Comments Draft – November 2006
75
1
3.2.4 Solar Energy 2
3
Photovoltaic (PV) electrical generation and solar water heating are suitable for much of 4
the United States, with current deployment primarily in off-grid locations and rooftop 5
systems where state or local tax incentives and utility incentives are present. Utility-scale 6
generation is most attractive in the Southwest with its high direct-radiation resource, 7
where concentrating or high-efficiency PV and solar thermal generation systems can be 8
used. California and Arizona currently have the only existing utility-scale systems (EIA 9
2005d) with additional projects being developed in Colorado, Nevada, and Arizona. 10
11
Pan et al. (2004) modeled changes to global solar radiation through the 2040s based on 12
the Hadley Center circulation model. This study projects a solar resource reduced by as 13
much as 20% seasonally, presumably from increased cloud cover, throughout the 14
country, but particularly in the West with its greater present resource. Increased 15
temperature can also reduce the effectiveness of PV electrical generation and solar 16
thermal energy collection. One international study predicts that a 2% decrease in global 17
solar radiation will decrease solar cell output by 6% overall (Fidje and Martinsen, 2006). 18
Anthropogenic sources of aerosols can also decrease average solar radiation, especially 19
on a regional or localized basis. The relationship between the climate forcing effect of 20
greenhouse gases and aerosols are complex and an area of extensive research. This field 21
would also benefit from further analysis on the nexus between anthropogenic aerosols, 22
climate change, solar radiation, and impacts on solar energy production. 23
24
3.2.5 Other Renewable Energy Sources 25
26
Climate change could affect geothermal energy production (6% of current U.S. 27
renewable energy [EIA 2005d] and concentrating solar power Rankine cycle power 28
plants in the same way that higher temperatures reduce the efficiency of fossil-fuel-boiler 29
electric turbines, but there is no recent research on other potential impacts in this sector 30
due to climate change. For a typical air-cooled binary cycle geothermal plant with a 31
Synthesis and Assessment Product 4.5 Public Comments Draft – November 2006
76
330°F resource, power output will decrease about 1% of rather power for each 1°F rise in 1
air temperature. The United States currently does not make significant use of wave, tidal, 2
or ocean thermal energy, but each of these could be affected by climate change due to 3
changes in average water temperature, temperature gradients, salinity, sea level, wind 4
patterns affecting wave production, and intensity and frequency of extreme weather 5
events. Harrison observes that wave heights in the North Atlantic have been increasing 6
and discusses how wave energy is affected by changes in wind speed (Harrison and 7
Wallace, 2005), but very little existing research has been identified that directly addresses 8
the potential impact of climate change on energy production from wave, tidal, or ocean 9
thermal technologies. 10
11
3.2.6 Summary 12
13
Of the two largest U.S. renewable energy sources, hydroelectric power generation can be 14
expected to be directly and significantly affected by climate change, while biomass 15
power and fuel production impacts are less certain in the short term. The impact on 16
hydroelectric production will vary by region, with potential for production decreases in 17
key areas such as the Columbia River Basin and Northern California. Current U.S. 18
electricity production from wind and solar energy is modest but anticipated to play a 19
significant role in the future as the use of these technologies increases. As such, even 20
modest impacts in key resource areas could substantially impact the cost competitiveness 21
of these technologies due to changes in electricity production and impede the planning 22
and financing of new wind and solar projects due to increased variability of the resource. 23
24
Renewable energy production is highly susceptible to localized and regional changes in 25
the resource base. As a result, the greater uncertainties on regional impacts under current 26
climate change modeling pose a significant challenge in evaluating medium to long term 27
impacts on renewable energy production. 28

Synthesis and Assessment Product 4.5 Public Comments Draft – November 2006
77
1
3.3 EFFECTS ON ENERGY TRANSMISSION, DISTRIBUTION, 2 AND SYSTEM INFRASTRUCTURE 3
4
In addition to the direct effects on operating facilities themselves, networks for transport, 5
electric transmission, and delivery would be susceptible to changes in stream flow, 6
annual precipitation and seasonal patterns, storm severity, and even temperature 7
increases, (e.g., pipelines handling supercritical fluids may be impacted by greater heat 8
loads if temperatures increase and/or cloud cover diminishes). 9
10
3.3.1 Electricity Transmission and Distribution 11
12
Severe weather events and associated flooding cause direct disruptions in energy 13
services. With more intense events, increased disruptions might be expected. Electricity 14
reliability might also be affected as a result of increased demand combined with high soil 15
temperatures and soil dryness (IPCC, 2001a). Figure 3.3.1 illustrates the major grid 16
outage that was initiated by a lightning strike. 17
18
Grid technologies in use today are at least 50 years old and although “smart grid” 19
technologies exist, they are not often employed. Two such technologies that may be 20
employed to help offset climate impacts include upgrading the grid by employing 21
advanced conductors that are capable withstanding greater temperature extremes and 22
automation of electric distribution (Gellings and Yeager, 2004). 23
24
3.3.2 Energy Resource Infrastructure 25
26
A substantial part of the oil imported into the United States is transported over long 27
distances from the Middle East and Africa in supertankers. While these supertankers are 28
able to offload within the ports of other countries, they are too deeply drafted to enter the 29
30
31
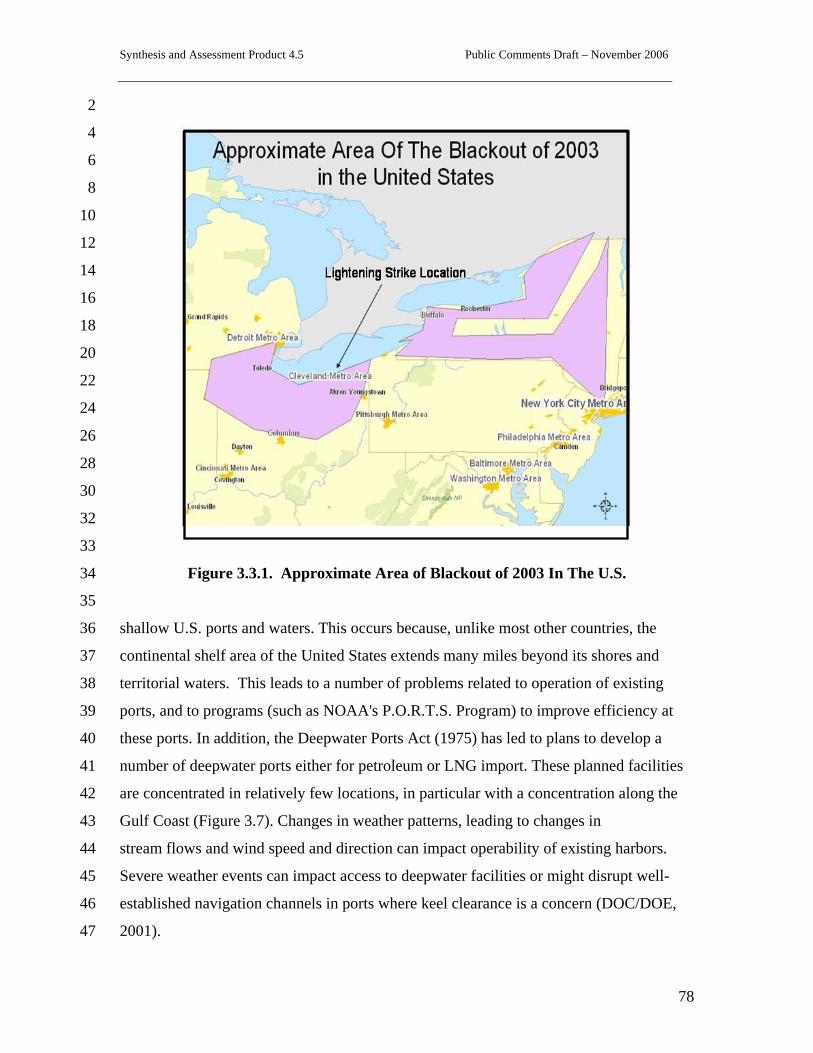
Synthesis and Assessment Product 4.5 Public Comments Draft – November 2006
78
2
4
6
8
10
12
14
16
18
20
22
24
26
28
30
32
33
Figure 3.3.1. Approximate Area of Blackout of 2003 In The U.S. 34
35
shallow U.S. ports and waters. This occurs because, unlike most other countries, the 36
continental shelf area of the United States extends many miles beyond its shores and 37
territorial waters. This leads to a number of problems related to operation of existing 38
ports, and to programs (such as NOAA's P.O.R.T.S. Program) to improve efficiency at 39
these ports. In addition, the Deepwater Ports Act (1975) has led to plans to develop a 40
number of deepwater ports either for petroleum or LNG import. These planned facilities 41
are concentrated in relatively few locations, in particular with a concentration along the 42
Gulf Coast (Figure 3.7). Changes in weather patterns, leading to changes in 43
stream flows and wind speed and direction can impact operability of existing harbors. 44
Severe weather events can impact access to deepwater facilities or might disrupt well-45
established navigation channels in ports where keel clearance is a concern (DOC/DOE, 46
2001). 47
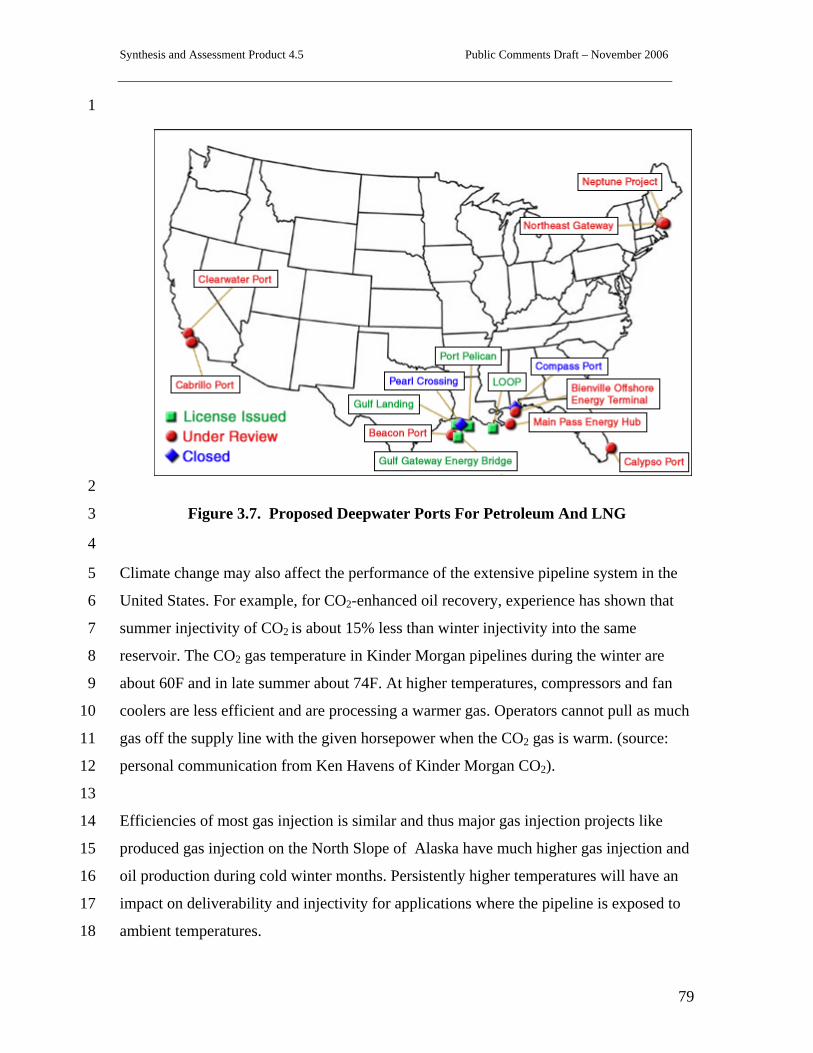
Synthesis and Assessment Product 4.5 Public Comments Draft – November 2006
79
1
2
Figure 3.7. Proposed Deepwater Ports For Petroleum And LNG 3
4
Climate change may also affect the performance of the extensive pipeline system in the 5
United States. For example, for CO2-enhanced oil recovery, experience has shown that 6
summer injectivity of CO2 is about 15% less than winter injectivity into the same 7
reservoir. The CO2 gas temperature in Kinder Morgan pipelines during the winter are 8
about 60F and in late summer about 74F. At higher temperatures, compressors and fan 9
coolers are less efficient and are processing a warmer gas. Operators cannot pull as much 10
gas off the supply line with the given horsepower when the CO2 gas is warm. (source: 11
personal communication from Ken Havens of Kinder Morgan CO2). 12
13
Efficiencies of most gas injection is similar and thus major gas injection projects like 14
produced gas injection on the North Slope of Alaska have much higher gas injection and 15
oil production during cold winter months. Persistently higher temperatures will have an 16
impact on deliverability and injectivity for applications where the pipeline is exposed to 17
ambient temperatures. 18
Synthesis and Assessment Product 4.5 Public Comments Draft – November 2006
80
1
3.3.3 Storage and Landing Facilities 2
3
The Strategic Petroleum Reserve storage locations (EIA 2004) that are all along the Gulf 4
Coast were selected because they provide the most flexible means for connecting to the 5
commercial oil transport network. Figure 3.8 illustrates their locations along the Gulf 6
Coast in areas USGS (2000) sees as being susceptible to sea-level rise. Similarly located 7
on the Sabine Pass is the Henry Hub, the largest gas transmission interconnection site in 8
the U.S., connecting 14 interstate and intrastate gas transmission pipelines. Henry Hub 9
was out of service briefly from Hurricane Katrina and for some weeks from Hurricane 10
Rita, which made landfall at Sabine Pass. 11
12
3.3.4 Infrastructure Planning And Considerations For New Power 13 Plant Siting 14
15
Water availability and access to coal delivery are currently critical issues in the siting of 16
new coal-fired generation capacity. New capacity, except on coasts and large estuaries, 17
will generally require cooling towers rather than once-through cooling water usage based 18
on current and expected regulations (EPA, 2000) independent of climate change issues. 19
New turbine capacity will also need to be designed to respond to the new ambient 20
conditions. 21
22
Siting of new nuclear units will face the same water availability issues as large new coal-23
fired units; they will not need to deal with coal deliverability but may depend on barge 24
transport to allow factory fabrication rather than site fabrication of large, heavy wall 25
vessels, as well as for transportation of any wastes that need to be stored off-site. 26
27
Capacity additions and system reliability have recently become important areas for 28
discussion. A number of approaches are being considered to run auctions (or other 29
approaches) to stimulate interest in adding new capacity without sending signals that 30
would result in over-building (as has happened in the past). Planning to ensure that both 31
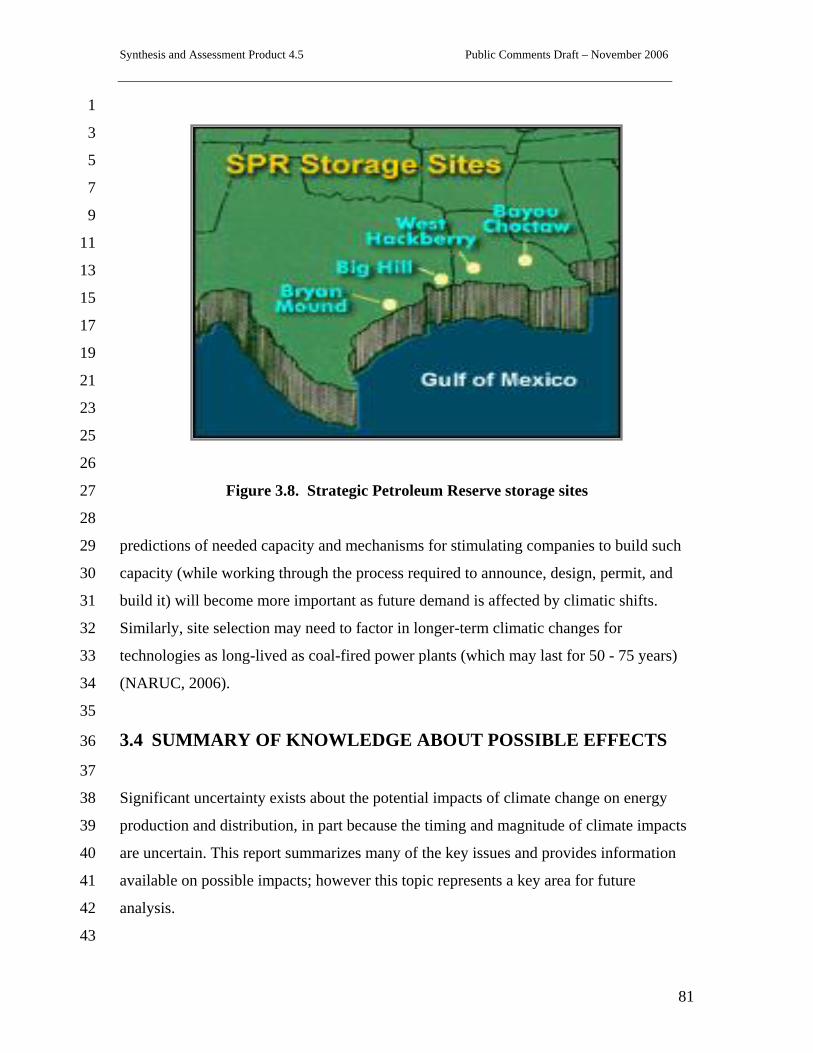
Synthesis and Assessment Product 4.5 Public Comments Draft – November 2006
81
1
3
5
7
9
11
13
15
17
19
21
23
25
26
Figure 3.8. Strategic Petroleum Reserve storage sites 27
28
predictions of needed capacity and mechanisms for stimulating companies to build such 29
capacity (while working through the process required to announce, design, permit, and 30
build it) will become more important as future demand is affected by climatic shifts. 31
Similarly, site selection may need to factor in longer-term climatic changes for 32
technologies as long-lived as coal-fired power plants (which may last for 50 - 75 years) 33
(NARUC, 2006). 34
35
3.4 SUMMARY OF KNOWLEDGE ABOUT POSSIBLE EFFECTS 36
37
Significant uncertainty exists about the potential impacts of climate change on energy 38
production and distribution, in part because the timing and magnitude of climate impacts 39
are uncertain. This report summarizes many of the key issues and provides information 40
available on possible impacts; however this topic represents a key area for future 41
analysis. 42
43
Synthesis and Assessment Product 4.5 Public Comments Draft – November 2006
82
1
Many of the technologies needed for existing energy facilities to adapt to increased 2
temperatures and decreased water availability are available for deployment; and, although 3
decreased efficiencies and lower output can be expected, significant disruptions seem 4
unlikely. Incorporating potential climate impacts into the planning process for new 5
facilities will strengthen the infrastructure. This is especially important for water 6
resources, as electricity generation is one of many competing applications for what may 7
be a (more) limited resource. 8
9
There are regionally important differences in adaptation needs. This is true for the 10
spectrum of climate impacts from water availability to increased temperatures and 11
changing patterns of severe weather events. The most salient example is for oil and gas 12
exploration and production in Alaska, where projected temperature increases may be 13
double the global average and melting permafrost and changing shorelines could 14
significantly alter the landscape and available opportunities for oil and gas production 15
16
Increased temperatures will also increase demand-side use, and the potential system-wide 17
impacts on electricity transmission and distribution and other energy system needs are not 18
well understood. Future planning for energy production and distribution may therefore 19
need to accommodate possible impacts of climate change. 20

Synthesis and Assessment Product 4.5 Public Comments Draft – November 2006
83
1
CHAPTER 4. POSSIBLE INDIRECT EFFECTS OF CLIMATE 2 CHANGE ON ENERGY PRODUCTION AND USE IN THE UNITED 3
STATES 4 5
Vatsal Bhatt and William C. Horak, Brookhaven National Laboratory 6 James Ekmann, National Energy Technology Laboratory 7
Thomas J. Wilbanks, Oak Ridge National Laboratory 8 9
10
4.1 INTRODUCTION 11
12
Changes in temperature, precipitation, storms, and/or sea level are likely to have direct 13
effects on energy production and use, as summarized above; but they may also have a 14
number of indirect effects – as climate change affects other sectors and if it shapes energy 15
and environmental policy-making and regulatory actions (Fig. 4.1). In some cases, it is 16
possible that indirect effects could have a greater impact, positive or negative, on certain 17
institutions and localities than direct effects. 18
19
In order to provide a basis for such a discussion, this chapter of SAP 4.5 offers a 20
preliminary taxonomy of categories of indirect effects that may be of interest, along with 21
a summary of existing knowledge bases about such indirect effects. Some of these 22
effects are from climate change itself, e.g., effects on electricity prices of changing 23
conditions for hydropower production or of more intense extreme weather events. Other 24
effects could come from climate change related policies,(e.g., effects of stabilization-25
related emission ceilings on energy prices, energy technology choices, or energy sector 26
emissions) (Table 4.1). 27
28
Most of the existing literature is concerned with implications of climate change 29
mitigation policies on energy technologies, prices, and emissions in the U.S. Because 30
this literature is abundant, relatively well-known, and in some cases covered by other 31
SAPs (such as SAP 2.2), it will be only briefly summarized here, offering links to more 32
33
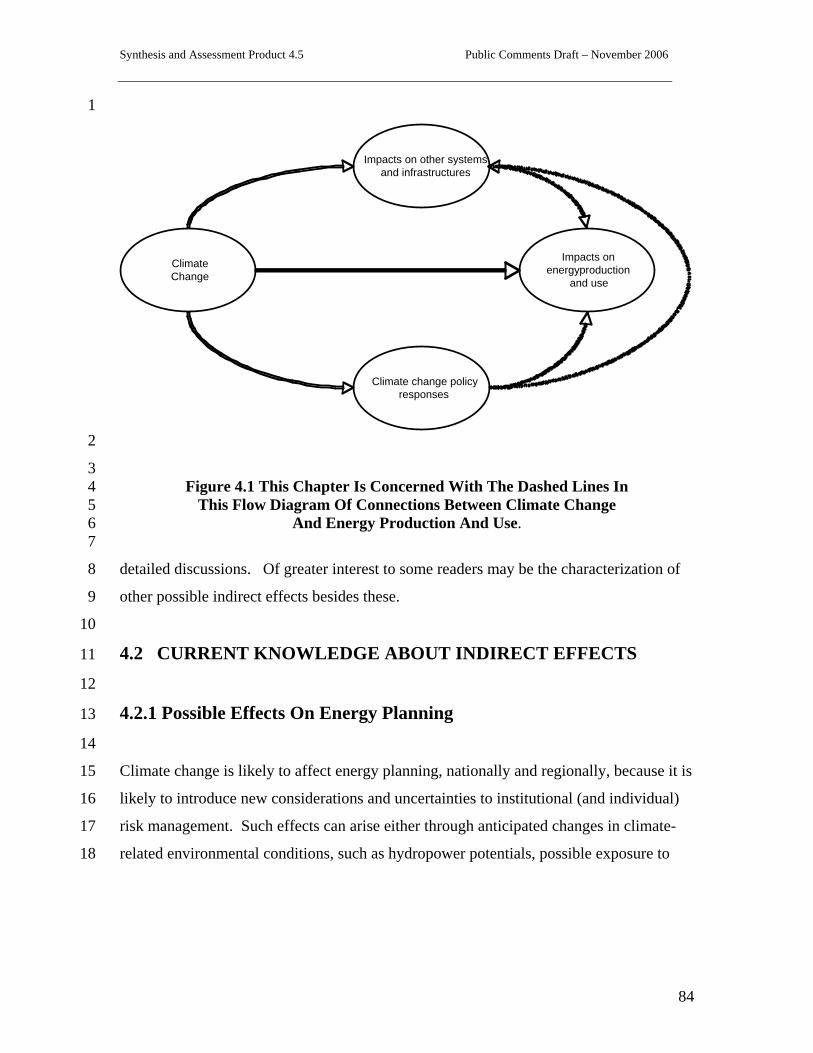
Synthesis and Assessment Product 4.5 Public Comments Draft – November 2006
84
1
2
3 Figure 4.1 This Chapter Is Concerned With The Dashed Lines In 4
This Flow Diagram Of Connections Between Climate Change 5 And Energy Production And Use. 6
7
detailed discussions. Of greater interest to some readers may be the characterization of 8
other possible indirect effects besides these. 9
10
4.2 CURRENT KNOWLEDGE ABOUT INDIRECT EFFECTS 11
12
4.2.1 Possible Effects On Energy Planning 13
14
Climate change is likely to affect energy planning, nationally and regionally, because it is 15
likely to introduce new considerations and uncertainties to institutional (and individual) 16
risk management. Such effects can arise either through anticipated changes in climate-17
related environmental conditions, such as hydropower potentials, possible exposure to 18
ClimateChange
Impacts on other systems and infrastructures
Climate change policy responses
Impacts on energy production
and use
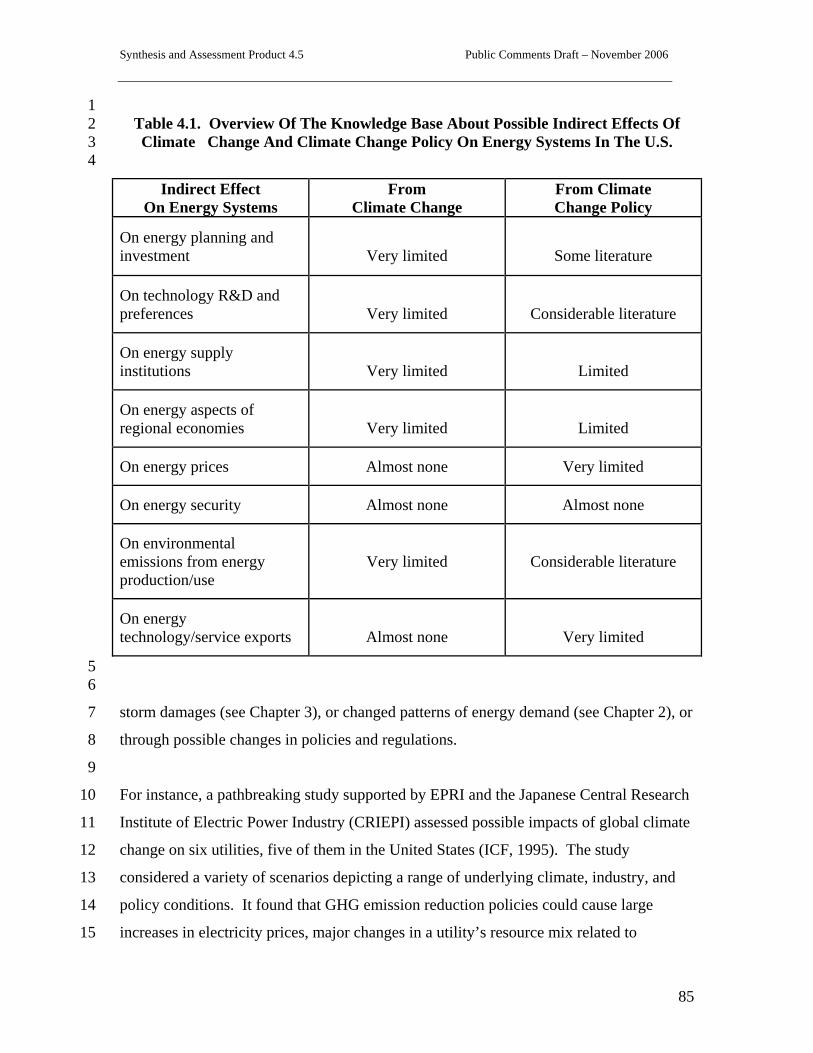
Synthesis and Assessment Product 4.5 Public Comments Draft – November 2006
85
1 Table 4.1. Overview Of The Knowledge Base About Possible Indirect Effects Of 2 Climate Change And Climate Change Policy On Energy Systems In The U.S. 3
4
Indirect Effect On Energy Systems
From Climate Change
From Climate Change Policy
On energy planning and investment
Very limited
Some literature
On technology R&D and preferences
Very limited
Considerable literature
On energy supply institutions
Very limited
Limited
On energy aspects of regional economies
Very limited
Limited
On energy prices Almost none Very limited
On energy security Almost none Almost none
On environmental emissions from energy production/use
Very limited Considerable literature
On energy technology/service exports
Almost none
Very limited
5 6
storm damages (see Chapter 3), or changed patterns of energy demand (see Chapter 2), or 7
through possible changes in policies and regulations. 8
9
For instance, a pathbreaking study supported by EPRI and the Japanese Central Research 10
Institute of Electric Power Industry (CRIEPI) assessed possible impacts of global climate 11
change on six utilities, five of them in the United States (ICF, 1995). The study 12
considered a variety of scenarios depicting a range of underlying climate, industry, and 13
policy conditions. It found that GHG emission reduction policies could cause large 14
increases in electricity prices, major changes in a utility’s resource mix related to 15
Synthesis and Assessment Product 4.5 Public Comments Draft – November 2006
86
requirements for emission controls, and significant expansions in demand-side 1
management programs. Major impacts are likely to be on Integrated Resource Planning 2
regarding resource and capacity additions and/or plant retirements, along with broader 3
implications of increased costs and prices. In another example, Burtraw et al., 2005 4
analyzed a nine-state northeastern regional greenhouse gas initiative (RGGI), an 5
allowance-based regional GHG cap-and-trade program for power sector. They found that 6
how allowances are allocated has an effect on electricity price, consumption, and the mix 7
of technologies used to generate electricity. Electricity price increases in most of the 8
cases. They also note that any policy that increases energy costs in the region is likely to 9
cause some emission leakage to other areas outside the region as electricity generation or 10
economic activity moves to avoid regulation and associated costs. 11
12 Electric utilities in particular are already sensitive to weather as a factor in earnings 13
performance, and they utilize weather risk management tools to hedge against risks 14
associated with weather-related uncertainties. Issues of interest include plans for capacity 15
additions, system reliability assurance, and site selection for long-lived capital facilities 16
(O’Neill, 2003). Even relatively small changes in temperature/demand can affect total 17
capacity needs across the U.S. power sector, especially in peak periods. 18
19
Current policy initiatives hint at what the future might be like, in terms of their possible 20
effects on energy planning. U.S. national and state climate policy actions include a 21
variety of traditional approaches such as funding mechanisms (incentives and 22
disincentives); regulation (caps, codes and standards); technical assistance (direct or in 23
kind); research and development; information and education; and monitoring and 24
reporting (including impact disclosure) (Rose and Shang, 2004). Covered sectors include 25
power generation, oil and gas, residential, commercial, industry, transportation, waste 26
management, agriculture and forestry. These sectors cut across private and public sector 27
facilities and programs, as well as producers and consumers of energy (Peterson and 28
Rose, 2006). 29
30
Synthesis and Assessment Product 4.5 Public Comments Draft – November 2006
87
One key issue involves the provision of financial incentives that create, encourage or 1
force markets to reward GHG mitigation, such as preferential qualifying credit for 2
transportation projects or energy production facilities. At the national level, clean and 3
renewable energy technology deployment is promoted primarily through a federal 4
production tax credit (PTC) and investment tax credit (ITC). Since it was introduced in 5
1992, the PTC – which was designed to spur the deployment of technologies that are near 6
economic competitiveness – has encouraged domestic renewable technologies, such as 7
wind, solar and biomass (NCEP, 2004). The EPAct (2005) extended most of these PTCs 8
to 2007, except to solar technologies that ended in 2005. 9
10
Other incentive mechanisms are potentially important for GHG mitigation. According to 11
Peterson & Rose (2006), cost sharing of fixed or variable mitigation program costs is 12
common, such as payments to farmers for installation of best management practices or 13
waste recovery facilities. These programs support measures that serve as alternatives to 14
more costly energy reduction measures. Extra credit in applications for financing is 15
common, where as preferential treatment in siting decisions can also reduce the time and 16
risk associated with recovery of costs. By providing faster approval of the project than 17
normal, or a higher guarantee of rate recovery, the financing costs to these projects can be 18
substantially reduced due to the time value of money and reduction of risk premiums in 19
financial markets. 20
21
Some of the policy alternatives facilitate differentiating policies to meet special 22
geographic needs, a critical issue given substantial differences among state renewable 23
portfolio standards (RPS); currently 22 states operate RPSs in the U.S. To date, 39 states 24
have developed greenhouse gas inventories, and 30 states have developed some form of 25
greenhouse gas action plan (EPA, 2003). Kousky and Schneider, 2003 note that by 26
mid-2003, 140 cities in the U.S. had established GHG reduction targets and had begun 27
mitigation action planning. 28
29
In California, the Governor’s Executive Order #S-3-05, calls for an 80% reduction in 30
climate change emissions, relative to 1990 levels, by 2050 (CEPA, 2006). As a result, 31
Synthesis and Assessment Product 4.5 Public Comments Draft – November 2006
88
the state has resolved to a series of extensive market based and policy driven demand and 1
supply side management initiatives (Luers and Moser, 2006). According to Peterson & 2
Rose (2006), a number of sub-federal jurisdictions have developed (or are developing) 3
comprehensive plans that are expected to include numerical goals and timetables and a 4
portfolio of actions across all economic sectors. Coordination with regional agreements 5
in New England (The New England Governors/Eastern Canadian Premiere's Agreement 6
or NEG/ECP), the Northeast (the Regional Greenhouse Gas Initiative, or RGGI), the 7
West Coast (the West Coast Climate Initiative), and the northern Midwest (the Powering 8
the Plains initiative) are significant steps in this direction. Such regional initiatives, as 9
explained by Kelly et al. (2005) for TX, OK and the Northeast states, promote energy 10
market transformation with the help of public-private partnerships and create 11
implementation projects to reduce GHG footprints. 12
13
Energy efficiency can contribute significantly in reducing market distortions while a cap-14
and-trade framework is in place. Prindle et al. (2006) concluded that doubling the current 15
level of energy efficiency spending in the RGGI region would have several very 16
favorable effects on the carbon cap-and-trade system. It would reduce electricity load 17
growth, future electricity prices, carbon emissions, carbon emission prices, and total 18
energy bills for electricity customers of all types. Similarly, in a case-study of New York 19
City, Kelly et al., (2005) show that energy efficiency and urban heat island mitigation 20
strategies can significantly reduce electricity peak load, GHG emissions and energy 21
system cost. 22
23
4.2.2 Possible Effects On Energy Production And Use Technologies 24
25
Perhaps the best-documented case of indirect effects of climate change on energy 26
production and use in the United States is effects of climate change policy on technology 27
research and development and on technology preferences and choices. 28
29
For instance, if the world moves toward concerted action to stabilize concentrations of 30
greenhouse gases (GHG) in the earth’s atmosphere, the profile of energy resources and 31

Synthesis and Assessment Product 4.5 Public Comments Draft – November 2006
89
technologies being used in the U.S. – on both the production and use sides – would have 1
to change significantly (CCTP, 2005). Developing innovative energy technologies and 2
approaches through science and technology research and development is widely seen as a 3
key to reducing the role of the energy sector as a driver of climate change. Considering 4
various climate change scenarios, researchers have modeled a number of different 5
pathways in order to inform discussions about technology options that might contribute to 6
energy system strategies (e.g., Edmonds et al, 1996; Akimoto et al., 2004; Hoffert et al., 7
2002; van Vuuren et al, 2004; Kainuma et al, 2004; IPCC 2005a; Kurosawa, 2004; Pacala 8
and Socolow, 2004 and Paltsev et al, 2005. In addition, there have been important recent 9
developments in scenario work in the areas of non-CO2 GHGs, land use and forestry 10
emission and sinks, emissions of radiatively important non-GHGs such as black and 11
organic carbon, and analyses of uncertainties, among many issues in increasing 12
mitigation options and reducing costs (Nakicenovic and Riahi, 2003; IPCC 2005b; van 13
Vuuren et al, 2006; and Placet et al, 2004). 14
15
These references indicate that a high degree of emissions reductions could be achieved 16
through combinations of many different technologies. A large number of scenario-based 17
analyses conducted by different research groups show the importance of technology 18
advancement, especially if R&D support is diversified. Although the full range of effects 19
in the future is necessarily speculative, it is possible that successful development of 20
advanced technologies could result in potentially large economic benefits. When the costs 21
of achieving different levels of emission reductions have been compared for cases with 22
and without advanced technologies, many of the advanced technology scenarios 23
projected that the cost savings from advancement would be significant. Note, however, 24
that there is considerable “inertia” in the nation’s energy supply capital stock because 25
institutions that have invested in expensive facilities prefer not to have them converted 26
into “stranded assets.” Note also that any kind of rapid technological transformation 27
would be likely to have cross-commodity cost/price effects, e.g., on costs of specialized 28
components in critical materials that are in greater demand. 29
30
Synthesis and Assessment Product 4.5 Public Comments Draft – November 2006
90
4.2.3 Possible Effects On Energy Production And Use Institutions 1
2
Climate change could affect the institutional structure of energy production and use in the 3
United States, although relatively little research has been done on such issues. 4
Institutions include energy corporations, electric utilities, governmental organizations at 5
all scales, and non-governmental organizations. Their niches, size and structure, and 6
operation tend to be sensitive to changes in “market” conditions from any of a variety of 7
driving forces, these days including such forces as globalization, technological change, 8
and social/cultural change (e.g., changes in consumer preferences). Climate change is 9
likely to interact with other driving forces in ways that could affect institutions concerned 10
with energy production and use. 11
12
Most of the very limited research attention to this type of effect has been focused on 13
effects of climate change policy (e.g., policy actions to reduce greenhouse gas emissions) 14
on U.S. energy institutions, such as on the financial viability of U.S. electric utilities 15
(see, for instance, WWF, 2003). Other effects could emerge from changes in energy 16
resource/technology mixes due to climate change: e.g., changes in renewable energy 17
resources and costs or changes in energy R&D investment patterns. 18
19
Most of these issues are speculative at this time, but identifying them is useful as a basis 20
for further discussion. Issues would appear to include (see effects on planning, above). 21
22
4.2.3.1 Effects on the institutional structure of the energy industry 23
24
Depending on its impacts, climate change could encourage large energy firms to move 25
into renewable energy areas that have been largely the province of smaller firms, as was 26
the case in some instances in the wake of the energy “shocks” of the 1970s (e.g., Flavin 27
and Lenssen, 1994). This kind of diversification into other “clean energy” fields could be 28
reflected in horizontal and/or vertical integration. Possible effects of climate change on 29
these and other institutional issues (such as organizational consolidation vs. 30
fragmentation) have not been addressed systematically in the research literature; but 31
Synthesis and Assessment Product 4.5 Public Comments Draft – November 2006
91
some large energy firms are exploring a wider range of energy technologies and some 1
large multi-national energy technology providers are diversifying their product lines to be 2
prepared for possible changes in market conditions. 3
4
4.2.3.2 Effects on electric utility restructuring 5
6
Recent trends in electric utility restructuring have included increasing competition in an 7
open electricity supply marketplace, which has sharpened attention to keeping O&M 8
costs for infrastructure as low as possible. Some research literature suggests that one 9
side-effect of restructuring has been a reduced willingness on the part of some utilities to 10
invest in environmental protection beyond what is absolutely required by law and 11
regulation (Parker, 1999; Senate of Texas, 1999), although this issue needs further study. 12
If climate change introduces new risks for utility investment planning and reliability, it is 13
possible that policies and practices could encourage greater cooperation and collaboration 14
among utilities. 15
16
4.2.3.3 Effects on the health of fossil fuel-related industries 17
18
If climate change is associated with policy and associated market signals that 19
decarbonization of energy systems, industries focused on the production of fossil fuels, 20
converting them into useful energy forms, transporting them to demand centers, and 21
providing them to users could face shrinking markets and profits. The coal industry 22
seems especially endangered in such an eventuality. In the longer run, this type of effect 23
depends considerably on technological change: e.g., affordable carbon capture and 24
sequestration, fuel cells, and efficiency improvement. It is possible that industries (and 25
regions) concentrated on fossil fuel extraction, processing, and use will seek to diversify 26
as a hedge against risks of economic threats from climate change policy. 27
28
Synthesis and Assessment Product 4.5 Public Comments Draft – November 2006
92
4.2.3.4 Effects on other supporting institutions such as financial and insurance 1 industries 2 3
Many major financial and insurance institutions are gearing up to underwrite emission 4
trading contracts, derivatives and hedging products, wind and biofuel crop guarantee 5
covers for renewable energy, and other new financial products to support carbon 6
emission trading and CDM, while they are concerned about exposure to financial risks 7
associated with climate change impacts. In recent years, various organizations have tried 8
to engage the global insurance industry in the climate change debate. Casualty insurers 9
are concerned about possible litigation against companies responsible for excessive GHG 10
emissions, and property insurers are concerned about future uncertainties in weather 11
damage losses. However, it is in the field of adaptation where insurers are most active, 12
and have most to contribute. 200 major companies in the financial sector around the 13
world have signed up to the UN Environment Program’s - Finance Initiative, and 95 14
institutional investment companies have so far signed up to the Carbon Disclosure 15
Project. They ask businesses to disclose investment-relevant information concerning 16
their GHGs. Their website provides a comprehensive registry of GHGs from public 17
corporations. Over 300 of the 500 largest companies in the world now report their 18
emissions on this website, recognizing that institutional investors regard this information 19
as important for shareholders (Crichton, 2005). 20
21
4.3 POSSIBLE EFFECTS ON ENERGY-RELATED DIMENSIONS 22 OF REGIONAL AND NATIONAL ECONOMIES 23
24
It is at least possible that climate change could have an effect on regional economies by 25
impacting regional comparative advantages related to energy availability and cost. 26
Examples could include regional economies closely associated with fossil fuel production 27
and use (especially coal) if climate change policies encourage decarbonization, regional 28
economies dependent on affordable electricity from hydropower if water supplies 29
decrease or increase, regional economies closely tied to coastal energy facilities that 30
could be threatened by more intense coastal storms (Chapter 3), and regional economies 31
Synthesis and Assessment Product 4.5 Public Comments Draft – November 2006
93
dependent on abundant electricity supplies if demands on current capacities increase or 1
decrease due to climate change. 2
3
Attempts to estimate the economic impacts that could occur 50–100 years in the future 4
have been made using various climate scenarios, but the interaction of climate and the 5
nation’s economy remains very difficult to define. Significant uncertainties therefore 6
surround projections of climate change induced energy sector impacts on the U.S. or 7
regional economies. Changnon estimated that annual national economic losses from 8
energy sector will outweigh the gains in years with major weather and climate extremes 9
(Changnon, 2005). Jorgenson et. al. studied impacts of climate change on various 10
sectors of the U.S. economy from 2000 – 2100. In three optimistic scenarios, they 11
conclude that increased energy availability and cost savings from reduced natural gas-12
based space heating more than compensate for increased expenditures on electricity-13
based space cooling. These unit cost reductions appear as productivity increases and, 14
thus, improve the economy, whereas other three pessimistic scenarios show that 15
electricity-based space conditioning experiences relatively larger productivity losses than 16
does space conditioning from coal, wood, petroleum or natural gas; accordingly its 17
(direct) unit cost rises faster and thus produces no benefits to the economy. Additionally, 18
higher domestic prices discourage exports and promote imports leading to a worsening 19
real trade balance. According to Mendelsohn et al. (2000), the U.S. economy will 20
benefit from the climate change induced energy sector changes. However, Mendelsohn 21
and Williams (2004) suggest that climate change will cause economic damages in the 22
energy sector in every scenario. They suggest that temperature changes cause most of the 23
energy impacts. Larger temperature increases generate significantly larger economic 24
damages. The damages are from increased cooling expenditures required to maintain 25
desired indoor temperatures. In the empirical studies, these cost increases outweighed 26
benefits of the reduced heating expenditures unless starting climates are very cool 27
(Mendelsohn and Neumann, 1999; Mendelsohn, 2001) (also see Chapter 2). 28
29
In California, a preliminary assessment of the macroeconomic impacts associated with 30
the climate change emission reduction strategies shows that the overall impacts of the 31
Synthesis and Assessment Product 4.5 Public Comments Draft – November 2006
94
climate change emission reduction strategies on the state’s economy could be positive. 1
Resulting impacts on the economy could translate into job and income gains for 2
Californians. Such favorable impacts on the economy are possible because of the 3
reduced costs associated with many of the strategies (CEPA, 2006). On the other hand, 4
the study emphasizes that even relatively small changes in in-state hydropower 5
generation result in substantial extra expenditure burdens on an economy for energy 6
generation, because losses in this “free” generation must be purchased from other 7
sources; a ten percent decrease in hydroelectric supply would impose a cost of 8
approximately $350 million in additional electricity expenditures annually (Franco and 9
Sanstad, 2006). Whereas electricity demand is projected to rise in California between 3 10
to 20 percent by the end of this century, peak electricity demand would increase at a 11
faster rate. Since annual expenditures of electricity demand in California represent about 12
$28 billion, even such a relatively small increases in energy demand would result in 13
substantial extra energy expenditures for energy services in the state; a three percent 14
increase in electricity demand by 2020 would translate into about $930 million (in 2000 15
dollars) in additional electricity expenditures (Franco and Sanstad, 2006). Particular 16
concerns are likely to exist in areas where summer electricity loads already strain supply 17
capacities (e.g., Hill and Goldberg, 2001; Kelly et al., 2005; Rosenzweig and Solecki, 18
2001) and where transmission and distribution networks have limited capacities to adapt 19
to changes in regional demands, especially seasonally (e.g., London Climate Change 20
Partnership, 2002). 21
22
Rose and others have examined effects of a number of climate change mitigation policies 23
on U.S. regions in general and the Susquehanna River basin in particular (Rose and 24
Oladosu, 2002; Rose and Zhang, 2004; Rose et al., 1999; Rose et al., forthcoming). In 25
general, they find that such policy options as emission permits tradable among U.S. 26
regions might have less than expected effects, with burdens impacting at least one 27
Southern region which needs maximum permits but whose economy is not among the 28
nation’s strongest. Additionally, they discuss Pennsylvania’s heavy reliance on coal 29
production and use infrastructure that increases the price of internal CO2 mitigation. 30
They suggest that the anomalies stem from the fact that new entrants, like Pennsylvania, 31
Synthesis and Assessment Product 4.5 Public Comments Draft – November 2006
95
into regional coalitions for cap-and-trade configuration may raise the permit price, may 1
undercut existing states’ permit sales, and may be able to exercise market power. 2
Particularly, they raise an issue of the “responsibility” for emissions. Should fossil fuel 3
producing regions take the full blame for emissions or are the using regions also 4
responsible? They find that aggregate impacts of a carbon tax on the Susquehanna River 5
Basin would be negative but quite modest. While Prindle et. al., 2006, suggest that 6
adding energy efficiency savings to such a cap-and-trade scheme will considerably lower 7
the consumer energy bills, increase the economic output and personal income with a 8
positive private-sector job growth by 2021. 9
10
Concerns remain, however, that aggressive climate policy interventions to reduce GHG 11
emissions could negatively affect regional economies linked to coal and other fossil 12
energy production. Concerns also exist that climate change itself could affect the 13
economies of areas exposed to severe weather events (positively or negatively) and areas 14
whose economies are closely linked to hydropower and other aspects of the “energy-15
water nexus.” 16
17
4.4 POSSIBLE RELATIONSHIPS WITH OTHER ENERGY-18 RELATED ISSUES 19
20
Many other types of indirect effects are possible, although relatively few have received 21
research attention. Without asserting that this listing is comprehensive, such effects 22
might include: 23
24
4.4.1 Effects Of Climate Change In Other Countries On US Energy Production 25 And Use 26
27
We know from recent experience that climate variability outside the U.S. can affect 28
energy conditions in the U.S.; an example is an unusually dry year in Spain in 2005 29
which led that country to enter the international LNG market to compensate for scarce 30
hydropower, which in turn raised LNG prices for U.S. consumption (Alexander’s Gas & 31
Oil Connections, 2005). It is important, therefore, to consider possible effects of climate 32
Synthesis and Assessment Product 4.5 Public Comments Draft – November 2006
96
change not only on international energy product suppliers and international energy 1
technology buyers but also on other countries whose participation in international 2
markets could affect U.S. energy availability and prices from international sources, which 3
could have implications for energy security (see below). Climate change-related energy 4
supply and price effects could be coupled with other price effects of international trends 5
on U.S. energy, infrastructures, such as effects of aggressive programs of infrastructure 6
development on China and India. 7
8
A particularly important case is U.S. energy inputs from Canada. Canada is the largest 9
single source of petroleum imports by the US (about 2.2 million barrels per day) and 10
exports more than 15% of the natural gas consumed in the U.S. (EIA, 2005a, 2006). In 11
2004, it exported to the U.S. 33 MWh of electricity, compared with imports of 22.5 MWh 12
(EIA, 2005b). Climate change could affect electricity exports and imports, for instance if 13
electricity demands for space cooling increase in Canada or if climate change affects 14
hydropower production in that country. 15
16
4.4.2 Effects Of Climate Change On Energy Prices 17
18
A principal mechanism in reducing vulnerabilities to climate-related (and other) changes 19
potentially affecting the energy sector is the operation of the energy market, where price 20
variation is a key driver. Effects of climate change on energy prices are in fact 21
interwoven with effects of energy prices on risk management strategies, in a dynamic that 22
could work in both directions at once; and it would be useful to know more about roles of 23
energy markets in reducing vulnerabilities to climate change impacts, along with possible 24
adaptations in the functioning of those markets. 25
26
Clearly, climate change could affect energy prices in the U.S. Extrapolating from a 27
limited knowledge base, it appears that climate change effects would more likely add to 28
pressures for energy price increases than to decreases, although uncertainties are 29
considerable. Hurricane Katrina is a recent example of how increased exposure to severe 30
storms due to climate change could raise energy prices, at least in the relatively short 31
Synthesis and Assessment Product 4.5 Public Comments Draft – November 2006
97
term, by disrupting energy production, storage, and transmission. This is one of several 1
reasons why climate change might be associated with greater volatility in energy prices 2
(Abbasi, 2005). Another possible example would be reduced production of relatively 3
inexpensive hydropower in areas dependent on winter snowfall for production potential, 4
where warming reduces annual snowfall. On the other hand, it can be argued that energy 5
technology responses to climate change and related policies would reduce energy price 6
volatility by diversifying sources, which means that overall effects of climate change on 7
energy prices are unclear. Since energy prices in turn affect not only the behavior of 8
energy consumers but also other sectors of the economy, it would be useful to be able to 9
assess possible roles of climate change relative to other influences on energy prices in 10
coming decades. 11
12
4.4.3 Effects Of Climate Change On Environmental Emissions 13
14
Climate change is very likely to lead to reductions in environmental emissions from 15
energy production and use in the U.S., although possible effects of climate change 16
responses are complex. For instance, cap and trade policy responses might not translate 17
directly into lower total emissions. In general, however, the available research literature 18
indicates that climate change policy will affect choices of energy resources and 19
technologies in ways that, overall, reduce greenhouse gas and other environmental 20
emissions (see indirect impacts on technologies above). 21
22
4.4.4 Effects Of Climate Change On Energy Security 23
24
Climate change relates to energy security because different drivers of energy policy 25
interact. As one example, some strategies to reduce oil import dependence, such as 26
increased use of renewable energy sources in the U.S., are similar to strategies to reduce 27
GHG emissions as a climate change response (e.g., IEA, 2004; O’Keefe, 2005). As 28
another example, energy security relates not only to import dependence but also to energy 29
system reliability, which can be threatened by possible increases in the intensity of severe 30
weather events. A different kind of issue is potential impacts of abrupt climate change in 31
Synthesis and Assessment Product 4.5 Public Comments Draft – November 2006
98
the longer run. One study has suggested that abrupt climate change could lead to very 1
serious international security threats, including threats of global energy crises, as 2
countries act to defend and secure supplies of essential commodities (Schwarz and 3
Randall, 2003). 4
5
4.4.5 Effects Of Climate Change On Energy Technology And Service 6 Exports 7
8
Finally, climate change could affect U.S. energy technology and service exports. It is 9
very likely that climate change will have some impacts on global energy technology, 10
institutional, and policy choices. Effects of these changes on U.S. exports would 11
probably be determined by whether the US is a leader or a follower in energy technology 12
and policy responses to concerns about climate change. More broadly, carbon emission 13
abatement actions by various countries are likely to affect international energy flows and 14
trade flows in energy technology and services (e.g., Rutherford, 2001). In particular, one 15
might expect flows of carbon-intensive energy forms and energy technologies and 16
energy-intensive products to be affected. 17
18
4.5 SUMMARY OF KNOWLEDGE ABOUT INDIRECT EFFECTS 19
20
Regarding indirect effects of climate change on energy production and use in the United 21
States, the available research literature tells us the most about possible changes in energy 22
resource/technology preferences and investments, along with associated reductions in 23
GHG emissions. Less-studied but also potentially important are possible impacts on the 24
institutional structure of energy supply in the United States, responding to changes in 25
perceived investment risks and emerging market and policy realities, and possible 26
interactions between energy prices and roles of energy markets in managing risks and 27
reducing vulnerabilities. Perhaps the most important insight from the limited current 28
research literature is that climate change will affect energy production and use not only as 29
a driving force in its own right but in its interactions with other driving forces such as 30
energy security. Where climate change response strategies correspond with other issue 31

Synthesis and Assessment Product 4.5 Public Comments Draft – November 2006
99
response strategies, they can add force to actions such as reduced dependence on 1
imported oil and gas and increased reliance on domestic non-carbon energy supply 2
sources. Where climate change impacts contradict other driving forces for energy 3
decisions, they are much less likely to have an effect on energy production and use. 4
5
Synthesis and Assessment Product 4.5 Public Comments Draft – November 2006
100
1 CHAPTER 5: CONCLUSIONS AND RESEARCH NEEDS 2
3 4 5.1 INTRODUCTION 5 6 7 The previous chapters have summarized a variety of currently available information 8
about effects of climate change on energy production and use in the United States. For 9
two reasons, it is important to be careful about drawing firm conclusions about effects at 10
this time. One reason is that the research literatures on many of the key issues are 11
limited, supporting an identification of issues but not a resolution of most uncertainties. 12
A second reason is that, as with many other categories of climate change effects in the 13
U.S., the effects depend on a wide range of factors beyond climate change alone, such as 14
patterns of economic growth and land use, patterns of population growth and distribution, 15
technological change, and social and cultural trends that could shape policies and actions, 16
individually and institutionally. 17
18
Accordingly, this final chapter of SAP 4.5 will sketch out what appear, based on the 19
current knowledge base, to be the most likely types of effects on the energy sector. These 20
should be considered along with effects on other sectors that should be considered in risk 21
management discussions in the near term. As indicated in Chapter 1, conclusions are 22
related to degrees of likelihood: likely (2 chances out of 3), very likely (9 chances out of 23
10), or virtually certain (99 chances out of 100). The chapter will then discuss issues 24
related to prospects for energy systems in the U.S. to adapt to such effects, although 25
literatures on adaptation are very limited. Finally, it will suggest a limited number of 26
needs for expanding the knowledge base so that, when further assessments on this topic 27
are carried out, conclusions about effects can be offered with a higher level of 28
confidence. 29
30
Synthesis and Assessment Product 4.5 Public Comments Draft – November 2006
101
1
5.2 CONCLUSIONS ABOUT EFFECTS 2
3
Based on currently available projections of climate change in the United States, a number 4
of conclusions can be suggested about likely effects on energy use in the U.S. over a 5
period of time addressed by the research literature (near to mid-term). Long-term 6
conclusions are difficult due to uncertainties about such driving forces as technological, 7
change, institutional change, and climate change policy responses. 8
9
• Climate change will mean reductions in total U.S. energy demand for space 10
heating for buildings, with effects differing by region. (virtually certain) 11
12
• Climate change will mean increases in total U.S. energy demand for space 13
cooling, with effects differing by region. (virtually certain) 14
15
• Net effects on energy use will differ by region, with net lower total energy 16
requirements for buildings in net heating load areas and net higher energy 17
requirements in net cooling load areas, with overall impacts affected by patterns 18
of interregional migration – which are likely to be in the direction of net cooling 19
load regions – and investments in new building stock. (virtually certain) 20
21
• Temperature increases will be associated with increased peak demands for 22
electricity. (very likely) 23
24
• Other effects of climate change are less clear, but some could be non-trivial: e.g., 25
increased energy use for water pumping and/or desalination in areas that see 26
reductions in water supply. (very likely) 27
28
• Lower winter energy demands in Canada could add to available electricity 29
supplies for a few U.S. regions. (likely) 30
Synthesis and Assessment Product 4.5 Public Comments Draft – November 2006
102
A number of conclusions can be offered with relatively high levels of confidence about 1
effects of climate change on energy production and supply in the U.S., but generally the 2
research evidence is not as strong as for effects on energy use: 3
4
• Changes in the distribution of water availability in the U.S. will affect power 5
plants; in areas with decreased water availability, competition for water supplies 6
will increase between energy production and other sectors. (virtually certain) 7
8
• Temperature increases will decrease overall thermoelectric power generation 9
efficiency. (virtually certain) 10
11
• In some regions, energy resource production and delivery systems are vulnerable 12
to effects of sea level rise and extreme weather events, especially the Gulf Coast 13
and the East Coast. (virtually certain) 14
15
• In some areas, the siting of new energy facilities and systems could face increased 16
restrictions, related partly to complex interactions among the wider range of water 17
uses as well as sea-level rise and extreme event exposures. (likely) 18
19
• Incorporating possible climate change impacts into planning processes could 20
strengthen energy production and distribution system infrastructures, especially 21
regarding water resource management. (likely) 22
23
• Hydropower production is expected to be directly and significantly affected by 24
climate change, especially in the West and Northwest. (very likely) 25
26
• Climate change is expected to mean greater variability in wind resources and 27
direct solar radiation, substantially impacting the planning, siting, and financing 28
of these technologies (likely) 29
30
Synthesis and Assessment Product 4.5 Public Comments Draft – November 2006
103
• Increased temperatures and other climate change effects will affect energy 1
transmission and distribution requirements, but these effects are not well-2
understood. 3
4
Overall, the current energy supply infrastructure is often located in areas where climate 5
change impacts might occur, but large-scale disruptions are not likely except during 6
extreme weather events. Most of the effects on fossil and nuclear electricity components 7
are likely to be modest changes in water availability and/or cycle efficiency. 8
9
California is one U.S. state where impacts on both energy use and energy production 10
have been studied with some care (See Box 5.1: California: A Case Study). 11
12
About indirect effects of climate change on energy production and use in the U.S., 13
conclusions are notably mixed. Conclusions related to possible impacts of climate 14
change policy interventions on technology choice and emissions can be offered with 15
relatively high confidence based on published research. Other types of possible indirect 16
effects can be suggested as a basis for discussion, but conclusions must await further 17
research. 18
19
Conclusions 20
21
• Climate change concerns are very likely to affect perceptions and practices related 22
to risk management behavior in investment by energy institutions. (very likely) 23
24
• Climate change concerns, especially if they are expressed through policy 25
interventions, are almost certain to affect public and private sector energy 26
technology R&D investments and energy resource/technology choices by energy 27
institutions, along with associated emissions. (virtually certain) 28
29
• Climate change can be expected to affect other countries in ways that in turn 30
affect US energy conditions. (very likely) 31
Synthesis and Assessment Product 4.5 Public Comments Draft – November 2006
104
1
2
Other Types Of Possible Effects 3
4
• Climate change effects on energy production and use could in turn affect some 5
regional economies, either positively or negatively. (likely) 6
7
• Climate change may have some effects on energy prices in the U.S., especially 8
associated with extreme weather events. (very likely) 9
10
• Climate change concerns are likely to interact with some driving forces behind 11
policies focused on U.S. energy security, such as reduced reliance on 12
conventional petroleum products. (likely) 13
14
BOX 5.1 CALIFORNIA: A CASE STUDY
California is unique in the United States as a state that has examined possible effects of climate change on its energy production and use in some detail (also see Box 2.2). Led by the California Energy Commission and supported by such nearby partners as the Electric Power Research Institute, the University of California–Berkeley, and the Scripps Institution of Oceanography, the state is developing a knowledge base on this subject that could be a model for other states and regions (as well as the nation as a whole). Generally, the analyses to date (many of which are referenced in Chapters 2 and 3) indicate that electricity demand will grow due to climate change, with an especially close relationship between peak electricity demand and temperature increases (Franco and Sanstad, 2006), and water supply – as an element of the “energy-water nexus” – will be affected by a reduction in the Sierra snowpack (by as much as 70-90 % over the coming century: Vicuña et al., 2006). Patterns of urbanization could add to pressures for further energy supplies. Adaptations to these and other climate change impacts appear possible, but they could be costly (Franco, 2005). Overall economic impacts will depend considerably on the effectiveness of response measures, which tend currently to emphasize emission reduction but also consider impact scenarios and potential adaptation measures (CEPA, 2006). Other relevant studies of the California context for climate change effects reinforce an impression that effects of warming and snowpack reduction could be serious (Hayhoe et al., 2004) and that other ecosystems related to renewable energy potentials could be affected as well (Union of Concerned Scientists, 1999).
Synthesis and Assessment Product 4.5 Public Comments Draft – November 2006
105
1
These conclusions add up to a picture that is cautionary rather than alarming. Since in 2
many cases effects that could be a concern to U.S. citizens and U.S. energy institutions 3
are some decades in the future, there is time to consider strategies for adaptation to 4
reduce possible negative impacts and take advantage of possible positive impacts. 5
6
5.3 CONSIDERING PROSPECTS FOR ADAPTATION 7
8
The existing research literature tends to treat the U.S. energy sector mainly as a driving 9
force for climate change rather than a sector subject to impacts from climate change. As 10
a result, there is very little literature on adaptation of the energy sector to effects of 11
climate change, and the following discussion is therefore largely speculative. 12
13
Generally, both energy users and providers in the U.S. are accustomed to changes in 14
conditions that affect their decisions. Users see energy prices fluctuate with international 15
oil market conditions and with Gulf Coast storm behavior, and they see energy 16
availability subject to short-term shortages for a variety of reasons (e.g., the California 17
energy market crises of 2000/2001 or electricity blackouts in some Northeastern cities in 18
2003). Energy providers cope with shifting global market conditions, policy changes, 19
financial variables such as interest rates for capital infrastructure lending, and climate 20
variability. In many ways, the energy sector is among the most resilient of all U.S. 21
economic sectors, at least in terms of responding to changes within the range of historical 22
experience. For instance, electric utilities routinely consider planning and investment 23
strategies that consider weather variables (Niemeyer, 2005); and one important guide to 24
adaptation to climate change is what makes sense in adapting to climate variability 25
(Franco, 2005). 26
27
On the other hand, such recent events as Hurricane Katrina (Box 5.2: Hurricane Katrina 28
and the Gulf Coast: A Case Study) suggest that the U.S. energy sector is better at 29
responding to relatively short-term variations and uncertainties than to changes that reach 30
Synthesis and Assessment Product 4.5 Public Comments Draft – November 2006
106
beyond the range of familiar short-term variabilities (Niemeyer, 2005). In fact, the 1
expertise of U.S. energy institutions in reducing exposure to risks from short-term 2
variations might tend to reduce their resilience to larger long-term changes, unless an 3
awareness of risks from such long-term changes is heightened. 4
5
Adaptations to effects of climate change on energy use may focus on increased demands 6
for space cooling in areas affected by warming and associated increases in total energy 7
consumption costs. Alternatives could include reducing costs of cooling for users 8
through energy efficiency improvement in cooling equipment and building envelopes; 9
responding to likely increases in demands for electricity for cooling through expanded 10
generation capacities, expanded interties, and possibly increased capacities for storage; 11
and responding to concerns about increased peak demand in electricity loads, especially 12
seasonally, through contingency planning for load-leveling. Over a period of several 13
BOX 5.2: HURRICANE KATRINA AND THE GULF COAST: A CASE STUDY
It is not possible to attribute the occurrence of Hurricane Katrina, August 29, 2005, to climate change; but projections of climate change say that extreme weather events are very likely to become more intense. If so (e.g., more of the annual hurricanes at higher levels of wind speed and potential damages), then the impacts of Katrina are an indicator of possible impacts of one manifestation of climate change. Impacts of Katrina on energy systems in the region and the nation were dramatic at the time, and some impacts remained many months later. The hurricane itself impacted coastal and offshore oil and gas production, offshore oil port operation (stopping imports of more than one million bbl/d of crude oil), and crude oil refining along the Louisiana Gulf Coast (Figures 3.4 a-d). Within only a few days, oil product and natural gas prices had risen significantly across the U.S. As of mid-December 2005, substantial oil and gas production was still shut-in, and refinery shutdowns still totalled 367, 000 bbl/d (EIA, 2005) (see Chapter 3). Possibilities for adaptation to reduce risks of damages from future Katrinas are unclear. They might include such alternatives as hardening offshore platforms and coastal facilities to be more resilient to high winds, wave action, and flooding (potentially expensive) and shifting the locations of some coastal refining and distribution facilities to less vulnerable sites, reducing their concentration in the Gulf Coast. (potentially very expensive).
Synthesis and Assessment Product 4.5 Public Comments Draft – November 2006
107
decades, for instance, technologies are likely to respond to consumer concerns about 1
higher energy bills where they occur. 2
3
Many technologies that can enable adaptations to effects on energy production and 4
supply are available for deployment. The most likely adaptation in the near term is an 5
increase in perceptions of uncertainty and risk in longer-term strategic planning and 6
investment, which could seek to reduce risks through such approaches as diversifying 7
supply sources and technologies and risk-sharing arrangements. 8
9
Adaptation to indirect effects of climate change on the energy sector is likely to be 10
bundled with adaptation to other issues for energy policy and decision-making in the 11
U.S., such as energy security: for instance, in the development of lower carbon-emitting 12
fossil fuel use technology ensembles, increased deployment of renewable energy 13
technologies, and the development of alternatives to fossil fuels and effects on energy 14
institutional structures. Issues related to effects of climate change on other countries 15
linked with U.S. energy conditions are likely to be addressed through attention by both 16
the public and private sectors to related information systems and market signals. 17
18
It seems possible that adaptation challenges would be greatest in connection with possible 19
increases in the intensity of extreme weather events and possible significant changes in 20
regional water supply regimes. More generally, adaptation prospects appear to related to 21
the magnitude and rate of climate change (e.g., how much the average temperature rises 22
before stabilization is achieved, how rapidly it moves to that level, and how variable the 23
climate is at that level), with adaptation more likely to be able to cope with effects of 24
lesser amounts, slower rates of change, and less variable climate (Wilbanks et al., 2006). 25
26
Generally, prospects for these types of adaptations depend considerably on the level of 27
awareness of possible climate changes at a relatively localized scale and possible 28
implications for energy production and use – the topic of this study. When the current 29
knowledge base to support such awareness is so limited, this suggests that expanding the 30
knowledge base is important to the energy sector in the United States. 31
Synthesis and Assessment Product 4.5 Public Comments Draft – November 2006
108
1
5.4 NEEDS FOR EXPANDING THE KNOWLEDGE BASE 2
3
Expanding the knowledge base about effects of climate change on energy production and 4
use in the United States is not just a responsibility of the federal government. As the 5
work of such institutions as the Electric Power Research Institute and the California 6
Energy Commission demonstrates, a wide variety of parts of U.S. society have 7
knowledge, expertise, and data to contribute to what should be a broad-based multi-8
institutional collaboration. 9
10
Recognizing that roles in these regards will differ among federal and state governments, 11
industry, non-governmental institutions, and academia and that all parties should be 12
involved in discussions about how to proceed, this study suggests the following needs for 13
expanding the knowledge base on its topic, some of which are rooted in broader needs for 14
advances in climate change science. 15
16
5.4.1 General Needs 17
18
• Improved projections of climate change and its effects on a relatively fine-grained 19
geographic scale, especially of precipitation changes and severe weather events: 20
e.g., in order to support evaluations of impacts at local and small-regional scales, 21
not only in terms of gradual changes but also in terms of extremes, since many 22
energy facility decisions are made at a relatively localized scale 23
24
• Research on and assessments of implications of extreme weather events for 25
energy system resiliency, including strategies for both reducing and recovering 26
from impacts 27
28
• Research on and assessments of potentials, costs, and limits of adaptation to risks 29
of adverse effects, for both supply and use infrastructures 30
Synthesis and Assessment Product 4.5 Public Comments Draft – November 2006
109
1
• Research on efficiency of energy use in the context of climate warming, with an 2
emphasis on technologies and practices that save cooling energy and reduce 3
electrical peak load 4
5
• Research on and assessments of implications of changing regional patterns of 6
energy use for regional energy supply institutions and consumers 7
8
• Improvements in the understanding of effects of changing conditions for 9
renewable energy and fossil energy development and market penetration on 10
regional energy balances and their relationships with regional economies 11
12
• In particular, improvements in understanding likely effects of climate change in 13
Arctic regions and on storm intensity to guide applications of existing 14
technologies and the development and deployment of new technologies and other 15
adaptations for energy infrastructure and energy exploration and production in 16
these relatively vulnerable regions 17
18
• Attention to linkages and feedbacks among climate change effects, adaptation, 19
and mitigation; to linkages between effects at different geographic scales; and 20
relationships between possible energy effects and other possible economic, 21
environmental, and institutional changes (Parson et al., 2003; Wilbanks, 2005). 22
23
5.4.2 Needs Related To Major Technology Areas 24
25
• Improving the understanding of potentials to increase efficiency improvements in 26
space cooling 27
28
• Improving information about interactions among water demands and uses where 29
the quantity and timing of surface water discharge is affected by climate change 30
Synthesis and Assessment Product 4.5 Public Comments Draft – November 2006
110
1
• Improving the understanding of potential climate change and localized variability 2
on energy production from wind and solar technologies 3
4
• Developing strategies to increase the resilience of coastal and offshore oil and gas 5
production and distribution systems to extreme weather events 6
7
• Pursuing strategies and improved technology potentials for adding resilience to 8
energy supply systems that may be subject to stress under possible scenarios for 9
climate change 10
11
• Improving understandings of potentials to improve resilience in electricity supply 12
systems through regional inertie capacities and distributed generation 13
14
• Research on and assessments of the impacts of severe weather events on sub-sea 15
pipeline systems, especially in the Gulf of Mexico, and strategies for reducing 16
such impacts 17
18
Other needs for research exist as well, and the process of learning more about this topic 19
in coming years may change perceptions of needs and priorities; but based on current 20
knowledge, these appear to be high priorities in the next several years. 21
22 23
Synthesis and Assessment Product 4.5 Public Comments Draft – November 2006
111
1 REFERENCES 2
3 4 Abbasi, D. R., 2005: Americans and Climate Change: Closing the Gap Between 5
Science and Action, Yale School of Forestry and Environmental Studies, New 6 Haven. 7
8 Akimoto, K., T. Tomoda, Y.Fujii, and K. Yamaji, 2004: Assessment of global warming 9
mitigation options with integrated assessment model DNE21, Energy Economics 10 26. 635– 653. 11
12 Alexander’s Gas & Oil Connections, 2005: European gas profiles, Market Reports, 13
November 2005. 14 15 Amato, A.D., M. Ruth, P. Kirshen and J. Horwitz. 2005: Regional energy demand 16
responses to climate change: Methodology and application to the Commonwealth 17 of Massachusetts. Climatic Change, 71. 175–201. 18
19 API, 2006: Recommended Practice, 95F, First Edition, May 2006. 20 21 API, 2006a. Recommended Practice, 95J, First Edition, June 2006. 22 23 API, 2006b. Gulf of Mexico Jackup Operations for Hurricane Season—Interim 24
Recommendations/ 25 26 API, 2006c. Interim Guidance for Gulf of Mexico MODU Mooring Practice—2006 27
Hurricane Season. 28 29 Aspen Environmental Group and M-Cubed, 2005: Potential Changes In Hydropower 30
Production From Global Climate Change In California And The Western United 31 States, CEC-700-2005-010. California Energy Commission, Sacramento, 32 California. 33
34 Atkinson, B.A., C. S. Barnaby, A. H. Wexler, and B. A. Wilcox, 1981: Proceedings of 35
the Annual Meeting – American Section of the International Solar Energy 36 Society, Vol/Issue: 6; National Passive Solar Conference; September 8, 1981; 37 Portland, OR, USA. 38
39 Badri, M.A. , 1992: Analysis of demand for electricity in the United States, Energy 40
17(7). 725–733. 41 42 Barnett, T., R. Malone, W. Pennell, D. Stammer, B. Semtner, and W. Washington, 2004: 43
The effects of climate change on water resources in the west: Introduction and 44 overview, Climate Change, 62. 1-11. 45
46
Synthesis and Assessment Product 4.5 Public Comments Draft – November 2006
112
Baxter, L.W., and K. Calandri. 1992: Global warming and electricity demand: A study of 1 California. Energy Policy, 20(3). 233–244. 2
3 Belzer, D.B., M. J. Scott, and R.D. Sands, 1996: Climate change impacts on U.S. 4
commercial building energy consumption: an analysis using sample survey data, 5 Energy Sources 18(2). 177–201. 6
7 Billings Gazette, 2005. South Dakota Governor Seeks Summit on Missouri River, 8
February 2005. Accessed 16 November 2006 at: 9 http://www:Billingsgazette.com 10
11 Breslow, P. and Sailor, D. 2002. Vulnerability of wind power resources to climate 12
change in the continental United States, Renewable Energy, 27. 585–598. 13 14 Brown, R. A., N. J. Rosenberg, C. J. Hays, W. E. Easterling, and L. O. Mearns, 2000: 15
Potential production and environmental effects of switchgrass and traditional 16 crops under current and greenhouse-altered climate in the central United States: 17 A simulation study, Agr. Ecosyst. Environ., 78. 31-47. 18
19 Burtraw, B., K. Palmer, and D. Kahn, 2005: Allocation of CO2 Emissions Allowances in 20
the Regional Greenhouse Gas Cap-and-Trade Program, RFF DP 05-25, 21 Resources for the Future, Washington, D.C. 22
23 California Energy Commission, 2006: Historic State-Wide California Electricity 24
Demand, Accessed 09 October 2006 at 25 http://energy.ca.gov/electricity/historic_peak_demand.html. 26
27 CCTP, 2005. U.S. Climate Change Technology Program: Vision and Framework for 28
Strategy and Planning, U.S. Climate Change Technology Program, Washington. 29 30 CEPA, 2006. Report to the Governor and Legislature. Climate Action Team, State of 31
California. 32 33 Changnon, S. A., 2005: Economic Impacts of Climate Conditions in the United States: 34
Past, Present, and Future, Climatic Change, 68: 1–9. 35 36 Clean Air Task Force, 2004. Wounded Waters: The Hidden Side of Power Plant 37
Pollution, CATF, Boston. 38 39 Considine, T.J. 2000: The impacts of weather variations on energy demand and carbon 40
emissions, Resource and Energy Economics, 22, 295-314. 41 42
Synthesis and Assessment Product 4.5 Public Comments Draft – November 2006
113
Crichton, D., 2005: “Insurance and Climate Change,” in Conference on “Insurance and 1 Climate Change,” presented at Conference on “Climate Change, Extreme Events, 2 and Coastal Cities,” Houston, TX, Feb. 9, 2005. Accessed 20 November 2006 at: 3 http://64.233.187.104/search?q=cache:n5NPA6j23boJ:cohesion.rice.edu/Centersa 4 ndInst/ShellCenter/emplibrary/CoastalCities.pdf+Crichton,+coastal+cities,+20055 &hl=en&gl=us&ct=clnk&cd=1 6
7 Cubasch, U., G.A. Meehl, G.J. Boer, R.J. Stouffer, M. Dix, A. Noda, C.A. Senior, S. 8
Raper, and K.S. Yap. 2001: Projections of Future Climate Change. In: Climate 9 Change 2001: The Scientific Basis. Contribution of Working Group I to the Third 10 Assessment Report of the Intergovernmental Panel on Climate Change, [J.T. 11 Houghton, Y. Ding, D.J. Griggs, M. Noguer, P.J. van der Linden, X. Dai, K. 12 Maskell, and C.A. Johnson, (eds.)], Cambridge University Press, 881 pp. 13
14 Darmstadter, J., 1993: Climate change impacts on the energy sector and possible 15
adjustments in the MINK region, Climatic Change, 24. 117-129. 16 17 Davcock, C., R. DesJardins, and S. Fennell, 200: Generation cost forecasting using on-18
line thermodynamic models, In: Proceedings of Electric Power. 19 20 Dettinger, M.D., 2005: Changes In Streamflow Timing In The Western United States In 21
Recent Decades, USGS Fact Sheet 2005-3018. 22 23 DOC/DOE, 2001: References to Deepwater Ports Act. Available at MARAD web site 24
for the map and the DOC/DOE Workshop in 2001 for information on P.O.R.T.S 25 26 DOE-2.Com. 2006. DOE-2 Building Energy Use and Cost Analysis Tool. Accessed 20 27
November 2006 at: http://doe2.com/DOE2/index.html 28 29 DOI, 2003: Water 2025 – Preventing Crises and Conflict in the West, U.S. Department 30
of the Interior. 31 32 Downton, M. W., T.R. Stewart, et al. 1988: Estimating historical heating and cooling 33
needs: Per capita degree-days, Journal of Applied Meteorology, 27(1). 84–90. 34 35 Edmonds, J., M. Wise, H. Pitcher, R. Richels, T. Wigley, and C. MacCracken. 1996a: an 36
integrated assessment of climate change and the accelerated introduction of 37 advanced energy technologies: An application of minicam 1.0, Mitigation and 38 Adaptation Strategies for Global Change 1(4). 311-339. 39
40 Edwards, A., 1991: Global Warming From An Energy Perspective, Global Climate 41
Change And California, Chapter 8, University of California Press. 42 43 Elkhafif, M., 1996: An iterative approach for weather-correcting energy consumption 44
data, Energy Economics 18(3). 221–230. 45 46
Synthesis and Assessment Product 4.5 Public Comments Draft – November 2006
114
EIA 2001: Residential Energy Consumption Survey 2001: Consumption and Expenditure 1 Data Tables. Accessed 17 November 2006 at: 2 http://www.eia.doe.gov/emeu/recs/recs2001/detailcetbls.html 3
4 EIA 2001b: 2001 Public Use Data Files (ASCII Format). Accessed 20 November 2006 5
at: http://www.eia.doe.gov/emeu/recs/recs2001/publicuse2001.html. 6 7 EIA 2001c: U.S. Climate Zones. Accessed 20 November 2006 at: 8
http://www.eia.doe.gov/emeu/recs/climate_zone.html. 9 10 EIA 2002: Annual Coal Report, DOE/EIA-0584, Energy Information Administration. 11 12 EIA 2002a: Energy Consumed as a Fuel by End Use: Table 5.2 - By Manufacturing 13
Industry with Net Electricity (trillion Btu), 2002 Energy Consumption by 14 Manufacturers--Data Tables, Energy Information Administration. Accessed 23 15 October 2006 at: 16 http://www.eia.doe.gov/emeu/mecs/mecs2002/data02/shelltables.html. 17
18 EIA, 2003b: CBECS Public Use Microdata Files. Accessed 20 November 2006 at: 19
http://www.eia.doe.gov/emeu/cbecs/cbecs2003/public_use_2003/cbecs_pudata2020 03.html 21
22 EIA, 2004: Annual Energy Review, Energy Information Administration. 23 24 EIA 2004: Petroleum Supply Annual, Energy Information Administration. 25 26 EIA, 2004b: Renewable Energy Trends, Accessed 24 October 2006 at: 27
http://www.eia.doe.gov/cneaf/solar.renewables/page/trends/rentrends04.html 28 29 EIA, 2005d: Renewable Energy Trends 2004, Table 18, Renewable Electric Power 30
Sector Net Generation by Energy Source and State, 2003. Energy Information 31 Administration. 32
33 EIA, 2006: Annual Energy Outlook 2006, with Projections to 2030. DOE/EIA-34
0383(2006). Energy Information Administration, Washington, D.C. 35 36 EIA, 2006d: Coal Transportation Information System. Accessed 07 November 2006 at: 37
http://www.eia.doe.gov/cneaf/coal/ctrdb/ctrdb.html. 38 39 Elliott D.B., D.M Anderson, D.B.Belzer, K.A.Cort, J.A.Dirks, and D.J. Hostick, 2004: 40
Methodological Framework for Analysis of Buildings-Related Programs: GPRA 41 Metrics Effort. Pacific Northwest National Laboratory, PNNL-14697, Richland, 42 WA. 43
44 EPA, 2000: Economic and Engineering Analyses of the Proposed Section 316(b) New 45
Facility Rule, EPA-821-R-00-019. 46

Synthesis and Assessment Product 4.5 Public Comments Draft – November 2006
115
1 EPA, 2003: State actions section of the Global Warming website, Environmental 2
Protection Agency. Accessed 09 November 2006 at: 3 http://yosemite.epa.gov/oar/globalwarming.nsf/content/ActionsState.html. 4
5 EPRI, 2003: A Survey of Water Use and Sustainability in the United States With a Focus 6
on Power Generation, EPRI Report No. 1005474. 7 8 Fidje A. and T. Martinsen, 2006: Effects of Climate Change on the Utilization of Solar 9
Cells in the Nordic Region. extended abstract for European Conference on 10 Impacts of Climate Change on Renewable Energy Sources. Reykjavik, Iceland, 11 June 5-9, 2006. 12
13 Flavin, C., and N. Lenssen, 1994: Power Surge: Guide to the Coming Energy 14
Revolution, WW Norton, New York. 15 16 Franco, G., 2005: Climate Change Impacts and Adaptation in California, CEC-500-17
2005-103-SD, California Energy Commission. 18 19 Franco, G., and A. Sanstad. 2006: Climate Change and Electricity Demand in 20
California, Final white paper, California Climate Change Center, CEC-500-21 2005-201-SD. Accessed 25 October 2006 at: 22 http://www.climatechange.ca.gov/climate_action_team/reports/index.html 23
24 GAO, 2003. Freshwater Supply, States’ Views of How Federal Agencies Could Help 25
Them Meet the Challenges of Expected Shortages, GAO Report No. GAO-03-26 514, United States General Accounting Office. 27
28 Gellings, C.W., and K.E.Yeager, 2004: Transforming the electric infrastructure, Physics 29
Today. 30 31 Georgakakos, K. P., N. E. Graham, T. M. Carpenter, A. P. Georgakakos, and H. Yao, 32
2005: Integrating climate-hydrology forecasts and multi-objective reservoir 33 management for Northern California. EOS, 86(12), 122-127. 34
35 Greenwire, 2003: State orders N.Y.’s Indian Point to take steps to protect fish, 36
Greenwire. Accessed 20 November 2006 at: 37 http://www.eenews.net/Greenwire.htm. 38
39 Hadley, S.W., D.J. Erickson III, J.L. Hernandez, and S.L. Thompson, 2004: Future U.S. 40
Energy Use for 2000-2025 as Computed with Temperature from a Global Climate 41 Prediction Model and Energy Demand Model 24th USAEE/IAEE North 42 American Conference, Washington, DC, USA. 43
44
Synthesis and Assessment Product 4.5 Public Comments Draft – November 2006
116
Hadley, S.W. , D. J. Erickson III, J.L. Hernandez, C.T. Broniak, and T. J. Blasing, 2006: 1 Responses of energy use to climate change: A climate modeling study, 2 Geophysical Research Letters 33, L17703, doi:10.1029/2006GL026652, 3
4 Harrison, G. and A.Wallace, 2005: Climate sensitivity of marine energy, Renewable 5
Energy, 30. 1801–1817. 6 7 Hayhoe, K. et al., 2004: Emissions pathways, climate change, and impacts on California. 8
Proceedings, NAS, 101/34: 12422-12427. 9 10 Hill, D. and R. Goldberg 2001: Energy Demand. In: [C. Rosenzweig, C. and W. 11
Solecki, (eds.),] Climate Change and a Global City: An Assessment of the 12 Metropolitan East Coast Region, Columbia Earth Institute, New York:, 121-147. 13
14 Hoffert, M. I. et al., 2002: Advanced technology paths to global climate stability: 15
Energy for a greenhouse planet, Science, 298, 981-87. 16 17 Huang, Y. J., 2006: The Impact of Climate Change on the Energy Use of the U.S. 18
Residential and Commercial Building Sectors, LBNL-60754, Lawrence Berkeley 19 National Laboratory, Berkeley CA. 20
21 Johnson, V.H. 2002: Fuel Used for Vehicle Air Conditioning: A State-by-State Thermal 22
Comfort-Based Approach, SAE paper number 2002-01-1957. Future Car 23 Congress, June 2002, Hyatt Crystal City, VA, USA, Session: Climate Control 24 Technology. SAE International, Warrendale, PA 15096-0001. Accessed 20 25 November 2006 at: http://www.sae.org/technical/papers/2002-01-1957 26
27 ICF, 1995: Potential Effects of Climate Change on Electric Utilities, TR-105005, 28
Research Project 2141-11, Prepared for CRIEPI and EPRI 29 30 IEA, 2004: Energy Security and Climate Change Policy Interactions. Information 31
Paper, International Energy Agency. 32 33 IPCC, 2001a: Climate Change 2001: Impacts, Adaptation and Vulnerability. Cambridge 34
University Press, Cambridge. 35 36 IPCC, 2005a: Carbon Dioxide Capture and Storage. IPCC Special Report. 37 38 IPPC 2005b: Workshop on New Emission Scenarios, Working Group III Technical 39
Support Unit, 29 June – 1 July 2005, Laxenburg, Austria. Accessed 20 November 40 2006 at: http://www.ipcc.ch/meet/othercorres/ESWmeetingreport.pdf 41
42 Jorgenson, D., R. Goettle, B. Hurd, J. Smith, L. Chestnut, and D. Mills, 2004. U.S. 43
Market Consequences Of Global Climate Change, Pew Center on Global Climate 44 Change. 45
46
Synthesis and Assessment Product 4.5 Public Comments Draft – November 2006
117
Kainuma, M., Y. Matsuokab, T. Moritaa, T. Masuia, and K. Takahashia, 2004: Analysis 1 of global warming stabilization scenarios: the Asian-Pacific integrated model, 2 Energy Economics, 26. 709– 719. 3
4 Kelly, P., V.Bhatt, J. Lee, O. Carroll, and E. Linky, 2005: Emissions Trading: 5
Developing Frameworks and Mechanisms for Implementing and Managing 6 Greenhouse Gas Emissions,” Proceedings of the World Energy Engineering 7 Congress, September 14-16, 2005, Austin, TX. 8
9 Kousky, C., and S. Schneider, 2003: Global climate policy: Will cities lead the way?, 10
Climate Policy, 3 (2003) 359–372. 11 12 Kurosawa, A., 2004. Carbon concentration target and technological choices, Energy 13
Economics, 26. 675– 684. 14 15 Lam, J. C. 1998: Climatic and economic influences on residential electricity 16
consumption, Energy Conversion Management, 39(7): 623–629. 17 18 Land Letter, 2004. Western Power Plants Come Under Scrutiny as Demand and 19
Drought Besiege Supplies. Accessed 04 November 2006 at: 20 http://www.eenews.net/Landletter.htm. 21
22 Le Comte, D. M. and H.E. Warren, 1981: Modeling the impact of summer temperatures 23
on national electricity consumption. Journal of Applied Meteorology. 20, 1415–24 1419. 25
26 Lehman, R. L., 1994: Projecting monthly natural gas sales for space heating using a 27
monthly updated model and degree-days from monthly outlooks, Journal of 28 Applied Meteorology, 33(1), 96–106. 29
30 Lettenmaier, D.P., A.W. Wood, R.N. Palmer, E.F. Wood, and E.Z. Stakhiv, 1999: Water 31
resources implications of global warming: A U.S. regional perspective, Climate 32 Change 43(3): 537-579. 33
34 Linder, K.P. and M.R. Inglis, 1989: The Potential Impact of Climate Change on Electric 35
Utilities, Regional and National Estimates, U.S. Environmental Protection 36 Agency, Washington, DC. 37
38 London Climate Change Partnership, 2002: London’s Warming, UK Climate Impacts 39
Programme. 40 41 Loveland, J.E. and G.Z. Brown, 1990: Impacts of Climate Change on the Energy 42
Performance of Buildings in the United States, U.S. Congress, Office of 43 Technology Assessment, Washington, DC, OTA/UW/UO, Contract J3-4825.0. 44
45
Synthesis and Assessment Product 4.5 Public Comments Draft – November 2006
118
Luers, A. L. and S.C. Moser, 2006: Preparing for the Impacts of Climate Change in 1 California: Opportunities and Constraints for Adaptation, California Climate 2 Change Center, CEC-500-2005-198-SF. 3
4 Mansur, E.T., R. Mendelsohn, and W. Morrison, 2005: A discrete-continuous choice 5
model of climate change impacts on energy, SSRN Yale SOM Working Paper 6 No. ES-43 (abstract number 738544), Submitted to Journal of Environmental 7 Economics and Management. 8
9 Marketwatch.com, 2006: June 9, 2006, 10 11 Maulbetsch, J.S. and M. N.DiFilippo, 2006: Cost and Value of Water Use at Combined 12
Cycle Power Plants, CEC-500-2006-034, April 2006. 13 14 Mendelsohn, R. and J. Neumann, eds., 1999: The Economic Impact of Climate Change 15
on the Economy of the United States, Cambridge, Cambridge University Press. 16 17 Mendelsohn, R., W. Morrison, M. Schlesinger and N. Andronova, 2000: Country-18
specific market impacts from climate change, Climatic Change 45. 553-569 19 20 Mendelsohn, R. (ed.), 2001: Global Warming and the American Economy: A Regional 21
Assessment of Climate Change, Edward Elgar Publishing, UK. 22 23 Mendelsohn, R., 2003. "The Impact of Climate Change on Energy Expenditures in 24
California." Appendix XI in Wilson, T., and L. Williams, J. Smith, R. 25 Mendelsohn, Global Climate Change and California: Potential Implications for 26 Ecosystems, Health, and the Economy, Consultant report 500-03-058CF to the 27 Public Interest Energy Research Program, California Energy Commission, August 28 2003. Available from http://www.energy.ca.gov/pier/final_project_reports/500-29 03-058cf.html 30
31
Mendelsohn, R. and L. Williams, 2004: Comparing Forecasts of the Global Impacts of 32 Climate Change” Mitigation and Adaptation Strategies for Global Change 9 33 (2004) 315-333. 34
35 Meyer, J.L., M.J. Sale, P.J. Mulholland, and N.L. Poff, 1999. Impacts of climate change 36
on aquatic ecosystem functioning and health, J. Amer. Water Resources Assoc. 37 35(6): 1373-1386. 38
39 Miller, B.A., and W.G. Brock, 1988: Sensitivity of the Tennessee Valley Authority 40
Reservoir System to Global Climate Change, Report No. WR28-1-680-101. 41 Tennessee Valley Authority Engineering Laboratory, Norris, Tennessee. 42
43 Miller, N. L., K. Hayhoe, J.M. Jin, and M. Auffhammer 2006: Climate, extreme heat 44
and energy demand in California, submitted to the Journal of Applied 45 Meteorology and Climatology. 46
Synthesis and Assessment Product 4.5 Public Comments Draft – November 2006
119
1 Milwaukee Journal Sentinel, February 18, 2005. Wisconsin Energy Just Can’t Stay Out 2
of the News with Their Intake Structures, February 18, 2005. 3 4 Morris, M., 1999; The Impact of Temperature Trends on Short-Term Energy Demand, 5
Energy Information Administration, (EIA). 6 7 Morrison, W.N. and R. Mendelsohn, 1999: The impact of global warming on U.S. energy 8
expenditures. In: [R. Mendelsohn and J. Neumann, (eds.)], The Economic 9 Impact of Climate Change on the United States Economy, , Cambridge University 10 Press, UK and New York, pp. 209–236. 11
12 NACC, 2001: Climate Change Impacts on the United States: The Potential 13
Consequences of Climate Variability and Change, Washington: U.S. Global 14 Change Research Program. 15
16 Nakicenovic, N. and K. Riahi, 2003: Model Runs With MESSAGE in the Context of the 17
Further Development of the Kyoto-Protocol. Laxenburg: IIASA. Available 18 from: www.wbgu.de/wbgu_sn2003_ex03.pdf 19
20 NARUC, 2006: “Enhancing the Nation's Electricity Delivery System - Transmission 21
Needs,” Mark Lynch, 2006 National Electricity Delivery Forum, Washington, 22 DC, February 15, 2006. Accessed 09 November 2006 at: 23 http://www.energetics.com/electricity_forum/pdfs/lynch.pdf. 24
25 Nash, L.L., and P.H. Gleick, 1993: The Colorado River Basin and Climate Change: The 26
Sensitivity of Stream Flow and Water Supply to Variations in Temperature and 27 Precipitation, EPA230-R-93-009, U.S. Environmental Protection Agency, 28 Washington, D.C. 29
30 Niemeyer, V., 2005: Climate science needs for long-term power sector investment 31
decisions, Presented at the CCSP Workshop on Climate Science in Support of 32 Decision Making, Washington, DC., November 15, 2005. 33
34 Northwest Power and Conservation Council. 2005: Effects of Climate Change on the 35
Hydroelectric System, Appendix N, The Fifth Northwest Electric Power and 36 Conservation Plan. Document 2005-7. Northwest Power and Conservation 37 Council, Portland, Oregon. Accessed 14 November 2006 at: 38 http://www.nwcouncil.org/energy/powerplan/plan/Default.htm. 39
40 NRC, 2002: Abrupt Climate Change: Inevitable Surprises, National Research Council, 41
National Academy Press, Washington, DC. 42 43 NREL, 2006. “On The Road To Future Fuels And Vehicles,” Research Review. May 44
2006, NREL/BR-840-38668. 45 46
Synthesis and Assessment Product 4.5 Public Comments Draft – November 2006
120
O’Keefe, W., 2005: Climate Change and National Security, Marshall Institute, May 1 2005. Accessed 11 October 2006 at: 2 http://www.marshall.org/article.php?id=290. 3
4 O’Neill, R. 2003: “Transmission Investments and Markets, Federal Energy Regulation 5
Commission,” presented at Harvard Electricity Policy Group meeting, Point 6 Clear, AL, December 11, 2003. Available from: 7 http://www.ksg.harvard.edu/hepg/Papers/Oneill.trans.invests.and.markets.11.Dec.8 03.pdf 9
10 ORNL, 2006. See the Oak Ridge National Laboratory Bioenergy Feedstock Information 11
Network, http://bioenergy.ornl.gov/main.aspx, and the Agricultural Research 12 Service Bioenergy and Energy Alternatives Program, 13 http://www.ars.usda.gov/research/programs/programs.htm?np_code=307, for 14 examples of the extensive research in this area. 15
16 Ouranos, 2004: Adapting to Climate Change. Ouranos Consortium, Montreal. 17 18 Pacala, S. and R. Socolow, 2004: Stabilization wedges: Solving the climate problem for 19
the next 50 years with current technologies, Science, 305, 968-72. 20 21 Paltsev, S., J.M. Reilly, H.D. Jacoby, R.S. Eckaus, J. McFarland, M. Sarofim, M. 22
Asadoorian, and M. Babiker, 2005: The MIT Emissions Prediction and Policy 23 Analysis (EPPA) Model: Version 4, � MIT Global Change Joint Program Report 24 Series #125 25
26 Pan, Z. T., M. Segal, R. W. Arritt, and E. S. Takle, 2004: On the potential change in 27
solar radiation over the U.S. due to increases of atmospheric greenhouse gases, 28 Renewable Energy, 29, 1923-1928. 29
30 Pardo, A., V. Meneu, and E. Valor, 2002: Temperature and seasonality influences on 31
the Spanish electricity load, Energy Economics 24(1), 55–70. 32 33 Parker, L.S., 1999: Electric Utility Restructuring: Overview Of Basic Policy Questions, 34
Congressional Research Service Report 97-154. 35 Parker, D.S. 2005: Energy Efficient Transportation for Florida, Florida Solar Energy 36
Center, University of Central Florida, Cocoa, Florida, Energy Note FSEC-EN-19. 37 Accessed on 20 November 2006 at: 38 http://www.fsec.ucf.edu/Pubs/energynotes/en-19.htm. 39
40 Parson, E., et al., 2003. Understanding climatic impacts, vulnerabilities, and adaptation 41
in the United States: Building a capacity for assessment, Climatic Change 57, 9–42 42. 43
44
Synthesis and Assessment Product 4.5 Public Comments Draft – November 2006
121
Peterson, T. D., and A.Z. Rose, 2006: Reducing conflicts between climate policy and 1 energy policy in the U.S.: The important role of the states, Energy Policy, 34, 2 619–631. 3
4 Petroleum Institute for Continuing Education, undated: Fundamentals of Petroleum 5
Refining Economics, training course curriculum. 6 7 Placet, M., K.K. Humphreys, and N. Mahasenan, 2004: Climate Change Technology 8
Scenarios: Energy, Emissions, And Economic Implications, Pacific Northwest 9 National Laboratory Richland, WA, PNNL-14800. Available from: 10 http://www.pnl.gov/energy/climate/climate_change-technology_scenarios.pdf 11
12 PNNL, 2002: Facility Energy Decision System User’s Guide, Release 5.0, PNNL-10542 13
Rev. 3. Prepared for the U.S. Department of Energy - Federal Energy 14 Management Program, U.S. Army - Construction Engineering Research 15 Laboratory, U.S. Army - Forces Command, Defense Commissary Agency, and 16 U.S. Navy - Naval Facilities Engineering Service Center, Pacific Northwest 17 National Laboratory, Richland, WA. 18
19 Prindle, W., A. Shipley, and R. Elliott. 2006: Energy Efficiency’s Role in a Carbon Cap-20
and-Trade System: Modeling Results from the Regional Greenhouse Gas 21 Initiative. American Council for an Energy-Efficient Economy, Washington, 22 D.C., Report Number E064. Accessed 04 November 2006 at : 23 http://www.aceee.org/pubs/e064.htm. 24
25 Quayle, R. G. and H.F. Diaz, 1979: Heating degree-day data applied to residential 26
heating energy consumption, Journal of Applied Meteorology 19, 241–246. 27 28 Reno-Gazette Journal, 2005: Nevada Residents Wary of Sempra Water Rights 29
Purchases, February 22, 2005. 30 31 RFA, 2006: From Niche to Nation: Ethanol Industry Outlook 2006, Renewable Fuels 32
Association. 33 34 Rose, A., R. Kamat, and D. Abler, 1999: The economic impact of a carbon tax on the 35
Susquehanna River Basin economy, Energy Economics, 21, 363-84. 36 37 Rose, A., J. Shortle, et al., 2000: Characterizing economic impacts and responses to 38
climate change, Global and Planetary Change, 25, 67-81. 39 40 Rose, A., and G. Oladosu, 2002: Greenhouse gas reduction in the U.S.: Identifying 41
winners and losers in an expanded permit trading system, Energy Journal, 23, 1-42 18. 43
44

Synthesis and Assessment Product 4.5 Public Comments Draft – November 2006
122
Rose, A. and Z. Zhang, 2004: Interregional burden-sharing of greenhouse gas mitigation 1 in the United States,” Mitigation and Adaptation Strategies for Global Change, 9, 2 477-500. 3
4 Rose, A., and G. Oladosu, 2006. Income distribution impacts of climate change 5
mitigation policy in the Susquehanna River Basin,” Energy Economics, 6 (forthcoming). 7
8 Rosenthal, D.H., H.K. Gruenspecht, and E.Moran, 1995: Effects of global warming on 9
energy use for space heating and cooling in the United States, Energy Journal 10 16(2), 77-96. 11
12 Rosenzweig, C. and W.D. Solecki, (eds.), 2001: Climate Change and a Global 13
City: The Potential Consequences of Climate Variability and Change – Metro 14 East Coast (MEC). Report for the U.S. Global Change Research Program, 15 National Assessment of Possible Consequences of Climate Variability and 16 Change for the United States, Columbia Earth Institute, New York:. 17 18
Ruosteenoja, K., T.R Carter, K.Jylhä, and H.Tuoenvirta, 2003: Future Climate in 19 World Regions: An Intercomparison of Model-Based Projections for the New 20 IPCC Emissions Scenarios, The Finnish Environment 644, Finnish Environment 21 Institute, Helsinki, Finland. 22
23 Ruth, M. and A-C Lin. 2006: Regional energy and adaptations to climate change: 24
Methodology and application to the state of Maryland, Energy Policy, 34, 2820-25 2833. 26
27 Rutherford, T., 2001: Equity and Global Climate Change: Economic Considerations, 28
Discussion Brief Prepared for the Pew Center for Global Climate Change - Equity 29 and Global Climate Change Conference, Washington, DC, April, 2001. 30
31 Sailor, D.J., 2001: Relating residential and commercial sector electricity loads to climate: 32
Evaluating state level sensitivities and vulnerabilities, Energy 26(7), 645–657. 33 34 Sailor, D.J., and J.R.Muñoz, 1997: Sensitivity of electricity and natural gas consumption 35
to climate in the U.S.—methodology and results for eight states, Energy, 22(10), 36 987–998. 37
38 Sailor, D.J., and A.A.Pavlova, 2003: Air conditioning market saturation and long-term 39
response of residential cooling energy demand to climate change, Energy, 28(9), 40 941–951. 41
42 Schwarz, P. and D. Randall, 2004: Abrupt Climate Change, Washington: GBN. 43
Accessed 20 November 2006 at: 44 http://www.gbn.com/ArticleDisplayServlet.srv?aid=26231. 45
46
Synthesis and Assessment Product 4.5 Public Comments Draft – November 2006
123
Scott, M. J., R.D. Sands, L.W. Vail, J.C. Chatters, D.A. Neitzel, and S.A. Shankle., 1993: 1 The Effects of Climate Change on Pacific Northwest Water-Related Resources: 2 Summary of Preliminary Findings, Pacific Northwest Laboratory, PNL-8987, 3 Richland, Washington. 4
5 Scott, M.J., D.L.Hadley, and L.E.Wrench, 1994: Effects of climate change on 6
commercial building energy demand, Energy Sources, 16(3), 339–354. 7 8 Scott, M. J., J.A. Dirks, and K.A. Cort. 2005: The adaptive value of energy efficiency 9
programs in a warmer world: Building energy efficiency offsets effects of climate 10 change, PNNL-SA-45118. In: Reducing Uncertainty Through Evaluation, 11 Proceedings of the 2005 International Energy Program Evaluation Conference, 12 August 17-19, 2005, Brooklyn, New York. 13
14 Segal, M., Z. Pan, R. W. Arritt, and E. S. Takle, 2001: On the potential change in wind 15
power over the u.s. due to increases of atmospheric greenhouse gases, Renewable 16 Energy, 24, 235-243. 17
18 Senate of Texas, 1999: Interim Committee Report, Interim Committee on Electric Utility 19
Restructuring, 20 21 Shurepower, LLC, 2005: Electric Powered Trailer Refrigeration Unit Market Study and 22
Technology Assessment, Agreement 8485-1, June 24, 2005. Prepared for New 23 York State Energy Research and Development Authority. Shurepower, LLC, 24 Rome New York. 25
26 SNL, 2006a: Energy and Water Research Directions - A Vision for a Reliable Energy 27
Future, Sandia National Laboratory. 28 29 SNL, 2006b: Energy and Water Research Directions – A Vision for a Reliable Energy 30
Future. 31 32 Stress Subsea, Inc., 2005: Deep Water Response to Undersea Pipeline Emergencies. 33
Final Report, Document No. 221006-PL-TR-0001, Houston, TX. 34 35 Struck, D., 2006: Canada pays environmentally for U.S. oil thirst: Huge mines rapidly 36
draining rivers, cutting into forests, boosting emissions, Washington Post, May 37 31, 2006, p. A01. 38
39 Subcommittee on Conservation, Credit, Rural Development, and Research, Of The 40
Committee on Agriculture, House of Representatives. 2001: Energy Issues 41 Affecting the Agricultural Sector of the U.S. Economy. One Hundred Seventh 42 Congress, First Session, April 25 and May 2, 2001. Serial No. 107–6. Printed for 43 the Use of the Committee on Agriculture. Superintendent of Documents, U.S. 44 Government Printing Office, Washington, D.C. 45
46

Synthesis and Assessment Product 4.5 Public Comments Draft – November 2006
124
Sweeney, J.L., 2002: The California Electricity Crisis. Pub. No. 503, Hoover Institution 1 Press, Stanford, California. 2
3 Union of Concerned Scientists, 1999: Confronting Climate Change in California, with 4
the Ecological Society of America, November 1999. 5 6 University of Georgia College of Agricultural and Environmental Sciences, Cooperative 7
Extension Service, Agricultural Experiment Station and Fort Valley State 8 University College of Agriculture, Home Economics and Allied Programs, 9 Cooperative Extension Program, Agricultural Research Station (University of 10 Georgia and Fort Valley State University), 2005: Georgia Annual Report of 11 Accomplishments FY 2004. March 31, 2005. Agricultural Research and 12 Cooperative Extension Programs, University of Georgia & Fort Valley State 13 University, 209 Conner Hall, Athens, 100 pp. 14
15 University of Missouri-Columbia, 2004: Influence of Missouri River on Power Plants 16
and Commodity Crop Prices, Food and Agriculture Policy Institute. 17 18 USGS, 2000: National Assessment of Coastal Vulnerability to Future Sea-Level Rise, 19
USGS Fact Sheet FS-076-00, U.S. Geological Survey, Washington, DC. 20 21 USGS, 2004: Estimated Use of Water in the United States in 2000, USGS Circular 22
1268, U.S. Geological Survey. 23 24 U.S. Climate Change Technology Program (CCTP), 2005: 2005 Strategic Plan: Draft 25
for Public Comment, September 2005. 26 27 Van Vuuren, D. P., B. de Vries, B. Eickhout, and T. Kram, 2004: Responses to 28
technology and taxes in a simulated world, Energy Economics, 26, 579– 601. 29 30 Van Vuuren,D. P., J. Weyant and F. de la Chesnaye, 2006. Multi-gas scenarios to 31
stabilize radiative forcing, Energy Economics, 28, 102–120 32 33 Vicuña, S., R. Leonardson, and J.A. Dracup, 2006: Climate Change Impacts On High-34
Elevation Hydropower Generation In California’s Sierra Nevada: A Case Study 35 In The Upper American River, CEC-500-2005-199-SF, California Energy 36 Commission, Sarcramento, California. 37
38 Vicuña, S., R. Leonardson, J. A. Dracup, M. Hanemann, and L. Dale, 2006: Climate 39
Change Impacts on High Elevation Hydropower Generation in California's 40 Sierra Nevada: A Case Study in the Upper American River, Final white paper 41 from California Climate Change Center, publication # CEC-500-2005-199-SD. 42 Accessed 25 October 2006 at: 43 http://www.climatechange.ca.gov/climate_action_team/reports/index.html 44 45
Synthesis and Assessment Product 4.5 Public Comments Draft – November 2006
125
Warren, H. E. and S.K. LeDuc, 1981: Impact of climate on energy sector in economic 1 analysis, Journal of Applied Meteorology, 20, 1431–1439. 2
3 Wilbanks, T. J., 2005: Issues in developing a capacity for integrated analysis of 4
mitigation and adaptation, Environmental Science & Policy, 8, 541–547. 5 6
Wilbanks, T., et al., 2006: Toward an integrated analysis of mitigation and adaptation: 7 Some preliminary findings. In: [T.Wilbanks, J. Sathaye, and R. Klein, (eds.)], 8 “Challenges in Integrating Mitigation and Adaptation as Responses to Climate 9 Change,” special issue, Mitigation and Adaptation Strategies for Global Change, 10 forthcoming 2006. 11
12 Winkelmann, FC, BE Birdsall, WF Buhl, KLEllington, AE Erdem, JJ Hirsch, and S. 13
Gates 1993: DOE-2 Supplement Version 2.1E, LBL-34947, Lawrence Berkeley 14 National Laboratory, Berkeley CA. 15
16 WWF, 2003: Power switch: impacts of climate policy on the global power sector, WWF 17
International. 18 19 Yan, Y. Y., 1998: Climate and residential electricity consumption in Hong Kong, 20
Energy, 23(1), 17–20. 21

Synthesis and Assessment Product 4.5 Public Comments Draft – November 2006
126
1 ORGANIZATIONS AND INDIVIDUALS CONSULTED2

Synthesis and Assessment Product 4.5 Public Comments Draft – November 2006
127
1 GLOSSARY 2
3

Synthesis and Assessment Product 4.5 Public Comments Draft – November 2006
128
LIST OF ACRONYMS 1 2 3
4
5