Embed Size (px)
Citation preview
ILO
Amer
icas
TE
CH
NIC
AL
RE
PO
RTS
201
7 / 6
Efec
tos
de C
hina
en
la c
antid
ad y
cal
idad
del
em
pleo
en
Amér
ica
Latin
a y
el C
arib
e
Effects of China on the quantity and quality of jobs in Latin America and the Caribbean
Enrique Dussel Peters Ariel C. Armony
ILO AmericasTECHNICALR E P O R T S
2 0 1 7 / 6
Regional Of�ce for Latin America and the Caribbean
ILO AmericasTECHNICALR E P O R T S
2 0 1 7 / 6
Effects of China on the quantity and quality of jobs in Latin America and the Caribbean Enrique Dussel Peters Ariel C. Armony
Regional Office for Latin America and the Caribbean
Copyright © International Labour Organization 2017 First published (2017)
Publications of the International Labour Office enjoy copyright under Protocol 2 of the Universal Copyright Convention. Nevertheless, short excerpts from them may be reproduced without authori-zation, on condition that the source is indicated. For rights of reproduction or translation, application should be made to ILO Publications (Rights and Licensing), International Labour Office, CH-1211 Geneva 22, Switzerland, or by email: [email protected]. The International Labour Office welcomes such applications.
Libraries, institutions and other users registered with a reproduction rights organization may make copies in accordance with the licences issued to them for this purpose. Visit www.ifrro.org to find the reproduction rights organization in your country.
Dussel Peters, Enrique & Armony, Ariel C.
Effects of China on the quantity and quality of jobs in Latin America and the Caribbean. Lima: ILO Regional Offi ce for Latin America and the Caribbean, 2017. 101 p. (ILO Technical Reports, 2017/6).
Employment, infrastructure, economy, trade, China, Latin America, Caribbean.
ISBN: 978-92-2-129906-6 (print) ISBN: 978-92-2-129907-3 (web pdf)
Also available in (Spanish): Efectos de China en la cantidad y calidad del empleo en América Latina y el Caribe (ISBN: 978-92-2-330876-6 (print); ISBN: 978-92-2-330885-8 (web pdf)), Lima, 2017.
ILO Cataloguing in Publication Data
The designations employed in ILO publications, which are in conformity with United Nations practice, and the presentation of material therein do not imply the expression of any opinion whatsoever on the part of the International Labour Office concerning the legal status of any country, area or territory or of its authorities, or concerning the delimitation of its frontiers.
The responsibility for opinions expressed in signed articles, studies and other contributions rests solely with their authors, and publication does not constitute an endorsement by the International Labour Office of the opinions expressed in them.
Reference to names of firms and commercial products and processes does not imply their endorsement by the International Labour Office, and any failure to mention a particular firm, commercial product or process is not a sign of disapproval.
ILO publications and digital products can be obtained through major booksellers and digital distri-bution platforms, or ordered directly from [email protected]. For more information, visit our website: www.ilo.org/publns or contact [email protected].
Printed in Peru
Effects of China on the quantity and quality of jobs in Latin America and the Caribbean
3
Table of contents
Preface 5
Introduction 9
1. The LAC-China economic relationship to date. Towards an interpretation of the recent period: Recent trends 11
2. Progress in understanding the effects of China on the quantity and quality of employment in LAC. Literature review and aggregate and disaggregate estimates 21
2.1 Literature review on the effects of China on the quantity and quality of employment in LAC 21
2.2 The net impact of the trade with China on LAC employment (1995–2011) 26
2.3 The impact of China’s OFDI on LAC employment (2003–2016) 31
2.4 The impact of Chinese infrastructure projects on employment in LAC (2005–2016) 37
3. Characteristics of the employment created by OFDI from China and infrastructure in LAC to 2016. Methodological aspects 42
4. Conclusions and proposals 46
References 50
Annex 59
Document prepared by Enrique Dussel Peters and Ariel C. Armony for the Interna-tional Labour Organization's (ILO) Regional Office for Latin America and the Caribbean for the 40170440/0 project. We, the authors, are very grateful to Xiao Yu, Lesbia Pérez Santillán, Laura Montero, Luis Humberto Saucedo Salgado, Manuel Contreras García, Daniel Hernández, Daniel Olmedo and Xiaoyu Song. We also thank the different comments provided by the ILO, mainly by José Manuel Salazar-Xirinachs and Fabio Bertranou. The authors alone are responsible for the views of this document, which are not necessarily endorsed by the ILO.
Enrique Dussel Peters Professor at the Graduate School of Economics in the National Autonomous University of Mexico (UNAM), Coordinator of the Chinese–Mexican Studies Center (Cechimex) at the School of Economics at UNAM and Coordinator of the Latin American and Caribbean Academic Network on China, dusselpeters.com
Ariel C. Armony Professor at the University of Pittsburgh, senior director of interna-tional programs and director of the University Center for International Studies, www.ucis.pitt.edu/main/.
Effects of China on the quantity and quality of jobs in Latin America and the Caribbean
5
Preface
China is the world’s leading emerging economy. The conversation regarding the tectonic changes brought about by globalization is also a conversation about the rebalancing of the global economy towards Asia. This rebalancing is mainly due to the growth and dynamism of the Chinese economy and the increasing geopolitical presence of China.
Growth during the golden decade of Latin America in 2003–2013 was mainly due to the cycle of commodities led and significantly defined by Chinese demand, to such an extent that it was usually referred to as the “China effect”. While growth in China is now slower and the “China effect” is no longer as strong as it was during that decade in terms of trade, this effect is still observed not only in imports to and exports from China, but also in Chinese direct foreign investment flows in the region, infrastructure projects and financial flows.
Public and private Chinese companies are not only buying raw materials in the region, but also investing in mining, agriculture, industries and services, including financial and banking services. These companies are participating in bidding processes for large projects and building numerous and significant infrastructure works. In some countries, they have bought significant amounts of sovereign debt, which is for many the main funding source for development and different types of investment.
The changing dynamics of LAC-China relationships and the expectation that they will become increasingly intense and complex is one of the main reasons for the need for governments, the private sector, union leaders, and many social stakeholders to have a better understanding of the economic relations with China, the triggering factors behind the dynamism of the relationship, and its effects. A better understanding of Chinese goals and policies for the region, relationships and stakeholders is also impor-tant for negotiating better economic and social conditions in the economic relations between LAC countries and Chinese companies along the multiple value chains that are being developed and becoming more complex.
ILO AmericasTECHNICAL REPORTS 2017 /6
Effects of China on the quantity and quality of jobs in Latin America and the Caribbean
6
After reviewing the existing literature on these topics from the ILO Regional Office,1 we reached the conclusion that there is relatively extensive research and literature on LAC-China relationships in trade, investment, funding and cultural spheres. However, there is almost no systematic information or knowledge on employment and labour aspects related to China’s trade, direct investments and infrastructure projects in many countries of the region. This is an incipient subject, with a large knowledge gap. This first report on this issue is aimed at filling that gap.
With this objective, we approached two renowned specialists in China–LAC rela-tions: Mr. Ariel Armony and Mr. Enrique Dussel-Peters. Mr. Armony is Professor at the University of Pittsburgh, Director of International Programs and Director of the University Center for International Studies, and has published extensively on China and its relations with LAC. Mr. Dussel-Peters is Professor at the Graduate School of Economics in the National Autonomous University of Mexico (UNAM) and Coordinator of the Center for Chinese–Mexican Studies at the School of Economics at UNAM and Coordinator of the Latin American and Caribbean Academic Network on China, and a prolific writer on this topic.
This report is a first attempt to address the subject. After reviewing the evolution of the economic relations between China and Latin America in trade, direct foreign investment and infrastructure projects, the following sections present an overview, as far as the limited information allows, of the quantitative and qualitative effects of China on employment in LAC through trade, direct foreign investment and infrastructure projects. The final section draws conclusions not only on the findings of this effort, but also on methodological options for more in-depth research on the quantitative and qualitative aspects of employment in the LAC-China relationship.
Our intention is to develop more extensive research on these topics in a second stage based on the identification of options and sources included in this first report.
The reader will realize that despite the major difficulties in terms of information, this report offers a first overview with new data and findings on both quantitative and qual-itative impacts of the LAC-China relationship on employment.
1 For instance, ECLAC (2016) Relaciones económicas entre América Latina y el Caribe y China. Oportunidades y desafíos; BID-Intal (2016) Made in Chi-lat: Claves para renovar la convergencia entre Latinoamérica y China, Revista Integración y Comercio, No 40; OECD-ECLAC-CAF (2015) Perspectivas Económicas de América Latina 2016: Hacia una nueva alianza con China; and the numerous publications of Red ALC-China, such as E. Dussel-Peters (2016) (coord) La nueva relación comercial de América Latina y el Caribe con China, Unión de Universidades de ALC, México, D.F.
Effects of China on the quantity and quality of jobs in Latin America and the Caribbean
7
We hope that the general overview and pioneering data provided in this study on the social and labour dimension of the LAC-China relationship will be useful for the ILO tripartite constituents, as well as for the general public, to put into perspective the realities of a relationship with a country that is the main social and trading partner or primary source of direct foreign investment or funding for many countries of the region.
It should also be noted that the development of good and mutually beneficial trade, investment and cooperation relations between Latin America and the Caribbean and China requires a proper understanding of the opportunities and challenges in the economic and labour spheres.
José Manuel Salazar-Xirinachs
ILO Regional Director for Latin America and the Caribbean
May 2017

Effects of China on the quantity and quality of jobs in Latin America and the Caribbean
9
Introduction
The relationship between Latin America and the Caribbean (LAC) and the People's Republic of China – hereinafter China – has become very dynamic in the past two decades. While this relationship started centuries ago, and saw significant political and diplomatic interaction in the second half of the twentieth century, it achieved qualita-tive levels in the cultural, political and economic spheres mainly as of the 1990s. The growing presence of China in LAC after all this time – also known as re-emergence – is significant in both the bilateral and multilateral spheres. For instance, the Forum of China and CELAC (Community of Latin American and Caribbean States) since 2015 and the Asia-Pacific Economic Cooperation (APEC) show the interest in managing a specific agenda between both parties.
There is a growing number of analyses on this bilateral relation, including several studies in the economic sphere. Thus, it can be noted that different efforts have been made in China and LAC by the academic sector, and also business and public bodies, to better understand this new bilateral dynamics, emphasizing commercial aspects and, more recently, overseas foreign direct investments (OFDI) to LAC.
In this context, this document is aimed at contributing to the knowledge on the quan-tity and quality of jobs created by China in LAC. These effects will be examined from an aggregate perspective for a group of LAC countries, classifying the jobs created by China through trade, OFDI and infrastructure projects. The document also seeks to enrich knowledge on the LAC-China relationship and enable a targeted dialogue between LAC and China institutions on labour issues. In this regard, it should be noted that there is no previous systematic research in LAC, China or elsewhere on this subject. It will also present an analysis methodology to carry out case studies at the country and company level, as well as an original database at the company level with records of China’s OFDI transactions and infrastructure projects in LAC during 2000–16.2
Within this framework, the document is divided into four sections. The first section presents a proposal for interpreting the LAC-China socio-economic relationship in the most recent period, paying attention to its growing complexity. The second section
2 This is a significant subject: currently, and in the light of the growing presence of China worldwide, it is not only the LAC-China relationship that matters, but also China’s relationship with Africa and other Asian countries, among others.
ILO AmericasTECHNICAL REPORTS 2017 /6
Effects of China on the quantity and quality of jobs in Latin America and the Caribbean
10
focuses on the quantitative and qualitative effects of China on LAC in the period 1995–2016. The section starts with a review of the existing literature in China, LAC and other countries, and addresses job creation through trade, OFDI and infrastructure projects. The third section presents a set of methodological aspects for analysing the quality of Chinese employment in LAC, based on efforts made by the International Labour Organization (ILO) itself and other institutions and authors. Finally, the document presents a set of conclusions and proposals on the main topics analysed in this report.
Effects of China on the quantity and quality of jobs in Latin America and the Caribbean
11
1. The LAC-China economic relationship to date. Towards an interpretation of the recent period: Recent trends
Together with a literature review on the current state of the Chinese presence in LAC, the document proposes an interpretation of the LAC-China relationship in the 1990s. The LAC-China relationship has subsequently become increasingly complex and cannot, therefore, be assessed following the same criteria as in the early 1990s or earlier.
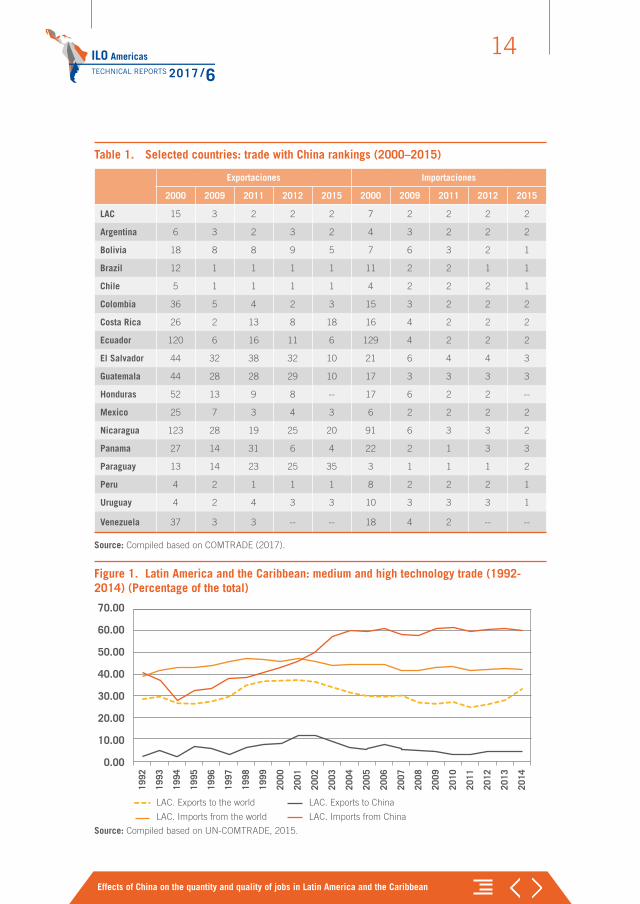
From a current perspective, a set of different phases is observed that do not follow a mechanical or basic sequence of stages. These have evolved simultaneously (that is, they are not mutually exclusive), generating different opportunities and challenges. From this perspective, the relatively recent and very dynamic LAC-China relationship requires analysis, thoughts and proposals that reflect a growing complexity. In line with this explanation, at least three phases are proposed, with a group of characteris-tics that will be analysed as follows: (i) since the 1990s, the relationship has intensified in commercial terms. Currently China is the region’s second largest trading partner, although with significant differences among the countries of the region (see Table 1);3 (ii) since 2007-2008, during the international crises of those years, large amounts of Chinese funds and OFDI streams were sent to LAC, making it a very important source of funding and OFDI, for many years even the main source (see Table 2); and (iii) since 2013, significant infrastructure projects have been implemented in LAC.4
3 This is a relevant topic for the region as a whole, even for the countries that do not have a diplomatic relation-ship with the People's Republic of China. In the last decade, China has become one of the five main trading partners, also in Central America (Arce Alvarado, 2016) and in the Caribbean (Díaz, 2016). This pragmatism has mainly depended on the normalcy of Taiwan-China relations, although it could change significantly in the light of potential bilateral tensions.
4 It should be noted that each of these phases or stages has their corresponding specificities and challenges, which will be further examined. It is not for this document to infer that such evolution is necessarily negative or positive for either party. For the case of China, for instance Ansar et al. (2016 analyse, conceptually and empirically, how infrastructure projects do not necessarily generate economic growth and positive effects for the country offering said projects (China, in this case), but may even cause an economic weakness in the light of different productive and financial inefficiencies.
ILO AmericasTECHNICAL REPORTS 2017 /6
Effects of China on the quantity and quality of jobs in Latin America and the Caribbean
12
This interpretation enables an understanding of – and makes it possible to distin-guish – the growing complexity of this bilateral relationship and the need to generate differentiated instruments to analyse and assess the different phases and the current situation. This interpretation also makes it possible to give a structure to the current bilateral relationship – taking into account important differences between LAC subre-gions and countries – and to distinguish between trade, funding, OFDI and infrastruc-ture projects.
This document presents an analysis to differentiate these stages and contribute to the knowledge base on the growing complexity of the LAC-China relationship.
While until 1992 China accounted for less than 1 per cent of LAC trade, in 2001, it had risen to 2.3 per cent and in 2014 to 12.84 per cent, ahead of the European Union as a whole and below only the United States, whose share in LAC trade fell from 50.87 per cent in 2001 to 37.74 per cent in 2014 (see Table 1; Bittencourt et al., 2012; ECLAC, 2016; Dussel Peters, 2016).5 Moreover, LAC has also become a major trade partner for China: LAC is China’s fourth most important trade partner, behind the United States, the European Union and Asia; and at the country level, behind the United States, Japan and South Korea.6 However there is a strong trade deficit for LAC: since 2012, the balance of trade has been above 75 billion dollars and increased over fifteenfold in 2000–2014. This means that whereas LAC exports increased twen-ty-twofold, imports from China have increased eighteen fold and, with the current trade structure, the trade deficit seems set to continue increasing.
Figure 1, on the other hand, shows the challenges posed by the trade between LAC and China. By measuring the percentage of medium- and high-technology trade against their corresponding imports and exports, a huge and growing technology gap is observed in LAC-China imports and exports: since 2006, medium- and high-tech-nology imports from China accounted for more than 60 per cent of the total, while exports to China fell from levels below 10 per cent in 2001–2002 to less than 5 per cent since 2009, which is a significant gap in absolute terms and one that has grown
5 For an analysis on strategies, structural changes and results in the last decades in China, see WB/DRC (2012).
6 For an analysis from a Chinese perspective, see Wu (2010) and Yang (2012), as well as the work of Chinese institutions, such as the Institute of Latin American Studies (ILAS) of the Chinese Academy of Social Sciences, and the China Institute of Contemporary International Relations (CICIR), among others. The ILAS has for many years published a Yellow Book on LAC–China relations. In LAC, the Latin American and Caribbean Academic Network on China (Red ALC–China) and the Chinese–Mexican Studies Center (CECHIMEX) of the School of Economics at the National Autonomous University of Mexico (UNAM) have carried out an outstanding job in the systematic analysis of China in LAC (Ortiz Velásquez, 2016).
Effects of China on the quantity and quality of jobs in Latin America and the Caribbean
13
over the past five years.7 These trends stand in contrast to the trade between LAC and the rest of the world, given that the technological level of imports has declined dramatically, as has the technological level of LAC exports, though to a lesser extent. As a result, the technological gap with the rest of the world has narrowed (see Figure 1). In other words, LAC exports to China, unlike imports, are mainly characterized by a minimum content of added value and medium and high technological level (OECD, CAF and ECLAC, 2015).8
There is also a growing debate on the fact that LAC has been superseded by China, both in its domestic and third markets (Dussel Peters, 2016; Gallagher and Porze-canski, 2008), which comes also with the discussion on China’s net effects – in terms of production, trade, employment and other variables. While LAC exports to China may have positive effects, imports coming from China may have negative effects. This subject has not yet been deeply analysed and will be explicitly addressed in the next section.9
7 This structure shows that LAC mainly exports minerals, soy, oil, gas and other raw materials – that is, a reduced group of products – and imports mainly technologically complex products (Barbosa and Guimaraes, 2010; ECLAC, 2010/a; Dussel Peters, 2016; IADB, 2016; Jenkins, 2011; Roldán Pérez et al., 2016).
8 On the other hand, rich and growing literature is available on China’s growing productive and commercial technological upgrading process (WB/DRC, 2012; OECD, CAF and ECLAC, 2015; Rodrick, 2006). In some cases, such as Argentinian soy exports to China, a real downgrading process is observed (López, Ramos and Starobinsky, 2010), with significant impacts on the ecological footprint of the corresponding LAC regions and countries (Trápaga Delfín, 2015).
9 ECLAC (2016) also emphasizes that, since 2013, trade between LAC and China has decreased, mainly due to the diminishing raw materials and corresponding exports from LAC (by 23 per cent during 2013–2015).
ILO AmericasTECHNICAL REPORTS 2017 /6
Effects of China on the quantity and quality of jobs in Latin America and the Caribbean
14
Table 1. Selected countries: trade with China rankings (2000–2015)
Exportaciones Importaciones
2000 2009 2011 2012 2015 2000 2009 2011 2012 2015
LAC 15 3 2 2 2 7 2 2 2 2
Argentina 6 3 2 3 2 4 3 2 2 2
Bolivia 18 8 8 9 5 7 6 3 2 1
Brazil 12 1 1 1 1 11 2 2 1 1
Chile 5 1 1 1 1 4 2 2 2 1
Colombia 36 5 4 2 3 15 3 2 2 2
Costa Rica 26 2 13 8 18 16 4 2 2 2
Ecuador 120 6 16 11 6 129 4 2 2 2
El Salvador 44 32 38 32 10 21 6 4 4 3
Guatemala 44 28 28 29 10 17 3 3 3 3
Honduras 52 13 9 8 -- 17 6 2 2 --
Mexico 25 7 3 4 3 6 2 2 2 2
Nicaragua 123 28 19 25 20 91 6 3 3 2
Panama 27 14 31 6 4 22 2 1 3 3
Paraguay 13 14 23 25 35 3 1 1 1 2
Peru 4 2 1 1 1 8 2 2 2 1
Uruguay 4 2 4 3 3 10 3 3 3 1
Venezuela 37 3 3 -- -- 18 4 2 -- --
Source: Compiled based on COMTRADE (2017).
Figure 1. Latin America and the Caribbean: medium and high technology trade (1992-2014) (Percentage of the total)
70.00
60.00
50.00
40.00
30.00
20.00
10.00
0.00
1992
1993
1994
1995
1996
1997
1998
1999
2000
2001
2002
2003
2004
2005
2006
2007
2008
2009
2010
2011
2012
2013
2014
LAC. Exports to the world LAC. Exports to China
LAC. Imports from the world LAC. Imports from China
Source: Compiled based on UN-COMTRADE, 2015.
Effects of China on the quantity and quality of jobs in Latin America and the Caribbean
15
In the second phase, as from 2007–2008, China has become a growing source of funding and OFDI. There are many works regarding funding, mainly those developed by Kevin Gallagher (Gallagher et al., 2013; Kong and Gallagher, 2016), that have, for more than five years, pointed out the growing presence of public Chinese banks in LAC (Hernández Cordero, 2016). This presence is also highly concentrated in a group of countries: more than 50 per cent of Chinese loans in the region are to the Bolivarian Republic of Venezuela, although Brazil, Argentina, Ecuador and the Pluri-national State of Bolivia have also received significant loans. More than two-thirds of these have been granted for infrastructure and energy projects, and mining projects have received more than 25 per cent.
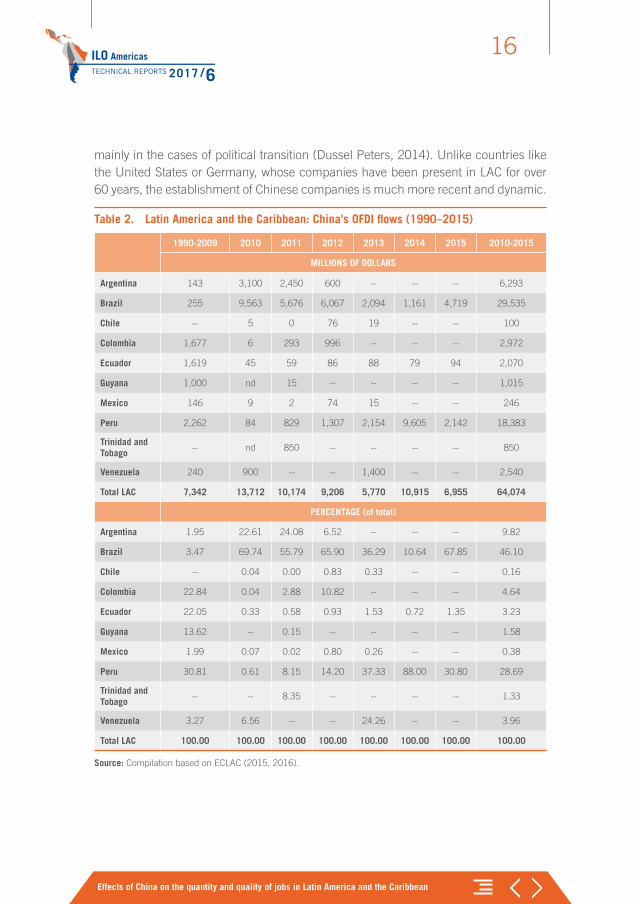
China's OFDI flows to LAC can be also included in this second phase, starting in 2007–2008. While there are significant statistical differences in the measurement of OFDI flows, with divergences of up to a factor of ten (Dussel Peters and Ortiz Velásquez, 2016; MOFCOM, 2016a), institutions such as ECLAC (2013), estimate that China's OFDI flows to LAC amount to approximately 10 billion dollars annually. Brazil, Peru and Argentina are the main recipients, although Venezuela, Colombia and Ecuador have also received growing proportions (see Table 2).10 In this context, there is a set of substantial outcomes and debates. On the one hand, China’s OFDI in LAC seems to reinforce the specialization pattern created by bilateral trade. In other words, China has focused its OFDI mainly on mining, oil, gas and other raw materials (Chen and Pérez Ludeña, 2013; IADB, 2016). Furthermore, OFDI ownership has been a significant aspect (Dussel Peters, 2013; Lin, 2013): while public OFDI (understood as ownership by Chinese towns, cities, provinces and the central government) has so far prevailed, private companies are expected to significantly increase their presence in China’s OFDI in LAC in the future.
Finally, Chinese companies have gone through a costly and time-consuming learning process with customers, suppliers, workers and the corresponding LAC laws, as well as with the corresponding federal governments, provinces, cities and city councils,
10 Several statistical descriptions were identified in the literature review carried out on studies about China’s OFDI in LAC, mainly by the Institute of Latin American Studies of the CASS (Chinese Academy of Social Sciences). The analysis carried out by Wang and Huang is specially relevant for future analysis owing to its in-depth and detailed knowledge on China’s OFDI, the use of different information sources and their knowledge of case studies. The results are also interesting, although they do not refer to LAC: China’s OFDI is based in countries where it can acquire new technologies or get raw materials (Huang and Wang 2013, 2011) and OFDI owner-ship – where public ownership currently prevails – is expected to diversify (Wang y Huang 2011). The analysis carried out by Li, Qin and Feng (2015) is also significant because it shows that the increase of China’s OFDI is highly related to net Chinese exports to the corresponding host country and an industrial upgrading process of the corresponding Chinese companies. The CAITEC (Chinese Academy of International Trade and Economic Cooperation), as part of the Ministry of Commerce, and the Development Research Center (DRC) of the Council of State has also different analyses on China’s OFDI, although no reference is made to the LAC case.
ILO AmericasTECHNICAL REPORTS 2017 /6
Effects of China on the quantity and quality of jobs in Latin America and the Caribbean
16
mainly in the cases of political transition (Dussel Peters, 2014). Unlike countries like the United States or Germany, whose companies have been present in LAC for over 60 years, the establishment of Chinese companies is much more recent and dynamic.
Table 2. Latin America and the Caribbean: China's OFDI flows (1990–2015)
1990-2009 2010 2011 2012 2013 2014 2015 2010-2015
MILLIONS OF DOLLARS
Argentina 143 3,100 2,450 600 -- -- -- 6,293
Brazil 255 9,563 5,676 6,067 2,094 1,161 4,719 29,535
Chile -- 5 0 76 19 -- -- 100
Colombia 1,677 6 293 996 -- -- -- 2,972
Ecuador 1,619 45 59 86 88 79 94 2,070
Guyana 1,000 nd 15 -- -- -- -- 1,015
Mexico 146 9 2 74 15 -- -- 246
Peru 2,262 84 829 1,307 2,154 9,605 2,142 18,383
Trinidad and Tobago
-- nd 850 -- -- -- -- 850
Venezuela 240 900 -- -- 1,400 -- -- 2,540
Total LAC 7,342 13,712 10,174 9,206 5,770 10,915 6,955 64,074
PERCENTAGE (of total)
Argentina 1.95 22.61 24.08 6.52 -- -- -- 9.82
Brazil 3.47 69.74 55.79 65.90 36.29 10.64 67.85 46.10
Chile -- 0.04 0.00 0.83 0.33 -- -- 0.16
Colombia 22.84 0.04 2.88 10.82 -- -- -- 4.64
Ecuador 22.05 0.33 0.58 0.93 1.53 0.72 1.35 3.23
Guyana 13.62 -- 0.15 -- -- -- -- 1.58
Mexico 1.99 0.07 0.02 0.80 0.26 -- -- 0.38
Peru 30.81 0.61 8.15 14.20 37.33 88.00 30.80 28.69
Trinidad and Tobago
-- -- 8.35 -- -- -- -- 1.33
Venezuela 3.27 6.56 -- -- 24.26 -- -- 3.96
Total LAC 100.00 100.00 100.00 100.00 100.00 100.00 100.00 100.00
Source: Compilation based on ECLAC (2015, 2016).
Effects of China on the quantity and quality of jobs in Latin America and the Caribbean
17
A third phase can be established for the LAC-China relationship since 2013, based on the growing presence of Chinese infrastructure projects in LAC.11 The Chinese economy has significant funding potential due to high savings rates, as well as signif-icant technological capacities and expertise of Chinese companies in China and the rest of the world (WB/DRC 2012). It is also important to acknowledge that in the light of the “pervasiveness of the public sector” in China (Dussel Peters, 2015), it has great institutional strengths to offer infrastructure “packages” or turnkey projects, that is, with the capacity of integrating aspects related to design, supply, manufacture, funding, technologies, after-sales services, and even workforce into the infrastructure projects (Gransow, 2015).12
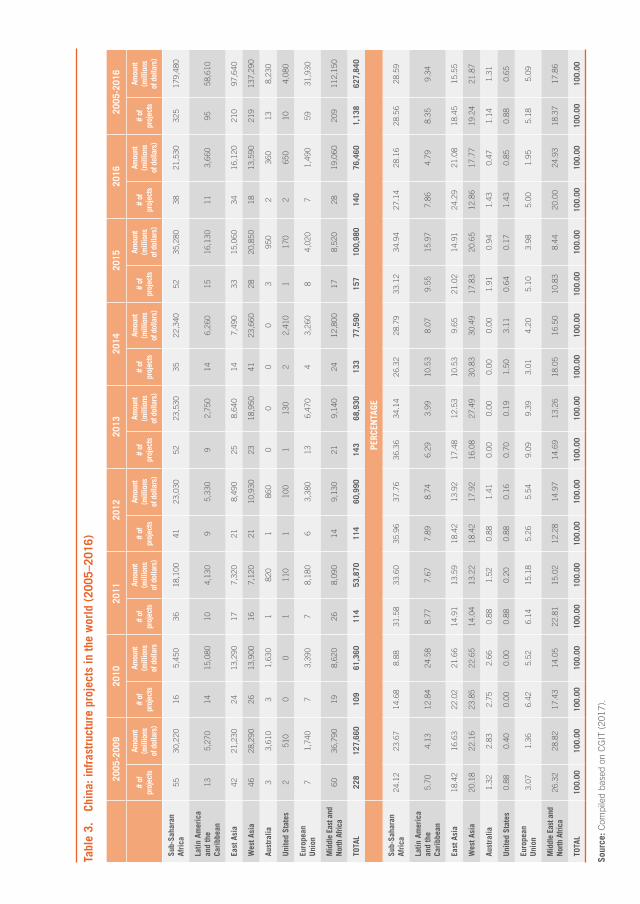
Until mid-2016, China carried out 2,133 infrastructure projects overseas, mainly in the construction of transport (ports, railways and airports) and energy projects (MOFCOM, 2016b).13 Even though it is difficult to have access to information by projects or by country, the CGIT (China Global Investment Tracker) (2012) does provide information for more than 1,100 Chinese infrastructure projects in the world during 2005–2016.14 Taking the CGIT information without modifications – an issue that will be relevant for the next sections – the main results include:
1. On the one hand, Table 3 shows the extraordinary total amount of Chinese infrastructure projects in the world, around 630 billion dollars during 2005–2016. East and West Asia accounted for 37.70 per cent of more than 1,100 projects and 37.42 per cent of the amount of infra-structure projects in the world during 2005–2016. On the other hand,
11 There is a growing gap in the infrastructure projects in LAC, i.e. significant differences between regional needs and demands. According to different estimates, LAC should invest around five per cent of the GDP in infrastruc-ture or at least increase it by three per cent of the GDP (CAF, 2015).
12 An extensive literature review was carried out, mainly in LAC and China. It is interesting to highlight that while the subject of infrastructure projects has become more dynamic in the academic environment – for instance, in journals and publications of the Chinese Academy of Social Sciences (CASS), mainly the Institute of Latin Amer-ican Studies, and in Chinese journals, such as the Journal of Latin American Studies, Journal of International Economic Cooperation, Finance Economy, Journal of Land Economics, Globalization and Northeast Asia Forum –, infrastructure projects in general are usually analysed in a general and abstract manner as a more recent way of cooperation (Cao, 2015; Lu Pan, 2015; Xie, 2016) and with greater emphasis on the infrastructure projects that China carries out in Asia (Li and Li, 2016; Wang, 2015). In very few cases has there been a description of and reflection on the Chinese infrastructure projects in LAC (He and Jiang, 2016; Li et al., 2014; Zhang, 2015).
13 From the beginning of the “One Belt, One Road” strategy (Long 2015), China has invested 51.1 billion dollars – around 12 per cent of China’s OFDI – and 12,500 projects have been signed for a value of 279 billion dollars, in addition to the 52 economic and trade areas established by Chinese companies (MOFCOM, 2016b).
14 Information obtained from the CGIT (2016) should be considered preliminary and requires further review for each individual country (see the following paragraphs). It includes both implemented and completed projects, as well as those that were only agreed upon or that are under construction. However, and taking into account the limitations, this is so far the only information source roughly structured on the subject.
ILO AmericasTECHNICAL REPORTS 2017 /6
Effects of China on the quantity and quality of jobs in Latin America and the Caribbean
18
LAC had a share of 8.35 per cent and 9.34 per cent, respectively. The subject will be addressed in detail in the next chapter.
2. Table 3 also shows the recent increase of these infrastructure projects, in line with the Chinese strategic proposal – with the motto “One Belt, One Road” and the new “Maritime silk road” – since 2013: both the number of projects and their corresponding amounts have been steadily increasing ever since.
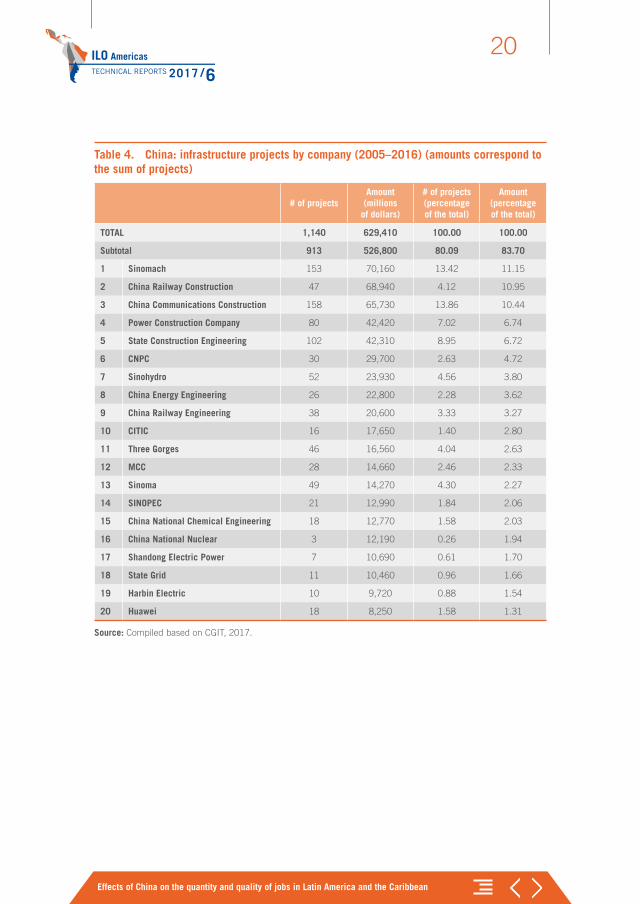
3. The same source and other recent studies (Dussel Peters and Ortiz Velásquez, 2017) also highlight the high level of concentration of a rela-tively small group of Chinese multinational enterprises with a signifi-cant share in the “One Belt, One Road” strategy at the global level: 20 companies, all of them public companies (with Sinomach and China Railway Construction being two of the most significant) have benefited from these infrastructure projects, with a share mainly in the energy and transportation sectors. Table 4 reflects that the main 20 companies have carried out 80.09 per cent of projects that accounted for 83.70 per cent of the value of projects considered. The main 5 companies in table 4 accounted for 46 per cent of the amount of Chinese infrastruc-ture projects during 2005–2016.
These aspects will be further reviewed in the next section related to employment. From a Latin American perspective, these projects could meet the existing deficits and demands, though still facing big challenges. Though it varies depending on the projects and specific agreements, local and national integration to infrastructure projects is practically non-existent, even when we take into account the workforce–.15
15 From this perspective, and controversially, it can be said that, in general, the LAC-China relationship seems to reproduce the typical “centre–periphery” patterns suggested by Raúl Prebisch in the mid-twentieth century: trade, funding, OFDI and infrastructure projects apparently increase the level of dependency of LAC on China.
Tabl
e 3.
Ch
ina:
infr
astr
uctu
re p
roje
cts
in th
e w
orld
(20
05–2
016)
2005
-200
920
1020
1120
1220
1320
1420
1520
1620
05-2
016
# of
pr
ojec
ts
Amou
nt
(mill
ions
of
dol
lars
)
# of
pr
ojec
ts
Amou
nt
(mill
ions
of
dol
lars
# of
pr
ojec
ts
Amou
nt
(mill
ions
of
dol
lars
)
# of
pr
ojec
ts
Amou
nt
(mill
ions
of
dol
lars
)
# of
pr
ojec
ts
Amou
nt
(mill
ions
of
dol
lars
)
# of
pr
ojec
ts
Amou
nt
(mill
ions
of
dol
lars
)
# of
pr
ojec
ts
Amou
nt
(mill
ions
of
dol
lars
)
# of
pr
ojec
ts
Amou
nt
(mill
ions
of
dol
lars
)
# of
pr
ojec
ts
Amou
nt
(mill
ions
of
dol
lars
)
Sub-
Saha
ran
Afri
ca55
30,2
2016
5,45
036
18,1
0041
23,0
3052
23,5
3035
22,3
4052
35,2
8038
21,5
3032
517
9,48
0
Latin
Am
eric
a an
d th
e Ca
ribb
ean
135,
270
1415
,080
104,
130
95,
330
92,
750
146,
260
1516
,130
113,
660
9558
,610
East
Asi
a42
21,2
3024
13,2
9017
7,32
021
8,49
025
8,64
014
7,49
033
15,0
6034
16,1
2021
097
,640
Wes
t Asi
a46
28,2
9026
13,9
0016
7,12
021
10,9
3023
18,9
5041
23,6
6028
20,8
5018
13,5
9021
913
7,29
0
Aust
ralia
33,
610
31,
630
182
01
860
00
00
395
02
360
138,
230
Uni
ted
Stat
es2
510
00
111
01
100
113
02
2,41
01
170
265
010
4,08
0
Euro
pean
U
nion
71,
740
73,
390
78,
180
63,
380
136,
470
43,
260
84,
020
71,
490
5931
,930
Mid
dle
East
and
No
rth A
frica
6036
,790
198,
620
268,
090
149,
130
219,
140
2412
,800
178,
520
2819
,060
209
112,
150
TOTA
L22
812
7,66
010
961
,360
114
53,8
7011
460
,990
143
68,9
3013
377
,590
157
100,
980
140
76,4
601,
138
627,
840
PERC
ENTA
GE
Sub-
Saha
ran
Afri
ca24
.12
23.6
714
.68
8.88
31.5
833
.60
35.9
637
.76
36.3
634
.14
26.3
228
.79
33.1
234
.94
27.1
428
.16
28.5
628
.59
Latin
Am
eric
a an
d th
e Ca
ribb
ean
5.70
4.13
12.8
424
.58
8.77
7.67
7.89
8.74
6.29
3.99
10.5
38.
079.
5515
.97
7.86
4.79
8.35
9.34
East
Asi
a18
.42
16.6
322
.02
21.6
614
.91
13.5
918
.42
13.9
217
.48
12.5
310
.53
9.65
21.0
214
.91
24.2
921
.08
18.4
515
.55
Wes
t Asi
a20
.18
22.1
623
.85
22.6
514
.04
13.2
218
.42
17.9
216
.08
27.4
930
.83
30.4
917
.83
20.6
512
.86
17.7
719
.24
21.8
7
Aust
ralia
1.32
2.83
2.75
2.66
0.88
1.52
0.88
1.41
0.00
0.00
0.00
0.00
1.91
0.94
1.43
0.47
1.14
1.31
Uni
ted
Stat
es0.
880.
400.
000.
000.
880.
200.
880.
160.
700.
191.
503.
110.
640.
171.
430.
850.
880.
65
Euro
pean
U
nion
3.07
1.36
6.42
5.52
6.14
15.1
85.
265.
549.
099.
393.
014.
205.
103.
985.
001.
955.
185.
09
Mid
dle
East
and
No
rth A
frica
26.3
228
.82
17.4
314
.05
22.8
115
.02
12.2
814
.97
14.6
913
.26
18.0
516
.50
10.8
38.
4420
.00
24.9
318
.37
17.8
6
TOTA
L10
0.00
100.
0010
0.00
100.
0010
0.00
100.
0010
0.00
100.
0010
0.00
100.
0010
0.00
100.
0010
0.00
100.
0010
0.00
100.
0010
0.00
100.
00
Sour
ce: C
ompi
led
base
d on
CG
IT (
2017
).
ILO AmericasTECHNICAL REPORTS 2017 /6
Effects of China on the quantity and quality of jobs in Latin America and the Caribbean
20
Table 4. China: infrastructure projects by company (2005–2016) (amounts correspond to the sum of projects)
# of projectsAmount (millions
of dollars)
# of projects (percentage of the total)
Amount (percentage of the total)
TOTAL 1,140 629,410 100.00 100.00
Subtotal 913 526,800 80.09 83.70
1 Sinomach 153 70,160 13.42 11.15
2 China Railway Construction 47 68,940 4.12 10.95
3 China Communications Construction 158 65,730 13.86 10.44
4 Power Construction Company 80 42,420 7.02 6.74
5 State Construction Engineering 102 42,310 8.95 6.72
6 CNPC 30 29,700 2.63 4.72
7 Sinohydro 52 23,930 4.56 3.80
8 China Energy Engineering 26 22,800 2.28 3.62
9 China Railway Engineering 38 20,600 3.33 3.27
10 CITIC 16 17,650 1.40 2.80
11 Three Gorges 46 16,560 4.04 2.63
12 MCC 28 14,660 2.46 2.33
13 Sinoma 49 14,270 4.30 2.27
14 SINOPEC 21 12,990 1.84 2.06
15 China National Chemical Engineering 18 12,770 1.58 2.03
16 China National Nuclear 3 12,190 0.26 1.94
17 Shandong Electric Power 7 10,690 0.61 1.70
18 State Grid 11 10,460 0.96 1.66
19 Harbin Electric 10 9,720 0.88 1.54
20 Huawei 18 8,250 1.58 1.31
Source: Compiled based on CGIT, 2017.
Effects of China on the quantity and quality of jobs in Latin America and the Caribbean
21
2. Progress in understanding the effects of China on the quantity and quality of employment in LAC. Literature review and aggregate and disaggregate estimates
This section presents an analysis of the impact of China on the quantity and quality of employment in LAC. It is divided into three sections and is in line with the proposal of interpretation of the increasingly complex bilateral LAC-China relationship. The first part proposes a literature review on the topic, both in China and LAC. The second and third sections present original results on the quantity of jobs created by Chinese trade, OFDI and infrastructure projects in LAC.
2.1 Literature review on the effects of China on the quantity and quality of employment in LACResearch on the subject – the effects of China on employment in LAC and its quality – started over five years ago, although in general it has been limited to aspects of trade and, to a lesser extent, to OFDI from China. There are no estimates or literature related to Chinese infrastructure projects in LAC. Among the studies found in China and LAC:
1. Two studies stand out in China on China’s OFDI. The China Council for International Cooperation on Environment and Development (CCICED 2011) analysis points out that Chinese companies in Asia prefer recruiting Chinese nationals for middle and high level posts, but are highly flexible for other positions and it also depends on the host country’s labour regulations that usually impose some limits for recruiting foreign workers (in this case, Chinese workers). The other study, developed by Wang and Zadek (2016, pp. 23–27), includes a literature review on the subject globally and reiterates the CCICED (2011) result in Asian and African countries. Regarding employment quality, results differ significantly, ranging from mining jobs in Zambia
ILO AmericasTECHNICAL REPORTS 2017 /6
Effects of China on the quantity and quality of jobs in Latin America and the Caribbean
22
with deaths of dozens of workers and precarious occupational health and safety conditions to research and development jobs offered by Lenovo in Japan, with high wages, and benefits and conditions compa-rable to the national labour conditions. This reflects a wide diversity and capacity of integration according to the requirements and demands of the countries that are recipients of China’s OFDI However, the analysis prepared by CAITEC, MOFCOM and UNDP (2015) is, to date, the most accurate and thorough existing analysis on China’s OFDI in the world. It was developed based on visits to a group of companies, interviews to nearly 50 multinational companies, dozens of meetings and a ques-tionnaire with more than 60 questions divided into five sections (basic information, corporate governance, economic performance, environ-mental and social impact) and answered by 254 companies.16 The section on “social impact” includes a set of questions related to “social relations” and has six questions (CAITEC, MOFCOM and UNDP, 2015, pp. 123–125) related to the main problems faced by Chinese compa-nies overseas in the labour sphere, the views of the company to build “good labour relations” and questions on the establishment (or not) of equitable employment systems between Chinese citizens and the host country, as well as other questions related to occupational health and safety management systems and production lines.
The document is very rich but, unfortunately, there is no access to the answers of the companies by country or region. However, the report highlights the following: (i) in South America, labour issues are the greatest risk for Chinese companies, followed by the political and regu-latory setting, as well as issues related to safety of workers; (ii) according to Chinese companies, the main challenges in labour relations were cultural differences (mentioned by 79 per cent), the lack of under-standing of local culture and habits (67 per cent), and disputes on compensations and benefits (56 per cent) (CAITEC, MOFCOM and UNDP, 2015, p. 82);17 (iii) Chinese companies have considered very
16 Forty-three out of the 254 companies that answered the questionnaire had activities in South America (CAITEC, MOFCOM and UNDP, 2015, p. 29).
17 This inter-agency effort among CAITEC, UNDP and MOFCOM is expected to be annual or biannual. As shown later in the methodological analysis, the 2017 publication includes important changes in the questionnaire that may be relevant for the future of the project.
Effects of China on the quantity and quality of jobs in Latin America and the Caribbean
23
important or relatively important training local workers (80 per cent)18 and increasing their involvement in middle and high level teams (72 per cent); and (iv) 73 per cent of Chinese companies confirmed having an equitable compensation and benefit system for the Chinese and host country nationals, 70 per cent had equitable systems for newcomers to the company, and 62 per cent had similar systems for training and promotions.19 It should also be noted that 69 per cent of Chinese foreign-based companies have health systems that are comprehensive or relatively comprehensive; 86 per cent have comprehensive or rela-tively comprehensive security systems (50 per cent have never had an accident); 75 per cent have a time-based wage system; 64 per cent offer overtime compensation in compliance with the law and have incentive systems; and 51 per cent offer paid leave.
2. Regarding the analysis of the effects of the trade with China on LAC employment. Castro, Olarreaga and Saslavsky (2007) and Dussel Peters (2009) carry out some of the first studies on the subject, mainly on the effects of the Argentina and Mexico trade with China, respectively, specifically of imports from China. With information until the first decade of the twenty-first century, results show a Chinese imports-manufacturing employment elasticity of 0.07 in Argentina, whereas for the Mexican case, results were not significant. In both cases, disaggregate sectorial information was used until 2005 and 2003 for Argentina and Mexico, respectively. More recently, for the case of Chile (Pellandra, 2017), the China–Chile trading relationship is estimated through supply (exports from China and impact on labour costs) and demand effects (change in the Chinese expense in every good) by regions in Chile. Results in this case are significant – and include links between imports from China and substitution of imports from other countries, as well as between exports to China and strong increases of prices in these sectors in China – with an elasticity of -0.197, that is, a one-dollar increase of imports from China reduced wages by 19.7 per cent (and with a similar elasticity for non-qualified
18 It is not so far possible to accurately define the reason for this result, but it may be due to the low local training level and/or a significant effort to overcome the cultural, labour and technical differences, among others, between the Chinese company and the workers from territories where China’s OFDI are hosted.
19 It would be exceedingly interesting to have access to the answers of the 2015 questionnaire by regions. Consul-tations and requests have been submitted to CAITEC, UNDP and MOFCOM, personally and in China, but they have so far refused to make the questionnaire available with the answers provided by the 254 companies.
ILO AmericasTECHNICAL REPORTS 2017 /6
Effects of China on the quantity and quality of jobs in Latin America and the Caribbean
24
employment). Imports coming from China were also positively associ-ated with the poverty and destitution rates in Chile.20
Two additional aspects are relevant. First, it should be noted that there is currently no institution in China responsible for China’s OFDI, including their effects on labour. This is most relevant from many perspectives. Although different Chinese institutions are responsible for formulating strategies (primarily the State Council and the National Development and Reform Commission (NDRC)) and influencing their implementation through regulations and laws (primarily the Ministry of Commerce (MOFCOM) and the SASAC (State-owned assets Supervision and Administration Commission of the State Council)), other than the existing statistical information (MOFCOM), there is no institution with clear roles assigned for the monitoring, assessment and definition of China’s OFDI. The recent project of CAITEC, MOFCOM and UNDP (2015) 21 with the involvement of the SASAC, reflects this dilemma, considering that this is the first public discussion and assessment in China after China’s OFDI had reached flows in excess of 100 billion dollars annually.22
In addition, there is currently no analysis on employment – quantity and quality – from China in LAC. From case studies of Chinese companies in LAC (Carrillo, 2015; Dussel Peters, 2014, 2017) it can be inferred that in many countries – according to the host country’s regulation – Chinese companies want to increase the quotas for middle and high level positions for Chinese nationals (Huawei in Mexico, for example) and that in some of the projects – for instance, the football stadium donated by China in Costa Rica – the whole infrastructure is built by Chinese workforce. There are, however,
20 The analysis made by Pellandra (2017) for 2003–2013 is particularly interesting because it is the only analysis in the existing literature review to date that distinguishes total, qualified and non-qualified employment. Results are not significant for Chinese imports and qualified employment, and present a negative correlation for the total and non-qualified employment. It should also be noted that Chilean exports present a significant and positive association for total, qualified and non-qualified employment of 0.002, 0.0023 and 0.0073, i.e. they have a much lower effect than Chinese imports. It will be important to carry out similar studies for other countries of the region; results for Chile cannot so far be generalized for the rest of LAC.
21 Thanks to personal interviews in Beijing with the UNDP and CAITEC, access was granted to the questionnaire that CAITEC, MOFCOM and UNDP will send to the Chinese companies, to be published in 2017 (now with the subject of the strategy “One Belt-One Road”, but since this strategy does not include LAC, no efforts will be made for companies that include LAC). The questionnaire is divided into six sections (basic information, prosperity, people, planet, association and equitable share) and 77 questions. Nine questions are presented in the section “people”, which are related to labour aspects, including composition and absolute employment, host country’s regulations on labour aspects, training programs, specific programs and accidents in the corre-sponding companies, as well as the main labour problems and their solution. This questionnaire, however, will not be applied to companies having activities in LAC, as explained above.
22 The issue is also observed – and as first-hand experience by addressing the topic with Chinese businessmen, officials and academicians in China and LAC – in Latin American countries: Chinese companies have minimal links with Chinese public institutions in the corresponding countries (for instance, the corresponding embassy, the CCPIT and others), and, therefore, the collective learning process and assessment capacity on the part of Chinese public institutions is significantly restricted.
Effects of China on the quantity and quality of jobs in Latin America and the Caribbean
25
other experiences. Companies such as Minth and Johnson Electrics – both private, based in Mexico and in electronic segments of the auto parts-automotive chain – as well as Hutchison Ports Holding (located in the Port of Lázaro Cárdenas in the State of Michoacan, Mexico), have almost no Chinese personnel, not even at the highest levels. The quantity and proportion of Chinese nationals in these companies seem to fully depend on the specific contractual conditions in the corresponding host coun-tries. Even in infrastructure projects, in many cases – mainly in Brazil and Mexico – Chinese companies outsource the most labour-intensive processes to local compa-nies – and this is basically the main reason for having co-investments with national businesses – in particular during the building stage, while the design and construction of more complex parts and the administration of the corresponding projects remain under the control of the Chinese company.
In other LAC countries, however, nearly all the workforce is Chinese, mainly in the Caribbean and other smaller Latin American countries.23 The quantity of Chinese employment in some countries can start having macroeconomic effects stemming from increasing remittances.24 In general, Chinese companies seem to adjust and comply with the required labour conditions, but in some countries, Chinese workers recruited by Chinese companies in LAC have even been involved in protests.25 In the case of Chinese companies in Mexico, there are also many companies that recruit their personnel directly, both local and Chinese, whereas others choose to do it through subcontractors and/or recruitment agencies, such as Manpower and GIN Group.26 All these cases show that there are no specific criteria or provisions followed by Chinese companies, or their branches in China, or by Chinese authorities in China or locally.
However, there are no systematic works or case studies on this subject.
23 In other cases, the Chinese workforce has also been integrated into specific projects and in countries as Vene-zuela, the purchase of land by the CAMCE company in the State of Trujillo for building five sugar agro-industrial complexes, the expansion of two sugar mills and the creation of a training school, all of them with an important share of Chinese nationals, generated a strong debate at the local and national level (El Tiempo, 2013).
24 In Trinidad and Tobago, for instance, the outflow of remittance has been higher than the inflow since 2014 and around 43 million dollars in 2015. The recent Chinese migration has played a significant role in this process (Hilaire, 2016).
25 Such was the case of protests and public dissatisfaction staged by more than 100 Chinese workers recruited by the public company Beijing Liujian Construction Corporation in October 2009 in Trinidad and Tobago. After the protest, the Chinese workers were taken by the police to the Immigration Office where they had a meeting with representatives of the Chinese Embassy (CLB, 2009).
26 The Huawei manufacturing plant in Guadalajara, Mexico, for instance, is outsourced to Flextronics and 67 out of around 250 workers were from Huawei (50 Chinese and 17 Mexican workers) and the rest of the staff recruited by Flextronics (Carrillo and Micheli, 2016).
ILO AmericasTECHNICAL REPORTS 2017 /6
Effects of China on the quantity and quality of jobs in Latin America and the Caribbean
26
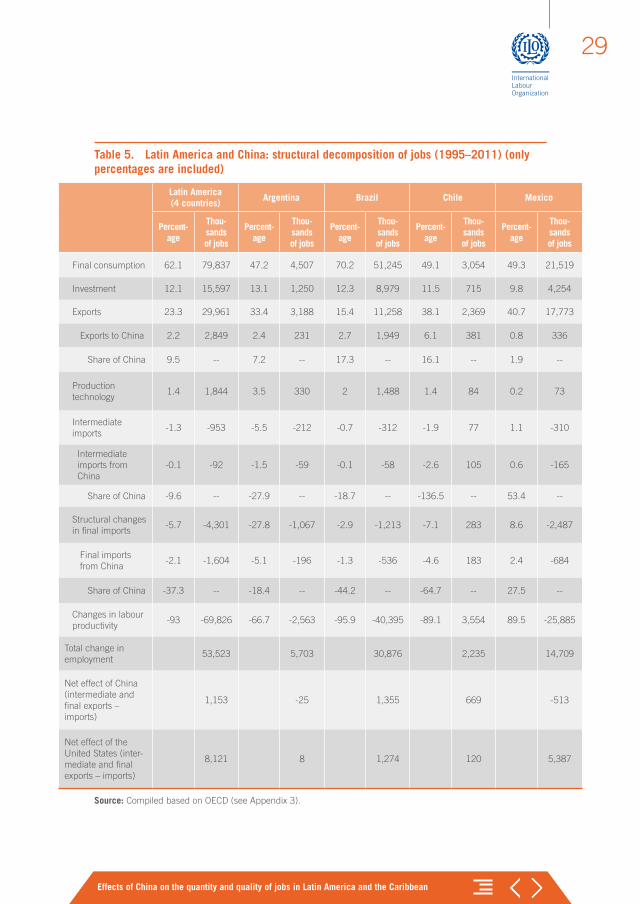
2.2 The net impact of the trade with China on LAC employment (1995–2011)The effects of Chinese trade on the economies of Argentina, Brazil, Chile and Mexico and 34 sectors of their economy are estimated, emphasizing employment aspects, using the input-output matrices (IOMs) included in the OECD database. (Although the database also includes the IOMs for Costa Rica and Colombia, they do not include information on employment.)A new matrix for Latin America was created, incorporating the information of these four countries; that is, the Latin American and the Caribbean region (LAC) in this sub-chapter refers to the four countries for which information is available. The driving factors of employment growth are disag-gregated into: (i) effects of changes on final consumption; (ii) effects of changes on investment; (iii) effects of changes on exports; (iv) effects of changes on the production technology; (v) effects of structural changes on intermediate imports; (vi) effects of structural changes on final imports; and (vii) effects of changes on labour productivity. In many cases, references were made to the United States to have an additional baseline on the employment created by trade with China, in addition to the absolute impact.
Considering the vast amount of results obtained – by countries and corresponding sectors – the main results for 1995–2011 highlight that:
a) In general, the matrix estimates a net effect regarding the impact of Chinese trade with the four Latin American countries, considering those that were created and those that were eliminated, of 1.15 million new jobs or 2.15 per cent of the employment created in the four countries in the period 1995–2011. The employment created by the net trade of the four countries with China was equivalent to 14.2 per cent of the employment created by the trade with the United States during the same period.
b) Two extreme cases can be considered for the four countries for the period 1995–2011: Mexico, as the main loser in the sphere of jobs – with 513,000 jobs lost to trade with China – and Brazil as the main winner, creating 1.35 million jobs or 4.38 per cent of the new employ-ment created in the four countries during the period. It is also important to highlight here the differences between the countries, with Mexico as the country that benefited the most from trade with the United States
Effects of China on the quantity and quality of jobs in Latin America and the Caribbean
27
(5.4 million jobs created) and Argentina where said trade resulted in virtually no job creation.
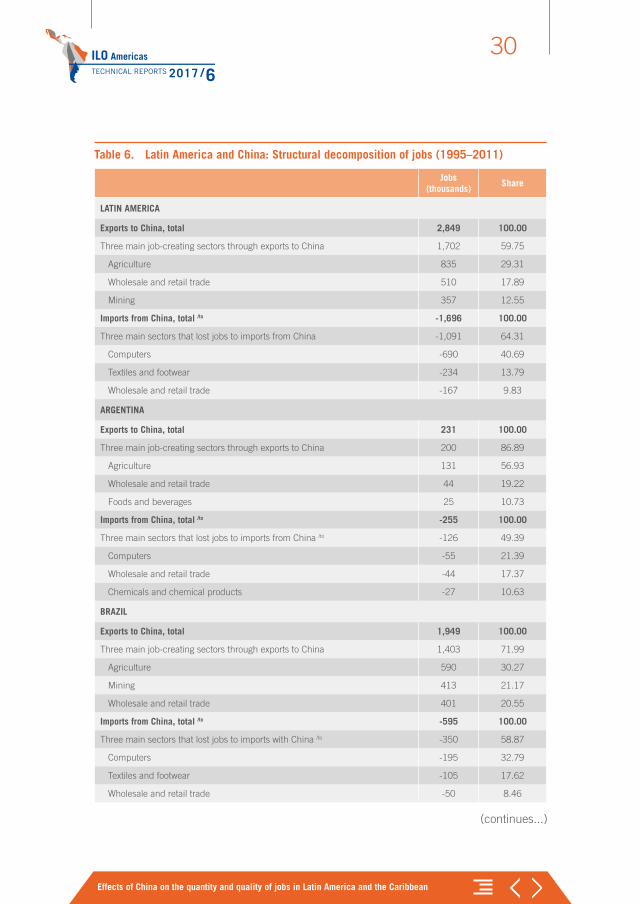
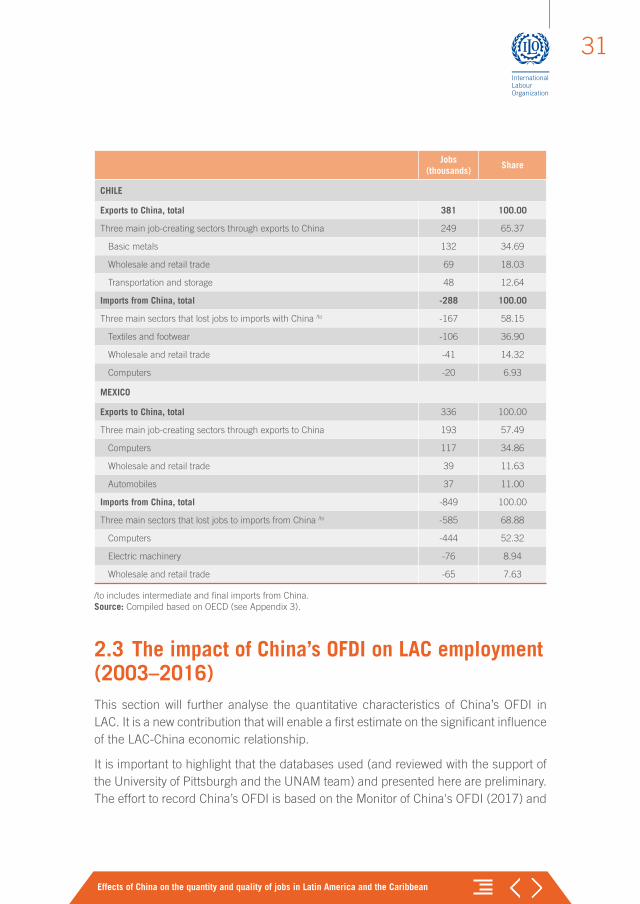
c) There is also detailed sectoral information for the region and each of the four countries (see Table 6). For the case of the region, for instance, three sectors – agriculture, trade and mining – created 1.7 million jobs through exports to China, while employment in the other three sectors – computers, textiles and footwear, as well as trade – was reduced by 1 million jobs due to the Chinese imports. For the case of Brazil, for example, agriculture, mining and trade created 1.4 million jobs, although two manufacturing sectors (computers and textiles and footwear), together with trade, lost 350,000 jobs. The case of Mexico, the country that lost most jobs to China among the four LAC countries considered, is also relevant: the three main job-creating sectors through exports to China – computers, trade and automobiles – only created 193,000 jobs, whereas computers, electrical machinery and trade lost 585,000 jobs.
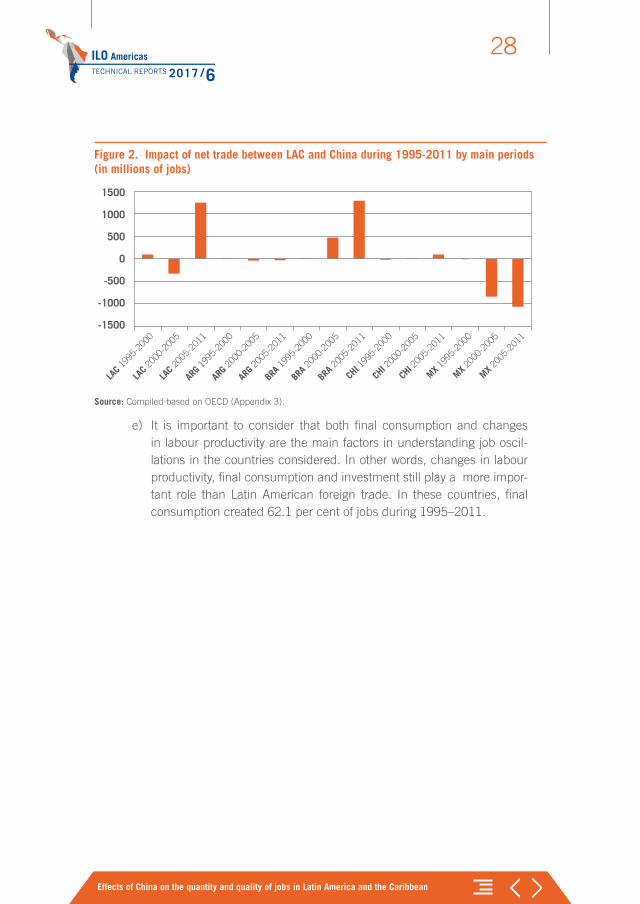
d) Figure 2 establishes the significant differences between job creation and net trade with China in the four Latin American countries for different periods during 1995–2011. For the four countries, the jobs created by this means increased significantly in the last sub-period (2005–2011). In this last period, the employment created by net trade with China was equivalent to 44.04 per cent of the employment created by net trade with the United States. Differences can also be observed in the latter period between Mexico and Brazil in negative and positive job creation respectively as a result of trade with China.
ILO AmericasTECHNICAL REPORTS 2017 /6
Effects of China on the quantity and quality of jobs in Latin America and the Caribbean
28
Figure 2. Impact of net trade between LAC and China during 1995-2011 by main periods (in millions of jobs)
1500
1000
500
0
-500
-1000
-1500
LAC 1
995-
2000
LAC 2
000-
2005
LAC 2
005-
2011
ARG 1
995-
2000
BRA 1
995-
2000
CHI 1
995-
2000
MX 199
5-20
00
MX 200
0-20
05
MX 200
5-20
11
CHI 2
000-
2005
CHI 2
005-
2011
BRA 2
000-
2005
BRA 2
005-
2011
ARG 2
000-
2005
ARG 2
005-
2011
Source: Compiled based on OECD (Appendix 3).
e) It is important to consider that both final consumption and changes in labour productivity are the main factors in understanding job oscil-lations in the countries considered. In other words, changes in labour productivity, final consumption and investment still play a more impor-tant role than Latin American foreign trade. In these countries, final consumption created 62.1 per cent of jobs during 1995–2011.
Effects of China on the quantity and quality of jobs in Latin America and the Caribbean
29
Table 5. Latin America and China: structural decomposition of jobs (1995–2011) (only percentages are included)
Latin America (4 countries)
Argentina Brazil Chile Mexico
Percent-age
Thou-sands of jobs
Percent-age
Thou-sands of jobs
Percent-age
Thou-sands of jobs
Percent-age
Thou-sands of jobs
Percent-age
Thou-sands of jobs
Final consumption 62.1 79,837 47.2 4,507 70.2 51,245 49.1 3,054 49.3 21,519
Investment 12.1 15,597 13.1 1,250 12.3 8,979 11.5 715 9.8 4,254
Exports 23.3 29,961 33.4 3,188 15.4 11,258 38.1 2,369 40.7 17,773
Exports to China 2.2 2,849 2.4 231 2.7 1,949 6.1 381 0.8 336
Share of China 9.5 -- 7.2 -- 17.3 -- 16.1 -- 1.9 --
Production technology
1.4 1,844 3.5 330 2 1,488 1.4 84 0.2 73
Intermediate imports
-1.3 -953 -5.5 -212 -0.7 -312 -1.9 77 1.1 -310
Intermediate imports from China
-0.1 -92 -1.5 -59 -0.1 -58 -2.6 105 0.6 -165
Share of China -9.6 -- -27.9 -- -18.7 -- -136.5 -- 53.4 --
Structural changes in final imports
-5.7 -4,301 -27.8 -1,067 -2.9 -1,213 -7.1 283 8.6 -2,487
Final imports from China
-2.1 -1,604 -5.1 -196 -1.3 -536 -4.6 183 2.4 -684
Share of China -37.3 -- -18.4 -- -44.2 -- -64.7 -- 27.5 --
Changes in labour productivity
-93 -69,826 -66.7 -2,563 -95.9 -40,395 -89.1 3,554 89.5 -25,885
Total change in employment
53,523 5,703 30,876 2,235 14,709
Net effect of China (intermediate and final exports – imports)
1,153 -25 1,355 669 -513
Net effect of the United States (inter-mediate and final exports – imports)
8,121 8 1,274 120 5,387
Source: Compiled based on OECD (see Appendix 3).
ILO AmericasTECHNICAL REPORTS 2017 /6
Effects of China on the quantity and quality of jobs in Latin America and the Caribbean
30
Table 6. Latin America and China: Structural decomposition of jobs (1995–2011)
Jobs (thousands)
Share
LATIN AMERICA
Exports to China, total 2,849 100.00
Three main job-creating sectors through exports to China 1,702 59.75
Agriculture 835 29.31
Wholesale and retail trade 510 17.89
Mining 357 12.55
Imports from China, total /to -1,696 100.00
Three main sectors that lost jobs to imports from China -1,091 64.31
Computers -690 40.69
Textiles and footwear -234 13.79
Wholesale and retail trade -167 9.83
ARGENTINA
Exports to China, total 231 100.00
Three main job-creating sectors through exports to China 200 86.89
Agriculture 131 56.93
Wholesale and retail trade 44 19.22
Foods and beverages 25 10.73
Imports from China, total /to -255 100.00
Three main sectors that lost jobs to imports from China /to -126 49.39
Computers -55 21.39
Wholesale and retail trade -44 17.37
Chemicals and chemical products -27 10.63
BRAZIL
Exports to China, total 1,949 100.00
Three main job-creating sectors through exports to China 1,403 71.99
Agriculture 590 30.27
Mining 413 21.17
Wholesale and retail trade 401 20.55
Imports from China, total /to -595 100.00
Three main sectors that lost jobs to imports with China /to -350 58.87
Computers -195 32.79
Textiles and footwear -105 17.62
Wholesale and retail trade -50 8.46
(continues...)
Effects of China on the quantity and quality of jobs in Latin America and the Caribbean
31
Jobs (thousands)
Share
CHILE
Exports to China, total 381 100.00
Three main job-creating sectors through exports to China 249 65.37
Basic metals 132 34.69
Wholesale and retail trade 69 18.03
Transportation and storage 48 12.64
Imports from China, total -288 100.00
Three main sectors that lost jobs to imports with China /to -167 58.15
Textiles and footwear -106 36.90
Wholesale and retail trade -41 14.32
Computers -20 6.93
MEXICO
Exports to China, total 336 100.00
Three main job-creating sectors through exports to China 193 57.49
Computers 117 34.86
Wholesale and retail trade 39 11.63
Automobiles 37 11.00
Imports from China, total -849 100.00
Three main sectors that lost jobs to imports from China /to -585 68.88
Computers -444 52.32
Electric machinery -76 8.94
Wholesale and retail trade -65 7.63
/to includes intermediate and final imports from China. Source: Compiled based on OECD (see Appendix 3).
2.3 The impact of China’s OFDI on LAC employment (2003–2016)This section will further analyse the quantitative characteristics of China’s OFDI in LAC. It is a new contribution that will enable a first estimate on the significant influence of the LAC-China economic relationship.
It is important to highlight that the databases used (and reviewed with the support of the University of Pittsburgh and the UNAM team) and presented here are preliminary. The effort to record China’s OFDI is based on the Monitor of China's OFDI (2017) and
ILO AmericasTECHNICAL REPORTS 2017 /6
Effects of China on the quantity and quality of jobs in Latin America and the Caribbean
32
more than two decades of analysis on the topic in LAC. Several databases were used, such as FDIMarkets, Bloomberg, Thomson Reuters and CGIT (2017), as well as the information from the Monitor of China's OFDI. This first database – with more than 700 transactions for 2003–2016 – required a review of every transaction to confirm its validity, effective execution or cancellation, among other aspects. For every trans-action effectively executed, it was particularly important to include information on employment. The final database for 2003–2016 recorded 271 transactions carried out in LAC and the employment created was provided for each of them. This process continues on a permanent basis, with the database updated accordingly.
The main results of the research are presented based on the information mentioned above. There is a set of significant aspects to be highlighted regarding China’s OFDI in LAC and its impact on employment.
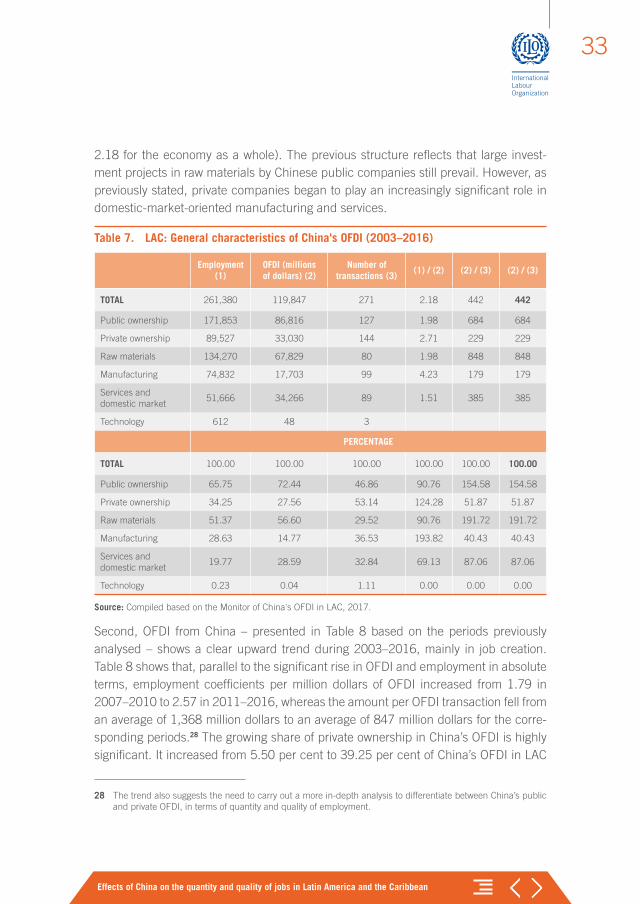
First, as indicated in Table 7, during 2003–2016, China’s OFDI created around 260,000 jobs and executed 271 transactions for around 120 billion dollars. As in previous periods (Dussel Peters, 2013), public OFDI prevails, with 72.44 per cent of the total OFDI to LAC. However, it is important to acknowledge the significant growth of private OFDI in the past five years. Private OFDI executed 144 transactions during the period, and its OFDI coefficient of amount per transaction was three times lower than the coefficients for public OFDI.
China’s OFDI is still focused on raw materials, which account for 56.60 per cent of the total. Manufacture-oriented OFDI – accounting for 14.77 per cent of the total – has also shown remarkable dynamism recently.27 However, OFDI focused on services and domestic market activities, such as financial services, banks, concessionaires and other services, has been the most dynamic activity in the past five years, accounting for 28.59 per cent of China’s OFDI in LAC for the period. The purchase of technology has played a secondary role.
Regarding employment, it should be noted that nearly two-thirds of the jobs are created by China’s public OFDI, mainly OFDI in raw materials, with 51.37 per cent of jobs created. Based on the estimated coefficients, two general characteristics are relevant: (a) whereas the public OFDI created more jobs per transaction – 1,353 jobs versus 622 on the private side – it should be noted that the employment created per OFDI unit is 2.71 for private OFDI and 1.98 for public OFDI, and (b) the manufacturing sector stands out as the main job creator per OFDI unit, with 4.23 jobs (compared to
27 It should be noted that China’s OFDI share in raw materials has fallen dramatically compared with previous periods (Dussel Peters, 2013).
Effects of China on the quantity and quality of jobs in Latin America and the Caribbean
33
2.18 for the economy as a whole). The previous structure reflects that large invest-ment projects in raw materials by Chinese public companies still prevail. However, as previously stated, private companies began to play an increasingly significant role in domestic-market-oriented manufacturing and services.
Table 7. LAC: General characteristics of China's OFDI (2003–2016)
Employment (1)
OFDI (millions of dollars) (2)
Number of transactions (3)
(1) / (2) (2) / (3) (2) / (3)
TOTAL 261,380 119,847 271 2.18 442 442
Public ownership 171,853 86,816 127 1.98 684 684
Private ownership 89,527 33,030 144 2.71 229 229
Raw materials 134,270 67,829 80 1.98 848 848
Manufacturing 74,832 17,703 99 4.23 179 179
Services and domestic market
51,666 34,266 89 1.51 385 385
Technology 612 48 3
PERCENTAGE
TOTAL 100.00 100.00 100.00 100.00 100.00 100.00
Public ownership 65.75 72.44 46.86 90.76 154.58 154.58
Private ownership 34.25 27.56 53.14 124.28 51.87 51.87
Raw materials 51.37 56.60 29.52 90.76 191.72 191.72
Manufacturing 28.63 14.77 36.53 193.82 40.43 40.43
Services and domestic market
19.77 28.59 32.84 69.13 87.06 87.06
Technology 0.23 0.04 1.11 0.00 0.00 0.00
Source: Compiled based on the Monitor of China's OFDI in LAC, 2017.
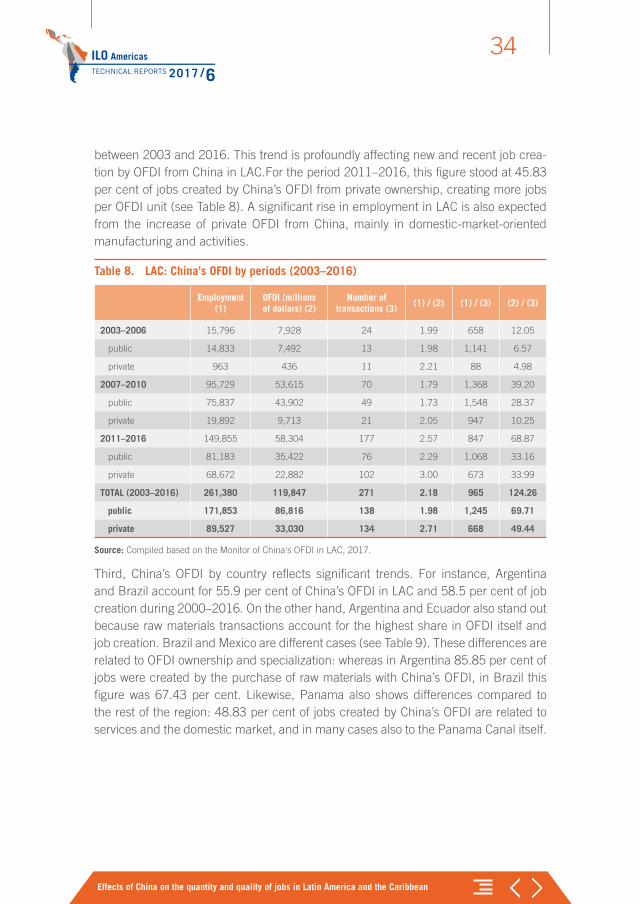
Second, OFDI from China – presented in Table 8 based on the periods previously analysed – shows a clear upward trend during 2003–2016, mainly in job creation. Table 8 shows that, parallel to the significant rise in OFDI and employment in absolute terms, employment coefficients per million dollars of OFDI increased from 1.79 in 2007–2010 to 2.57 in 2011–2016, whereas the amount per OFDI transaction fell from an average of 1,368 million dollars to an average of 847 million dollars for the corre-sponding periods.28 The growing share of private ownership in China’s OFDI is highly significant. It increased from 5.50 per cent to 39.25 per cent of China’s OFDI in LAC
28 The trend also suggests the need to carry out a more in-depth analysis to differentiate between China’s public and private OFDI, in terms of quantity and quality of employment.
ILO AmericasTECHNICAL REPORTS 2017 /6
Effects of China on the quantity and quality of jobs in Latin America and the Caribbean
34
between 2003 and 2016. This trend is profoundly affecting new and recent job crea-tion by OFDI from China in LAC.For the period 2011–2016, this figure stood at 45.83 per cent of jobs created by China’s OFDI from private ownership, creating more jobs per OFDI unit (see Table 8). A significant rise in employment in LAC is also expected from the increase of private OFDI from China, mainly in domestic-market-oriented manufacturing and activities.
Table 8. LAC: China's OFDI by periods (2003–2016)
Employment (1)
OFDI (millions of dollars) (2)
Number of transactions (3)
(1) / (2) (1) / (3) (2) / (3)
2003–2006 15,796 7,928 24 1.99 658 12.05
public 14,833 7,492 13 1.98 1,141 6.57
private 963 436 11 2.21 88 4.98
2007–2010 95,729 53,615 70 1.79 1,368 39.20
public 75,837 43,902 49 1.73 1,548 28.37
private 19,892 9,713 21 2.05 947 10.25
2011–2016 149,855 58,304 177 2.57 847 68.87
public 81,183 35,422 76 2.29 1,068 33.16
private 68,672 22,882 102 3.00 673 33.99
TOTAL (2003–2016) 261,380 119,847 271 2.18 965 124.26
public 171,853 86,816 138 1.98 1,245 69.71
private 89,527 33,030 134 2.71 668 49.44
Source: Compiled based on the Monitor of China's OFDI in LAC, 2017.
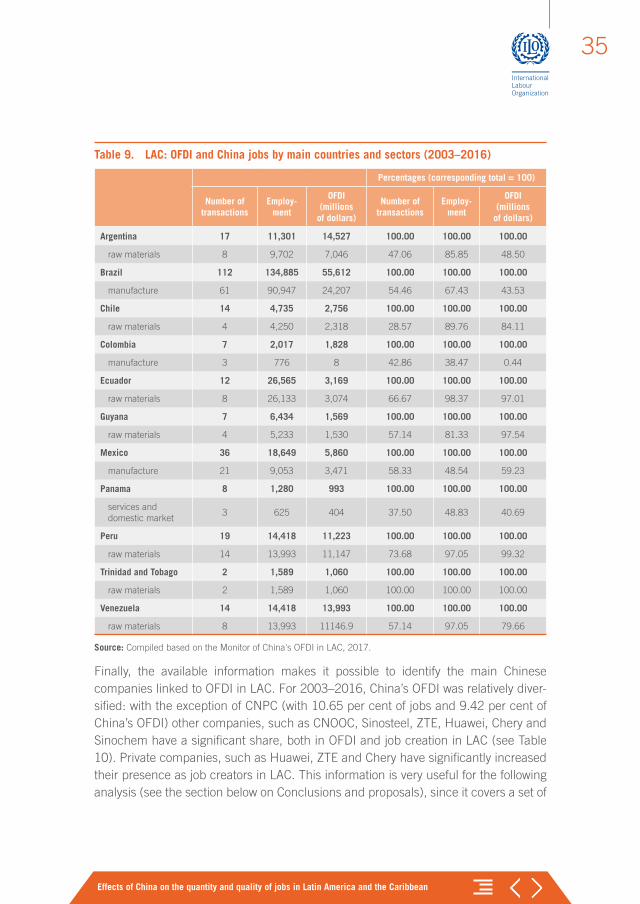
Third, China’s OFDI by country reflects significant trends. For instance, Argentina and Brazil account for 55.9 per cent of China’s OFDI in LAC and 58.5 per cent of job creation during 2000–2016. On the other hand, Argentina and Ecuador also stand out because raw materials transactions account for the highest share in OFDI itself and job creation. Brazil and Mexico are different cases (see Table 9). These differences are related to OFDI ownership and specialization: whereas in Argentina 85.85 per cent of jobs were created by the purchase of raw materials with China’s OFDI, in Brazil this figure was 67.43 per cent. Likewise, Panama also shows differences compared to the rest of the region: 48.83 per cent of jobs created by China’s OFDI are related to services and the domestic market, and in many cases also to the Panama Canal itself.
Effects of China on the quantity and quality of jobs in Latin America and the Caribbean
35
Table 9. LAC: OFDI and China jobs by main countries and sectors (2003–2016)
Percentages (corresponding total = 100)
Number of transactions
Employ-ment
OFDI (millions
of dollars)
Number of transactions
Employ-ment
OFDI (millions
of dollars)
Argentina 17 11,301 14,527 100.00 100.00 100.00
raw materials 8 9,702 7,046 47.06 85.85 48.50
Brazil 112 134,885 55,612 100.00 100.00 100.00
manufacture 61 90,947 24,207 54.46 67.43 43.53
Chile 14 4,735 2,756 100.00 100.00 100.00
raw materials 4 4,250 2,318 28.57 89.76 84.11
Colombia 7 2,017 1,828 100.00 100.00 100.00
manufacture 3 776 8 42.86 38.47 0.44
Ecuador 12 26,565 3,169 100.00 100.00 100.00
raw materials 8 26,133 3,074 66.67 98.37 97.01
Guyana 7 6,434 1,569 100.00 100.00 100.00
raw materials 4 5,233 1,530 57.14 81.33 97.54
Mexico 36 18,649 5,860 100.00 100.00 100.00
manufacture 21 9,053 3,471 58.33 48.54 59.23
Panama 8 1,280 993 100.00 100.00 100.00
services and domestic market
3 625 404 37.50 48.83 40.69
Peru 19 14,418 11,223 100.00 100.00 100.00
raw materials 14 13,993 11,147 73.68 97.05 99.32
Trinidad and Tobago 2 1,589 1,060 100.00 100.00 100.00
raw materials 2 1,589 1,060 100.00 100.00 100.00
Venezuela 14 14,418 13,993 100.00 100.00 100.00
raw materials 8 13,993 11146.9 57.14 97.05 79.66
Source: Compiled based on the Monitor of China's OFDI in LAC, 2017.
Finally, the available information makes it possible to identify the main Chinese companies linked to OFDI in LAC. For 2003–2016, China’s OFDI was relatively diver-sified: with the exception of CNPC (with 10.65 per cent of jobs and 9.42 per cent of China’s OFDI) other companies, such as CNOOC, Sinosteel, ZTE, Huawei, Chery and Sinochem have a significant share, both in OFDI and job creation in LAC (see Table 10). Private companies, such as Huawei, ZTE and Chery have significantly increased their presence as job creators in LAC. This information is very useful for the following analysis (see the section below on Conclusions and proposals), since it covers a set of
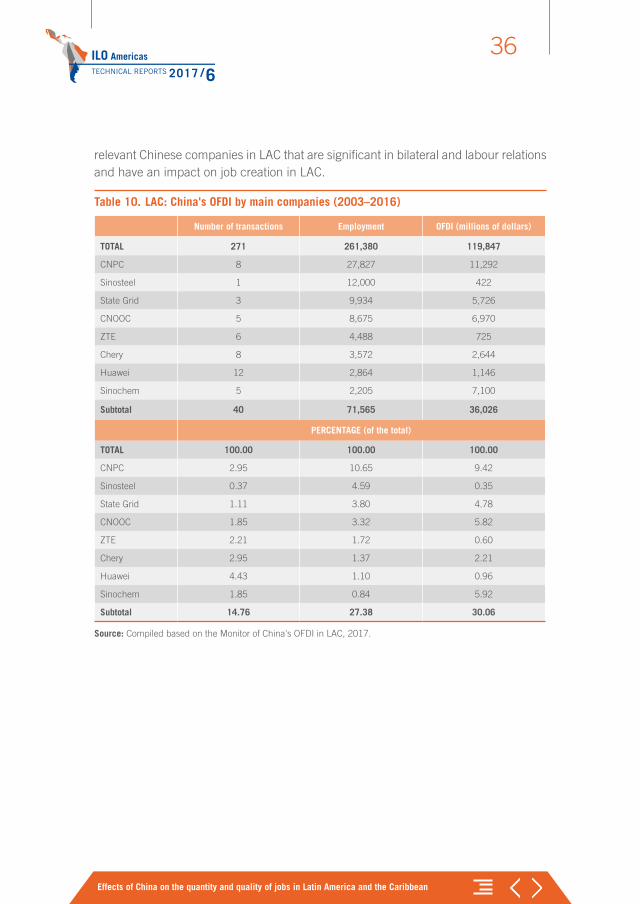
ILO AmericasTECHNICAL REPORTS 2017 /6
Effects of China on the quantity and quality of jobs in Latin America and the Caribbean
36
relevant Chinese companies in LAC that are significant in bilateral and labour relations and have an impact on job creation in LAC.
Table 10. LAC: China's OFDI by main companies (2003–2016)
Number of transactions Employment OFDI (millions of dollars)
TOTAL 271 261,380 119,847
CNPC 8 27,827 11,292
Sinosteel 1 12,000 422
State Grid 3 9,934 5,726
CNOOC 5 8,675 6,970
ZTE 6 4,488 725
Chery 8 3,572 2,644
Huawei 12 2,864 1,146
Sinochem 5 2,205 7,100
Subtotal 40 71,565 36,026
PERCENTAGE (of the total)
TOTAL 100.00 100.00 100.00
CNPC 2.95 10.65 9.42
Sinosteel 0.37 4.59 0.35
State Grid 1.11 3.80 4.78
CNOOC 1.85 3.32 5.82
ZTE 2.21 1.72 0.60
Chery 2.95 1.37 2.21
Huawei 4.43 1.10 0.96
Sinochem 1.85 0.84 5.92
Subtotal 14.76 27.38 30.06
Source: Compiled based on the Monitor of China's OFDI in LAC, 2017.
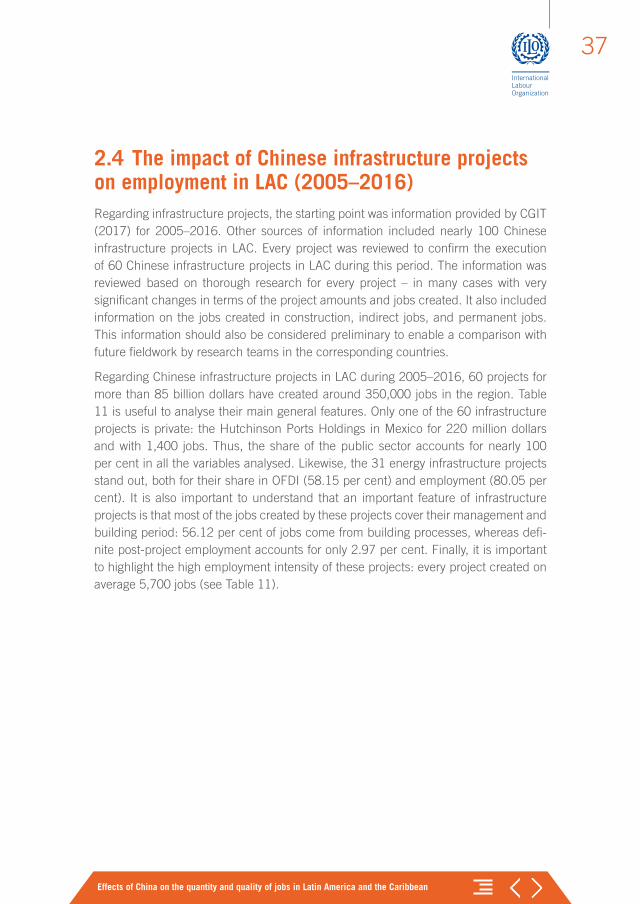
Effects of China on the quantity and quality of jobs in Latin America and the Caribbean
37
2.4 The impact of Chinese infrastructure projects on employment in LAC (2005–2016)Regarding infrastructure projects, the starting point was information provided by CGIT (2017) for 2005–2016. Other sources of information included nearly 100 Chinese infrastructure projects in LAC. Every project was reviewed to confirm the execution of 60 Chinese infrastructure projects in LAC during this period. The information was reviewed based on thorough research for every project – in many cases with very significant changes in terms of the project amounts and jobs created. It also included information on the jobs created in construction, indirect jobs, and permanent jobs. This information should also be considered preliminary to enable a comparison with future fieldwork by research teams in the corresponding countries.
Regarding Chinese infrastructure projects in LAC during 2005–2016, 60 projects for more than 85 billion dollars have created around 350,000 jobs in the region. Table 11 is useful to analyse their main general features. Only one of the 60 infrastructure projects is private: the Hutchinson Ports Holdings in Mexico for 220 million dollars and with 1,400 jobs. Thus, the share of the public sector accounts for nearly 100 per cent in all the variables analysed. Likewise, the 31 energy infrastructure projects stand out, both for their share in OFDI (58.15 per cent) and employment (80.05 per cent). It is also important to understand that an important feature of infrastructure projects is that most of the jobs created by these projects cover their management and building period: 56.12 per cent of jobs come from building processes, whereas defi-nite post-project employment accounts for only 2.97 per cent. Finally, it is important to highlight the high employment intensity of these projects: every project created on average 5,700 jobs (see Table 11).
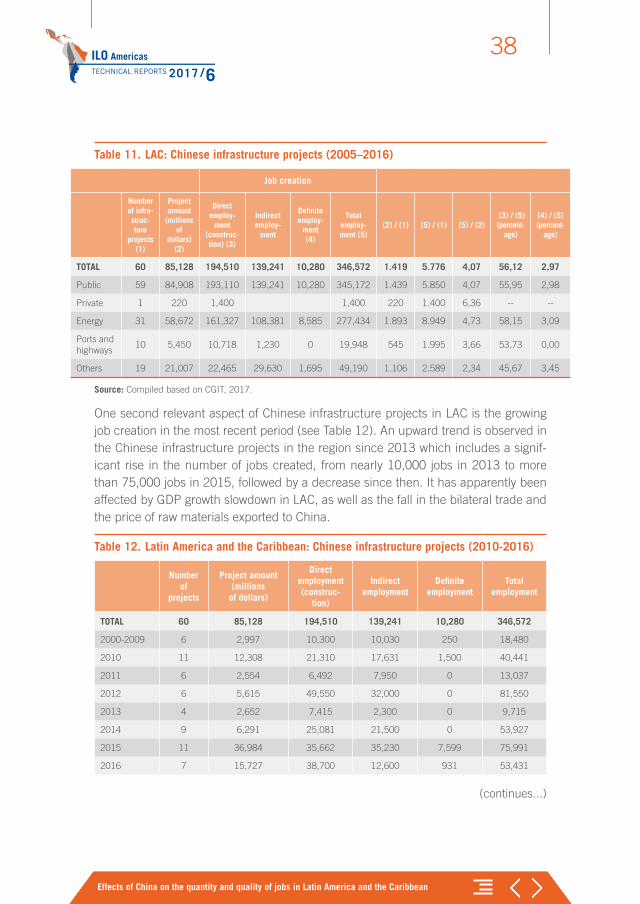
ILO AmericasTECHNICAL REPORTS 2017 /6
Effects of China on the quantity and quality of jobs in Latin America and the Caribbean
38
Table 11. LAC: Chinese infrastructure projects (2005–2016)
Job creation
Number of infra-struc-ture
projects (1)
Project amount
(millions of
dollars) (2)
Direct employ-
ment (construc-tion) (3)
Indirect employ-
ment
Definite employ-
ment (4)
Total employ-ment (5)
(2) / (1) (5) / (1) (5) / (2) (3) / (5) (percent-
age)
(4) / (5) (percent-
age)
TOTAL 60 85,128 194,510 139,241 10,280 346,572 1.419 5.776 4,07 56,12 2,97
Public 59 84,908 193,110 139,241 10,280 345,172 1.439 5.850 4,07 55,95 2,98
Private 1 220 1,400 1,400 220 1.400 6,36 -- --
Energy 31 58,672 161,327 108,381 8,585 277,434 1.893 8.949 4,73 58,15 3,09
Ports and highways
10 5,450 10,718 1,230 0 19,948 545 1.995 3,66 53,73 0,00
Others 19 21,007 22,465 29,630 1,695 49,190 1.106 2.589 2,34 45,67 3,45
Source: Compiled based on CGIT, 2017.
One second relevant aspect of Chinese infrastructure projects in LAC is the growing job creation in the most recent period (see Table 12). An upward trend is observed in the Chinese infrastructure projects in the region since 2013 which includes a signif-icant rise in the number of jobs created, from nearly 10,000 jobs in 2013 to more than 75,000 jobs in 2015, followed by a decrease since then. It has apparently been affected by GDP growth slowdown in LAC, as well as the fall in the bilateral trade and the price of raw materials exported to China.
Table 12. Latin America and the Caribbean: Chinese infrastructure projects (2010-2016)
Number
of projects
Project amount (millions
of dollars)
Direct employment (construc-
tion)
Indirect employment
Definite employment
Total employment
TOTAL 60 85,128 194,510 139,241 10,280 346,572
2000-2009 6 2,997 10,300 10,030 250 18,480
2010 11 12,308 21,310 17,631 1,500 40,441
2011 6 2,554 6,492 7,950 0 13,037
2012 6 5,615 49,550 32,000 0 81,550
2013 4 2,652 7,415 2,300 0 9,715
2014 9 6,291 25,081 21,500 0 53,927
2015 11 36,984 35,662 35,230 7,599 75,991
2016 7 15,727 38,700 12,600 931 53,431
(continues...)
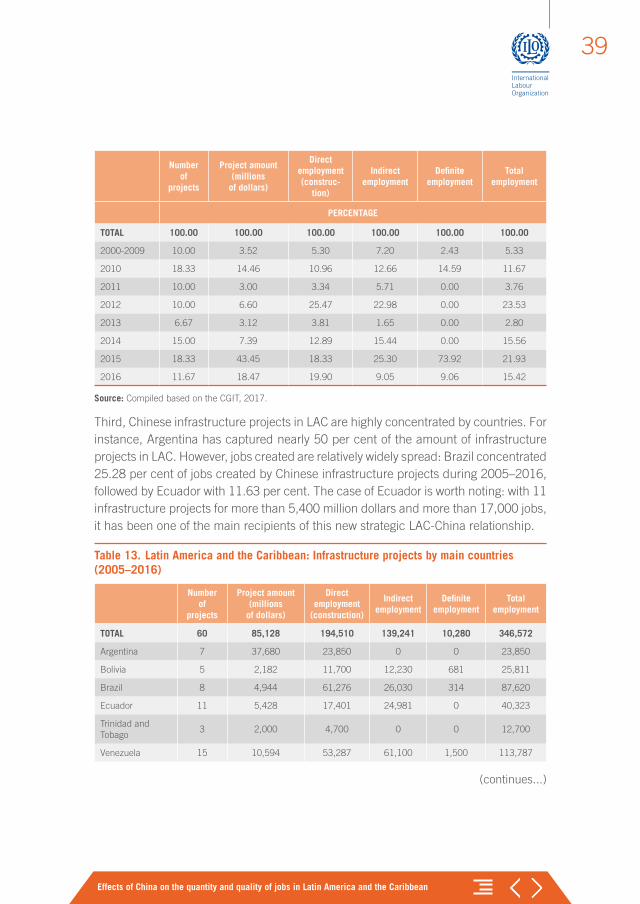
Effects of China on the quantity and quality of jobs in Latin America and the Caribbean
39
Number
of projects
Project amount (millions
of dollars)
Direct employment (construc-
tion)
Indirect employment
Definite employment
Total employment
PERCENTAGE
TOTAL 100.00 100.00 100.00 100.00 100.00 100.00
2000-2009 10.00 3.52 5.30 7.20 2.43 5.33
2010 18.33 14.46 10.96 12.66 14.59 11.67
2011 10.00 3.00 3.34 5.71 0.00 3.76
2012 10.00 6.60 25.47 22.98 0.00 23.53
2013 6.67 3.12 3.81 1.65 0.00 2.80
2014 15.00 7.39 12.89 15.44 0.00 15.56
2015 18.33 43.45 18.33 25.30 73.92 21.93
2016 11.67 18.47 19.90 9.05 9.06 15.42
Source: Compiled based on the CGIT, 2017.
Third, Chinese infrastructure projects in LAC are highly concentrated by countries. For instance, Argentina has captured nearly 50 per cent of the amount of infrastructure projects in LAC. However, jobs created are relatively widely spread: Brazil concentrated 25.28 per cent of jobs created by Chinese infrastructure projects during 2005–2016, followed by Ecuador with 11.63 per cent. The case of Ecuador is worth noting: with 11 infrastructure projects for more than 5,400 million dollars and more than 17,000 jobs, it has been one of the main recipients of this new strategic LAC-China relationship.
Table 13. Latin America and the Caribbean: Infrastructure projects by main countries (2005–2016)
Number of
projects
Project amount (millions
of dollars)
Direct employment
(construction)
Indirect employment
Definite employment
Total employment
TOTAL 60 85,128 194,510 139,241 10,280 346,572
Argentina 7 37,680 23,850 0 0 23,850
Bolivia 5 2,182 11,700 12,230 681 25,811
Brazil 8 4,944 61,276 26,030 314 87,620
Ecuador 11 5,428 17,401 24,981 0 40,323
Trinidad and Tobago
3 2,000 4,700 0 0 12,700
Venezuela 15 10,594 53,287 61,100 1,500 113,787
(continues...)
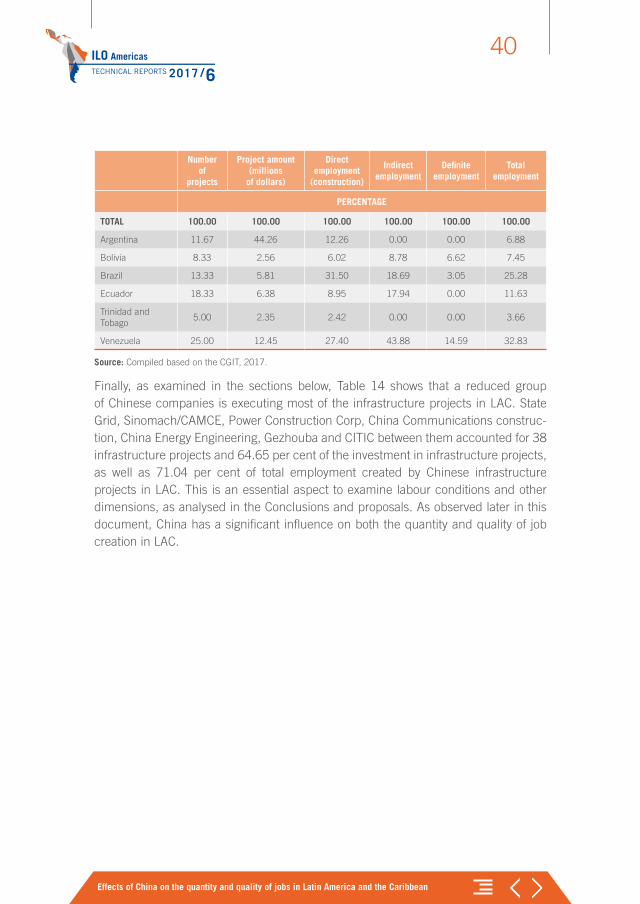
ILO AmericasTECHNICAL REPORTS 2017 /6
Effects of China on the quantity and quality of jobs in Latin America and the Caribbean
40
Number of
projects
Project amount (millions
of dollars)
Direct employment
(construction)
Indirect employment
Definite employment
Total employment
PERCENTAGE
TOTAL 100.00 100.00 100.00 100.00 100.00 100.00
Argentina 11.67 44.26 12.26 0.00 0.00 6.88
Bolivia 8.33 2.56 6.02 8.78 6.62 7.45
Brazil 13.33 5.81 31.50 18.69 3.05 25.28
Ecuador 18.33 6.38 8.95 17.94 0.00 11.63
Trinidad and Tobago
5.00 2.35 2.42 0.00 0.00 3.66
Venezuela 25.00 12.45 27.40 43.88 14.59 32.83
Source: Compiled based on the CGIT, 2017.
Finally, as examined in the sections below, Table 14 shows that a reduced group of Chinese companies is executing most of the infrastructure projects in LAC. State Grid, Sinomach/CAMCE, Power Construction Corp, China Communications construc-tion, China Energy Engineering, Gezhouba and CITIC between them accounted for 38 infrastructure projects and 64.65 per cent of the investment in infrastructure projects, as well as 71.04 per cent of total employment created by Chinese infrastructure projects in LAC. This is an essential aspect to examine labour conditions and other dimensions, as analysed in the Conclusions and proposals. As observed later in this document, China has a significant influence on both the quantity and quality of job creation in LAC.
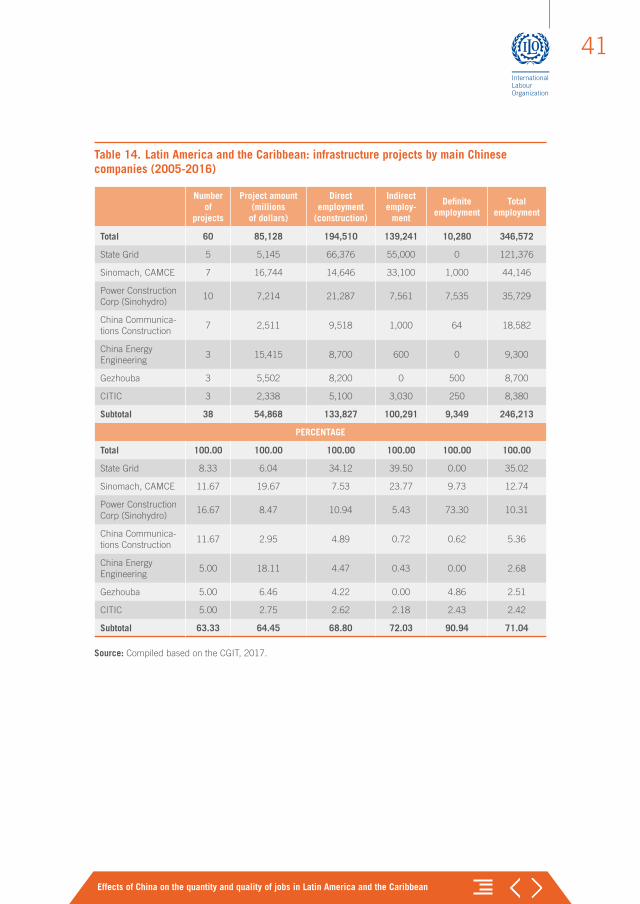
Effects of China on the quantity and quality of jobs in Latin America and the Caribbean
41
Table 14. Latin America and the Caribbean: infrastructure projects by main Chinese companies (2005-2016)
Number of
projects
Project amount (millions
of dollars)
Direct employment
(construction)
Indirect employ-
ment
Definite employment
Total employment
Total 60 85,128 194,510 139,241 10,280 346,572
State Grid 5 5,145 66,376 55,000 0 121,376
Sinomach, CAMCE 7 16,744 14,646 33,100 1,000 44,146
Power Construction Corp (Sinohydro)
10 7,214 21,287 7,561 7,535 35,729
China Communica-tions Construction
7 2,511 9,518 1,000 64 18,582
China Energy Engineering
3 15,415 8,700 600 0 9,300
Gezhouba 3 5,502 8,200 0 500 8,700
CITIC 3 2,338 5,100 3,030 250 8,380
Subtotal 38 54,868 133,827 100,291 9,349 246,213
PERCENTAGE
Total 100.00 100.00 100.00 100.00 100.00 100.00
State Grid 8.33 6.04 34.12 39.50 0.00 35.02
Sinomach, CAMCE 11.67 19.67 7.53 23.77 9.73 12.74
Power Construction Corp (Sinohydro)
16.67 8.47 10.94 5.43 73.30 10.31
China Communica-tions Construction
11.67 2.95 4.89 0.72 0.62 5.36
China Energy Engineering
5.00 18.11 4.47 0.43 0.00 2.68
Gezhouba 5.00 6.46 4.22 0.00 4.86 2.51
CITIC 5.00 2.75 2.62 2.18 2.43 2.42
Subtotal 63.33 64.45 68.80 72.03 90.94 71.04
Source: Compiled based on the CGIT, 2017.
ILO AmericasTECHNICAL REPORTS 2017 /6
Effects of China on the quantity and quality of jobs in Latin America and the Caribbean
42
3. Characteristics of the employment created by OFDI from China and infrastructure in LAC to 2016. Methodological aspects
Research documents that explicitly address OFDI from China and/or infrastructure projects in LAC and their impact on job creation and quality have not been found. This section proposes the need to complement the existing information – beyond the information already presented at the aggregate and disaggregate levels – in LAC and China on the quantity and quality of employment created by China’s OFDI and infra-structure. This clarification is important because this section will not address detailed methodological and conceptual discussions on multinational enterprises and decent work, among others, which would digress from the objectives of this document.
Despite the lack of analyses on the quantity and quality of jobs created by China’s OFDI and infrastructure in LAC, there are three ways to generate and enhance the existing information on the subject: 1. Methodological aspects by the ILO, 2. Access to CAITEC, MOFCOM and UNDP results (2015 and 2016/2017, see section above), and 3. A set of case studies.
1. Regarding the methodologies to assess the quality of employment, no consensus has been reached on the concept of employment quality, but it is usually associated with the dimension of the vulnerable (ILO, 2016) and/or precarious (ILO, 2016; Bertranou et al., 2013) and/or decent work (Galhardi, 2016).29 There is apparently consensus on the minimum conditions that any quality employment should offer: labour contract, adequate remuneration, affiliation to social security systems, fair working hours, labour rights and freedom of association. Recent efforts have also been made by the ILO in Mexico to carry out systematic and efficient analyses of information on the economic and social impact
29 Galhardi’s document (2016) presents an excellent introduction and analysis of the different definitions of MNEs and the measurement of their activities, emphasizing labour aspects and proposals to integrate indicators on the concept of “decent work” (Galhardi, 2016,pp. 10–13). It would be relevant to organize a Decent Work Team in China to carry out pilot studies, as further analysed below.
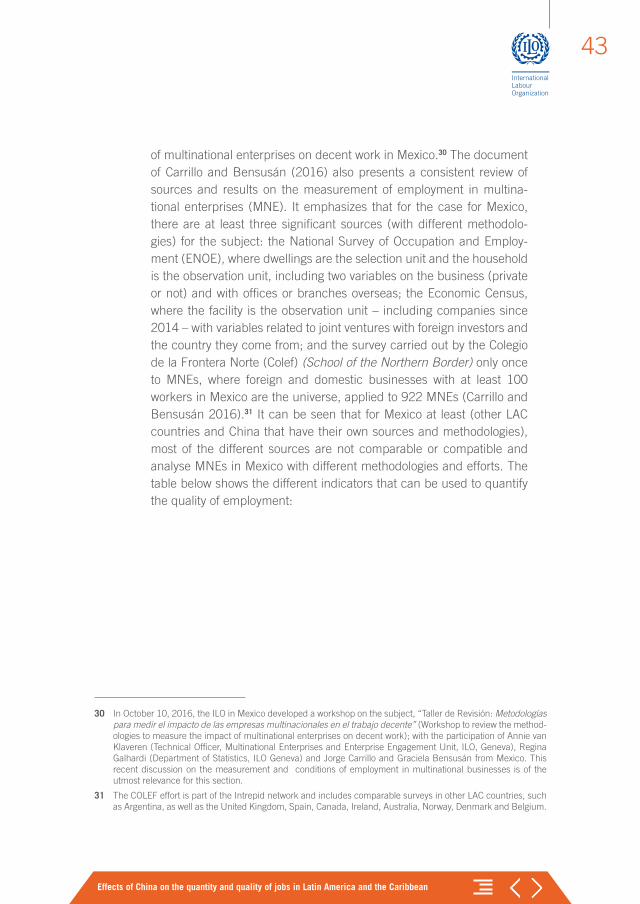
Effects of China on the quantity and quality of jobs in Latin America and the Caribbean
43
of multinational enterprises on decent work in Mexico.30 The document of Carrillo and Bensusán (2016) also presents a consistent review of sources and results on the measurement of employment in multina-tional enterprises (MNE). It emphasizes that for the case for Mexico, there are at least three significant sources (with different methodolo-gies) for the subject: the National Survey of Occupation and Employ-ment (ENOE), where dwellings are the selection unit and the household is the observation unit, including two variables on the business (private or not) and with offices or branches overseas; the Economic Census, where the facility is the observation unit – including companies since 2014 – with variables related to joint ventures with foreign investors and the country they come from; and the survey carried out by the Colegio de la Frontera Norte (Colef) (School of the Northern Border) only once to MNEs, where foreign and domestic businesses with at least 100 workers in Mexico are the universe, applied to 922 MNEs (Carrillo and Bensusán 2016).31 It can be seen that for Mexico at least (other LAC countries and China that have their own sources and methodologies), most of the different sources are not comparable or compatible and analyse MNEs in Mexico with different methodologies and efforts. The table below shows the different indicators that can be used to quantify the quality of employment:
30 In October 10, 2016, the ILO in Mexico developed a workshop on the subject, “Taller de Revisión: Metodologías para medir el impacto de las empresas multinacionales en el trabajo decente” (Workshop to review the method-ologies to measure the impact of multinational enterprises on decent work); with the participation of Annie van Klaveren (Technical Officer, Multinational Enterprises and Enterprise Engagement Unit, ILO, Geneva), Regina Galhardi (Department of Statistics, ILO Geneva) and Jorge Carrillo and Graciela Bensusán from Mexico. This recent discussion on the measurement and conditions of employment in multinational businesses is of the utmost relevance for this section.
31 The COLEF effort is part of the Intrepid network and includes comparable surveys in other LAC countries, such as Argentina, as well as the United Kingdom, Spain, Canada, Ireland, Australia, Norway, Denmark and Belgium.
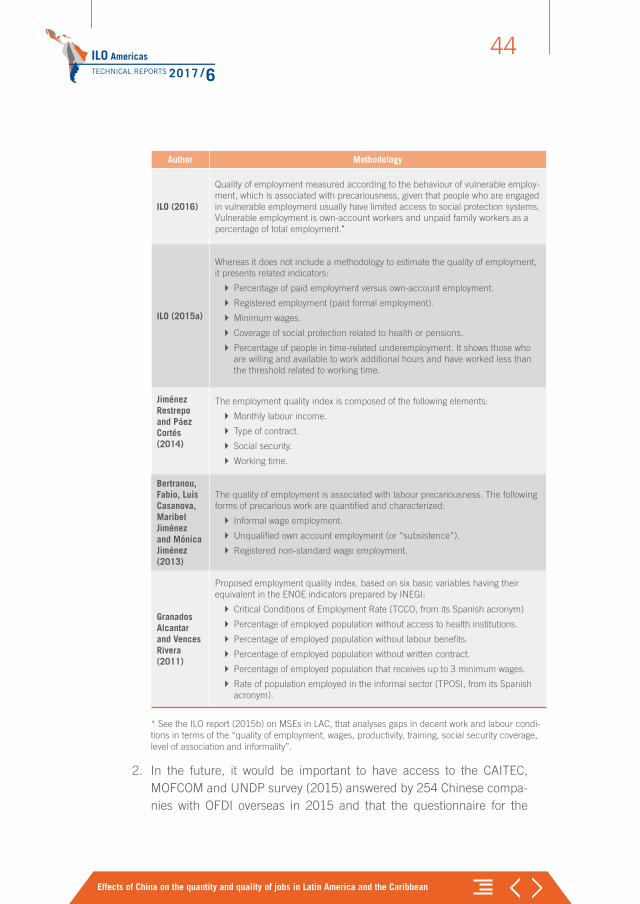
ILO AmericasTECHNICAL REPORTS 2017 /6
Effects of China on the quantity and quality of jobs in Latin America and the Caribbean
44
Author Methodology
ILO (2016)
Quality of employment measured according to the behaviour of vulnerable employ-ment, which is associated with precariousness, given that people who are engaged in vulnerable employment usually have limited access to social protection systems. Vulnerable employment is own-account workers and unpaid family workers as a percentage of total employment.*
ILO (2015a)
Whereas it does not include a methodology to estimate the quality of employment, it presents related indicators:
` Percentage of paid employment versus own-account employment.
` Registered employment (paid formal employment).
` Minimum wages.
` Coverage of social protection related to health or pensions.
` Percentage of people in time-related underemployment. It shows those who are willing and available to work additional hours and have worked less than the threshold related to working time.
Jiménez Restrepo and Páez Cortés (2014)
The employment quality index is composed of the following elements:
` Monthly labour income.
` Type of contract.
` Social security.
` Working time.
Bertranou, Fabio, Luis Casanova, Maribel Jiménez and Mónica Jiménez (2013)
The quality of employment is associated with labour precariousness. The following forms of precarious work are quantified and characterized:
` Informal wage employment.
` Unqualified own account employment (or “subsistence”).
` Registered non-standard wage employment.
Granados Alcantar and Vences Rivera (2011)
Proposed employment quality index, based on six basic variables having their equivalent in the ENOE indicators prepared by INEGI:
` Critical Conditions of Employment Rate (TCCO, from its Spanish acronym)
` Percentage of employed population without access to health institutions.
` Percentage of employed population without labour benefits.
` Percentage of employed population without written contract.
` Percentage of employed population that receives up to 3 minimum wages.
` Rate of population employed in the informal sector (TPOSI, from its Spanish acronym).
* See the ILO report (2015b) on MSEs in LAC, that analyses gaps in decent work and labour condi-tions in terms of the “quality of employment, wages, productivity, training, social security coverage, level of association and informality”.
2. In the future, it would be important to have access to the CAITEC, MOFCOM and UNDP survey (2015) answered by 254 Chinese compa-nies with OFDI overseas in 2015 and that the questionnaire for the
Effects of China on the quantity and quality of jobs in Latin America and the Caribbean
45
2016/2017 edition (see Section 2) includes the Chinese companies that have activities in LAC (“South America”).
3. So far, and despite the wide literature review in Spanish, English and Mandarin Chinese, no research document has been found that explic-itly addresses OFDI and/or infrastructure projects from China in LAC and its impact on job creation and the quality of employment. However, recent documents related to the topic were identified, which can be grouped as follows: (i) empirical studies on China’s OFDI effects on the quantity (though not quality) of employment; (ii) conceptual aspects to be considered in the measurement of the quality of employment. The studies by Kubny and Voss (2010), Wang and Zadek (2016), Sinkala, Muchemwa and Zhou (2014), Liste and Kolster (2012), Huang and Ren (2013), Hanemann (2012), and Boakye and Li (2015), among others, reflect different attempts to analyse case studies of Chinese companies, mainly in Africa, and different analysis on their impact on employment.
The results of the above-mentioned studies on OFDI effects on LAC show, so far, the possibility of a “3-way approach”: 1. The use of the information available in the corre-sponding Latin American countries (see the discussion by Carrillo and Bensusán, 2016, for the Mexican case); 2. Access and use of the information available in China and the use of a comparable questionnaire with the results obtained (2015) and that will be obtained by CAITEC, MOFCOM and UNDP (2016/2017), if accurate questions are available for this questionnaire;32 and 3. Analysis of case studies. Surprisingly, this third dimension – that is of the utmost relevance to understand specific cases that would enable comparisons at the local, national and LAC levels – has not been explic-itly taken into account in the previous debates and analyses for the cases of Mexico and China. Case studies of Chinese companies in LAC that enable an understanding of their potential and difficulties in the labour sphere – such as those that have been carried out from the perspective of the industrial organization (Dussel Peters, 2014) – would be particularly relevant for the analysis on the quantity and quality of employ-ment in the region.
32 The support of the ILO and United Nations at the highest level will be essential to prepare a questionnaire, since we understand, by first-hand experience, that Chinese companies will reply only if invited and required by the central government of the People's Republic of China.
ILO AmericasTECHNICAL REPORTS 2017 /6
Effects of China on the quantity and quality of jobs in Latin America and the Caribbean
46
4. Conclusions and proposals
The analysis of the document reflects the growing and significant socio-economic presence of China in LAC in the past 15 years. Different stages in the LAC-China rela-tionship since the 1990s entail a growing complexity by including, simultaneously, an integration through trade, funding, OFDI and infrastructure projects. Employment and its quality as a result of different Chinese activities in LAC play an increasingly relevant role in each of these fields. To date, the systematic analysis on the subject has been practically non-existent.
To understand the growing complexity of this issue, the first section analyses the LAC-China relationship in terms of trade, OFDI and infrastructure projects, differ-entiating each of these components and understanding the driving factors of their evolution. The proposal is significant, not only in terms of the analysis, but mainly to inform policy-making processes. Such policies should be implemented within the specific sphere of each of these fields, also specifically for the analysis of jobs created by China in LAC.
The first section also highlights that the LAC-China relationship has also had some contradictions. For instance, the growing LAC trade deficit with China and, particu-larly, the technological content of the trade, with a huge gap in terms of added value and technological level between LAC exports and imports. This structure seems to be increasingly complex if we consider China OFDI focus on raw materials. Infrastructure projects, carried out since 2013 with a group of Chinese companies, and LAC demand could meet specific needs in the region, but also consolidate the “centre-periphery” pattern established in the trade and OFDI relationship.
This section also addresses the existing analyses of jobs created by China through trade, OFDI and infrastructure projects. In the light of the limited existing studies for LAC, the high flexibility level – or pragmatism – of the Chinese companies is remarkable: they seem to adjust to local and national provisions internationally, in Japan, LAC and Africa. For the case of LAC, and according to the CAITEC, MOFCOM and UNDP survey (2015), the “labour issues” are the highest risk for their activities, followed by the political and regulatory setting.
Chinese companies themselves acknowledge in this survey their lack of understanding of the local culture and habits, as well as specific disagreements on compensations and benefits in labour relations. The preference for recruiting Chinese nationals
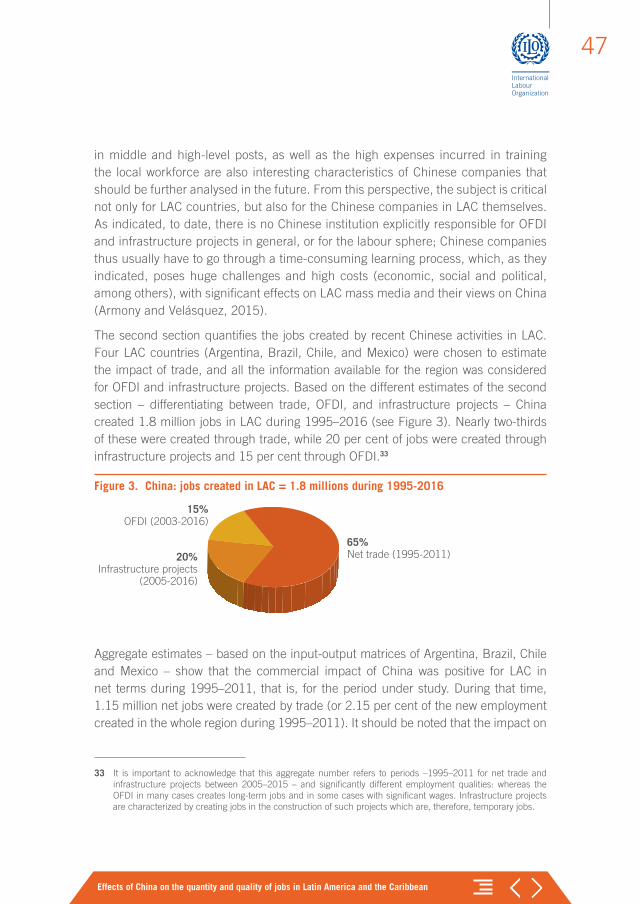
Effects of China on the quantity and quality of jobs in Latin America and the Caribbean
47
in middle and high-level posts, as well as the high expenses incurred in training the local workforce are also interesting characteristics of Chinese companies that should be further analysed in the future. From this perspective, the subject is critical not only for LAC countries, but also for the Chinese companies in LAC themselves. As indicated, to date, there is no Chinese institution explicitly responsible for OFDI and infrastructure projects in general, or for the labour sphere; Chinese companies thus usually have to go through a time-consuming learning process, which, as they indicated, poses huge challenges and high costs (economic, social and political, among others), with significant effects on LAC mass media and their views on China (Armony and Velásquez, 2015).
The second section quantifies the jobs created by recent Chinese activities in LAC. Four LAC countries (Argentina, Brazil, Chile, and Mexico) were chosen to estimate the impact of trade, and all the information available for the region was considered for OFDI and infrastructure projects. Based on the different estimates of the second section – differentiating between trade, OFDI, and infrastructure projects – China created 1.8 million jobs in LAC during 1995–2016 (see Figure 3). Nearly two-thirds of these were created through trade, while 20 per cent of jobs were created through infrastructure projects and 15 per cent through OFDI.33
Figure 3. China: jobs created in LAC = 1.8 millions during 1995-2016
65%Net trade (1995-2011)20%
Infrastructure projects (2005-2016)
15%OFDI (2003-2016)
Aggregate estimates – based on the input-output matrices of Argentina, Brazil, Chile and Mexico – show that the commercial impact of China was positive for LAC in net terms during 1995–2011, that is, for the period under study. During that time, 1.15 million net jobs were created by trade (or 2.15 per cent of the new employment created in the whole region during 1995–2011). It should be noted that the impact on
33 It is important to acknowledge that this aggregate number refers to periods –1995–2011 for net trade and infrastructure projects between 2005–2015 – and significantly different employment qualities: whereas the OFDI in many cases creates long-term jobs and in some cases with significant wages. Infrastructure projects are characterized by creating jobs in the construction of such projects which are, therefore, temporary jobs.
ILO AmericasTECHNICAL REPORTS 2017 /6
Effects of China on the quantity and quality of jobs in Latin America and the Caribbean
48
LAC of net trade with China has increased and that in 2005–2011 it amounted to 44 per cent of the employment created by net trade with the United States. The analysis also enabled a disaggregation among the countries and by sectors: Brazil and Mexico were at both ends in terms of job creation – positive and negative. At the sector level, agriculture and mining were the two sectors that benefited the most from the trade with China – mainly by their exports –, whereas other sectors, such as computers, textiles, footwear and wholesale and retail trade were affected by the trade with China through imports. According to preliminary estimates, which require further review and development, China’s OFDI and infrastructure projects in LAC created more than 600,000 jobs.
The analysis in this section indicates that there are interesting areas for further research: the still pervasive presence of the public sector in China’s OFDI and infra-structure projects, although with a growing presence of private companies under OFDI. A relatively small group of companies with significant presence in the jobs created by OFDI and infrastructure projects were also identified in both cases, such as CNPC, CNOOC, ZTE, Chery, Huawei, CAMCE, State Grid, Gezhouba, Power Construc-tion/Sinohydro and China Energy Engineering. These companies play a pivotal role in the socio-economic relationship between LAC and China, specifically in terms of the quantity and quality of employment created in LAC. These companies have an impact on the bilateral relationship and the specific labour conditions in LAC. No information is available on the intra-company characteristics in China and abroad for this group of Chinese companies, nor any comparative analysis with other local and national companies in LAC.
The third section of the document examines the existing contributions available in the ILO, LAC and China on the quantity and quality of jobs created by Chinese companies in LAC. It is clear that further studies will need to use the existing information in a pragmatic way by means of surveys, censuses and specialized questionnaires, such as those of the Intrepid network. The case of Mexico shows the challenges in linking these existing efforts. Furthermore, it is important to have access to and know in detail the results of surveys available in China on the activities of multi-national enterprises (MNE) worldwide and in LAC. However, these efforts are usually far from an accurate understanding of the quality of employment created by the Chinese MNEs in LAC. Therefore, a triple approach is proposed for the analysis of the quantity and, primarily the quality, of the jobs created by the Chinese MNEs in LAC: use of information avail-able at the national and local levels, access to existing surveys in China, and devel-opment of case studies. This triple approach will enable a local, national and global comparison.
Effects of China on the quantity and quality of jobs in Latin America and the Caribbean
49
Results presented above suggest the need of a more in-depth analysis of the new labour conditions created by OFDI and infrastructure projects from China in LAC. It is justified, not only by its growing relevance, but also by the global Chinese presence. This subject is relevant for host countries, given the limited knowledge when it is necessary to negotiate with Chinese companies or make specific requests. Likewise, and in the light of institutional limitations in China (the lack of an institution respon-sible for China’s OFDI monitoring and assessment), the subject is essential both in local and national labour terms, as well as to build a mutually beneficial and long-term South–South cooperation relationship. Certainly, the dynamics and intensity of this LAC-China relationship have not allowed both parties to be prepared enough.
It would be relevant to identify a group of LAC countries that could be included in an analysis of the quantity and quality of employment created by the China’s net trade, OFDI and infrastructure projects in LAC, in order to compare these general conclu-sions and proposals with case studies on the subject. It would be useful to integrate the analysis of four or five Chinese companies into the study, since there is as yet no research project – in the academic world and/or with public institutions and/or the United Nations, such as the ILO or the UNDP – focused on labour aspects. This study could also be supported by a survey similar to the one developed by CAITEC, MOFCOM and UNDP, including a specific questionnaire to be answered by the Chinese companies that are present in LAC. A common approach to assess the quan-tity and quality of job creation requires the development of a standard questionnaire in the countries included in the analysis and in China, including Chinese companies that have OFDI and infrastructure projects in LAC. Finally, the preliminary results obtained in this document need to be compared with the jobs created in LAC by other countries, such as the United States and the European Union. This subject is also relevant to measure the absolute results and the quality of jobs created by OFDI and infrastructure projects from China.
In short, the results of this study suggest the need to further explore the impacts of China on the quantity and quality of employment in LAC. As suggested by this document, the importance of China in the region and the growing complexity of the LAC-China relationship entail investigating the effects on the employment sector, in order to better understand its present and project its future, and to be able to formu-late the necessary policies and interventions to maximize the benefits for the Latin American and Caribbean region.
ILO AmericasTECHNICAL REPORTS 2017 /6
Effects of China on the quantity and quality of jobs in Latin America and the Caribbean
50
References
Aho, C.M. and Orr, J.A. 1981. “Trade sensitive employment: Who are the affected workers?”, in Monthly Labor Review 104(2), pp. 29–35.
Ansar, A., Flyvbjerg, B., Budzier, A. and Lunn, D. 2016. “Does infrastructure investment lead to economic growth or economic fragility? Evidence from China”, in Oxford Review of Economic Policy 32(3), pp. 360–390.
Arce Alvarado, R. 2016. “Mercado Común Centroamericano y República Popular China: Retos del vínculo commercial de cara a la integración del MCCA”, in E. Dussel Peters: ¿Participa China en la integración o desintegración comercial de China? (Mexico, Red ALC–China, UDUAL and UNAM/Cechimex), pp. 97–140.
Armony, A. C. and Velásquez, N. 2015. “Anti-Chinese sentiment in Latin America: An analysis of online discourse”, in Journal of Chinese Political Science, 20(3), pp. 319–346.
Bertranou, F., Casanova, L., Jiménez, M. and Jiménez, M. 2013. Informalidad, calidad del empleo y segmentación laboral en Argentina. (ILO Country Office for Argen-tina, Buenos Aires).
Bittencourt, G. et al. (coords.). 2012. El impacto de China en América Latina: Comercio e inversiones. (Montevideo, Red Mercosur).
Boakye, K. andLi, Y. 2015. “The impact of chinese FDI on employment generation in the building and construction sector of Ghana, in Eurasian Journal of Social Sciences, 3(2), pp. 1–15.
CAITEC (Chinese Academy of International Trade and Economic Cooperation), MOFCOM (Ministry of Commerce) and UNDP (United Nations Development Programme China). 2015. Report on the sustainable development of Chinese enterprises overseas. (Beijing, CAITEC, MOFCOM and UNDP).
Cao, Y. 2015. “TPP Model opens a new phase of infrastructure construction of “One Belt One Road”, in International Project Contracting & Labour Service 5, pp. 32–33.
Carrillo, J. and Bensusán, G. 2016. “Metodologías para el estudio del impacto de las multinacionales relacionadas con el empleo y el trabajo en México”. (Mexico, ILO), September 21.
Effects of China on the quantity and quality of jobs in Latin America and the Caribbean
51
Carrillo, J. and Micheli, J. 2015. “The Globalization strategy of a Chinese multinational: Huawei in Mexico”, in Frontera Norte 28(56), pp. 35–58.
Castro, L., Olarreaga, M. and Saslavsky, D. 2007. “The impact of trade with China and India on Argentina’s manufacturing employment.” World Bank Policy Research Working Paper 4153, (Washington, D.C.).
CBBC (China-Brazil Business Council). 2013. Chinese investments in Brazil from 2007-2012: A review of recent trends. (Brazil, CBBC and Inter-American Development Bank).
CCICED (China Council for International Cooperation on Environment and Development). 2011. Investment, trade and environment: A report by the CCICED Taskforce on Investment, Trade and Environment. (Beijing).
CGIT (China Global Investment Tracker). 2017. CGIT, at: https://www.aei.org/china-glob-al-investment-tracker/.
Chen, T. and Pérez Ludeña, M. 2013. “Chinese foreign direct investment in Latin America and the Caribbean”, in Production Development 195 (ECLAC), pp. 1–30.
CLB (China Labour Bulletin). 2009. “Chinese construction workers protest in Trinidad and Tobago”. CLB, October 12.
Dai1, F. and Liu, R. 2015. “Gains or pains? – Effects of US–China trade on US employ-ment: Based on a WIOT analysis from 1995 to 2011”. Institute for Research on Labor and Employment. (Los Angeles, UCLA).
Díaz, R. 2016. “La nueva relación de América Latina y el Caribe con China: ¿Integración o desintegración regional? El caso de la CARICOM”, in E. Dussel Peters(coord.): La nueva relación comercial de América Latina y el Caribe con China: ¿inte-gración o desintegración regional? (Mexico, Red ALC–China, UDUAL and UNAM/Cechimex), pp. 141–194.
Dussel Peters, E. 2009. “The Mexican Case”, in, R. Jenkins and E. Dussel Peters (eds.): China and Latin America. Economic relations in the twenty-first century (Mexico, DIE and UNAM/CECHIMEX), pp. 279–394.
___ 2013. “Características de la inversión extranjera directa china en América Latina (2000-2011)”, in E. Dussel Peters (coord.): América Latina y el Caribe–China. Economía, comercio e inversiones (Mexico, Red ALC–China, UDUAL UNAM/Cechimex), pp. 171–202.
ILO AmericasTECHNICAL REPORTS 2017 /6
Effects of China on the quantity and quality of jobs in Latin America and the Caribbean
52
___ (coord.). 2014. La inversión extranjera directa de China en América Latina: 10 casos de estudio (México , Red ALC–China, UDUAL and UNAM/Cechimex).
___ 2015. “The omnipresent role of China’s public sector in its relationship with Latin America and the Caribbean”, in E. Dussel Peters, and A. Armony (eds.). Beyond raw materials. Who are the actors in the Latin America and Caribbean–China relationship? (Buenos Aires, Red ALC–China, Friedrich Ebert Stifung and University of Pittsburgh/CLAS), pp. 50–72.
___ 2016. La nueva relación comercial de América Latina y el Caribe con China: ¿integración o desintegración regional? (Mexico, Red ALC–China, UDUAL and UNAM/Cechimex).
___ Forthcoming. Hacia una estrategia para la atracción de IED china en México. (Banobras).
Dussel Peters, E. and Ortiz Velásquez, S. 2016. Monitor de la OFDI de China en México, in Monitor de la OFDI de China en ALC 1, pp. 1–49.
___ Forthcoming. Evolución estratégica en la relación entre América Latina y el Caribe y China (2000-2016): La relevancia de los proyectos de infraestructura de China. (Mexico, Red ALC-–).
ECLAC (Economic Commission for Latin America and the Caribbean). 2013. Chinese foreign direct investment in Latin America and the Caribbean. China–Latin America cross-council taskforce (Santiago)
___ 2015. First Forum of China and the Community of Latin American and Caribbean States (CELAC). Exploring opportunities for cooperation on trade and investment (Santiago).
___ 2016. Relaciones económicas entre América Latina y el Caribe y China. Opor-tunidades y desafíos (Santiago).
ECLAC/ILO. 2016. Employment situation in Latin America and the Caribbean: Global supply chains and decent work (Santiago) number 15 (October.
El Tiempo. 2013. “Retan a Ranel Silva a explicar entrega de El Cenizo y el CAT”. El Tiempo, October 7.
Galhardi, R. 2016. Measurement of the employment and labour-related impacts of MNEs: A proposal for action (Geneva, ILO).
Effects of China on the quantity and quality of jobs in Latin America and the Caribbean
53
Gallagher, K, Irwin, A. and Koleski, K. 2013. “¿Un mejor trato? Análisis comparativo de los préstamos chinos en América Latina” in Cuadernos de Trabajo del Cechimex 1, pp. 1–32.
Gallagher, K. P. and Porzecanski, R. 2008. “China Matters. China’s economic impact in Latin America”, in Latin American Research Review 43(1), pp. 185–200.
Granados Alcantar, J. A. and Vences Rivera, J. 2011. Construyendo un indicador para medir la calidad del empleo en el tiempo en las ciudades de México, in https://repository.uaeh.edu.mx/bitstream/bitstream/handle/123456789/1357
Gransow, B. 2015. “Chinese investment in Latin American infrastructure: Strategies, actors, and risks”, in E. Dussel Peters and A. C. Armony (coords.): Beyond raw materials. Who are the actors in the Latin America and Caribbean–China rela-tionship? (Buenos Aires, Red ALC–China, Friedrich Ebert Stiftung and University of Pittsburgh/CLAS), pp. 86–115.
Hanemann, T. 2012. “The employment impacts of Chinese investment in the United States”. East Asia Forum, Economics, Politics and Public Policy in East Asia and the Pacific.
He, J. and Mingsheng, J. 2015. “Analysis on opportunity and risk of Peru port infra-structure construction”, in China Harbour Engineering 35(5), pp. 66–70.
Hernández Cordero, Rubén. 2016. “El Banco Popular de China y su política crediticia”, in Cuadernos de Trabajo del Cechimex 2, pp. 1–24.
Hilaire, A. 2016. Aspects of Trinidad and Tobago’s Global Economic Interactions (Central Bank of Trinidad and Tobago).
Huang, Y. and Wang, B. 2011. “Chinese outward direct investment: Is there a China model?”, in China & World Economy 19(4), pp. 1–21.
___ 2013. “Investing overseas without moving factories abroad: The case of Chinese outward direct investment” in Asian Development Review 30 (1), pp. 85–107.
IADB (Inter-American Development Bank). 2016. “Made in Chi-LAT. Keys to renew the convergence between Latin America and China”, in Integration & Trade 40, pp. 1–170.
ILAB. 1978. "The impact of changes in manufacturing trade on sectoral employment patterns – Progress report". Office of Foreign Economic Research, Bureau of International Labor Affairs, U.S. Department of Labor, in Trade and Employment. National Commission for Manpower Policy, Special Report No. 30, November.
ILO AmericasTECHNICAL REPORTS 2017 /6
Effects of China on the quantity and quality of jobs in Latin America and the Caribbean
54
ILO (International Labour Organization). 2015a. Labour overview 2015. Latin America and the Caribbean (Lima, ILO Regional Office for Latin America and the Carib-bean).
___ 2015b. Thematic labour overview. Small enterprises, large gaps. Employment and working conditions inmMicro and small enterprises in Latin America and the Caribbean. (Lima).
___ 2016. World employment and social outlook: Trends 2016 (Geneva).
Jenkins, R. 2011. “El “efecto China” en los precios de los productos básicos y en el valor de las exportaciones de América Latina”, in Revista de la CEPAL 103, pp. 77–93.
Jenkins, R. and Dussel Peters, E. (coords.). 2009. China and Latin America. Economic relations in the twenty-first century (Bonn and Mexico, DIE, CECHIMEX/UNAM)
Jiménez Restrepo, D. M. and Páez Cortés, J. N. 2014. “Una medida alternativa para medir la calidad del empleo en Colombia (2008–2012)”, in Sociedad y economía No. 27, 2014, pp. 129–154.
Huang, M. and Ren, P. 2013. A study on the employment effect of Chinese invest-ment in South Africa (Stellenbosch, Stellenbosch University, Centre for Chinese Studies).
Kong, B. and Gallagher. K. 2016. The globalization of Chinese energy companies: The role of state finance. (Boston, Boston University/GEGI).
Kubny, J. and Voss, H. 2010. The impact of Chinese outward investment: Evidence from Cambodia and Vietnam. Discussion Paper (Bonn, Deutsches Institut für Entwicklungspolitik).
Li, T., Yang, W., Yang, Z., Liu, Y. and Cao, X. 2014. “New patterns and practices for overseas regional development of China under the background of global strategy: A case study of the integrated development of transportationiInfrastructure and land space along the Tehuantepec in Mexico”, in Journal of Land Economics 2, pp. 109–125.
Li, Y. and Li, M. 2016. “The Impact of Japan in the Process of China´s High-Speed Rail Export”, in Northeast Asia Forum 5, pp. 16–27.
Lin, Y. 2013. “Inversión extranjera directa de China en América Latina”, in E. Dussel Peters (coord.). América Latina y el Caribe–China. Economía, comercio e inver-siones (Mexico, Red ALC–CHINA, UDUAL, UNAM/Cechimex), pp. 203–222.
Effects of China on the quantity and quality of jobs in Latin America and the Caribbean
55
Liste, J. and Kolster, J. 2012. Chinese investments and employment creation in Algeria and Egypt (African Development Bank, Economic Brief).
Liu, X, Qin, G. and Lu, F. 2015. “Remedy or Poison: Impacts of China´s Outward Direct Investment on its Exports”, in China & World Economy 23(6), pp. 100–120.
Long, G. 2015. “One Belt, One Road”: A New Vision for Open, Inclusive Regional Cooperation”, in Cuadernos de Trabajo del Cechimex 4, pp. 1–8.
López, A., Ramos, D. and Starobinsky, G. 2010. “A study of the impact of China’s global expansion on Argentina: Soybean value chain analysis”, in Cuadernos de Trabajo del Cechimex 2, pp. 1–28.
López Arévalo, J. A., Rodil Marzábal, O. and Valdéz Gastelum, S. 2014. “La irrupción de China en el TLCAN. Efectos sobre el comercio intraindustrial de México”, in Economía UNAM 11(31), pp. 84–113.
MOFCOM (Ministry of Commerce). 2016a. 2015 Statistical Bulletin of Outward Foreign Direct Investment (Beijing).
___ 2016b. Regular Press Conference of the Ministry of Commerce on 17 May, 2016. (Beijing).
___ 2016c. Regular Press Conference of the Ministry of Commerce on 17 August, 2016. (Beijing).
Monitor of China’s OFDI in LAC. 2016. Red ALC–China, at:, http://www.redalc-china.org/monitor/.
OECD (Organisation for Economic Co-operation and Development), CAF and ECLAC. 2015. Perspectivas económicas de América Latina 2016 (Paris).
Pan, X. 2015. “How to manage political risks of overseas infrastructure investment inspired by the high speed rail case in Mexico”, in Journal of International Economic Cooperation 3, pp. 76–79.
Pellandra, A. Forthcoming. Los efectos sociales del comercio con China en las regiones chilenas, 2003-2013: ¿Beneficio o maldición? (Red ALC–China).
Portes, A. and Armony, A.C. 2016. “Rescatando valores ancestrales y creando nuevos lazos: El transnacionalismo chino en América Latina”, in: Migración y Desarrollo 14(26). pp. 3–23.
Roldán Pérez, A., Castro Lara, A. S. and Pérez Restrepo, C.A. (coords.). 2016. La pres-encia de China en América Latina. Comercio, inversión y cooperación económica (Medellín, Universidad EAFIT).
ILO AmericasTECHNICAL REPORTS 2017 /6
Effects of China on the quantity and quality of jobs in Latin America and the Caribbean
56
Sinkala, M. and Zhou, W. 2014. “Chinese FDI and employment creation in Zambia”, in Journal of Economics and Sustainable Development Vol.5, No.23, pp. 39–44.
Trápaga Delfín, Y. 2015. “¿Qué tan sustentables son las “ciudades sustentables”? Los casos de Tianjin y Curitiba, In Y. Trápaga Delfín (coord.): América Latina y el Caribe y China. Recursos naturales y medio ambiente 2015 (Mexico, Red ALC–China, UDUAL and UNAM/Cechimex), pp. 55–78.
Wang, Q. 2015. “Unconventional risk of Asian infrastructure investment and how to respond”, in Journal of International Economic Cooperation 8, pp. 84–88.
Wang, B. and Huang, Y. 2012. “Industry and ownership structure of Chinese over-seas direct investment”, in The Roundtable and Public Forum, China’s Global Investment. Crawford School of Public Policy, Australian National University, September 4–5.
Wang, Y., Zadek, S., Yu, K., Halle, M., Ortiz Velásquez, S., Zhang, L. and Wang, H. 2016. Sustainability impacts of Chinese outward direct investment: A review of the literature. IISD Report. Prepared as a contribution to the project on Promoting Sustainable Development of Chinese Enterprises for “Going Out” (Winnipeg, Manitoba, IISD).WB/DRC (World Bank and Development Research Center of the State Council). 2012. China 2030. Building a modern, harmonious, and creative high-income society (Washington, D.C.).
Wu, H. 2010. “Treinta años de relaciones de China y México como socios estratégicos: Desarrollo económico y social”, in, E. Dussel Peters and Y. Trápaga Delfín (coords.). Hacia un diálogo entre México y China. Dos y tres décadas de cambios socioeconómicos (Chamber of Senators, UNAM/CECHIMEX, CICIR and Friedrich Ebert Foundation), pp. 9–38.
Wu, C. 2013. “U.S.–Mexico–China relations in the context of regional cooperation. A Chinese perspective”, in E. Dussel Peters, A. H. Hearn and H. Shaiken (coords.),: China and the new triangular relationships in the Americas. China and the future of US–Mexico relations. (Mexico, University of Miami, University of California/Berkeley, UNAM/CECHIMEX), pp. 67–72.
Xie, W. 2016. “Medium to high rate growth of China’s economy and the economic and trade cooperation between China and Latin America”, in Journal of Latin American Studies 4, pp. 42–58.
Yang, Z. 2012. “Cooperación económica y comercial entre China y México: elevando el nivel desde una óptica estratégica”, in E. Dussel Peters (coord.): 40 años de
Effects of China on the quantity and quality of jobs in Latin America and the Caribbean
57
la relación entre México y China. Acuerdos, desencuentros y futuro (UNAM/CECHIMEX, Senate of the Republic and CICIR), pp. 107–119.
Zhang, L. 2015. “An assessment of the development environment of PPP projects in Latin America”, in International Project Contracting & Labour Service 10, pp. 24–26.
Zhang, X. and Gang, L. 2010. “China’s international trade in post-crisis era”, in China Development Forum 2010 (DRC), pp. 89–112.
Zhang, X., Qi, Z, Gang, L and Hongqiang, X. 2010. “International Investment of China in Post-Crisis Era”, in China Development Forum 2010 (DRC), pp. 113–135.
Zhang, Y. 2011. “Situación general y el futuro de la macroeconomía china”, in Cuad-ernos de Trabajo del Cechimex 2011-2.

Effects of China on the quantity and quality of jobs in Latin America and the Caribbean
59
Annex
Effects of exports and imports from China on Argentina, Brazil, Chile and Mexico
Description of methodology and dataThe effects of the trade between China and Mexico on employment in the latter are estimated by using a variant of the structural decomposition analysis based on data of the input-output matrices (IOM), where imported inputs are separated from domestic ones according to their inter-industrial uses.34 This model disaggregates the driving factors of employment growth into: (i) effects of changes on final consumption; (ii) effects of changes on investment; (iii) effects of changes on exports; (iv) effects of changes on production technology; (v) effects of structural changes on intermediate imports; (vi) effects of structural changes on final imports; and (vii) effects of changes on labour productivity.
The IOM for every country are taken from the Input-Output Tables (IOTs) published by the OECD in December 2015. For intermediate and final bilateral trade between Mexico and China, data are taken from the Inter-Country Input-Output (ICIO) Tables, which are related to the trade data on final goods and services among countries of the OECD STAN Bilateral Trade by Industry and End-use category (BTDIxE).
The matrix notation is as follows:
The basic input-output equation35 is given by PB = APB + Y, where:
PB = (x1, ..., xn) is the vector of gross production, Aij is the matrix of technical coeffi-cients, and Y = (y1, ..., yn) is the vector of final demand.
From the equation above, the gross production can be reformulated as:
PB = (I – A)−1Y
[1.]
34 Non-competitive IOM.
35 The expression is usually X=AX+Y, but in this work X is replaced with PB so as not to confuse it with exports.
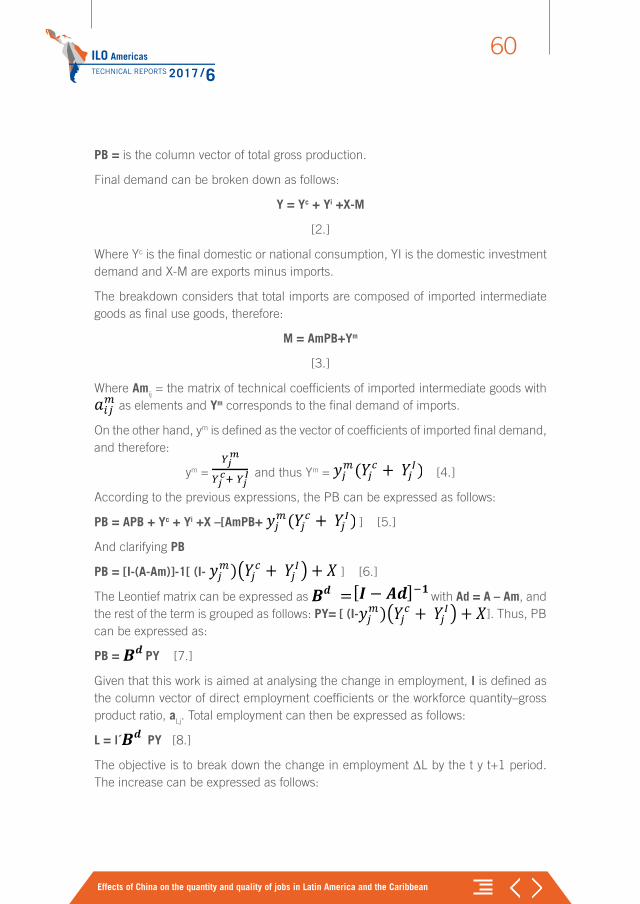
ILO AmericasTECHNICAL REPORTS 2017 /6
Effects of China on the quantity and quality of jobs in Latin America and the Caribbean
60
PB = is the column vector of total gross production.
Final demand can be broken down as follows:
Y = Yc + Yi +X-M
[2.]
Where Yc is the final domestic or national consumption, YI is the domestic investment demand and X-M are exports minus imports.
The breakdown considers that total imports are composed of imported intermediate goods as final use goods, therefore:
M = AmPB+Ym
[3.]
Where Amij = the matrix of technical coefficients of imported intermediate goods with as elements and Ym corresponds to the final demand of imports.
On the other hand, ym is defined as the vector of coefficients of imported final demand, and therefore:
ym = and thus Ym = [4.]
According to the previous expressions, the PB can be expressed as follows:
PB = APB + Yc + Yi +X –[AmPB+ ] [5.]
And clarifying PB
PB = [I-(A-Am)]-1[ (I- ] [6.]
The Leontief matrix can be expressed as with Ad = A – Am, and the rest of the term is grouped as follows: PY= [ (I- ]. Thus, PB can be expressed as:
PB = PY [7.]
Given that this work is aimed at analysing the change in employment, l is defined as the column vector of direct employment coefficients or the workforce quantity–gross product ratio, aLj. Total employment can then be expressed as follows:
L = l´ PY [8.]
The objective is to break down the change in employment ΔL by the t y t+1 period. The increase can be expressed as follows:
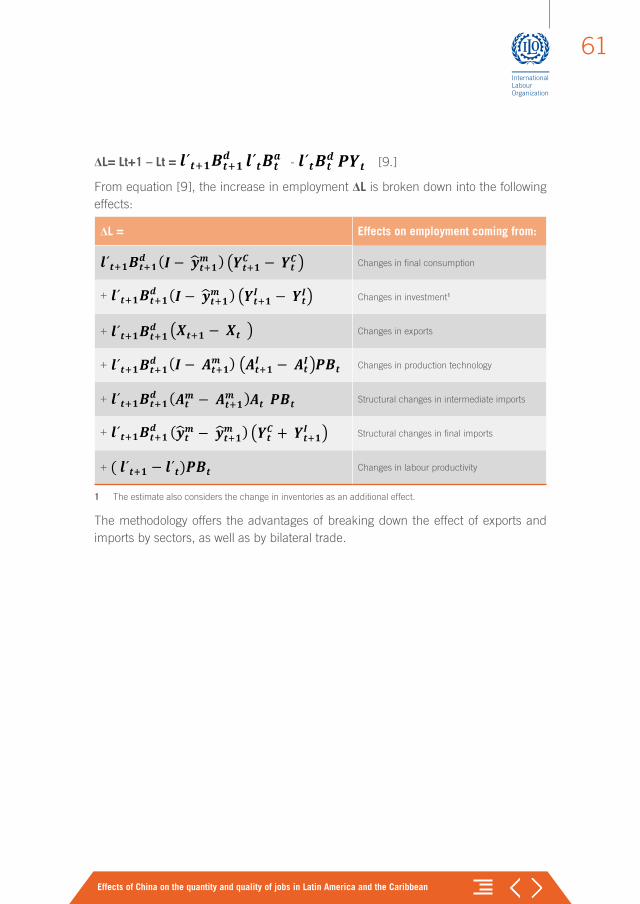
Effects of China on the quantity and quality of jobs in Latin America and the Caribbean
61
ΔL= Lt+1 – Lt = - [9.]
From equation [9], the increase in employment ΔL is broken down into the following effects:
ΔL = Effects on employment coming from:
Changes in final consumption
+ Changes in investment1
+ Changes in exports
+ Changes in production technology
+ Structural changes in intermediate imports
+ Structural changes in final imports
+ Changes in labour productivity
1 The estimate also considers the change in inventories as an additional effect.
The methodology offers the advantages of breaking down the effect of exports and imports by sectors, as well as by bilateral trade.
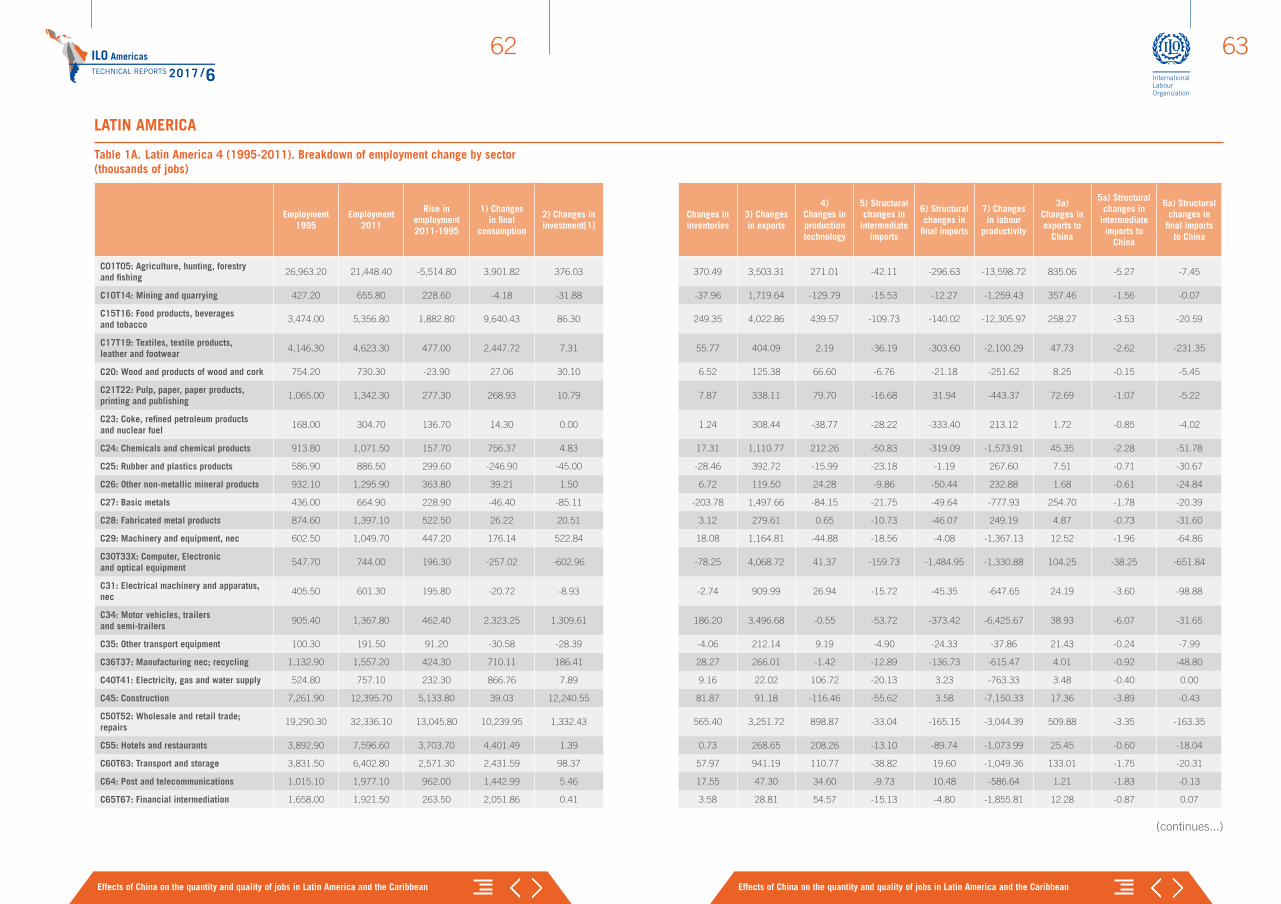
ILO AmericasTECHNICAL REPORTS 2017 /6
Effects of China on the quantity and quality of jobs in Latin America and the Caribbean Effects of China on the quantity and quality of jobs in Latin America and the Caribbean
6362
Table 1A. Latin America 4 (1995-2011). Breakdown of employment change by sector (thousands of jobs)
Employment 1995
Employment 2011
Rise in employment 2011-1995
1) Changes in final
consumption
2) Changes in investment[1]
Changes in inventories
3) Changes in exports
4) Changes in production technology
5) Structural changes in
intermediate imports
6) Structural changes in
final imports
7) Changes in labour
productivity
3a) Changes in exports to
China
5a) Structural changes in
intermediate imports to
China
6a) Structural changes in
final imports to China
C01T05: Agriculture, hunting, forestry and fishing
26,963.20 21,448.40 -5,514.80 3,901.82 376.03 370.49 3,503.31 271.01 -42.11 -296.63 -13,598.72 835.06 -5.27 -7.45
C10T14: Mining and quarrying 427.20 655.80 228.60 -4.18 -31.88 -37.96 1,719.64 -129.79 -15.53 -12.27 -1,259.43 357.46 -1.56 -0.07
C15T16: Food products, beverages and tobacco
3,474.00 5,356.80 1,882.80 9,640.43 86.30 249.35 4,022.86 439.57 -109.73 -140.02 -12,305.97 258.27 -3.53 -20.59
C17T19: Textiles, textile products, leather and footwear
4,146.30 4,623.30 477.00 2,447.72 7.31 55.77 404.09 2.19 -36.19 -303.60 -2,100.29 47.73 -2.62 -231.35
C20: Wood and products of wood and cork 754.20 730.30 -23.90 27.06 30.10 6.52 125.38 66.60 -6.76 -21.18 -251.62 8.25 -0.15 -5.45
C21T22: Pulp, paper, paper products, printing and publishing
1,065.00 1,342.30 277.30 268.93 10.79 7.87 338.11 79.70 -16.68 31.94 -443.37 72.69 -1.07 -5.22
C23: Coke, refined petroleum products and nuclear fuel
168.00 304.70 136.70 14.30 0.00 1.24 308.44 -38.77 -28.22 -333.40 213.12 1.72 -0.85 -4.02
C24: Chemicals and chemical products 913.80 1,071.50 157.70 756.37 4.83 17.31 1,110.77 212.26 -50.83 -319.09 -1,573.91 45.35 -2.28 -51.78
C25: Rubber and plastics products 586.90 886.50 299.60 -246.90 -45.00 -28.46 392.72 -15.99 -23.18 -1.19 267.60 7.51 -0.71 -30.67
C26: Other non-metallic mineral products 932.10 1,295.90 363.80 39.21 1.50 6.72 119.50 24.28 -9.86 -50.44 232.88 1.68 -0.61 -24.84
C27: Basic metals 436.00 664.90 228.90 -46.40 -85.11 -203.78 1,497.66 -84.15 -21.75 -49.64 -777.93 254.70 -1.78 -20.39
C28: Fabricated metal products 874.60 1,397.10 522.50 26.22 20.51 3.12 279.61 0.65 -10.73 -46.07 249.19 4.87 -0.73 -31.60
C29: Machinery and equipment, nec 602.50 1,049.70 447.20 176.14 522.84 18.08 1,164.81 -44.88 -18.56 -4.08 -1,367.13 12.52 -1.96 -64.86
C30T33X: Computer, Electronic and optical equipment
547.70 744.00 196.30 -257.02 -602.96 -78.25 4,068.72 41.37 -159.73 -1,484.95 -1,330.88 104.25 -38.25 -651.84
C31: Electrical machinery and apparatus, nec
405.50 601.30 195.80 -20.72 -8.93 -2.74 909.99 26.94 -15.72 -45.35 -647.65 24.19 -3.60 -98.88
C34: Motor vehicles, trailers and semi-trailers
905.40 1,367.80 462.40 2,323.25 1,309.61 186.20 3,496.68 -0.55 -53.72 -373.42 -6,425.67 38.93 -6.07 -31.65
C35: Other transport equipment 100.30 191.50 91.20 -30.58 -28.39 -4.06 212.14 9.19 -4.90 -24.33 -37.86 21.43 -0.24 -7.99
C36T37: Manufacturing nec; recycling 1,132.90 1,557.20 424.30 710.11 186.41 28.27 266.01 -1.42 -12.89 -136.73 -615.47 4.01 -0.92 -48.80
C40T41: Electricity, gas and water supply 524.80 757.10 232.30 866.76 7.89 9.16 22.02 106.72 -20.13 3.23 -763.33 3.48 -0.40 0.00
C45: Construction 7,261.90 12,395.70 5,133.80 39.03 12,240.55 81.87 91.18 -116.46 -55.62 3.58 -7,150.33 17.36 -3.89 -0.43
C50T52: Wholesale and retail trade; repairs
19,290.30 32,336.10 13,045.80 10,239.95 1,332.43 565.40 3,251.72 898.87 -33.04 -165.15 -3,044.39 509.88 -3.35 -163.35
C55: Hotels and restaurants 3,892.90 7,596.60 3,703.70 4,401.49 1.39 0.73 268.65 208.26 -13.10 -89.74 -1,073.99 25.45 -0.60 -18.04
C60T63: Transport and storage 3,831.50 6,402.80 2,571.30 2,431.59 98.37 57.97 941.19 110.77 -38.82 19.60 -1,049.36 133.01 -1.75 -20.31
C64: Post and telecommunications 1,015.10 1,977.10 962.00 1,442.99 5.46 17.55 47.30 34.60 -9.73 10.48 -586.64 1.21 -1.83 -0.13
C65T67: Financial intermediation 1,658.00 1,921.50 263.50 2,051.86 0.41 3.58 28.81 54.57 -15.13 -4.80 -1,855.81 12.28 -0.87 0.07
(continues...)
LATIN AMERICA
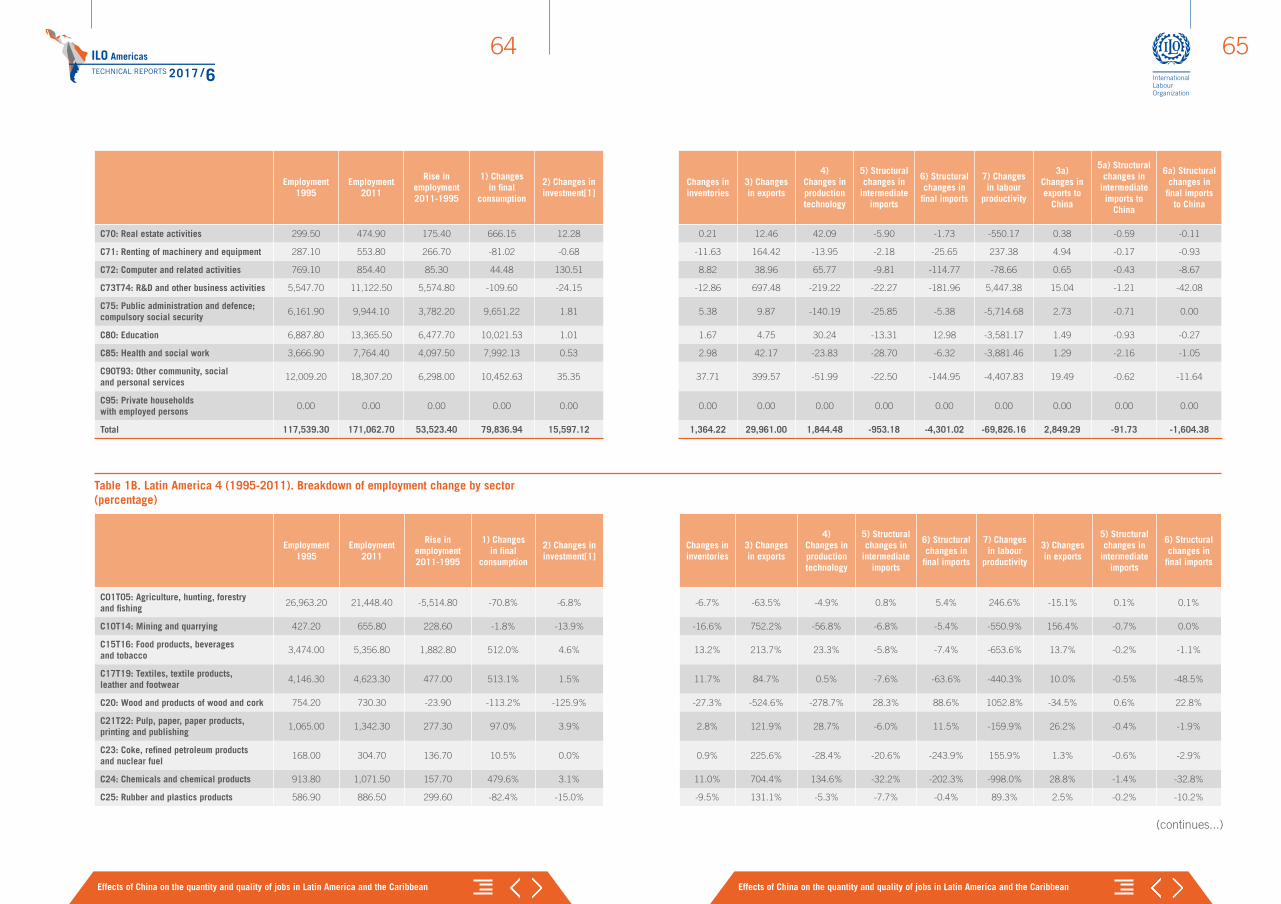
ILO AmericasTECHNICAL REPORTS 2017 /6
Effects of China on the quantity and quality of jobs in Latin America and the Caribbean Effects of China on the quantity and quality of jobs in Latin America and the Caribbean
6564
Employment 1995
Employment 2011
Rise in employment 2011-1995
1) Changes in final
consumption
2) Changes in investment[1]
Changes in inventories
3) Changes in exports
4) Changes in production technology
5) Structural changes in
intermediate imports
6) Structural changes in
final imports
7) Changes in labour
productivity
3a) Changes in exports to
China
5a) Structural changes in
intermediate imports to
China
6a) Structural changes in
final imports to China
C70: Real estate activities 299.50 474.90 175.40 666.15 12.28 0.21 12.46 42.09 -5.90 -1.73 -550.17 0.38 -0.59 -0.11
C71: Renting of machinery and equipment 287.10 553.80 266.70 -81.02 -0.68 -11.63 164.42 -13.95 -2.18 -25.65 237.38 4.94 -0.17 -0.93
C72: Computer and related activities 769.10 854.40 85.30 44.48 130.51 8.82 38.96 65.77 -9.81 -114.77 -78.66 0.65 -0.43 -8.67
C73T74: R&D and other business activities 5,547.70 11,122.50 5,574.80 -109.60 -24.15 -12.86 697.48 -219.22 -22.27 -181.96 5,447.38 15.04 -1.21 -42.08
C75: Public administration and defence; compulsory social security
6,161.90 9,944.10 3,782.20 9,651.22 1.81 5.38 9.87 -140.19 -25.85 -5.38 -5,714.68 2.73 -0.71 0.00
C80: Education 6,887.80 13,365.50 6,477.70 10,021.53 1.01 1.67 4.75 30.24 -13.31 12.98 -3,581.17 1.49 -0.93 -0.27
C85: Health and social work 3,666.90 7,764.40 4,097.50 7,992.13 0.53 2.98 42.17 -23.83 -28.70 -6.32 -3,881.46 1.29 -2.16 -1.05
C90T93: Other community, social and personal services
12,009.20 18,307.20 6,298.00 10,452.63 35.35 37.71 399.57 -51.99 -22.50 -144.95 -4,407.83 19.49 -0.62 -11.64
C95: Private households with employed persons
0.00 0.00 0.00 0.00 0.00 0.00 0.00 0.00 0.00 0.00 0.00 0.00 0.00 0.00
Total 117,539.30 171,062.70 53,523.40 79,836.94 15,597.12 1,364.22 29,961.00 1,844.48 -953.18 -4,301.02 -69,826.16 2,849.29 -91.73 -1,604.38
Table 1B. Latin America 4 (1995-2011). Breakdown of employment change by sector (percentage)
Employment 1995
Employment 2011
Rise in employment 2011-1995
1) Changes in final
consumption
2) Changes in investment[1]
Changes in inventories
3) Changes in exports
4) Changes in production technology
5) Structural changes in
intermediate imports
6) Structural changes in
final imports
7) Changes in labour
productivity
3) Changes in exports
5) Structural changes in
intermediate imports
6) Structural changes in
final imports
C01T05: Agriculture, hunting, forestry and fishing
26,963.20 21,448.40 -5,514.80 -70.8% -6.8% -6.7% -63.5% -4.9% 0.8% 5.4% 246.6% -15.1% 0.1% 0.1%
C10T14: Mining and quarrying 427.20 655.80 228.60 -1.8% -13.9% -16.6% 752.2% -56.8% -6.8% -5.4% -550.9% 156.4% -0.7% 0.0%
C15T16: Food products, beverages and tobacco
3,474.00 5,356.80 1,882.80 512.0% 4.6% 13.2% 213.7% 23.3% -5.8% -7.4% -653.6% 13.7% -0.2% -1.1%
C17T19: Textiles, textile products, leather and footwear
4,146.30 4,623.30 477.00 513.1% 1.5% 11.7% 84.7% 0.5% -7.6% -63.6% -440.3% 10.0% -0.5% -48.5%
C20: Wood and products of wood and cork 754.20 730.30 -23.90 -113.2% -125.9% -27.3% -524.6% -278.7% 28.3% 88.6% 1052.8% -34.5% 0.6% 22.8%
C21T22: Pulp, paper, paper products, printing and publishing
1,065.00 1,342.30 277.30 97.0% 3.9% 2.8% 121.9% 28.7% -6.0% 11.5% -159.9% 26.2% -0.4% -1.9%
C23: Coke, refined petroleum products and nuclear fuel
168.00 304.70 136.70 10.5% 0.0% 0.9% 225.6% -28.4% -20.6% -243.9% 155.9% 1.3% -0.6% -2.9%
C24: Chemicals and chemical products 913.80 1,071.50 157.70 479.6% 3.1% 11.0% 704.4% 134.6% -32.2% -202.3% -998.0% 28.8% -1.4% -32.8%
C25: Rubber and plastics products 586.90 886.50 299.60 -82.4% -15.0% -9.5% 131.1% -5.3% -7.7% -0.4% 89.3% 2.5% -0.2% -10.2%
(continues...)
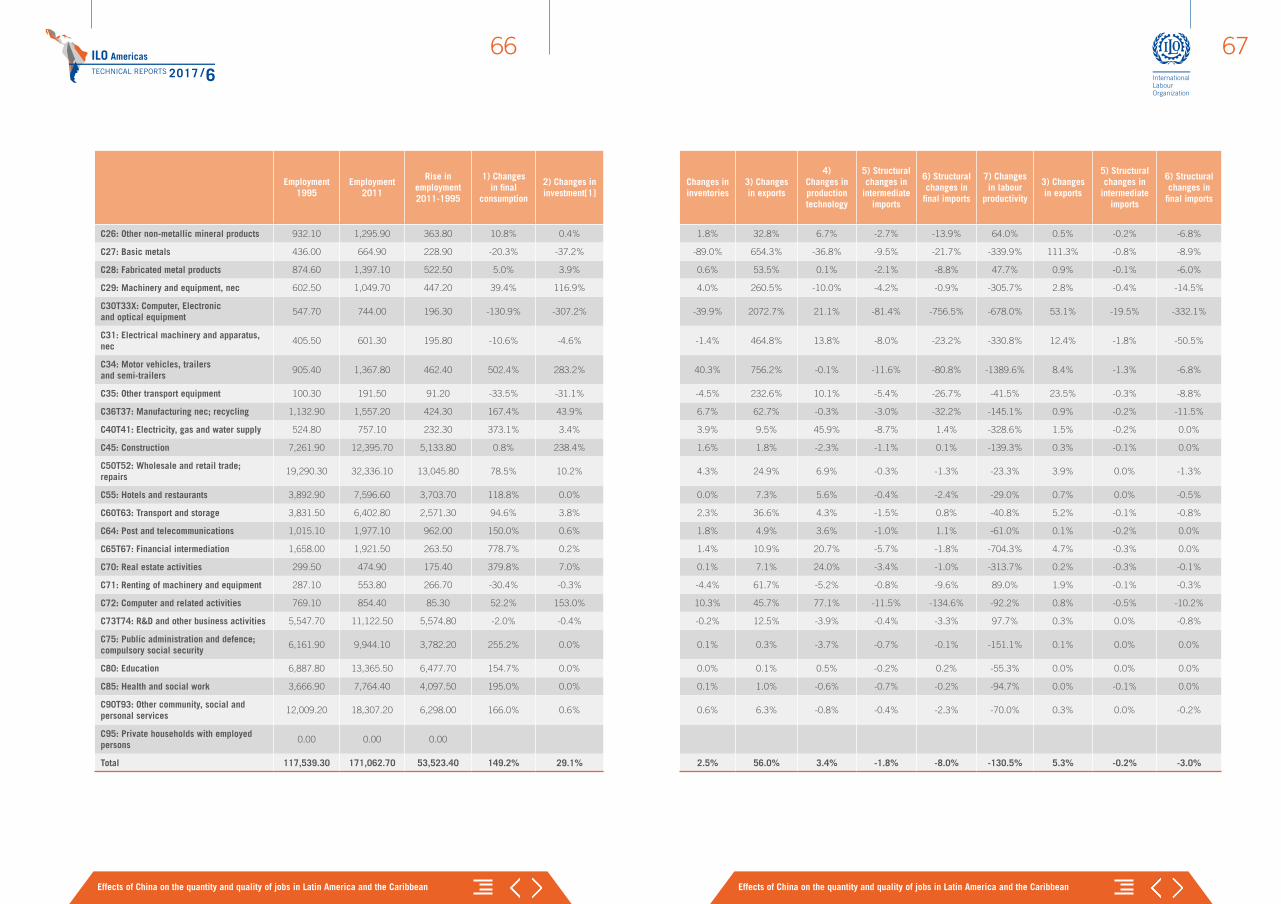
ILO AmericasTECHNICAL REPORTS 2017 /6
Effects of China on the quantity and quality of jobs in Latin America and the Caribbean Effects of China on the quantity and quality of jobs in Latin America and the Caribbean
6766
Employment 1995
Employment 2011
Rise in employment 2011-1995
1) Changes in final
consumption
2) Changes in investment[1]
Changes in inventories
3) Changes in exports
4) Changes in production technology
5) Structural changes in
intermediate imports
6) Structural changes in
final imports
7) Changes in labour
productivity
3) Changes in exports
5) Structural changes in
intermediate imports
6) Structural changes in
final imports
C26: Other non-metallic mineral products 932.10 1,295.90 363.80 10.8% 0.4% 1.8% 32.8% 6.7% -2.7% -13.9% 64.0% 0.5% -0.2% -6.8%
C27: Basic metals 436.00 664.90 228.90 -20.3% -37.2% -89.0% 654.3% -36.8% -9.5% -21.7% -339.9% 111.3% -0.8% -8.9%
C28: Fabricated metal products 874.60 1,397.10 522.50 5.0% 3.9% 0.6% 53.5% 0.1% -2.1% -8.8% 47.7% 0.9% -0.1% -6.0%
C29: Machinery and equipment, nec 602.50 1,049.70 447.20 39.4% 116.9% 4.0% 260.5% -10.0% -4.2% -0.9% -305.7% 2.8% -0.4% -14.5%
C30T33X: Computer, Electronic and optical equipment
547.70 744.00 196.30 -130.9% -307.2% -39.9% 2072.7% 21.1% -81.4% -756.5% -678.0% 53.1% -19.5% -332.1%
C31: Electrical machinery and apparatus, nec
405.50 601.30 195.80 -10.6% -4.6% -1.4% 464.8% 13.8% -8.0% -23.2% -330.8% 12.4% -1.8% -50.5%
C34: Motor vehicles, trailers and semi-trailers
905.40 1,367.80 462.40 502.4% 283.2% 40.3% 756.2% -0.1% -11.6% -80.8% -1389.6% 8.4% -1.3% -6.8%
C35: Other transport equipment 100.30 191.50 91.20 -33.5% -31.1% -4.5% 232.6% 10.1% -5.4% -26.7% -41.5% 23.5% -0.3% -8.8%
C36T37: Manufacturing nec; recycling 1,132.90 1,557.20 424.30 167.4% 43.9% 6.7% 62.7% -0.3% -3.0% -32.2% -145.1% 0.9% -0.2% -11.5%
C40T41: Electricity, gas and water supply 524.80 757.10 232.30 373.1% 3.4% 3.9% 9.5% 45.9% -8.7% 1.4% -328.6% 1.5% -0.2% 0.0%
C45: Construction 7,261.90 12,395.70 5,133.80 0.8% 238.4% 1.6% 1.8% -2.3% -1.1% 0.1% -139.3% 0.3% -0.1% 0.0%
C50T52: Wholesale and retail trade; repairs
19,290.30 32,336.10 13,045.80 78.5% 10.2% 4.3% 24.9% 6.9% -0.3% -1.3% -23.3% 3.9% 0.0% -1.3%
C55: Hotels and restaurants 3,892.90 7,596.60 3,703.70 118.8% 0.0% 0.0% 7.3% 5.6% -0.4% -2.4% -29.0% 0.7% 0.0% -0.5%
C60T63: Transport and storage 3,831.50 6,402.80 2,571.30 94.6% 3.8% 2.3% 36.6% 4.3% -1.5% 0.8% -40.8% 5.2% -0.1% -0.8%
C64: Post and telecommunications 1,015.10 1,977.10 962.00 150.0% 0.6% 1.8% 4.9% 3.6% -1.0% 1.1% -61.0% 0.1% -0.2% 0.0%
C65T67: Financial intermediation 1,658.00 1,921.50 263.50 778.7% 0.2% 1.4% 10.9% 20.7% -5.7% -1.8% -704.3% 4.7% -0.3% 0.0%
C70: Real estate activities 299.50 474.90 175.40 379.8% 7.0% 0.1% 7.1% 24.0% -3.4% -1.0% -313.7% 0.2% -0.3% -0.1%
C71: Renting of machinery and equipment 287.10 553.80 266.70 -30.4% -0.3% -4.4% 61.7% -5.2% -0.8% -9.6% 89.0% 1.9% -0.1% -0.3%
C72: Computer and related activities 769.10 854.40 85.30 52.2% 153.0% 10.3% 45.7% 77.1% -11.5% -134.6% -92.2% 0.8% -0.5% -10.2%
C73T74: R&D and other business activities 5,547.70 11,122.50 5,574.80 -2.0% -0.4% -0.2% 12.5% -3.9% -0.4% -3.3% 97.7% 0.3% 0.0% -0.8%
C75: Public administration and defence; compulsory social security
6,161.90 9,944.10 3,782.20 255.2% 0.0% 0.1% 0.3% -3.7% -0.7% -0.1% -151.1% 0.1% 0.0% 0.0%
C80: Education 6,887.80 13,365.50 6,477.70 154.7% 0.0% 0.0% 0.1% 0.5% -0.2% 0.2% -55.3% 0.0% 0.0% 0.0%
C85: Health and social work 3,666.90 7,764.40 4,097.50 195.0% 0.0% 0.1% 1.0% -0.6% -0.7% -0.2% -94.7% 0.0% -0.1% 0.0%
C90T93: Other community, social and personal services
12,009.20 18,307.20 6,298.00 166.0% 0.6% 0.6% 6.3% -0.8% -0.4% -2.3% -70.0% 0.3% 0.0% -0.2%
C95: Private households with employed persons
0.00 0.00 0.00
Total 117,539.30 171,062.70 53,523.40 149.2% 29.1% 2.5% 56.0% 3.4% -1.8% -8.0% -130.5% 5.3% -0.2% -3.0%
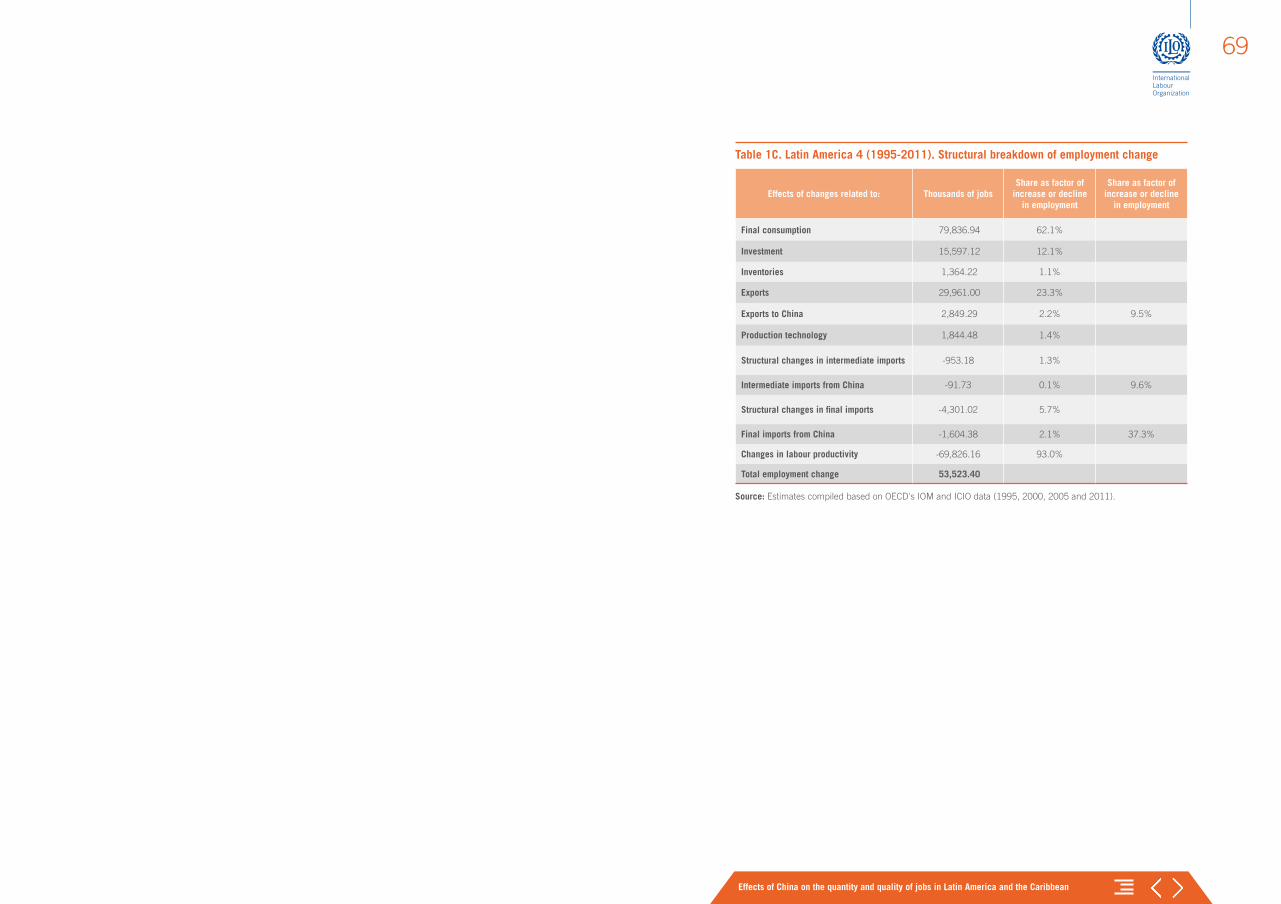
Effects of China on the quantity and quality of jobs in Latin America and the Caribbean
69
Table 1C. Latin America 4 (1995-2011). Structural breakdown of employment change
Effects of changes related to: Thousands of jobsShare as factor of
increase or decline in employment
Share as factor of increase or decline
in employment
Final consumption 79,836.94 62.1%
Investment 15,597.12 12.1%
Inventories 1,364.22 1.1%
Exports 29,961.00 23.3%
Exports to China 2,849.29 2.2% 9.5%
Production technology 1,844.48 1.4%
Structural changes in intermediate imports -953.18 1.3%
Intermediate imports from China -91.73 0.1% 9.6%
Structural changes in final imports -4,301.02 5.7%
Final imports from China -1,604.38 2.1% 37.3%
Changes in labour productivity -69,826.16 93.0%
Total employment change 53,523.40
Source: Estimates compiled based on OECD's IOM and ICIO data (1995, 2000, 2005 and 2011).
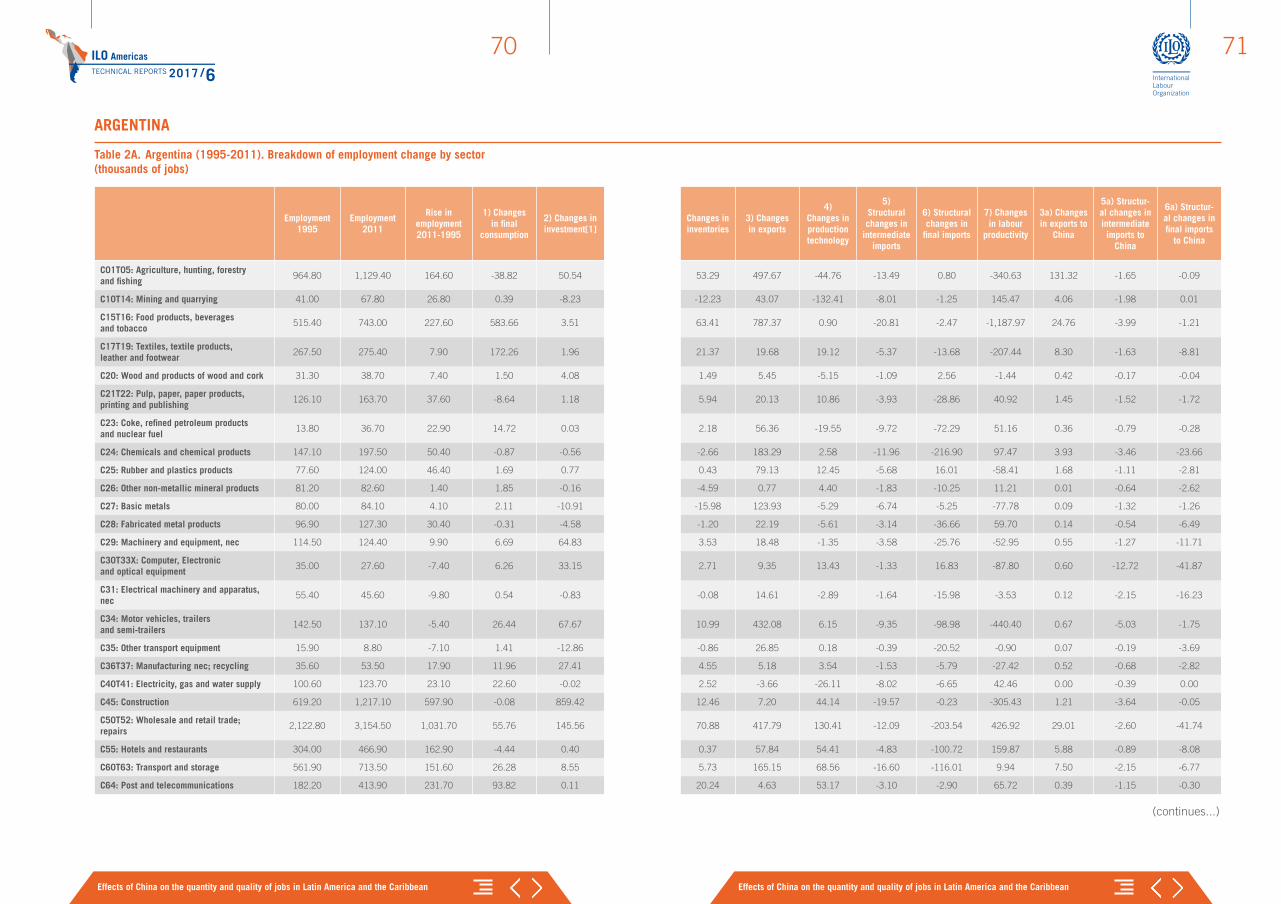
ILO AmericasTECHNICAL REPORTS 2017 /6
Effects of China on the quantity and quality of jobs in Latin America and the Caribbean Effects of China on the quantity and quality of jobs in Latin America and the Caribbean
7170
Table 2A. Argentina (1995-2011). Breakdown of employment change by sector (thousands of jobs)
Employment 1995
Employment 2011
Rise in employment 2011-1995
1) Changes in final
consumption
2) Changes in investment[1]
Changes in inventories
3) Changes in exports
4) Changes in production technology
5) Structural changes in
intermediate imports
6) Structural changes in
final imports
7) Changes in labour
productivity
3a) Changes in exports to
China
5a) Structur-al changes in intermediate imports to
China
6a) Structur-al changes in final imports
to China
C01T05: Agriculture, hunting, forestry and fishing
964.80 1,129.40 164.60 -38.82 50.54 53.29 497.67 -44.76 -13.49 0.80 -340.63 131.32 -1.65 -0.09
C10T14: Mining and quarrying 41.00 67.80 26.80 0.39 -8.23 -12.23 43.07 -132.41 -8.01 -1.25 145.47 4.06 -1.98 0.01
C15T16: Food products, beverages and tobacco
515.40 743.00 227.60 583.66 3.51 63.41 787.37 0.90 -20.81 -2.47 -1,187.97 24.76 -3.99 -1.21
C17T19: Textiles, textile products, leather and footwear
267.50 275.40 7.90 172.26 1.96 21.37 19.68 19.12 -5.37 -13.68 -207.44 8.30 -1.63 -8.81
C20: Wood and products of wood and cork 31.30 38.70 7.40 1.50 4.08 1.49 5.45 -5.15 -1.09 2.56 -1.44 0.42 -0.17 -0.04
C21T22: Pulp, paper, paper products, printing and publishing
126.10 163.70 37.60 -8.64 1.18 5.94 20.13 10.86 -3.93 -28.86 40.92 1.45 -1.52 -1.72
C23: Coke, refined petroleum products and nuclear fuel
13.80 36.70 22.90 14.72 0.03 2.18 56.36 -19.55 -9.72 -72.29 51.16 0.36 -0.79 -0.28
C24: Chemicals and chemical products 147.10 197.50 50.40 -0.87 -0.56 -2.66 183.29 2.58 -11.96 -216.90 97.47 3.93 -3.46 -23.66
C25: Rubber and plastics products 77.60 124.00 46.40 1.69 0.77 0.43 79.13 12.45 -5.68 16.01 -58.41 1.68 -1.11 -2.81
C26: Other non-metallic mineral products 81.20 82.60 1.40 1.85 -0.16 -4.59 0.77 4.40 -1.83 -10.25 11.21 0.01 -0.64 -2.62
C27: Basic metals 80.00 84.10 4.10 2.11 -10.91 -15.98 123.93 -5.29 -6.74 -5.25 -77.78 0.09 -1.32 -1.26
C28: Fabricated metal products 96.90 127.30 30.40 -0.31 -4.58 -1.20 22.19 -5.61 -3.14 -36.66 59.70 0.14 -0.54 -6.49
C29: Machinery and equipment, nec 114.50 124.40 9.90 6.69 64.83 3.53 18.48 -1.35 -3.58 -25.76 -52.95 0.55 -1.27 -11.71
C30T33X: Computer, Electronic and optical equipment
35.00 27.60 -7.40 6.26 33.15 2.71 9.35 13.43 -1.33 16.83 -87.80 0.60 -12.72 -41.87
C31: Electrical machinery and apparatus, nec
55.40 45.60 -9.80 0.54 -0.83 -0.08 14.61 -2.89 -1.64 -15.98 -3.53 0.12 -2.15 -16.23
C34: Motor vehicles, trailers and semi-trailers
142.50 137.10 -5.40 26.44 67.67 10.99 432.08 6.15 -9.35 -98.98 -440.40 0.67 -5.03 -1.75
C35: Other transport equipment 15.90 8.80 -7.10 1.41 -12.86 -0.86 26.85 0.18 -0.39 -20.52 -0.90 0.07 -0.19 -3.69
C36T37: Manufacturing nec; recycling 35.60 53.50 17.90 11.96 27.41 4.55 5.18 3.54 -1.53 -5.79 -27.42 0.52 -0.68 -2.82
C40T41: Electricity, gas and water supply 100.60 123.70 23.10 22.60 -0.02 2.52 -3.66 -26.11 -8.02 -6.65 42.46 0.00 -0.39 0.00
C45: Construction 619.20 1,217.10 597.90 -0.08 859.42 12.46 7.20 44.14 -19.57 -0.23 -305.43 1.21 -3.64 -0.05
C50T52: Wholesale and retail trade; repairs
2,122.80 3,154.50 1,031.70 55.76 145.56 70.88 417.79 130.41 -12.09 -203.54 426.92 29.01 -2.60 -41.74
C55: Hotels and restaurants 304.00 466.90 162.90 -4.44 0.40 0.37 57.84 54.41 -4.83 -100.72 159.87 5.88 -0.89 -8.08
C60T63: Transport and storage 561.90 713.50 151.60 26.28 8.55 5.73 165.15 68.56 -16.60 -116.01 9.94 7.50 -2.15 -6.77
C64: Post and telecommunications 182.20 413.90 231.70 93.82 0.11 20.24 4.63 53.17 -3.10 -2.90 65.72 0.39 -1.15 -0.30
(continues...)
ARGENTINA
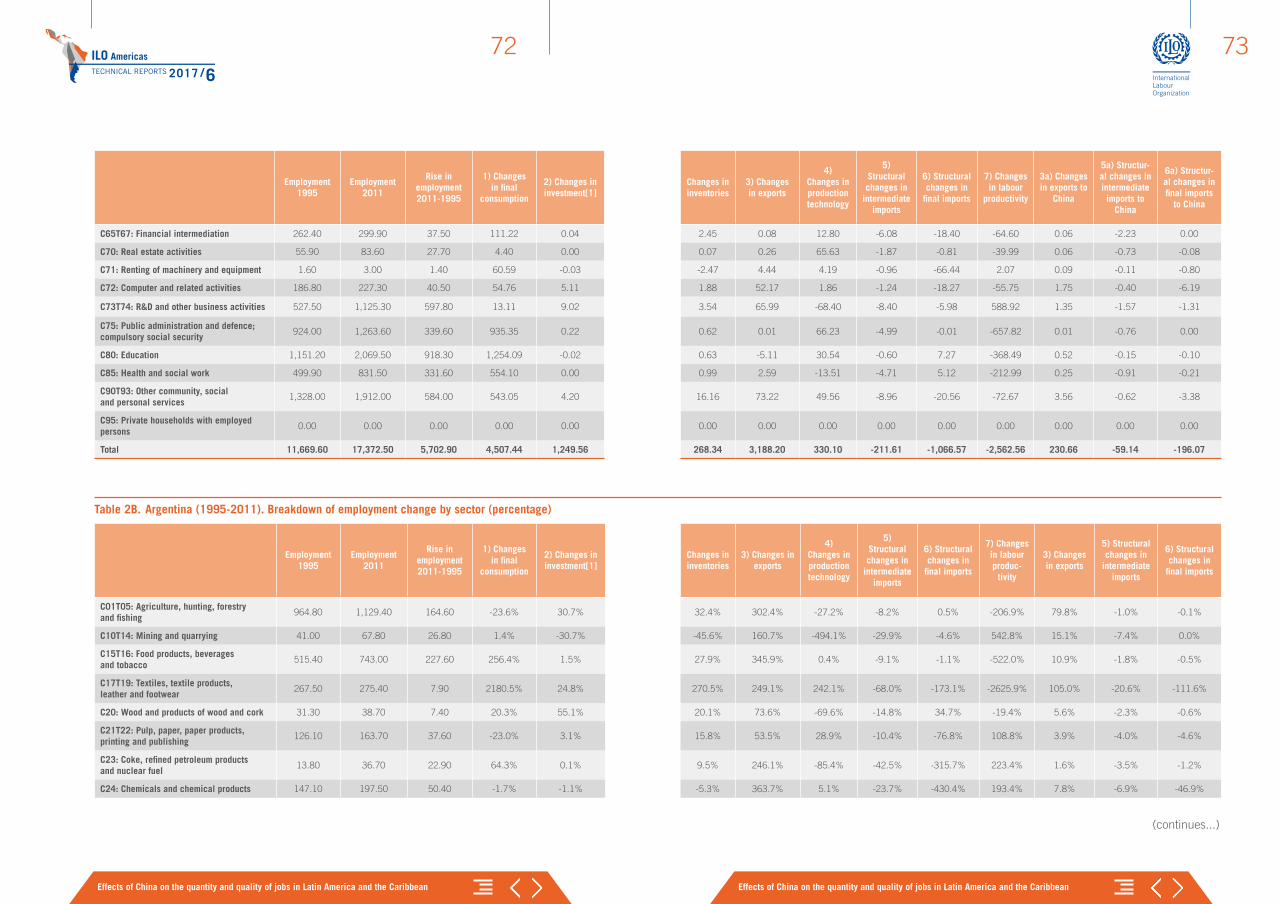
ILO AmericasTECHNICAL REPORTS 2017 /6
Effects of China on the quantity and quality of jobs in Latin America and the Caribbean Effects of China on the quantity and quality of jobs in Latin America and the Caribbean
7372
Employment 1995
Employment 2011
Rise in employment 2011-1995
1) Changes in final
consumption
2) Changes in investment[1]
Changes in inventories
3) Changes in exports
4) Changes in production technology
5) Structural changes in
intermediate imports
6) Structural changes in
final imports
7) Changes in labour
productivity
3a) Changes in exports to
China
5a) Structur-al changes in intermediate imports to
China
6a) Structur-al changes in final imports
to China
C65T67: Financial intermediation 262.40 299.90 37.50 111.22 0.04 2.45 0.08 12.80 -6.08 -18.40 -64.60 0.06 -2.23 0.00
C70: Real estate activities 55.90 83.60 27.70 4.40 0.00 0.07 0.26 65.63 -1.87 -0.81 -39.99 0.06 -0.73 -0.08
C71: Renting of machinery and equipment 1.60 3.00 1.40 60.59 -0.03 -2.47 4.44 4.19 -0.96 -66.44 2.07 0.09 -0.11 -0.80
C72: Computer and related activities 186.80 227.30 40.50 54.76 5.11 1.88 52.17 1.86 -1.24 -18.27 -55.75 1.75 -0.40 -6.19
C73T74: R&D and other business activities 527.50 1,125.30 597.80 13.11 9.02 3.54 65.99 -68.40 -8.40 -5.98 588.92 1.35 -1.57 -1.31
C75: Public administration and defence; compulsory social security
924.00 1,263.60 339.60 935.35 0.22 0.62 0.01 66.23 -4.99 -0.01 -657.82 0.01 -0.76 0.00
C80: Education 1,151.20 2,069.50 918.30 1,254.09 -0.02 0.63 -5.11 30.54 -0.60 7.27 -368.49 0.52 -0.15 -0.10
C85: Health and social work 499.90 831.50 331.60 554.10 0.00 0.99 2.59 -13.51 -4.71 5.12 -212.99 0.25 -0.91 -0.21
C90T93: Other community, social and personal services
1,328.00 1,912.00 584.00 543.05 4.20 16.16 73.22 49.56 -8.96 -20.56 -72.67 3.56 -0.62 -3.38
C95: Private households with employed persons
0.00 0.00 0.00 0.00 0.00 0.00 0.00 0.00 0.00 0.00 0.00 0.00 0.00 0.00
Total 11,669.60 17,372.50 5,702.90 4,507.44 1,249.56 268.34 3,188.20 330.10 -211.61 -1,066.57 -2,562.56 230.66 -59.14 -196.07
Table 2B. Argentina (1995-2011). Breakdown of employment change by sector (percentage)
Employment 1995
Employment 2011
Rise in employment 2011-1995
1) Changes in final
consumption
2) Changes in investment[1]
Changes in inventories
3) Changes in exports
4) Changes in production technology
5) Structural changes in
intermediate imports
6) Structural changes in
final imports
7) Changes in labour produc-
tivity
3) Changes in exports
5) Structural changes in
intermediate imports
6) Structural changes in
final imports
C01T05: Agriculture, hunting, forestry and fishing
964.80 1,129.40 164.60 -23.6% 30.7% 32.4% 302.4% -27.2% -8.2% 0.5% -206.9% 79.8% -1.0% -0.1%
C10T14: Mining and quarrying 41.00 67.80 26.80 1.4% -30.7% -45.6% 160.7% -494.1% -29.9% -4.6% 542.8% 15.1% -7.4% 0.0%
C15T16: Food products, beverages and tobacco
515.40 743.00 227.60 256.4% 1.5% 27.9% 345.9% 0.4% -9.1% -1.1% -522.0% 10.9% -1.8% -0.5%
C17T19: Textiles, textile products, leather and footwear
267.50 275.40 7.90 2180.5% 24.8% 270.5% 249.1% 242.1% -68.0% -173.1% -2625.9% 105.0% -20.6% -111.6%
C20: Wood and products of wood and cork 31.30 38.70 7.40 20.3% 55.1% 20.1% 73.6% -69.6% -14.8% 34.7% -19.4% 5.6% -2.3% -0.6%
C21T22: Pulp, paper, paper products, printing and publishing
126.10 163.70 37.60 -23.0% 3.1% 15.8% 53.5% 28.9% -10.4% -76.8% 108.8% 3.9% -4.0% -4.6%
C23: Coke, refined petroleum products and nuclear fuel
13.80 36.70 22.90 64.3% 0.1% 9.5% 246.1% -85.4% -42.5% -315.7% 223.4% 1.6% -3.5% -1.2%
C24: Chemicals and chemical products 147.10 197.50 50.40 -1.7% -1.1% -5.3% 363.7% 5.1% -23.7% -430.4% 193.4% 7.8% -6.9% -46.9%
(continues...)
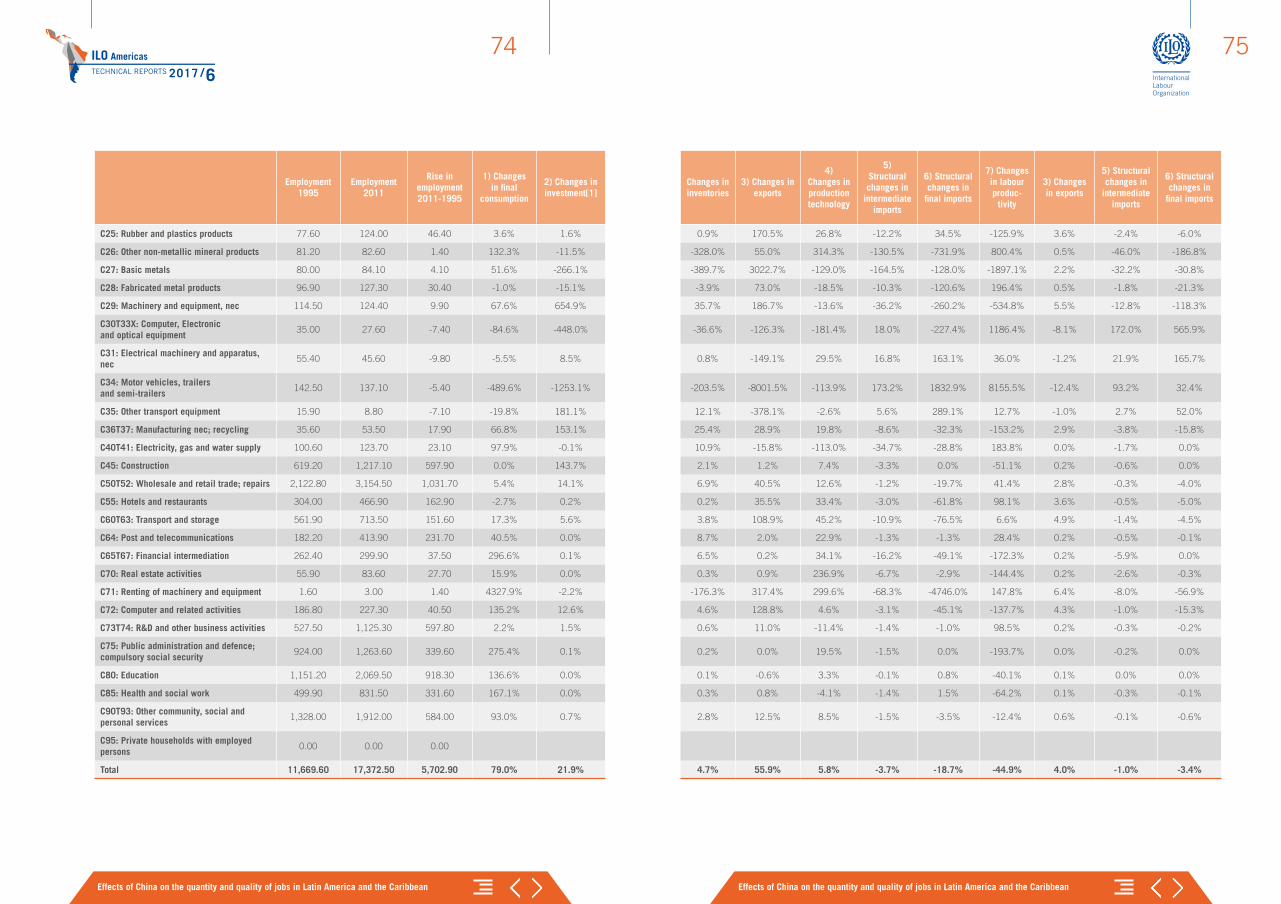
ILO AmericasTECHNICAL REPORTS 2017 /6
Effects of China on the quantity and quality of jobs in Latin America and the Caribbean Effects of China on the quantity and quality of jobs in Latin America and the Caribbean
7574
Employment 1995
Employment 2011
Rise in employment 2011-1995
1) Changes in final
consumption
2) Changes in investment[1]
Changes in inventories
3) Changes in exports
4) Changes in production technology
5) Structural changes in
intermediate imports
6) Structural changes in
final imports
7) Changes in labour produc-
tivity
3) Changes in exports
5) Structural changes in
intermediate imports
6) Structural changes in
final imports
C25: Rubber and plastics products 77.60 124.00 46.40 3.6% 1.6% 0.9% 170.5% 26.8% -12.2% 34.5% -125.9% 3.6% -2.4% -6.0%
C26: Other non-metallic mineral products 81.20 82.60 1.40 132.3% -11.5% -328.0% 55.0% 314.3% -130.5% -731.9% 800.4% 0.5% -46.0% -186.8%
C27: Basic metals 80.00 84.10 4.10 51.6% -266.1% -389.7% 3022.7% -129.0% -164.5% -128.0% -1897.1% 2.2% -32.2% -30.8%
C28: Fabricated metal products 96.90 127.30 30.40 -1.0% -15.1% -3.9% 73.0% -18.5% -10.3% -120.6% 196.4% 0.5% -1.8% -21.3%
C29: Machinery and equipment, nec 114.50 124.40 9.90 67.6% 654.9% 35.7% 186.7% -13.6% -36.2% -260.2% -534.8% 5.5% -12.8% -118.3%
C30T33X: Computer, Electronic and optical equipment
35.00 27.60 -7.40 -84.6% -448.0% -36.6% -126.3% -181.4% 18.0% -227.4% 1186.4% -8.1% 172.0% 565.9%
C31: Electrical machinery and apparatus, nec
55.40 45.60 -9.80 -5.5% 8.5% 0.8% -149.1% 29.5% 16.8% 163.1% 36.0% -1.2% 21.9% 165.7%
C34: Motor vehicles, trailers and semi-trailers
142.50 137.10 -5.40 -489.6% -1253.1% -203.5% -8001.5% -113.9% 173.2% 1832.9% 8155.5% -12.4% 93.2% 32.4%
C35: Other transport equipment 15.90 8.80 -7.10 -19.8% 181.1% 12.1% -378.1% -2.6% 5.6% 289.1% 12.7% -1.0% 2.7% 52.0%
C36T37: Manufacturing nec; recycling 35.60 53.50 17.90 66.8% 153.1% 25.4% 28.9% 19.8% -8.6% -32.3% -153.2% 2.9% -3.8% -15.8%
C40T41: Electricity, gas and water supply 100.60 123.70 23.10 97.9% -0.1% 10.9% -15.8% -113.0% -34.7% -28.8% 183.8% 0.0% -1.7% 0.0%
C45: Construction 619.20 1,217.10 597.90 0.0% 143.7% 2.1% 1.2% 7.4% -3.3% 0.0% -51.1% 0.2% -0.6% 0.0%
C50T52: Wholesale and retail trade; repairs 2,122.80 3,154.50 1,031.70 5.4% 14.1% 6.9% 40.5% 12.6% -1.2% -19.7% 41.4% 2.8% -0.3% -4.0%
C55: Hotels and restaurants 304.00 466.90 162.90 -2.7% 0.2% 0.2% 35.5% 33.4% -3.0% -61.8% 98.1% 3.6% -0.5% -5.0%
C60T63: Transport and storage 561.90 713.50 151.60 17.3% 5.6% 3.8% 108.9% 45.2% -10.9% -76.5% 6.6% 4.9% -1.4% -4.5%
C64: Post and telecommunications 182.20 413.90 231.70 40.5% 0.0% 8.7% 2.0% 22.9% -1.3% -1.3% 28.4% 0.2% -0.5% -0.1%
C65T67: Financial intermediation 262.40 299.90 37.50 296.6% 0.1% 6.5% 0.2% 34.1% -16.2% -49.1% -172.3% 0.2% -5.9% 0.0%
C70: Real estate activities 55.90 83.60 27.70 15.9% 0.0% 0.3% 0.9% 236.9% -6.7% -2.9% -144.4% 0.2% -2.6% -0.3%
C71: Renting of machinery and equipment 1.60 3.00 1.40 4327.9% -2.2% -176.3% 317.4% 299.6% -68.3% -4746.0% 147.8% 6.4% -8.0% -56.9%
C72: Computer and related activities 186.80 227.30 40.50 135.2% 12.6% 4.6% 128.8% 4.6% -3.1% -45.1% -137.7% 4.3% -1.0% -15.3%
C73T74: R&D and other business activities 527.50 1,125.30 597.80 2.2% 1.5% 0.6% 11.0% -11.4% -1.4% -1.0% 98.5% 0.2% -0.3% -0.2%
C75: Public administration and defence; compulsory social security
924.00 1,263.60 339.60 275.4% 0.1% 0.2% 0.0% 19.5% -1.5% 0.0% -193.7% 0.0% -0.2% 0.0%
C80: Education 1,151.20 2,069.50 918.30 136.6% 0.0% 0.1% -0.6% 3.3% -0.1% 0.8% -40.1% 0.1% 0.0% 0.0%
C85: Health and social work 499.90 831.50 331.60 167.1% 0.0% 0.3% 0.8% -4.1% -1.4% 1.5% -64.2% 0.1% -0.3% -0.1%
C90T93: Other community, social and personal services
1,328.00 1,912.00 584.00 93.0% 0.7% 2.8% 12.5% 8.5% -1.5% -3.5% -12.4% 0.6% -0.1% -0.6%
C95: Private households with employed persons
0.00 0.00 0.00
Total 11,669.60 17,372.50 5,702.90 79.0% 21.9% 4.7% 55.9% 5.8% -3.7% -18.7% -44.9% 4.0% -1.0% -3.4%
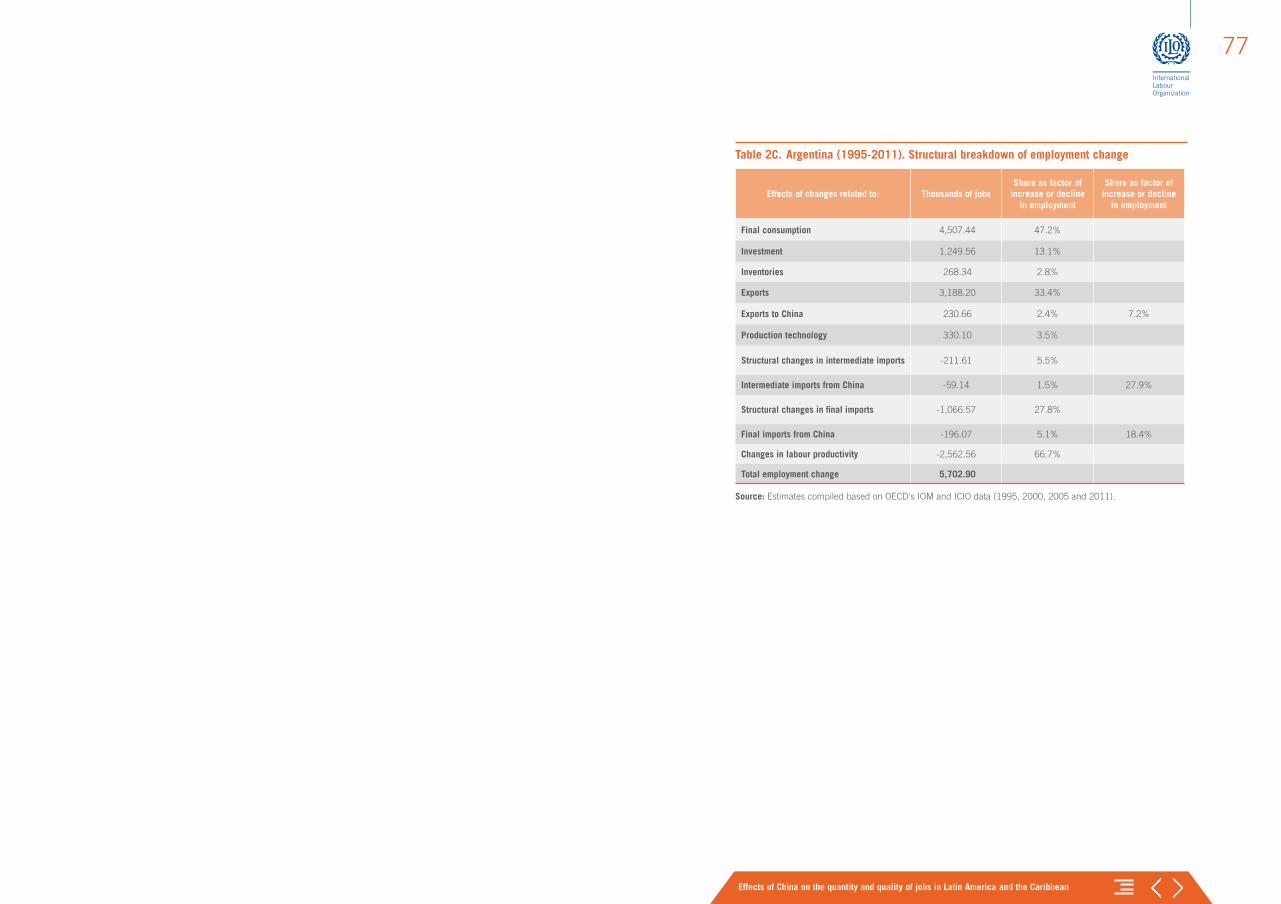
Effects of China on the quantity and quality of jobs in Latin America and the Caribbean
77
Table 2C. Argentina (1995-2011). Structural breakdown of employment change
Effects of changes related to: Thousands of jobsShare as factor of
increase or decline in employment
Share as factor of increase or decline
in employment
Final consumption 4,507.44 47.2%
Investment 1,249.56 13.1%
Inventories 268.34 2.8%
Exports 3,188.20 33.4%
Exports to China 230.66 2.4% 7.2%
Production technology 330.10 3.5%
Structural changes in intermediate imports -211.61 5.5%
Intermediate imports from China -59.14 1.5% 27.9%
Structural changes in final imports -1,066.57 27.8%
Final imports from China -196.07 5.1% 18.4%
Changes in labour productivity -2,562.56 66.7%
Total employment change 5,702.90
Source: Estimates compiled based on OECD's IOM and ICIO data (1995, 2000, 2005 and 2011).
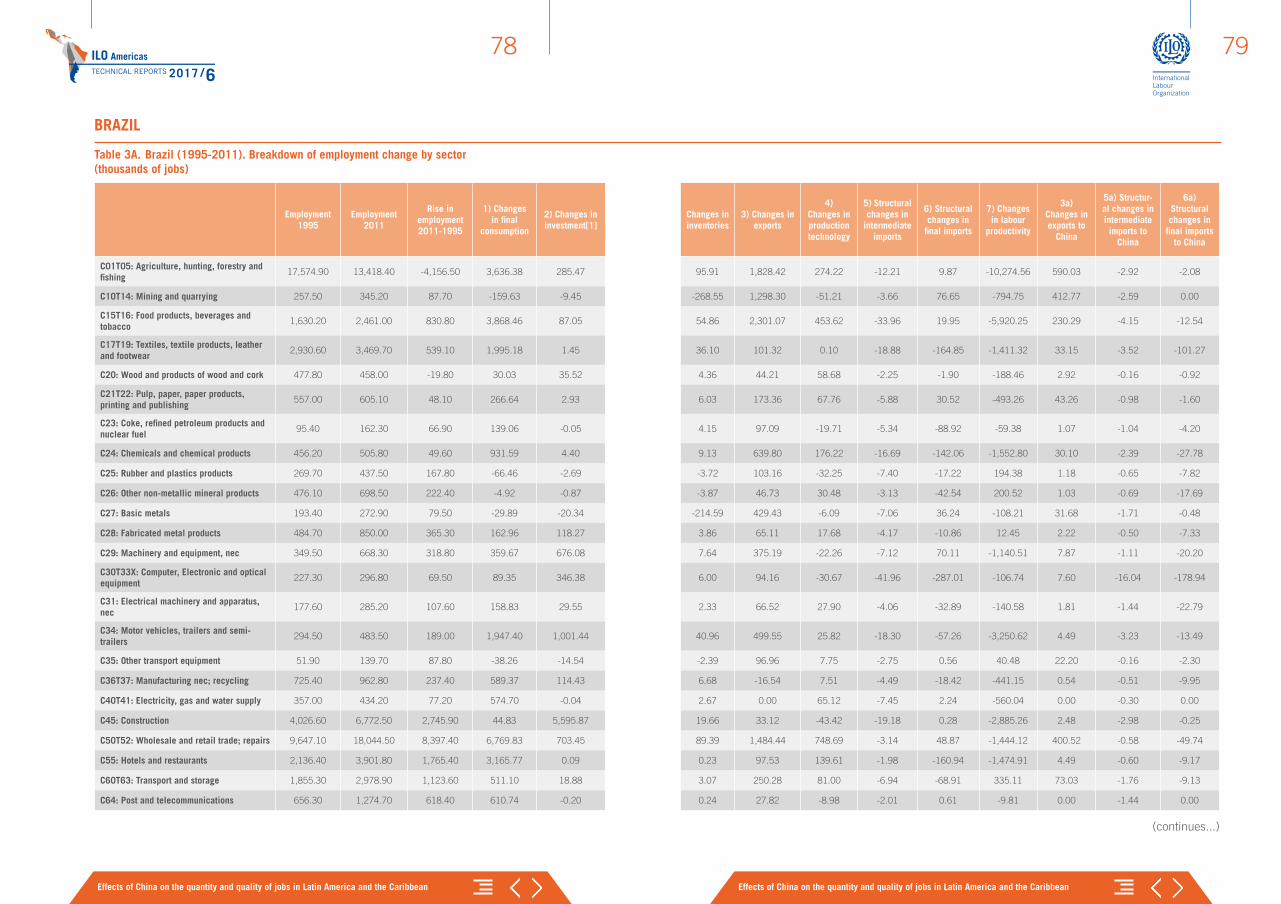
ILO AmericasTECHNICAL REPORTS 2017 /6
Effects of China on the quantity and quality of jobs in Latin America and the Caribbean Effects of China on the quantity and quality of jobs in Latin America and the Caribbean
7978
Table 3A. Brazil (1995-2011). Breakdown of employment change by sector (thousands of jobs)
Employment 1995
Employment 2011
Rise in employment 2011-1995
1) Changes in final
consumption
2) Changes in investment[1]
Changes in inventories
3) Changes in exports
4) Changes in production technology
5) Structural changes in
intermediate imports
6) Structural changes in
final imports
7) Changes in labour
productivity
3a) Changes in exports to
China
5a) Structur-al changes in intermediate imports to
China
6a) Structural changes in
final imports to China
C01T05: Agriculture, hunting, forestry and fishing
17,574.90 13,418.40 -4,156.50 3,636.38 285.47 95.91 1,828.42 274.22 -12.21 9.87 -10,274.56 590.03 -2.92 -2.08
C10T14: Mining and quarrying 257.50 345.20 87.70 -159.63 -9.45 -268.55 1,298.30 -51.21 -3.66 76.65 -794.75 412.77 -2.59 0.00
C15T16: Food products, beverages and tobacco
1,630.20 2,461.00 830.80 3,868.46 87.05 54.86 2,301.07 453.62 -33.96 19.95 -5,920.25 230.29 -4.15 -12.54
C17T19: Textiles, textile products, leather and footwear
2,930.60 3,469.70 539.10 1,995.18 1.45 36.10 101.32 0.10 -18.88 -164.85 -1,411.32 33.15 -3.52 -101.27
C20: Wood and products of wood and cork 477.80 458.00 -19.80 30.03 35.52 4.36 44.21 58.68 -2.25 -1.90 -188.46 2.92 -0.16 -0.92
C21T22: Pulp, paper, paper products, printing and publishing
557.00 605.10 48.10 266.64 2.93 6.03 173.36 67.76 -5.88 30.52 -493.26 43.26 -0.98 -1.60
C23: Coke, refined petroleum products and nuclear fuel
95.40 162.30 66.90 139.06 -0.05 4.15 97.09 -19.71 -5.34 -88.92 -59.38 1.07 -1.04 -4.20
C24: Chemicals and chemical products 456.20 505.80 49.60 931.59 4.40 9.13 639.80 176.22 -16.69 -142.06 -1,552.80 30.10 -2.39 -27.78
C25: Rubber and plastics products 269.70 437.50 167.80 -66.46 -2.69 -3.72 103.16 -32.25 -7.40 -17.22 194.38 1.18 -0.65 -7.82
C26: Other non-metallic mineral products 476.10 698.50 222.40 -4.92 -0.87 -3.87 46.73 30.48 -3.13 -42.54 200.52 1.03 -0.69 -17.69
C27: Basic metals 193.40 272.90 79.50 -29.89 -20.34 -214.59 429.43 -6.09 -7.06 36.24 -108.21 31.68 -1.71 -0.48
C28: Fabricated metal products 484.70 850.00 365.30 162.96 118.27 3.86 65.11 17.68 -4.17 -10.86 12.45 2.22 -0.50 -7.33
C29: Machinery and equipment, nec 349.50 668.30 318.80 359.67 676.08 7.64 375.19 -22.26 -7.12 70.11 -1,140.51 7.87 -1.11 -20.20
C30T33X: Computer, Electronic and optical equipment
227.30 296.80 69.50 89.35 346.38 6.00 94.16 -30.67 -41.96 -287.01 -106.74 7.60 -16.04 -178.94
C31: Electrical machinery and apparatus, nec
177.60 285.20 107.60 158.83 29.55 2.33 66.52 27.90 -4.06 -32.89 -140.58 1.81 -1.44 -22.79
C34: Motor vehicles, trailers and semi-trailers
294.50 483.50 189.00 1,947.40 1,001.44 40.96 499.55 25.82 -18.30 -57.26 -3,250.62 4.49 -3.23 -13.49
C35: Other transport equipment 51.90 139.70 87.80 -38.26 -14.54 -2.39 96.96 7.75 -2.75 0.56 40.48 22.20 -0.16 -2.30
C36T37: Manufacturing nec; recycling 725.40 962.80 237.40 589.37 114.43 6.68 -16.54 7.51 -4.49 -18.42 -441.15 0.54 -0.51 -9.95
C40T41: Electricity, gas and water supply 357.00 434.20 77.20 574.70 -0.04 2.67 0.00 65.12 -7.45 2.24 -560.04 0.00 -0.30 0.00
C45: Construction 4,026.60 6,772.50 2,745.90 44.83 5,595.87 19.66 33.12 -43.42 -19.18 0.28 -2,885.26 2.48 -2.98 -0.25
C50T52: Wholesale and retail trade; repairs 9,647.10 18,044.50 8,397.40 6,769.83 703.45 89.39 1,484.44 748.69 -3.14 48.87 -1,444.12 400.52 -0.58 -49.74
C55: Hotels and restaurants 2,136.40 3,901.80 1,765.40 3,165.77 0.09 0.23 97.53 139.61 -1.98 -160.94 -1,474.91 4.49 -0.60 -9.17
C60T63: Transport and storage 1,855.30 2,978.90 1,123.60 511.10 18.88 3.07 250.28 81.00 -6.94 -68.91 335.11 73.03 -1.76 -9.13
C64: Post and telecommunications 656.30 1,274.70 618.40 610.74 -0.20 0.24 27.82 -8.98 -2.01 0.61 -9.81 0.00 -1.44 0.00
(continues...)
BRAZIL
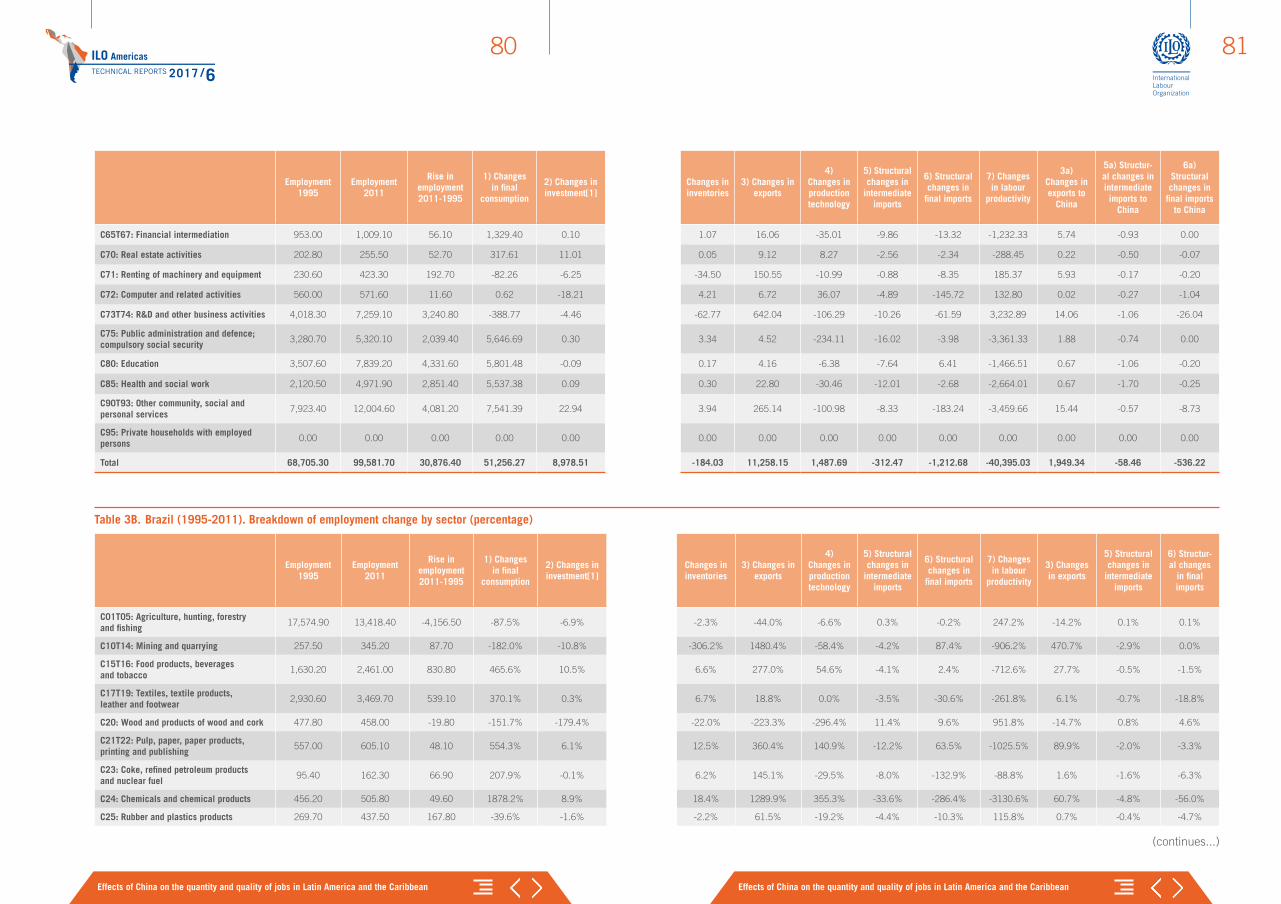
ILO AmericasTECHNICAL REPORTS 2017 /6
Effects of China on the quantity and quality of jobs in Latin America and the Caribbean Effects of China on the quantity and quality of jobs in Latin America and the Caribbean
8180
Employment 1995
Employment 2011
Rise in employment 2011-1995
1) Changes in final
consumption
2) Changes in investment[1]
Changes in inventories
3) Changes in exports
4) Changes in production technology
5) Structural changes in
intermediate imports
6) Structural changes in
final imports
7) Changes in labour
productivity
3a) Changes in exports to
China
5a) Structur-al changes in intermediate imports to
China
6a) Structural changes in
final imports to China
C65T67: Financial intermediation 953.00 1,009.10 56.10 1,329.40 0.10 1.07 16.06 -35.01 -9.86 -13.32 -1,232.33 5.74 -0.93 0.00
C70: Real estate activities 202.80 255.50 52.70 317.61 11.01 0.05 9.12 8.27 -2.56 -2.34 -288.45 0.22 -0.50 -0.07
C71: Renting of machinery and equipment 230.60 423.30 192.70 -82.26 -6.25 -34.50 150.55 -10.99 -0.88 -8.35 185.37 5.93 -0.17 -0.20
C72: Computer and related activities 560.00 571.60 11.60 0.62 -18.21 4.21 6.72 36.07 -4.89 -145.72 132.80 0.02 -0.27 -1.04
C73T74: R&D and other business activities 4,018.30 7,259.10 3,240.80 -388.77 -4.46 -62.77 642.04 -106.29 -10.26 -61.59 3,232.89 14.06 -1.06 -26.04
C75: Public administration and defence; compulsory social security
3,280.70 5,320.10 2,039.40 5,646.69 0.30 3.34 4.52 -234.11 -16.02 -3.98 -3,361.33 1.88 -0.74 0.00
C80: Education 3,507.60 7,839.20 4,331.60 5,801.48 -0.09 0.17 4.16 -6.38 -7.64 6.41 -1,466.51 0.67 -1.06 -0.20
C85: Health and social work 2,120.50 4,971.90 2,851.40 5,537.38 0.09 0.30 22.80 -30.46 -12.01 -2.68 -2,664.01 0.67 -1.70 -0.25
C90T93: Other community, social and personal services
7,923.40 12,004.60 4,081.20 7,541.39 22.94 3.94 265.14 -100.98 -8.33 -183.24 -3,459.66 15.44 -0.57 -8.73
C95: Private households with employed persons
0.00 0.00 0.00 0.00 0.00 0.00 0.00 0.00 0.00 0.00 0.00 0.00 0.00 0.00
Total 68,705.30 99,581.70 30,876.40 51,256.27 8,978.51 -184.03 11,258.15 1,487.69 -312.47 -1,212.68 -40,395.03 1,949.34 -58.46 -536.22
Table 3B. Brazil (1995-2011). Breakdown of employment change by sector (percentage)
Employment 1995
Employment 2011
Rise in employment 2011-1995
1) Changes in final
consumption
2) Changes in investment[1]
Changes in inventories
3) Changes in exports
4) Changes in production technology
5) Structural changes in
intermediate imports
6) Structural changes in
final imports
7) Changes in labour
productivity
3) Changes in exports
5) Structural changes in
intermediate imports
6) Structur-al changes
in final imports
C01T05: Agriculture, hunting, forestry and fishing
17,574.90 13,418.40 -4,156.50 -87.5% -6.9% -2.3% -44.0% -6.6% 0.3% -0.2% 247.2% -14.2% 0.1% 0.1%
C10T14: Mining and quarrying 257.50 345.20 87.70 -182.0% -10.8% -306.2% 1480.4% -58.4% -4.2% 87.4% -906.2% 470.7% -2.9% 0.0%
C15T16: Food products, beverages and tobacco
1,630.20 2,461.00 830.80 465.6% 10.5% 6.6% 277.0% 54.6% -4.1% 2.4% -712.6% 27.7% -0.5% -1.5%
C17T19: Textiles, textile products, leather and footwear
2,930.60 3,469.70 539.10 370.1% 0.3% 6.7% 18.8% 0.0% -3.5% -30.6% -261.8% 6.1% -0.7% -18.8%
C20: Wood and products of wood and cork 477.80 458.00 -19.80 -151.7% -179.4% -22.0% -223.3% -296.4% 11.4% 9.6% 951.8% -14.7% 0.8% 4.6%
C21T22: Pulp, paper, paper products, printing and publishing
557.00 605.10 48.10 554.3% 6.1% 12.5% 360.4% 140.9% -12.2% 63.5% -1025.5% 89.9% -2.0% -3.3%
C23: Coke, refined petroleum products and nuclear fuel
95.40 162.30 66.90 207.9% -0.1% 6.2% 145.1% -29.5% -8.0% -132.9% -88.8% 1.6% -1.6% -6.3%
C24: Chemicals and chemical products 456.20 505.80 49.60 1878.2% 8.9% 18.4% 1289.9% 355.3% -33.6% -286.4% -3130.6% 60.7% -4.8% -56.0%
C25: Rubber and plastics products 269.70 437.50 167.80 -39.6% -1.6% -2.2% 61.5% -19.2% -4.4% -10.3% 115.8% 0.7% -0.4% -4.7%
(continues...)
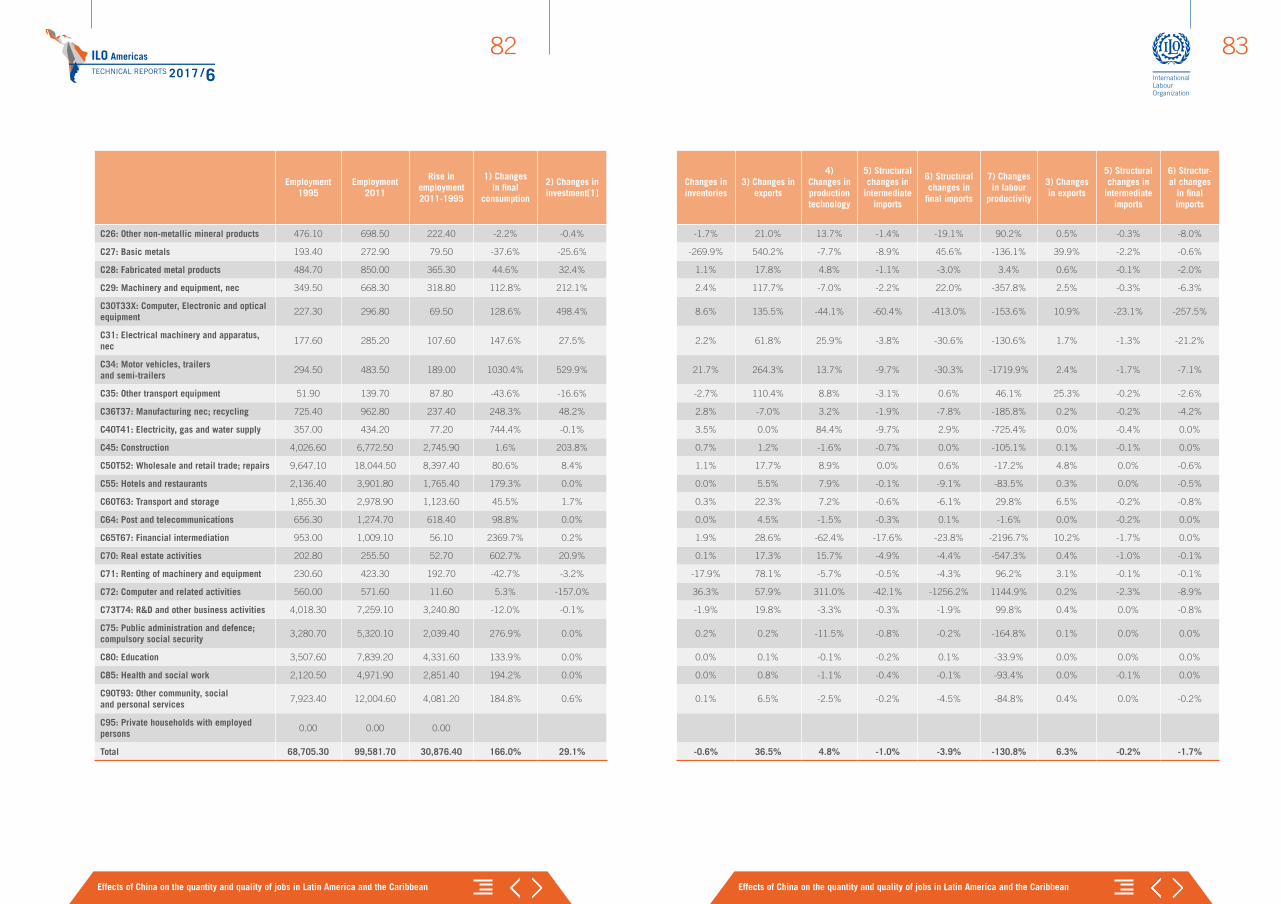
ILO AmericasTECHNICAL REPORTS 2017 /6
Effects of China on the quantity and quality of jobs in Latin America and the Caribbean Effects of China on the quantity and quality of jobs in Latin America and the Caribbean
8382
Employment 1995
Employment 2011
Rise in employment 2011-1995
1) Changes in final
consumption
2) Changes in investment[1]
Changes in inventories
3) Changes in exports
4) Changes in production technology
5) Structural changes in
intermediate imports
6) Structural changes in
final imports
7) Changes in labour
productivity
3) Changes in exports
5) Structural changes in
intermediate imports
6) Structur-al changes
in final imports
C26: Other non-metallic mineral products 476.10 698.50 222.40 -2.2% -0.4% -1.7% 21.0% 13.7% -1.4% -19.1% 90.2% 0.5% -0.3% -8.0%
C27: Basic metals 193.40 272.90 79.50 -37.6% -25.6% -269.9% 540.2% -7.7% -8.9% 45.6% -136.1% 39.9% -2.2% -0.6%
C28: Fabricated metal products 484.70 850.00 365.30 44.6% 32.4% 1.1% 17.8% 4.8% -1.1% -3.0% 3.4% 0.6% -0.1% -2.0%
C29: Machinery and equipment, nec 349.50 668.30 318.80 112.8% 212.1% 2.4% 117.7% -7.0% -2.2% 22.0% -357.8% 2.5% -0.3% -6.3%
C30T33X: Computer, Electronic and optical equipment
227.30 296.80 69.50 128.6% 498.4% 8.6% 135.5% -44.1% -60.4% -413.0% -153.6% 10.9% -23.1% -257.5%
C31: Electrical machinery and apparatus, nec
177.60 285.20 107.60 147.6% 27.5% 2.2% 61.8% 25.9% -3.8% -30.6% -130.6% 1.7% -1.3% -21.2%
C34: Motor vehicles, trailers and semi-trailers
294.50 483.50 189.00 1030.4% 529.9% 21.7% 264.3% 13.7% -9.7% -30.3% -1719.9% 2.4% -1.7% -7.1%
C35: Other transport equipment 51.90 139.70 87.80 -43.6% -16.6% -2.7% 110.4% 8.8% -3.1% 0.6% 46.1% 25.3% -0.2% -2.6%
C36T37: Manufacturing nec; recycling 725.40 962.80 237.40 248.3% 48.2% 2.8% -7.0% 3.2% -1.9% -7.8% -185.8% 0.2% -0.2% -4.2%
C40T41: Electricity, gas and water supply 357.00 434.20 77.20 744.4% -0.1% 3.5% 0.0% 84.4% -9.7% 2.9% -725.4% 0.0% -0.4% 0.0%
C45: Construction 4,026.60 6,772.50 2,745.90 1.6% 203.8% 0.7% 1.2% -1.6% -0.7% 0.0% -105.1% 0.1% -0.1% 0.0%
C50T52: Wholesale and retail trade; repairs 9,647.10 18,044.50 8,397.40 80.6% 8.4% 1.1% 17.7% 8.9% 0.0% 0.6% -17.2% 4.8% 0.0% -0.6%
C55: Hotels and restaurants 2,136.40 3,901.80 1,765.40 179.3% 0.0% 0.0% 5.5% 7.9% -0.1% -9.1% -83.5% 0.3% 0.0% -0.5%
C60T63: Transport and storage 1,855.30 2,978.90 1,123.60 45.5% 1.7% 0.3% 22.3% 7.2% -0.6% -6.1% 29.8% 6.5% -0.2% -0.8%
C64: Post and telecommunications 656.30 1,274.70 618.40 98.8% 0.0% 0.0% 4.5% -1.5% -0.3% 0.1% -1.6% 0.0% -0.2% 0.0%
C65T67: Financial intermediation 953.00 1,009.10 56.10 2369.7% 0.2% 1.9% 28.6% -62.4% -17.6% -23.8% -2196.7% 10.2% -1.7% 0.0%
C70: Real estate activities 202.80 255.50 52.70 602.7% 20.9% 0.1% 17.3% 15.7% -4.9% -4.4% -547.3% 0.4% -1.0% -0.1%
C71: Renting of machinery and equipment 230.60 423.30 192.70 -42.7% -3.2% -17.9% 78.1% -5.7% -0.5% -4.3% 96.2% 3.1% -0.1% -0.1%
C72: Computer and related activities 560.00 571.60 11.60 5.3% -157.0% 36.3% 57.9% 311.0% -42.1% -1256.2% 1144.9% 0.2% -2.3% -8.9%
C73T74: R&D and other business activities 4,018.30 7,259.10 3,240.80 -12.0% -0.1% -1.9% 19.8% -3.3% -0.3% -1.9% 99.8% 0.4% 0.0% -0.8%
C75: Public administration and defence; compulsory social security
3,280.70 5,320.10 2,039.40 276.9% 0.0% 0.2% 0.2% -11.5% -0.8% -0.2% -164.8% 0.1% 0.0% 0.0%
C80: Education 3,507.60 7,839.20 4,331.60 133.9% 0.0% 0.0% 0.1% -0.1% -0.2% 0.1% -33.9% 0.0% 0.0% 0.0%
C85: Health and social work 2,120.50 4,971.90 2,851.40 194.2% 0.0% 0.0% 0.8% -1.1% -0.4% -0.1% -93.4% 0.0% -0.1% 0.0%
C90T93: Other community, social and personal services
7,923.40 12,004.60 4,081.20 184.8% 0.6% 0.1% 6.5% -2.5% -0.2% -4.5% -84.8% 0.4% 0.0% -0.2%
C95: Private households with employed persons
0.00 0.00 0.00
Total 68,705.30 99,581.70 30,876.40 166.0% 29.1% -0.6% 36.5% 4.8% -1.0% -3.9% -130.8% 6.3% -0.2% -1.7%

Effects of China on the quantity and quality of jobs in Latin America and the Caribbean
85
Table 3C. Brazil (1995-2011). Structural breakdown of employment change
Effects of changes related to: Thousands of jobsShare as factor of
increase or decline in employment
Share as factor of increase or decline
in employment
Final consumption 51,256.27 70.2%
Investment 8,978.51 12.3%
Inventories -184.03 0.4%
Exports 11,258.15 15.4%
Exports to China 1,949.34 2.7% 17.3%
Production technology 1,487.69 2.0%
Structural changes in intermediate imports -312.47 0.7%
Intermediate imports from China -58.46 0.1% 18.7%
Structural changes in final imports -1,212.68 2.9%
Final imports from China -536.22 1.3% 44.2%
Changes in labour productivity -40,395.03 95.9%
Total employment change 30,876.40
Source: Estimates compiled based on OECD's IOM and ICIO data (1995, 2000, 2005 and 2011).
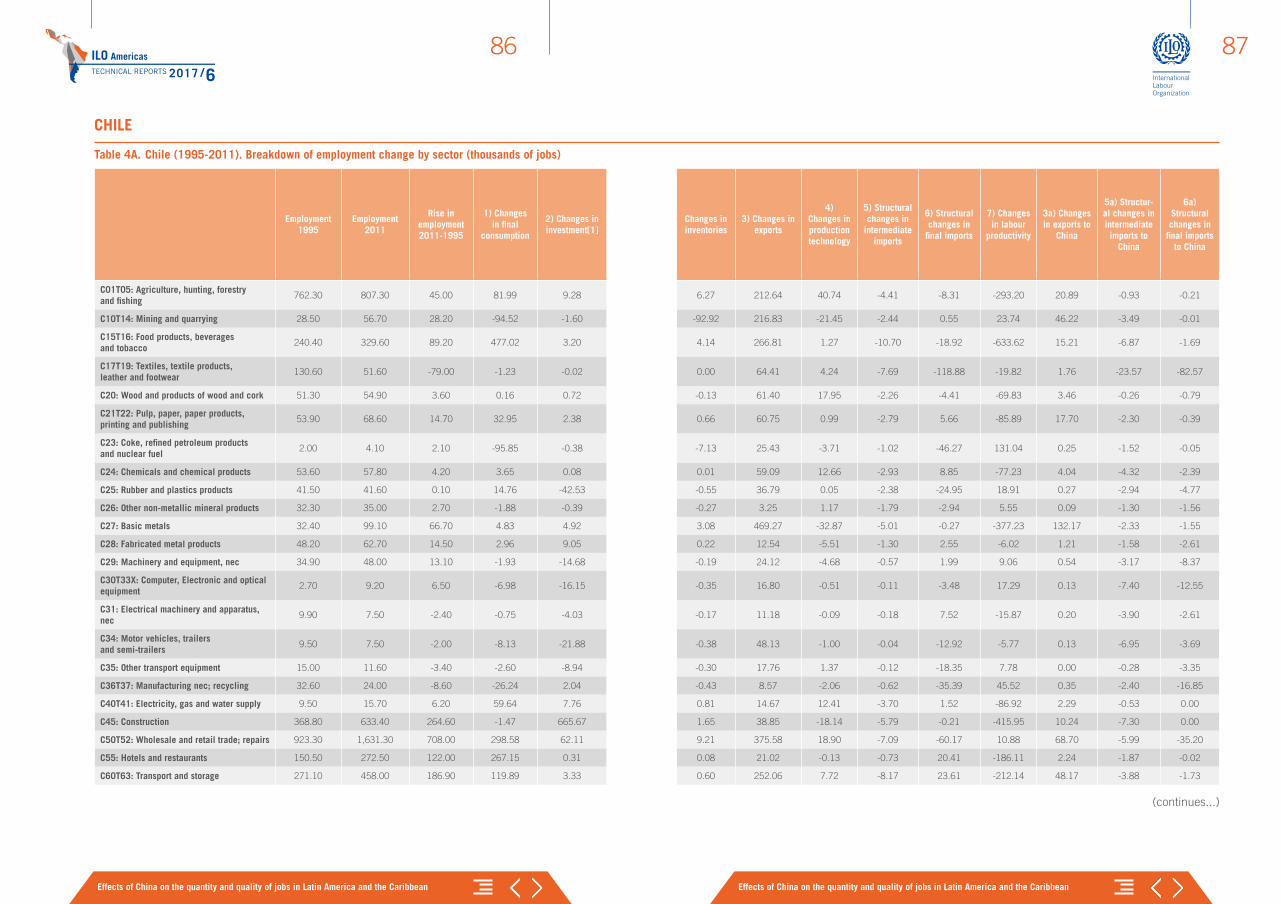
ILO AmericasTECHNICAL REPORTS 2017 /6
Effects of China on the quantity and quality of jobs in Latin America and the Caribbean Effects of China on the quantity and quality of jobs in Latin America and the Caribbean
8786
Table 4A. Chile (1995-2011). Breakdown of employment change by sector (thousands of jobs)
Employment 1995
Employment 2011
Rise in employment 2011-1995
1) Changes in final
consumption
2) Changes in investment[1]
Changes in inventories
3) Changes in exports
4) Changes in production technology
5) Structural changes in
intermediate imports
6) Structural changes in
final imports
7) Changes in labour
productivity
3a) Changes in exports to
China
5a) Structur-al changes in intermediate imports to
China
6a) Structural changes in
final imports to China
C01T05: Agriculture, hunting, forestry and fishing
762.30 807.30 45.00 81.99 9.28 6.27 212.64 40.74 -4.41 -8.31 -293.20 20.89 -0.93 -0.21
C10T14: Mining and quarrying 28.50 56.70 28.20 -94.52 -1.60 -92.92 216.83 -21.45 -2.44 0.55 23.74 46.22 -3.49 -0.01
C15T16: Food products, beverages and tobacco
240.40 329.60 89.20 477.02 3.20 4.14 266.81 1.27 -10.70 -18.92 -633.62 15.21 -6.87 -1.69
C17T19: Textiles, textile products, leather and footwear
130.60 51.60 -79.00 -1.23 -0.02 0.00 64.41 4.24 -7.69 -118.88 -19.82 1.76 -23.57 -82.57
C20: Wood and products of wood and cork 51.30 54.90 3.60 0.16 0.72 -0.13 61.40 17.95 -2.26 -4.41 -69.83 3.46 -0.26 -0.79
C21T22: Pulp, paper, paper products, printing and publishing
53.90 68.60 14.70 32.95 2.38 0.66 60.75 0.99 -2.79 5.66 -85.89 17.70 -2.30 -0.39
C23: Coke, refined petroleum products and nuclear fuel
2.00 4.10 2.10 -95.85 -0.38 -7.13 25.43 -3.71 -1.02 -46.27 131.04 0.25 -1.52 -0.05
C24: Chemicals and chemical products 53.60 57.80 4.20 3.65 0.08 0.01 59.09 12.66 -2.93 8.85 -77.23 4.04 -4.32 -2.39
C25: Rubber and plastics products 41.50 41.60 0.10 14.76 -42.53 -0.55 36.79 0.05 -2.38 -24.95 18.91 0.27 -2.94 -4.77
C26: Other non-metallic mineral products 32.30 35.00 2.70 -1.88 -0.39 -0.27 3.25 1.17 -1.79 -2.94 5.55 0.09 -1.30 -1.56
C27: Basic metals 32.40 99.10 66.70 4.83 4.92 3.08 469.27 -32.87 -5.01 -0.27 -377.23 132.17 -2.33 -1.55
C28: Fabricated metal products 48.20 62.70 14.50 2.96 9.05 0.22 12.54 -5.51 -1.30 2.55 -6.02 1.21 -1.58 -2.61
C29: Machinery and equipment, nec 34.90 48.00 13.10 -1.93 -14.68 -0.19 24.12 -4.68 -0.57 1.99 9.06 0.54 -3.17 -8.37
C30T33X: Computer, Electronic and optical equipment
2.70 9.20 6.50 -6.98 -16.15 -0.35 16.80 -0.51 -0.11 -3.48 17.29 0.13 -7.40 -12.55
C31: Electrical machinery and apparatus, nec
9.90 7.50 -2.40 -0.75 -4.03 -0.17 11.18 -0.09 -0.18 7.52 -15.87 0.20 -3.90 -2.61
C34: Motor vehicles, trailers and semi-trailers
9.50 7.50 -2.00 -8.13 -21.88 -0.38 48.13 -1.00 -0.04 -12.92 -5.77 0.13 -6.95 -3.69
C35: Other transport equipment 15.00 11.60 -3.40 -2.60 -8.94 -0.30 17.76 1.37 -0.12 -18.35 7.78 0.00 -0.28 -3.35
C36T37: Manufacturing nec; recycling 32.60 24.00 -8.60 -26.24 2.04 -0.43 8.57 -2.06 -0.62 -35.39 45.52 0.35 -2.40 -16.85
C40T41: Electricity, gas and water supply 9.50 15.70 6.20 59.64 7.76 0.81 14.67 12.41 -3.70 1.52 -86.92 2.29 -0.53 0.00
C45: Construction 368.80 633.40 264.60 -1.47 665.67 1.65 38.85 -18.14 -5.79 -0.21 -415.95 10.24 -7.30 0.00
C50T52: Wholesale and retail trade; repairs 923.30 1,631.30 708.00 298.58 62.11 9.21 375.58 18.90 -7.09 -60.17 10.88 68.70 -5.99 -35.20
C55: Hotels and restaurants 150.50 272.50 122.00 267.15 0.31 0.08 21.02 -0.13 -0.73 20.41 -186.11 2.24 -1.87 -0.02
C60T63: Transport and storage 271.10 458.00 186.90 119.89 3.33 0.60 252.06 7.72 -8.17 23.61 -212.14 48.17 -3.88 -1.73
(continues...)
CHILE
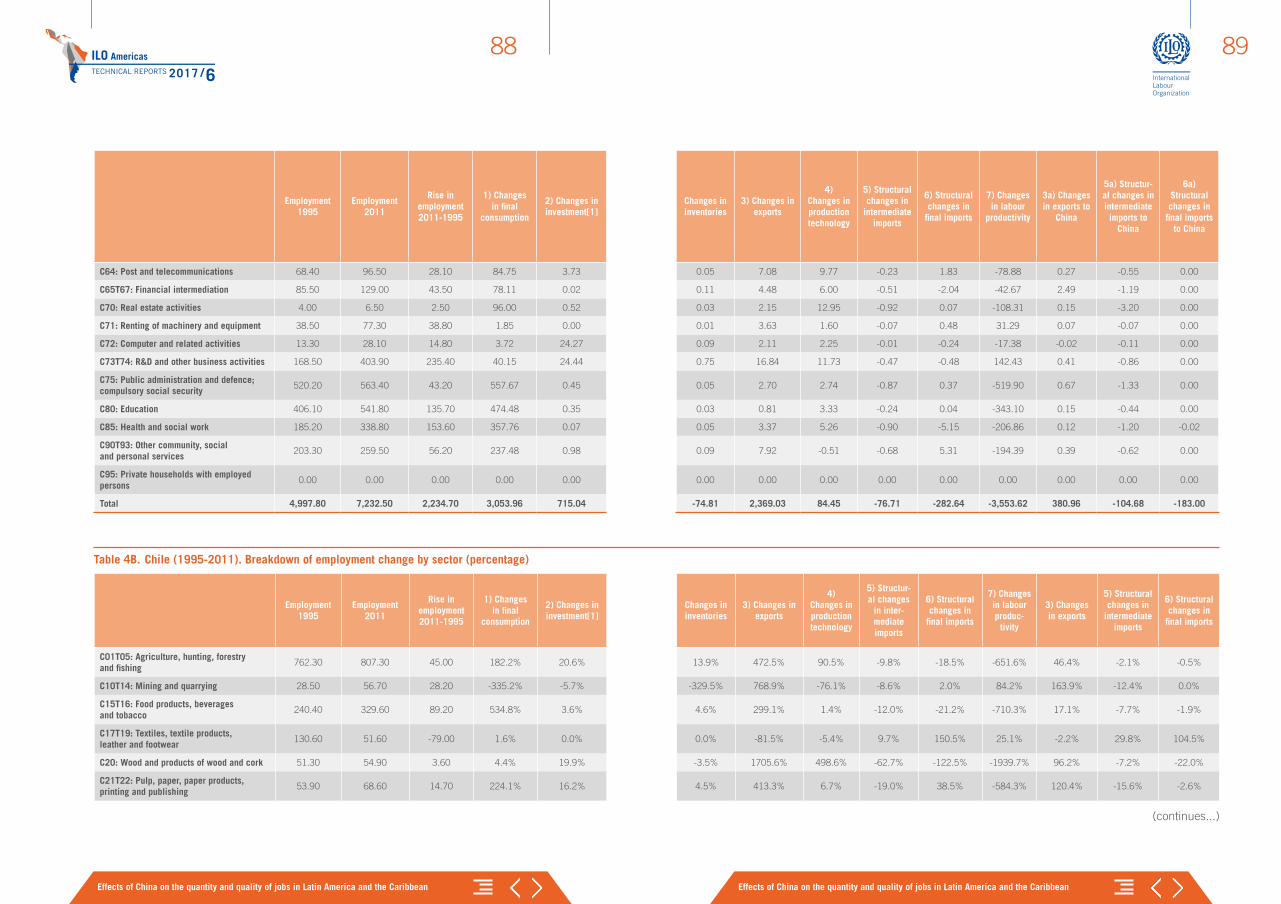
ILO AmericasTECHNICAL REPORTS 2017 /6
Effects of China on the quantity and quality of jobs in Latin America and the Caribbean Effects of China on the quantity and quality of jobs in Latin America and the Caribbean
8988
Employment 1995
Employment 2011
Rise in employment 2011-1995
1) Changes in final
consumption
2) Changes in investment[1]
Changes in inventories
3) Changes in exports
4) Changes in production technology
5) Structural changes in
intermediate imports
6) Structural changes in
final imports
7) Changes in labour
productivity
3a) Changes in exports to
China
5a) Structur-al changes in intermediate imports to
China
6a) Structural changes in
final imports to China
C64: Post and telecommunications 68.40 96.50 28.10 84.75 3.73 0.05 7.08 9.77 -0.23 1.83 -78.88 0.27 -0.55 0.00
C65T67: Financial intermediation 85.50 129.00 43.50 78.11 0.02 0.11 4.48 6.00 -0.51 -2.04 -42.67 2.49 -1.19 0.00
C70: Real estate activities 4.00 6.50 2.50 96.00 0.52 0.03 2.15 12.95 -0.92 0.07 -108.31 0.15 -3.20 0.00
C71: Renting of machinery and equipment 38.50 77.30 38.80 1.85 0.00 0.01 3.63 1.60 -0.07 0.48 31.29 0.07 -0.07 0.00
C72: Computer and related activities 13.30 28.10 14.80 3.72 24.27 0.09 2.11 2.25 -0.01 -0.24 -17.38 -0.02 -0.11 0.00
C73T74: R&D and other business activities 168.50 403.90 235.40 40.15 24.44 0.75 16.84 11.73 -0.47 -0.48 142.43 0.41 -0.86 0.00
C75: Public administration and defence; compulsory social security
520.20 563.40 43.20 557.67 0.45 0.05 2.70 2.74 -0.87 0.37 -519.90 0.67 -1.33 0.00
C80: Education 406.10 541.80 135.70 474.48 0.35 0.03 0.81 3.33 -0.24 0.04 -343.10 0.15 -0.44 0.00
C85: Health and social work 185.20 338.80 153.60 357.76 0.07 0.05 3.37 5.26 -0.90 -5.15 -206.86 0.12 -1.20 -0.02
C90T93: Other community, social and personal services
203.30 259.50 56.20 237.48 0.98 0.09 7.92 -0.51 -0.68 5.31 -194.39 0.39 -0.62 0.00
C95: Private households with employed persons
0.00 0.00 0.00 0.00 0.00 0.00 0.00 0.00 0.00 0.00 0.00 0.00 0.00 0.00
Total 4,997.80 7,232.50 2,234.70 3,053.96 715.04 -74.81 2,369.03 84.45 -76.71 -282.64 -3,553.62 380.96 -104.68 -183.00
Table 4B. Chile (1995-2011). Breakdown of employment change by sector (percentage)
Employment 1995
Employment 2011
Rise in employment 2011-1995
1) Changes in final
consumption
2) Changes in investment[1]
Changes in inventories
3) Changes in exports
4) Changes in production technology
5) Structur-al changes
in inter-mediate imports
6) Structural changes in
final imports
7) Changes in labour produc-
tivity
3) Changes in exports
5) Structural changes in
intermediate imports
6) Structural changes in
final imports
C01T05: Agriculture, hunting, forestry and fishing
762.30 807.30 45.00 182.2% 20.6% 13.9% 472.5% 90.5% -9.8% -18.5% -651.6% 46.4% -2.1% -0.5%
C10T14: Mining and quarrying 28.50 56.70 28.20 -335.2% -5.7% -329.5% 768.9% -76.1% -8.6% 2.0% 84.2% 163.9% -12.4% 0.0%
C15T16: Food products, beverages and tobacco
240.40 329.60 89.20 534.8% 3.6% 4.6% 299.1% 1.4% -12.0% -21.2% -710.3% 17.1% -7.7% -1.9%
C17T19: Textiles, textile products, leather and footwear
130.60 51.60 -79.00 1.6% 0.0% 0.0% -81.5% -5.4% 9.7% 150.5% 25.1% -2.2% 29.8% 104.5%
C20: Wood and products of wood and cork 51.30 54.90 3.60 4.4% 19.9% -3.5% 1705.6% 498.6% -62.7% -122.5% -1939.7% 96.2% -7.2% -22.0%
C21T22: Pulp, paper, paper products, printing and publishing
53.90 68.60 14.70 224.1% 16.2% 4.5% 413.3% 6.7% -19.0% 38.5% -584.3% 120.4% -15.6% -2.6%
(continues...)
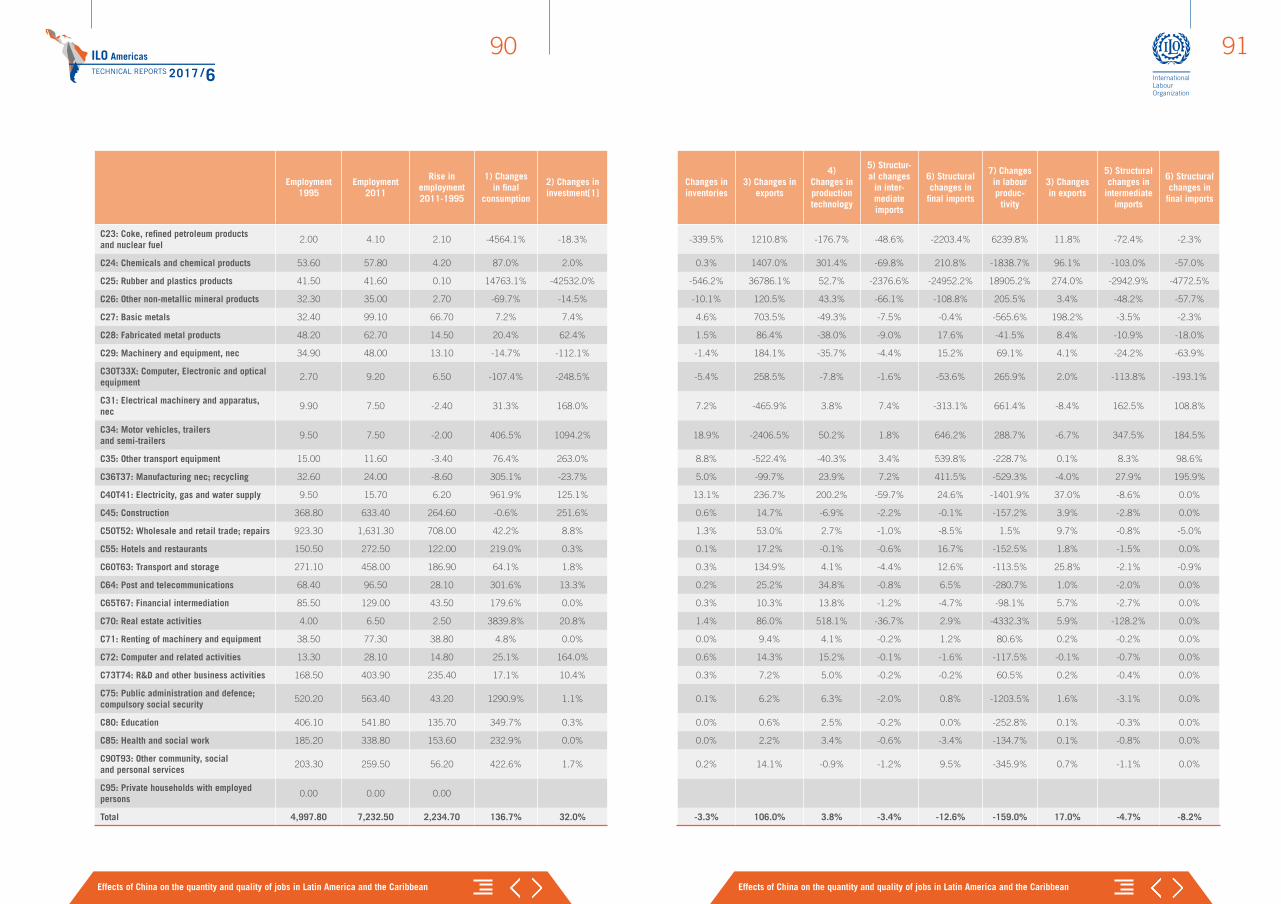
ILO AmericasTECHNICAL REPORTS 2017 /6
Effects of China on the quantity and quality of jobs in Latin America and the Caribbean Effects of China on the quantity and quality of jobs in Latin America and the Caribbean
9190
Employment 1995
Employment 2011
Rise in employment 2011-1995
1) Changes in final
consumption
2) Changes in investment[1]
Changes in inventories
3) Changes in exports
4) Changes in production technology
5) Structur-al changes
in inter-mediate imports
6) Structural changes in
final imports
7) Changes in labour produc-
tivity
3) Changes in exports
5) Structural changes in
intermediate imports
6) Structural changes in
final imports
C23: Coke, refined petroleum products and nuclear fuel
2.00 4.10 2.10 -4564.1% -18.3% -339.5% 1210.8% -176.7% -48.6% -2203.4% 6239.8% 11.8% -72.4% -2.3%
C24: Chemicals and chemical products 53.60 57.80 4.20 87.0% 2.0% 0.3% 1407.0% 301.4% -69.8% 210.8% -1838.7% 96.1% -103.0% -57.0%
C25: Rubber and plastics products 41.50 41.60 0.10 14763.1% -42532.0% -546.2% 36786.1% 52.7% -2376.6% -24952.2% 18905.2% 274.0% -2942.9% -4772.5%
C26: Other non-metallic mineral products 32.30 35.00 2.70 -69.7% -14.5% -10.1% 120.5% 43.3% -66.1% -108.8% 205.5% 3.4% -48.2% -57.7%
C27: Basic metals 32.40 99.10 66.70 7.2% 7.4% 4.6% 703.5% -49.3% -7.5% -0.4% -565.6% 198.2% -3.5% -2.3%
C28: Fabricated metal products 48.20 62.70 14.50 20.4% 62.4% 1.5% 86.4% -38.0% -9.0% 17.6% -41.5% 8.4% -10.9% -18.0%
C29: Machinery and equipment, nec 34.90 48.00 13.10 -14.7% -112.1% -1.4% 184.1% -35.7% -4.4% 15.2% 69.1% 4.1% -24.2% -63.9%
C30T33X: Computer, Electronic and optical equipment
2.70 9.20 6.50 -107.4% -248.5% -5.4% 258.5% -7.8% -1.6% -53.6% 265.9% 2.0% -113.8% -193.1%
C31: Electrical machinery and apparatus, nec
9.90 7.50 -2.40 31.3% 168.0% 7.2% -465.9% 3.8% 7.4% -313.1% 661.4% -8.4% 162.5% 108.8%
C34: Motor vehicles, trailers and semi-trailers
9.50 7.50 -2.00 406.5% 1094.2% 18.9% -2406.5% 50.2% 1.8% 646.2% 288.7% -6.7% 347.5% 184.5%
C35: Other transport equipment 15.00 11.60 -3.40 76.4% 263.0% 8.8% -522.4% -40.3% 3.4% 539.8% -228.7% 0.1% 8.3% 98.6%
C36T37: Manufacturing nec; recycling 32.60 24.00 -8.60 305.1% -23.7% 5.0% -99.7% 23.9% 7.2% 411.5% -529.3% -4.0% 27.9% 195.9%
C40T41: Electricity, gas and water supply 9.50 15.70 6.20 961.9% 125.1% 13.1% 236.7% 200.2% -59.7% 24.6% -1401.9% 37.0% -8.6% 0.0%
C45: Construction 368.80 633.40 264.60 -0.6% 251.6% 0.6% 14.7% -6.9% -2.2% -0.1% -157.2% 3.9% -2.8% 0.0%
C50T52: Wholesale and retail trade; repairs 923.30 1,631.30 708.00 42.2% 8.8% 1.3% 53.0% 2.7% -1.0% -8.5% 1.5% 9.7% -0.8% -5.0%
C55: Hotels and restaurants 150.50 272.50 122.00 219.0% 0.3% 0.1% 17.2% -0.1% -0.6% 16.7% -152.5% 1.8% -1.5% 0.0%
C60T63: Transport and storage 271.10 458.00 186.90 64.1% 1.8% 0.3% 134.9% 4.1% -4.4% 12.6% -113.5% 25.8% -2.1% -0.9%
C64: Post and telecommunications 68.40 96.50 28.10 301.6% 13.3% 0.2% 25.2% 34.8% -0.8% 6.5% -280.7% 1.0% -2.0% 0.0%
C65T67: Financial intermediation 85.50 129.00 43.50 179.6% 0.0% 0.3% 10.3% 13.8% -1.2% -4.7% -98.1% 5.7% -2.7% 0.0%
C70: Real estate activities 4.00 6.50 2.50 3839.8% 20.8% 1.4% 86.0% 518.1% -36.7% 2.9% -4332.3% 5.9% -128.2% 0.0%
C71: Renting of machinery and equipment 38.50 77.30 38.80 4.8% 0.0% 0.0% 9.4% 4.1% -0.2% 1.2% 80.6% 0.2% -0.2% 0.0%
C72: Computer and related activities 13.30 28.10 14.80 25.1% 164.0% 0.6% 14.3% 15.2% -0.1% -1.6% -117.5% -0.1% -0.7% 0.0%
C73T74: R&D and other business activities 168.50 403.90 235.40 17.1% 10.4% 0.3% 7.2% 5.0% -0.2% -0.2% 60.5% 0.2% -0.4% 0.0%
C75: Public administration and defence; compulsory social security
520.20 563.40 43.20 1290.9% 1.1% 0.1% 6.2% 6.3% -2.0% 0.8% -1203.5% 1.6% -3.1% 0.0%
C80: Education 406.10 541.80 135.70 349.7% 0.3% 0.0% 0.6% 2.5% -0.2% 0.0% -252.8% 0.1% -0.3% 0.0%
C85: Health and social work 185.20 338.80 153.60 232.9% 0.0% 0.0% 2.2% 3.4% -0.6% -3.4% -134.7% 0.1% -0.8% 0.0%
C90T93: Other community, social and personal services
203.30 259.50 56.20 422.6% 1.7% 0.2% 14.1% -0.9% -1.2% 9.5% -345.9% 0.7% -1.1% 0.0%
C95: Private households with employed persons
0.00 0.00 0.00
Total 4,997.80 7,232.50 2,234.70 136.7% 32.0% -3.3% 106.0% 3.8% -3.4% -12.6% -159.0% 17.0% -4.7% -8.2%

Effects of China on the quantity and quality of jobs in Latin America and the Caribbean
93
Table 4C. Chile (1995-2011). Structural breakdown of employment change
Effects of changes related to: Thousands of jobsShare as factor of
increase or decline in employment
Share as factor of increase or decline
in employment
Final consumption 3,053.96 49.1%
Investment 715.04 11.5%
Inventories -74.81 1.9%
Exports 2,369.03 38.1%
Exports to China 380.96 6.1% 16.1%
Production technology 84.45 1.4%
Structural changes in intermediate imports -76.71 1.9%
Intermediate imports from China -104.68 2.6% 136.5%
Structural changes in final imports -282.64 7.1%
Final imports from China -183.00 4.6% 64.7%
Changes in labour productivity -3,553.62 89.1%
Total employment change 2,234.70
Source: Estimates compiled based on OECD's IOM and ICIO data (1995, 2000, 2005 and 2011).

ILO AmericasTECHNICAL REPORTS 2017 /6
Effects of China on the quantity and quality of jobs in Latin America and the Caribbean Effects of China on the quantity and quality of jobs in Latin America and the Caribbean
9594
Table 5A. Mexico (1995-2011). Breakdown of employment change by sector (thousands of jobs)
Employment 1995
Employment 2011
Rise in employment 2011-1995
1) Changes in final
consumption
2) Changes in investment[1]
Changes in inventories
3) Changes in exports
4) Changes in production technology
5) Structur-al changes
in inter-mediate imports
6) Structural changes in
final imports
7) Changes in labour
productivity
3a) Changes in exports to
China
5a) Structur-al changes
in intermedi-ate imports
to China
6a) Structural changes in
final imports to China
C01T05: Agriculture, hunting, forestry and fishing
7,661.20 6,093.30 -1,567.90 656.66 24.06 142.20 599.09 65.53 -16.55 -460.29 -2,578.60 13.42 -1.30 -6.90
C10T14: Mining and quarrying 100.20 186.10 85.90 1.60 81.46 76.64 279.71 -26.17 -3.93 -5.30 -318.11 16.78 -0.76 -0.01
C15T16: Food products, beverages and tobacco
1,088.00 1,823.20 735.20 5,223.30 0.59 121.32 570.95 22.72 -52.39 -95.71 -5,055.58 4.54 -4.07 -5.62
C17T19: Textiles, textile products, leather and footwear
817.60 826.60 9.00 372.29 0.98 -3.90 211.25 -40.25 -8.74 -6.78 -515.84 4.31 -4.37 -35.73
C20: Wood and products of wood and cork 193.80 178.70 -15.10 -9.52 -0.34 -2.27 -4.85 1.20 -2.54 -47.02 50.24 0.07 -0.19 -6.42
C21T22: Pulp, paper, paper products, printing and publishing
328.00 504.90 176.90 -12.88 -1.06 0.53 80.76 4.03 -6.39 -27.03 138.93 3.11 -1.27 -1.88
C23: Coke, refined petroleum products and nuclear fuel
56.80 101.60 44.80 -39.80 -0.01 -5.45 108.48 16.02 -2.95 -81.26 49.78 0.29 -0.78 -0.04
C24: Chemicals and chemical products 256.90 310.40 53.50 -24.62 -0.04 -0.62 237.42 3.33 -16.17 -47.57 -98.23 7.88 -2.64 -7.97
C25: Rubber and plastics products 198.10 283.40 85.30 -248.82 -2.38 -28.10 212.55 17.35 -5.46 43.06 97.10 5.03 -1.09 -15.63
C26: Other non-metallic mineral products 342.50 479.80 137.30 68.81 0.54 4.16 68.15 -11.06 -2.68 -10.73 20.11 0.58 -0.62 -7.15
C27: Basic metals 130.20 208.80 78.60 -4.62 -26.82 -111.26 363.90 -26.53 -2.65 -18.86 -94.56 11.80 -1.63 -8.03
C28: Fabricated metal products 244.80 357.10 112.30 -184.29 -77.03 -43.46 233.69 1.39 -2.43 -28.56 213.00 1.09 -1.68 -18.75
C29: Machinery and equipment, nec 103.60 209.00 105.40 -23.12 -313.86 -24.37 881.62 -18.49 -5.09 -184.95 -206.34 3.82 -5.09 -31.84
C30T33X: Computer, Electronic and optical equipment
282.70 410.40 127.70 -1,506.32 -1,230.04 -778.67 7,040.52 50.39 -46.77 -1,368.31 -2,033.09 117.06 -68.56 -375.65
C31: Electrical machinery and apparatus, nec
162.60 263.00 100.40 -221.40 -45.40 -83.06 1,188.49 6.53 -8.59 -27.48 -708.70 24.08 -8.78 -67.09
C34: Motor vehicles, trailers and semi-trailers
458.90 739.70 280.80 141.44 53.40 29.88 3,800.54 -20.43 -38.05 -202.37 -3,483.62 36.94 -18.08 -10.55
C35: Other transport equipment 17.50 31.40 13.90 1.12 0.79 0.26 127.57 4.73 -0.81 -3.75 -116.02 0.11 -0.79 -2.92
C36T37: Manufacturing nec; recycling 339.30 516.90 177.60 161.21 44.94 10.92 354.38 -6.59 -6.58 -85.89 -294.80 3.22 -3.31 -16.93
C40T41: Electricity, gas and water supply 57.70 183.50 125.80 202.40 0.03 3.15 14.63 29.40 -4.69 2.51 -121.64 0.00 -0.72 0.00
C45: Construction 2,247.30 3,772.70 1,525.40 -0.88 5,188.58 47.97 4.05 -25.22 -11.83 4.80 -3,682.06 0.75 -5.53 -0.11
C50T52: Wholesale and retail trade; repairs 6,597.10 9,505.80 2,908.70 3,267.80 411.78 340.88 985.31 -42.93 -19.17 -36.96 -1,998.01 39.05 -15.28 -49.58
C55: Hotels and restaurants 1,302.00 2,955.40 1,653.40 1,185.26 0.30 -0.33 74.37 22.31 -3.88 141.58 233.79 23.04 -0.91 -1.70
C60T63: Transport and storage 1,143.20 2,252.40 1,109.20 1,528.18 56.18 50.55 265.40 -45.70 -16.87 68.44 -796.99 10.61 -3.36 -4.60
C64: Post and telecommunications 108.20 192.00 83.80 669.14 0.31 2.44 6.87 25.33 -4.26 6.52 -622.55 0.43 -3.77 -0.02
C65T67: Financial intermediation 357.10 483.50 126.40 507.87 0.26 0.90 6.44 84.16 -0.88 17.83 -490.18 3.04 -0.90 0.07
C70: Real estate activities 36.80 129.30 92.50 191.45 0.00 0.07 0.84 -31.20 -2.91 0.45 -66.20 0.03 -1.34 0.00
(continues...)
MEXICO
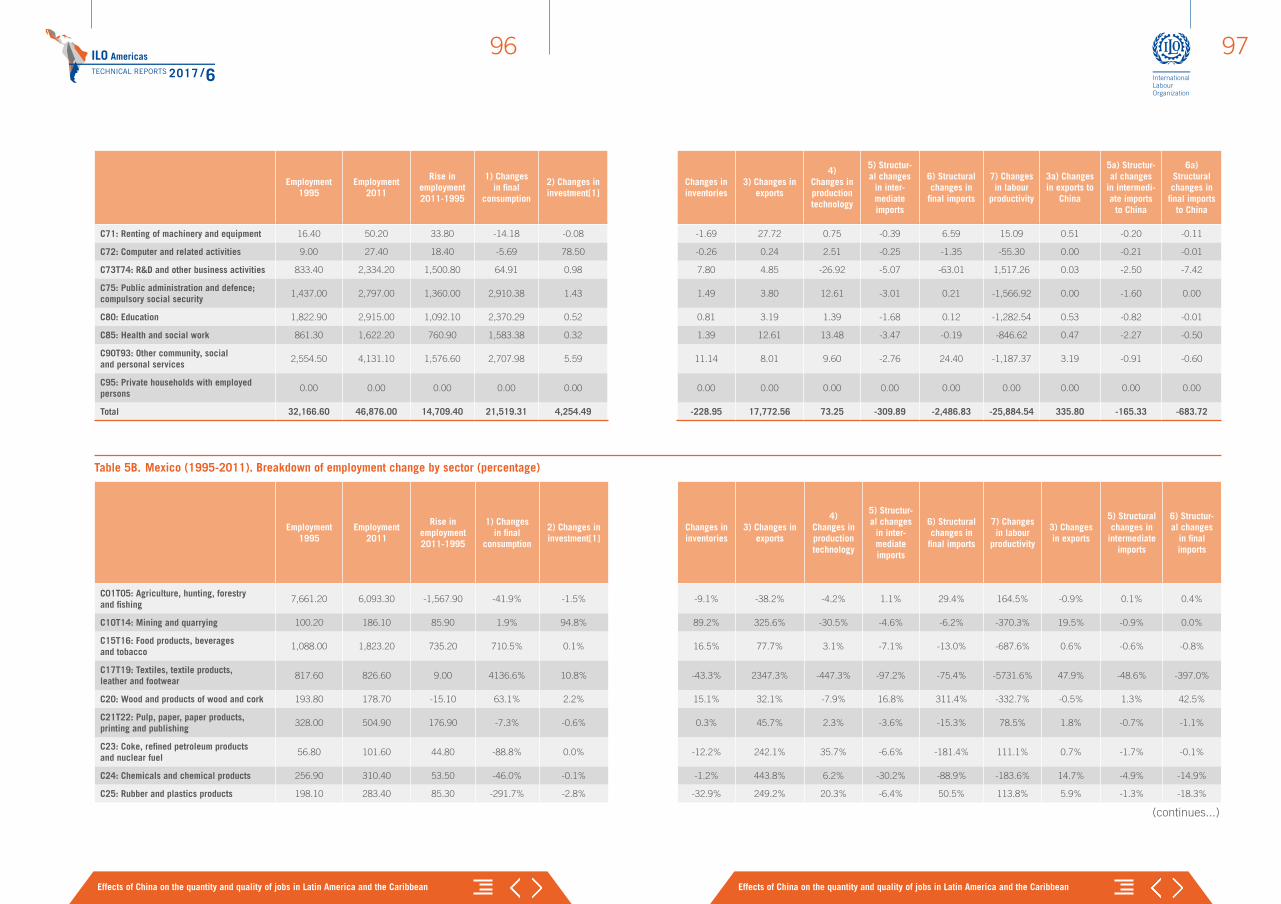
ILO AmericasTECHNICAL REPORTS 2017 /6
Effects of China on the quantity and quality of jobs in Latin America and the Caribbean Effects of China on the quantity and quality of jobs in Latin America and the Caribbean
9796
Employment 1995
Employment 2011
Rise in employment 2011-1995
1) Changes in final
consumption
2) Changes in investment[1]
Changes in inventories
3) Changes in exports
4) Changes in production technology
5) Structur-al changes
in inter-mediate imports
6) Structural changes in
final imports
7) Changes in labour
productivity
3a) Changes in exports to
China
5a) Structur-al changes
in intermedi-ate imports
to China
6a) Structural changes in
final imports to China
C71: Renting of machinery and equipment 16.40 50.20 33.80 -14.18 -0.08 -1.69 27.72 0.75 -0.39 6.59 15.09 0.51 -0.20 -0.11
C72: Computer and related activities 9.00 27.40 18.40 -5.69 78.50 -0.26 0.24 2.51 -0.25 -1.35 -55.30 0.00 -0.21 -0.01
C73T74: R&D and other business activities 833.40 2,334.20 1,500.80 64.91 0.98 7.80 4.85 -26.92 -5.07 -63.01 1,517.26 0.03 -2.50 -7.42
C75: Public administration and defence; compulsory social security
1,437.00 2,797.00 1,360.00 2,910.38 1.43 1.49 3.80 12.61 -3.01 0.21 -1,566.92 0.00 -1.60 0.00
C80: Education 1,822.90 2,915.00 1,092.10 2,370.29 0.52 0.81 3.19 1.39 -1.68 0.12 -1,282.54 0.53 -0.82 -0.01
C85: Health and social work 861.30 1,622.20 760.90 1,583.38 0.32 1.39 12.61 13.48 -3.47 -0.19 -846.62 0.47 -2.27 -0.50
C90T93: Other community, social and personal services
2,554.50 4,131.10 1,576.60 2,707.98 5.59 11.14 8.01 9.60 -2.76 24.40 -1,187.37 3.19 -0.91 -0.60
C95: Private households with employed persons
0.00 0.00 0.00 0.00 0.00 0.00 0.00 0.00 0.00 0.00 0.00 0.00 0.00 0.00
Total 32,166.60 46,876.00 14,709.40 21,519.31 4,254.49 -228.95 17,772.56 73.25 -309.89 -2,486.83 -25,884.54 335.80 -165.33 -683.72
Table 5B. Mexico (1995-2011). Breakdown of employment change by sector (percentage)
Employment 1995
Employment 2011
Rise in employment 2011-1995
1) Changes in final
consumption
2) Changes in investment[1]
Changes in inventories
3) Changes in exports
4) Changes in production technology
5) Structur-al changes
in inter-mediate imports
6) Structural changes in
final imports
7) Changes in labour
productivity
3) Changes in exports
5) Structural changes in
intermediate imports
6) Structur-al changes
in final imports
C01T05: Agriculture, hunting, forestry and fishing
7,661.20 6,093.30 -1,567.90 -41.9% -1.5% -9.1% -38.2% -4.2% 1.1% 29.4% 164.5% -0.9% 0.1% 0.4%
C10T14: Mining and quarrying 100.20 186.10 85.90 1.9% 94.8% 89.2% 325.6% -30.5% -4.6% -6.2% -370.3% 19.5% -0.9% 0.0%
C15T16: Food products, beverages and tobacco
1,088.00 1,823.20 735.20 710.5% 0.1% 16.5% 77.7% 3.1% -7.1% -13.0% -687.6% 0.6% -0.6% -0.8%
C17T19: Textiles, textile products, leather and footwear
817.60 826.60 9.00 4136.6% 10.8% -43.3% 2347.3% -447.3% -97.2% -75.4% -5731.6% 47.9% -48.6% -397.0%
C20: Wood and products of wood and cork 193.80 178.70 -15.10 63.1% 2.2% 15.1% 32.1% -7.9% 16.8% 311.4% -332.7% -0.5% 1.3% 42.5%
C21T22: Pulp, paper, paper products, printing and publishing
328.00 504.90 176.90 -7.3% -0.6% 0.3% 45.7% 2.3% -3.6% -15.3% 78.5% 1.8% -0.7% -1.1%
C23: Coke, refined petroleum products and nuclear fuel
56.80 101.60 44.80 -88.8% 0.0% -12.2% 242.1% 35.7% -6.6% -181.4% 111.1% 0.7% -1.7% -0.1%
C24: Chemicals and chemical products 256.90 310.40 53.50 -46.0% -0.1% -1.2% 443.8% 6.2% -30.2% -88.9% -183.6% 14.7% -4.9% -14.9%
C25: Rubber and plastics products 198.10 283.40 85.30 -291.7% -2.8% -32.9% 249.2% 20.3% -6.4% 50.5% 113.8% 5.9% -1.3% -18.3%
(continues...)
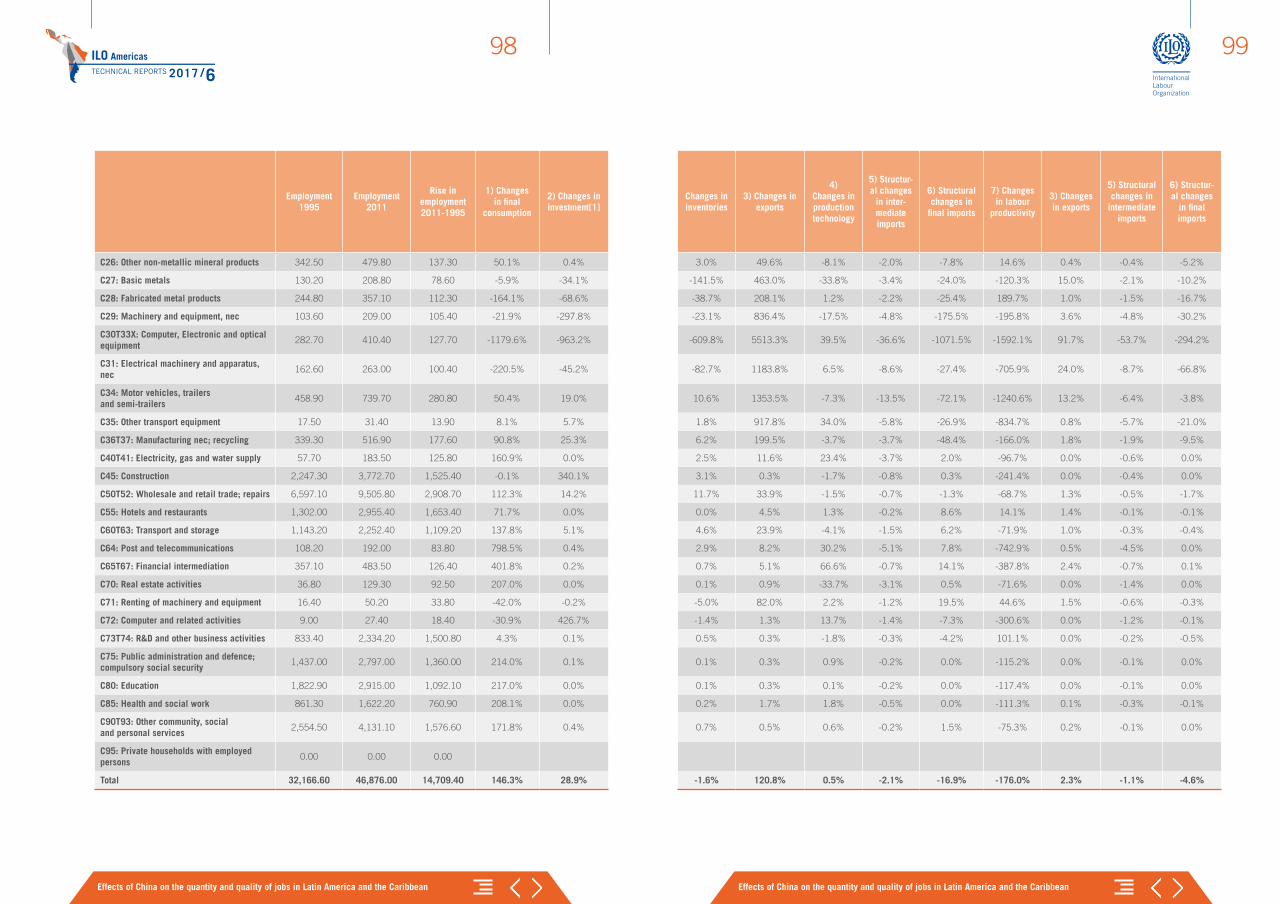
ILO AmericasTECHNICAL REPORTS 2017 /6
Effects of China on the quantity and quality of jobs in Latin America and the Caribbean Effects of China on the quantity and quality of jobs in Latin America and the Caribbean
9998
Employment 1995
Employment 2011
Rise in employment 2011-1995
1) Changes in final
consumption
2) Changes in investment[1]
Changes in inventories
3) Changes in exports
4) Changes in production technology
5) Structur-al changes
in inter-mediate imports
6) Structural changes in
final imports
7) Changes in labour
productivity
3) Changes in exports
5) Structural changes in
intermediate imports
6) Structur-al changes
in final imports
C26: Other non-metallic mineral products 342.50 479.80 137.30 50.1% 0.4% 3.0% 49.6% -8.1% -2.0% -7.8% 14.6% 0.4% -0.4% -5.2%
C27: Basic metals 130.20 208.80 78.60 -5.9% -34.1% -141.5% 463.0% -33.8% -3.4% -24.0% -120.3% 15.0% -2.1% -10.2%
C28: Fabricated metal products 244.80 357.10 112.30 -164.1% -68.6% -38.7% 208.1% 1.2% -2.2% -25.4% 189.7% 1.0% -1.5% -16.7%
C29: Machinery and equipment, nec 103.60 209.00 105.40 -21.9% -297.8% -23.1% 836.4% -17.5% -4.8% -175.5% -195.8% 3.6% -4.8% -30.2%
C30T33X: Computer, Electronic and optical equipment
282.70 410.40 127.70 -1179.6% -963.2% -609.8% 5513.3% 39.5% -36.6% -1071.5% -1592.1% 91.7% -53.7% -294.2%
C31: Electrical machinery and apparatus, nec
162.60 263.00 100.40 -220.5% -45.2% -82.7% 1183.8% 6.5% -8.6% -27.4% -705.9% 24.0% -8.7% -66.8%
C34: Motor vehicles, trailers and semi-trailers
458.90 739.70 280.80 50.4% 19.0% 10.6% 1353.5% -7.3% -13.5% -72.1% -1240.6% 13.2% -6.4% -3.8%
C35: Other transport equipment 17.50 31.40 13.90 8.1% 5.7% 1.8% 917.8% 34.0% -5.8% -26.9% -834.7% 0.8% -5.7% -21.0%
C36T37: Manufacturing nec; recycling 339.30 516.90 177.60 90.8% 25.3% 6.2% 199.5% -3.7% -3.7% -48.4% -166.0% 1.8% -1.9% -9.5%
C40T41: Electricity, gas and water supply 57.70 183.50 125.80 160.9% 0.0% 2.5% 11.6% 23.4% -3.7% 2.0% -96.7% 0.0% -0.6% 0.0%
C45: Construction 2,247.30 3,772.70 1,525.40 -0.1% 340.1% 3.1% 0.3% -1.7% -0.8% 0.3% -241.4% 0.0% -0.4% 0.0%
C50T52: Wholesale and retail trade; repairs 6,597.10 9,505.80 2,908.70 112.3% 14.2% 11.7% 33.9% -1.5% -0.7% -1.3% -68.7% 1.3% -0.5% -1.7%
C55: Hotels and restaurants 1,302.00 2,955.40 1,653.40 71.7% 0.0% 0.0% 4.5% 1.3% -0.2% 8.6% 14.1% 1.4% -0.1% -0.1%
C60T63: Transport and storage 1,143.20 2,252.40 1,109.20 137.8% 5.1% 4.6% 23.9% -4.1% -1.5% 6.2% -71.9% 1.0% -0.3% -0.4%
C64: Post and telecommunications 108.20 192.00 83.80 798.5% 0.4% 2.9% 8.2% 30.2% -5.1% 7.8% -742.9% 0.5% -4.5% 0.0%
C65T67: Financial intermediation 357.10 483.50 126.40 401.8% 0.2% 0.7% 5.1% 66.6% -0.7% 14.1% -387.8% 2.4% -0.7% 0.1%
C70: Real estate activities 36.80 129.30 92.50 207.0% 0.0% 0.1% 0.9% -33.7% -3.1% 0.5% -71.6% 0.0% -1.4% 0.0%
C71: Renting of machinery and equipment 16.40 50.20 33.80 -42.0% -0.2% -5.0% 82.0% 2.2% -1.2% 19.5% 44.6% 1.5% -0.6% -0.3%
C72: Computer and related activities 9.00 27.40 18.40 -30.9% 426.7% -1.4% 1.3% 13.7% -1.4% -7.3% -300.6% 0.0% -1.2% -0.1%
C73T74: R&D and other business activities 833.40 2,334.20 1,500.80 4.3% 0.1% 0.5% 0.3% -1.8% -0.3% -4.2% 101.1% 0.0% -0.2% -0.5%
C75: Public administration and defence; compulsory social security
1,437.00 2,797.00 1,360.00 214.0% 0.1% 0.1% 0.3% 0.9% -0.2% 0.0% -115.2% 0.0% -0.1% 0.0%
C80: Education 1,822.90 2,915.00 1,092.10 217.0% 0.0% 0.1% 0.3% 0.1% -0.2% 0.0% -117.4% 0.0% -0.1% 0.0%
C85: Health and social work 861.30 1,622.20 760.90 208.1% 0.0% 0.2% 1.7% 1.8% -0.5% 0.0% -111.3% 0.1% -0.3% -0.1%
C90T93: Other community, social and personal services
2,554.50 4,131.10 1,576.60 171.8% 0.4% 0.7% 0.5% 0.6% -0.2% 1.5% -75.3% 0.2% -0.1% 0.0%
C95: Private households with employed persons
0.00 0.00 0.00
Total 32,166.60 46,876.00 14,709.40 146.3% 28.9% -1.6% 120.8% 0.5% -2.1% -16.9% -176.0% 2.3% -1.1% -4.6%
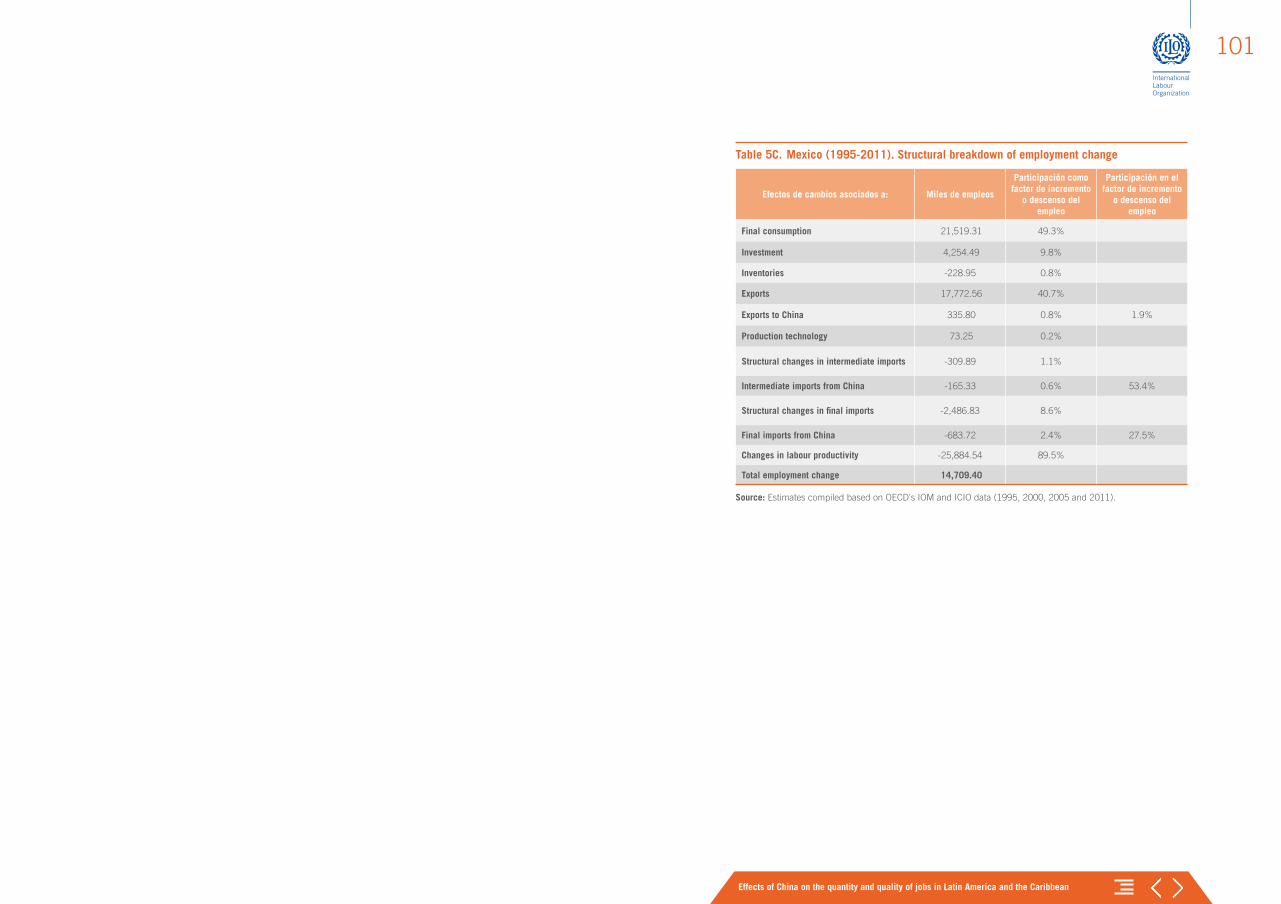
Effects of China on the quantity and quality of jobs in Latin America and the Caribbean
101
Table 5C. Mexico (1995-2011). Structural breakdown of employment change
Efectos de cambios asociados a: Miles de empleos
Participación como factor de incremento
o descenso del empleo
Participación en el factor de incremento
o descenso del empleo
Final consumption 21,519.31 49.3%
Investment 4,254.49 9.8%
Inventories -228.95 0.8%
Exports 17,772.56 40.7%
Exports to China 335.80 0.8% 1.9%
Production technology 73.25 0.2%
Structural changes in intermediate imports -309.89 1.1%
Intermediate imports from China -165.33 0.6% 53.4%
Structural changes in final imports -2,486.83 8.6%
Final imports from China -683.72 2.4% 27.5%
Changes in labour productivity -25,884.54 89.5%
Total employment change 14,709.40
Source: Estimates compiled based on OECD's IOM and ICIO data (1995, 2000, 2005 and 2011).
Promoting Decent Work in Global Supply Chains in Latin America and the CaribbeanKEY ISSUES, GOOD PRACTICES, LESSONS LEARNED AND POLICY INSIGHTS
TITLES IN THIS SERIES
Labour migration in Latin America and the CaribbeanDIAGNOSIS, STRATEGY, AND ILO’S WORK IN THE REGION
Cluster and Productive Development Policies in the Autonomous Community of the Basque CountryLESSONS FOR LATIN AMERICA AND THE CARIBBEAN
Productive development, transition to formality and labour standardsPRIORITARY AREAS OF WORK FOR THE ILO IN LATIN AMERICA AND THE CARIBBEAN
ILO AmericasTECHNICALR E P O R T S
/1
/2
/3
/4
ILO AmericasTECHNICALR E P O R T S
2 0 1 7 / 6