Embed Size (px)
Citation preview

Effects of Charge Motion Control
During Cold Start of SI Engines
by
Dongkun Lee
B.S., Mechanical and Aerospace Engineering Seoul N ational University, 2003
Submitted to the Department of Mechanical Engineering in partial fulfillment of the requirements for the degree of
Master of Science in Mechanical Engineering
at the
MASSACHUSETTS INSTITUTE OF TECHNOLOGY
September 2005
© Massachusetts Institute of Technology 2005. All rights reserved. )
Signature redacted Author ............. ~-.;'-"; ........................................... .
C,... Department of Mechanical Engineering August 19, 2005
Signature redacted Certified by ......................... ' .................. . , . ':' .' ...... '"':' .. .
John B. Heywood Professor of Mechanical Engineering
~ Thesis Supervisor
Signature redacted Accepted by ........................................................ .
Lallit Anand Chairman, Department Committee on Graduate Students
MASSACHUSETTS INS OF TECHNOLOGY ' ___ -NOV 0 7 2005
LIBRARIES

2

To my mother
3

4

Effects of Charge Motion ControlDuring Cold Start of SI Engines
by
Dongkun Lee
Submitted to the Department of Mechanical Engineeringon August 19, 2005 in partial fulfillment of the
requirements for the degree ofMaster of Science in Mechanical Engineering
Abstract
An experimental study was conducted to investigate the effects of various intakecharge motion control approaches on the cold start-up process of a port fuel injected SI en-gine. Engine experiments were performed to assess the effectiveness of enhanced chargemotion on mixture preparation, combustion, and hydrocarbon (HC) emissions. Differentcharge motions were produced by three different shapes of charge motion control valves(CMCV), which block off 75% of the engine's intake ports.
Cold-fluid steady state experiments were carried out with the CMCV open and closed.Increased charge motion with the CMCV closed was found to shorten the combustion dura-tion, which caused the 50% mass fraction burned to occur up to 50 CA earlier for the samespark timing. By the use of the CMCV, significant improvements in combustion stability(up to 1.5% reduction in COV) and fuel efficiency (up to 8% reduction in ISFC) wereachieved with increased levels of spark timing retard due to enhanced air-fuel mixing andrelatively faster burning.
Engine start-up experiments were conducted with three different geometric chargemotion control valves. The CMCV improved mixture preparation due to increased swirland tumble intensities, which enhanced fuel distribution and evaporation. Moderate sparkretard (AOs, -5') was found to reduce the engine-out HC emissions during the enginestart-up process. Peak engine-out HC emissions with the CMCV closed occurred in the ear-lier stages of engine start-up process relative to the CMCV open case. Greater fuel vapori-zation and faster burning rate with the CMCV closed allowed reduced fuel injection andadditional spark retard, resulting in significantly reduced HC emissions. The engine-out HCemissions were reduced by 18% during the 0-3 seconds and by 7% during the 3-20 seconds.
Thesis Supervisor: John B. HeywoodTitle: Professor of Mechanical Engineering
5

6

Acknowledgments
I am ever grateful to God, the Creator and the Guardian, to whom I owe my very exis-tence. He has assured me that He will be with me and pointed out to me that no one hasknowledge, power, or importance apart from him.
There have been a number of people without whom this thesis could not have beencompleted. My deepest gratitude goes out to my supervisor, Professor John Heywood. Ithas been an honor to be mentored by a leader of such great character, knowledge, and in-tegrity. He has tolerated an incalculable number of questions from me and has weatheredthat storm beautifully. He has not only taught me about internal combustion engines butalso showed me the way of thinking to conduct research.
I would like to thank all of the members of the MIT Engines and Fuels Research Con-sortium (General Motors, Ford, Daimler Chrysler, Delphi, and Saudi Aramco) for theirvaluable feedback and support. Special thanks to Dr. Ron Herrin and Dr. Norm Maasshoffof General Motors, who provided the engine, charge motion control devices, and flow test-ing results. It has been a pleasure working with them, and I hope to continue our workingrelationship in the future.
The Sloan Automotive Laboratory has been a great place to work, learn, and socializewith fellow students and dedicated MIT employees. Thanks to Michael Gerty and BrianHallgren for their assistance and companionship for the past two years. It is impossible toname everybody, but I would like to thank those who made my life at the lab interestingand helped me with my research.
I am very fortunate to have wonderful friends with whom I have shared many greattimes. I would like to extend special thanks to my dream house members (Soon-Jo Chung,Ki Tae Nam, Hyun Jin In, and Jooeun Ahn) for their friendships which have made my lifeat MIT more enjoyable and truly colorful.
All these years, my family has always been there for me. I would like to express myundying gratitude to my mother, Seok Joong, for her love, prayers, and for providing me amodel of how I should live. I also would like to thank my sister, Jin-Ju, for her support andencouragement. Knowing that I have you standing behind me, I will never be afraid tomarch forward. I love you. Finally, I wish to thank my father, Seung Yeon, who I wouldgive anything to have seen me finish this research project.
Dongkun LeeAugust 2005
7

8

Contents
Abstract................................................................................................................................... 5
A cknow ledgm ents .................................................................................................................. 7
Contents .................................................................................................................................. 9
List of Figures....................................................................................................................... 13
List of Tables ........................................................................................................................ 17
N om enclature........................................................................................................................ 19
Chapter 1: Introduction..................................................................................................... 21
1.1 Background and M otivation......................................................................... 21
1.2 Previous W ork .............................................................................................. 22
1.3 Research Objectives .................................................................................... 23
Chapter 2 Experim ental Apparatus and Procedures ........................................................ 25
2.1 Experim ental Setup ...................................................................................... 25
2.1.1 Engine and D ynam om eter ................................................................... 25
2.1.2 Engine Subsystem s and Instrum entation............................................. 26
2.1.3 Engine Control System .......................................................................... 27
2.1.4 Charge M otion Control V alve .............................................................. 27
2.1.5 In-cylinder Pressure m easurem ents ..................................................... 28
2.1.6 D ata A cquisition System ..................................................................... 28
2.1.7 Fast-Response Em issions Analyzers ................................................... 29
2.2 Experim ental Conditions and Procedure ..................................................... 31
2.2.1 Steady State Test Conditions and Procedure ........................................ 31
2.2.2 Start-up Test Conditions and Procedure............................................... 32
2.3 A nalysis M ethod............................................................................................ 34
2.3.1 Residual G as Fraction.......................................................................... 34
2.3.2 A ir/Fuel Ratio D eterm ination............................................................... 34
2.3.3 Burn Rate Analysis.............................................................................. 36
9
Chapter 3 : Steady State Experimental Results ................................................................. 37
3.1 Charge M otion Overview ............................................................................ 37
3.2 Combustion Characteristics.......................................................................... 38
3.2.1 Combustion Stability ............................................................................ 38
3.2.2 Bum Rate Analysis............................................................................... 39
3.3 Exhaust Emissions........................................................................................ 41
3.3.1 Exhaust Gas Temperature...................................................................... 41
3.3.2 Exhaust HC Emissions .......................................................................... 42
Chapter 4 : Engine Start-up Experimental Results.......................................................... 47
4.1 Engine Start-up Overview ............................................................................ 47
4.2 Comparison Results of Various CM CVs ..................................................... 49
4.2.1 CM CV Overview................................................................................. 49
4.2.2 M ixture Preparation...............................................................................50
4.2.3 Combustion Characteristics................................................................. 53
4.2.4 Exhaust Emissions................................................................................. 56
4.2.5 Flow Testing Results ............................................................................ 58
4.2.6 Overall Assessment of Different CM CVs ............................................. 60
4.3 Effects of Reduced Fuel Injection ................................................................. 61
4.3.1 M odification of Fuel Injection............................................................. 61
4.3.2 M ixture Preparation............................................................................... 61
4.3.3 Combustion Characteristics................................................................. 62
4.3.4 Exhaust Emissions................................................................................. 65
4.4 Effects of Retarded Spark Timing ............................................................... 67
4.4.1 M odification of Spark Timing ............................................................. 67
4.4.2 M ixture Preparation...............................................................................68
4.4.3 Combustion Characteristics................................................................. 68
4.4.4 Exhaust Emissions.................................................................................71
4.5 M odified Start-up Strategy with CM CV closed........................................... 73
4.5.1 M odification of Fuel Injection and Spark Timing................................ 73
4.5.2 M ixture Preparation...............................................................................75
10

4.5.3 Com bustion Characteristics................................................................... 75
4.5.4 Exhaust Em issions................................................................................ 79
Chapter 5 : Summary, Conclusions, and Recommendations ............................................ 81
5.1 Overview ...................................................................................................... 81
5.2 Steady State Experim ents .............................................................................. 81
5.3 Engine Start-up Experim ents....................................................................... 82
5.4 Overall A ssessm ent and Recom m endations................................................. 85
References ............................................................................................................................ 87
Appendix .............................................................................................................................. 89
11

12

List of Figures
Figure 2-1 Three different types of charge motion control valves: (a) Base CMCV<CMCV(B)>, (b) Tumble type CMCV <CMCV(T)>, (c) Swirl type CMCV<CMCV(S)>. Flow area was 25% for all three CMCVs....................................... 28
Figure 2-2 Schematic of fast-response FID sampling head from Cambustion. ....................... 29
Figure 2-3 Schematic of fast-response NDIR sampling head from Cambustion...................... 30Figure 3-1 Geometry of charge motion control valve. 25% notch area valve made of 1mm
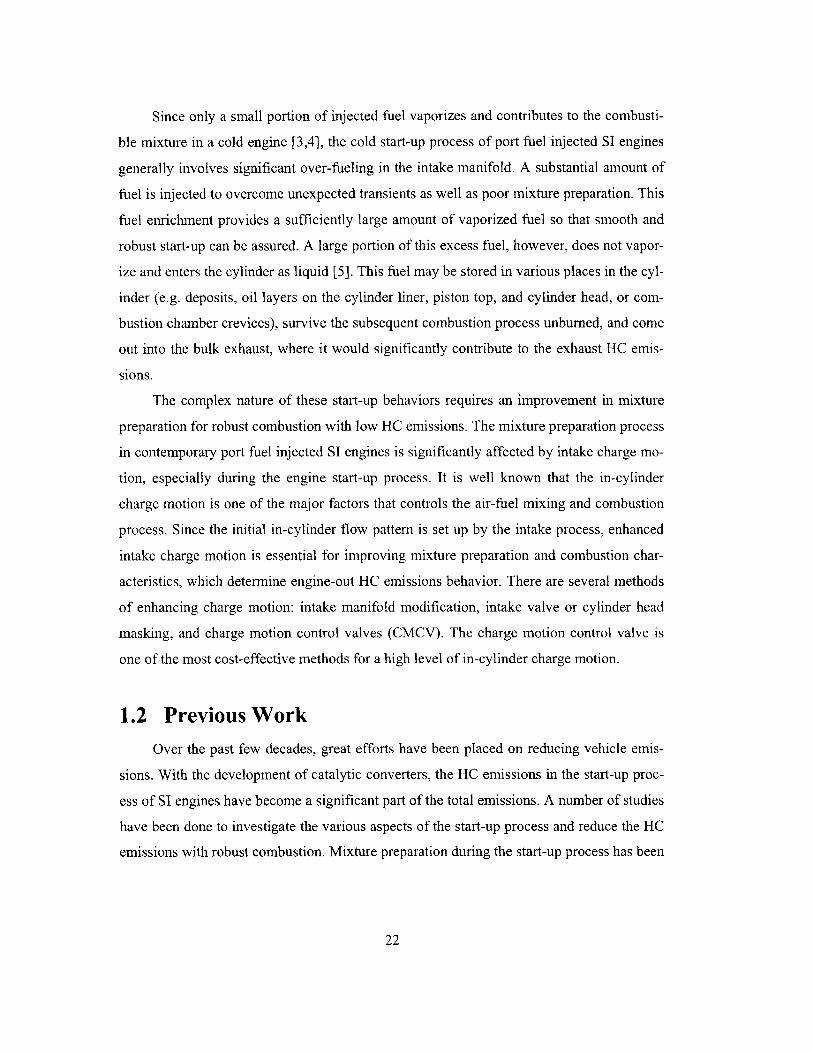
alu m in u m p late . ......................................................................................................... 3 8Figure 3-2 COV of the Net-IMEP as a function of spark timing with the CMCV open and closed
at 2.5 bar NIMEP, 1000 RPM, and stoichiometric air/fuel ratio with the 200 C coolant.................................................................................................................................... 3 9
Figure 3-3 0-10% and 10-90% combustion durations as a function of spark timing with theCMCV open and closed at 2.5 bar NIMEP, 1000 RPM, and stoichiometric air/fuelratio w ith the 20 0C coolant. .................................................................................. 40
Figure 3-4 Location of 50% MFB as a function of spark timing with the CMCV open and closedat 2.5 bar NIMEP, 1000 RPM, and stoichiometric air/fuel ratio with the 20'C coolant.................................................................................................................................... 4 0
Figure 3-5 Exhaust port gas temperature as a function of spark timing with the CMCV open andclosed at 2.5 bar NIMEP, 1000 RPM, and stoichiometric air/fuel ratio with the 20'Cc o o la n t. ...................................................................................................................... 4 1
Figure 3-6 Exhaust port gas temperature as a function of 50% MFB location with the CMCVopen and closed at 2.5 bar NIMEP, 1000 RPM, and stoichiometric air/fuel ratio withthe 20'C coolant................................................................................................... . . 42
Figure 3-7 Exhaust port HC concentration as a function of spark timing with the CMCV openand closed at 2.5 bar NIMEP, 1000 RPM, and stoichiometric air/fuel ratio with the2 00C co o lan t............................................................................................................... 4 3
Figure 3-8 Exhaust port HC concentration as a function of 50% MFB location with the CMCVopen and closed at 2.5 bar NIMEP, 1000 RPM, and stoichiometric air/fuel ratio withth e 20'C coolant..................................................................................................... . 4 3
Figure 3-9 MAP and intake air flow as a function of spark timing with the CMCV open andclosed at 2.5 bar NIMEP, 1000 RPM, and stoichiometric air/fuel ratio with the 20'Cc o o lan t. ...................................................................................................................... 4 4
Figure 3-10 Exhaust port HC mass flow rate as a function of spark timing with the CMCV openand closed at 2.5 bar NIMEP, 1000 RPM, and stoichiometric air/fuel ratio with the2 00C co o lan t............................................................................................................... 4 5
Figure 3-11 Exhaust port HC mass flow rate as a function of 50% MFB location with the CMCVopen and closed at 2.5 bar NIMEP, 1000 RPM, and stoichiometric air/fuel ratio withthe 20'C coolant..................................................................................................... . 46
Figure 4-1 Baseline calibration MAP, RPM, spark timing, and relative air/fuel ratio as a functionof time after crank with the CM CV open. ............................................................. 48
13

Figure 4-2 Exhaust gas emissions measured at the exhaust port exit of cylinder #4 as a functionof time after crank with the CM CV open. ............................................................. 48
Figure 4-3 Three different types of charge motion control valves: (a) Base CMCV<CMCV(B)>, (b) Tumble type CMCV <CMCV(T)>, (c) Swirl type CMCV<CMCV(S)>. Flow area was 25% for all three CMCVs........................................ 50
Figure 4-4 In-cylinder k as a function of cycle number during the first 20 seconds followingen gine crankin g.................................................................................................... . . 5 1
Figure 4-5 Evaporated fuel as a function of cycle number during the transient period for variousC M C V s ...................................................................................................................... 5 2
Figure 4-6 Percentage of evaporated fuel to injected fuel as a function of cycle number duringthe quasi-steady period for various CM CVs.......................................................... 52
Figure 4-7 Net-IMEP as a function of cycle number during the transient period for variousC M C V s ...................................................................................................................... 5 3
Figure 4-8 0-10% and 10-90% combustion durations as a function of cycle number during thetransient period for various CM CV s....................................................................... 55
Figure 4-9 0-10% and 10-90% combustion durations as a function of cycle number during thequasi-steady period for various CM CVs. ............................................................... 55
Figure 4-10 Engine-out HC mass emissions measured at the exhaust port exit of cylinder #4 as afunction of cycle number during the transient period for various CMCVs. .......... 57
Figure 4-11 Engine-out HC mass emissions measured at the exhaust port exit of cylinder #4 as afunction of cycle number during the quasi-steady period for various CMCVs......... 57
Figure 4-12 Swirl index from flow bench meters as a function of normalized valve lift for variousC M C V s...................................................................................................................... 5 9
Figure 4-13 Tumble index from flow bench meters as a function of normalized valve lift forvarious C M C V s. .................................................................................................... . 59
Figure 4-14 Required mass of injected fuel as a function of cycle number for the same in-cylinderlambda trace with the CMCV open and closed during the first 20 seconds aftercranking com m enced. ............................................................................................ 62
Figure 4-15 Net-IMEP as a function of cycle number during the transient period for the CMCVopen case and the CMCV closed case with reduced fuel injection. ....................... 63
Figure 4-16 0-10% and 10-90% combustion durations as a function of cycle number during thetransient period for the CMCV open case and the CMCV closed case with reducedfu el injectio n .............................................................................................................. 64
Figure 4-17 0-10% and 10-90% combustion durations as a function of cycle number during thequasi-steady period for the CMCV open case and the CMCV closed case withreduced fuel injection. ............................................................................................ 64
Figure 4-18 Engine-out HC mass emissions measured at the exhaust port exit of cylinder #4 as afunction of cycle number during the transient period for the CMCV open case andthe CMCV closed case with reduced fuel injection............................................... 66
Figure 4-19 Engine-out HC mass emissions measured at the exhaust port exit of cylinder #4 as afunction of cycle number during the quasi-steady period for the CMCV open caseand the CMCV closed case with reduced fuel injection........................................ 66
Figure 4-20 Spark timing as a function of cycle number during the first 20 seconds followingengine cranking for various spark modifications with the CMCV closed............. 67
14

Figure 4-21 Required mass of injected fuel as a function of cycle number for the same in-cylinderlambda trace with various spark modifications during the first 20 seconds aftercranking com m enced. ............................................................................................ 68
Figure 4-22 Net-IMEP as a function of cycle number during the transient period for various sparkm odifications with the CM CV closed. ................................................................... 69
Figure 4-23 Location of 50% mass fraction burned as a function of cycle number during the 20seconds after engine cranking for various spark modifications with the CMCVc lo se d ......................................................................................................................... 7 0
Figure 4-24 0-10% and 10-90% combustion durations as a function of cycle number during thetransient period for various spark modifications with the CMCV closed.............. 70
Figure 4-25 0-10% and 10-90% combustion durations as a function of cycle number during thequasi-steady period for various spark modifications with the CMCV closed. .......... 71
Figure 4-26 Engine-out HC mass emissions measured at the exhaust port exit of cylinder #4 as afunction of cycle number during the transient period for various spark modificationsw ith the C M C V closed. ......................................................................................... 72
Figure 4-27 Engine-out HC mass emissions measured at the exhaust port exit of cylinder #4 as afunction of cycle number during the quasi-steady period for various sparkm odifications w ith the CM CV closed. ................................................................... 72
Figure 4-28 Injected fuel mass as a function of cycle number with the CMCV open and closedduring the first 20 seconds after cranking. Reduced sequential fuel injection strategywas applied to the CM CV closed case.................................................................. 74
Figure 4-29 Spark timing as a function of cycle number with the CMCV open and closed duringthe first 20 seconds after cranking. Retarded spark timing strategy was applied to theC M C V closed case. ............................................................................................. . . 74
Figure 4-30 In-cylinder k as a function of cycle number during the first 20 seconds followingengine cranking with the CMCV open and closed. Reduced sequential fuel injectionand retarded spark timing strategy was applied to the CMCV closed case........... 75
Figure 4-31 Net-IMEP as a function of cycle number during the transient period with the CMCVopen and closed. Reduced sequential fuel injection and retarded spark timing strategywas applied to the CM CV closed case.................................................................. 76
Figure 4-32 0-10% and 10-90% combustion durations as a function of cycle number during thetransient period with the CMCV open and closed. Reduced sequential fuel injectionand retarded spark timing strategy was applied to the CMCV closed case........... 77
Figure 4-33 Location of 50% mass fraction burned as a function of cycle number during thetransient period with the CMCV open and closed. Reduced sequential fuel injectionand retarded spark timing strategy was applied to the CMCV closed case........... 77
Figure 4-34 0-10% and 10-90% combustion durations as a function of cycle number during thequasi-steady period with the CMCV open and closed. Reduced sequential fuelinjection and retarded spark timing strategy was applied to the CMCV closed case. 78
Figure 4-35 Location of 50% mass fraction burned as a function of cycle number during thequasi-steady period with the CMCV open and closed. Reduced sequential fuelinjection and retarded spark timing strategy was applied to the CMCV closed case. 79
Figure 4-36 Engine-out HC mass emissions measured at the exhaust port exit of cylinder #4 as afunction of cycle number during the transient period with the CMCV open andclosed. Reduced sequential fuel injection and retarded spark timing strategy wasapplied to the CM CV closed case........................................................................... 80
15

Figure 4-37 Engine-out HC mass emissions measured at the exhaust port exit of cylinder #4 as afunction of cycle number during the quasi-steady period with the CMCV open andclosed. Reduced sequential fuel injection and retarded spark timing strategy wasapplied to the CM CV closed case......................................................................... 80
16

List of Tables
Table 2-1 Engine specifications.............................................................................................. 25Table 2-2 Unleaded test gasoline (Indolene, UTG-91) properties [14]. ................................ 32
17

18

Nomenclature
ABDC after bottom dead centerATDC after top dead centerBBDC before bottom dead centerBDC bottom dead centerBTDC before top dead centerCA crank angleCMCV charge motion control valveCOV coefficient of variationDAQ data acquisitionDOHC dual overhead camshaftECM engine control moduleEGR exhaust gas recirculationEVC exhaust valve closingEVO exhaust valve openingFFID fast flame ionization detectorFID flame ionization detectorFTP federal test procedureHC hydrocarbonIAC idle air controlIMEP indicated mean effective pressureIVC intake valve closingIVO intake valve openingMAP manifold air pressureMDS modular development systemMFB mass fraction burnedNDIR non-dispersive infraredPVC positive crankcase ventilationRPM revolutions per minuteSI spark ignitionTDC top dead centerUEGO universal exhaust gas oxygen
19

20

Chapter 1
Introduction
1.1 Background and Motivation
Meeting future, stringent emissions standards will require precise engine control
strategies that significantly improve the emissions performance under transient conditions.
In particular, greater emphasis is being put upon the cold start-up process where a signifi-
cant fraction of the total hydrocarbon (HC) emissions can be produced. The use of catalytic
converters for aftertreatment is an effective means of reducing tailpipe-out HC emissions
from spark ignition (SI) engines. However, the majority of the total HC emissions during
the Federal Test Procedure (FTP) are emitted during the first few seconds of engine
operation before the catalyst reaches light-off temperature, approximately 2500 C. Due to
the fact that catalytic converters are essentially ineffective until light-off temperatures are
achieved, increased importance is being placed on understanding and improving engine-out
HC emissions during the first few seconds of engine operation after cranking.
There are various HC emissions formation mechanisms for SI engines: the filling of
crevice volumes with unburned mixture, flame quenching at the combustion chamber walls,
oil layer absorption and desorption, incomplete combustion, liquid fuel wetting of in-
cylinder surface, deposit absorption and desorption, and air/fuel ratio abnormality [1,2].
During the engine start-up process, these mechanisms play increased roles in determining
the engine-out HC emissions. Of particular importance is the influence of the mixture
preparation process which can greatly affect these mechanisms. However, it is difficult to
achieve appropriate mixture preparation in the cold start-up process due to the unfavorable
fuel transportation and evaporation environment such as low port air velocity, initially at-
mospheric port pressure, and low port and cylinder wall temperatures.
21
Since only a small portion of injected fuel vaporizes and contributes to the combusti-
ble mixture in a cold engine [3,4], the cold start-up process of port fuel injected SI engines
generally involves significant over-fueling in the intake manifold. A substantial amount of
fuel is injected to overcome unexpected transients as well as poor mixture preparation. This
fuel enrichment provides a sufficiently large amount of vaporized fuel so that smooth and
robust start-up can be assured. A large portion of this excess fuel, however, does not vapor-
ize and enters the cylinder as liquid [5]. This fuel may be stored in various places in the cyl-
inder (e.g. deposits, oil layers on the cylinder liner, piston top, and cylinder head, or com-
bustion chamber crevices), survive the subsequent combustion process unburned, and come
out into the bulk exhaust, where it would significantly contribute to the exhaust HC emis-
sions.
The complex nature of these start-up behaviors requires an improvement in mixture
preparation for robust combustion with low HC emissions. The mixture preparation process
in contemporary port fuel injected SI engines is significantly affected by intake charge mo-
tion, especially during the engine start-up process. It is well known that the in-cylinder
charge motion is one of the major factors that controls the air-fuel mixing and combustion
process. Since the initial in-cylinder flow pattern is set up by the intake process, enhanced
intake charge motion is essential for improving mixture preparation and combustion char-
acteristics, which determine engine-out HC emissions behavior. There are several methods
of enhancing charge motion: intake manifold modification, intake valve or cylinder head
masking, and charge motion control valves (CMCV). The charge motion control valve is
one of the most cost-effective methods for a high level of in-cylinder charge motion.
1.2 Previous Work
Over the past few decades, great efforts have been placed on reducing vehicle emis-
sions. With the development of catalytic converters, the HC emissions in the start-up proc-
ess of SI engines have become a significant part of the total emissions. A number of studies
have been done to investigate the various aspects of the start-up process and reduce the HC
emissions with robust combustion. Mixture preparation during the start-up process has been
22

the focus of previous research. Most of previous studies have concentrated on the effects of
fuel metering and liquid fuel behavior on mixture preparation and HC emissions.
In a previous study performed by Henein et al. [6], the effect of engine transients on
HC emissions was investigated. The initial piston position was found to affect the HC
emissions during the cold start-up process. The first cycle fuel metering effect on HC emis-
sions was examined by Castaing et a]. [7]. The open valve injection was detrimental to the
mixture preparation process during the start-up because it caused mixture non-uniformity,
directly deposited fuel in the cylinder which increased engine-out HC emissions. There
have been some studies investigating the effect of enhanced charge motion on engine per-
formance. In a study conducted by Takahashi et al. [8], the use of the CMCV increased the
bum rate and combustion stability. More improvement in combustion stability was ob-
tained by optimizing the geometry of the CMCV. Similar research by Nishizawa et al. [9]
showed that the cold start-up HC emissions were reduced by an electronically actuated
CMCV with a high-speed starter and a fast light-off catalyst. Jung et a]. [10] showed some
benefits of the CMCV in the fuel consumption and cam retard at light load conditions. At
medium and high load conditions, the CMCV caused an excessive pumping work penalty
due to the flow restriction.
1.3 Research Objectives
There has been little study trying to examine the real engine start-up process with the
CMCV. Most of the previous experimental studies on enhancing the charge motion for the
cold start-up process have been performed under the simulated steady state conditions due
to the difficulty of engine control. Therefore, it would be worth to investigate the effects of
enhanced charge motion on mixture preparation, combustion characteristics, and HC emis-
sions.
The objective of this research is to quantify the effects of various intake charge mo-
tion control approaches on the cold start-up process of a port fuel injected SI engine. Four
main tasks were carried out:
23

* Develop diagnostics to examine the impacts of controlled charge motions on
mixture and combustion.
* Identify desirable flow patterns for cold start-up by examining various charge
motion control valves.
* Assess the effectiveness of these changes in charge motion on mixture prepara-
tion, combustion, and emissions.
* Develop recommendations for improving the charge motion during the engine
start-up process.
24

Chapter 2
Experimental Apparatus and Procedures
2.1 Experimental Setup
2.1.1 Engine and Dynamometer
Experiments were performed on a 2003 model year, 2.2 liter L61 Ecotec (GMX357)
engine to investigate the effects of various intake charge motion control approaches on the
cold start-up process of a port fuel injected SI engine. The engine was coupled to an eddy
current, absorbing only, dynamometer (Froude Consine AE-80). This test setup used the
engine starter motor for cranking operation with full control over the engine control mod-
ules (ECM). Additional engine specifications are shown in Table 2-1.
Table 2-1 Engine specifications
Ecotec 2.2-liter, 4-cylin er Engine SpecificationsType Naturally Aspirated, Line 4Displacement Volume (cc) 2189Clearance Volume (cc) 65Bore (mm) 86Stroke (mm) 94.6Connecting Rod (mm) 146.5Wrist Pin Offset (mm) 0.8Compression Ratio 10.0:1Firing Order 1-3-4-2Valve Configuration 16v DOHC
Valve Timing IVO: 7 BTDC I IVC: 560 ABDCEVO: 49 BBDC I EVC: 19 ATDC
Fuel System Sequential Fuel Injection
25

2.1.2 Engine Subsystems and Instrumentation
Air mass flow rate was measured by a thermal mass flow meter (EPI, Series 8000MP).
Throttle position control was controlled by a stepper motor (Pacific Scientific SinMax 1.8'
motor with 5230 indexer/driver) connected via a cable to the engine throttle body. Incre-
mental movement of the throttle was adjusted by two momentary contact switches with a
selectable stepping rate. The positive crankcase ventilation (PCV) system was utilized dur-
ing the engine operation, but the exhaust gas recirculation (EGR) and secondary air injec-
tion system were not used for these experiments.
Fuel was supplied by external fuel pump with an inline filter, accumulator, and pres-
sure regulator. The regulator outlet was connected to the fuel injector rail. A constant fuel
rail pressure of 52 psig was maintained for a returnless fuel injection system. Injected fuel
mass was calculated from the fuel pulse width duration and pressure differential across the
injector.
The coolant temperature was controlled by an external heat exchanger. The engine
coolant system was a closed looped system driven by an internal water pump that circulated
fluid through the block and cylinder head. The thermostat was removed and the heater core
was modified to eliminate the recirculation of coolant within the cylinder head and block.
Coolant exited the head and flowed to an external water pump installed in the engine's
cooling circuit. The pump outlet was connected to an external heat exchanger and to a cool-
ant reservoir tank before being routed back to the engine. Coolant temperature was varied
via a set-point controller that actuated a valve allowing for plant water to flow through an
external heat exchanger. The engine oil was not externally cooled and its temperature was
measured in the oil pan.
Time-resolved exhaust gas temperatures were obtained from chromel-alumel (type-K)
exposed junction thermocouples (0.8-mm bead diameter) with custom radiation shielding.
Exhaust air/fuel ratio was measured by a universal exhaust gas oxygen (UEGO) sensor lo-
cated at the exhaust manifold collector. A Horiba MEXA-700 analyzer interpreted the sig-
nal and displayed the air/fuel equivalence ratio.
26

2.1.3 Engine Control System
The Delco Modular Development System (MDS) [11] was used to control and modify
the engine control module (ECM). Specific ECM operations were monitored and recorded
by the MDS. This system provided the user control of parameters including the change of
calibration data by read only memory (ROM) emulation. A PC was connected to the MDS
stack that allowed for internal and external data logging. The stack was composed of sev-
eral units. The main instrument unit (MIU) was the core of the MDS and contained two
embedded processors: the main instrument processor (MIP) and the input output processor
(IOP). The computer interface buffer internal logging (CIBIL) provided MDS communica-
tion with a computer. The analog conversion module (ACM) contained 8-BNC outputs and
2 instantaneous switches scaled from 0 to 5 volts. A 1MB GMPX Pod was connected to the
X-pod that interfaced with the ECM and allowed the ECM's EPROM to be flashed for
standalone ECM operation. The shell program allowed the user to have full access to
lookup tables and relevant environmental variables. Real-time monitoring and modification
of several parameters (RPM, MAP, spark timing, air/fuel ratio, and idle air control (IAC)
valve position) was accomplished by using the MDS's external display unit (DU). Full con-
trol of the engine was possible using the Delphi Electronics Instrument Tool Suite (ITS)
running the Saturn Legacy Software. File handling between the computer and MDS unit
was achieved using the ITS software. The program CalTools was used to modify ECM pa-
rameters and lookup table variables.
2.1.4 Charge Motion Control Valve
The charge motion control valve (CMCV) device was installed between the intake
manifold and intake port. The asymmetrical CMCV (base CMCV) was used for the steady
state experiment as shown in Figure 2-1. Three different shapes of charge motion control
valves were investigated for the engine start-up experiment in order to better understand the
effects of the enhanced charge motion on mixture preparation, combustion, and emissions.
All three different CMCVs were made of 1 mm aluminum plate and reduced the port cross
sectional area by 75% (i.e. 25% notch area). Since the CMCV device was located upstream
of the fuel injector, it did not impede the fuel spray.
27

(a) Base CMCV (b) Tumble type CMCV (c) Swirl type CMCV
Figure 2-1 Three different types of charge motion control valves: (a) Base CMCV <CMCV(B)>, (b)Tumble type CMCV <CMCV(T)>, (c) Swirl type CMCV <CMCV(S)>. Flow area was 25%for all three CMCVs.
2.1.5 In-cylinder Pressure measurements
Each cylinder was equipped with a flush-mounted piezoelectric pressure transducer
(Kistler 6125A). The cylinder head passage sleeve incorporated an eight-hole flame arrestor
to minimize the occurrence of thermal shock. The current signal from the transducer was
converted to a voltage signal by a charge amplifier (Kistler 5010B). The transducers were
statically calibrated at several pressure points using a dead weight tester. For pressure refer-
encing, an absolute pressure transducer (OMEGA PX-176) was installed in the intake
manifold runner that provided better transient response compared to the OEM MAP trans-
ducer. In-cylinder pressure was referenced on an individual cycle basis over a 20 CA inter-
val centered around BDC of the intake event, 1700 ATDC to 190' ATDC, using the intake
manifold runner pressure.
2.1.6 Data Acquisition System
The data acquisition (DAQ) system utilized two DAQ boards from National Instru-
ments installed in a personal computer. The first card (PCI-6071E) acquired 32 differential
channels of high-speed signals. The second card (PCI-6024E) was used with a multiplexing
chassis (SCXI-1000) and a 32 channel thermocouple module (SCXI- 1102) to acquire tem-
perature data from type-K thermocouples. The two boards were operated at different
speeds; high-speed data was captured with a frequency of 40000hz (once per 0.025ms),
while temperature data was acquired with a frequency of 4000hz (once per 0.25ms). Both
28

DAQ cards were triggered frOln signals provided by an incremental encoder (BEl Series
H25E) coupled to the engine crankshaft. LabView software was used to create a virtual in
strument for data scaling, processing, and logging.
2.1.7 Fast-Response Emissions Analyzers
• Fast-Response He Analyzer
Time-resolved HC concentrations were measured via a Cambustion HFR400 fast
response flame ionization detector (FID). The FID is the industry standard method of
measuring HC concentration. The fast-response FID consists of a main control unit (MCU)
and two remote sampling heads. The sample gas is introduced into a hydrogen flame inside
the FID. Any hydrocarbons in the sample will produce ions when they are burned. Ions are
detected using a Inetal collector which is biased with a high DC voltage. The current across
this collector is thus proportional to the rate of ionization which in tum depends upon the
concentration of HC in the salnple gas. This fast-response FID has a 10-90% response time
of approximately 1 millisecond. A heated transfer sampling line (TSL-H) with a hole di
ameter of 0.026" was placed at the exhaust port exit, 7 em from the exhaust valve seats.
The fast-response FID was calibrated before and after each experiment using 1500ppmC3
propane gas (span) and nitrogen gas (zero).
Fast Response FID
High voltage __ ion collector
NozzLe ---
SampLe capillary
-----~ Vacuum
Rame chamber
_____ <f-- Air ______ <f--
Fuel gas
Figure 2-2 Schematic of fast-response FID sampling head from Cambustion [12].
29

Fast-Response CO and CO2 Analyzer
Time-resolved CO and CO2 concentrations were measured VIa a Cambustion
NDIR500 fast-response non-dispersive infrared (NDIR) detector. The NDIR is the industry
standard method of measuring engine exhaust CO and CO2 emissions. The instrument is a
two-channel analyzer with the detectors located in remote sample heads. It measures CO
and CO2 simultaneously from one sample head, providing four streams of data per analyzer.
Satnple gas from the engine is conveyed through narrow heated capillaries directly into the
sample chamber. The optical filters are mounted on a chopping wheel; reference and blank
sectors on the chopping wheel correct for minute changes in temperature and IR emitter
performance. The instrument gives a T lO- 90 response time of approximately 8 milliseconds.
The main control unit is housed in a mobile cabinet with the vacuum pump located in the
base. The analyzer is controlled via RS232 or RS485 serial communications from a laptop
computer with the installed operating software. The interface provides full control of the
instrument including auto-calibration, start-up, self-test, and trouble-shooting and help
functions with video assistance. A heated sample probe was located at the exhaust port exit,
7 CIn from the exhaust valve seats. Recommended cleaning process was conducted before
and after each experiment to remove accumulations from optical windows.
Temperature controlled
Temperature Controlled Ext.maIC~ Heatstnk
Pressure controUed dlamber
~
1
AddItional volume can be added here for in-cylinder
sampling.
-----++To vacuum pump
Figure 2-3 Schematic of fast-response NDIR sampling head from Cambustion 113J.
30

2.2 Experimental Conditions and Procedure
2.2.1 Steady State Test Conditions and Procedure
Steady state cold-fluid experiments were performed to understand the basic effects of
the CMCV on mixture, combustion, and emissions. In order to simulate the park idle condi-
tion, the engine was operated at the condition of 1000 rpm, 2.5 bar Net-IMEP (net indicated
mean effective pressure) with the base CMCV open and closed. Spark timing sweeps were
conducted with a fixed coolant temperature of 20'C and a stoichiometric air/fuel ratio. The
coolant temperature was regulated by an external heat exchanger. The exhaust system,
however, was not externally cooled and was allowed to reach a hot stabilized temperature
for steady state experiments. A set of 300 cycle data was recorded for each operating condi-
tion. All experiments were performed with unleaded test gasoline (UTG), commonly
termed "indolene". This is a standardized fuel type typically used for emissions certifica-
tion and laboratory work. UTG-91 from Chevron Phillips Chemical Company LLC was
used for this work to represent the performance of gasoline. The relevant specification of
this fuel is in Table 2-2.
31

Table 2-2 Unleaded test gasoline (Indolene, UTG-91) properties [141.
UTG-91Property Typical Value SpecificationSpecific Gravity at 60160 *F 0.7350 0.7343 - 0.7440API Gravity 61.0 ReportCopper Corrosion, 3 h at 50 'C 1 1 maxExistent Gum (washed), mgi100 mL 2 5 maxSulfur, ppm 130 1000 maxReid Vapor Pressure, psia 9.0 8.8- 92Lead, gtgal 0.0010 0.0050 maxPhosphorus, gfgal 0.001 0.002 maxHydrogen, wt % 13.7 ReportCaibon, wt % 86.3 ReportCabon Density, g/gal ReportDistilation Range at 760 mmHg, *F
Initial Boling Point 88 75-9510% 122 120-13550% 212 200-23090% 321 300-325End Point 399 415 max
Oxidation Stabdity, min > 1440 1440 minHeat of Combustion, Net, Btuflb 18500 ReportComposition, vol %
Aromatics 24.0 35.0 maxOlefins 6.0 10- maxSaturates 70.0 Report
Research Octane Number 90.8 90.3- 91.7Motor Octane Number 82.8 ReportAnti-Knock Index, (R+MY2 86-8 87.0 maxSensitivity 7.8 7.5 minOxygenates, vol % 0.0 maxBenzene, vol % Report
Test MethodASTM D 4052ASTM D 1250ASTM D 130ASTM D 381ASTM D 5453ASTM D 5191ICPIOESICPIOESASTM D 5291ASTM D 5291CalculatedASTM D 86
ASTM D 525ASTM D 240ASTM D 1319
ASTM D 2699ASTM D 2700CalculatedCalculatedChromatographyChromatography
2.2.2 Start-up Test Conditions and Procedure
Engine start-up experiments were conducted with the three different geometric charge
motion control valves. Mixture preparation, combustion characteristics, and HC emissions
were evaluated with the various fuel injection and spark timing strategies during the first 20
seconds following engine cranking. General Motors provided the target speed-load point
during the park idle period of the FTP (0-15 seconds) for this engine. The baseline calibra-
tion produced a Gross-IMEP of 3.0 bar and 950 RPM with 0.40 bar MAP and 60BTDC
spark timing. Therefore, the engine was calibrated using the MDS hardware and CalTools
software to achieve the target operation condition for the park idle period, 2.5 bar Net-
IMEP and 950 RPM. All engine start-up tests were conducted with UTG-91 (Table 2-2) at
approximately 20C environmental conditions. The coolant temperature was initially fixed
at 20C by the external coolant control system.
32

After each start-up test, the engine was operated and warmed up to a coolant tempera-
ture of 70 0C to avoid residual fuel build-up in the intake port [15]. After shutdown, the en-
gine was purged by cranking with the injector off for 1 minute. Metal temperatures
throughout the engine and exhaust system, then, were force-cooled to ambient temperatures
before another experiment was conducted.
Several previous studies showed that the engine start-up behavior is affected by the
initial phasing of the piston positions [6,7]. For a 4-cylinder 4-stroke engine, the engine
tends to stop with one of the pistons at mid stroke (~90' from the BDC) of compression.
Therefore, the piston starting point was fixed at 90 'ATDC of the expansion stroke of cylin-
der #4 to avoid excessive complexity in data analysis.
Engine speed and load were not regulated by the dynamometer controller (Digalog
Series 1022A) due to the unstable transient control of the dyno-engine system during start-
up RPM flare. The required engine idle load was achieved by utilizing engine accessories
with the dynamometer coupled but not absorbing power from the engine. A hydraulic
power steering pump and alternator were added to the engine setup to simulate park idle
load conditions observed during the first 15 seconds of the FTP. The power steering pump
was throttled to 800 psig by the use of a needle valve. The low pressure line was routed
through a heat exchanger before returning oil to the reservoir tank. The regulated 14.7 volt
output from the alternator was isolated from the 12 volt battery bus by a zener diode and
connected to bank of power watt resistors, which had total 0.2 Ohm (three 0.6 Ohm resis-
tors in parallel).
33

2.3 Analysis Method
2.3.1 Residual Gas Fraction
To calculate in-cylinder air/fuel ratio and engine-out HC mass emissions, it is crucial
to be able to estimate the cycle-by-cycle composition of the combustion chamber charge.
This charge consists of fresh air, fuel, and residual gas from the previous cycle. The con-
ventional SI combustion process is largely affected by the residual gas fraction. Residual
gas in SI engines has a profound effect on emissions, performance, and combustion stabil-
ity. Residual gas affects the combustion process through its influence on charge mass, dilu-
tion, temperature, and flame speed. Residual gas influences combustion mainly by acting as
a diluent which decreases the flame speed and temperature of the resulting charge. These
effects are especially important for engine idle stability and for HC emissions. Also,
interpreting experimental pressure data through chemical energy release and exhaust mass
flow analysis requires that the residual gas mass fraction be known. Fox model [16] was
used to estimate the residual gas fraction during the engine start-up process since the model
is applicable for low to medium engine speeds such that the cylinder pressure does not
substantially differ from the exhaust port pressure at IVO. In the model, the contribution of
the back flow from the exhaust port to the cylinder during the valve overlap period is ac-
counted for explicitly in terms of a valve overlap factor. For more detailed information re-
garding the residual gas fraction refer to the Section A.2 in the Appendix.
OF P --0.87 4
x, =1.266 -P - + 32_.-N P r
2.3.2 Air/Fuel Ratio Determination
Exhaust gas composition depends on the relative proportions of fuel and air fed to the
engine, fuel composition, and completeness of combustion. These relationships can be used
to determine the operating air/fuel equivalence ratio of an engine from a knowledge of its
exhaust gas composition. A general formula for the composition of fuel can be represented
as CnHmOr. For conventional petroleum-based fuels, oxygen will be absent. Since Indolene
34

(UTG-91) also has no oxygen in its composition, CHy (c.f. y = m/n) was used for the fol-
lowing combustion reactions. The overall combustion reaction can be written explicitly as:
CH +n, (0, +3.773- N2)
+ n,, -{i' q C02 + ' o -CO+ Xc's - CH, + X' o -H2 0+ X' o - NO+ X' H + X' -N2 + X' -02}
> n { Xc - C2 + cCO HCH+X -CH,+ H 2 O+ NO . NO+XH, - H+ - N -}~nPxC@~±xOCOxCHCH~H 2 0II2+ XNNO± 2H H2 +N, 2 + @ 2
no : moles of 02 per mole CHy
nr moles of residual gas per mole CHy
nP moles of exhaust products per mole CHy
' mole fraction of residual gas component
X : mole fraction of exhaust gas component
From the exhaust concentrations of HC, CO, and C0 2, a carbon balance air/fuel ratio
was derived. Fox model was combined with this combustion equation in order to provide
the mole fraction of residual gas. Throughout the calculation, it has been assumed that the
unburned hydrocarbons have the same H/C ratio as the fuel. Since NOx concentrations are
usually sufficiently low during the cold start-up process, NO and NO2 were negligible for
this air/fuel ratio evaluation.
A Mar [W +C'W- CW' y]- I-+1 - n
F Mfuel C, CT 2
CT XC + K0O + XCH
W =- ic+ -XH20 +1CH, W= 'o + I' + 1's2 22 n2 2 H 2 )
K = XCOXHO CO XXC H XH 2
Mair, M fuel: molecular weight
35

2.3.3 Bum Rate Analysis
The burn rate analysis was performed using the in-cylinder pressure data acquired
from cylinder #4. A single-zone thermodynamic model [18] incorporating the effects of
residual fraction, heat transfer, and crevices was used for the burn rate analysis in order to
quantify combustion characteristics with the CMCV open and closed. Fox model was used
for the residual gas fraction in this model, heat transfer was handled by the Woschni corre-
lation, and total crevice volume was estimated to be equal to 2% of the clearance volume.
QCH - Y -1 V + 1 VP + CR HT
ao Y ao Y -I ao ao ao
where:
QcH Fuel chemical energy
0 Crank angle
y Ratio of specific heat
p Cylinder pressure
V Cylinder volume
QCR Energy in crevices
QHT Heat transfer
36

Chapter 3
Steady State
Experimental Results
3.1 Charge Motion OverviewGas motion into and within the engine cylinder is one of the major factors that con-
trols the air-fuel mixing and combustion process. It also has a significant impact on heat
transfer. Since the initial in-cylinder flow pattern is set up by the intake process, the intake
charge motion plays a critical role in enhancing both the air-fuel mixing and combustion
process. During the engine start-up process, it is difficult to achieve an appropriate in-
cylinder mixture for robust combustion due to the unfavorable mixture preparation envi-
ronment such as cold port wall temperatures, initially atmospheric port pressure, and low
air velocity. Inappropriate mixture preparation can also cause a high level of HC emissions
and a slow combustion process, which decreases combustion stability. Enhanced in-
cylinder charge motion, therefore, is essential for mixture preparation, combustion charac-
teristics, and HC emissions during the cold start-up.
Steady state cold-fluid testing was performed to understand the basic effects of the
CMCV on mixture, combustion, and emissions. Various parameters were measured at the
condition of 1000 rpm, 2.5 bar Net-IMEP. This speed-load point represents the park idle
operating condition for this engine.
An asymmetrical charge motion control valve (CMCV), shown in Figure 3-1, was
used to promote more rapid air-fuel mixing and also speed up the combustion process in
this steady state experiment. The charge motion control valve was installed between the
intake port and the intake manifold. This CMCV was made of 1 mm aluminum plate and
reduced the port cross sectional area by 75%.
37

(a) Base CMCV
Figure 3-1 Geometry of charge motion control valve. 25% notch area valve made of 1mm aluminumplate.
3.2 Combustion Characteristics
3.2.1 Combustion Stability
Combustion stability was quantified and investigated in terms of the coefficient of
variation (COV) in net indicated mean effective pressure (Net-IMEP). Cycle-by-cycle
combustion variations in the combustion process are caused by several factors: variation in
gas motion in the cylinder during combustion, variation in the amounts of fuel, air, and re-
sidual gas supplied to a given cylinder each cycle, and variation in mixture composition
within the cylinder each cycle [1]. Net-IMEP and COV were calculated from in-cylinder
pressure data acquired from cylinder #4. A set of 300 cycle data was analyzed for each op-
erating condition. Figure 3-2 shows the COV of the Net-IMEP as a function of spark timing
with the CMCV open and closed. With increased spark retardation, combustion stability
was found to worsen as combustion occurred in a rapidly expanding cylinder volume.
However, significant improvements in combustion stability were achieved with the CMCV
closed at late spark timings.
38
9
8
-. 6 ~
[;; 5 ::;; Z
> 4 o U
3
2
2.5 bar NIMEP, 1000 RPM, 20°C, A=1.0
35 30 25 20 15 10 o -5 -10 -15
Spark Timing (OBTDC)
Figure 3-2 COY of the Net-IMEP as a function of spark timing with the CMCV open and closed at 2.5 bar NIMEP, 1000 RPM, and stoichiometric air/fuel ratio with the 20°C coolant.
3.2.2 Bum Rate Analysis
A single-zone thermodynamic bum rate analysis incorporating the effects of heat
transfer, residuals, and crevices was used to quantify combustion characteristics with the
CMCV open and closed case. Increased charge motion with the CMCV closed was found
to shorten the 0-100/0 and 10-90% combustion duration as shown in Figure 3-3. Figure 3-4
shows that the reduced combustion duration causes 50% mass fraction burned to occur up
to 5° CA earlier for the same spark timing.
39

38
......... 36 0) Q)
"'0 34 « S 32 c 0 .~ 30
~ 0 28 c 0
26 ~ ::l .0 24 E 0 U 22 cF. 0 20 r-
6 18
2.5 bar NIMEP, 1000 RPM, 20°C, 1..=1.0
0 open010 .. ciosed010 38 o open1090
.. closed1090 0) 36 r-------.
0-10%
0 0 0 o A-A- 0
A- 0 0 o A-A A
A A
0
0 A-
A-
Q)
"'0 34 o « u A ~ 32
o .~ 30
~ o 28 c 0 .~ 26 ::l .0 E 24 0 U
22 cF. 0 en 20 6
18
353025 20 15 10 5 0 -5 -10-15
Spark Timing (oBTDC)
10-90%
o
o
o A
o A-
0
A o A-
0 0 A A A
35 30 25 20 15 10 5 0 -5 -10-15
Spark Timing (BTDC)
Figure 3-3 0-10% and 10-90% combustion durations as a function of spark timing with the CMCV open and closed at 2.5 bar NIMEP, 1000 RPM, and stoichiometric air/fuel ratio with the 20°C coolant.
2.5 bar NIMEP, 1000 RPM, 20°C, 1..=1.0
70
60
U 0 l- SO « 'L.. 0) 40 LL ~
"* 30 0 I.()
'0 c 20 .9 co u 10 0 -l
0
35 30 25 20 15 10 5 o -5 -10 -15
Spark Timing (BTDC)
Figure 3-4 Location of 50% MFB as a function of spark timing with the CMCV open and closed at 2.5 bar NIMEP, 1000 RPM, and stoichiometric air/fuel ratio with the 20°C coolant.
40

3.3 Exhaust Emissions
3.3.1 Exhaust Gas Temperature
The cylinder #4 port exit exhaust gas temperatures were measured with the CMCV
open and closed at various spark timings as shown in Figure 3-5. The CMCV decreased the
exhaust gas temperature between 5-30°C at a given spark timing, which was attributed to
increased in-cylinder heat transfer during combustion. The exhaust gas temperatures were
observed to increase with the spark retardation for both the CMCV open and closed case
due to the fact that the burned gas is not as fully expanded and does not perform as much
work on the piston.
800
U 750 'L.
~ 700 co Ci3
E 650 Cl)
I-Vl co C)
~ 0...
tl :J co ..c x
llJ
600
550
500
450
2.5 bar NIMEP, 1000 RPM, 20°C, A=1.0
35 30 25 20 15 10 5 0 -5 -10 -15
Spark Timing (oBTDC)
Figure 3-5 Exhaust port gas temperature as a function of spark timing with the CMCV open and closed at 2.5 bar NIMEP, 1000 RPM, and stoichiometric air/fuel ratio with the 20°C coolant.
41

Since the location of 50% mass fraction burned gives a better indication of when
combustion is occurring, it can be used as the indicator of combustion phasing. Figure 3-6
shows that exhaust gas temperatures increased linearly with combustion phasing. At an
equivalent phasing, there is a close agreement between the CMCV open and closed exhaust
gas temperatures.
800
E 750
Q)
:s 700 ro Cii E 650 Q)
I-(f) C'Q
<...?
0 CL t=) :::J C'Q ..c x
l!J
600
550
500
450
2.5 bar NIMEP, 1000 RPM, 20°C, A=1.0
----0--- CMCV open --A- CMCV closed
-5 0 5 10 15 20 25 30 35 40 45 50 55 60 65 70 75
Location of 50% MFB (OATDC)
Figure 3-6 Exhaust port gas temperature as a function of 50% MFB location with the CMCV open and closed at 2.5 bar NIMEP, 1000 RPM, and stoichiometric air/fuel ratio with the 20°C coolant.
3.3.2 Exhaust He Emissions
Figure 3-7 shows the exhaust HC concentrations with the CMCV open and closed for
various spark timings. HC concentrations decreased at retarded spark timings mainly due to
the reduced crevice volume fraction at peak pressure and increased burned gas temperature
at the end of the expansion and during exhaust, which increased oxidation. The exhaust HC
concentrations were also investigated as a function of combustion phasing (location of 500/0
MFB). Figure 3-8 shows that the He concentrations of the CMCV open and closed cases
are almost coincident at a given combustion phasing.
42

3500
3000
U~
E 2500 a.. S c 0 2000 .~
C Q) u c 1500 0 U U 1000 I
500
2.5 bar NIMEP, 1000 RPM, 20°C, A=1.0
~~~ ~~~g~io~~d o~
\)~
\':\ \:~
'\o~ " ...
"0
35 30 25 20 15 10 5 0 -5 -10 -15
Spark Timing (oBTDC)
Figure 3-7 Exhaust port HC concentration as a function of spark timing with the CMCV open and closed at 2.5 bar NIMEP, 1000 RPM, and stoichiometric air/fuel ratio with the 20GC coolant.
u~
E a.. S c 0 .~
C Q) u c 0 U U I
3500
3000
2500
2000
1500
1000
500
2.5 bar NIMEP, 1000 RPM, 20°C, A=1.0
'0
-5 0 5 10 15 20 25 30 35 40 45 50 55 60 65 70 75
Location of 50% MFB (OATDC)
Figure 3-8 Exhaust port HC concentration as a function of 50% MFB location with the CMCV open and closed at 2.5 bar NIMEP, 1000 RPM, and stoichiometric air/fuel ratio with the 20GC coolant.
43

To achieve the same engine load (Net-IMEP) with late spark timings, the engine's
mass flow rate was increased to offset the reduction in work extracted from the burned gas.
Therefore, the meaningful representation of the HC emissions is the HC mass flow rate in
the steady state. Changes in exhaust mass flow rates were addressed to better interpret the
results from the HC concentration data as shown in Figure 3-9.
0.65
0.60
"2 0.55 CIJ e 0.50
~ 0.45
~ 0.40
0.35
2.5 bar NIMEP, 1000 RPM, 20°C, A=1.0
35 30 25 20 15 10 5 o ·5 -10 -15
11 ,--1 ______ ---.
Vl 109 r-I ---B--- CMCVopen I :9 ~ CMCV closed S o
u::: 8 f-
6
35 30 25 20 15 10 5 o -5 -10 -15
Spark Timing (OBTOC)
Figure 3-9 MAP and intake air flow as a function of spark timing with the CMCV open and closed at 2.5 bar NIMEP, 1000 RPM, and stoichiometric airlfuel ratio with the 20°C coolant.
44

Figure 3-10 shows the exhaust HC mass flow rate with the CMCV open and closed
for various spark timings. As combustion was phased earlier due to faster burning with the
enhanced CMCV generated charge motion at a given spark timing, higher in-cylinder peak
combustion pressures occurred, which would increase the mass fraction of the HC trapped
in crevice volumes that escaped the oxidation during flame propagation. The important
crevice processes occurring during the engine cycle are the following. As the cylinder pres
sure rises during compression, air-fuel mixture is forced into each crevice region. Since
these volumes are thin, they have a large surface/volume ratio; the gas flowing into the
crevice cools by heat transfer to close to the wall temperature. During combustion while the
pressure continues to rise, air-fuel mixture, depending on engine type, continues to flow
into these crevice volumes. After flame arrival at the crevice entrance, burned gases will
flow into each crevice until the cylinder pressure starts to decrease. Once the crevice gas
pressure is higher than the cylinder pressure, gas flows back from each crevice into the cyl
inder.
u Q) (f)
10
0, 8 5 (f)
c o .~ 6
'E w u I
2.5 bar NIMEP. 1000 RPM. 20°C. 1..=1.0
35 30 25 20 15 10
I---B--- CMCV open I . ............... CMCV closed I
o ·5 ·10 ·15
Spark Timing tSTDC)
Figure 3-10 Exhaust port HC mass flow rate as a function of spark timing with the CMCV open and closed at 2.5 bar NIMEP, 1000 RPM, and stoichiometric air/fuel ratio with the 20°C coolant.
45

The exhaust HC mass flow rates were re-plotted in Figure 3-11 at equivalent levels of
combustion phasing (location of 50% MFB). The line for the CMCV closed case was al
most coincident with the line for the CMCV open case. This indicates that the CMCV gives
no noticeable advantage on the exhaust HC emissions at an equivalent combustion phasing
in the steady state park idle operation.
U ell V1
10
rn 8 5
V1 c o "~ 6
"E L.1J
u I
2.5 bar NIMEP, 1000 RPM, 20°C, A=1.0
---B--- CMCV open --A- CMCV closed
'0
2~~~~~~~~~~~~~~~~~
-5 0 5 10 15 20 25 30 35 40 45 50 55 60 65 70 75
Location of 50% MFB (OAT DC)
Figure 3-11 Exhaust port HC mass flow rate as a function of 50% MFB location with the CMCV open and closed at 2.5 bar NIMEP, 1000 RPM, and stoichiometric airlfuel ratio with the 20°C coolant.
46

Chapter 4
Engine Start-up
Experimental Results
4.1 Engine Start-up Overview
Ambient engine start-up is a complicated process that requires delivery of an adequate
relative air/fuel ratio around the spark plug gap for a robust combustion event during engine
cranking. The engine undergoes severe transients before it reaches the idle speed. Upon the
first cylinder firing, the engine accelerates to a speed up to about 1600 RPM, resulting in a
rapid decrease in the intake manifold pressure. During the first part of this transient period,
spark timing is advanced as engine speed and in-cylinder exhaust gas residuals increase.
The engine then decelerates to normal idle speeds during the second part of this transient
period; therefore, the intake manifold pressure and spark timing also transition to the idle
calibration state. In order to better understand the typical engine start-up behavior, several
operating parameters and exhaust emissions were acquired during the first 20 seconds after
cranking commenced as shown in Figure 4-1 and Figure 4-2. A substantial amount of fuel
was injected into cylinder #4 for the first few cycles to prepare the appropriate in-cylinder
mixture for robust combustion. Significantly rich in-cylinder mixture conditions and high
transient HC concentrations were also observed during the first few seconds.
The critical processes will be discussed in the following sequence: mixture prepara-
tion, combustion, and HC emissions. This is because the intended use of the CMCV is to
reduce HC emissions by improving mixture preparation and combustion characteristics.
However, the mixture preparation analysis used the engine-out exhaust emissions data as
shown in Section 2.3.2.
47

1.00.90.80.70.6
Figure 4-1 Baseline calibration MAP, RPM, spark timing, and relative air/fueltime after crank with the CMCV open.
20*C Engine Start-up Behavior, Baseline Calibration
C- 2CC
- HC
HC
0 2 4 6 8 10 12 14 16 18
ratio as a function of
120100
80
60
40
20
0
40000
3500030000
2000015001000050000
4)E0.
C)I
20
Time after crank (sec)
Figure 4-2 Exhaust gas emissions measured at the exhaust port exit of cylinder #4 as a function oftime after crank with the CMCV open.
48
a-(U
.0
fl 0.52 0.4
0.30.2
4035
i- 25201511050
-10
2
120
100
80
60
40
20
0
14
12108
4
20
00
U-
060
0
N
0
20*C Engine Start-up Behavior, Baseline CalibrationII1 2000
1800MAP 1800-- 6D--- RPM i 14w
1200
8 00
-; 800400200
2 4 6 8 10 12 14 16 18 20
_____1.3
1.1
0.90.8070.8
T i - 05S 2 4 6 8 10 12 14 16 18 20
Time after crank (sec)
During a typical 20C start-up process, the baseline calibration resulted in an idle
speed of 950 RPM and 60 BTDC spark timing at approximately 3 seconds after the onset of
engine cranking. The average Net-IMEP of 2.45 bar with 5% COV was obtained during the
quasi-steady idle period of 3-20 seconds.
Engine operation in the first 20 seconds showed two clearly distinct periods, which
were separated by engine operating conditions around 3 seconds following engine cranking.
Thus, in subsequent discussions, the earlier period and the later period are denoted as the
transient period and the quasi-steady period, respectively.
4.2 Comparison Results of Various CMCVs
4.2.1 CMCV Overview
In-cylinder charge motion is a transient phenomenon and is developed during the in-
take process. Gas motion within the cylinder is one of the major factors that controls the
air-fuel mixing and combustion process. It is difficult to achieve robust combustion in the
start-up process due to the unfavorable mixture preparation environment such as cold port
wall temperatures, initially atmospheric port pressure, and low air velocity; each of these
conditions is detrimental to fuel vaporization. Therefore, during the start-up process, an in-
creased level of in-cylinder charge motion is helpful for improving fuel vaporization, air-
fuel mixing, and tolerance to high levels of residual dilution. Three different shapes of
charge motion control valves were investigated to better understand the effects of the en-
hanced charge motion on mixture preparation, combustion, and emissions. Figure 4-3
shows the three different charge motion control valves named as base CMCV, tumble type
CMCV, and swirl type CMCV. All three different CMCVs were made of 1 mm aluminum
plate and reduced the port cross sectional area by 75% (i.e. 25% notch area).
49

(a) Base CMCV (b) Tumble type CMCV (c) Swirl type CMCV
Figure 4-3 Three different types of charge motion control valves: (a) Base CMCV <CMCV(B)>, (b)Tumble type CMCV <CMCV(T)>, (c) Swirl type CMCV <CMCV(S)>. Flow area was 25%for all three CMCVs.
4.2.2 Mixture Preparation
The task of the engine induction and fuel systems is to prepare an air-fuel mixture that
satisfies the requirements of the engine over its operating regime. Mixture preparation is
usually discussed in terms of the relative air/fuel ratio. In order to explore this topic here,
mixture preparation is defined by the in-cylinder mixture condition just before combustion
occurs. The in-cylinder mixture condition just before the start of the combustion was quan-
tified by the calculated in-cylinder relative air/fuel ratio, resulting from fuel vaporization in
the port and cylinder produced by the charge motion. In-cylinder relative air/fuel ratio was
derived from the carbon based lambda evaluation, which was developed from time-resolved
emission measurements, as described in Section 2.3.2.
With the CMCV closed, consistently richer in-cylinder lambda levels were observed
from numerous experiments with different amounts of fuel injections. To avoid unnecessar-
ily rich in-cylinder mixture conditions with the CMCV closed, a 4% reduction in fuel injec-
tion, compared to the baseline CMCV open calibration, was applied to all the CMCV open
and CMCV closed cases for this comparison experiment. The spark timing trajectories,
however, remained the same as the baseline CMCV open calibration for all cases. In addi-
tion, with the CMCV closed, the idle air control (IAC) stepper positions were varied in or-
der to maintain the same air flow rate as the CMCV open case. Consequently, the same in-
jected fuel and same inlet air mass were delivered to the cylinder, cycle by cycle, for all
four different experiments.
50


45 I-
40 l-~
Q)
~ 35 ~ AO u 0, 8 5 30 ~ (i) X :::J
lJ.. 25 ~ "'0 Q)
ro 20 0
Cl.. ro >
l.J.J 15
10
o
Evaporated Fuel of Transient Period I
X ~
()~ 0
o~
0
A o~
5
I I -'-0 CMCVopen A CMCV closed [] CMCV closed(t) X CMCV closed(s)
-
-
* o ~ ,- _
li~!~~~~~.ai~~~~§~t~i
10 15
Cycle No.
20 25 30
Figure 4-5 Evaporated fuel as a function of cycle number during the transient period for various CMCVs.
Percent Evaporated Fuel to Injected Fuel 110
.& .&
.& .&
~ 105 .& .&
.& Q) 0
:::J lJ..
100 0 0 "'0 Q)
ti Q) .C'
95 B Q) :::J
lJ.. 90 "'0 Q) 0 CMCVopen ro 0
~ co 0 ~
.& CMCV closed(B) X Cl.. 85 X
0 CMCV closed(T) ro CMCV closed(S) > X
l.J.J - •• Linear Fit of CMCV open -- Linear Fit of CMCV closed(B)
80 30 45 60 75 90 105 120 135 150 165
Cycle No.
Figure 4-6 Percentage of evaporated fuel to injected fuel as a function of cycle number during the quasi-steady period for various CMCVs.
52

4.2.3 Combustion Characteristics
Combustion stability was investigated qualitatively during the transient period, and
was quantified by the COV of the Net-IMEP during a quasi-steady period. Net-IMEP was
calculated from in-cylinder pressure data acquired from cylinder #4. More stable Net-IMEP
was observed in all three CMCV closed cases compared with the CMCV open case during
the transient period as shown in Figure 4-7. During the quasi-steady period, the COV of
Net-IMEP was also decreased with the base CMCV and the swirl type CMCV; a COV of
5.2% and of 5.5% were obtained, respectively, while the CMCV open case yielded a COV
of 5.9%. The combustion stability, however, slightly worsened with the tumble type
CMCV up to a COV of 6.2%.
10 CMCV open 1 CMCV closed(B)
80M 6- co -
2 - z
0- 0 -. U
li 0~ liuiL~lihI ..llluuu1Illff0 5 10 15 20 25 30 0 5 10 15 20 25 30
10-CMCV closed(T) 10 CMCV closed(S)
6 --
.a.
LJ 4-
z
|11:41 1|111 2 111112 01 111 10 5 10 15 20 25 30 0 5 10 15 20 25 30
Cycle No. Cycle No.
Figure 4-7 Net-IMEP as a function of cycle number during the transient period for various CMCVs.
53

Burn rate analysis was conducted on the 0 to 20 seconds after cranking. The flame-
development angle (0-10% energy-release fraction) and rapid-burning angle (10-90% en-
ergy-release fraction) were investigated with the CMCV open and with the various CMCVs
closed. It is known that the flame development process is primarily influenced by the mix-
ture state, composition, and motion in the vicinity of the spark plug. The rapid burning
stage, during which the major portion of the charge bums as the flame propagates across
the chamber, is obviously influenced by conditions throughout the combustion chamber.
The 0-10% and 10-90% combustion durations were shortened with all three different
CMCVs as shown in Figure 4-8 and Figure 4-9. In particular, the 0-10% and 10-90% com-
bustion durations were significantly reduced with the CMCV closed during the transient
period. There are two plausible mechanisms for these faster burning processes. First, differ-
ences in in-cylinder mixture composition, resulting from the enhanced mixture preparation,
could affect the combustion duration. On the other hand, differences in gas motion in the
vicinity of the spark plug, resulting in differences in motion of the flame kernel during the
early stages of development, could also affect the combustion duration.
Least square fit lines for the CMCV open and the base CMCV closed case were added
to Figure 4-9 for a more clear illustration. Significant reductions were also achieved with
the CMCV closed during the quasi-steady period, due to the combined effect of richer in-
cylinder mixture and enhanced gas motion within the cylinder, while the injected fuel mass
and spark timing trajectories remained the same for all cases.
54

Combustion Duration of Transient Region
o CMCV openA CMCV closed(B)
- 0 CMCV closed(T)X CMCV closed(S)
00
0
0 P 0
A
0-10%-
o 5 10 15 20 25 30
Cycle No.
50
45
40
35
300
25
E0 20C-,
o 15
10
0
- -
-x
0 0 A-
A A~~0
0 d,A>A&
-210-90%
0 5 10 15 20 25 30
Cycle No.
Figure 4-8 0-10% and 10-90% combustion durations as a function of cycle number during the tran-sient period for various CMCVs.
Combustion Duration of Quasi Steady Period
37
35
33
< 310C 2901 27
O 25
2 23
.o 21Eo 19
' 170
615
13
42
40
a 38
< 36U
c 34
O 32
30S0C0= 28
Ct)
-O 26E0o 24
_ 22
620
18
30 45 60 75 90 105120135150165
Cycle No.
Figure 4-9 0-10% and 10-90% combustion durations assteady period for various CMCVs.
0
0 0(0 0
0 0 0-0 00 0 00 0
00 0 EVO0 *oQ
cxy 00 0tm qj M-Ac 0-' 15 ' ' ' ' 'W M
- O -- < CuAO AmOnci ;xa MMxCU= cx M GOP A
-0) ctnoc Aor) >*DM%0 M4"
xc-x So *E3<XEs A
.m x A e oxx*-" hf A A-
06~"AA*>A
AAo0iCA A0 0 10-90%/C
30 45 60 75 90 105120135150165
Cycle No.
a function of cycle number during the quasi-
55
50
45
40
35
30
25
20
15
=3
0OOR-o
10
0 CMCV open_ A CMCV closed(B)
0 CMCV closed(T)- X CMCV closed(S)
--- Linear Fit of CMCV open- Linear Fit of CMCV closed(B)
00 0 0
-X 0 o o -(A& 0
-COOO cx<)00< 006 octl A 0-.) 0 XO OX MAD ~ X* (a xUa-x M> arflM&Wma
ARA 00 AO cAoA- 4OAA AA00 0 0
0-10%, 1 1 , , , , , , , , , , , 7, ,

4.2.4 Exhaust Emissions
Time-resolved cylinder #4 exhaust port exit HC, CO and CO 2 concentration data were
taken for the first 20 seconds of engine operation. During the transient period, high HC and
CO emissions were observed due to the rich in-cylinder mixture condition and the in-
creased charge dilution. As the engine accelerated, the intake manifold pressure decreased
to a low value of about 0.26 bar, which increased the residual gas fraction due to the in-
creased backflow during the valve overlap period. The highest HC mole fraction occurred
around cycle #13 where the intake manifold pressure dipped to its minimum value. As the
intake manifold pressure started to increase to the idle calibration condition, there was a
progressive drop in HC mole fraction.
Using the same fuel injection and spark timing trajectories, higher levels of engine-
out HC emissions relative to the CMCV open case were observed with all three different
CMCVs. There were several plausible reasons for the trends shown in Figure 4-10 and Fig-
ure 4-11. Richer in-cylinder mixture conditions with the CMCV closed cases mainly pro-
duced higher engine-out HC emissions. As combustion was phased earlier due to faster
burning with the enhanced charge motion, higher in-cylinder peak combustion pressures
occurred and also increased the mass fraction of the HC trapped in crevice volumes that
escaped the oxidation during flame propagation.
56

Engine-out HC Emissions of Transient Period
7 X 0 CMCV openA CMCV closed(B)0 CMCV closed(T)
> 6 -X CMCV closed(S)
.3 A
E 5-C,
o X
Ew 3 -
LO AI ~ 0 X
A2 --
0 X
_ 0 10 0 0
0 1
0 5 10 15 20 25 30
Cycle No.
Figure 4-10 Engine-out HC mass emissions measured at the exhaust port exit of cylinder #4 as a func-tion of cycle number during the transient period for various CMCVs.
0.7
S0.6
E20.5
C,).V)
ELU 0.4
S0.3
LLJ
0.2
Engine-out HC Emissions of Quasi-steady Period
0 CMCV openx A CMCV closed(B)
x 11 CMCV closed(T)- O X CMCV closed(S)
A*
. x x ~~ xxX oc 6
i bXS,%~~ A Ax) X
0 A a A A-
30 45 60 75 90 105 120 135 150 165
Cycle No.
Figure 4-11 Engine-out HC mass emissions measured at the exhaust port exit of cylinder #4 as a func-tion of cycle number during the quasi-steady period for various CMCVs.
57

4.2.5 Flow Testing Results
In order to quantify the in-cylinder charge motion with the CMCVs, flow bench tests
were conducted at GM Powertrain Warren Engineering Center. The raw in-cylinder flow
motion information, either the swirl or tumble, was indicated as a torque. However, the
torques, by themselves, are of little value and must be corrected for flow rate and test con-
ditions. By normalizing torque output values with engine geometries (bore and stroke) and
plotting them versus valve lift, the swirl and tumble indexes were produced. Physically, the
index represents a measure of the rate at which the charge in the cylinder is swirling or
tumbling around its axis per engine revolution if all the inducted charge entered the cylin-
der at the given valve lift. More information about the swirl and tumble index calculation is
described in Appendix A.3.
Figure 4-12 and 4-13 show the swirl and tumble index from the raw torque values that
come from flow bench meters as a function of normalized valve lift. The strongest swirl
flow was observed with the swirl type CMCV and the moderate increase of swirl flow was
also shown with the base CMCV, while little impact on the swirl motion was identified
with the tumble type CMCV. All three designs, however, increased the tumble index rela-
tive to the CMCV open case, and the base CMCV was found to give slightly higher tumble
flow than the others.
The differences of these swirl and tumble motions are likely to affect the liquid fuel
transport, distribution, and evaporation; therefore, those flow testing results can be corre-
lated with the previous results of mixture preparation, combustion characteristics, and HC
emissions.
58

6
5
4
3
2
0
-1
Swirl Index
0.00 0.05 0.10 0.15 0.20 0.25 0.30
L /DV V
Figure 4-12 Swirl index from flow bench meters as a function of normalized valve lift for variousCMCVs.
2.0
1.5
1.0
0.5
0.0
-0.5
-1.0
-1.5
-2.00.00
Tumble Index
AA
-0-o
'0 ----
0 --- 0---0------- ------
--0--- CMCV open-- CMCV closed(B)
E CMCV closed(T)X-CMCV closed(S)
0.05 0.10 0.15 0.20 0.25 0.30
L /DV V
Figure 4-13 Tumble index from flow bench meters as a function of normalized valve lift for variousCMCVs.
59
0)
- --- CMCV open-- CMCV closed(B)
E3 CMCV closed(T)x- CMCV closed(S)
- x
0-)-----0------- --- ~ O .. ~
E
I I I I I I

4.2.6 Overall Assessment of Different CMCVs
Different geometric charge motion control valves were found to yield differences in
fuel evaporation, combustion rate, and engine-out HC emissions. With the same fuel injec-
tion and spark timing profile, the highest fuel evaporation was achieved with the base
CMCV, which has the highest tumbling and also significant swirling flow motion. Lower
fuel evaporation and higher HC emissions were observed with the swirl type CMCV, which
has the strongest swirl motion and moderate tumble motion, than the other CMCVs. The
swirl type CMCV showed slower 0-10% combustion but faster 10-90% combustion than
the tumble type CMCV that enhances only the tumble motion.
A plausible mechanism can be developed by correlating the in-cylinder flow motion
characteristics with the other results. With the swirl type CMCV, the bulk flow was forced
to rotate strongly through the cylinder liner side; therefore, more of fuel droplets were pre-
sumably distributed near the cylinder wall than the centrally located spark plug gap. This
was likely to cause the lack of fuel in the vicinity of spark plug gap and the excess of fuel
near the cylinder wall. This fuel distribution can explain relatively slower flame initiation
(0-10% combustion duration) in the earlier stage of combustion and higher flame propaga-
tion (10-90% combustion duration) in the later stage of combustion with the swirl type
CMCV. In addition, by this excess swirl motion through the cylinder wall, more liquid fuel
could wet the cylinder wall, resulting in increased amounts of fuel deposited in cylinder and
also engine-out HC emissions. In contrast, with the tumble motion, strong flow patterns can
be expected near the piston top and cylinder head surface. Thus, higher flow motion can be
achieved in the vicinity of spark plug gap.
The overall results indicate that in-cylinder swirl and tumble motion should be appro-
priately combined by optimizing the shape of the CMCV. The base CMCV, which moder-
ately enhanced the swirl and tumble motion, showed the greatest potential for mixture
preparation, combustion characteristics, and HC emissions.
60

4.3 Effects of Reduced Fuel Injection
4.3.1 Modification of Fuel Injection
Since relatively richer in-cylinder mixture conditions were observed with the CMCV
closed, reduced sequential fuel injection was then used with the CMCV closed case. In or-
der to achieve the same in-cylinder lambda trace with the baseline CMCV open calibration,
reduced amounts of fuel were injected for the CMCV closed case. Spark timings, however,
were maintained at the same levels of the baseline CMCV open calibration. The impacts of
spark timing on combustion and emissions were thus decoupled from the effects of reduced
fuel injection.
The comparison of the various charge motion control valves indicates that the base
CMCV has the greatest potential for improving mixture preparation and combustion char-
acteristics even though it produces higher HC emissions (due mainly to the higher in-
cylinder lambda conditions). Thus, the base CMCV was used for further comparison ex-
periments.
4.3.2 Mixture Preparation
The effect of reduced fuel injection with the CMCV closed on mixture preparation
was evaluated while using the same spark timing trace as the base CMCV open calibration.
Figure 4-14 shows the injected fuel mass as a function of cycle number during the first 20
seconds following engine cranking, in order to obtain the same in-cylinder lambda trace as
the baseline CMCV open calibration. The amount of cycle-by-cycle injected fuel mass was
reduced approximately by 7.5% during the transient period, including a 12% reduction for
the first two cycles. During the quasi-steady period, overall 3.5% less fuel was injected
with the CMCV closed. Meanwhile, the same baseline spark timings were applied to both
the CMCV open and closed case.
61

Injected Fuel Mass125 k I I ' * * I
120 - 0 CMCV open115 A CMCV closed
110 &-> 105
045E A
40
CO 35
30
L 25
20 -
0 A
w15- 10
5
00 20 40 60 80 100 120 140 160
Cycle No.
Figure 4-14 Required mass of injected fuel as a function of cycle number for the same in-cylinderlambda trace with the CMCV open and closed during the first 20 seconds after crankingcommenced.
4.3.3 Combustion Characteristics
Combustion characteristics were investigated in terms of the variation of Net-IMEP
and combustion duration in order to assess the effectiveness of the CMCV with reduced
fuel injection. A smaller variation of Net-IMEP, shown in Figure 4-15, was obtained with
the CMCV closed (relative to the CMCV open case) during the transient period, while the
same in-cylinder lambda and spark timing trace were maintained. During the quasi-steady
period, Net-IMEP averaged 2.45 bar with 5% COV for both the cases. Test-to-test
variations in average Net-IMEP and COV were ±0.1 bar and ±0. 3%, respectively.
62

10
.0
6
4
8
6
4
2
0
CMCV open
0 5 10 15 20 25 30
Cycle No.
Figure 4-15 Net-IMEP as a function of cycle number during the transient period for the CMCV opencase and the CMCV closed case with reduced fuel injection.
Burn rate analysis was performed on the first 20 seconds following engine cranking to
determine the 0-10% and 10-90% combustion duration. Figure 4-16 and Figure 4-17 show
clear differences between the CMCV open and closed case. Noticeable reductions in both
the 0-10% and 10-90% combustion duration were found with the CMCV closed, especially
during the transient period. Reduced combustion durations of the CMCV closed case could
allow additional spark retard while injecting less fuel overall.
63
i CMCV closed
-UmmCL
025 300 5 10 15 20
Cycle No.
10

Combustion Duration of Transient Region60 , 1 6 . . . . . .. .
0-10% 10-90%55 55 0
0) 050 - 0-0 0 0 0 0 0
045 - 45 o0
-0 40 0 .2 40 -C 00400 0 0o 0 .0 35 0 35 - 0C - 0 0 0 -0 00. 0 0 . 0 ODo
30 - 0 O 30 -A 0 AAA 0 0 0 0
~ 5 A A 0 A A E 25 A A A"AE 0 2 - A 20 - 0 A
0 0 oMA Ab~20 -A A - 20
15 - 0 CMCV open 0 15
IA CMCV closed A
10 10 I I I0 5 10 15 20 25 30 0 5 10 15 20 25 30
Cycle No. Cycle No.
Figure 4-16 0-10% and 10-90% combustion durations as a function of cycle number during the tran-sient period for the CMCV open case and the CMCV closed case with reduced fuel injec-tion.
Combustion Duration of Quasi Steady Region
0 CMCV open 035 - A CMCV closed - 40 0 -
- -Linear Fit of CMCV open A- Linear Fit of CMCV closed W 0 0 0
"0 0 AcLo A AAoo
030 00 - U 35 A 0 0 A 00 o AC0040 r_ 0 0 A
.o C o amo o A At 02 0 o OOA ,36 O(AS o0oAL 4 ao GD Ao o*& A 0 OAOO vo XOOft* dMd
O cD cxDO Od A $2110 0 cA oc 0 o AoeoM) 25 -a Ci A 30 o 0 Ala tCooC oaaiA ~ A A o0 A * A.O 0s sa Me A Ao& oA
. 0 A AA A A - L eOAAAL AAAE -A& AM&!,a! <k AAA ' J E 2 AAA AAn".Gr A A oA AITL AAAUA&
o AA
6-1iS 10-90%I I~ 1 i e . I Ii .1 , i 1 i I I 1. , , ,
25 40 55 70 85 100115130145160 25 40 55 70 85 100115130145160
CyCle No. Cycle No.
Figure 4-17 0-10% and 10-90% combustion durations as a function of cycle number during the quasi-steady period for the CMCV open case and the CMCV closed case with reduced fuel injec-tion.
64
Gas motion effects on air-fuel mixture in the port and cylinder can be divided into two
areas: the effect on mixture preparation which is represented by in-cylinder air/fuel ratio,
and the effect on flame-development which is represented by the 0-10% energy-release
fraction angle. Since the same in-cylinder lambda trajectory was maintained with the same
spark timing for both the cases, the difference of the 0-10% combustion duration can be
considered as the direct charge motion impact on flame-development. The CMCV thus de-
creased the 0-10% combustion duration, 80 CA on average during the transient period and
2' CA during the quasi-steady period, as a result of enhanced charge motion impacts on
combustion initiation.
4.3.4 Exhaust Emissions
With the CMCV open, the high engine-out HC emissions region, shown in Figure 4-
18, was observed near where the lowest intake manifold pressure occurred. The low in-
cylinder pressure presumably assisted the vaporization of liquid fuel deposited throughout
the engine. However, with the CMCV closed, high engine-out HC emissions were found in
the earlier stages of engine start-up. This implies that the CMCV enhanced fuel evaporation
rate right from the beginning; therefore, less liquid fuel should be deposited in the cylinder
during the transient period. Figure 4-19 shows that the engine-out HC emissions during the
quasi-steady period were reduced with the CMCV closed by 6.5%, while the same in-
cylinder lambda and spark timing profile was maintained.
65

7
6
5
E
C 4
ELU
3
U
2
LU
0
Engine-out HC Emissions of Transient Period
A 0 CMCV openA CMCV closed
AA
A A o00
0 0 A A 00 0
4A AAA 00 AA AAA&&f464*AA
0L I 15 20 25 I0 5 10 15 20 25 30
Cycle No.
Figure 4-18 Engine-out HC mass emissions measured at the exhaust port exit of cylinder #4 as a func-tion of cycle number during the transient period for the CMCV open case and the CMCVclosed case with reduced fuel injection.
0.65
0.60
S0.55
C)E 0.50
o 0.45
E 0.40LUJ
I 0.35
06 0.30
0.25LUI
0.20 12
Engine-out HC Emissions of Quasi-steady Period
0 CMCV open0 A CMCV closed
A- - Linear Fit of CMCV open-- Linear Fit of CMCV closed
m - O
A 0 0 0A OA 0
- A 0 A
-~ A -
-
40 55 70 85 100
Cycle No.
15 I ,I 160115 130 145 160
Figure 4-19 Engine-out HC mass emissions measured at the exhaust port exit of cylinder #4 as a func-tion of cycle number during the quasi-steady period for the CMCV open case and theCMCV closed case with reduced fuel injection.
66
. I . I . I . I . I .
3

4.4 Effects of Retarded Spark Timing
4.4.1 Modification of Spark Timing
Since considerable shortening in combustion duration and improvement in combus
tion stability were achieved with the use of the charge motion control valve, additional
spark retard was feasible with the CMCV closed. Three different spark modifications with
the CMCV closed were investigated during the first 20 seconds following engine cranking.
Spark timings, shown in Figure 4-20, were retarded (~esp = _5° and -10°) with respect to
the baseline spark timing (~esp = 0°), while the same in-cylinder lambda trace was main
tained for all three different spark modifications.
40
35
30
25
G 20 0
t-eo
15 'L-0) c 10 ·E f= 5 .::,t:.
m 0 Cl. if)
-5
-10
-15 0
Spark Modification with the CMCV closed
20 40 60
--~El =0° sp
- - - ~e = _5° sp
- - . - . ~e = -1 0° sp
80 100 120 140 160
Cycle No.
Figure 4-20 Spark timing as a function of cycle number during the first 20 seconds following engine cranking for various spark modifications with the CMCV closed.
67

4.4.2 Mixture Preparation
Figure 4-21 shows the required Inass of injected fuel for the same in-cylinder lalnbda
trace as the baseline spark tuning (~esp = 0°) case. The steady-state experilnental results
showed that the air and fuel mass flow rates through the engine were increased with an in
creased level of spark retardation to maintain the same mean Net-IMEP. Similar trends
were observed in the start-up experiments. As spark timing was retarded, more fuel was
injected and also more air was inducted for the same in-cylinder latnbda trajectory.
Injected Fuel Mass
20~,~~,~~,~~,~~,~~,~;~,=~==,====,==~~,
Q3 14 ~ u.. "0 Q)
ti .~ 12 r-
A ~o = 00
sp * ~o = _50 sp
~o = _100
sp
10 I I I I I I I I I I
-
30 45 60 75 90 105 120 135 150 165
Cycle No.
Figure 4-21 Required mass of injected fuel as a function of cycle number for the same in-cylinder lambda trace with various spark modifications during the first 20 seconds after cranking commenced.
4.4.3 Combustion Characteristics
As combustion was phased later in the cycle, spark timing retardation was limited by
combustion stability. Therefore, at each of the three different spark modifications, combus
tion stability was assessed during the first 20 seconds following engine cranking. Figure 4-
22 shows the Net-IMEP during the transient period. As the level of spark retardation was
increased, there was a noticeable increase of fluctuation in the Net-IMEP during the
transient period. During the quasi-steady period, the COY of Net-IMEP was also increased;
68

sient period. During the quasi-steady period, the COY of Net-IMEP was also increased; the
COY of5 .2%, 6.0%, and 6.9% were observed for the ~esp = 0°, ~esp = _5 °, and ~esp = -10°
spark modification, respectively.
10
8
6 ro e
e... w ~ 4 Z
2
o
10 10 l18 = 0° _ l18 = _5° I ""t*4Jl18 = -10°
sp sp sp
ro e e... w ~
o 5 10 15 20 25 30
Cycle No,
8
6
4
ro e e... w ~
o 5 10 15 20 25 30
Cycle No.
8
6
4
2
o o 5 10 15 20 25 30
Cycle No.
Figure 4-22 Net-IMEP as a function of cycle number during the transient period for various spark modifications with the CMCV closed.
The location of 50% mass fraction burned, 0-100/0 combustion duration and 10-90%
combustion duration, shown in Figure 4-23 , Figure 4-24 and Figure 4-25 , were determined
by bum rate analysis. As the spark timings were retarded, the locations of 500/0 mass frac
tion burned were also retarded during both the transient and quasi-steady period. With the
most aggressive spark retardation (~esp = -10°), relatively larger variations in the location
of 50% mass fraction burned and the 10-90% combustion duration were observed as com
bustion occurred in a rapidly expanding cylinder volume. However, relatively less varia
tions were observed in the 0-100/0 combustion duration, which is influenced primarily by
the in-cylinder mixture preparation and in-cylinder gas motion. This is likely because the
in-cylinder lambda trace was fixed and gas motions in the vicinity of the spark plug were
fairly silnilar due to the use of the CMCV for all three spark modifications.
69

Location of 50% Mass Fraction Burned
60 o
o 20 40 60 80
Cycle No.
100
... ~6 = 0° sp * ~6 = _5° sp
o ~6 = _10° sp
120 140 160
Figure 4-23 Location of 50% mass fraction burned as a function of cycle number during the 20 seconds after engine cranking for various spark modifications with the CMCV closed.
Combustion Duration of Transient Region
45 t--
~ 40 t--'0
« ~ 35 t--c o
o o
o
& ~e = 0° sp * ~e = _5° sp
o ~e = _10° sp
o
.~ 30 t-- & 0 0 :; .. A 0 0 f:!J. &
§ 25 Co ;*~;frJob .~ ~;~& ~ ~ 20 r* T & & o ,. *& &
U M g 15 r ~ * ,......
6 10 0-10%
I I I 1 11 ~
o 5 10 15 20 25 30
Cycle No.
45
cr, ~ 40
« U '-"'35 c o .~ 30 ::J o C .g 25 (f)
::J .0 E 20 o U
g 15 en 6 ,...... 10
-
* 0 -
0
& *'IE -
0 & ~& 0
* *
10-90% ~ _I I 1 I 1 1
o 5 10 1 5 20 25 30
Cycle No.
Figure 4-24 0-10% and 10-90% combustion durations as a function of cycle number during the transient period for various spark modifications with the CMCV closed.
70

0, Q) "0
<t:
35
S:?. 30 c o .~
~ o 25 c o
'f7; ::J
.D E 20 o U
"* o r-
6 15
Combustion Duration of Quasi-steady Region
~ 69 = 00
sp
* 69 = _50 sp
0 69 = _lOa sp
W1!!Il(
~ ~ o~
OIl ~o~d\ ~o ~o ~ *-~
0.0 ____
~DO _~~ __ BAlIlib'.
~~ ~&:J_~~~ ... ~ ... l-..:ro CI&l JlIiiIit. .... .. ~,..
tl~ ~* ~~*~;tJ* 0 -~~ ;eJ *
c- '* 0-10% _L I _I L I
45~~~~~~~~~~
"* 020 (j)
6
*
o
o
* * o * **
00 0 * ~0[JlK:
~ ~. o ITJ",*_
o 0 *_ * GIE*J i3 .-:J ~o ** '* DID*: ~
10-90% 15~~~~~~~~~~
30 45 60 75 90105120135150165 30 45 60 75 90105120135150165
Cycle No. Cycle No.
Figure 4-25 0-10% and 10-90% combustion durations as a function of cycle number during the quasisteady period for various spark modifications with the CMCV closed.
4.4.4 Exhaust Emissions
Time-resolved cylinder #4 exhaust port exit HC, CO and CO2 concentration meas
urements were taken for the first 20 seconds of engine operation. In order to investigate the
effect of retarded spark timing, the engine-out HC mass emissions were evaluated for three
different spark modifications. Figure 4-26 and Figure 4-27 show that the engine-out HC
emissions were reduced with the moderate spark retardation (~esp = _5°) by 220/0 during the
transient period and by 140/0 during the quasi-steady period. However, with the more ag
gressive spark retardation (~esp = -10°), the engine-out HC emissions were increased by
200/0 during the transient period and by 14% during the quasi-steady period. As described in
Section 4.4.2, the air and fuel mass flow rates through the engine were increased with in
creased levels of spark retardation to maintain the same mean Net-IMEP. Thus, a decrease
in HC concentrations with the spark retardation was more than offset by an increase in
mass flow rate.
71

..--..6 CI)
U >. u 0,5 S (f)
c o 'Vi (f)
~ 3 U I
"5 2 o a) c '0, 1 c
l.LJ
o
III I
'- \ r
;-
r
r-
o
Engine-out HC Emissions of Transient Period I I I I I I
---A--- ~e = 00
sp
- -)f- - ~e sp
= _50
···D···~e = _100
sp
~\ -
-. .' \ .'" $ \ b\ .~
)iii '. 0 '. -~: b '0: '.
~ & .... *,0. "'=~?-~~~} '0 p ... -* ··*-*t~i,;j"iH= .. ~~i
10 15 20 25 30
Cycle No.
Figure 4-26 Engine-out HC mass emissions measured at the exhaust port exit of cylinder #4 as a function of cycle number during the transient period for various spark modifications with the CMCV closed.
Q) u
0.8
~ 0.7 0, S (f)
§ 0.6 'Vi (f)
'E W 0.5 U I
"5 o 0.4 a) c '0, c W 0.3
30
Engine-out HC Emissions of Quasi-steady Period
o
45 60 75
t>9 = 00
sp * t>9 = _50 sp
o t>9 = _100
sp
-- Linear Fit of t>9 = 00
sp
- .• - Linear Fit of t>9 = _50 sp
- - • Linear Fit of t>9 = _100
sp
90 105 120 135 150 165
Cycle No.
Figure 4-27 Engine-out HC mass emissions measured at the exhaust port exit of cylinder #4 as a function of cycle number during the quasi-steady period for various spark modifications with the CMCV closed.
72
4.5 Modified Start-up Strategy with CMCV closed
4.5.1 Modification of Fuel Injection and Spark Timing
As discussed in the previous sections, mixture preparation and combustion character-
istics were improved with the CMCV closed by enhancing fuel vaporization and increasing
burning rate. Greater fuel vaporization allowed reduced fuel injection and the faster burning
rate enabled additional spark retard. In addition, the extended retardation of spark timing
decreased HC emissions. Therefore, an appropriate combination of reduced fuel injection
and retarded spark timing with the CMCV closed could be a way to achieve more robust
combustion and lower HC emissions during the engine start-up process.
In order to achieve the same in-cylinder lambda profile as the baseline CMCV open
calibration, reduced sequential fuel injection strategy was applied to the CMCV closed case
as shown in Figure 4-28. The amount of reductions in fuel injection was determined by the
results of Section 4.3. At the same time, retarded spark timing strategy was also utilized to
the CMCV closed case for more reductions in HC emissions as shown in Figure 4-29.
Spark timing was modified using the results of Section 4.3 and Section 4.4.
During the transient period (0 to 3 seconds), a total of 7.5% reduced fuel, including a
12% reduction for the first two cycles, and 80 CA retarded spark timing were applied to the
CMCV closed case. During the quasi-steady period (3 to 20 seconds), overall 3.5% reduced
fuel and 50 CA retarded spark timing were applied to the CMCV closed case with respect to
the baseline CMCV open case.
73

0)
EC-)
CO
LL_0C-)C'
125
120
115
110
105
45
40
35
30
25
20
15
10
5
0
Injected Fuel Mass
-0o CMCV open--A CMCV closed
0
A
A-
- -0
0 20 40 60 80 100 120 140 160
Cycle No.
Figure 4-28 Injected fuel mass as a function of cycle number with the CMCV open and closed duringthe first 20 seconds after cranking. Reduced sequential fuel injection strategy was appliedto the CMCV closed case.
Spark Timing
U
C
CO
LI)
35
30
25
20
15
10
5
0
-5
-10
CMCV open--- \---- CMCV closed -
IV'
\ -
- --
I I I I . I . I .
0 20 40 60 80 100 120 140 160
Cycle No.
Figure 4-29 Spark timing as a function of cycle number with the CMCV open and closed during thefirst 20 seconds after cranking. Retarded spark timing strategy was applied to the CMCVclosed case.
74

4.5.2 Mixture Preparation
In-cylinder lambda was calculated from the exhaust HC, CO, and CO2 emissions data
to investigate mixture preparation before combustion. Figure 4-30 shows in-cylinder
lambda traces as a function of cycle number for the cases described in the previous section.
Cycle-by-cycle in-cylinder lambda points were well matched for both cases within ±2%.
Figure 4-30 suggests that both cases had similar mixture preparation conditions before
combustion occurred.
In-cylinder A.
1.8 I I I I
I 0 CMCVopen ~ 1.6 f-.A. • CMCV closed
0 1.4 I- -
1.2 I- -
0.4 L.-LI----'----'I'-'--"--I...&.-.-........ I---'-----'I----'~l'__"__...L.._ 1-'--....L1----,---,-,i
o 20 40 60 80 100 120 140 160
Cycle No.
Figure 4-30 In-cylinder J... as a function of cycle number during the first 20 seconds following engine cranking with the CMCV open and closed. Reduced sequential fuel injection and retarded spark timing strategy was applied to the CMCV closed case.
4.5.3 Combustion Characteristics
Net-IMEP and combustion durations were calculated from in-cylinder pressure data
acquired from cylinder #4 in order to investigate combined effects of reduced fuel and re
tarded spark timing with enhanced charge motion on combustion characteristics. Qualita
tive observation of Net-IMEP shown in Figure 4-31 indicates that combustion stability was
improved with the CMCV closed during the transient period. However, the COY of Net-
75
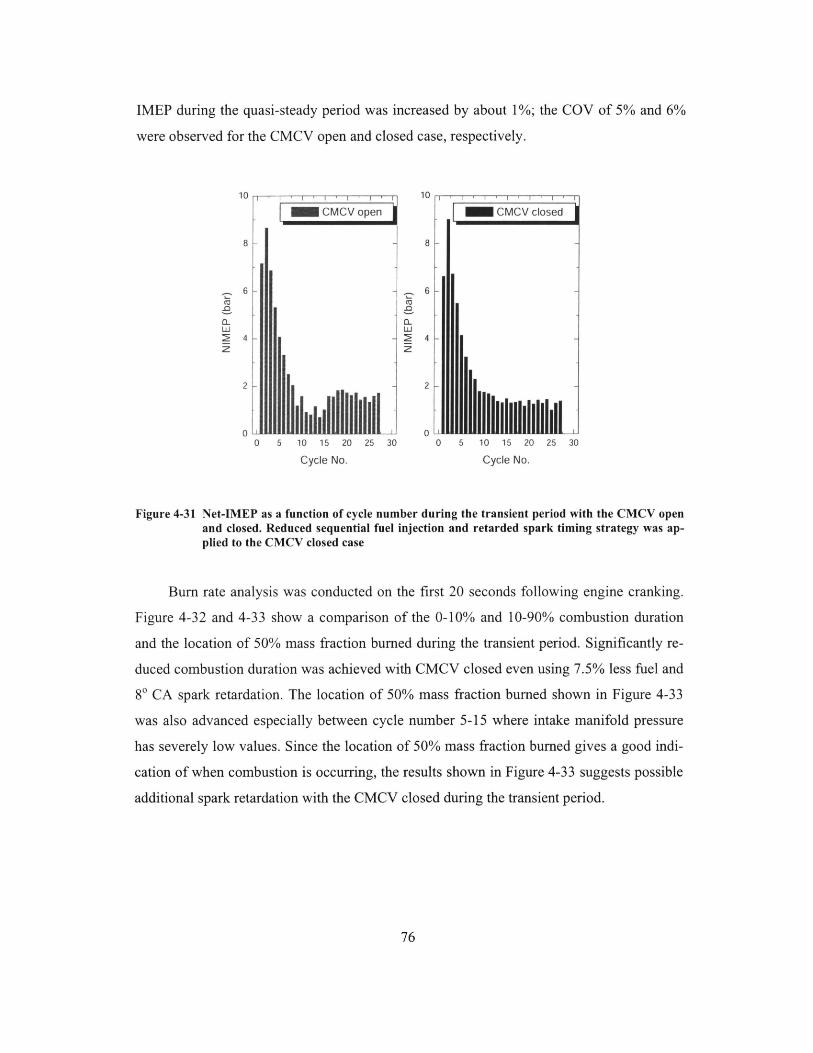
IMEP during the quasi-steady period was increased by about 1 %; the COY of 5% and 6%
were observed for the CMCV open and closed case, respectively.
ro e 0... ll.J
8
6
~ 4 z
2
o o
_CMCVopen
10 15 20 25 30
Cycle No.
'-ro e
0... ll.J
8
6
~ 4 Z
2
o
_ CMCV closed
o 5 10 15 20 25 30
Cycle No.
Figure 4-31 Net-IMEP as a function of cycle number during the transient period with the CMCV open and closed. Reduced sequential fuel injection and retarded spark timing strategy was applied to the CMCV closed case
Bum rate analysis was conducted on the first 20 seconds following engine cranking.
Figure 4-32 and 4-33 show a comparison of the 0-100/0 and 10-90% combustion duration
and the location of 50% mass fraction burned during the transient period. Significantly re
duced combustion duration was achieved with CMCV closed even using 7.5% less fuel and
8° CA spark retardation. The location of 500/0 mass fraction burned shown in Figure 4-33
was also advanced especially between cycle number 5-15 where intake manifold pressure
has severely low values. Since the location of 500/0 mass fraction burned gives a good indi
cation of when combustion is occurring, the results shown in Figure 4-33 suggests possible
additional spark retardation with the CMCV closed during the transient period.
76

Combustion Duration of Transient Period 60 I I I I I I I 60 I I I I I I
0-10% 10-90% 55 - 55 r. 0
0> 0> 0 Q) 50 -
Q) 50 0 "0 0 "0 0
« 0 « ~ 45 - ~ 45 00
c 0 c
0 0 • • .~ 40 0 - .~ 40 -
:s 0 0 :s o .~O
0 0 35 0 ~
- 35 c- o • • -0 0 c 0 00. c 0
• CD~~ 0 0 o 0 ~ .~ .~ 30 30 -
::::l M,cAc1. ::::l o ~ /.~~ .0 .0
E 25 • E 25 0 -0 o ~ i1 0 0 CD U 0 • Ji. U • cf2. 20 • .6M cf2. 20 ~. ~. • 0 ~.
0 ..-- en ~
6 15 I
0 CMCVopen t 6 15 f- •• I 0 CMCVopen t • CMCV closed • CMCV closed
10 I I L 10 0 5 10 15 20 25 30 0 5 10 15 20 25 30
Cycle No. Cycle No.
Figure 4-32 0-10% and 10-90% combustion durations as a function of cycle number during the transient period with the CMCV open and closed. Reduced sequential fuel injection and retarded spark timing strategy was applied to the CMCV closed case.
65 f-
60 f-
55 f-
U- 50 f-0 f-- 45 ~ 40
r-f-en
l.J.... 35 ~
• f-
cf2. 30 f- 0 0 l!') 25 f-
a c 20 f-0
15 .~ f-
u 10 0 --l
5
0 -'-o
Location of 50% MFB of Transient Period
0 0
()
0 0 o. 0 •• • • 0 • 0 •
o~· ••
1 I
5 10
0
0
• 0
.~. • 0
• •
I I
15
Cycle No.
0°
0
•
I I
• 0 ••
0
• 0 o. • • 0
• 0
0
CMCVopen CMCV closed
20 25
I-
---
---
-
---
I: 30
Figure 4-33 Location of 500/0 mass fraction burned as a function of cycle number during the transient period with the CMCV open and closed. Reduced sequential fuel injection and retarded spark timing strategy was applied to the CMCV closed case.
77

Figure 4-34 and 4-35 show a comparison of the 0-10% and 10-900/0 combustion dura
tion and the location of 50% mass fraction burned during the quasi-steady period. Rela
tively large variations in the 10-90% combustion duration and the location of 50% mass
fraction burned were observed with CMCV closed. This increased variation was responsi
ble for slightly decreased combustion stability (COV) during the quasi-steady period.
Variations in the location of 50% mass fraction burned are known as the primary cause of
cyclic variations in the Net-IMEP. Since the expansion ratio decreases rapidly during com
bustion for retarded spark timing, the combustion phasing is one of the major factors which
determines individual cycle Net-IMEP. Both the CMCV open and closed case were found
to experience almost the same combustion phasing on average since two linear fit lines of
the location of 50% mass fraction burned almost coincided, while using reduced sequential
fuel injection and retarded spark timing strategy for the CMCV closed case.
Combustion Duration of Quasi Steady Period 40 45~~~~~~~~~~
o CMCVopen .. CMCV closed
- •• Linear Fit of CMCV open - Linear Fit of CMCV closed
o
eft. o 20 O'l 6
0-10% 10-90%
o A o
10 15~~~~~~~~~~
25 40 55 70 85100115130145160 25 40 55 70 85 100115130145160
Cycle No. Cycle No.
Figure 4-34 0-10% and 10-90% combustion durations as a function of cycle number during the quasisteady period with the CMCV open and closed. Reduced sequential fuel injection and retarded spark timing strategy was applied to the CMCV closed case.
78

G 0 f-
~ co l.L
~
eft. 0 L{)
a c 0 .~
u 0
-.J
55
50
45
40
35
30
25
Location of 50% MFB of Quasi-steady Period
o CMCVopen • CMCV closed
- • - Linear Fit of CMCV open --Linear Fit of CMCV closed o • .. () 0
00 A
20~~~~~~~~~~~--~~~~~~~~
25 40 55 70 85 100 115 130 145 160
Cycle No.
Figure 4-35 Location of 50% mass fraction burned as a function of cycle number during the quasisteady period with the CMCV open and closed. Reduced sequential fuel injection and retarded spark timing strategy was applied to the CMCV closed case.
4.5.4 Exhaust Emissions
HC, co and CO2 concentrations were measured at the exhaust port exit of cylinder #4
during the first 20 seconds after engine cranking commenced. Figure 4-36 and Figure 4-37
show the mass of engine-out HC emissions per cycle during the transient period and during
the quasi-steady state, respectively. There was a noticeable decrease in engine-out HC
emissions around the region in which the intake manifold pressure was lowest. The engine
out HC emissions were reduced by 18% during the transient period and by 7% during the
quasi-steady period. A total reduction of 12% in HC emissions was achieved by the charge
motion control valve with the reduced fuel injection and retarded spark timing.
79

I
6 ... Cil U » 0 u 0,5 S l/1 C 0 ·Vi l/1 ·E
3 l.LJ
U I
:5 2 0 cG c ·61 1 c
l.LJ
0 0
Engine-out HC Emissions of Transient Period I I
10
I I -'
I 0 CMCVopen ~ • CMCV closed
'"-----
15
Cycle No.
20
Transient region
I
25 30
Figure 4-36 Engine-out HC mass emissions measured at the exhaust port exit of cylinder #4 as a function of cycle number during the transient period with the CMCV open and closed. Reduced sequential fuel injection and retarded spark timing strategy was applied to the CMCV closed case.
Engine-out HC Emissions of Quasi-steady Period
0.60
Cil ~) ~ 0.55 u 0, o S 0.50 l/1 C 0 ·Vi
0.45 l/1
·E 0.40 l.LJ
U I 0.35 :5 0 cG 0.30
Quasi steady region c ·61 c 0.25
l.LJ
o CMCVopen • CMCV closed
- • - Linear Fit of CMCV open -- Linear Fit of CMCV closed
o. 20 L..-~~--'---'----I.---''---~''''''''''--'---'----'----'L..-~''''''''''--'---'----I.--' 25 40 55 70 85 100 115 130 145 160
Cycle No.
Figure 4-37 Engine-out HC mass emissions measured at the exhaust port exit of cylinder #4 as a function of cycle number during the quasi-steady period with the CMCV open and closed. Reduced sequential fuel injection and retarded spark timing strategy was applied to the CMCV closed case.
80
Chapter 5
Summary, Conclusions, and
Recommendations
5.1 Overview
The purpose of this research was to investigate the effects of various intake charge
motion control approaches on the cold start-up process of a port fuel injected SI engine.
Experiments were performed to assess the effectiveness of enhanced charge motion on mix-
ture preparation, combustion, and HC emissions. In this chapter, the findings of the re-
search will be summarized, conclusions will be drawn, and implications for future research
will be discussed.
5.2 Steady State Experiments
Steady state experiments were conducted to provide basic insight into combustion
characteristics and HC emissions behavior with the charge motion control valve (CMCV).
The combustion process and exhaust gas state were examined under the fixed engine opera-
tion (2.5 bar Net-IMEP, 1000 rpm) and cold (20'C) fluid condition. The following conclu-
sions were obtained from the steady state experimental results.
* Increased charge motion with the CMCV closed was found to shorten the 0-10%
and 10-90% combustion duration at a given spark timing. This reduced combustion
duration caused the 50% mass fraction burned to occur up to 5' CA earlier for the
same spark timing.
81
* With increased spark retardation from optimum timing, combustion stability was
found to worsen as more of the combustion process occurred in a rapidly expanding
cylinder volume. However, significant improvements in combustion stability (0.5-
1.5% reductions in COV) were achieved with the CMCV closed as spark timing
was retarded. This is due to the increase in burn rate with the CMCV closed, result-
ing from the higher in-cylinder velocity and turbulence.
* The CMCV decreased the exhaust gas temperature between 5-30'C at a given spark
timing, which was attributed to the increased in-cylinder heat transfer during com-
bustion due to the effectively less retarded combustion phasing (location of 50%
mass fraction burned) with the CMCV closed. However, at equivalent levels of
combustion phasing, there was close agreement between the CMCV open and
closed exhaust gas temperatures.
* No noticeable advantage on the exhaust HC emissions was found with the CMCV
closed at an equivalent combustion phasing in steady state idle operation, since the
exhaust HC mass flow rate with the CMCV closed was almost coincident with the
CMCV open case. This is mainly due to faster combustion and slightly higher peak
pressure, which have offsetting effects on the various sources of HC within the cyl-
inder.
* The use of the CMCV improved fuel consumption at retarded spark timings. Im-
provements in ISFC were obtained with the CMCV closed due to enhanced air-fuel
mixing and relatively faster burning, which caused the earlier end of combustion.
The ISFC at a given spark timing was reduced up to 8% relative to the CMCV open
case, as spark timing was retarded.
5.3 Engine Start-up Experiments
Engine start-up experiments were conducted with the three different geometric charge
motion control valves. Mixture preparation, combustion characteristics, and HC emissions
were evaluated with the various fuel injection and spark timing strategies during the first 20
82

seconds following engine cranking. The engine operation was divided into two distinct pe-
riods (transient period and quasi-steady period) at about 3 seconds, after which the engine
entered into the quasi-steady idle operation. The following conclusions were based on the
results of those engine start-up experiments.
Effects of the CMCV with the same fuel injection and spark profile
* The use of the CMCV was found to improve mixture preparation during the engine
start-up process. With the same fuel injection and spark timing trajectory, the
CMCV increased the amount of fuel evaporated relative to the CMCV open case.
This is mainly due to higher mixture velocities through the upper part of valve,
which increases atomization of liquid fuel at the valve seat, resulting in finer fuel
droplets and more rapid distribution and mixing with hot residual gas.
" Significant differences were observed between the different geometric charge mo-
tion control valves. The highest evaporation rate was obtained from the swirl-
tumble type CMCV (base type CMCV as shown in Figure 4-3). The liquid fuel
transport, distribution, and evaporation were affected by the combined swirl and
tumble flow motion, and correlated with combustion characteristics and HC emis-
sions. Moderately enhanced swirl and tumble motion, which was produced by the
base CMCV, showed the greatest potential for improving mixture preparation,
combustion characteristics, and HC emissions.
Effects of the CMCV with reduced fuel injection under the same spark profile
* The same in-cylinder air/fuel ratio profile as the CMCV open case was achieved
with the CMCV closed by injecting 7.5% less fuel during the transient period (0 to
3 seconds) and 3.5% less fuel during the quasi-steady period (3 to 20 seconds) due
to improved fuel transport and evaporation, while the same spark timing trajectory
was maintained.
83

* Charge motion impact on initial flame development was assessed by comparing the
burn rate analysis results with the same in-cylinder air/fuel ratio and spark timing
profile. The 0-10% combustion duration was reduced by 8' CA on average during
the transient period and 20 CA during the quasi-steady period due to enhanced in-
cylinder charge motion resulting from the use of the CMCV. Significant reductions
in the combustion duration were found with the CMCV closed, especially during
the transient period.
* Using the CMCV with the same in-cylinder lambda and spark timing profile, peak
engine-out HC emissions (excluding the first cycle) occurred in the earlier stages of
engine start-up process relative to the CMCV open case. Combining this with the
fact that the same burned fuel mass trajectory was maintained indicates that the
CMCV enhanced liquid fuel transport and evaporation rates, resulting in less liquid
fuel being deposited in the cylinder during the transient period. The engine-out HC
emissions during the quasi-steady period were reduced with the CMCV closed by
6.5%.
Effects of the CMCV with retarded spark under the same fuel injection profile
* Reduced combustion duration with the CMCV closed enabled additional spark re-
tard while injecting less fuel overall. Combustion stability worsened as combustion
was phased later. Moderate spark retard (AOsp = -5') was found to reduce the en-
gine-out HC emissions by 22% during the transient period and by 14% during the
quasi-steady period relative to the baseline spark timing (A0,= 0'). HC emissions
decreased at retarded spark timings due to decreased crevice volume fraction at
peak pressure and increased burned gas temperatures at the end of the expansion
and during exhaust, which increased post combustion oxidation.
Effects of the CMCV with reduced fuel injection and retarded spark profile
* The same in-cylinder air/fuel ratio profile as the baseline CMCV open case was
achieved with the CMCV closed by applying 7.5% reduced fuel and 8' CA spark re-
84

tard for the transient period and 3.5% reduced fuel and 5' CA spark retard for the
quasi-steady period due to increased fuel vaporization and burning rates.
* By the combination of reduced fuel injection and retarded spark timing strategy
with the CMCV closed, the combustion stability was increased during the transient
period. However, the COV of Net-IMEP during the quasi-steady period was wors-
ened from about 5% to 6%.
* A total reduction of 12% in HC emissions during the first 20 seconds of operation
was achieved by the charge motion control valve with the reduced fuel injection and
retarded spark timing. The engine-out HC emissions were reduced by 18% during
the transient period and by 7% during the quasi-steady period. This improvement
was mainly influenced by enhanced liquid fuel transport into the cylinder and in-
creased fuel vaporization, which allowed reduced fuel injection and prevented liq-
uid fuel deposited within the cylinder.
5.4 Overall Assessment and Recommendations
* The CMCV was found to improve the engine's cold start-up characteristics. In par-
ticular, greater improvement in mixture preparation, combustion stability, and HC
emissions were observed during the initial 3 seconds (transient period) before the
engine reached quasi-steady idle operation.
" Considering that a large fraction of the total HC emissions during the Federal Test
Procedure (FTP) is emitted during the first 20 seconds, and also that approximately
40% of the first 20 second HC emissions are emitted during the first 3 seconds, it
would be beneficial to use the charge motion control valve even for the first 3 sec-
onds of engine cold start-up.
* Different shape charge motion control valves, which produced different in-cylinder
flows, were found to yield the differences in fuel evaporation, combustion rate, and
engine-out HC emissions due to the combined effects of the swirl and tumble mo-
85

tion. Flow testing results indicate that better performance was obtained with the
CMCV geometries that produced moderate swirl and tumble intensities rather than
high swirl or tumble alone
* Greater fuel vaporization and faster burning rate with the CMCV closed allowed re-
duced fuel injection and additional spark retard, resulting in a significant reduction
in HC emissions during the engine cold start-up process.
* Since less liquid fuel deposits within the cylinder in the early stage of engine start-
up with the CMCV closed, more precise cycle-by-cycle fuel metering, which is re-
quired for the low emissions engine start-up, can be achieved for the first hundred
cycles by the use of the CMCV.
86

References
References
1. Heywood, J.B., Internal Combustion Engine Fundamentals, McGraw-Hill, New York,
1988.
2. Cheng, W.K., Hamrin D., Heywood, J.B., Hochgreb, S., Min, K., and Norris, M., "An
overview of hydrocarbon emissions mechanisms in spark-ignition engines", SAE Paper
932708, 1993.
3. Takeda, K., Yaegashi, T., Sekiguchi, K., Saito, K., and Imatake, N., "Mixture prepara-
tion and HC emissions of a 4-valve engine during cold starting and warm-up", SAE Pa-
per 950074, 1995.
4. Cheng, W.K. and Santoso, H., "Mixture preparation and hydrocarbon emissions behav-
iors in the first cycle of SI engine cranking", SAE Paper 2002-01-2805, 2002.
5. Meyer, R. and Heywood, J.B., "Evaporation of in-cylinder liquid fuel droplets in an SI
engine: A diagnostic-based modeling study", SAE Paper 1999-01-0567, 1999.
6. Henein, N.A., Tagomori, M.K., Yassine, M.K., Asmus, T.W., Thomas, C.P., and Hart-
man, P.G., "Cycle-by-cycle analysis of HC emissions during cold start of gasoline en-
gines", SAE Paper 952402, 1995.
7. Castaing, B.M., Coward, J.S., and Cheng, W.K., "Fuel metering effects on hydrocarbon
emissions and engine stability during cranking and start-up in a port fuel injected spark
ignition engine", SAE Paper 2000-01-2836, 2000.
8. Takahashi, H., Ishizuka, Y., Tomita, M., and Nishizawa, K., "Engine-out and tail-pipe
emission reduction technologies of V-6 LEVs", SAE Paper 980674, 1998.
9. Nishizawa, K., Momoshima, S., Koga, M., and Tsuchida, H., "Development of new
technologies targeting zero emissions for gasoline engines", SAE Paper 2000-01-0890,
2000.
10. Jung, H.H., Stein, R.A., and Leone, T.G., "Comparison of dual retard VCT to continu-
ously variable event valvetrain", SAE Paper 2004-01-1268, 2004.
11. Development Instrumentation Group, Delco Modular Development System Manual,
Delco Electronics Corporation, 1997.
87

12. Cambustion HFR400, April 2005
<http://www.cambustion.co.uk/instruments/hfr400>.
13. Cambustion NDIR500, April 2005
<http://www.cambustion.co.uk/instruments/ndir500/ndirprinciples.html>.
14. UTG-91 Fuel Properties, Chevron Phillips Chemical Company LLC, October 2004
<http://www.cpchem.com/enu/tdsunsecured/UTG-9 1.pdf>.
15. Klein, D. and Cheng, W.K., "Spark ignition engine hydrocarbon emissions behaviors in
stopping and restarting", SAE Paper, 2002-01-2804, 2002.
16. Fox, J.W., Cheng, W.K., and Heywood, J.B., "A model for predicting residual gas frac-
tion in spark-ignition engines", SAE Paper 931025, 1993.
17. Cheung, H.M. and Heywood, J.B., "Evaluation of a one-zone bum-rate analysis proce-
dure using production SI engine pressure data", SAE Paper 932749, 1993.
88

Appendix A
A. 1 Energy Release Equation
QCHa80
y-1
7
avp-+
80
where:
QCH fuel chemical energy
0 crank angle
y ratio of specific heat
p
V
cylinder pressure
cylinder volume
QCR energy in crevices
Q HT heat transfer
A.2 Residual Gas Fraction Calculation
Fox Model (modified for a 4-valve engine)
x, =1.266.OF( P 087
N P
145 2 LV-D,~OF= . (107+7.8.AO+A02). vnax
B B2
89
1 V2P +QCR +QHTy-1 ao ao ao
(j/ P)-07| P I +0.6 2 -#-

A.3 Swirl and Tumble Index
Swirl Index (SI) :
This is an estimate of the swirl number if the cylinder was filled at this valve lift and there
were no effects of compressibility.
= 2zSp"I g 2
i&d 8
Note: The term (nt2/8) is to correct for "mass weighting" of the mean piston speed when as-
signing an engine speed to match the flow rate of the steady flow bench.
SI swirl index
Ts swirl torque on honeycomb element (N-mm)
S engine stroke (mm)
Pcy = in-cylinder density at test conditions (kg/m 3)
Calculate pcyl from the ideal gas relation:
p = 1000 PD (kg288.17 TD
Note: This equation assumes the gas pressure and temperature at the valve-exit-plane are
the same as those within the cylinder.
PD and TD are pressure and temperature in the cylinder at each test point.
Tumble Index (TI) :
This is an estimate of the tumble number if the cylinder was filled at this valve lift and there
were no effects of compressibility.
90

2rcorSpy .C 2TI = -
12 8
Note: The term (n 2/8) is to correct for "mass weighting" of the mean piston speed when as-
signing an engine speed to match the flow rate of the steady flow bench.
TI = tumble index
S = engine stroke (mm)
Tcor corrected torque (N-mm)
PcyI in-cylinder density at test conditions (kg/M 3)
Calculate Tcor:
2cor = r meas 2 CAL
3 9B
Second term in correction equation is to convert from the moment of inertia for a cylinder
about its axis into the moment of inertia for a cylinder rotated about a central diameter.
S = engine stroke (mm)
B = engine bore (mm)
Tmeas = measured torque (N-mm)
Tcor = corrected torque (N-mm)
CAL = calibration factor to account for fraction of tumble angular momentum intercepted
and measured by sensing element. Current best estimate of calibration to use for WEC fix-
ture is 1.0.
91