Embed Size (px)
Citation preview

EFFECTS OF CHANGES IN MOISTURE CONTENT IN REINFORCED GLULAM BEAMS Philipp Dietsch1, Heinrich Kreuzinger2, Stefan Winter3 ABSTRACT: Reinforcement in glulam beams in form of screws or rods can restrict the free shrinkage or swelling of the wood material. The objective of the project presented was to evaluate the influence of such reinforcement on the magnitude of moisture induced stresses. For this purpose, experimental studies were carried out in combination with analytical considerations on the basis of the finite-element method. Taking into account the influence of relaxation processes, the results indicate that a reduction of timber moisture content of 3 - 4 % around threaded rods, positioned perpendicular to the grain, can lead to critical stresses with respect to moisture induced cracks. In addition, a substantial mutual influence of adjacent reinforcing elements has been identified. A reduction of the distance between the reinforcement thus results in a lower tolerable reduction of timber moisture content around the reinforcement. KEYWORDS: glued laminated timber, reinforcement, threaded rod, screw, moisture, shrinkage, swelling, moisture induced stresses 1 INTRODUCTION 123
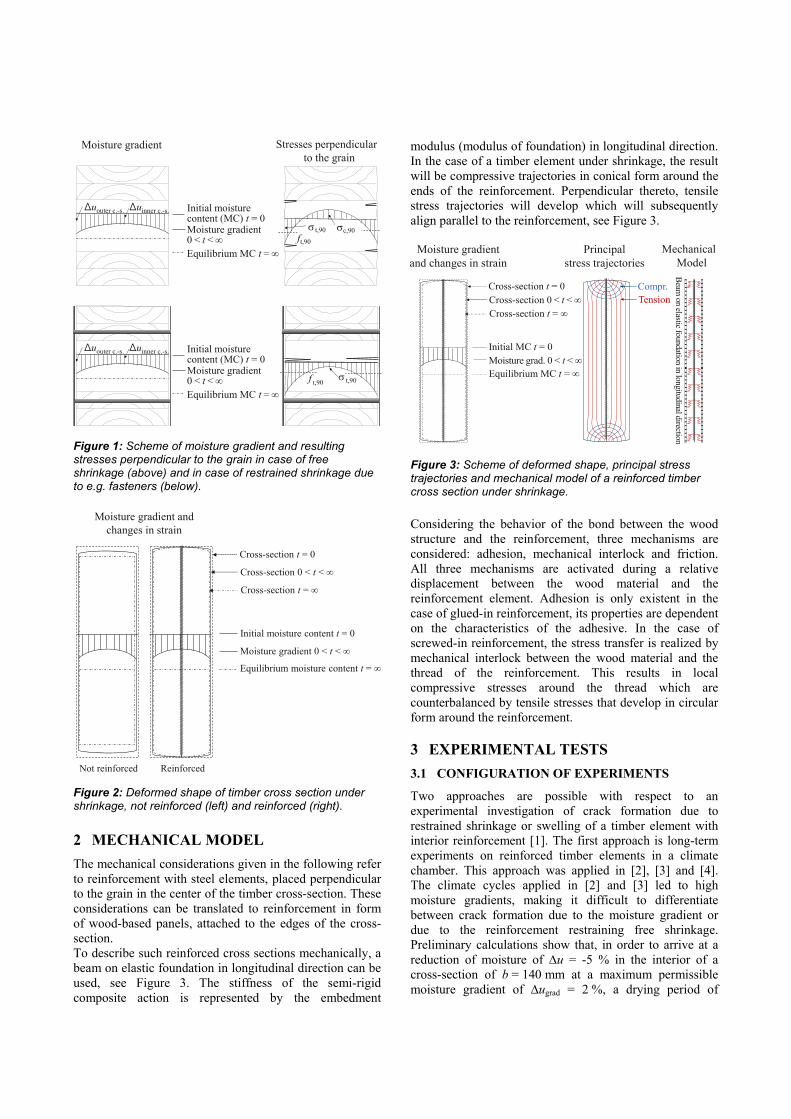
Changes in wood moisture content lead to changes of virtually all physical and mechanical properties (e.g. strength and stiffness properties) of wood. An additional effect of changes of the wood moisture content is the shrinkage or swelling of the material and the associated internal stresses. Visualizing the cross-section of a structural timber element reveals, that the area near the surface of the element adapts quite quickly to changes in the surrounding climate (temperature, relative humidity). Areas inside the cross-section require a longer time to reach the equilibrium moisture content due to the greater necessary length of moisture transport by diffusion. The distribution of timber moisture content in the cross-section is therefore not only dependent on the relative humidity, but also on time. This results in a moisture gradient across the cross-section. Changes in moisture content result in strains of different magnitude across the timber cross-section due to the associated shrinkage or swelling of the timber. During the drying process of a timber element, the wood material near the surface is restrained by the inner cross-section, 1Philipp Dietsch, Dr.-Ing., Email: [email protected] 2 Heinrich Kreuzinger, Univ.-Prof. i.R. Dr.-Ing., Email: [email protected] 3 Stefan Winter, Univ.-Prof. Dr.-Ing, Email: [email protected] Technische Universität München, Chair for Timber Structures and Building Construction, Arcisstraße 21, D-80333 München.
comparable to an elastic foundation. This results in tensile stresses perpendicular to the grain near the surface, which are counterbalanced by compressive stresses inside the cross-section due to the necessary equilibrium of stresses, see Figure 1. These stresses are reduced over time due to relaxation processes. However, if they locally exceed the very low tensile strength perpendicular to grain, the result will be a stress relief in form of cracks. These can reduce the load-carrying capacity of structural timber elements in e.g. shear or tension perpendicular to grain. If the free deformation of the cross section is prevented by restraining forces, e.g. fasteners in dowel-type connections, the magnitude of moisture induced stresses depends on the difference between the strains of the timber cross-section and the restraining elements. Equilibrium of tensile and compressive moisture induced stresses is impeded by the restraining forces. This results in stresses of higher magnitude and eventually in deep shrinkage cracks, see Figure 1. An example are fork supports with dowel-type fasteners arranged at considerable vertical distances. In the case of screws or threaded rods positioned perpendicular or at an angle to the grain, the free deformation of the surrounding wood material is restrained due to the semi-rigid composite action between the wood material and the thread of the reinforcement, see Figure 2. The reason is that steel features an expansion coefficient with respect to temperature but, in contrast to wood, not with respect to changes of moisture.
ft,90
c,90t,90
Δuinner c.-s.Δuouter c.-s.
Moisture gradient Stresses perpendicular_to the grain
Initial moisturecontent (MC) t = 0Moisture gradient0 < t < ∞Equilibrium MC t = ∞
f t,90 t,90
Initial moisturecontent (MC) t = 0Moisture gradient0 < t < ∞Equilibrium MC t = ∞
Δuinner c.-s.Δuouter c.-s.
Figure 1: Scheme of moisture gradient and resulting stresses perpendicular to the grain in case of free shrinkage (above) and in case of restrained shrinkage due to e.g. fasteners (below).
Initial moisture content t = 0
Moisture gradient 0 < t < ∞
Equilibrium moisture content t = ∞
Moisture gradient andchanges in strain
Cross-section t = 0
Cross-section 0 < t < ∞
Cross-section t = ∞
Not reinforced Reinforced
Figure 2: Deformed shape of timber cross section under shrinkage, not reinforced (left) and reinforced (right).
2 MECHANICAL MODEL
The mechanical considerations given in the following refer to reinforcement with steel elements, placed perpendicular to the grain in the center of the timber cross-section. These considerations can be translated to reinforcement in form of wood-based panels, attached to the edges of the cross-section. To describe such reinforced cross sections mechanically, a beam on elastic foundation in longitudinal direction can be used, see Figure 3. The stiffness of the semi-rigid composite action is represented by the embedment
modulus (modulus of foundation) in longitudinal direction. In the case of a timber element under shrinkage, the result will be compressive trajectories in conical form around the ends of the reinforcement. Perpendicular thereto, tensile stress trajectories will develop which will subsequently align parallel to the reinforcement, see Figure 3.
Compr.Tension
Principalstress trajectories
Mechanical_Model
Beam
on elastic foundation in longitudinal direction
Initial MC t = 0Moisture grad. 0 < t < ∞Equilibrium MC t = ∞
Moisture gradientand changes in strain
Cross-section t = 0Cross-section 0 < t < ∞Cross-section t = ∞
Figure 3: Scheme of deformed shape, principal stress trajectories and mechanical model of a reinforced timber cross section under shrinkage.
Considering the behavior of the bond between the wood structure and the reinforcement, three mechanisms are considered: adhesion, mechanical interlock and friction. All three mechanisms are activated during a relative displacement between the wood material and the reinforcement element. Adhesion is only existent in the case of glued-in reinforcement, its properties are dependent on the characteristics of the adhesive. In the case of screwed-in reinforcement, the stress transfer is realized by mechanical interlock between the wood material and the thread of the reinforcement. This results in local compressive stresses around the thread which are counterbalanced by tensile stresses that develop in circular form around the reinforcement.
3 EXPERIMENTAL TESTS
3.1 CONFIGURATION OF EXPERIMENTS
Two approaches are possible with respect to an experimental investigation of crack formation due to restrained shrinkage or swelling of a timber element with interior reinforcement [1]. The first approach is long-term experiments on reinforced timber elements in a climate chamber. This approach was applied in [2], [3] and [4]. The climate cycles applied in [2] and [3] led to high moisture gradients, making it difficult to differentiate between crack formation due to the moisture gradient or due to the reinforcement restraining free shrinkage. Preliminary calculations show that, in order to arrive at a reduction of moisture of ∆u = -5 % in the interior of a cross-section of b = 140 mm at a maximum permissible moisture gradient of ∆ugrad = 2 %, a drying period of
almost one year is necessary. Since neither climate chambers nor measuring equipment were available for this period, it was decided to pursue the second possible approach. This approach is based on the idea that, in the case of a relatively stiff composite between the reinforcement and the wood material, the type and location of the induced strains have a rather small effect on the stress distribution in the glued-laminated (glulam) timber element. Using the mechanical model given above, and assuming either exterior load (e.g. tensile force on the reinforcement) or internal stresses (e.g. restrained shrinkage), the main transfer of stresses between the steel reinforcement and the wood material will occur in the vicinity of both ends (x = 0, x = ℓ) of the reinforcement, see Figure 4. This means that, although the nature of the strain (shrinkage strain or strain due to externally applied tensile load) is different from one another, the stress distribution in the glued-laminated (glulam) timber element, resulting from the interaction between the wood and the reinforcement, is comparable.
ut=0
u0<t<∞
ut=∞
Deformation fromchange in moisture
At=0
A0<t<∞
At=∞
Deformation appliedto reinforcement
∆ε0<t<∞
At=0
A0<t<∞
At=∞
Principal stress trajectories
Figure 4: Scheme of deformation in dependence on type of loading (exterior load or moisture change) and resulting principal stress trajectories.
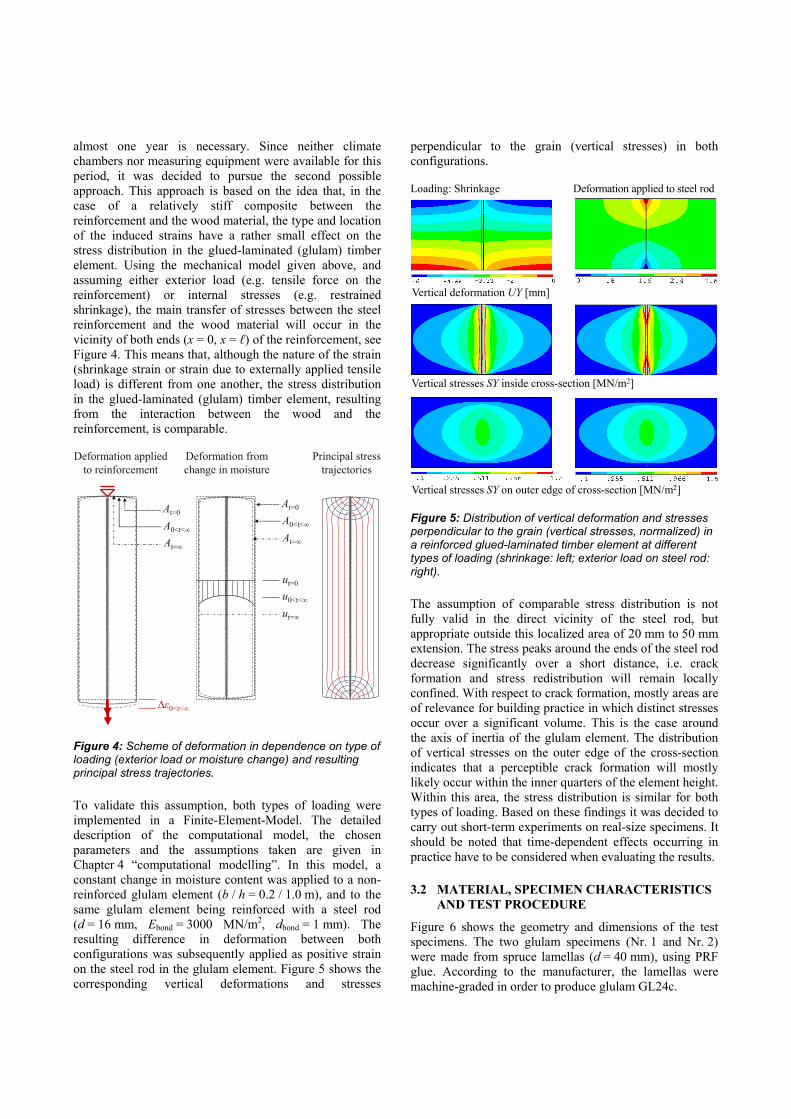
To validate this assumption, both types of loading were implemented in a Finite-Element-Model. The detailed description of the computational model, the chosen parameters and the assumptions taken are given in Chapter 4 “computational modelling”. In this model, a constant change in moisture content was applied to a non-reinforced glulam element (b / h = 0.2 / 1.0 m), and to the same glulam element being reinforced with a steel rod (d = 16 mm, Ebond = 3000 MN/m2, dbond = 1 mm). The resulting difference in deformation between both configurations was subsequently applied as positive strain on the steel rod in the glulam element. Figure 5 shows the corresponding vertical deformations and stresses
perpendicular to the grain (vertical stresses) in both configurations. Loading: Shrinkage Deformation applied to steel rod
Vertical deformation UY [mm]
Vertical stresses SY inside cross-section [MN/m2]
Vertical stresses SY on outer edge of cross-section [MN/m2]
Figure 5: Distribution of vertical deformation and stresses perpendicular to the grain (vertical stresses, normalized) in a reinforced glued-laminated timber element at different types of loading (shrinkage: left; exterior load on steel rod: right).
The assumption of comparable stress distribution is not fully valid in the direct vicinity of the steel rod, but appropriate outside this localized area of 20 mm to 50 mm extension. The stress peaks around the ends of the steel rod decrease significantly over a short distance, i.e. crack formation and stress redistribution will remain locally confined. With respect to crack formation, mostly areas are of relevance for building practice in which distinct stresses occur over a significant volume. This is the case around the axis of inertia of the glulam element. The distribution of vertical stresses on the outer edge of the cross-section indicates that a perceptible crack formation will mostly likely occur within the inner quarters of the element height. Within this area, the stress distribution is similar for both types of loading. Based on these findings it was decided to carry out short-term experiments on real-size specimens. It should be noted that time-dependent effects occurring in practice have to be considered when evaluating the results. 3.2 MATERIAL, SPECIMEN CHARACTERISTICS
AND TEST PROCEDURE
Figure 6 shows the geometry and dimensions of the test specimens. The two glulam specimens (Nr. 1 and Nr. 2) were made from spruce lamellas (d = 40 mm), using PRF glue. According to the manufacturer, the lamellas were machine-graded in order to produce glulam GL24c.
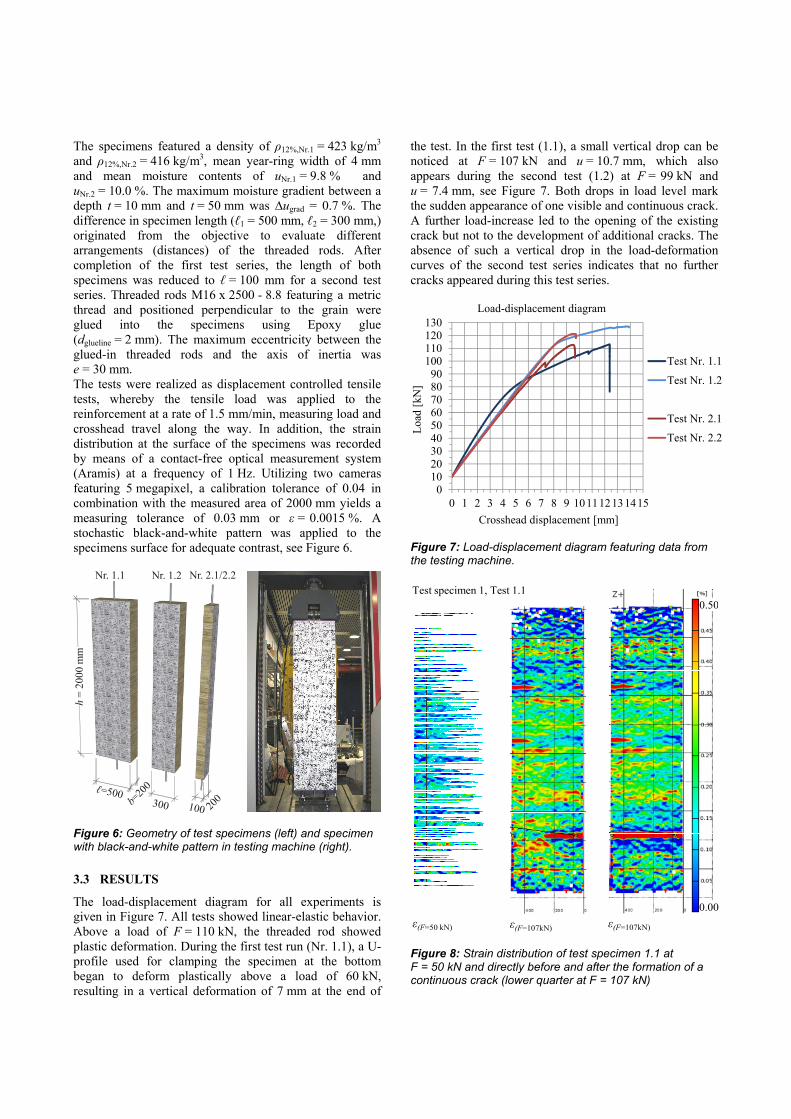
The specimens featured a density of ρ12%,Nr.1 = 423 kg/m3
and ρ12%,Nr.2 = 416 kg/m3, mean year-ring width of 4 mm and mean moisture contents of uNr.1 = 9.8 % and uNr.2 = 10.0 %. The maximum moisture gradient between a depth t = 10 mm and t = 50 mm was ∆ugrad = 0.7 %. The difference in specimen length (ℓ1 = 500 mm, ℓ2 = 300 mm,) originated from the objective to evaluate different arrangements (distances) of the threaded rods. After completion of the first test series, the length of both specimens was reduced to ℓ = 100 mm for a second test series. Threaded rods M16 x 2500 - 8.8 featuring a metric thread and positioned perpendicular to the grain were glued into the specimens using Epoxy glue (dglueline = 2 mm). The maximum eccentricity between the glued-in threaded rods and the axis of inertia was e = 30 mm. The tests were realized as displacement controlled tensile tests, whereby the tensile load was applied to the reinforcement at a rate of 1.5 mm/min, measuring load and crosshead travel along the way. In addition, the strain distribution at the surface of the specimens was recorded by means of a contact-free optical measurement system (Aramis) at a frequency of 1 Hz. Utilizing two cameras featuring 5 megapixel, a calibration tolerance of 0.04 in combination with the measured area of 2000 mm yields a measuring tolerance of 0.03 mm or ε = 0.0015 %. A stochastic black-and-white pattern was applied to the specimens surface for adequate contrast, see Figure 6.
Nr. 1.1 Nr. 1.2 Nr. 2.1/2.2
h =
200
0 m
m
Figure 6: Geometry of test specimens (left) and specimen with black-and-white pattern in testing machine (right).
3.3 RESULTS
The load-displacement diagram for all experiments is given in Figure 7. All tests showed linear-elastic behavior. Above a load of F = 110 kN, the threaded rod showed plastic deformation. During the first test run (Nr. 1.1), a U-profile used for clamping the specimen at the bottom began to deform plastically above a load of 60 kN, resulting in a vertical deformation of 7 mm at the end of
the test. In the first test (1.1), a small vertical drop can be noticed at F = 107 kN and u = 10.7 mm, which also appears during the second test (1.2) at F = 99 kN and u = 7.4 mm, see Figure 7. Both drops in load level mark the sudden appearance of one visible and continuous crack. A further load-increase led to the opening of the existing crack but not to the development of additional cracks. The absence of such a vertical drop in the load-deformation curves of the second test series indicates that no further cracks appeared during this test series.
0102030405060708090
100110120130
0 1 2 3 4 5 6 7 8 9 101112131415
Loa
d [k
N]
Crosshead displacement [mm]
Load-displacement diagram
Test Nr. 1.1
Test Nr. 1.2
Datenreihen
Test Nr. 2.1
Test Nr. 2.2
Figure 7: Load-displacement diagram featuring data from the testing machine.
Test specimen 1, Test 1.1
ε(F=50 kN) ε(F=107kN) ε(F=107kN)
0.50
0.00
Figure 8: Strain distribution of test specimen 1.1 at F = 50 kN and directly before and after the formation of a continuous crack (lower quarter at F = 107 kN)
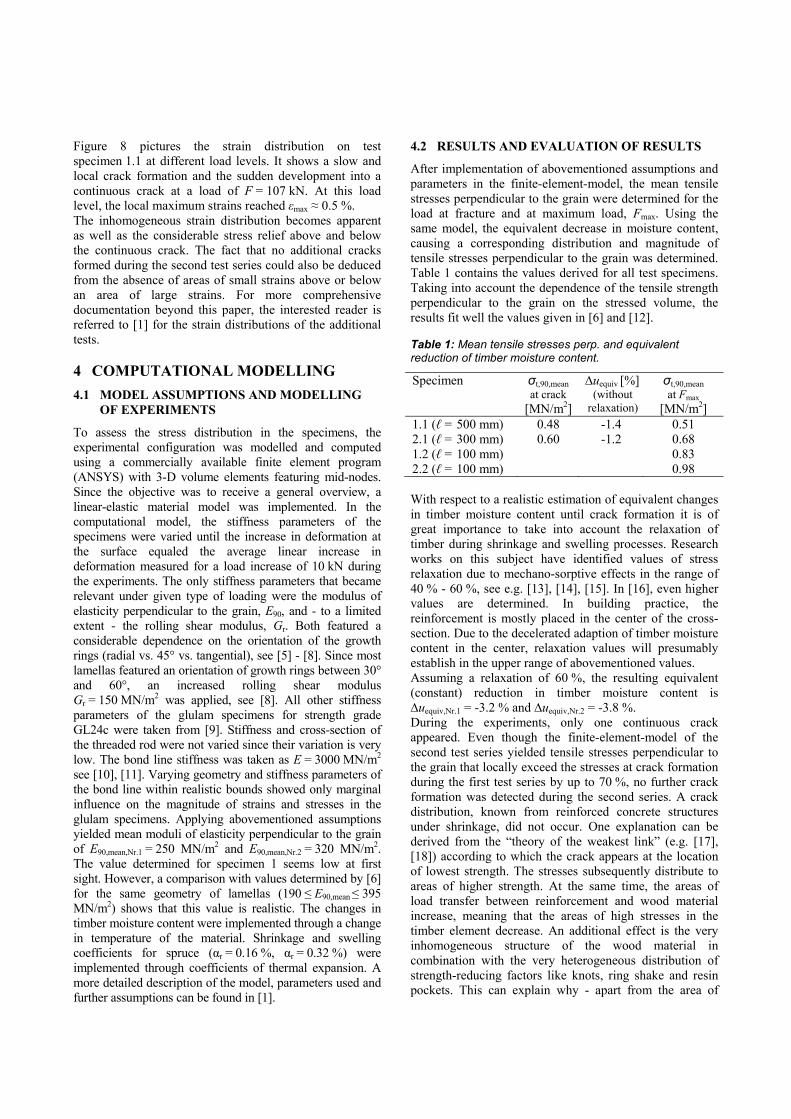
Figure 8 pictures the strain distribution on test specimen 1.1 at different load levels. It shows a slow and local crack formation and the sudden development into a continuous crack at a load of F = 107 kN. At this load level, the local maximum strains reached εmax ≈ 0.5 %. The inhomogeneous strain distribution becomes apparent as well as the considerable stress relief above and below the continuous crack. The fact that no additional cracks formed during the second test series could also be deduced from the absence of areas of small strains above or below an area of large strains. For more comprehensive documentation beyond this paper, the interested reader is referred to [1] for the strain distributions of the additional tests. 4 COMPUTATIONAL MODELLING
4.1 MODEL ASSUMPTIONS AND MODELLING OF EXPERIMENTS
To assess the stress distribution in the specimens, the experimental configuration was modelled and computed using a commercially available finite element program (ANSYS) with 3-D volume elements featuring mid-nodes. Since the objective was to receive a general overview, a linear-elastic material model was implemented. In the computational model, the stiffness parameters of the specimens were varied until the increase in deformation at the surface equaled the average linear increase in deformation measured for a load increase of 10 kN during the experiments. The only stiffness parameters that became relevant under given type of loading were the modulus of elasticity perpendicular to the grain, E90, and - to a limited extent - the rolling shear modulus, Gr. Both featured a considerable dependence on the orientation of the growth rings (radial vs. 45° vs. tangential), see [5] - [8]. Since most lamellas featured an orientation of growth rings between 30° and 60°, an increased rolling shear modulus Gr = 150 MN/m2 was applied, see [8]. All other stiffness parameters of the glulam specimens for strength grade GL24c were taken from [9]. Stiffness and cross-section of the threaded rod were not varied since their variation is very low. The bond line stiffness was taken as E = 3000 MN/m2 see [10], [11]. Varying geometry and stiffness parameters of the bond line within realistic bounds showed only marginal influence on the magnitude of strains and stresses in the glulam specimens. Applying abovementioned assumptions yielded mean moduli of elasticity perpendicular to the grain of E90,mean,Nr.1 = 250 MN/m2 and E90,mean,Nr.2 = 320 MN/m2. The value determined for specimen 1 seems low at first sight. However, a comparison with values determined by [6] for the same geometry of lamellas (190 ≤ E90,mean ≤ 395 MN/m2) shows that this value is realistic. The changes in timber moisture content were implemented through a change in temperature of the material. Shrinkage and swelling coefficients for spruce (αr = 0.16 %, αr = 0.32 %) were implemented through coefficients of thermal expansion. A more detailed description of the model, parameters used and further assumptions can be found in [1].
4.2 RESULTS AND EVALUATION OF RESULTS
After implementation of abovementioned assumptions and parameters in the finite-element-model, the mean tensile stresses perpendicular to the grain were determined for the load at fracture and at maximum load, Fmax. Using the same model, the equivalent decrease in moisture content, causing a corresponding distribution and magnitude of tensile stresses perpendicular to the grain was determined. Table 1 contains the values derived for all test specimens. Taking into account the dependence of the tensile strength perpendicular to the grain on the stressed volume, the results fit well the values given in [6] and [12].
Table 1: Mean tensile stresses perp. and equivalent reduction of timber moisture content.
Specimen σt,90,mean at crack
[MN/m2]
∆uequiv [%] (without
relaxation)
σt,90,mean at Fmax
[MN/m2] 1.1 (ℓ = 500 mm) 0.48 -1.4 0.51 2.1 (ℓ = 300 mm) 0.60 -1.2 0.68 1.2 (ℓ = 100 mm) 0.83 2.2 (ℓ = 100 mm) 0.98 With respect to a realistic estimation of equivalent changes in timber moisture content until crack formation it is of great importance to take into account the relaxation of timber during shrinkage and swelling processes. Research works on this subject have identified values of stress relaxation due to mechano-sorptive effects in the range of 40 % - 60 %, see e.g. [13], [14], [15]. In [16], even higher values are determined. In building practice, the reinforcement is mostly placed in the center of the cross-section. Due to the decelerated adaption of timber moisture content in the center, relaxation values will presumably establish in the upper range of abovementioned values. Assuming a relaxation of 60 %, the resulting equivalent (constant) reduction in timber moisture content is ∆uequiv,Nr.1 = -3.2 % and ∆uequiv,Nr.2 = -3.8 %. During the experiments, only one continuous crack appeared. Even though the finite-element-model of the second test series yielded tensile stresses perpendicular to the grain that locally exceed the stresses at crack formation during the first test series by up to 70 %, no further crack formation was detected during the second series. A crack distribution, known from reinforced concrete structures under shrinkage, did not occur. One explanation can be derived from the “theory of the weakest link” (e.g. [17], [18]) according to which the crack appears at the location of lowest strength. The stresses subsequently distribute to areas of higher strength. At the same time, the areas of load transfer between reinforcement and wood material increase, meaning that the areas of high stresses in the timber element decrease. An additional effect is the very inhomogeneous structure of the wood material in combination with the very heterogeneous distribution of strength-reducing factors like knots, ring shake and resin pockets. This can explain why - apart from the area of
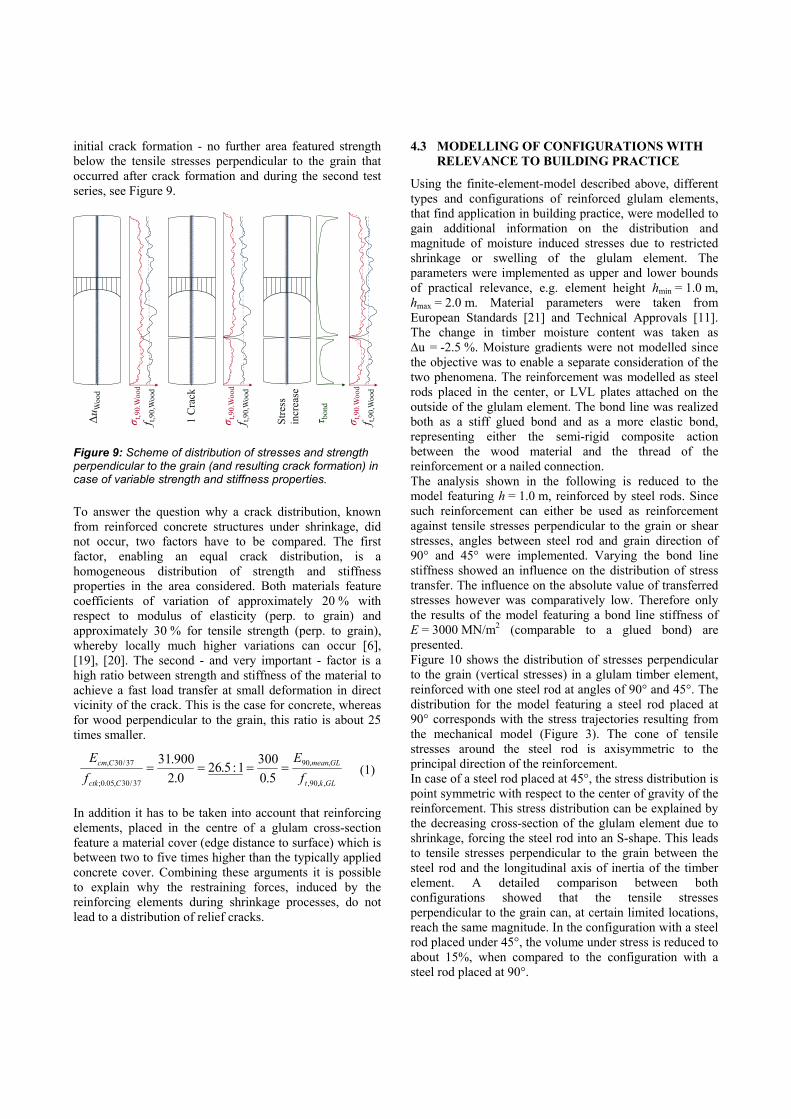
initial crack formation - no further area featured strength below the tensile stresses perpendicular to the grain that occurred after crack formation and during the second test series, see Figure 9.
Str
ess
incr
ease
∆u W
ood
σ t,9
0.W
ood
f t,90
,Woo
d
1 C
rack
σ t,9
0.W
ood
f t,90
,Woo
d
τ bon
d
σ t,9
0.W
ood
f t,90
,Woo
d
Figure 9: Scheme of distribution of stresses and strength perpendicular to the grain (and resulting crack formation) in case of variable strength and stiffness properties.
To answer the question why a crack distribution, known from reinforced concrete structures under shrinkage, did not occur, two factors have to be compared. The first factor, enabling an equal crack distribution, is a homogeneous distribution of strength and stiffness properties in the area considered. Both materials feature coefficients of variation of approximately 20 % with respect to modulus of elasticity (perp. to grain) and approximately 30 % for tensile strength (perp. to grain), whereby locally much higher variations can occur [6], [19], [20]. The second - and very important - factor is a high ratio between strength and stiffness of the material to achieve a fast load transfer at small deformation in direct vicinity of the crack. This is the case for concrete, whereas for wood perpendicular to the grain, this ratio is about 25 times smaller.
GLkt
GLmean
Cctk
Ccm
f
E
f
E
,,90,
,,90
37/30,05.0;
37/30,
5.0
3001:5.26
0.2
900.31 (1)
In addition it has to be taken into account that reinforcing elements, placed in the centre of a glulam cross-section feature a material cover (edge distance to surface) which is between two to five times higher than the typically applied concrete cover. Combining these arguments it is possible to explain why the restraining forces, induced by the reinforcing elements during shrinkage processes, do not lead to a distribution of relief cracks.
4.3 MODELLING OF CONFIGURATIONS WITH RELEVANCE TO BUILDING PRACTICE
Using the finite-element-model described above, different types and configurations of reinforced glulam elements, that find application in building practice, were modelled to gain additional information on the distribution and magnitude of moisture induced stresses due to restricted shrinkage or swelling of the glulam element. The parameters were implemented as upper and lower bounds of practical relevance, e.g. element height hmin = 1.0 m, hmax = 2.0 m. Material parameters were taken from European Standards [21] and Technical Approvals [11]. The change in timber moisture content was taken as ∆u = -2.5 %. Moisture gradients were not modelled since the objective was to enable a separate consideration of the two phenomena. The reinforcement was modelled as steel rods placed in the center, or LVL plates attached on the outside of the glulam element. The bond line was realized both as a stiff glued bond and as a more elastic bond, representing either the semi-rigid composite action between the wood material and the thread of the reinforcement or a nailed connection. The analysis shown in the following is reduced to the model featuring h = 1.0 m, reinforced by steel rods. Since such reinforcement can either be used as reinforcement against tensile stresses perpendicular to the grain or shear stresses, angles between steel rod and grain direction of 90° and 45° were implemented. Varying the bond line stiffness showed an influence on the distribution of stress transfer. The influence on the absolute value of transferred stresses however was comparatively low. Therefore only the results of the model featuring a bond line stiffness of E = 3000 MN/m2 (comparable to a glued bond) are presented. Figure 10 shows the distribution of stresses perpendicular to the grain (vertical stresses) in a glulam timber element, reinforced with one steel rod at angles of 90° and 45°. The distribution for the model featuring a steel rod placed at 90° corresponds with the stress trajectories resulting from the mechanical model (Figure 3). The cone of tensile stresses around the steel rod is axisymmetric to the principal direction of the reinforcement. In case of a steel rod placed at 45°, the stress distribution is point symmetric with respect to the center of gravity of the reinforcement. This stress distribution can be explained by the decreasing cross-section of the glulam element due to shrinkage, forcing the steel rod into an S-shape. This leads to tensile stresses perpendicular to the grain between the steel rod and the longitudinal axis of inertia of the timber element. A detailed comparison between both configurations showed that the tensile stresses perpendicular to the grain can, at certain limited locations, reach the same magnitude. In the configuration with a steel rod placed under 45°, the volume under stress is reduced to about 15%, when compared to the configuration with a steel rod placed at 90°.
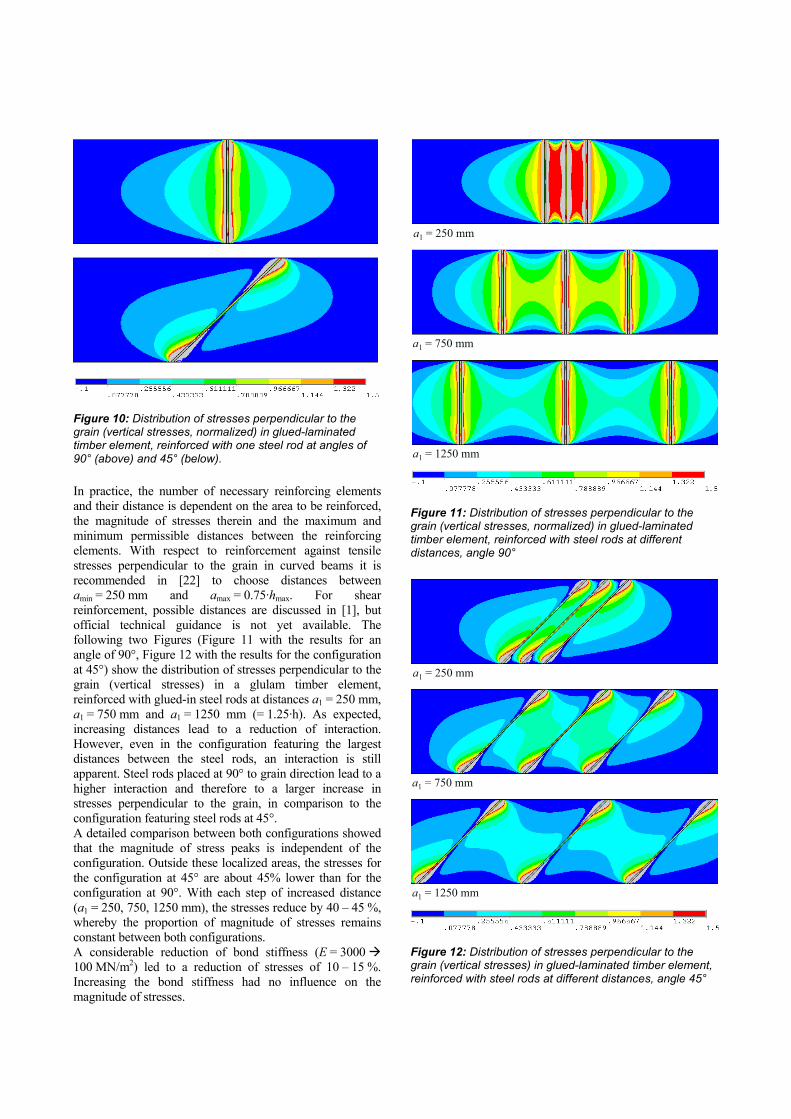
Figure 10: Distribution of stresses perpendicular to the grain (vertical stresses, normalized) in glued-laminated timber element, reinforced with one steel rod at angles of 90° (above) and 45° (below).
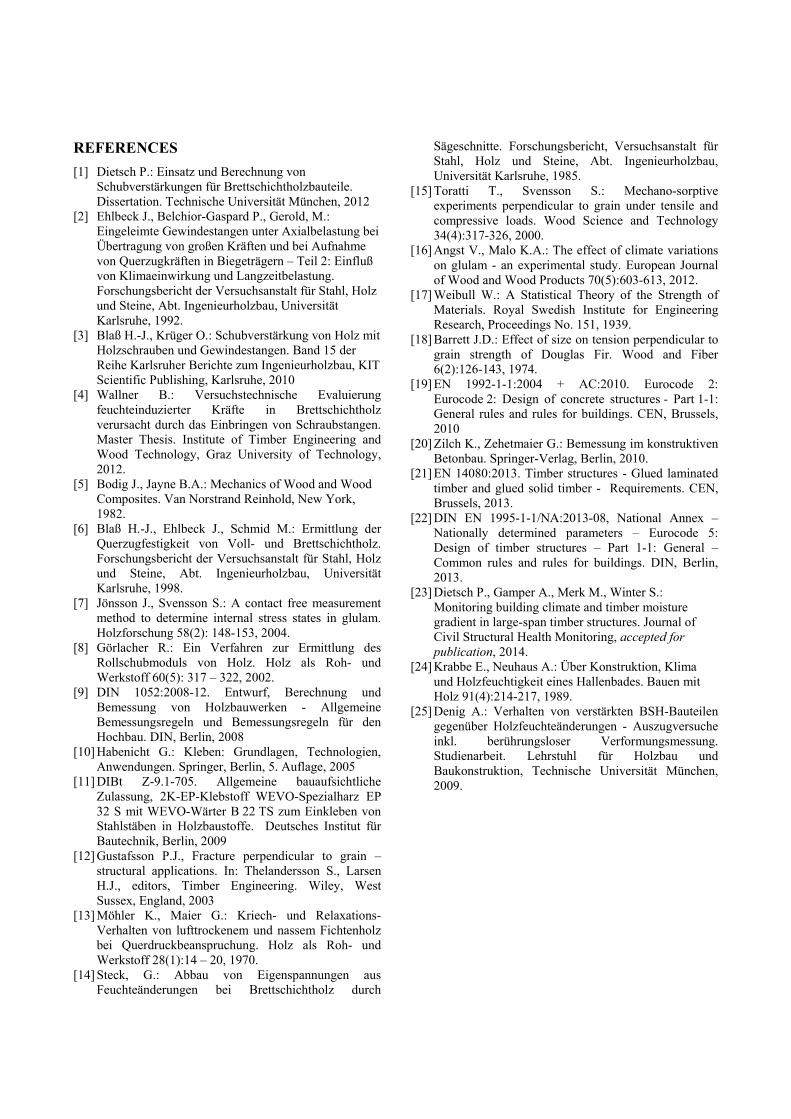
In practice, the number of necessary reinforcing elements and their distance is dependent on the area to be reinforced, the magnitude of stresses therein and the maximum and minimum permissible distances between the reinforcing elements. With respect to reinforcement against tensile stresses perpendicular to the grain in curved beams it is recommended in [22] to choose distances between amin = 250 mm and amax = 0.75·hmax. For shear reinforcement, possible distances are discussed in [1], but official technical guidance is not yet available. The following two Figures (Figure 11 with the results for an angle of 90°, Figure 12 with the results for the configuration at 45°) show the distribution of stresses perpendicular to the grain (vertical stresses) in a glulam timber element, reinforced with glued-in steel rods at distances a1 = 250 mm, a1 = 750 mm and a1 = 1250 mm (= 1.25·h). As expected, increasing distances lead to a reduction of interaction. However, even in the configuration featuring the largest distances between the steel rods, an interaction is still apparent. Steel rods placed at 90° to grain direction lead to a higher interaction and therefore to a larger increase in stresses perpendicular to the grain, in comparison to the configuration featuring steel rods at 45°. A detailed comparison between both configurations showed that the magnitude of stress peaks is independent of the configuration. Outside these localized areas, the stresses for the configuration at 45° are about 45% lower than for the configuration at 90°. With each step of increased distance (a1 = 250, 750, 1250 mm), the stresses reduce by 40 – 45 %, whereby the proportion of magnitude of stresses remains constant between both configurations. A considerable reduction of bond stiffness (E = 3000 100 MN/m2) led to a reduction of stresses of 10 – 15 %. Increasing the bond stiffness had no influence on the magnitude of stresses.
a1 = 250 mm
a1 = 750 mm
a1 = 1250 mm
Figure 11: Distribution of stresses perpendicular to the grain (vertical stresses, normalized) in glued-laminated timber element, reinforced with steel rods at different distances, angle 90°
a1 = 250 mm
a1 = 750 mm
a1 = 1250 mm
Figure 12: Distribution of stresses perpendicular to the grain (vertical stresses) in glued-laminated timber element, reinforced with steel rods at different distances, angle 45°

5 COMPARISON TO TIMBER MOISTURE CONTENTS AND MOISTURE GRADIENTS IN BUILDING PRACTICE
Reinforcement against tension perpendicular to the grain stresses in form of fully threaded screws or threaded rods is common practice in large-span timber structures, e.g. to counter tensile stresses perpendicular to the grain from deviation forces in curved beams. The moisture content of such elements in use is dependent on the surrounding climate which is again influenced by the use of the building. Here it is possible to roughly group into:
a) buildings featuring a rather constant, mostly dry climate, e.g. sports (gymnasiums), production and sales facilities and
b) buildings featuring periodic changes of surrounding climate, e.g. riding rinks, agriculture, warehouses.
Within a research project [23], surrounding climate and timber moisture content were monitored in 21 buildings from 7 different types of use. One finding was that the envelope curves resulting from periodic changes of surrounding climate are less critical when regarding the interior parts of the timber cross-section (edge distance of 70 mm or more), see Figure 13.
mir
ror
axis
Max
Mean
Min
6
8
10
12
14
16
18
20
0 20 40 60 80
tim
ber
moi
stur
e co
nten
t [%
]
beam width [mm]
Envelope curve of timber moisture content
Figure 13: Envelope curve of the timber moisture content at different depths of the cross section, building with periodically changing climate, from [1]
Timber elements in buildings featuring a constant but dry climate are more critical in that aspect, due to a constant but considerable drying out of the timber elements after the opening of a building. In the research project [23], mean timber moisture contents as low as u = 5 % were measured. Comparing these to timber moisture contents during erection, which are commonly around u = 12%, the
potential effect on the drying of a timber element in such a magnitude becomes obvious. These findings confirm measurements taken on timber elements above a swimming pool, presented in [24].
6 CONCLUSIONS
The reaction of wood to moisture forms an integral part of any task in connection with this natural and renewable building material. With respect to reinforcement, this poses the question of its influence on the magnitude of moisture induced stresses, since reinforcement restricts the free shrinkage or swelling of the timber beam. For this purpose, experimental studies (short-term tests) were carried out in combination with analytical considerations on the basis of the finite-element method. Taking into account the influence of relaxation processes, the results indicate that a reduction of timber moisture content of 3 - 4 % around threaded rods, positioned perpendicular to the grain, can lead to critical stresses with respect to moisture induced cracks. In case of shear reinforcement with 45° inclination, the magnitude of moisture induced stresses is reduced by half while the stressed volume is reduced even more (to about 15%). For both types of arrangement, a substantial mutual influence of adjacent reinforcing elements could be identified. A reduction of the distance between the reinforcing elements thus results in a lower tolerable reduction of timber moisture content around the reinforcement. Therefore the aim should be to realize larger distances between reinforcing elements. The results also indicate that reinforcing elements like screwed-in or glued-in threaded rods should be placed in the center of the timber cross-section. Periodic, e.g. yearly changes of surrounding climate have a smaller influence on timber moisture content in the interior of a cross-section. Permanent change of timber moisture content will lead to a slower adaption of the same in the interior of a cross-section, enabling relaxation processes to unfold over a longer period. Due to the heterogeneous distribution of stiffness properties across the width of one lamella, tensile stresses perpendicular to the grain from exterior loads will be highest in the center of the cross-section. Finally, a placement in the center of the timber cross-section is more robust with respect to potential deviation of the drill hole during production. If multiple rows of reinforcement are necessary, e.g. in block-glued members, an adequate edge distance should be ensured. Until more experience is gained, an edge distance of at least 70 mm is proposed.
ACKNOWLEDGEMENT
Gratitude is extended to Grossmann Bau GmbH & Co. KG for providing the specimens and to student research assistant Andreas Denig [25] for his support during the experimental tests and analysis of measurements.
REFERENCES
[1] Dietsch P.: Einsatz und Berechnung von Schubverstärkungen für Brettschichtholzbauteile. Dissertation. Technische Universität München, 2012
[2] Ehlbeck J., Belchior-Gaspard P., Gerold, M.: Eingeleimte Gewindestangen unter Axialbelastung bei Übertragung von großen Kräften und bei Aufnahme von Querzugkräften in Biegeträgern – Teil 2: Einfluß von Klimaeinwirkung und Langzeitbelastung. Forschungsbericht der Versuchsanstalt für Stahl, Holz und Steine, Abt. Ingenieurholzbau, Universität Karlsruhe, 1992.
[3] Blaß H.-J., Krüger O.: Schubverstärkung von Holz mit Holzschrauben und Gewindestangen. Band 15 der Reihe Karlsruher Berichte zum Ingenieurholzbau, KIT Scientific Publishing, Karlsruhe, 2010
[4] Wallner B.: Versuchstechnische Evaluierung feuchteinduzierter Kräfte in Brettschichtholz verursacht durch das Einbringen von Schraubstangen. Master Thesis. Institute of Timber Engineering and Wood Technology, Graz University of Technology, 2012.
[5] Bodig J., Jayne B.A.: Mechanics of Wood and Wood Composites. Van Norstrand Reinhold, New York, 1982.
[6] Blaß H.-J., Ehlbeck J., Schmid M.: Ermittlung der Querzugfestigkeit von Voll- und Brettschichtholz. Forschungsbericht der Versuchsanstalt für Stahl, Holz und Steine, Abt. Ingenieurholzbau, Universität Karlsruhe, 1998.
[7] Jönsson J., Svensson S.: A contact free measurement method to determine internal stress states in glulam. Holzforschung 58(2): 148-153, 2004.
[8] Görlacher R.: Ein Verfahren zur Ermittlung des Rollschubmoduls von Holz. Holz als Roh- und Werkstoff 60(5): 317 – 322, 2002.
[9] DIN 1052:2008-12. Entwurf, Berechnung und Bemessung von Holzbauwerken - Allgemeine Bemessungsregeln und Bemessungsregeln für den Hochbau. DIN, Berlin, 2008
[10] Habenicht G.: Kleben: Grundlagen, Technologien, Anwendungen. Springer, Berlin, 5. Auflage, 2005
[11] DIBt Z-9.1-705. Allgemeine bauaufsichtliche Zulassung, 2K-EP-Klebstoff WEVO-Spezialharz EP 32 S mit WEVO-Wärter B 22 TS zum Einkleben von Stahlstäben in Holzbaustoffe. Deutsches Institut für Bautechnik, Berlin, 2009
[12] Gustafsson P.J., Fracture perpendicular to grain – structural applications. In: Thelandersson S., Larsen H.J., editors, Timber Engineering. Wiley, West Sussex, England, 2003
[13] Möhler K., Maier G.: Kriech- und Relaxations-Verhalten von lufttrockenem und nassem Fichtenholz bei Querdruckbeanspruchung. Holz als Roh- und Werkstoff 28(1):14 – 20, 1970.
[14] Steck, G.: Abbau von Eigenspannungen aus Feuchteänderungen bei Brettschichtholz durch
Sägeschnitte. Forschungsbericht, Versuchsanstalt für Stahl, Holz und Steine, Abt. Ingenieurholzbau, Universität Karlsruhe, 1985.
[15] Toratti T., Svensson S.: Mechano-sorptive experiments perpendicular to grain under tensile and compressive loads. Wood Science and Technology 34(4):317-326, 2000.
[16] Angst V., Malo K.A.: The effect of climate variations on glulam - an experimental study. European Journal of Wood and Wood Products 70(5):603-613, 2012.
[17] Weibull W.: A Statistical Theory of the Strength of Materials. Royal Swedish Institute for Engineering Research, Proceedings No. 151, 1939.
[18] Barrett J.D.: Effect of size on tension perpendicular to grain strength of Douglas Fir. Wood and Fiber 6(2):126-143, 1974.
[19] EN 1992-1-1:2004 + AC:2010. Eurocode 2: Eurocode 2: Design of concrete structures - Part 1-1: General rules and rules for buildings. CEN, Brussels, 2010
[20] Zilch K., Zehetmaier G.: Bemessung im konstruktiven Betonbau. Springer-Verlag, Berlin, 2010.
[21] EN 14080:2013. Timber structures - Glued laminated timber and glued solid timber - Requirements. CEN, Brussels, 2013.
[22] DIN EN 1995-1-1/NA:2013-08, National Annex – Nationally determined parameters – Eurocode 5: Design of timber structures – Part 1-1: General – Common rules and rules for buildings. DIN, Berlin, 2013.
[23] Dietsch P., Gamper A., Merk M., Winter S.: Monitoring building climate and timber moisture gradient in large-span timber structures. Journal of Civil Structural Health Monitoring, accepted for publication, 2014.
[24] Krabbe E., Neuhaus A.: Über Konstruktion, Klima und Holzfeuchtigkeit eines Hallenbades. Bauen mit Holz 91(4):214-217, 1989.
[25] Denig A.: Verhalten von verstärkten BSH-Bauteilen gegenüber Holzfeuchteänderungen - Auszugversuche inkl. berührungsloser Verformungsmessung. Studienarbeit. Lehrstuhl für Holzbau und Baukonstruktion, Technische Universität München, 2009.