Embed Size (px)
Citation preview

ARTICLE
Effects of canagliflozin compared with placebo on major adversecardiovascular and kidney events in patient groups with differentbaseline levels of HbA1c, disease duration and treatment intensity:results from the CANVAS Program
Tamara K. Young1& Jing-Wei Li1 & Amy Kang1
& Hiddo J. L. Heerspink1 & Carinna Hockham2& Clare Arnott1,3 &
Brendon L. Neuen1& Sophia Zoungas1,4 & Kenneth W. Mahaffey5 & Vlado Perkovic1 & Dick de Zeeuw6
& Greg Fulcher3 &
Bruce Neal1 & Meg Jardine1,3
Received: 10 December 2020 /Accepted: 19 April 2021# The Author(s) 2021
AbstractAims/hypothesis Type 2 diabetes mellitus can manifest over a broad clinical range, although there is no clear consensus on thecategorisation of disease complexity. We assessed the effects of canagliflozin, compared with placebo, on cardiovascular andkidney outcomes in the CANagliflozin cardioVascular Assessment Study (CANVAS) Program over a range of type 2 diabetesmellitus complexity, defined separately by baseline intensity of treatment, duration of diabetes and glycaemic control.Methods We performed a post hoc analysis of the effects of canagliflozin on major adverse cardiovascular events (MACE) accordingto baseline glucose-lowering treatments (0 or 1, 2 or 3+ non-insulin glucose-lowering treatments, or insulin-based treatment), durationof diabetes (<10, 10 to 16, >16 years) and HbA1c (≤53.0 mmol/mol [<7.0%], >53.0 to 58.5 mmol/mol [>7.0% to 7.5%], >58.5 to63.9 mmol/mol [>7.5 to 8.0%], >63.9 to 69.4 mmol/mol [8.0% to 8.5%], >69.4 to 74.9 mmol/mol [>8.5 to 9.0%] or >74.9 mmol/mol[>9.0%]).We analysed additional secondary endpoints for cardiovascular and kidney outcomes, including a combined kidney outcomeof sustained 40% decline in eGFR, end-stage kidney disease or death due to kidney disease. We used Cox regression analyses andcompared the constancy of HRs across subgroups by fitting an interaction term (p value for significance <0.05).Results At study initiation, 5095 (50%) CANVAS Program participants were treated with insulin, 2100 (21%) had an HbA1c >74.9 mmol/mol (9.0%) and the median duration of diabetes was 12.6 years (interquartile interval 8.0–18 years). Canagliflozinreduced MACE (HR 0.86 [95% CI 0.75, 0.97]) with no evidence that the benefit differed between subgroups defined by thenumber of glucose-lowering treatments, the duration of diabetes or baseline HbA1c (all p-heterogeneity >0.17). Canagliflozinreduced MACE in participants receiving insulin with no evidence that the benefit differed from other participants in the trial (HR0.85 [95%CI 0.72, 1.00]). Similar results were observed for other cardiovascular outcomes and for the combined kidney outcome(HR for combined kidney outcome 0.60 [95% CI 0.47, 0.77]), with all p-heterogeneity >0.37.Conclusions/interpretation In people with type 2 diabetes mellitus at high cardiovascular risk, there was no evidence thatcardiovascular and renal protection with canagliflozin differed across subgroups defined by baseline treatment intensity, durationof diabetes or HbA1c.
Keywords Baseline HbA1c. Complications . Disease duration . Treatment intensity . Type 2 diabetes complexity
* Carinna [email protected]
* Clare [email protected]
1 The George Institute for Global Health, UNSW, Sydney, NSW,Australia
2 The George Institute for Global Health, Imperial College London,London, UK
3 University of Sydney, Sydney, NSW, Australia4 Monash University, Melbourne, VIC, Australia5 Stanford Center for Clinical Research, Department of Medicine,
Stanford University School of Medicine, Stanford, CA, USA6 Department of Clinical Pharmacy and Pharmacology, University
Medical Center Groningen, Groningen, the Netherlands
https://doi.org/10.1007/s00125-021-05524-1
/ Published online: 26 August 2021
Diabetologia (2021) 64:2402–2414
AbbreviationsCANVAS CANagliflozin cardioVascular
Assessment StudyCANVAS-R CANagliflozin cardioVascular
Assessment Study – RenalIQI Interquartile intervalMACE Major adverse cardiovascular eventsSGLT2 Sodium–glucose cotransporter 2UACR Urinary albumin/creatinine ratio
Introduction
Type 2 diabetes mellitus is a chronic disease, and individualsincluded in large trials vary widely in terms of their glycaemiccontrol and treatment management strategies. However, there isno universally agreed system for classifying the complexity ofdiabetes mellitus. A higher level of treatment intensity, increaseddisease duration and an elevatedHbA1c all imply amore complexdisease state [1, 2]. The intensity of diabetes treatment is a surro-gate marker of diabetes complexity in the context of internationalguidelines framed around glycaemic control [3]. Disease durationis another possible variable to describe disease complexity and isindependently associated with increased morbidity and mortalityrisk, reflecting an underlying progressive disease course [1, 4, 5].HbA1c level is a biochemical predictor of the development of
microvascular complications [6–8], reflected in HbA1c thresholdsappearing as targets for guideline-directed therapy [8–10].Overall, these variables represent different aspects of a heteroge-neous disease.
Sodium–glucose cotransporter 2 (SGLT2) inhibitorsreduce cardiovascular events in people with type 2 diabetesmellitus and high cardiovascular risk [11–15]. The SGLT2inhibitor canagliflozin has also been demonstrated toreduce the progression of chronic kidney disease andprevent clinical kidney events [11, 12]. Despite therequirement of these agents to be filtered at the glomerulusto meet their site of action, canagliflozin shows consistentkidney and cardiovascular protection across declining cate-gories of eGFR [15, 16]. However, the effectiveness ofthese agents in differing states of glycaemia and diabetesseverity is unclear and may plausibly vary depending onthe underlying glycaemic control and the extent of pre-existing diabetes-related complications [17–19].
The aim of these analyseswas to assess the protective effect ofcanagliflozin on key cardiovascular and kidney outcomes acrossa broad range of diabetes severity at treatment initiation. In theabsence of a consensus for classification of diabetes severity orcomplexity, our assessment for the treatment efficacy and safetyof canagliflozin in the CANagliflozin cardioVascularAssessment Study (CANVAS) Program on cardiovascular andkidney outcomes was undertaken according to three differentvariables: diabetes treatment intensity, diabetes duration andbaseline HbA1c.
2403Diabetologia (2021) 64:2402–2414
Methods
Study design and participants
The CANVAS Program comprised two multicentre, double-blind, placebo-controlled, randomised trials (CANVAS andCANagliflozin cardioVascular Assessment Study – Renal[CANVAS-R]). These were similarly conducted, with aprespecified integrated analysis, and with the aim of assessingthe cardiovascular efficacy and safety of canagliflozin inparticipants with type 2 diabetes and either a history of, or athigh risk for, CVD. The two trials were scheduled for jointclose-out and analysis when at least 688 cardiovascular eventshad occurred, and the last randomised participant had under-gone at least 78 weeks of follow-up [20]. Local institutionalethics committees approved the trial protocols at each site.Trials were registered and details are available online(ClinicalTrials.gov registration no. NCT01032629 andNCT01989754). All participants provided written, informedconsent to participate. The trial protocols and statisticalanalysis plans were published along with the primaryCANVAS Program manuscript [11].
Study population
Entry criteria for both trials included participants with type 2diabetes (53.0 mmol/mol [7.0%] ≤HbA1c ≤ 91.3 mmol/mol[10.5%]) who were either ≥30 years old with establishedatherosclerotic vascular disease or ≥50 years old with two ormore cardiovascular risk factors. Risk factors were defined as:duration of diabetes of at least 10 years; systolic blood pres-sure >140 mmHg while receiving one or more antihyperten-sive agents; current smoking; microalbuminuria ormacroalbuminuria; or high-density lipoprotein cholesterollevel of less than 1 mmol/l (38.7 mg/dl).
Baseline diabetes variable definitions
This post hoc analysis was designed after the main study waspublished. The analysis plan for the current analyses, includ-ing the definition of the baseline subgroups, was prespecifiedprior to commencement of these analyses.
Participants were divided into subgroups for treatmentintensity, disease duration and baseline HbA1c, according tothe following definitions:
(1) Treatment intensity Subgroups for treatment intensitywere defined by glucose-lowering treatments at baselinestudy visit and were: zero or one oral glucose-loweringagent, two oral glucose-lowering agents, three or moreoral glucose-lowering agents, or any combination ofglucose-lowering medication that included insulintherapy.
(2) Disease duration Subgroups were defined by tertiles ofdisease duration at baseline, namely: duration of<10 years, 10–16 years or >16 years.
(3) Baseline HbA1cBaseline HbA1c was measured 2 weeksprior to randomisation. Subgroups of HbA1c weredefined on clinically accepted categories of HbA1c of≤53.0 mmol/mol (<7.0%), >53.0 to 58.5 mmol/mol(>7.0% to 7.5%), >58.5 to 63.9 mmol/mol (>7.5% to8.0%), >63.9 to 69.4 mmol/mol (>8.0% to 8.5%),>69.4 to 74.9 mmol/mol (>8.5% to 9.0%) and>74.9 mmol/mol (>9.0%).
Randomisation and conduct of the CANVAS Programtrials
A web-based response system was used for computer-generatedrandom allocation. In CANVAS, participants were randomlyassigned to canagliflozin 100 mg daily, canagliflozin 300 mgdaily or placebo. In CANVAS-R, they were randomly assignedto canagliflozin 100 mg daily with potential dose escalation ormatching placebo. Face-to-face follow-upwas scheduled in threevisits during the first year and at 6 month intervals thereafter,with telephone follow-up between face-to-face assessments.Adverse events were collected and reported separately.Ongoing glycaemic management was in accordance with localguidelines. Central endpoint adjudication committees blinded totreatment allocation assessed cardiovascular, kidney and keysafety outcomes. The trials were analysed and reported together[11, 20].
Outcomes
The outcomes selected for this post hoc analysis were thesame as those used in the primary reporting of theCANVAS Program [11]. Other prespecified secondarycardiovascular outcomes were death from CVD, myocardialinfarction, stroke and a combined outcome comprising eithercardiovascular death or admission for heart failure [11].
The kidney outcome was a composite of end-stage kidneydisease, kidney death and 40% decrease in eGFR, which wasrequired to be sustained for two consecutive measures of≥30 days apart or occurring on the last available measure toensure the measures reflected chronic progression [11].Albuminuria progression comprised more than a 30%increase in albuminuria and a change either fromnormoalbuminuria to microalbuminuria or macroalbuminuria,or from microalbuminuria to macroalbuminuria. TheModification of Diet in Renal Disease study equation to defineeGFR was used as in the primary analysis. Albuminuria wasmeasured in first morning void urine specimens and calculatedas the urinary albumin/creatinine ratio (UACR).
2404 Diabetologia (2021) 64:2402–2414

Table1
Baselinecharacteristicsaccordingto
subgroupsof
each
variableof
diabetes
complexity
Characteristic
Intensity
oftreatm
ent
Disease
duratio
n(years)
BaselineHbA
1c(m
mol/m
ol[%
])
0or
1agents
2agents
3+agents
Insulin
p≤1
010–16
≥16
p53
(<7.0)
53.0–58.5
(7.0–7.5)
58.5–63.9
(7.5–8.0)
63.9–69.4
(8.0–8.5)
69.4–74.9
(8.5–9.0)
>74.9
(>9.0)
p
Num
ber
1693
2528
826
5095
3541
3261
3340
746
1940
2147
1793
1416
2100
Meanage(years)
63.4
62.9
62.9
63.5
0.723
61.2
62.9
65.9
<0.001
64.0
64.5
64.1
63.2
62.7
61.7
<0.001
Female(%
)36.4
37.1
28.2
36.2
0.535
33.9
36.7
37.0
0.006
32.4
32.2
35.9
36.7
35.8
39.5
<0.001
Heartfailu
re(%
)18.2
16.2
5.0
13.8
<0.001
18.7
13.2
11.1
<0.001
12.9
12.7
13.2
13.6
15.1
18.0
<0.001
Meanduratio
nof
diabetes
(years)
8.5
11.3
13.9
16.3
<0.001
6.0
12.8
22.3
<0.001
11.0
12.0
12.3
13.0
13.0
13.0
<0.001
CVD(%
)69.5
64.0
54.0
67.0
0.732
79.6
51.1
65.1
<0.001
67.7
67.1
65.6
63.3
66.1
65.2
0.143
MeanBMI(kg/m
2)
31.4
30.9
31.2
32.8
<0.001
32.0
32.2
31.7
0.074
31.9
31.7
31.8
31.8
32.2
32.3
0.02
MeanHbA
1c(m
mol/m
ol)
6466
6668
<0.001
6667
67<0.001
5156
6267
7383
<0.001
MeanHbA
1c(%
)8.0
8.2
8.2
8.4
<0.001
8.2
8.3
8.3
<0.001
6.8
7.3
7.8
8.3
8.8
9.7
<0.001
2405Diabetologia (2021) 64:2402–2414

Statistical analysis
Baseline characteristics with continuous data were describedusing mean (SD) or, when non-normally distributed, usingmedian (interquartile interval [IQI]). Categorical data weredescribed as frequencies and percentages. Differences in char-acteristics between subgroups were examined using a lineartrend test from generalised linear models for continuous vari-ables and Cochran–Armitage trend test for discrete variables.
HRs for the effect of canagliflozin compared with placebo,95% CIs and p values were estimated with Cox regressionmodels, using an intention-to-treat approach, with stratifica-tion according to trial and history of CVD. Comparisonsacross subgroups were assessed for heterogeneity, with a pvalue of less than 0.05 regarded as significant. The globalp values for heterogeneity across all subgroups were obtainedby fitting an interaction term in the Cox regression model.
Restricted cubic splines using columns that were univariatespline expansions of disease duration and baseline HbA1c
were fitted to proportional hazard regression to generatedose–response figures, setting point estimates at the middleof each category, for the major adverse cardiovascular events(MACE) outcome.
All analyses were performed using SAS version 9.4 (SASInstitute, Cary, NC, USA).
Results
The CANVAS Program included a total of 10,142 participants,4330 participants in the CANVAS trial and 5812 participants inthe CANVAS-R trial. Across the program, 5795 participantswere randomised to canagliflozin and 4347 were randomised toplacebo. During a mean follow-up of 188.2 weeks, 1011 partic-ipants experienced the combinedMACE outcome. Canagliflozinreduced MACE (HR 0.86 [95% CI 0.75, 0.97]), and thecombined kidney outcome (HR 0.60 [95% CI 0.47, 0.77]), aspreviously published elsewhere [11].
At study initiation, 5095 (50%) CANVAS Program partic-ipants were treated with insulin. The median duration ofdiabetes was 12.6 years (interquartile interval 8.0–18 years).In total, 2100 participants (21%) had a baseline HbA1c greaterthan 74.9mmol/mol (9.0%). In general, the markers of diseaseseverity at baseline were consistent between the three vari-ables (Table 1). Mean HbA1c was lowest in the participantson zero or one agent at baseline (mean 64 mmol/mol [8.0%,SD 0.9%]) and highest in those on insulin therapy (mean68 mmol/mol [8.4%, SD 0.9%]). Mean disease duration wasshortest in the participants on zero or one agent at baseline(mean 8.5 years, SD 6.2 years) and longest in those on insulintherapy (mean 16.3 years, SD 7.7 years). Mean disease dura-tion was shortest for those with the lowest HbA1c category atbaseline (mean 11.0 years, IQI 6–16 years) and longest for
those with the highest three HbA1c categories at baseline (allmean 13.0 years) (Electronic supplementary material [ESM]Figs. 1, 2; ESM Tables 1–3).
Albuminuria was different among HbA1c subgroups(p < 0.05), although there was no discernible difference ineGFR. For example, participants in the lowest HbA1c
subgroup had less albuminuria (median UACR 1.1 mg/mmol,IQI 1.0–2.6 mg/mmol) compared with those in the highestHbA1c category (median UACR 2.0 mg/mmol, IQI 0.9–8.0 mg/mmol). Both albuminuria and eGFR were differentbetween disease duration subgroups (p < 0.05 for both).Participants with the shortest disease duration had highereGFR and lower albuminuria than those with the longestdisease duration (mean eGFR 80.0 ml min−1 [1.73 m]−2, SD20.3 ml min−1 [1.73 m]−2, median UACR 1.2 mg/mmol, IQI0.7–3.4 mg/mmol; and mean eGFR 71.6 ml min−1 [1.73 m]−2,SD 19.9 ml min−1 [1.73 m]−2, median UACR 1.8 mg/mmol,IQI 0.8–7.3 mg/mmol, respectively). Similarly, both albumin-uria and eGFR were different in treatment intensity subgroups(p < 0.05 for both). Participants with the lowest intensity oftreatment had higher eGFR and lower albuminuria than thosereceiving insulin-based treatment (mean eGFR 77.7 ml min−1
[1.73 m]−2, SD 20.9 ml min−1 [1.73 m]−2, median UACR1.1 mg/mmol, IQI 0.7–2.8 mg/mmol; and mean eGFR74.1 ml min−1 [1.73 m]−2, SD 20.6 ml min−1 [1.73 m]−2,median UACR 1.7 mg/mmol, IQR 0.8–7.0 mg/mmol, respec-tively) (ESM Tables 1–3).
Outcomes according to treatment intensity
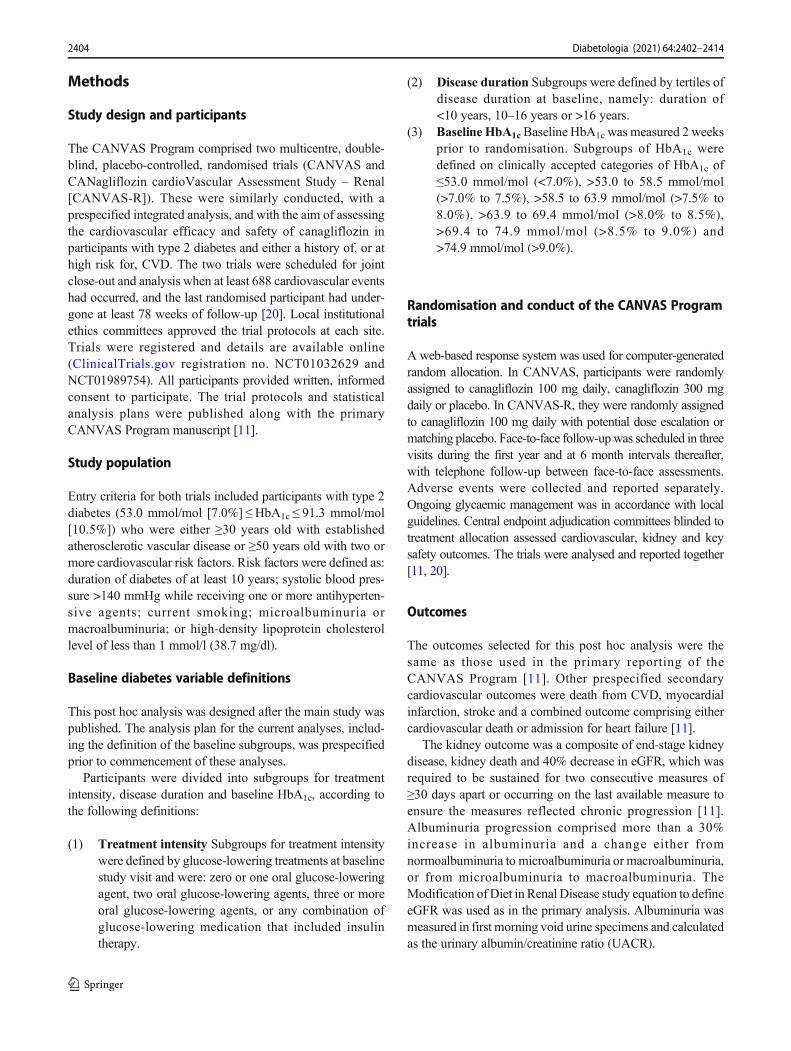
When considering the reduction in MACE for the overall trialpopulation (HR 0.86 [CI 0.75, 0.97]), there was no evidencethat the benefit differed across subgroups of baseline treatmentintensity (HR 0.71 [CI 0.51, 0.99], HR 0.95 [CI 0.71, 1.26], HR1.02 [CI 0.59, 1.76], HR 0.85 [CI 0.72, 1.0] for 0 or 1, 2 or 3+glucose-lowering agents, or insulin-based therapy, respectively;p-heterogeneity 0.292). The point estimates of the HRssuggested a potential benefit for the individual cardiovascularoutcomes; however, the CIs around the overall effect and theeffects within each subgroup were wide and overlapped thenull, so it was not possible to draw definitive conclusions(Fig. 1a).
There was consistency across treatment intensity categoriesfor the reduction of the kidney disease outcome of sustained40% decrease in eGFR, end-stage kidney disease or kidney
�Fig. 1 HRs for (a) cardiovascular and (b) kidney outcomes according tobaseline treatment intensity. HRs cannot be directly calculated from eventnumbers because the trials had different randomisation ratios anddifferent follow-up durations. The follow-up for CANVAS was295.9 weeks and for CANVAS-R was 108.0 weeks. Cana,canagliflozin; CV, cardiovascular; HF, heart failure; MI, myocardialinfarction
2406 Diabetologia (2021) 64:2402–2414
Variable HR (95% CI)Interactionp value
HR (95% CI)Interactionp value
Treatmentintensity
Events/1000person-years
Progressionof albuminuria
Renal combined
Events/1000
No./total no.
No./total no.
Cana
MACE
CV death
MI
Stroke
CV death or HF
Placebo PlaceboCana
Variable Cana Placebo PlaceboCana
All 26.9
21.0
23.0
20.4
32.0
31.5
30.7
24.2
19.1
37.4
0.86 (0.75, 0.97)
0.292
0.215
0.476
0.505
0.336
0.71 (0.51, 0.99)
0.95 (0.71, 1.26)
1.02 (0.59, 1.76)
0.85 (0.72, 1.00)
426/4347
72/740
81/1050
21/352
252/2205
585/5795
74/953
131/1478
36/474
344/2890
11.6
8.0
10.4
5.9
14.3
12.8
13.9
9.7
6.1
15.0
185/4347
35/740
34/1050
7/352
109/2205
268/5795
30/953
63/1478
11/474
164/2890
0 or 1
2
3
Insulin
All
0 or 1
2
3
Insulin
All
0 or 1
2
3
Insulin
11.2
10.2
9.3
10.6
12.7
12.6
9.7
8.9
9.0
16.1
0.87 (0.72, 1.06)
0.58 (0.35, 0.95)
1.13 (0.74, 1.73)
0.82 (0.31, 2.12)
0.89 (0.70, 1.14)
0.89 (0.73, 1.09)
1.08 (0.64, 1.83)
0.99 (0.63, 1.55)
1.14 (0.52, 2.47)
0.80 (0.62, 1.03)
173/4347
23/740
30/1050
10/352
110/2205
248/5795
36/953
54/1478
19/474
139/2890
7.9
7.0
6.9
5.5
9.2
9.6
11.0
8.0
3.6
11.0
133/4347
26/740
27/1050
4/352
76/2205
176/5795
25/953
40/1478
10/474
101/2890
16.3
12.3
13.8
11.6
19.7
20.8
20.5
14.7
13.5
25.0
0.87 (0.69, 1.09)
0.69 (0.39, 1.20)
0.89 (0.54, 1.46)
1.60 (0.50, 5.17)
0.88 (0.65, 1.19)
0.78 (0.67, 0.91)
0.60 (0.40, 0.91)
0.99 (0.69, 1.42)
0.81 (0.41, 1.58)
0.77 (0.63, 0.94)
288/4347
49/740
50/1050
15/352
174/2205
364/5795
44/953
81/1478
21/474
218/2890
All
0 or 1
2
3
Insulin
All
0 or 1
2
3
Insulin
All
0 or 1
23
Insulin
89.4
91.8
83.183.193.2
All
0 or 1
23Insulin
5.5
4.83.9
2.7
7.1
128.7
116.2
115.4121.0141.9
9.0
6.77.4
5.3
11.2
1341/5196
222/876
337/1349107/437675/2534
124/5794
17/95223/1478
5/474
79/2890
1114/3819
181/663
260/95884/318
589/1880
125/4346
16/73925/1050
6/352
78/2205
0.375
0.947
0.82 (0.68, 1.01)
0.73 (0.67, 0.79)
0.78 (0.66, 0.93)
0.71 (0.53, 0.95)0.68 (0.60, 0.76)
0.60 (0.47, 0.77)
0.69 (0.35, 1.39)0.52 (0.29, 0.93)
0.48 (0.14, 1.60)
0.61 (0.44, 0.84)
0.25 0.5 1 2 63
0.1 0.5 1 2 3 6
endpoint
a
b
person-years
Favours placeboFavours Cana
Favours placeboFavours Cana
2407Diabetologia (2021) 64:2402–2414

death, and for the protection against progression of albumin-uria (p-heterogeneity 0.375 and 0.947, respectively) (Fig. 1b).
Outcomes according to disease duration
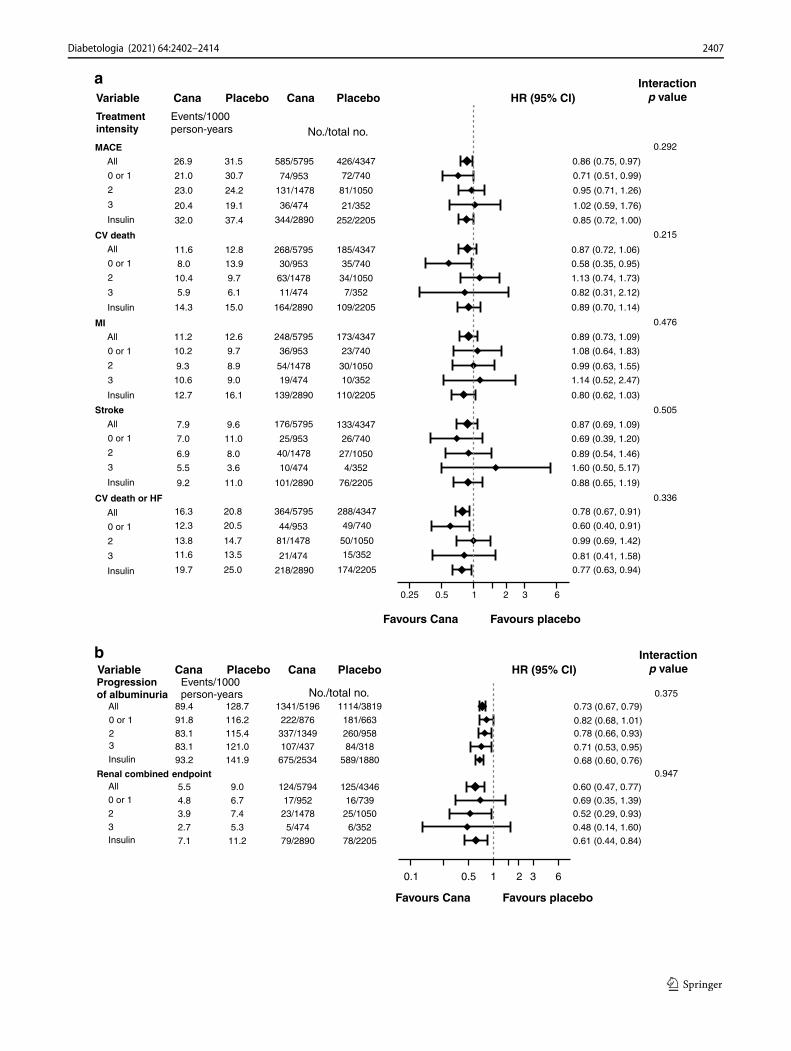
The reduction inMACEwas similar across subgroups definedby duration of diabetes (p = 0.37). The point estimates of theHRs suggested a potential benefit for the individual cardiovas-cular outcomes; however, once again, the CIs around the over-all effect and the effects within each subgroup were wide andoverlapped the null, so it was not possible to draw definitiveconclusions (Fig. 2a). The effect of canagliflozin on myocar-dial infarction differed across subgroups, with no benefit seenfor myocardial infarction in those with disease duration of lessthan 10 years (p for heterogeneity between definedsubgroups = 0.01). However, when considering the relativereduction in MACE, there was no evidence that the benefitdiffered across the range of disease duration when tested as acontinuous variable (Fig. 3).
There was no evidence that the benefit differed for a reduc-tion of the kidney disease outcome and prevention of theprogression of albuminuria across subgroups of disease dura-tion (p = 0.773 and 0.097, respectively) (Fig. 2b).
Outcomes according to baseline HbA1c
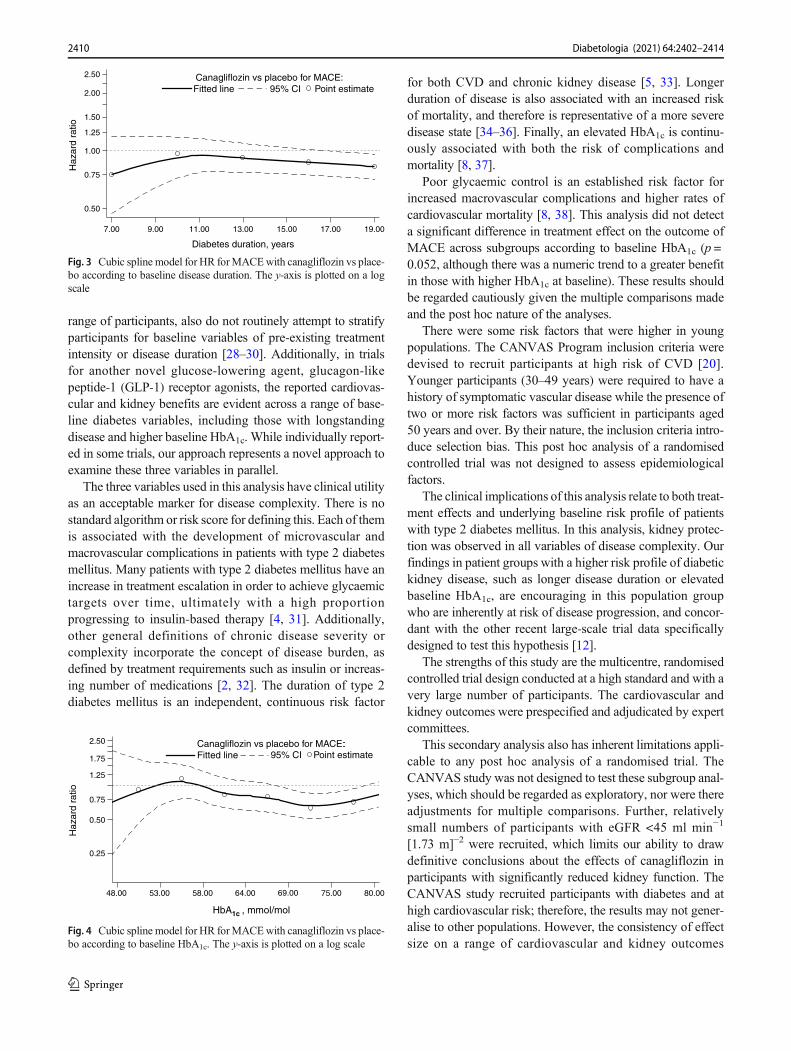
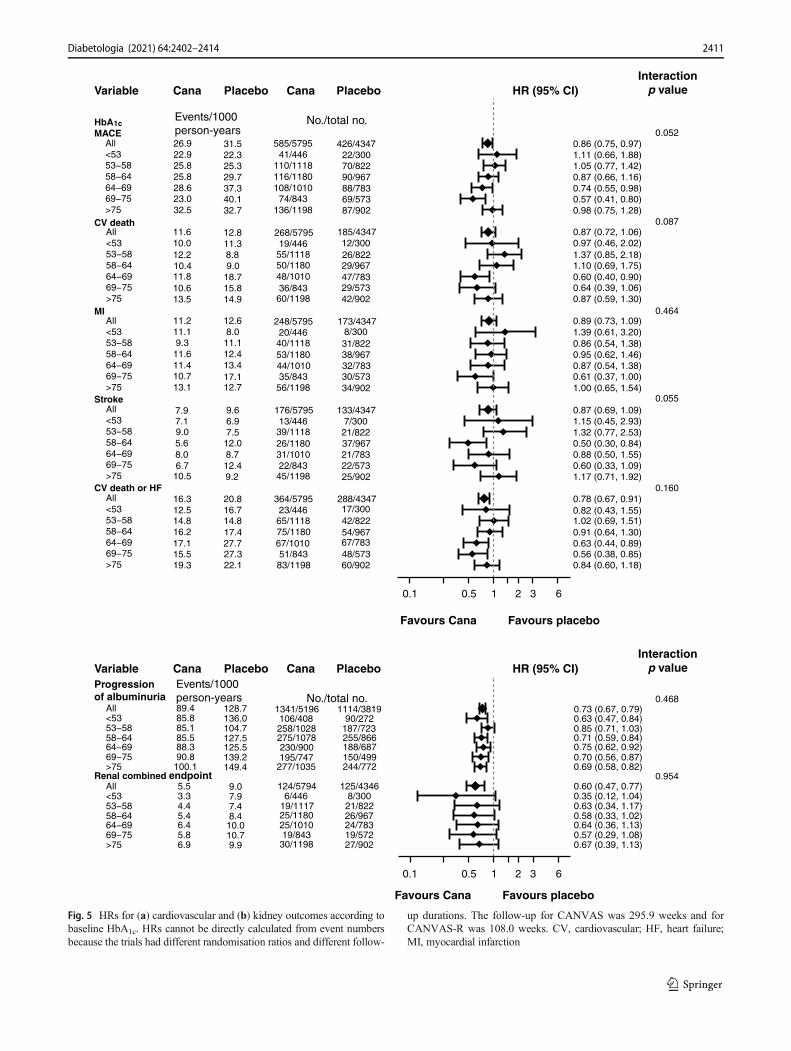
For the outcome of MACE, numerically, the effects ofcanagliflozin appeared to be greater in the HbA1c subgroupsbetween 53.0 and 74.9 mmol/mol (7.0% and 9.0%), althoughthis association was not seen for other cardiovascularoutcomes or in analyses of HbA1c as a continuous variable(Fig. 4). The point estimates of the HRs suggested a potentialbenefit for the individual cardiovascular outcomes; however,with the CIs around the overall effect and the effects withineach subgroup overlapping the null, it was not possible todraw definitive conclusions (Fig. 5a).
There was no evidence that the benefit of canagliflozin fora reduction in the kidney disease outcome, and protectionagainst progression of albuminuria, differed betweensubgroups defined by baseline HbA1c (p = 0.954 and 0.468,respectively) (Fig. 5b).
Discussion
In this secondary post hoc analysis of a large, multicentrerandomised controlled trial, participants with type 2 diabetesrandomised to canagliflozin received similar cardioprotectiveand renoprotective effects regardless of their baseline HbA1c,disease duration or intensity of diabetes treatment.Canagliflozin was associated with a reduction in cardiovascu-lar death and stroke, even in participants in the highest diseaseduration tertile, representing at least 16 years with the disease.
Canagliflozin had consistent effects for MACE, including inparticipants receiving insulin at baseline. This implies a possi-ble drug effect on the prevention of macrovascular complica-tions that is not attenuated in those with a more complexdisease state. In patients randomised to receive canagliflozin,kidney protection was observed across all variables of diseaseseverity, including maximum treatment intensity, long diseaseduration and higher baseline HbA1c. Regardless of how it isdefined, a higher level of baseline disease complexity orseverity does not appear to pose a threshold for the cardiovas-cular and kidney benefits of canagliflozin.
In the absence of a clear consensus on diabetes severitycategorisation, an analysis of outcomes using these three plau-sible variables in a trial population with a range of underlyingdisease complexity was undertaken. There is no universallyagreed system for classifying disease severity or complexity inmajor international guidelines that is the equivalent of theKidney Disease: Improving Global Outcomes (KDIGO)CKD stage classification system [21, 22]. The observedconcordance in findings across these three potential variablesof diabetes disease complexity suggests a possible approach tosystematically evaluating a disease with broad clinical presen-tation. This multifaceted approach for describing diabetescomplexity may provide a framework for future analyses tocapture a wide spectrum of disease. Overall, our broad methodof describing baseline diabetes complexity, and the reproduc-ibility of findings across all three variables, increases thegeneralisability of these findings to a wide range of peoplewith type 2 diabetes.
Analyses of trial efficacy according to variables of diseasecomplexity have been incompletely reported [14, 23, 24]. TheDapagliflozin Effect on Cardiovascular Events–Thrombolysisin Myocardial Infarction 58 (DECLARE-TIMI58) trialdemonstrated heterogeneous MACE outcomes and attenuatedrenoprotective outcomes in patients with type 2 diabetesdisease duration greater than 20 years who were randomisedto receive an SGLT2 inhibitor [25]. Additionally, while majortrials for cardiovascular outcomes in SGLT2 inhibitors allconsider baseline HbA1c, albeit with a range of entry criteria,only one has reported outcomes according to baseline HbA1c,demonstrating that the cardioprotective effects ofempagliflozin were independent of baseline glycaemic control[26]. This is concordant with our findings. Other trials do notroutinely analyse outcomes according to the number of agentsthat patients are prescribed at study entry, or the proportion ofindividual agents that are used [27]. The CANVAS Programhad a higher proportion of insulin use at baseline comparedwith other major trials, suggesting a higher proportion ofparticipants with more complex type 2 diabetes mellitus, yetstill reported favourable outcomes in this subgroup of partic-ipants. Other recent trials examining cardiovascular andkidney outcomes for novel glucose-lowering agents for diabe-tes other than SGLT2 inhibitors, while including a broad
2408 Diabetologia (2021) 64:2402–2414

Variable Cana Placebo Cana Placebo HR (95% CI)Interactionp value
VariableProgressionof albuminuria
Renal combined endpoint
Cana Placebo Cana Placebo HR (95% CI)Interactionp value
Diabetes duration
CV death
MI
Stroke
CV death or HF
MACE
All
≤10
≥16
10−16
26.9
27.2
28.7
24.8
11.6
9.0
15.0
10.9
12.8
12.0
13.8
12.9
268/5795
72/2038
114/1891
82/1866
185/4347
60/1503
63/1449
62/1395
31.5
0.370
0.282
0.016
0.240
0.150
0.097
0.773
27.9
36.6
30.4
585/5795
203/2038
206/1891
176/1866
426/4347
132/1503
156/1449
138/1395
All
≤10
≥16
10−16
All
≤10
≥16
10−16
7.9
9.5
6.7
7.5
9.6
10.4
10.9
7.5
176/5795
73/2038
49/1891
54/1866
133/4347
50/1503
48/1449
35/1395
All
≤10
≥16
10−16
12.6
8.7
15.5
14.0
248/5795
93/2038
81/1891
74/1866
173/4347
42/1503
67/1449
64/1395
11.2
12.2
11.2
10.3
All
≤10
≥16
10−16
16.3
13.9
20.3
14.7
20.8
17.3
22.0
23.2
364/5795
108/2038
149/1891
107/1866
288/4347
84/1503
97/1449
107/1395
0.87 (0.72, 1.06)
0.75 (0.53, 1.06)
1.05 (0.77, 1.44)
0.82 (0.59, 1.14)
0.86 (0.75, 0.97)
0.98 (0.79, 1.23)
0.78 (0.63, 0.97)
0.82 (0.65, 1.02)
0.87 (0.69, 1.09)
0.96 (0.67, 1.38)
0.67 (0.44, 1.00)
1.03 (0.67, 1.58)
0.89 (0.73, 1.09)
1.40 (0.97, 2.02)
0.70 (0.50, 0.98)
0.76 (0.54, 1.06)
0.78 (0.67, 0.91
0.80 (0.60, 1.07)
0.93 (0.72, 1.21)
0.63 (0.48, 0.83)
All
≤10
≥16
10−16
89.4
91.7
91.6
84.7
128.7
123.0
149.0
116.8
1341/5196
487/1879
437/1660
417/1657
1114/3819
383/1351
387/1242
344/1226
All
≤10
≥16
10−16
5.5
4.1
7.2
5.4
9.0
6.6
10.7
9.9
124/5794
32/2038
53/1891
39/1865
125/4346
32/1502
47/1449
46/1395
0.73 (0.67, 0.79)
0.79 (0.69, 0.91)
0.65 (0.56, 0.75)
0.76 (0.66, 0.88)
0.60 (0.47, 0.77)
0.62 (0.38, 1.02)
0.61 (0.41, 0.92)
0.55 (0.36, 0.85)
0.1 0.5 1 62 3
0.1 0.5 1 62 3
No./total no.
No./total no.
Events/1000person-years
Events/1000person-years
a
b
Favours placeboFavours Cana
Favours placeboFavours Cana
Fig. 2 HRs for (a) cardiovascular and (b) kidney outcomes according tobaseline disease duration. HRs cannot be directly calculated from eventnumbers because the trials had different randomisation ratios and
different follow-up durations. The follow-up for CANVAS was295.9 weeks and for CANVAS-R was 108.0 weeks. CV, cardiovascular;HF, heart failure; MI, myocardial infarction
2409Diabetologia (2021) 64:2402–2414
range of participants, also do not routinely attempt to stratifyparticipants for baseline variables of pre-existing treatmentintensity or disease duration [28–30]. Additionally, in trialsfor another novel glucose-lowering agent, glucagon-likepeptide-1 (GLP-1) receptor agonists, the reported cardiovas-cular and kidney benefits are evident across a range of base-line diabetes variables, including those with longstandingdisease and higher baseline HbA1c. While individually report-ed in some trials, our approach represents a novel approach toexamine these three variables in parallel.
The three variables used in this analysis have clinical utilityas an acceptable marker for disease complexity. There is nostandard algorithm or risk score for defining this. Each of themis associated with the development of microvascular andmacrovascular complications in patients with type 2 diabetesmellitus. Many patients with type 2 diabetes mellitus have anincrease in treatment escalation in order to achieve glycaemictargets over time, ultimately with a high proportionprogressing to insulin-based therapy [4, 31]. Additionally,other general definitions of chronic disease severity orcomplexity incorporate the concept of disease burden, asdefined by treatment requirements such as insulin or increas-ing number of medications [2, 32]. The duration of type 2diabetes mellitus is an independent, continuous risk factor
for both CVD and chronic kidney disease [5, 33]. Longerduration of disease is also associated with an increased riskof mortality, and therefore is representative of a more severedisease state [34–36]. Finally, an elevated HbA1c is continu-ously associated with both the risk of complications andmortality [8, 37].
Poor glycaemic control is an established risk factor forincreased macrovascular complications and higher rates ofcardiovascular mortality [8, 38]. This analysis did not detecta significant difference in treatment effect on the outcome ofMACE across subgroups according to baseline HbA1c (p =0.052, although there was a numeric trend to a greater benefitin those with higher HbA1c at baseline). These results shouldbe regarded cautiously given the multiple comparisons madeand the post hoc nature of the analyses.
There were some risk factors that were higher in youngpopulations. The CANVAS Program inclusion criteria weredevised to recruit participants at high risk of CVD [20].Younger participants (30–49 years) were required to have ahistory of symptomatic vascular disease while the presence oftwo or more risk factors was sufficient in participants aged50 years and over. By their nature, the inclusion criteria intro-duce selection bias. This post hoc analysis of a randomisedcontrolled trial was not designed to assess epidemiologicalfactors.
The clinical implications of this analysis relate to both treat-ment effects and underlying baseline risk profile of patientswith type 2 diabetes mellitus. In this analysis, kidney protec-tion was observed in all variables of disease complexity. Ourfindings in patient groups with a higher risk profile of diabetickidney disease, such as longer disease duration or elevatedbaseline HbA1c, are encouraging in this population groupwho are inherently at risk of disease progression, and concor-dant with the other recent large-scale trial data specificallydesigned to test this hypothesis [12].
The strengths of this study are the multicentre, randomisedcontrolled trial design conducted at a high standard and with avery large number of participants. The cardiovascular andkidney outcomes were prespecified and adjudicated by expertcommittees.
This secondary analysis also has inherent limitations appli-cable to any post hoc analysis of a randomised trial. TheCANVAS study was not designed to test these subgroup anal-yses, which should be regarded as exploratory, nor were thereadjustments for multiple comparisons. Further, relativelysmall numbers of participants with eGFR <45 ml min−1
[1.73 m]−2 were recruited, which limits our ability to drawdefinitive conclusions about the effects of canagliflozin inparticipants with significantly reduced kidney function. TheCANVAS study recruited participants with diabetes and athigh cardiovascular risk; therefore, the results may not gener-alise to other populations. However, the consistency of effectsize on a range of cardiovascular and kidney outcomes
7.00 9.00 11.00 13.00 15.00 17.00 19.00
2.50
2.00
1.50
1.25
1.00
0.75
0.50
Haz
ard
ratio
Diabetes duration, years
Canagliflozin vs placebo for MACE:Fitted line 95% CI Point estimate
Fig. 3 Cubic spline model for HR forMACEwith canagliflozin vs place-bo according to baseline disease duration. The y-axis is plotted on a logscale
48.00 53.00 58.00 64.00 69.00 75.00 80.00
HbA1c , mmol/mol
2.50
1.75
1.25
0.75
0.50
0.25
Haz
ard
ratio
Canagliflozin vs placebo for MACE:Fitted line 95% CI Point estimate
Fig. 4 Cubic spline model for HR forMACEwith canagliflozin vs place-bo according to baseline HbA1c. The y-axis is plotted on a log scale
2410 Diabetologia (2021) 64:2402–2414
Variable
HbAMACE
CV death
MI
Stroke
CV death or HF
All<5353−5858−6464−6969−75>75
26.922.925.825.828.623.032.5
31.522.325.329.737.340.132.7
585/579541/446
110/1118116/1180108/1010
74/843136/1198
426/434722/30070/82290/96788/78369/57387/902
All<5353−5858−6464−6969−75>75
11.610.012.210.411.810.613.5
12.811.38.89.0
18.715.814.9
268/579519/44655/111850/118048/101036/843
60/1198
185/434712/30026/82229/96747/78329/57342/902
All<5353−5858−6464−6969−75>75
11.211.19.3
11.611.410.713.1
248/579520/44640/111853/118044/101035/843
56/1198
173/43478/30031/82238/96732/78330/57334/902
12.68.0
11.112.413.417.112.7
All<5353−5858−6464−6969−75>75
7.97.19.05.68.06.7
10.5
9.66.97.5
12.08.712.49.2
176/579513/44639/111826/118031/101022/84345/1198
133/43477/30021/82237/96721/78322/57325/902
All<5353−5858−6464−6969−75>75
All<5353−5858−6464−6969−75>75
All<5353−5858−6464−6969−75>75
89.485.885.185.588.390.8
100.1
5.53.34.45.46.45.86.9
128.7136.0104.7127.5125.5139.2149.4
9.07.97.48.4
10.010.79.9
1341/5196106/408258/1028275/1078230/900195/747
277/1035
124/57946/446
19/111725/118025/101019/843
30/1198
1114/381990/272
187/723255/866188/687150/499244/772
125/43468/30021/82226/96724/78319/57227/902
0.73 (0.67, 0.79)0.63 (0.47, 0.84)0.85 (0.71, 1.03)0.71 (0.59, 0.84)0.75 (0.62, 0.92)0.70 (0.56, 0.87)0.69 (0.58, 0.82)
0.60 (0.47, 0.77)0.35 (0.12, 1.04)0.63 (0.34, 1.17)0.58 (0.33, 1.02)0.64 (0.36, 1.13)0.57 (0.29, 1.08)0.67 (0.39, 1.13)
16.312.514.816.217.115.519.3
20.816.714.817.427.727.322.1
364/579523/44665/111875/118067/101051/84383/1198
288/434717/30042/82254/96767/78348/57360/902
0.86 (0.75, 0.97)0.052
0.087
0.464
0.055
0.160
0.468
0.954
1.11 (0.66, 1.88)1.05 (0.77, 1.42)0.87 (0.66, 1.16)0.74 (0.55, 0.98)0.57 (0.41, 0.80)0.98 (0.75, 1.28)
0.87 (0.72, 1.06)0.97 (0.46, 2.02)1.37 (0.85, 2.18)1.10 (0.69, 1.75)0.60 (0.40, 0.90)0.64 (0.39, 1.06)0.87 (0.59, 1.30)
0.89 (0.73, 1.09)1.39 (0.61, 3.20)0.86 (0.54, 1.38)0.95 (0.62, 1.46)0.87 (0.54, 1.38)0.61 (0.37, 1.00)1.00 (0.65, 1.54)
0.87 (0.69, 1.09)1.15 (0.45, 2.93)1.32 (0.77, 2.53)0.50 (0.30, 0.84)0.88 (0.50, 1.55)0.60 (0.33, 1.09)1.17 (0.71, 1.92)
0.78 (0.67, 0.91)0.82 (0.43, 1.55)1.02 (0.69, 1.51)0.91 (0.64, 1.30)0.63 (0.44, 0.89)0.56 (0.38, 0.85)0.84 (0.60, 1.18)
Cana Placebo Placebo HR (95% CI)Interactionp valueCana
VariableProgressionof albuminuria
Cana Placebo Placebo HR (95% CI)Interactionp valueCana
Events/1000person-years
No./total no.
Events/1000person-years No./total no.
0.1 0.5 1 2 3 6
0.1 0.5 1 2 3 6
1c
Favours placeboFavours Cana
Favours placeboFavours Cana
Renal combined endpoint
Fig. 5 HRs for (a) cardiovascular and (b) kidney outcomes according tobaseline HbA1c. HRs cannot be directly calculated from event numbersbecause the trials had different randomisation ratios and different follow-
up durations. The follow-up for CANVAS was 295.9 weeks and forCANVAS-R was 108.0 weeks. CV, cardiovascular; HF, heart failure;MI, myocardial infarction
2411Diabetologia (2021) 64:2402–2414
supports the likely beneficial effects of SGLT2 inhibitors inpatients with type 2 diabetes mellitus at high cardiovascularrisk.
Conclusions Canagliflozin has beneficial cardiovascular andkidney outcomes that are evident across a wide range of diabe-tes control and levels of complexity in patient groups whohave an underlying elevated risk of CVD. Consideration forthe clinical utility of SGLT2 inhibitors in the prevention ofcardiovascular and kidney complications of diabetes across aspectrum of disease, even in those patient groups with moreserious prognostic factors, is warranted.
Supplementary Information The online version of this article (https://doi.org/10.1007/s00125-021-05524-1) contains peer-reviewed butunedited supplementary material.
Acknowledgements Some of the data were presented as an abstract at the57th ERA-EDTA Congress in 2020.
Data availability Data from the CANVAS Program will be made avail-able in the public domain via the Yale University Open Data AccessProject (http://yoda.yale.edu/) once the product and relevant indicationsstudied have been approved by regulators in Europe and the United Statesand the study has been completed for 18 months. Data are available fromthe authors upon reasonable request.
Funding The CANVAS Program was supported by Janssen Research &Development, LLC; ClinicalTrials.gov registration no. NCT01032629,NCT01989754. The analyses in this paper were supported solely by theauthors’ institutions and received no external support. The study sponsor/funder was not involved in the design of the study; the collection, analy-sis, and interpretation of data; writing the report; and did not impose anyrestrictions regarding the publication of the report.
Authors’ relationships and activities TKY is supported by a UniversityPostgraduate Award Scholarship to undertake a PhD at UNSW. Sheprovides scientific support for a trial sponsored by Visterra. J-WL, AK,CA, CH and GF declare that there are no relationships or activities thatmight bias, or be perceived to bias, their work. BLN has received travelsupport from Janssen and honoraria from Bayer with all funds paid to hisinstitution. HJLH’s institution received honoraria from Janssen. SZreports payment to institution (Monash University) outside the submittedwork—Eli Lilly Australia Ltd., Boehringer-Ingelheim, MSD Australia,AstraZeneca, Novo Nordisk and Servier. KWM has received researchgrants or consultancy agreements from the following: Abbott, Afferent,AHA, Amgen, Anthos, Apple, Inc., AstraZeneca, Baim Institute, Bayer,Boehringer Ingelheim, Cardiva Medical, Inc., CSL Behring, Eidos,Elsevier, Ferring, Gilead, Google (Verily), Inova, Intermountain Health,Johnson & Johnson, Luitpold, Medscape, Medtronic, Merck, MountSinai, Mundipharma, Myokardia, NIH, Novartis, Novo Nordisk,Otsuka, Portola, Regeneron, Sanifit, Sanofi, SmartMedics, St. Jude andTheravance. VP reports Honoraria for Advisory Boards or ScientificP r e sen t a t i ons : AbbVie , Baye r , Boeh r i nge r Inge lhe im ,GlaxoSmithKline, Janssen and Pfizer; Astellas, AstraZeneca, Bayer,Baxter, Bristol-Myers Squibb, Chinook, Durect, Eli Lilly, Gilead,Merck, Mitsubishi Tanabe, Mundipharma, Novartis, Novo Nordisk,Pharmalink, Relypsa, Retrophin, Roche, Sanofi, Servier and Vitae; andis Serving/Served on Steering Committees for trials funded by AbbVie,Astra Zeneca, Bayer, Boehringer Ingelheim, Chinook, Eli Lilly, Gilead,GlaxoSmithKline, Janssen, Novartis, Novo Nordisk and Retrophin; and
is a Board Director for: George Clinical, George Institute, GarvanInstitute, Mindgardens Network, Children’s Cancer Institute and VictorChang Cardiac Research Institute. DdZ provides consultancy to JanssenFresenius, Boehringer Ingelheim, Bayer, Mitsubishi Tanabe,Mundipharma and Travere Pharma. BLN reports honoraria fromJanssen and Mitsubishi Tanabe Pharma Corporation. MJ is supportedby a Medical Research Future Fund Next Generation ClinicalResearchers Program Career Development Fellowship; is responsiblefor research projects that have received unrestricted funding fromGambro, Baxter, CSL, Amgen, Eli Lilly and MSD; has served on advi-sory boards sponsored by Akebia, Astra Zeneca, Baxter, BoehringerIngelheim, MSD and Vifor; serves on a Steering Committee for trialssponsored by Janssen and CSL; and has spoken at scientific meetingssponsored by Janssen, Amgen, Roche and Vifor, with any consultancy,honoraria or travel support paid to her institution.
Contribution statement All authors made substantial contributions toconception and design of the paper. TKY and J-WL undertook the initialanalysis of data and all authors contributed to the interpretation of data.TKY drafted the original article and all authors contributed to revisionsand final approval for publishing. TKY and MJ are responsible for theintegrity of the work as a whole. The authors, who had full access to thedata and made the final decisions about the content of the manuscript,vouch for the accuracy and completeness of the data and analyses and forthe fidelity of the trial to the protocol.
Open Access This article is licensed under a Creative CommonsAttribution 4.0 International License, which permits use, sharing, adap-tation, distribution and reproduction in any medium or format, as long asyou give appropriate credit to the original author(s) and the source,provide a link to the Creative Commons licence, and indicate if changeswere made. The images or other third party material in this article areincluded in the article's Creative Commons licence, unless indicatedotherwise in a credit line to the material. If material is not included inthe article's Creative Commons licence and your intended use is notpermitted by statutory regulation or exceeds the permitted use, you willneed to obtain permission directly from the copyright holder. To view acopy of this licence, visit http://creativecommons.org/licenses/by/4.0/.
References
1. Chatterjee S, Khunti K, Davies MJ (2017) Type 2 diabetes. Lancet389:2239–2251. https://doi.org/10.1016/S0140-6736(17)30058-2
2. Sav A, Salehi A, Mair FS, McMillan SS (2017) Measuring theburden of treatment for chronic disease: implications of a scopingreview of the literature. BMC Med Res Methodol 17:140
3. American Diabetes Association (2019) 6. Glycemic targets: stan-dards of medical care in diabetes—2019. Diabetes Care 42:S61–S70
4. Turner RC, Cull CA, Frighi V, Holman RR (1999) Glycemiccontrol with diet, sulfonylurea, metformin, or insulin in patientswith type 2 diabetes mellitus: progressive requirement for multipletherapies (UKPDS 49). UK Prospective Diabetes Study (UKPDS)Group. JAMA 281:2005–2012. https://doi.org/10.1001/jama.281.21.2005
5. Zoungas S, Woodward M, Li Q et al (2014) Impact of age, age atdiagnosis and duration of diabetes on the risk of macrovascular andmicrovascular complications and death in type 2 diabetes.Diabetologia 57:2465–2474. https://doi.org/10.1007/s00125-014-3369-7
2412 Diabetologia (2021) 64:2402–2414
6. UK Prospective Diabetes Study (UKPDS) Group (1998) Intensiveblood-glucose control with sulphonylureas or insulin comparedwith conventional treatment and risk of complications in patientswith type 2 diabetes (UKPDS 33). Lancet (London, England) 352:837–853
7. The Diabetes Control and Complications Trial Research Group(1995) The relationship of glycemic exposure (HbA1c) to the riskof development and progression of retinopathy in the diabetescontrol and complications trial. Diabetes 44:968–983. https://doi.org/10.2337/diab.44.8.968
8. Zoungas S, Chalmers J, Ninomiya T et al (2012) Association ofHbA1c levels with vascular complications and death in patientswith type 2 diabetes: evidence of glycaemic thresholds.Diabetologia 55:636–643. https://doi.org/10.1007/s00125-011-2404-1
9. Rodriguez-Gutierrez R, McCoy RG (2019) Measuring whatmatters in DiabetesReevaluating the use of hemoglobin A1c as asurrogate marker in diabetes. JAMA 321:1865–1866. https://doi.org/10.1001/jama.2019.4310
10. Spencer-Bonilla G, Quinones AR, Montori VM (2017) Assessingthe burden of treatment. J Gen Intern Med 32:1141–1145. https://doi.org/10.1007/s11606-017-4117-8
11. Neal B, Perkovic V, Mahaffey KW et al (2017) Canagliflozin andcardiovascular and renal events in type 2 diabetes. N Engl J Med377:644–657. https://doi.org/10.1056/NEJMoa1611925
12. Perkovic V, JardineMJ, Neal B et al (2019) Canagliflozin and renaloutcomes in type 2 diabetes and nephropathy. N Engl J Med 380:2295–2306. https://doi.org/10.1056/NEJMoa1811744
13. Wiviott SD, Raz I, Bonaca MP et al (2019) Dapagliflozin andcardiovascular outcomes in type 2 diabetes. N Engl J Med 380:347–357. https://doi.org/10.1056/NEJMoa1812389
14. Zinman B, Wanner C, Lachin JM et al (2015) Empagliflozin,cardiovascular outcomes, and mortality in type 2 diabetes. N EnglJ Med 373:2117–2128. https://doi.org/10.1056/NEJMoa1504720
15. Neuen BL, Young T, Heerspink HJL et al (2019) SGLT2 inhibitorsfor the prevention of kidney failure in patients with type 2 diabetes:a systematic review and meta-analysis. Lancet Diabetes Endocrinol7:845–854
16. Neuen Brendon L, Ohkuma T, Neal B et al (2018) Cardiovascularand renal outcomes with canagliflozin according to baseline kidneyfunction. Circulation 138:1537–1550. https://doi.org/10.1161/CIRCULATIONAHA.118.035901
17. Petrykiv S, Sjöström CD, Greasley PJ et al (2017) Differentialeffects of dapagliflozin on cardiovascular risk factors at varyingdegrees of renal function. Clin J Am Soc Nephrol 12:751–759
18. Cherney DZI, Cooper ME, Tikkanen I et al (2018) Pooled analysisof phase III trials indicate contrasting influences of renal functionon blood pressure, body weight, and HbA1c reductions withempagliflozin. Kidney Int 93:231–244. https://doi.org/10.1016/j.kint.2017.06.017
19. Zelniker TA, Wiviott SD, Raz I et al (2019) SGLT2 inhibitors forprimary and secondary prevention of cardiovascular and renaloutcomes in type 2 diabetes: a systematic review and meta-analysis of cardiovascular outcome trials. Lancet 393:31–39.https://doi.org/10.1016/S0140-6736(18)32590-X
20. Neal B, Perkovic V, Mahaffey KW et al (2017) Optimizing theanalysis strategy for the CANVAS Program: a prespecified planfor the integrated analyses of the CANVAS and CANVAS-R trials.Diabetes Obes Metab 19:926–935. https://doi.org/10.1111/dom.12924
21. Levin A, Stevens PE, Bilous RW et al (2013) Kidney disease:Improving Global Outcomes (KDIGO) CKD Work Group.KDIGO 2012 clinical practice guideline for the evaluation andmanagement of chronic kidney disease. Kidney Int 3:1–150
22. Davies MJ, D’Alessio DA, Fradkin J et al (2018) Management ofhyperglycaemia in type 2 diabetes, 2018. A consensus report by the
American Diabetes Association (ADA) and the EuropeanAssociation for the Study of Diabetes (EASD). Diabetologia 61:2461–2498. https://doi.org/10.1007/s00125-018-4729-5
23. Neal B, Perkovic V, de ZeeuwD et al (2013) Rationale, design, andbaseline characteristics of the Canagliflozin CardiovascularAssessment Study (CANVAS)–a randomized placebo-controlledtrial. Am Heart J 166:217–223.e211. https://doi.org/10.1016/j.ahj.2013.05.007
24. Raz I, Mosenzon O, Bonaca MP et al (2018) DECLARE-TIMI 58:participants’ baseline characteristics. Diabetes Obes Metab 20:1102–1110. https://doi.org/10.1111/dom.13217
25. Bajaj HS, Raz I, Mosenzon O et al (2020) Cardiovascular and renalbenefits of dapagliflozin in patients with short and long-standingtype 2 diabetes: analysis from the DECLARE-TIMI 58 trial.Diabetes Obes Metab 22:1122–1131. https://doi.org/10.1111/dom.14011
26. Inzucchi SE, Kosiborod M, Fitchett D et al (2018) Improvement incardiovascular outcomes with empagliflozin is independent ofglycemic control. Circulation 138:1904–1907. https://doi.org/10.1161/CIRCULATIONAHA.118.035759
27. Zinman B, Inzucchi SE, Lachin JM et al (2014) Rationale, design,and baseline characteristics of a randomized, placebo-controlledcardiovascular outcome trial of empagliflozin (EMPA-REGOUTCOME). Cardiovasc Diabetol 13:102. https://doi.org/10.1186/1475-2840-13-102
28. Rosenstock J, Perkovic V, Johansen OE et al (2019) Effect oflinagliptin vs placebo on major cardiovascular events in adults withtype 2 diabetes and high cardiovascular and renal risk: theCARMELINA randomized clinical trial. JAMA 321:69–79.https://doi.org/10.1001/jama.2018.18269
29. Marso SP, Daniels GH, Brown-Frandsen K et al (2016) Liraglutideand cardiovascular outcomes in type 2 diabetes. N Engl J Med 375:311–322. https://doi.org/10.1056/NEJMoa1603827
30. Green JB, Bethel MA, Armstrong PW et al (2015) Effect ofsitagliptin on cardiovascular outcomes in type 2 diabetes. N EnglJ Med 373:232–242. https://doi.org/10.1056/NEJMoa1501352
31. Fu AZ, Sheehan JJ (2016) Treatment intensification for patientswith type 2 diabetes and poor glycaemic control. Diabetes ObesMetab 18:892–898. https://doi.org/10.1111/dom.12683
32. Boyd CM, Weiss CO, Halter J et al (2007) Framework for evalu-ating disease severity measures in older adults with comorbidity. JGerontol A Biol Sci Med Sci 62:286–295. https://doi.org/10.1093/gerona/62.3.286
33. Nanayakkara N, Ranasinha S, Gadowski A et al (2018) Age, age atdiagnosis and diabetes duration are all associated with vascularcomplications in type 2 diabetes. J Diabetes Complicat 32:279–290. https://doi.org/10.1016/j.jdiacomp.2017.11.009
34. Huo L, Magliano DJ, Ranciere F et al (2018) Impact of age atdiagnosis and duration of type 2 diabetes on mortality in Australia1997-2011. Diabetologia 61:1055–1063. https://doi.org/10.1007/s00125-018-4544-z
35. Herrington WG, Alegre-Diaz J, Wade R et al (2018) Effect ofdiabetes duration and glycaemic control on 14-year cause-specificmortality in Mexican adults: a blood-based prospective cohortstudy. Lancet Diabetes Endocrinol 6:455–463. https://doi.org/10.1016/S2213-8587(18)30050-0
36. Vetrone LM, Zaccardi F,Webb DR et al (2019) Cardiovascular andmortality events in type 2 diabetes cardiovascular outcomes trials: asystematic review with trend analysis. Acta Diabetol 56:331–339.https://doi.org/10.1007/s00592-018-1253-5
37. Zoungas S, Arima H, Gerstein HC et al (2017) Effects of intensiveglucose control on microvascular outcomes in patients with type 2diabetes: a meta-analysis of individual participant data fromrandomised controlled trials. Lancet Diabetes Endocrinol 5:431–437. https://doi.org/10.1016/S2213-8587(17)30104-3
2413Diabetologia (2021) 64:2402–2414

38. Cavero-Redondo I, Peleteiro B, Álvarez-Bueno C et al (2017)Glycated haemoglobin A1c as a risk factor of cardiovascularoutcomes and all-cause mortality in diabetic and non-diabetic popu-lations: a systematic review and meta-analysis. BMJ Open 7:e015949. https://doi.org/10.1136/bmjopen-2017-015949
Publisher’s note Springer Nature remains neutral with regard to jurisdic-tional claims in published maps and institutional affiliations.
2414 Diabetologia (2021) 64:2402–2414


![AusPAR Attachment 1: Product Information for Canagliflozin ...C]canagliflozin dose to healthy subjects, 41.5%, 7.0%, and 3.2% of the administered radioactive dose was recovered in](https://img.pdfslide.us/doc/110x75/5e2cee0a2324423f1429435d/auspar-attachment-1-product-information-for-canagliflozin-ccanagliflozin-dose.jpg)


![Nicotine Replacement for Smoking Cessation …...nicotine usually obtainedby smoking, thereby relieving cravings and withdrawal symptoms [24,25]. Compared to placebo, the odds ratio](https://img.pdfslide.us/doc/110x75/5f4b08784eec7f5833173808/nicotine-replacement-for-smoking-cessation-nicotine-usually-obtainedby-smoking.jpg)