Embed Size (px)
Citation preview
Journal of Alloys and Compounds 615 (2014) 582–587
Contents lists available at ScienceDirect
Journal of Alloys and Compounds
journal homepage: www.elsevier .com/locate / ja lcom
Effects of calcination on the preparation of carbon-coated SnO2/grapheneas anode material for lithium-ion batteries q
http://dx.doi.org/10.1016/j.jallcom.2014.06.1430925-8388/� 2014 Elsevier B.V. All rights reserved.
q Electronic supplementary information (ESI) available.⇑ Corresponding author. Tel.: +86 532 8698 3452.
E-mail address: [email protected] (M. Wu).
Guiliang Wu, Zhongtao Li, Wenting Wu, Mingbo Wu ⇑State Key Laboratory of Heavy Oil Processing, China University of Petroleum, Qingdao 266580, China
a r t i c l e i n f o
Article history:Received 15 May 2014Received in revised form 19 June 2014Accepted 19 June 2014Available online 5 July 2014
Keywords:Carbon-coated SnO2/graphene compositeCalcinationCycling stabilityConjugated systemLithium-ion batteries
a b s t r a c t
Carbon-coated SnO2/graphene (SnO2-C/GN) composites with high electrochemical performance areprepared via hydrothermal method followed by a facile calcination at different temperatures. The effectsof calcination temperature on the structure and morphology as well as electrochemical behavior ofsynthesized SnO2-C/GNs are systematically investigated by X-ray diffraction, Fourier transform infraredspectrometry, transmission electron microscopy, and related electrochemical performance tests. Theresults show that the as-made SnO2-C/GNs calcined at 500 �C has the smallest charge transfer resistance,the largest lithium ion diffusion coefficient and the best cycling stability, exhibiting a stable capacity of460 mAh g�1 even after 120 cycles at a current density of 200 mA g�1. The simple calcination processwith proper temperature can effectively promote the uniformity of dispersed SnO2 nanoparticles andthe formation of an excellent conjugated system with high electrical conductivity by graphene andhomogeneous carbon, which contribute to the improved electrochemical properties of as-madeSnO2-C/GNs.
� 2014 Elsevier B.V. All rights reserved.
1. Introduction
Lithium-ion batteries (LIBs), with high electromotive force, highenergy density, and long cycle life, have attracted considerableresearch interest during the past decades [1–3]. Among numerousanode materials of LIBs, tin oxide (SnO2) is considered to be one ofthe most promising anode materials because of its nontoxicity, lowcost, good safety and high theoretical capacity of 782 mAh g�1
based on an alloying mechanism [4–7]. Unfortunately, the practicalapplications of SnO2 in LIBs are restricted owing to severe volumevariation (around 300%) during the alloying/de-alloying processes,which results in critical mechanical damage to Sn-based elec-trodes, and leads to a drastic loss of capacity [8–10].
In order to overcome these obstacles, various methods havebeen proposed [11–16]. Hybridizing SnO2 with homogeneous car-bon at nanoscale is an effective method to accommodate the strainof volume change during cyclic process, and the carbon coatinglayer also can enhance the conductivity of anodes [11,17–19].Graphene (GN), an atomic single layer of honeycomb carbonlattice, has been considered as an ideal supporting material tofunctionalize the carbon-coated SnO2/graphene (SnO2-C/GN)
[17,20,21] or SnO2/graphene [22–24] due to its outstandingelectrical conductivity, excellent mechanical flexibility, largespecific surface area, and high thermal and chemical stabilities.
Calcination also has a significant effect on the structure, particlesize, and morphology of carbon materials as well as the formationof conductivity networks [25–27]. It is noted that calcination tem-perature plays important role on the structure and performance offinal samples. On one hand, the reduction of graphene oxide (GO)and construction of covalent frameworks are hard to occur atlow calcined temperature. On the other hand, severe agglomera-tion of SnO2 nanoparticles (NPs) distributed on carbon substrateswould happen at high calcined temperature. The both factors havea great influence on the electrochemical performances of SnO2-C/GNs as LIBs anode. Therefore, the calcination temperature needsto be systematically explored in order to obtain the optimalelectrode material with excellent electrochemical property. Tothe best of our knowledge, the effect of calcination, especially therole of calcined temperature on the structure and electrochemicalperformance of SnO2-C/GNs as LIBs anode has not been sufficientlydiscussed.
In this work, polyvinyl alcohol (PVA) is adopted as carbonprecursor of the conductive matrix and graphene as coating carbonto synthesize SnO2-C/GNs followed by calcination at varioustemperatures. Herein, the effects of varied calcined temperatureon the structure and electrochemical property of SnO2-C/GNs are
G. Wu et al. / Journal of Alloys and Compounds 615 (2014) 582–587 583
systematically explored, aiming at precise control of the structureand conformation of SnO2-C/GNs, thereby obtaining SnO2-C/GNswith high electrochemical performance via facile calcinationtechnique.
2. Experimental
2.1. Preparation of SnO2-C/GN composites
All chemicals were of analytical grade and used as received, without furtherpurification. SnO2-C/GN nanocomposites were synthesized by hydrothermal andsubsequent calcination processes. In a typical process, graphite oxide was firstlysynthesized from graphite powder by a modified Hummers’ method [28]. 100 mggraphite oxide was added to 100 mL distilled water followed by sonication for2 h. The obtained suspension was labelled as solution A. Solution B was preparedby dissolving 3.0 g PVA in 100 mL of distilled water after 30 min of stirring.12.5 g SnCl4�5H2O was dissolved to the solution of 60 mL distilled water and 1 mLappropriate concentrated hydrochloric acid under stirring. The resultant solutionwas marked as solution C. Solution A was slowly injected into the mixture of solu-tions B and C, and its pH value was adjusted among 9–10 by injecting amounts ofammonium hydroxide (25.0–38.0 wt%). The above mixture was stirred sufficientlyin a water bath for 1 h at 85 �C and then dried at 100 �C for 24 h. The samples werecollected for the further calcination at 400 �C, 500 �C, and 600 �C under nitrogenatmosphere, and the resulting samples were denoted as SnO2-C/GN-400, SnO2-C/GN-500 and SnO2-C/GN-600, respectively. For a comparison, pure SnO2 (withoutadding GO and PVA) was synthesized by the same method as mentioned above.
2.2. Samples characterization
The crystal structures of samples were characterized by X-ray powder diffrac-tion (XRD) (X’Pert PRO MPD, Holland). Functional groups of samples were detectedby Fourier transform infrared spectrometry (FTIR) (Thermo Nicolet NEXUS 670,USA). The morphology of the as-prepared samples was investigated by transmissionelectron microscopy (TEM) (JEM-2100UHR, Japan). The thermal properties of thesamples were characterized by thermogravimetric analysis (TGA) (STA 409 PC Luxx,Germany).
2.3. Electrochemical measurements
To measure the electrochemical performance, the electrodes were prepared bycoating the slurry of the active material powders, acetylene black, and poly(vinyli-dene) fluoride (PVDF) binder (80:10:10 in weight ratio) dissolved in N-methyl-2-pyrrolidinone (NMP) onto a Cu foil substrate. The electrodes were dried in a vacuumat 100 �C for 10 h, and then assembled into a half-battery (CR2032 coin type) withlithium foil as a counter electrode in an Ar-filled glove box. The electrolyte used was1 M LiPF6 in a 1:1 weight ratio ethylene carbonate (EC):dimethyl carbonate (DMC)solvent. The cells were galvanostatically charged–discharged in the potential range0.005–2.5 V vs. Li/Li+ at the current density of 200 mA g�1 on a Land CT2001A cycler.Cyclic voltammograms (CV) were performed using an Ametek PARSTAT4000electrochemistry workstation at 0.25 mV s�1 within the potential range of0.005–2.5 V. Electrochemical impedance spectroscopy (EIS) tests were alsomeasured on an Ametek PARSTAT4000 electrochemistry workstation in thefrequency range of 100 kHz to 10 mHz with AC voltage amplitude of 10 mV.
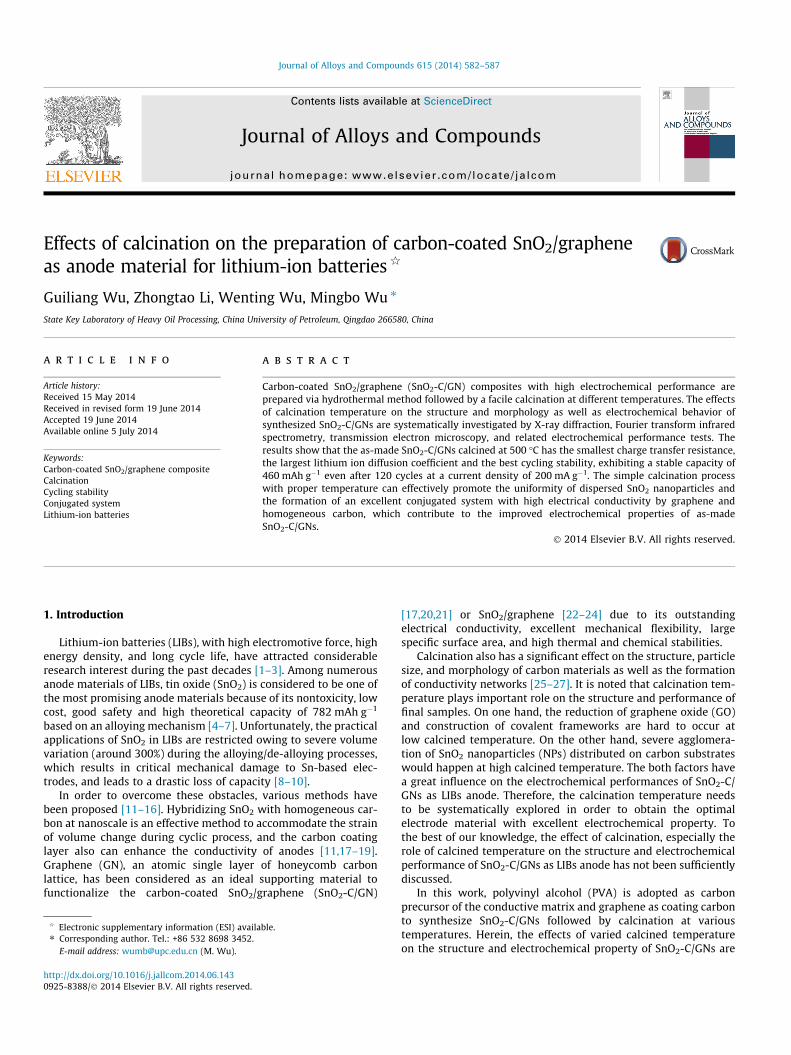
Fig. 1. Synthesis schematic of SnO2-C/GNs: (a) mixing sol
3. Results and discussion
Fig. 1 illustrates the synthesis procedure for SnO2-C/GNs. Whensolutions B and C are completely mixed, the injection of Sn4+ canintensely interact with hydroxide radicals on the PVA molecules,which is regarded as an excellent surface-active and dispersingagent. Then, with the assistance of PVA chains, the homogeneousdispersion of Sn4+ can be obtained. The introduced graphene oxide,with many oxygen-containing functional groups (e.g. ACOOH,AOH), can induce the PVA chains regular arrangement on the planeof graphene oxide via the interaction between functional groups.SnO2-C/GNs with different structure and morphology can beobtained after calcination at various temperatures.
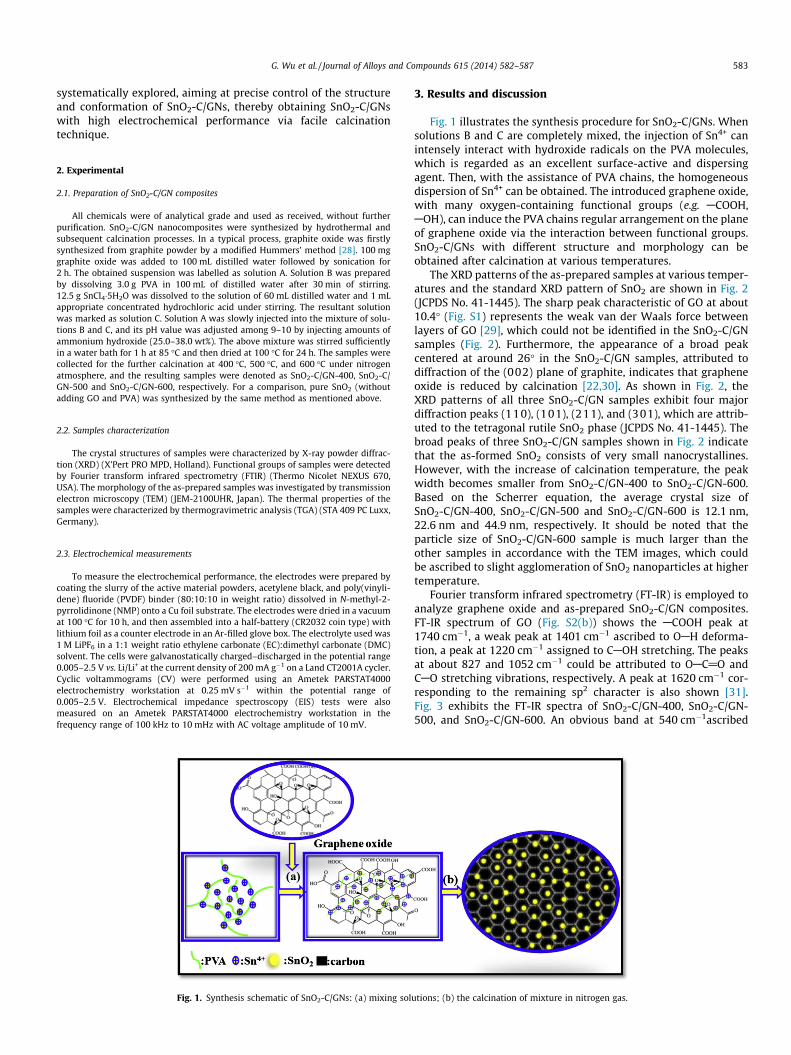
The XRD patterns of the as-prepared samples at various temper-atures and the standard XRD pattern of SnO2 are shown in Fig. 2(JCPDS No. 41-1445). The sharp peak characteristic of GO at about10.4� (Fig. S1) represents the weak van der Waals force betweenlayers of GO [29], which could not be identified in the SnO2-C/GNsamples (Fig. 2). Furthermore, the appearance of a broad peakcentered at around 26� in the SnO2-C/GN samples, attributed todiffraction of the (002) plane of graphite, indicates that grapheneoxide is reduced by calcination [22,30]. As shown in Fig. 2, theXRD patterns of all three SnO2-C/GN samples exhibit four majordiffraction peaks (110), (101), (211), and (301), which are attrib-uted to the tetragonal rutile SnO2 phase (JCPDS No. 41-1445). Thebroad peaks of three SnO2-C/GN samples shown in Fig. 2 indicatethat the as-formed SnO2 consists of very small nanocrystallines.However, with the increase of calcination temperature, the peakwidth becomes smaller from SnO2-C/GN-400 to SnO2-C/GN-600.Based on the Scherrer equation, the average crystal size ofSnO2-C/GN-400, SnO2-C/GN-500 and SnO2-C/GN-600 is 12.1 nm,22.6 nm and 44.9 nm, respectively. It should be noted that theparticle size of SnO2-C/GN-600 sample is much larger than theother samples in accordance with the TEM images, which couldbe ascribed to slight agglomeration of SnO2 nanoparticles at highertemperature.
Fourier transform infrared spectrometry (FT-IR) is employed toanalyze graphene oxide and as-prepared SnO2-C/GN composites.FT-IR spectrum of GO (Fig. S2(b)) shows the ACOOH peak at1740 cm�1, a weak peak at 1401 cm�1 ascribed to OAH deforma-tion, a peak at 1220 cm�1 assigned to CAOH stretching. The peaksat about 827 and 1052 cm�1 could be attributed to OAC@O andCAO stretching vibrations, respectively. A peak at 1620 cm�1 cor-responding to the remaining sp2 character is also shown [31].Fig. 3 exhibits the FT-IR spectra of SnO2-C/GN-400, SnO2-C/GN-500, and SnO2-C/GN-600. An obvious band at 540 cm�1ascribed
utions; (b) the calcination of mixture in nitrogen gas.
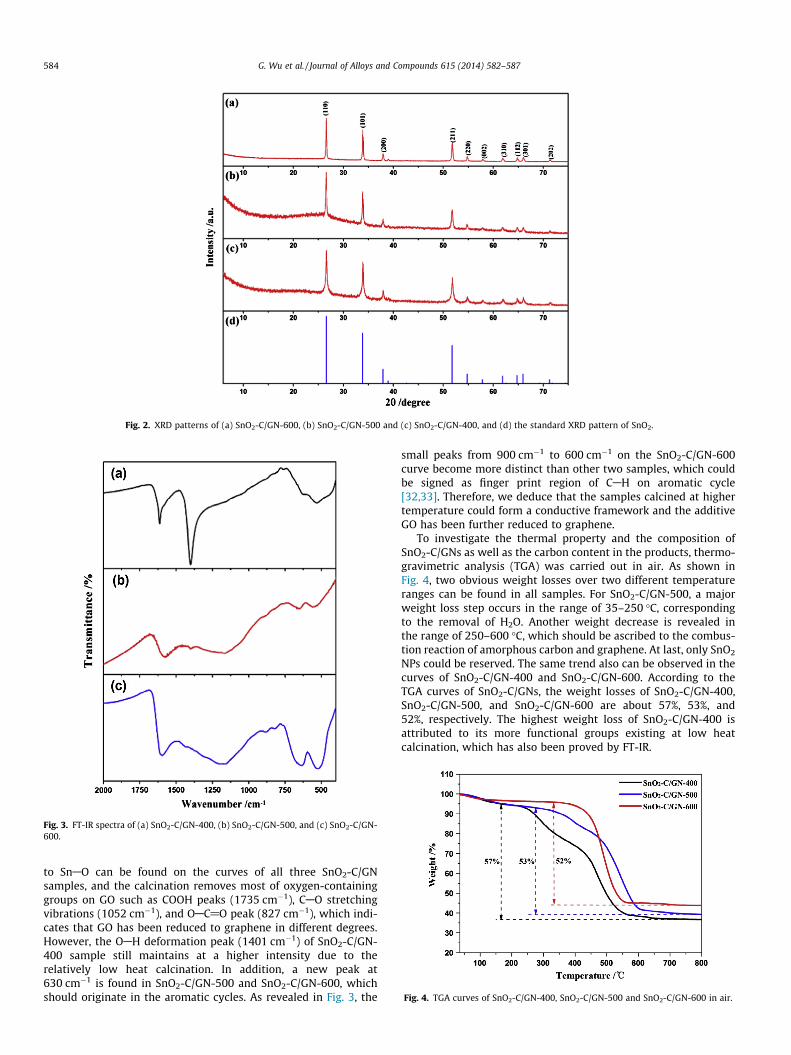
Fig. 2. XRD patterns of (a) SnO2-C/GN-600, (b) SnO2-C/GN-500 and (c) SnO2-C/GN-400, and (d) the standard XRD pattern of SnO2.
Fig. 3. FT-IR spectra of (a) SnO2-C/GN-400, (b) SnO2-C/GN-500, and (c) SnO2-C/GN-600.
Fig. 4. TGA curves of SnO2-C/GN-400, SnO2-C/GN-500 and SnO2-C/GN-600 in air.
584 G. Wu et al. / Journal of Alloys and Compounds 615 (2014) 582–587
to SnAO can be found on the curves of all three SnO2-C/GNsamples, and the calcination removes most of oxygen-containinggroups on GO such as COOH peaks (1735 cm�1), CAO stretchingvibrations (1052 cm�1), and OAC@O peak (827 cm�1), which indi-cates that GO has been reduced to graphene in different degrees.However, the OAH deformation peak (1401 cm�1) of SnO2-C/GN-400 sample still maintains at a higher intensity due to therelatively low heat calcination. In addition, a new peak at630 cm�1 is found in SnO2-C/GN-500 and SnO2-C/GN-600, whichshould originate in the aromatic cycles. As revealed in Fig. 3, the
small peaks from 900 cm�1 to 600 cm�1 on the SnO2-C/GN-600curve become more distinct than other two samples, which couldbe signed as finger print region of CAH on aromatic cycle[32,33]. Therefore, we deduce that the samples calcined at highertemperature could form a conductive framework and the additiveGO has been further reduced to graphene.
To investigate the thermal property and the composition ofSnO2-C/GNs as well as the carbon content in the products, thermo-gravimetric analysis (TGA) was carried out in air. As shown inFig. 4, two obvious weight losses over two different temperatureranges can be found in all samples. For SnO2-C/GN-500, a majorweight loss step occurs in the range of 35–250 �C, correspondingto the removal of H2O. Another weight decrease is revealed inthe range of 250–600 �C, which should be ascribed to the combus-tion reaction of amorphous carbon and graphene. At last, only SnO2
NPs could be reserved. The same trend also can be observed in thecurves of SnO2-C/GN-400 and SnO2-C/GN-600. According to theTGA curves of SnO2-C/GNs, the weight losses of SnO2-C/GN-400,SnO2-C/GN-500, and SnO2-C/GN-600 are about 57%, 53%, and52%, respectively. The highest weight loss of SnO2-C/GN-400 isattributed to its more functional groups existing at low heatcalcination, which has also been proved by FT-IR.
G. Wu et al. / Journal of Alloys and Compounds 615 (2014) 582–587 585
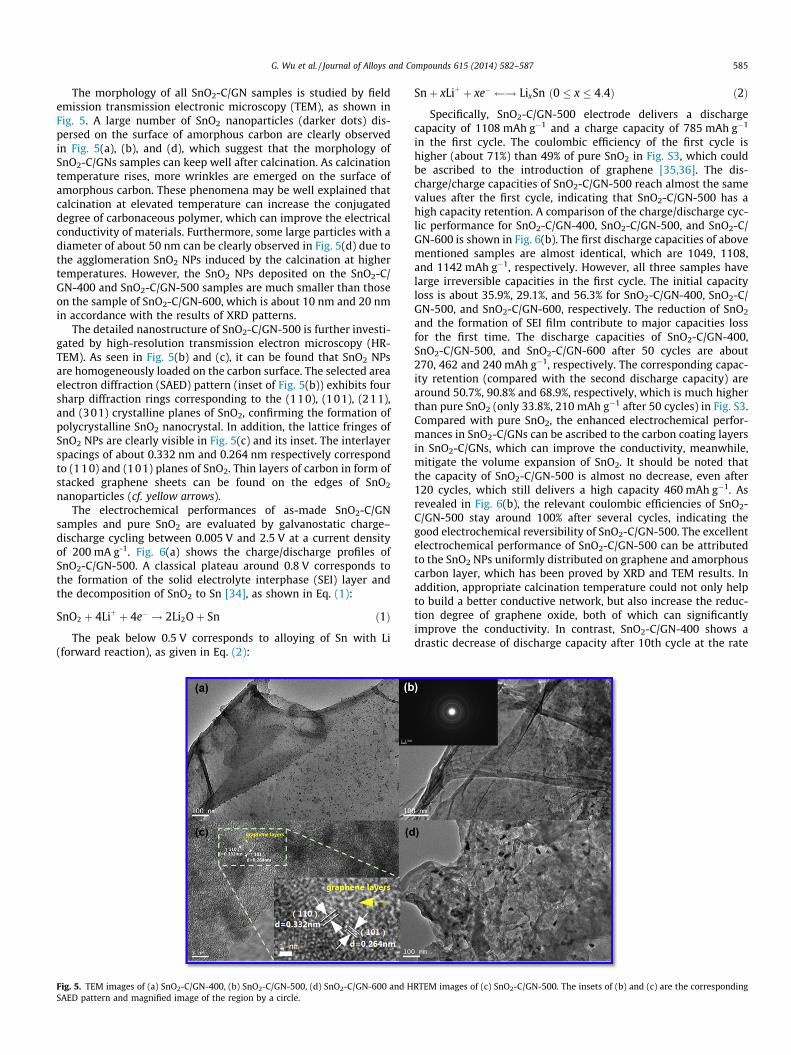
The morphology of all SnO2-C/GN samples is studied by fieldemission transmission electronic microscopy (TEM), as shown inFig. 5. A large number of SnO2 nanoparticles (darker dots) dis-persed on the surface of amorphous carbon are clearly observedin Fig. 5(a), (b), and (d), which suggest that the morphology ofSnO2-C/GNs samples can keep well after calcination. As calcinationtemperature rises, more wrinkles are emerged on the surface ofamorphous carbon. These phenomena may be well explained thatcalcination at elevated temperature can increase the conjugateddegree of carbonaceous polymer, which can improve the electricalconductivity of materials. Furthermore, some large particles with adiameter of about 50 nm can be clearly observed in Fig. 5(d) due tothe agglomeration SnO2 NPs induced by the calcination at highertemperatures. However, the SnO2 NPs deposited on the SnO2-C/GN-400 and SnO2-C/GN-500 samples are much smaller than thoseon the sample of SnO2-C/GN-600, which is about 10 nm and 20 nmin accordance with the results of XRD patterns.
The detailed nanostructure of SnO2-C/GN-500 is further investi-gated by high-resolution transmission electron microscopy (HR-TEM). As seen in Fig. 5(b) and (c), it can be found that SnO2 NPsare homogeneously loaded on the carbon surface. The selected areaelectron diffraction (SAED) pattern (inset of Fig. 5(b)) exhibits foursharp diffraction rings corresponding to the (110), (101), (211),and (301) crystalline planes of SnO2, confirming the formation ofpolycrystalline SnO2 nanocrystal. In addition, the lattice fringes ofSnO2 NPs are clearly visible in Fig. 5(c) and its inset. The interlayerspacings of about 0.332 nm and 0.264 nm respectively correspondto (110) and (101) planes of SnO2. Thin layers of carbon in form ofstacked graphene sheets can be found on the edges of SnO2
nanoparticles (cf. yellow arrows).The electrochemical performances of as-made SnO2-C/GN
samples and pure SnO2 are evaluated by galvanostatic charge–discharge cycling between 0.005 V and 2.5 V at a current densityof 200 mA g-1. Fig. 6(a) shows the charge/discharge profiles ofSnO2-C/GN-500. A classical plateau around 0.8 V corresponds tothe formation of the solid electrolyte interphase (SEI) layer andthe decomposition of SnO2 to Sn [34], as shown in Eq. (1):
SnO2 þ 4Liþ þ 4e� ! 2Li2Oþ Sn ð1Þ
The peak below 0.5 V corresponds to alloying of Sn with Li(forward reaction), as given in Eq. (2):
Fig. 5. TEM images of (a) SnO2-C/GN-400, (b) SnO2-C/GN-500, (d) SnO2-C/GN-600 and HSAED pattern and magnified image of the region by a circle.
Snþ xLiþ þ xe� ! LixSn ð0 � x � 4:4Þ ð2Þ
Specifically, SnO2-C/GN-500 electrode delivers a dischargecapacity of 1108 mAh g�1 and a charge capacity of 785 mAh g�1
in the first cycle. The coulombic efficiency of the first cycle ishigher (about 71%) than 49% of pure SnO2 in Fig. S3, which couldbe ascribed to the introduction of graphene [35,36]. The dis-charge/charge capacities of SnO2-C/GN-500 reach almost the samevalues after the first cycle, indicating that SnO2-C/GN-500 has ahigh capacity retention. A comparison of the charge/discharge cyc-lic performance for SnO2-C/GN-400, SnO2-C/GN-500, and SnO2-C/GN-600 is shown in Fig. 6(b). The first discharge capacities of abovementioned samples are almost identical, which are 1049, 1108,and 1142 mAh g�1, respectively. However, all three samples havelarge irreversible capacities in the first cycle. The initial capacityloss is about 35.9%, 29.1%, and 56.3% for SnO2-C/GN-400, SnO2-C/GN-500, and SnO2-C/GN-600, respectively. The reduction of SnO2
and the formation of SEI film contribute to major capacities lossfor the first time. The discharge capacities of SnO2-C/GN-400,SnO2-C/GN-500, and SnO2-C/GN-600 after 50 cycles are about270, 462 and 240 mAh g�1, respectively. The corresponding capac-ity retention (compared with the second discharge capacity) arearound 50.7%, 90.8% and 68.9%, respectively, which is much higherthan pure SnO2 (only 33.8%, 210 mAh g�1 after 50 cycles) in Fig. S3.Compared with pure SnO2, the enhanced electrochemical perfor-mances in SnO2-C/GNs can be ascribed to the carbon coating layersin SnO2-C/GNs, which can improve the conductivity, meanwhile,mitigate the volume expansion of SnO2. It should be noted thatthe capacity of SnO2-C/GN-500 is almost no decrease, even after120 cycles, which still delivers a high capacity 460 mAh g�1. Asrevealed in Fig. 6(b), the relevant coulombic efficiencies of SnO2-C/GN-500 stay around 100% after several cycles, indicating thegood electrochemical reversibility of SnO2-C/GN-500. The excellentelectrochemical performance of SnO2-C/GN-500 can be attributedto the SnO2 NPs uniformly distributed on graphene and amorphouscarbon layer, which has been proved by XRD and TEM results. Inaddition, appropriate calcination temperature could not only helpto build a better conductive network, but also increase the reduc-tion degree of graphene oxide, both of which can significantlyimprove the conductivity. In contrast, SnO2-C/GN-400 shows adrastic decrease of discharge capacity after 10th cycle at the rate
RTEM images of (c) SnO2-C/GN-500. The insets of (b) and (c) are the corresponding
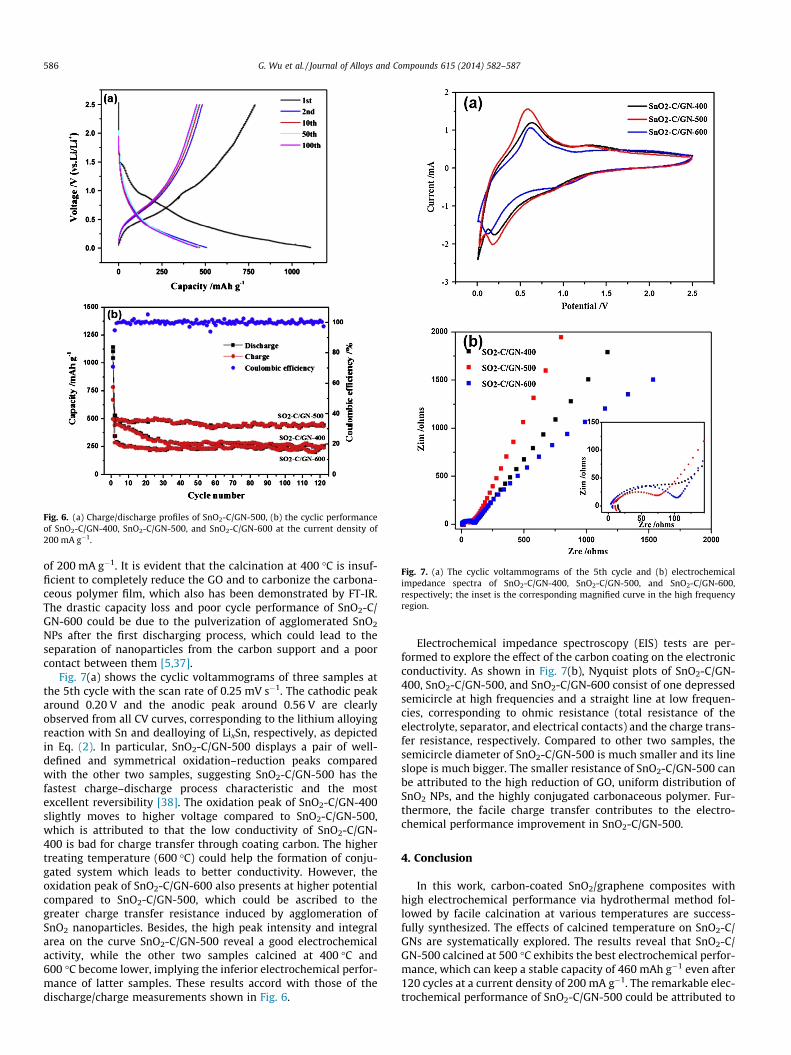
Fig. 6. (a) Charge/discharge profiles of SnO2-C/GN-500, (b) the cyclic performanceof SnO2-C/GN-400, SnO2-C/GN-500, and SnO2-C/GN-600 at the current density of200 mA g�1.
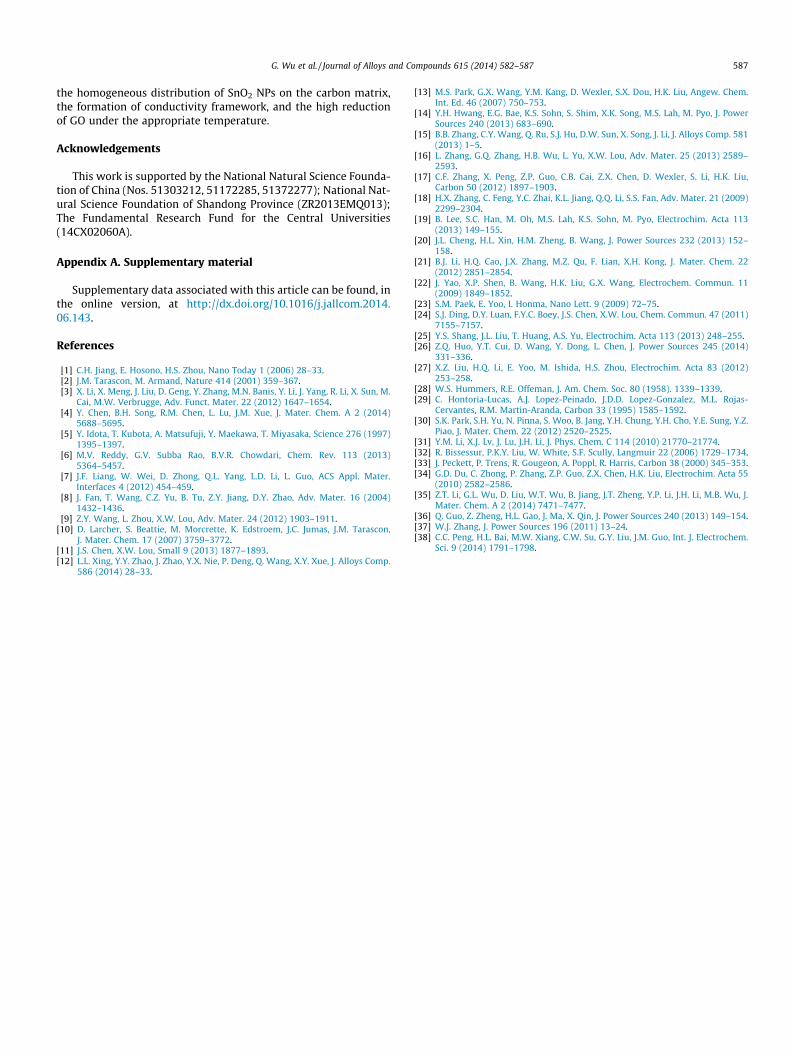
Fig. 7. (a) The cyclic voltammograms of the 5th cycle and (b) electrochemicalimpedance spectra of SnO2-C/GN-400, SnO2-C/GN-500, and SnO2-C/GN-600,respectively; the inset is the corresponding magnified curve in the high frequencyregion.
586 G. Wu et al. / Journal of Alloys and Compounds 615 (2014) 582–587
of 200 mA g�1. It is evident that the calcination at 400 �C is insuf-ficient to completely reduce the GO and to carbonize the carbona-ceous polymer film, which also has been demonstrated by FT-IR.The drastic capacity loss and poor cycle performance of SnO2-C/GN-600 could be due to the pulverization of agglomerated SnO2
NPs after the first discharging process, which could lead to theseparation of nanoparticles from the carbon support and a poorcontact between them [5,37].
Fig. 7(a) shows the cyclic voltammograms of three samples atthe 5th cycle with the scan rate of 0.25 mV s�1. The cathodic peakaround 0.20 V and the anodic peak around 0.56 V are clearlyobserved from all CV curves, corresponding to the lithium alloyingreaction with Sn and dealloying of LixSn, respectively, as depictedin Eq. (2). In particular, SnO2-C/GN-500 displays a pair of well-defined and symmetrical oxidation–reduction peaks comparedwith the other two samples, suggesting SnO2-C/GN-500 has thefastest charge–discharge process characteristic and the mostexcellent reversibility [38]. The oxidation peak of SnO2-C/GN-400slightly moves to higher voltage compared to SnO2-C/GN-500,which is attributed to that the low conductivity of SnO2-C/GN-400 is bad for charge transfer through coating carbon. The highertreating temperature (600 �C) could help the formation of conju-gated system which leads to better conductivity. However, theoxidation peak of SnO2-C/GN-600 also presents at higher potentialcompared to SnO2-C/GN-500, which could be ascribed to thegreater charge transfer resistance induced by agglomeration ofSnO2 nanoparticles. Besides, the high peak intensity and integralarea on the curve SnO2-C/GN-500 reveal a good electrochemicalactivity, while the other two samples calcined at 400 �C and600 �C become lower, implying the inferior electrochemical perfor-mance of latter samples. These results accord with those of thedischarge/charge measurements shown in Fig. 6.
Electrochemical impedance spectroscopy (EIS) tests are per-formed to explore the effect of the carbon coating on the electronicconductivity. As shown in Fig. 7(b), Nyquist plots of SnO2-C/GN-400, SnO2-C/GN-500, and SnO2-C/GN-600 consist of one depressedsemicircle at high frequencies and a straight line at low frequen-cies, corresponding to ohmic resistance (total resistance of theelectrolyte, separator, and electrical contacts) and the charge trans-fer resistance, respectively. Compared to other two samples, thesemicircle diameter of SnO2-C/GN-500 is much smaller and its lineslope is much bigger. The smaller resistance of SnO2-C/GN-500 canbe attributed to the high reduction of GO, uniform distribution ofSnO2 NPs, and the highly conjugated carbonaceous polymer. Fur-thermore, the facile charge transfer contributes to the electro-chemical performance improvement in SnO2-C/GN-500.
4. Conclusion
In this work, carbon-coated SnO2/graphene composites withhigh electrochemical performance via hydrothermal method fol-lowed by facile calcination at various temperatures are success-fully synthesized. The effects of calcined temperature on SnO2-C/GNs are systematically explored. The results reveal that SnO2-C/GN-500 calcined at 500 �C exhibits the best electrochemical perfor-mance, which can keep a stable capacity of 460 mAh g�1 even after120 cycles at a current density of 200 mA g�1. The remarkable elec-trochemical performance of SnO2-C/GN-500 could be attributed to
G. Wu et al. / Journal of Alloys and Compounds 615 (2014) 582–587 587
the homogeneous distribution of SnO2 NPs on the carbon matrix,the formation of conductivity framework, and the high reductionof GO under the appropriate temperature.
Acknowledgements
This work is supported by the National Natural Science Founda-tion of China (Nos. 51303212, 51172285, 51372277); National Nat-ural Science Foundation of Shandong Province (ZR2013EMQ013);The Fundamental Research Fund for the Central Universities(14CX02060A).
Appendix A. Supplementary material
Supplementary data associated with this article can be found, inthe online version, at http://dx.doi.org/10.1016/j.jallcom.2014.06.143.
References
[1] C.H. Jiang, E. Hosono, H.S. Zhou, Nano Today 1 (2006) 28–33.[2] J.M. Tarascon, M. Armand, Nature 414 (2001) 359–367.[3] X. Li, X. Meng, J. Liu, D. Geng, Y. Zhang, M.N. Banis, Y. Li, J. Yang, R. Li, X. Sun, M.
Cai, M.W. Verbrugge, Adv. Funct. Mater. 22 (2012) 1647–1654.[4] Y. Chen, B.H. Song, R.M. Chen, L. Lu, J.M. Xue, J. Mater. Chem. A 2 (2014)
5688–5695.[5] Y. Idota, T. Kubota, A. Matsufuji, Y. Maekawa, T. Miyasaka, Science 276 (1997)
1395–1397.[6] M.V. Reddy, G.V. Subba Rao, B.V.R. Chowdari, Chem. Rev. 113 (2013)
5364–5457.[7] J.F. Liang, W. Wei, D. Zhong, Q.L. Yang, L.D. Li, L. Guo, ACS Appl. Mater.
Interfaces 4 (2012) 454–459.[8] J. Fan, T. Wang, C.Z. Yu, B. Tu, Z.Y. Jiang, D.Y. Zhao, Adv. Mater. 16 (2004)
1432–1436.[9] Z.Y. Wang, L. Zhou, X.W. Lou, Adv. Mater. 24 (2012) 1903–1911.
[10] D. Larcher, S. Beattie, M. Morcrette, K. Edstroem, J.C. Jumas, J.M. Tarascon,J. Mater. Chem. 17 (2007) 3759–3772.
[11] J.S. Chen, X.W. Lou, Small 9 (2013) 1877–1893.[12] L.L. Xing, Y.Y. Zhao, J. Zhao, Y.X. Nie, P. Deng, Q. Wang, X.Y. Xue, J. Alloys Comp.
586 (2014) 28–33.
[13] M.S. Park, G.X. Wang, Y.M. Kang, D. Wexler, S.X. Dou, H.K. Liu, Angew. Chem.Int. Ed. 46 (2007) 750–753.
[14] Y.H. Hwang, E.G. Bae, K.S. Sohn, S. Shim, X.K. Song, M.S. Lah, M. Pyo, J. PowerSources 240 (2013) 683–690.
[15] B.B. Zhang, C.Y. Wang, Q. Ru, S.J. Hu, D.W. Sun, X. Song, J. Li, J. Alloys Comp. 581(2013) 1–5.
[16] L. Zhang, G.Q. Zhang, H.B. Wu, L. Yu, X.W. Lou, Adv. Mater. 25 (2013) 2589–2593.
[17] C.F. Zhang, X. Peng, Z.P. Guo, C.B. Cai, Z.X. Chen, D. Wexler, S. Li, H.K. Liu,Carbon 50 (2012) 1897–1903.
[18] H.X. Zhang, C. Feng, Y.C. Zhai, K.L. Jiang, Q.Q. Li, S.S. Fan, Adv. Mater. 21 (2009)2299–2304.
[19] B. Lee, S.C. Han, M. Oh, M.S. Lah, K.S. Sohn, M. Pyo, Electrochim. Acta 113(2013) 149–155.
[20] J.L. Cheng, H.L. Xin, H.M. Zheng, B. Wang, J. Power Sources 232 (2013) 152–158.
[21] B.J. Li, H.Q. Cao, J.X. Zhang, M.Z. Qu, F. Lian, X.H. Kong, J. Mater. Chem. 22(2012) 2851–2854.
[22] J. Yao, X.P. Shen, B. Wang, H.K. Liu, G.X. Wang, Electrochem. Commun. 11(2009) 1849–1852.
[23] S.M. Paek, E. Yoo, I. Honma, Nano Lett. 9 (2009) 72–75.[24] S.J. Ding, D.Y. Luan, F.Y.C. Boey, J.S. Chen, X.W. Lou, Chem. Commun. 47 (2011)
7155–7157.[25] Y.S. Shang, J.L. Liu, T. Huang, A.S. Yu, Electrochim. Acta 113 (2013) 248–255.[26] Z.Q. Huo, Y.T. Cui, D. Wang, Y. Dong, L. Chen, J. Power Sources 245 (2014)
331–336.[27] X.Z. Liu, H.Q. Li, E. Yoo, M. Ishida, H.S. Zhou, Electrochim. Acta 83 (2012)
253–258.[28] W.S. Hummers, R.E. Offeman, J. Am. Chem. Soc. 80 (1958). 1339–1339.[29] C. Hontoria-Lucas, A.J. Lopez-Peinado, J.D.D. Lopez-Gonzalez, M.L. Rojas-
Cervantes, R.M. Martin-Aranda, Carbon 33 (1995) 1585–1592.[30] S.K. Park, S.H. Yu, N. Pinna, S. Woo, B. Jang, Y.H. Chung, Y.H. Cho, Y.E. Sung, Y.Z.
Piao, J. Mater. Chem. 22 (2012) 2520–2525.[31] Y.M. Li, X.J. Lv, J. Lu, J.H. Li, J. Phys. Chem. C 114 (2010) 21770–21774.[32] R. Bissessur, P.K.Y. Liu, W. White, S.F. Scully, Langmuir 22 (2006) 1729–1734.[33] J. Peckett, P. Trens, R. Gougeon, A. Poppl, R. Harris, Carbon 38 (2000) 345–353.[34] G.D. Du, C. Zhong, P. Zhang, Z.P. Guo, Z.X. Chen, H.K. Liu, Electrochim. Acta 55
(2010) 2582–2586.[35] Z.T. Li, G.L. Wu, D. Liu, W.T. Wu, B. Jiang, J.T. Zheng, Y.P. Li, J.H. Li, M.B. Wu, J.
Mater. Chem. A 2 (2014) 7471–7477.[36] Q. Guo, Z. Zheng, H.L. Gao, J. Ma, X. Qin, J. Power Sources 240 (2013) 149–154.[37] W.J. Zhang, J. Power Sources 196 (2011) 13–24.[38] C.C. Peng, H.L. Bai, M.W. Xiang, C.W. Su, G.Y. Liu, J.M. Guo, Int. J. Electrochem.
Sci. 9 (2014) 1791–1798.