Embed Size (px)
Citation preview

Apidologie 38 (2007) 368–377 Available online at:c© INRA/DIB-AGIB/ EDP Sciences, 2007 www.apidologie.orgDOI: 10.1051/apido:2007022
Original article
Effects of Bt corn pollen on honey bees: emphasison protocol development*
Robyn Rosea, Galen P. Divelyb, Jeff Pettisc
a Biotechnology Regulatory Services, USDA, Animal and Plant Health Inspection Service, Unit 147, 4700 RiverRoad, Riverdale, MD 20737, USA
b Department of Entomology, University of Maryland, 4112 Plant Sciences Bldg., College Park, MD 20402, USAc Bee Research Laboratory, USDA, Agricultural Research Service, BLDG. 476, RM.100, BARC-EAST,
Beltsville, MD 20705, USA
Received 9 January 2006 – Revised 26 February 2007 – Accepted 28 February 2007
Abstract – Laboratory feeding studies showed no effects on the weight and survival of honey bees feedingon Cry1Ab-expressing sweet corn pollen for 35 days. In field studies, colonies foraging in sweet corn plotsand fed Bt pollen cakes for 28 days showed no adverse effects on bee weight, foraging activity, and colonyperformance. Brood development was not affected by exposure to Bt pollen but significantly reduced bythe positive insecticide control. The number of foragers returning with pollen loads, pollen load weight,and forager weight were the most consistent endpoints as indicators of foraging activity. Using variancesof measured endpoints, experimental designs required to detect a range of effect sizes at 80% statisticalpower were determined. Discussed are methods to ensure exposure to pollen, duration of exposure, positivecontrols, and appropriate endpoints to consider in planning laboratory and field studies to evaluate the non-target effects of transgenic pollen.
Apis mellifera / Cry1Ab / power analysis / transgenic plants / risk assessment
1. INTRODUCTION
Laboratory studies to assess potential non-target effects of Bt corn on honey bees, Apismellifera L., have involved feeding Bt pollenor purified endotoxin mixed with honey orsugar syrup directly to the larvae (Arpaia,1996;Malone et al., 1999; Hanley et al., 2003).These studies and others have indicated no ad-verse effects, however, the method of endo-toxin delivery has been questioned because itdoes not mimic the way pollen is naturallyprocessed and fed to larvae (Hilbeck et al.,2000). Furthermore, exposure to Bt pollencould have other direct and indirect non-targeteffects on brood development in a honey bee
Corresponding author: G.P. Dively,[email protected]*Manuscript editor: Jean-Noël Tasei
colony. For young bees, the presence of Bt pro-teins in ingested pollen may affect hypopha-ryngeal gland development and thus the abil-ity of nurse bees to make brood food. Effectson the orientation, foraging, and communi-cation behavioral activities could also impairthe ability of worker bees to find and relocatefood sources. Although experimental methodsare available for assessing behavioral changes(Pham-Delègue et al., 2002), these potentialsublethal effects of Bt corn have not been ad-dressed in current laboratory protocols. Thus,reliable experimental protocols that evaluatethe potential risks of Bt crops on honey beesare needed (Stark et al., 1995, Hilbeck et al.,2000). Reported here are results of both lab-oratory and field studies to assess the effectsof Bt pollen on honey bee survival, forag-ing activity, and colony performance. A ma-jor emphasis of this research was to identify
Article published by EDP Sciences and available at http://www.apidologie.org or http://dx.doi.org/10.1051/apido:2007022

Effects of Bt corn pollen on honey bees: emphasis on protocol development 369
reliable endpoints and experimental protocolsfor assessing effects with acceptable statisticalpower. Bt sweet corn expressing the Cry1Abprotein was chosen to represent worst-case ex-posure conditions because it produces greateramounts of pollen and is more attractive tohoney bees than field corn (Schur et al., 2000;Sommerville, 2001).
2. MATERIALS AND METHODS
2.1. Laboratory studies on adultsurvival and pollen consumption
No-choice dietary feeding studies were con-ducted in 2001 and 2002 to measure effects ofcorn pollen on development and survival of adulthoney bees. Cohorts of newly-emerged bees werefed a diet of Bt pollen from sweet corn hybrid At-tribute GSS0966 (Syngenta Seeds, Golden Valley,MN; event Bt11) and non-Bt pollen from an iso-line (Syngenta Seeds; Prime Plus). Corn pollen wascollected from plant tassels in the field, and storedat –80 ◦C until initiation of the study. Bee cohortswere provided access to pollen, sugar syrup and wa-ter sources in small wooden cages (11 cm × 9 cm ×7 cm) with a sliding glass front, which allowed dailycounting and removal of dead bees. Cages werekept in an incubator at 34 ◦C, 50% RH, and 24 hof dark. Bee mortality was recorded daily and thebody weights of ten randomly selected bees wererecorded on day 10.
In 2001, Bt, non-Bt, and mixed pollen (frompollen traps) diets were fed to newly emerged bees(<24 h old). Six replicate cages were assigned toeach diet treatment. Each cage contained 60 beesrandomly selected from one of six source colonies.Two grams of powdered pollen in an artificial plas-tic comb were placed in each cage on days 0, 5 and10. Small plastic lures with queen pheromone (BeeBoost, Pherotech Inc, Delta B.C., Canada) wereplaced in cages to simulate the presence of a queen.The amount of pollen consumed was determined ondays 5, 10 and 26 for each treatment cage by weigh-ing pollen before and after introduction.
In 2002, cohorts of 50 newly emerged bees fromten source colonies were evenly allocated to threesets of 10 replicate cages. Treatments of Bt pollen,non-Bt pollen, or non-Bt pollen treated imidaclo-prid (Admire 2F, Bayer CropSciences, ResearchTriangle, NC) were assigned to each replicate set.The pollen types were mixed with honey to increase
consumption and were provided on days 0, 7, 14 as5 g cakes (80% pollen and 20% honey w/w). Imida-cloprid was added to the non-Bt pollen at the rate of200 μg per kg of cake. The difference in weights ofpollen cakes before and after introduction was de-termined on days 7, 14 and 21.
2.2. Field studies on colony activityand development
In 2002 four 65 m × 65 m (0.4 ha) replicate plotsof Bt hybrid Attribute GSS0966 (Syngenta Seeds)and its non-Bt isoline Prime Plus were planted atleast 300 m apart from each other at University ofMaryland Research facilities. Two plots of non-Btsweet corn were also planted for positive controlcolonies exposed to imidacloprid.
Packages of 900 g of bees (approximately10 000) were obtained from a commercial supplier(Wilbanks Apiaries; Claxton, GA, USA) and usedto establish colonies for 5–6 weeks prior to ini-tiation of the field study. Sister queens from thesame breeding line were used in these colonieswhich were established in nucleus hives with fourbrood frames and one foundation frame to allowfor expansion. Two weeks prior to anthesis, hiveswere opened to visually assess and equalize beeand brood densities. Seven days prior to anthesis,three hives were randomly selected and placed onwooded pallets over a 3 m × 4 m tarp in a clearedarea at the center of each plot. During the eveningof the same day, each hive was opened and sides ofeach comb with bees were photographed with a dig-ital camera. Bees were then dislodged into the hivebox and each comb photographed a second time toobtain pre-exposure images of brood, pollen, andhoney cells.
Colonies were allowed to forage for 4 weeks,which overlapped the period of anthesis. No pollenloads were trapped to avoid interference with thefunctioning of the nucleus hive. Each colony wasprovisioned with pollen cakes to increase the levelof exposure. Pollen was collected from plantswithin each respective plot and processed into 50 gcakes consisting of 2 parts pollen, 2 parts soy flour,2 parts honey, and 1 part sugar by weight. Pollencakes containing either 10, 100 or 1000 μg of im-idacloprid per kg of cake were assigned to one ofthe three hives in each positive control plot. Con-centrations were based on studies conducted to as-sess the impact of imidacloprid on honey bee be-havior in France (Schmuck, 1999). Four cakes were

370 R. Rose et al.
placed directly on the top of the frames in each hiveonce or twice weekly to allow bees ad libitum ac-cess. Records were kept on the weight of pollencakes consumed by each colony.
Hives were observed three times weekly duringthe exposure period to record the number of for-aging bees returning to the hive, with and withoutpollen pellets, over a 5-min. period between 0900and 1100 h. Weights of foraging bees and theirpollen loads were measured once weekly from asample of 10 bees returning to hives. At the endof the exposure period, combs of each hive wereagain photographed to obtain post-exposure imagesof bee strength, brood development, and stores offood. The percentage of bees covering each comb,and the percentage of capped brood, pollen andhoney cells were visually estimated to the nearest10% from matching pre- and post-exposure imagesdisplayed on a computer monitor with a grid over-lay. An actual count of bees was also recorded onrepresentative grid sections showing 10 to 100% ofthe area covered with bees. This data set was usedto compute a linear regression function to estimatethe total number of bees per hive from the averagepercentage of combs covered with bees.
2.3. Statistical analysis
All data sets were tested before analysis for nor-mality and homogeneity of variances using Spear-man Rank Correlation and Shapiro-Wilk tests. Fordata not meeting the assumptions of ANOVA, anappropriate transformation was used or varianceswere grouped prior to analysis. Foraging data wereanalyzed as individual observations or as an av-erage of weekly observations. Data on number ofbees, and percentage of capped brood, pollen andhoney cells were analyzed as differences betweenpre- and post-exposure conditions within each hive.The mean of the three hives per replicate plot wereanalyzed as the experimental unit, including thehives exposed to different doses of imidacloprid.The PROCMIXED procedure of ANOVAwas usedto test for main and interaction effects for each end-point. The repeated measures option was used fortime series data to correct for intercorrelation be-tween sampling dates. Means were separated fol-lowing a significant F test by using the Tukey’s mul-tiple comparison adjustment (P < 0.05). Contrasttests were performed to compare specific pollendiets individually or grouped. A variance compo-nent analysis (PROC MIXED Option CL) was con-
ducted on specific endpoints to estimate the vari-ance at each level of the experimental design.
A retroactive power analysis using PASS2000(Hintze, 2001) was performed using variance datato determine the number of replicates and subsam-ples (i.e. bees per cage, hives per plot) requiredto detect a range of effect sizes at 80% statisticalpower. An 80% probability of rejecting a false nullhypothesis (Type II error) was chosen as the ac-cepted level of power for non-target risk assessmentstudies (Candolfi et al., 2000).
3. RESULTS
3.1. Laboratory studies
Overall survival of bees in the 2001 study aver-aged 47.2% after feeding for 35 days and was notsignificantly affected by the pollen diets (Fig. 1).Differences in the amount of each pollen diet con-sumed per bee were not the same over time (F =5.17; df = 4, 30; P = 0.003). Adult bees consumedmore mixed pollen than corn pollen but this pref-erence declined significantly as the bees aged andapparently utilized less pollen in their diet. Beesfed non-Bt, Bt, and mixed corn pollen weighed126.6 ± 6.7, 137.4 ± 3.6, and 139.6 ± 2.2 mg, re-spectively, but differences were not statistically sig-nificant (P = 0.13).
In the 2002 study, survival of bees fedimidacloprid-treated pollen cakes was significantlyreduced, particularly during the first five days, butthere was no difference in the survival of bees fedBt and non-Bt pollen (F = 1.92; df = 40, 460;P < 0.001) (Fig. 2). The average survival at 21 daysfor the non-Bt exposed bees was 71.4 ± 20.6%. Be-cause the variance was relatively low, power anal-ysis indicated that ten cohorts of 50 bees per treat-ment can detect a 35% difference in survival with80% statistical power, assuming a one-tailed signif-icance level of 0.05.
As expected the amount of pollen ingested perbee was higher than the amount consumed by beesin the 2001 study. Differences in pollen consump-tion were statistically significant among pollen di-ets (F = 10.43, df = 2, 15.9; P = 0.001) (Fig. 2).More non-Bt than Bt pollen was consumed per beebut there was no difference between the non-Btand imidacloprid-exposed bees. This result differedfrom the 2001 study that indicated no difference inBt than non-Bt pollen consumption. Differences inpollen consumption and diets had no effect on beeweight.
Effects of Bt corn pollen on honey bees: emphasis on protocol development 371
Figure 1. Survival and pollen consumption of honey bees fed Bt and non-Bt sweet corn, and mixed pollenfrom natural sources for 35 days in a no-choice laboratory study conducted in 2001. Mean bars with S.D.bearing the same letter are not significantly different at the 5% probability level.
3.2. Field Study
3.2.1. Foraging activity
Exposure of bees to sweet corn plots and pollencakes had no significant effect on foraging activ-ity (P = 0.75) or the percentage of bees loadedwith pollen (P = 0.54). Noteworthy is the fact thatbees from the imidacloprid-exposed hives were for-aging at about the same level of activity but overall22% fewer bees were bringing back pollen, partic-ularly during the last week of exposure. Due to thelow replication, the percentage of foragers loadedwith pollen (14 to 29%) was not significantly dif-ferent among the three imidacloprid concentrations(P = 0.065). However, 50% fewer foragers fromhives exposed to the high rate of imidacloprid werereturning with pollen compared to foragers exposedto the lower doses.
Foraging bee weights averaged 80.1 ± 1.34,80.6 ± 2.45, and 77.4 ± 3.40 mg, and pollen loadsaveraged 8.6 ± 0.84, 7.7 ± 0.88, and 5.5 ± 0.57 mgfor hives exposed to Bt, non-Bt, and imidacloprid,respectively. There were no statistical differencesamong treatments. However, the overall weight ofpollen loads significantly increased over time (F =3.93; df = 2, 12; P = 0.049).
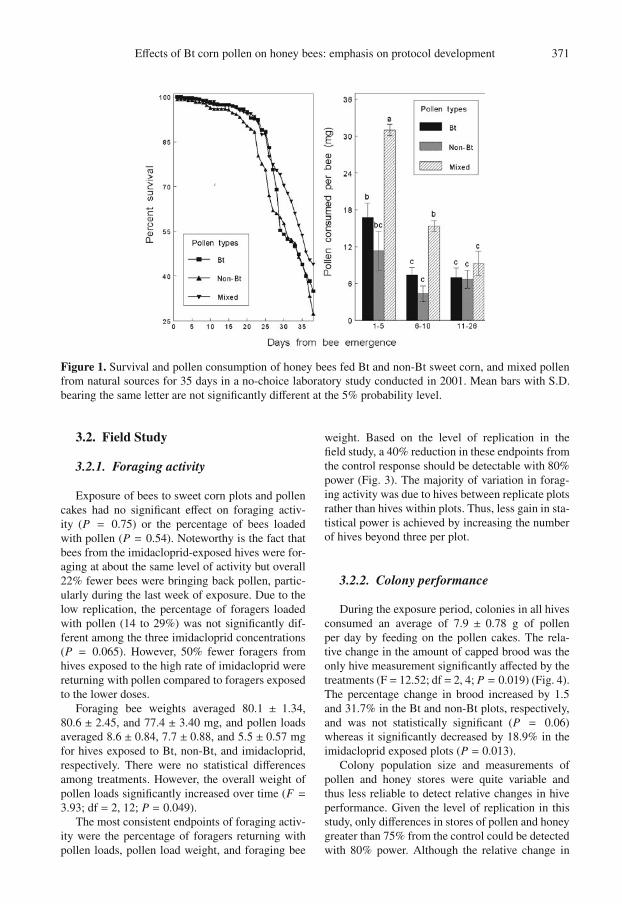
The most consistent endpoints of foraging activ-ity were the percentage of foragers returning withpollen loads, pollen load weight, and foraging bee
weight. Based on the level of replication in thefield study, a 40% reduction in these endpoints fromthe control response should be detectable with 80%power (Fig. 3). The majority of variation in forag-ing activity was due to hives between replicate plotsrather than hives within plots. Thus, less gain in sta-tistical power is achieved by increasing the numberof hives beyond three per plot.
3.2.2. Colony performance
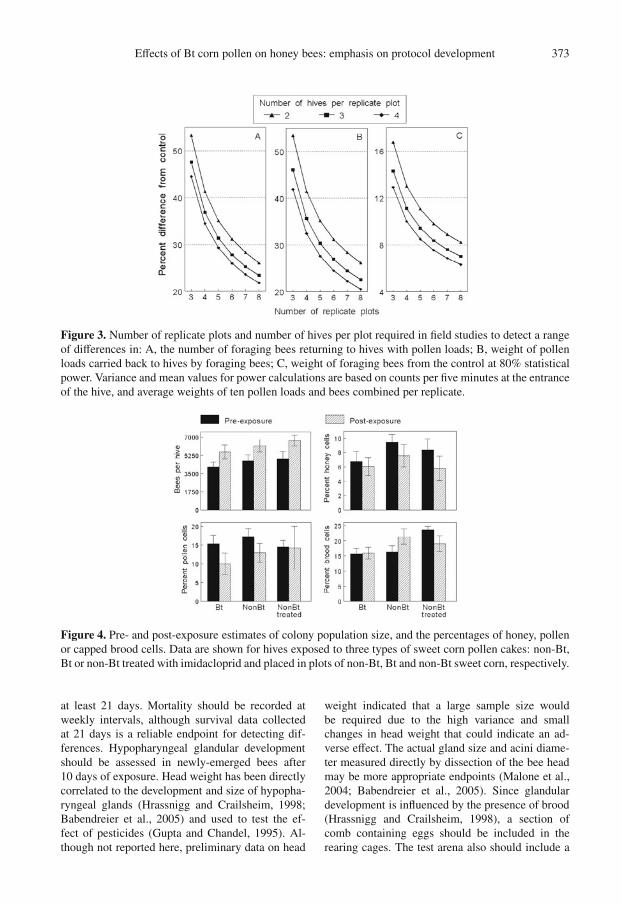
During the exposure period, colonies in all hivesconsumed an average of 7.9 ± 0.78 g of pollenper day by feeding on the pollen cakes. The rela-tive change in the amount of capped brood was theonly hive measurement significantly affected by thetreatments (F = 12.52; df = 2, 4; P = 0.019) (Fig. 4).The percentage change in brood increased by 1.5and 31.7% in the Bt and non-Bt plots, respectively,and was not statistically significant (P = 0.06)whereas it significantly decreased by 18.9% in theimidacloprid exposed plots (P = 0.013).
Colony population size and measurements ofpollen and honey stores were quite variable andthus less reliable to detect relative changes in hiveperformance. Given the level of replication in thisstudy, only differences in stores of pollen and honeygreater than 75% from the control could be detectedwith 80% power. Although the relative change in

372 R. Rose et al.
Figure 2. Survival and pollen consumption of bees fed Bt, non-Bt and treated sweet corn pollen for 20 daysin a no-choice laboratory study conducted in 2002. The treated pollen contained 200 μg of imidaclopridper kg of cake. Mean bars with S.D. bearing the same letter are not significantly different at the 5% proba-bility level.
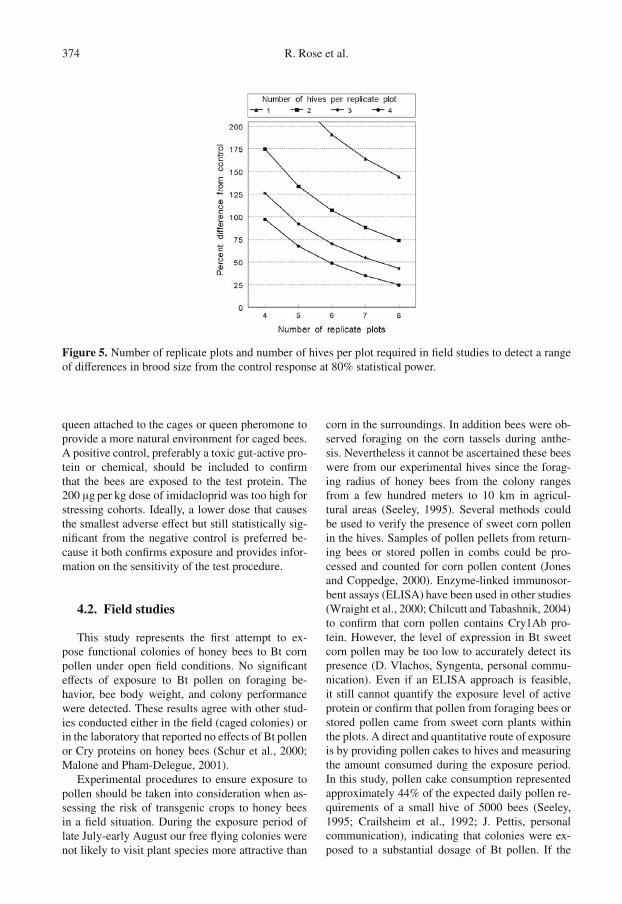
the percentage of capped brood cells was signifi-cantly affected by the positive control, this endpointwas also too variable to detect a 50% effect size with80% power. Given the variation in brood develop-ment, experimental designs to evaluate changes inbrood strength should include four hives in each ofsix replicate plots to detect a 50% difference fromthe control response (Fig. 5).
4. DISCUSSION
4.1. Laboratory studies
Dietary toxicity tests for Bt proteins have in-volved dosing larval honey bees with endotoxinsor Bt pollen (EPA, 2001) whereas in our study,newly emerged bees were fed different pollen typesfor up to 35 days to assess the effects on pollenconsumption and, survival. Bees consumed signif-icantly more mixed pollen than sweet corn pollenand more sweet corn pollen when it was mixedwith honey. Inconsistent results in pollen consump-tion were observed between the non-Bt and Bt co-horts of bees, which were probably due to differ-ences in pollen quality since the two types of sweetcorn pollen were not collected at the same time.Cry1Ab expression in pollen has been reported as<0.09 μg/g for event Bt11 field corn (EPA, 2000a).Considering this concentration as a realistic worst
case we presume our individual bees consumed onaverage 2.8 ng of toxin over 26 days in 2001 and6.2 ng over 21 days in 2002. This level of ex-perimental exposure was less than the 10 day ex-posures of purified endotoxins used in the labora-tory at 625 μg/g Cry1Ba and 10 μg/g Cry 1Ab byMalone et al. (2004) and Babendreier et al. (2005)respectively, who did not report negative effects onbee survival. All these studies are in agreementwith Hanley’s et al. results (2003) and EPA re-ports (2001) that indicated no adverse effects whenCry1Ab field corn pollen was fed directly to honeybee larvae in brood cells.
Based on our laboratory studies, the followingguidelines will aid in developing a protocol forassessing the effects of Bt corn pollen on newlyemerged bees. First, variance can be reduced andstatistical power increased by establishing replicatecohorts from a more homogenous pool of honeybees collected from one representative colony. Also,one-tailed testing will increase statistical power andis appropriate for survival data because only re-ductions relative to the control indicate a potentialrisk or the need for higher tier studies. Laboratorystudies to measure adult bee survival should test atleast six cohorts of 50 bees per treatment to de-tect a 50% reduction with 80% statistical power.To ensure maximum consumption and exposureto the expressed protein, fresh pollen should bemixed with honey and fed to cohorts of adults for
Effects of Bt corn pollen on honey bees: emphasis on protocol development 373
Figure 3. Number of replicate plots and number of hives per plot required in field studies to detect a rangeof differences in: A, the number of foraging bees returning to hives with pollen loads; B, weight of pollenloads carried back to hives by foraging bees; C, weight of foraging bees from the control at 80% statisticalpower. Variance and mean values for power calculations are based on counts per five minutes at the entranceof the hive, and average weights of ten pollen loads and bees combined per replicate.
Figure 4. Pre- and post-exposure estimates of colony population size, and the percentages of honey, pollenor capped brood cells. Data are shown for hives exposed to three types of sweet corn pollen cakes: non-Bt,Bt or non-Bt treated with imidacloprid and placed in plots of non-Bt, Bt and non-Bt sweet corn, respectively.
at least 21 days. Mortality should be recorded atweekly intervals, although survival data collectedat 21 days is a reliable endpoint for detecting dif-ferences. Hypopharyngeal glandular developmentshould be assessed in newly-emerged bees after10 days of exposure. Head weight has been directlycorrelated to the development and size of hypopha-ryngeal glands (Hrassnigg and Crailsheim, 1998;Babendreier et al., 2005) and used to test the ef-fect of pesticides (Gupta and Chandel, 1995). Al-though not reported here, preliminary data on head
weight indicated that a large sample size wouldbe required due to the high variance and smallchanges in head weight that could indicate an ad-verse effect. The actual gland size and acini diame-ter measured directly by dissection of the bee headmay be more appropriate endpoints (Malone et al.,2004; Babendreier et al., 2005). Since glandulardevelopment is influenced by the presence of brood(Hrassnigg and Crailsheim, 1998), a section ofcomb containing eggs should be included in therearing cages. The test arena also should include a
374 R. Rose et al.
Figure 5. Number of replicate plots and number of hives per plot required in field studies to detect a rangeof differences in brood size from the control response at 80% statistical power.
queen attached to the cages or queen pheromone toprovide a more natural environment for caged bees.A positive control, preferably a toxic gut-active pro-tein or chemical, should be included to confirmthat the bees are exposed to the test protein. The200 μg per kg dose of imidacloprid was too high forstressing cohorts. Ideally, a lower dose that causesthe smallest adverse effect but still statistically sig-nificant from the negative control is preferred be-cause it both confirms exposure and provides infor-mation on the sensitivity of the test procedure.
4.2. Field studies
This study represents the first attempt to ex-pose functional colonies of honey bees to Bt cornpollen under open field conditions. No significanteffects of exposure to Bt pollen on foraging be-havior, bee body weight, and colony performancewere detected. These results agree with other stud-ies conducted either in the field (caged colonies) orin the laboratory that reported no effects of Bt pollenor Cry proteins on honey bees (Schur et al., 2000;Malone and Pham-Delegue, 2001).
Experimental procedures to ensure exposure topollen should be taken into consideration when as-sessing the risk of transgenic crops to honey beesin a field situation. During the exposure period oflate July-early August our free flying colonies werenot likely to visit plant species more attractive than
corn in the surroundings. In addition bees were ob-served foraging on the corn tassels during anthe-sis. Nevertheless it cannot be ascertained these beeswere from our experimental hives since the forag-ing radius of honey bees from the colony rangesfrom a few hundred meters to 10 km in agricul-tural areas (Seeley, 1995). Several methods couldbe used to verify the presence of sweet corn pollenin the hives. Samples of pollen pellets from return-ing bees or stored pollen in combs could be pro-cessed and counted for corn pollen content (Jonesand Coppedge, 2000). Enzyme-linked immunosor-bent assays (ELISA) have been used in other studies(Wraight et al., 2000; Chilcutt and Tabashnik, 2004)to confirm that corn pollen contains Cry1Ab pro-tein. However, the level of expression in Bt sweetcorn pollen may be too low to accurately detect itspresence (D. Vlachos, Syngenta, personal commu-nication). Even if an ELISA approach is feasible,it still cannot quantify the exposure level of activeprotein or confirm that pollen from foraging bees orstored pollen came from sweet corn plants withinthe plots. A direct and quantitative route of exposureis by providing pollen cakes to hives and measuringthe amount consumed during the exposure period.In this study, pollen cake consumption representedapproximately 44% of the expected daily pollen re-quirements of a small hive of 5000 bees (Seeley,1995; Crailsheim et al., 1992; J. Pettis, personalcommunication), indicating that colonies were ex-posed to a substantial dosage of Bt pollen. If the

Effects of Bt corn pollen on honey bees: emphasis on protocol development 375
aim is to evaluate effects of worst case exposure, pu-rified Cry toxins should be incorporated into pollencakes and provisioned to hives as did Malone et al.(2001) and Huang et al. (2004) or into syrup accord-ing to Arpaia (1996) and Picard-Nizou et al. (1997).
An insecticide positive control was included inthis study to verify that bees and brood in the hiveswere exposed to the treatments. Dosage levels of 10,100 or 1000 μg/kg of imidacloprid incorporated intopollen cakes resulted in an overall 20% reductionin the number of brood cells, confirming that con-sumption of the pollen cakes was either adverselyaffecting the number of nurse bees or contaminat-ing brood food. However the minimum dose thatwould cause a detectable effect could not be deter-mined due to our design comprising one hive perdose in two replicate plots. Considering contradic-tory conclusions on imidacloprid concentrations re-sulting in no chronic effect (Maus et al., 2003) or insignificant effects on survival or behavior (Suchailet al., 2001; Ramirez-Romero et al., 2005), we sug-gest that a concentration of around 100 μg of imi-dacloprid per kg in pollen cakes may be a reason-able positive control. However a positive control isnot necessary if a maximum level of exposure to thetransgenic toxin is accurately measured.
Another important consideration in a non-targetfield study of honey bee colonies is the durationof the exposure. In this study, functional hiveswere exposed to Bt pollen for at least four weeksafter which hive performance was measured andcompared with pre-exposure levels. The exposureperiod could not be extended any longer due topossible confounding effects from physiologicalchanges in bees preparing for overwintering. How-ever, longer experimental durations may be moredesirable to detect possible delayed chronic effectsif the exposure period starts earlier in the summer.
Non-target field studies are often criticized be-cause the level of replication does not provideenough statistical power to detect potential differ-ences between the treatments and control. A gener-ally accepted aim in ecotoxicological studies is todetect a 50% difference relative to the control re-sponse with 80% statistical power (Candolfi et al.,2000). Using this as a standard, retrospective poweranalyses were conducted on each endpoint to de-termine the number of plots and hives needed todetect a range of effect sizes. Also, the power oftesting is dependent partly on the selection of rele-vant endpoints that are the most sensitive and con-sistent in response to non-target effects. Given thelevel of replication and the imperfect equalization
of hives at the beginning of our experiment, thenumber of foragers returning, hive population size,and measurements of pollen and honey stores weretoo variable to detect a 50% effect size. The mostconsistent endpoints were the number of foragersreturning with pollen loads, pollen load weight, andforaging bee weight. These endpoints can be usedas indicators of the ability of foraging bees to locatesources of pollen and return to the hive. Notewor-thy is that more statistical power is possible by fo-cusing on the number of bees returning with pollenloads rather than counting returning foragers, whichis the common indicator used in most foraging stud-ies. The power analyses showed that experimentaldesigns similar to the one used in this study shoulddetect a 40% reduction in foraging endpoints with80% power. For the colony performance endpoints,the analysis of differences between pre- and post-exposure conditions reduced the inherent variabil-ity to some degree. The percentage of capped broodcells as an indicator of queen health and brood de-velopment did not differ between the Bt and non-Bt treatments but was significantly reduced by thepositive control. However, in future studies, at leastfour hives placed in six replicate plots would beneeded to detect a 50% change in brood devel-opment with 80% statistical power. In field stud-ies with multiple endpoints measured, the level ofreplication and subsampling should be designed toachieve enough statistical power for detecting 50%changes in the most variable endpoint.
The EPA Scientific Advisory Panel held in 1999(EPA, 2000b) recommended that field studies beconducted as the most direct way to assess poten-tial non-target invertebrate impacts of planting Btcorn on a commercial scale This study has identi-fied several experimental design elements, sensitiveendpoints, and factors to consider in planning short-term field studies with open, functional hives toevaluate the non-target effects of transgenic pollen.Although there is no evidence thus far of any lethalor sublethal effects of the Bt proteins, insecticidalproducts expressed by other transgenes may needmore extended field testing on a case-by-case ba-sis (Malone and Pham-Delegue, 2001) to assess thelonger term consequences of sub-lethal changes incolonies and subtle modifications in bee behavior.
ACKNOWLEDGEMENTS
We thank Amy Miller, Terry Patton, KellyHaisfeld, Adam Oaks, Jenny Rochico, Jessica

376 R. Rose et al.
Nelson, Ben Falk, Heather Harmon, Kaitlin Nelson,Bridgette Bobwiec, and Mika Hunter for assistancein the conducting field studies, and Mike Embreyfor providing the bee colonies. Financial supportwas provided by the Maryland Agriculture Exper-iment Station and by a grant from the U.S. Environ-mental Protection Agency.
Les effets du pollen de maïs Bt sur les abeillesdomestiques : étude mettant l’accent sur la miseau point d’un protocole expérimental.
Apis mellifera / plante transgénique / évaluationrisque / Cry1Ab / analyse puissance statistique /survie / consommation pollen / comportementbutinage / performance colonie / étude en labo-ratoire / étude en champ
Zusammenfassung – Auswirkungen von Pollenvon Bt-Mais auf Honigbienen: Eine Untersu-chung mit Schwerpunkt auf der Entwicklungvon Versuchsprotokollen. Der Kontakt mit Pol-len von CryIAb-exprimierenden Maispflanzen, dieGene des Bodenbakteriums Bacillus thuringiensis(Bt) enthalten, kann direkte oder indirekte Auswir-kungen auf Honigbienen haben. Wir führten Labor-und Feldstudien durch, um mögliche Effekte vonPollen von Bt-Süssmais auf verschiedene Indikato-ren der Fitness und Volksleistung von Honigbienenzu erfassen. Die Laborstudien liessen keine Effek-te auf das Lebendgewicht und die Überlebensratenvon Bienen erkennen, die Bt-Pollen aufgenommenhatten (Abb. 1, 2). Der Zusatz von Honig erhöh-te die Aufnahme von Pollen unter Laborbedingun-gen. Auch in den Feldstudien war weder nach Auf-nahme von Pollen in Bt-Süssmaisparzellen nochnach Verzehr von Bt-Pollenkuchen über 28 Tagehinweg eine negative Auswirkung auf das Gewichtder Bienen, ihr Sammelverhalten oder auf die Ko-lonieleistung zu erkennen. Die beständigsten End-punktindikatoren für das Sammelverhalten warender Prozentsatz der mit Pollenhöschen zurückkeh-renden Sammlerinnnen, das Gewicht der Pollen-höschen und das Gewicht der Sammlerinnen. Ei-ne Reduktion in diesen Endpunkten um 40 % imVergleich zu den Kontrollen hätte bei den in die-ser Feldstudien zugrundegelegten Wiederholungenmit einer Wahrscheinlichkeit von 80 % erkennbarsein müssen (Abb. 3). Die Volksgrösse und die Mes-sungen der Pollen- und Honigvorräte waren hinge-gen mit ziemlichen Schwankungen verbunden undlieferten weniger verlässliche Indikatoren für dieVolksleistung. Unter den dieser Studie zugrundege-legtenWiederholungen wären nur Unterschiede vonüber 75 % in den entsprechenden Pollen- und Ho-nigvorräten mit einer Wahrscheinlichkeit von 80 %zu erkennen gewesen. Der Kontakt mit Bt-Pollenzeigte keine Effekte auf die Brutentwicklung. Die-se war jedoch in den positiven Kontrollen mit In-
sektizidkontakt (Imidacloprid) signifikant reduziert(Abb. 4). Angesichts der Unterschiede in der Brut-nestgrösse sollten Experimente, die die Beurteilungvon Auswirkungen auf die Brut zum Ziel haben, mitmindestens vier Völkern in jeder der sechs Repli-kaparzellen durchgeführt werden, wenn ein Unter-schied von 50% imVergleich zu Kontrollen erkenn-bar sein soll (Abb. 5). Wir diskutieren Methoden,die dazu beitragen sollen den Kontakt mit Pollen,die Kontaktdauer, die positiven Kontrollen, sowiedie angemessenen Endpunkte abzusichern. Diesesollten für die Planung von Labor- und Feldstudienzu Auswirkungen von transgenem Pollen auf Nicht-Zielorganismen von Nutzen sein.
Apis mellifera / Cry1Ab / Potenzanalyse / Trans-gene Pflanzen / Risikoabschätzung
REFERENCES
Arpaia S. (1996) Ecological impact of Bt-transgenicplants: Assessing possible effects of CryIIIB toxinon honey bees (Apis mellifera L.) colonies, J.Genet. Breed. 50, 315–319.
Babendreier D., Kalberer N.M., Romeis J., Fluri P.,Mulligan E., Bigler F. (2005) Influence of Bt-transgenic pollen, Bt-toxin and protease inhibitor(SBTI) ingestion on development of the hypopha-ryngeal glands in honeybees, Apidologie 36, 585–594.
Candolfi M.P., Bluemel S., Forester R., Bakker F.M.,Grimm C., Hassan S.A., Heimbach U., Mead-Briggs M.A., Reber B., Schmuck R., Vogt H.(2000) Guidelines to evaluate side-effects ofplant protection products to non-target arthropods:IOBC, BART and EPPO joint initiative, 158 p.
Chilcutt C.F., Tabashnik B.E. (2004) Contamination ofrefuges by Bacillus thuringiensis toxin genes fromtransgenic corn, Proc. Natl Acad. Sci. USA 101,7526–7529.
Crailsheim K., Schneider L.H.W., Hrassnigg N.,Buhlmann G., Brosch U., Gmeinbauer R.,Schoffmann B. (1992) Pollen consumption andutilization in worker honeybees (Apis melliferacarnica): dependence on individual age and func-tion, J. Insect Physiol. 38, 409–419.
Environmental Protection Agency (2000a) SAP re-port No. 99–06, Characterization and non tar-get organism data requirements for protein plantpesticides, http://www.epa.gov/scipoly/sap/1999/index.htm#december/backgrd1.pdf [online] (ac-cessed on 19 April 2007).
Environmental Protection Agency (2000b) BtPlant-Pesticides Biopesticides RegistrationAction Document, Science Assessment, http://www.epa.gov/oscpmont/sap/meetings/2000/october/brad2_scienceassessment.pdf [online] (accessedon 19 April 2007).

Effects of Bt corn pollen on honey bees: emphasis on protocol development 377
Environmental Protection Agency (2001) Bt Plant– Pesticides Biopesticides Registration ActionDocument, Environmental Assessment, http://www.epa.gov/oscpmont/sap/meetings/2000/october/brad3_enviroassessment.pdf [online] (accessedon 19 April 2007).
Gupta P.R., Chandel R.S. (1995) Effects of difluben-zuron and penfluron on workers of Apis cerana-indica F. and Apis mellifera L., Apidologie 26,3−10.
Hanley A.V., Huang Z.Y., Pett W.L. (2003) Effects ofdietary transgenic Bt corn pollen on larvae of Apismellifera and Galleria mellonella, J. Apic. Res.42, 77–81.
Hilbeck A., Meier M.S., Raps A. (2000) Review onNon-Target Organisms and Bt-Plants, EcoStratGmbH (Ecological Technology Assessment &Environmental Consulting), Report to GreenpeaceInternational, Amsterdam, 77 p.
Hintze J. (2001) NCSS and PASS, Number cruncherstatistical systemsTM, Kaysville, Utah, [online]http://www.ncss.com (accessed on 19 April 2007).
Hrassnigg N., Crailsheim K. (1998) Adaptation of hy-popharyngeal gland development to the brood sta-tus of honeybee (Apis mellifera L.) colonies, J.Insect Physiol. 44, 929–939.
Huang Z.Y., Hanley A.V., Pett W.L., Langenberger M.,Duan J.J. (2004) Field and semifield evaluationof impacts of transgenic canola pollen on survivaland development of worker honey bees, J. Econ.Entomol. 97, 1517–1523.
Jones G.D., Coppedge J.R. (2000) Foraging resourcesof adult Mexican corn rootworm (Coleoptera:Chrysomelidae) in Bell County, Texas, J. Econ.Entomol. 93, 636–643.
Malone L.A., Pham-Delègue M.H. (2001) Effects oftransgenic products on honey bees (Apis mellif-era) and bumblebees (Bombus sp.), Apidologie32, 287–304.
Malone L.A., Burgess E.P.J., Stefanovic D. (1999)Effects of a Bacillus thuringiensis toxin, twoBacillus thuringiensis biopesticide formulations,and a soybean trypsin inhibitor on honey bee(Apis mellifera L.) survival and food consumption,Apidologie 30, 465–473.
Malone L.A., Burgess E.P.J., Gatehouse H.S., VoiseyC.R., Tregidga E.L., Philip B.A. (2001) Effects ofingestion of a Bacillus thuringiensis toxin and atrypsin inhibitor on honey bee flight activity andlongevity, Apidologie 32, 57–68.
Malone L.A., Todd J.H., Burgess E.P.J., Christeller J.T.(2004) Development of hypopharyngeal glands in
adult honey bees fed with a Bt toxin, a biotin bind-ing protein and a protease inhibitor, Apidologie35, 655–664.
Maus C., Curé G., Schmuck R. (2003) Safety of imi-dacloprid seed dressings to honey bees: a compre-hensive overview and compilation of the currentstate of knowledge, Bull. Insectology 56, 51–57.
Pham-Delègue M.H., Decourtye A., Kaiser L.,Devillers J. (2002) Behavioural methods to assessthe effects of pesticides on honey bees, Apidologie33, 425–432.
Picard-Nizou A.L., Grison R., Olsen L., Pioche C.,Arnold G., Pham-Delegue M.H. (1997) Impact ofproteins used in plant genetic engineering: toxic-ity and behavioral study in the honeybee, J. Econ.Entomol. 90, 1710–1716.
Ramirez-Romero R., Chaufaux J., Pham-DelègueM.H. (2005) Effects of Cry1Ab protoxin,deltamethrin and imidacloprid on the foragingactivity and the learning performances of thehoneybee Apis mellifera, a comparative approach,Apidologie 36, 601–611.
Schmuck R. (1999) No causal relationship betweenGauchor© seed dressing in sunflowers and theFrench bee malady, Pflanzenschutz-NachrichtenBayer 52, 257–299.
Schur A., Tornier I., Neumann C. (2000) Assessmentof potential side effects of Bt-corn to the honeybee, Apis mellifera (Hymenoptera, Apidae) underfield conditions, Apidologie 31, 616–618.
Seeley T.D. (1995) TheWisdom of the Hive The SocialPhysiology of Honey Bee Colonies, HarvardUniversity Press, Cambridge Massachusetts,295 p.
Sommerville D.C. (2001) Nutritional value of bee col-lected pollens, a report for the Rural IndustriesResearch and Development, Corporation #01/047,NSW Agriculture Goulburn, NSW Kustry, 166 p.
Stark J.D., Jepson P.C., Mayer D.F. (1995) Limitationsto use of topical toxicity data for predictions ofpesticide side effects in the field, J. Econ. Entomol.88, 1081–1088.
Suchail S., Guez D., Belzunces L. (2001) Discrepancybetween acute and chronic toxicity I induced byimidacloprid and its metabolites in Apis mellifera,Environ. Toxicol. Chem. 20, 2482–2486.
Wraight C.L., Zangerl A.R., Carroll M.J., BerenbaumM.R. (2000) Absence of toxicity of Bacillusthuringiensis pollen to black swallowtails underfield conditions, Proc. Natl Acad. Sci. USA 97,7700–7703.