Embed Size (px)
Citation preview

See discussions, stats, and author profiles for this publication at: https://www.researchgate.net/publication/259095108
Effects of blunt trailing edge flow discharge in supersonic regime
Article in Computers & Fluids · December 2013
DOI: 10.1016/j.compfluid.2013.09.013
CITATIONS
4
READS
92
4 authors, including:
Some of the authors of this publication are also working on these related projects:
SOAR - diStributed Open-rotor AiRcraft View project
Noise prediction methods View project
Bayindir H Saracoglu
von Karman Institute for Fluid Dynamics
42 PUBLICATIONS 37 CITATIONS
SEE PROFILE
Guillermo Paniagua
Purdue University
220 PUBLICATIONS 768 CITATIONS
SEE PROFILE
All content following this page was uploaded by Bayindir H Saracoglu on 23 February 2015.
The user has requested enhancement of the downloaded file.
Computers & Fluids 88 (2013) 200–209
Contents lists available at ScienceDirect
Computers & Fluids
journal homepage: www.elsevier .com/locate /compfluid
Effects of blunt trailing edge flow discharge in supersonic regime
0045-7930 � 2013 Elsevier Ltd.http://dx.doi.org/10.1016/j.compfluid.2013.09.013
⇑ Corresponding author. Tel.: +32 2 359 96 53; fax: +32 2 359 96 00.E-mail address: [email protected] (B.H. Saracoglu).
Open access under CC BY-NC-SA license.
B.H. Saracoglu a,⇑, G. Paniagua a, J. Sanchez b, P. Rambaud a
a von Karman Institute for Fluid Dynamics, Chaussée de Waterloo 72, 1640 Rhode-Saint-Genèse, Belgiumb Universitat Politécnica de Valencia, Camino de Vera s/n, E-46022 Valencia, Spain
a r t i c l e i n f o
Article history:Received 2 July 2012Received in revised form 23 July 2013Accepted 11 September 2013Available online 19 September 2013
Keywords:Shock waveBlunt trailing edgeTrailing edge dischargeCoolingSupersonic flowBase pressureURANS
a b s t r a c t
Flow discharge at the blunt trailing edge of bodies immersed into supersonic stream alters significantlythe downstream aerodynamic characteristics. This paper studies the changes in the base region topologyfor a wide range of purge ejection, using Unsteady Reynolds Averaged Navier–Stokes solutions. At lowpurge rate the base pressure increases, resulting in a reduction of the trailing edge shock wave intensity.Supersonic purge flows diminishes the base pressure and thus strengthens the shock wave, a linear rela-tionship between the base pressure and the shock strength was obtained for the investigated conditions.Furthermore, an auxiliary shock wave system was observed to form upstream of the main fish tail shockat certain discharge rates.
� 2013 Elsevier Ltd. Open access under CC BY-NC-SA license.
1. Introduction
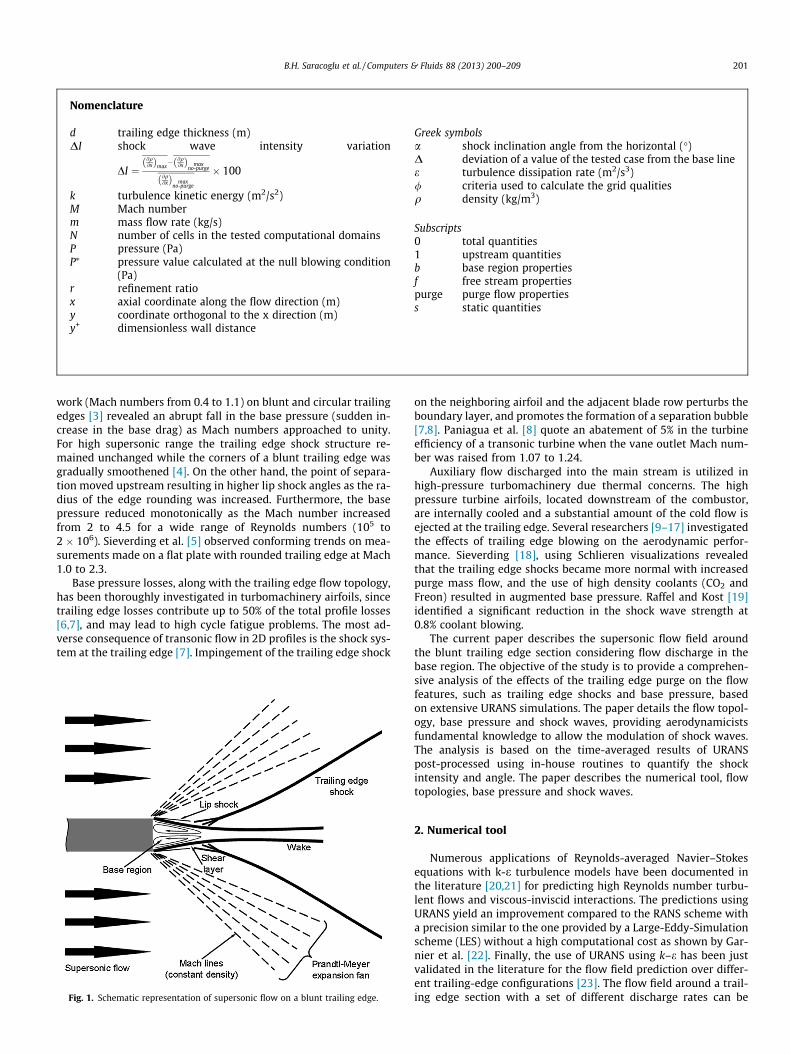
Improvements in lifespan and efficiency of aero-mechanicalsystems has steered research towards limiting detrimental aero-structural interactions. Such effects become significantly severewhen the internal flow velocities are beyond the speed of sound.When airfoils are submerged into supersonic passages, shockwaves are formed at the trailing edge, causing undesired pressureperturbations downstream. The subsequent unsteady forcing in-duced by the trailing edge shock waves on downstream rotatingairfoils leads to mechanical and thermal fatigue. These unfavorableinfluences could be alleviated through the modulation of the shockwaves. Understanding the trailing edge flow field is essential to re-veal the parameters affecting those pressure distortions. Fig. 1 rep-resents the flow topology at the trailing edge. Owing to Coandaeffect, upstream boundary layers remain attached at the trailingedge corner, separate immediately downstream and develop shearlayers. While simultaneously, the main flow accelerates through aPrandtl–Meyer expansion fan. The shear layers propagating down-stream from each side of the trailing edge unite at the point of con-fluence and merge into the wake. Preceding this point, enclosed bythe shear layers and the trailing edge, there is a dead air zone,where the low momentum and constant pressure flow recirculates.This area is often referred to as the base region, whose attributeshave strong influence on several features of surrounding flow filed,
namely the vortex shedding and compression waves. Conse-quently, the unsteady pressure and temperature field downstreamof the trailing edge is dominated by the base region characteristics.The compression process in supersonic trailing edge flows is com-monly observed in two stages. A weak and local compression wave,called separation or lip shock, is formed at the point of flow detach-ment in order to adapt the pressure gradient between the shearingflow and the downstream. Although the properties of the lip shockdepends on both the trailing edge geometry and free stream flowconditions, it is usually embedded into the shear layer and conse-quently it may not be visible. Further on, at the confluence point,the flow changes its direction notably and therefore it is forcedto compress through a system of strong trailing edge shocks. Thedegree of compression, hence the strength of the shock waves,highly depend on the base region properties.
Several analytical, numerical and experimental studies havebeen dedicated to understand the characteristics of the base flowsin multiple applications. The literature can be classified into threecategories: characterization of the base pressure – base drag onwing airfoils (2D) and projectiles (axisymmetric bodies); base pres-sure-shock losses in turbomachinery airfoils (2D), and effects oftrailing edge bleed on the base region.
The experimental review of Nash [1] showed that the base pres-sure in 2D supersonic flows increases with the boundary layermomentum thickness, and hence the base drag force decreases. Alater compilation [2] recorded the effect of the base pressure onthe point of vortex street formation, which leads to an additionaldrag. In conjunction with these studies, an extensive experimental
Nomenclature
d trailing edge thickness (m)DI shock wave intensity variation
DI ¼@q@xð Þmax
� @q@xð Þ max
no-purge
@q@xð Þ max
no-purge
� 100
k turbulence kinetic energy (m2/s2)M Mach numberm mass flow rate (kg/s)N number of cells in the tested computational domainsP pressure (Pa)P⁄ pressure value calculated at the null blowing condition
(Pa)r refinement ratiox axial coordinate along the flow direction (m)y coordinate orthogonal to the x direction (m)y+ dimensionless wall distance
Greek symbolsa shock inclination angle from the horizontal (�)D deviation of a value of the tested case from the base linee turbulence dissipation rate (m2/s3)/ criteria used to calculate the grid qualitiesq density (kg/m3)
Subscripts0 total quantities1 upstream quantitiesb base region propertiesf free stream propertiespurge purge flow propertiess static quantities
B.H. Saracoglu et al. / Computers & Fluids 88 (2013) 200–209 201
work (Mach numbers from 0.4 to 1.1) on blunt and circular trailingedges [3] revealed an abrupt fall in the base pressure (sudden in-crease in the base drag) as Mach numbers approached to unity.For high supersonic range the trailing edge shock structure re-mained unchanged while the corners of a blunt trailing edge wasgradually smoothened [4]. On the other hand, the point of separa-tion moved upstream resulting in higher lip shock angles as the ra-dius of the edge rounding was increased. Furthermore, the basepressure reduced monotonically as the Mach number increasedfrom 2 to 4.5 for a wide range of Reynolds numbers (105 to2 � 106). Sieverding et al. [5] observed conforming trends on mea-surements made on a flat plate with rounded trailing edge at Mach1.0 to 2.3.
Base pressure losses, along with the trailing edge flow topology,has been thoroughly investigated in turbomachinery airfoils, sincetrailing edge losses contribute up to 50% of the total profile losses[6,7], and may lead to high cycle fatigue problems. The most ad-verse consequence of transonic flow in 2D profiles is the shock sys-tem at the trailing edge [7]. Impingement of the trailing edge shock
Fig. 1. Schematic representation of supersonic flow on a blunt trailing edge.
on the neighboring airfoil and the adjacent blade row perturbs theboundary layer, and promotes the formation of a separation bubble[7,8]. Paniagua et al. [8] quote an abatement of 5% in the turbineefficiency of a transonic turbine when the vane outlet Mach num-ber was raised from 1.07 to 1.24.
Auxiliary flow discharged into the main stream is utilized inhigh-pressure turbomachinery due thermal concerns. The highpressure turbine airfoils, located downstream of the combustor,are internally cooled and a substantial amount of the cold flow isejected at the trailing edge. Several researchers [9–17] investigatedthe effects of trailing edge blowing on the aerodynamic perfor-mance. Sieverding [18], using Schlieren visualizations revealedthat the trailing edge shocks became more normal with increasedpurge mass flow, and the use of high density coolants (CO2 andFreon) resulted in augmented base pressure. Raffel and Kost [19]identified a significant reduction in the shock wave strength at0.8% coolant blowing.
The current paper describes the supersonic flow field aroundthe blunt trailing edge section considering flow discharge in thebase region. The objective of the study is to provide a comprehen-sive analysis of the effects of the trailing edge purge on the flowfeatures, such as trailing edge shocks and base pressure, basedon extensive URANS simulations. The paper details the flow topol-ogy, base pressure and shock waves, providing aerodynamicistsfundamental knowledge to allow the modulation of shock waves.The analysis is based on the time-averaged results of URANSpost-processed using in-house routines to quantify the shockintensity and angle. The paper describes the numerical tool, flowtopologies, base pressure and shock waves.
2. Numerical tool
Numerous applications of Reynolds-averaged Navier–Stokesequations with k-e turbulence models have been documented inthe literature [20,21] for predicting high Reynolds number turbu-lent flows and viscous-inviscid interactions. The predictions usingURANS yield an improvement compared to the RANS scheme witha precision similar to the one provided by a Large-Eddy-Simulationscheme (LES) without a high computational cost as shown by Gar-nier et al. [22]. Finally, the use of URANS using k–e has been justvalidated in the literature for the flow field prediction over differ-ent trailing-edge configurations [23]. The flow field around a trail-ing edge section with a set of different discharge rates can be
202 B.H. Saracoglu et al. / Computers & Fluids 88 (2013) 200–209
reproduced using URANS, with an adequate grid and computa-tional solver. In this section, the methodology validation, the solverand the grid selections are described.
2.1. Methodology validation
The numerical validation has been performed on a backwardfacing step due to the similarity with the trailing edge flow. Thetopology of the Prandtl–Meyer expansion fan, boundary layerdetachment (generating a shear layer between the supersonic flowand the subsonic recirculation region), wake lip and reattachmentshock waves are analogous for both geometries. The experimentalresults obtained by Smith [24] on a 2.5 Mach stream flowing over asupersonic rearward-facing step were used for the validation of thecurrent URANS approach. The geometry used in Smith’s experi-ments had a 0.0113 m step, and 0.1016 m upstream section forthe incoming boundary layer to develop. The downstream partwas kept 0.3048 m long to capture well the supersonic flow fea-tures. The numerical domain was enclosed with a slip wall0.1588 m above the step. The inlet total pressure and outlet staticpressure were set to 127,553 Pa and 7750 Pa respectively to matchthe experimental conditions at M = 2.5 and Re = 78.74 � 106/m.The inlet total temperature was 344 K. In the calculation, the fluiddomain was meshed using triangles with a non-uniform rectangu-lar boundary layer mesh close to the wall. To solve the laminarsublayer, y+ < 1 was kept for the incoming turbulent boundarylayer. The resulting 2D mesh consisted of 30,000 grid points.
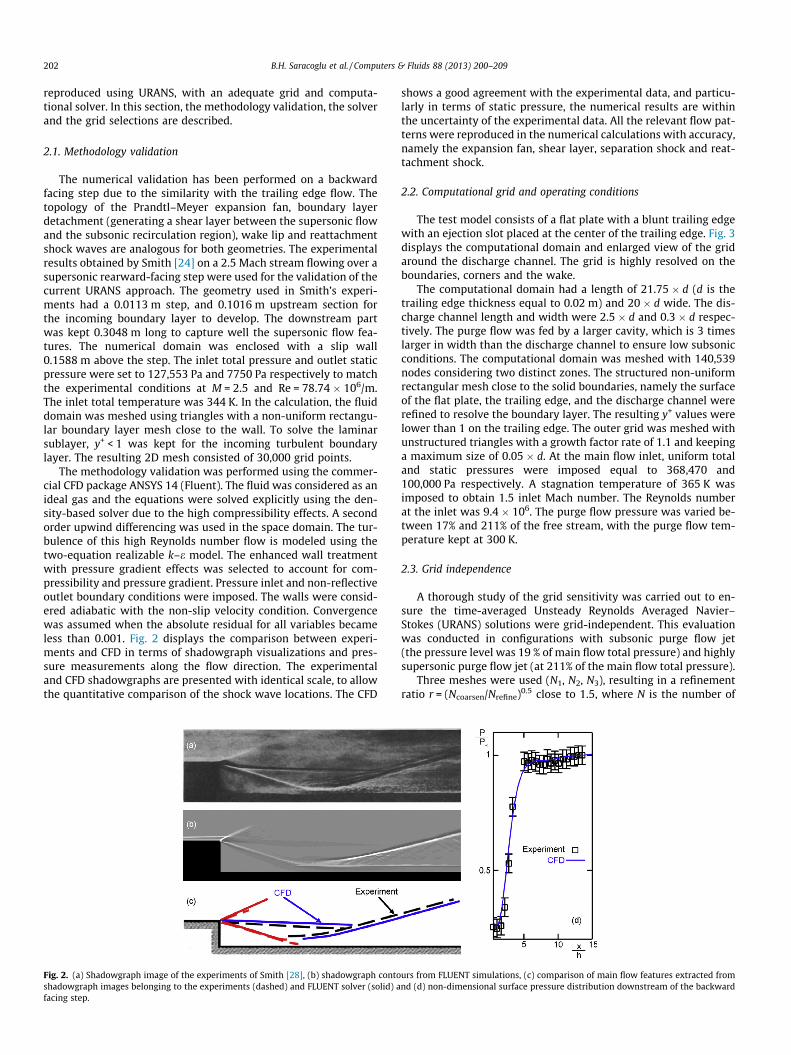
The methodology validation was performed using the commer-cial CFD package ANSYS 14 (Fluent). The fluid was considered as anideal gas and the equations were solved explicitly using the den-sity-based solver due to the high compressibility effects. A secondorder upwind differencing was used in the space domain. The tur-bulence of this high Reynolds number flow is modeled using thetwo-equation realizable k–e model. The enhanced wall treatmentwith pressure gradient effects was selected to account for com-pressibility and pressure gradient. Pressure inlet and non-reflectiveoutlet boundary conditions were imposed. The walls were consid-ered adiabatic with the non-slip velocity condition. Convergencewas assumed when the absolute residual for all variables becameless than 0.001. Fig. 2 displays the comparison between experi-ments and CFD in terms of shadowgraph visualizations and pres-sure measurements along the flow direction. The experimentaland CFD shadowgraphs are presented with identical scale, to allowthe quantitative comparison of the shock wave locations. The CFD
Fig. 2. (a) Shadowgraph image of the experiments of Smith [28], (b) shadowgraph contoshadowgraph images belonging to the experiments (dashed) and FLUENT solver (solid) afacing step.
shows a good agreement with the experimental data, and particu-larly in terms of static pressure, the numerical results are withinthe uncertainty of the experimental data. All the relevant flow pat-terns were reproduced in the numerical calculations with accuracy,namely the expansion fan, shear layer, separation shock and reat-tachment shock.
2.2. Computational grid and operating conditions
The test model consists of a flat plate with a blunt trailing edgewith an ejection slot placed at the center of the trailing edge. Fig. 3displays the computational domain and enlarged view of the gridaround the discharge channel. The grid is highly resolved on theboundaries, corners and the wake.
The computational domain had a length of 21.75 � d (d is thetrailing edge thickness equal to 0.02 m) and 20 � d wide. The dis-charge channel length and width were 2.5 � d and 0.3 � d respec-tively. The purge flow was fed by a larger cavity, which is 3 timeslarger in width than the discharge channel to ensure low subsonicconditions. The computational domain was meshed with 140,539nodes considering two distinct zones. The structured non-uniformrectangular mesh close to the solid boundaries, namely the surfaceof the flat plate, the trailing edge, and the discharge channel wererefined to resolve the boundary layer. The resulting y+ values werelower than 1 on the trailing edge. The outer grid was meshed withunstructured triangles with a growth factor rate of 1.1 and keepinga maximum size of 0.05 � d. At the main flow inlet, uniform totaland static pressures were imposed equal to 368,470 and100,000 Pa respectively. A stagnation temperature of 365 K wasimposed to obtain 1.5 inlet Mach number. The Reynolds numberat the inlet was 9.4 � 106. The purge flow pressure was varied be-tween 17% and 211% of the free stream, with the purge flow tem-perature kept at 300 K.
2.3. Grid independence
A thorough study of the grid sensitivity was carried out to en-sure the time-averaged Unsteady Reynolds Averaged Navier–Stokes (URANS) solutions were grid-independent. This evaluationwas conducted in configurations with subsonic purge flow jet(the pressure level was 19 % of main flow total pressure) and highlysupersonic purge flow jet (at 211% of the main flow total pressure).
Three meshes were used (N1, N2, N3), resulting in a refinementratio r = (Ncoarsen/Nrefine)0.5 close to 1.5, where N is the number of
urs from FLUENT simulations, (c) comparison of main flow features extracted fromnd (d) non-dimensional surface pressure distribution downstream of the backward
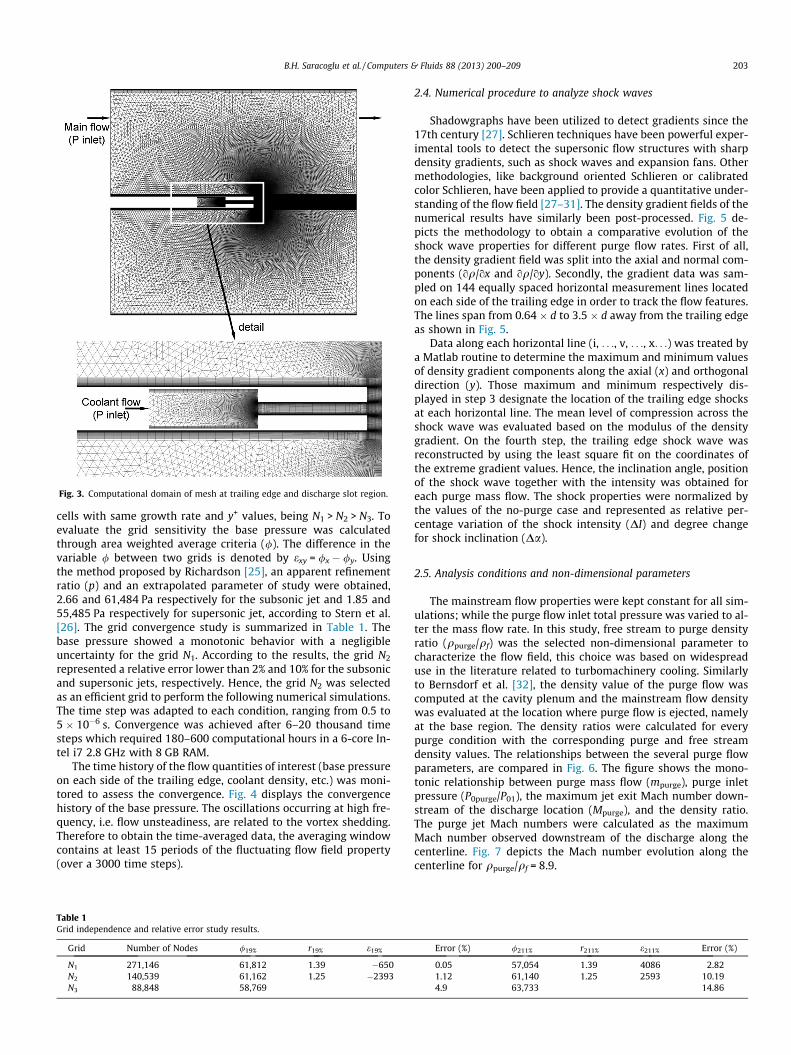
Fig. 3. Computational domain of mesh at trailing edge and discharge slot region.
B.H. Saracoglu et al. / Computers & Fluids 88 (2013) 200–209 203
cells with same growth rate and y+ values, being N1 > N2 > N3. Toevaluate the grid sensitivity the base pressure was calculatedthrough area weighted average criteria (/). The difference in thevariable / between two grids is denoted by exy = /x � /y. Usingthe method proposed by Richardson [25], an apparent refinementratio (p) and an extrapolated parameter of study were obtained,2.66 and 61,484 Pa respectively for the subsonic jet and 1.85 and55,485 Pa respectively for supersonic jet, according to Stern et al.[26]. The grid convergence study is summarized in Table 1. Thebase pressure showed a monotonic behavior with a negligibleuncertainty for the grid N1. According to the results, the grid N2
represented a relative error lower than 2% and 10% for the subsonicand supersonic jets, respectively. Hence, the grid N2 was selectedas an efficient grid to perform the following numerical simulations.The time step was adapted to each condition, ranging from 0.5 to5 � 10�6 s. Convergence was achieved after 6–20 thousand timesteps which required 180–600 computational hours in a 6-core In-tel i7 2.8 GHz with 8 GB RAM.
The time history of the flow quantities of interest (base pressureon each side of the trailing edge, coolant density, etc.) was moni-tored to assess the convergence. Fig. 4 displays the convergencehistory of the base pressure. The oscillations occurring at high fre-quency, i.e. flow unsteadiness, are related to the vortex shedding.Therefore to obtain the time-averaged data, the averaging windowcontains at least 15 periods of the fluctuating flow field property(over a 3000 time steps).
Table 1Grid independence and relative error study results.
Grid Number of Nodes /19% r19% e19%
N1 271,146 61,812 1.39 �650N2 140,539 61,162 1.25 �2393N3 88,848 58,769
2.4. Numerical procedure to analyze shock waves
Shadowgraphs have been utilized to detect gradients since the17th century [27]. Schlieren techniques have been powerful exper-imental tools to detect the supersonic flow structures with sharpdensity gradients, such as shock waves and expansion fans. Othermethodologies, like background oriented Schlieren or calibratedcolor Schlieren, have been applied to provide a quantitative under-standing of the flow field [27–31]. The density gradient fields of thenumerical results have similarly been post-processed. Fig. 5 de-picts the methodology to obtain a comparative evolution of theshock wave properties for different purge flow rates. First of all,the density gradient field was split into the axial and normal com-ponents (oq/ox and oq/oy). Secondly, the gradient data was sam-pled on 144 equally spaced horizontal measurement lines locatedon each side of the trailing edge in order to track the flow features.The lines span from 0.64 � d to 3.5 � d away from the trailing edgeas shown in Fig. 5.
Data along each horizontal line (i, . . ., v, . . ., x. . .) was treated bya Matlab routine to determine the maximum and minimum valuesof density gradient components along the axial (x) and orthogonaldirection (y). Those maximum and minimum respectively dis-played in step 3 designate the location of the trailing edge shocksat each horizontal line. The mean level of compression across theshock wave was evaluated based on the modulus of the densitygradient. On the fourth step, the trailing edge shock wave wasreconstructed by using the least square fit on the coordinates ofthe extreme gradient values. Hence, the inclination angle, positionof the shock wave together with the intensity was obtained foreach purge mass flow. The shock properties were normalized bythe values of the no-purge case and represented as relative per-centage variation of the shock intensity (DI) and degree changefor shock inclination (Da).
2.5. Analysis conditions and non-dimensional parameters
The mainstream flow properties were kept constant for all sim-ulations; while the purge flow inlet total pressure was varied to al-ter the mass flow rate. In this study, free stream to purge densityratio (qpurge/qf) was the selected non-dimensional parameter tocharacterize the flow field, this choice was based on widespreaduse in the literature related to turbomachinery cooling. Similarlyto Bernsdorf et al. [32], the density value of the purge flow wascomputed at the cavity plenum and the mainstream flow densitywas evaluated at the location where purge flow is ejected, namelyat the base region. The density ratios were calculated for everypurge condition with the corresponding purge and free streamdensity values. The relationships between the several purge flowparameters, are compared in Fig. 6. The figure shows the mono-tonic relationship between purge mass flow (mpurge), purge inletpressure (P0purge/P01), the maximum jet exit Mach number down-stream of the discharge location (Mpurge), and the density ratio.The purge jet Mach numbers were calculated as the maximumMach number observed downstream of the discharge along thecenterline. Fig. 7 depicts the Mach number evolution along thecenterline for qpurge/qf = 8.9.
Error (%) /211% r211% e211% Error (%)
0.05 57,054 1.39 4086 2.821.12 61,140 10.191.25 25934.9 63,733 14.86
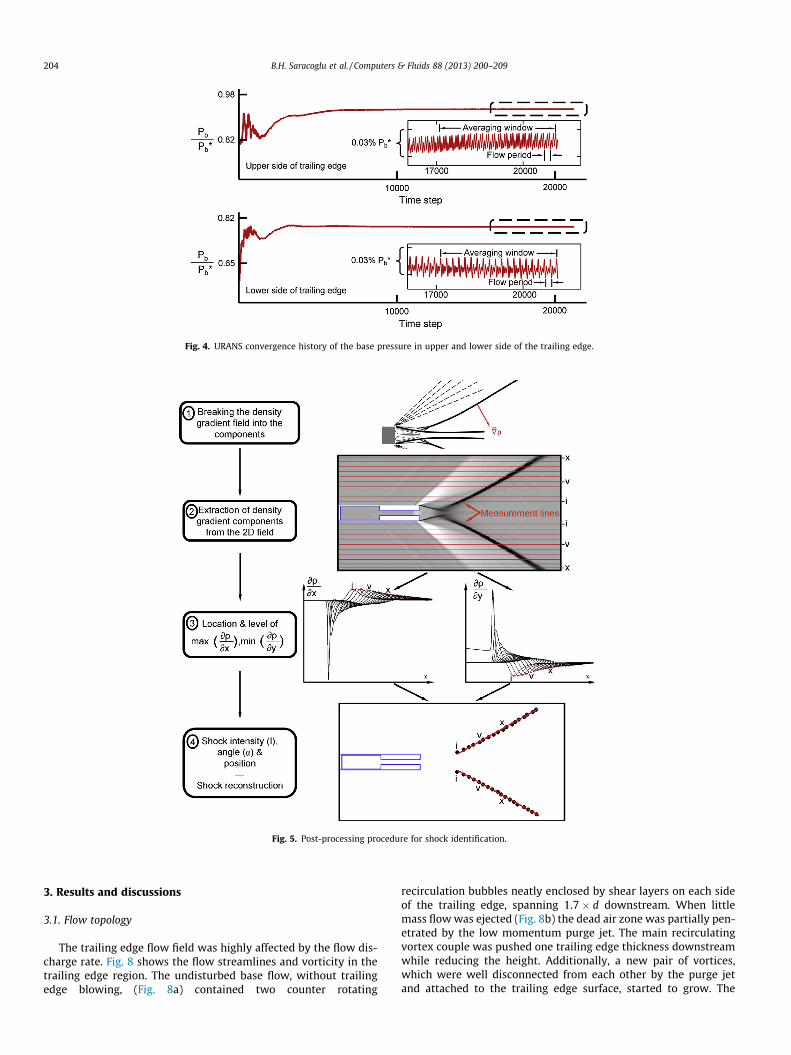
Fig. 4. URANS convergence history of the base pressure in upper and lower side of the trailing edge.
Fig. 5. Post-processing procedure for shock identification.
204 B.H. Saracoglu et al. / Computers & Fluids 88 (2013) 200–209
3. Results and discussions
3.1. Flow topology
The trailing edge flow field was highly affected by the flow dis-charge rate. Fig. 8 shows the flow streamlines and vorticity in thetrailing edge region. The undisturbed base flow, without trailingedge blowing, (Fig. 8a) contained two counter rotating
recirculation bubbles neatly enclosed by shear layers on each sideof the trailing edge, spanning 1.7 � d downstream. When littlemass flow was ejected (Fig. 8b) the dead air zone was partially pen-etrated by the low momentum purge jet. The main recirculatingvortex couple was pushed one trailing edge thickness downstreamwhile reducing the height. Additionally, a new pair of vortices,which were well disconnected from each other by the purge jetand attached to the trailing edge surface, started to grow. The
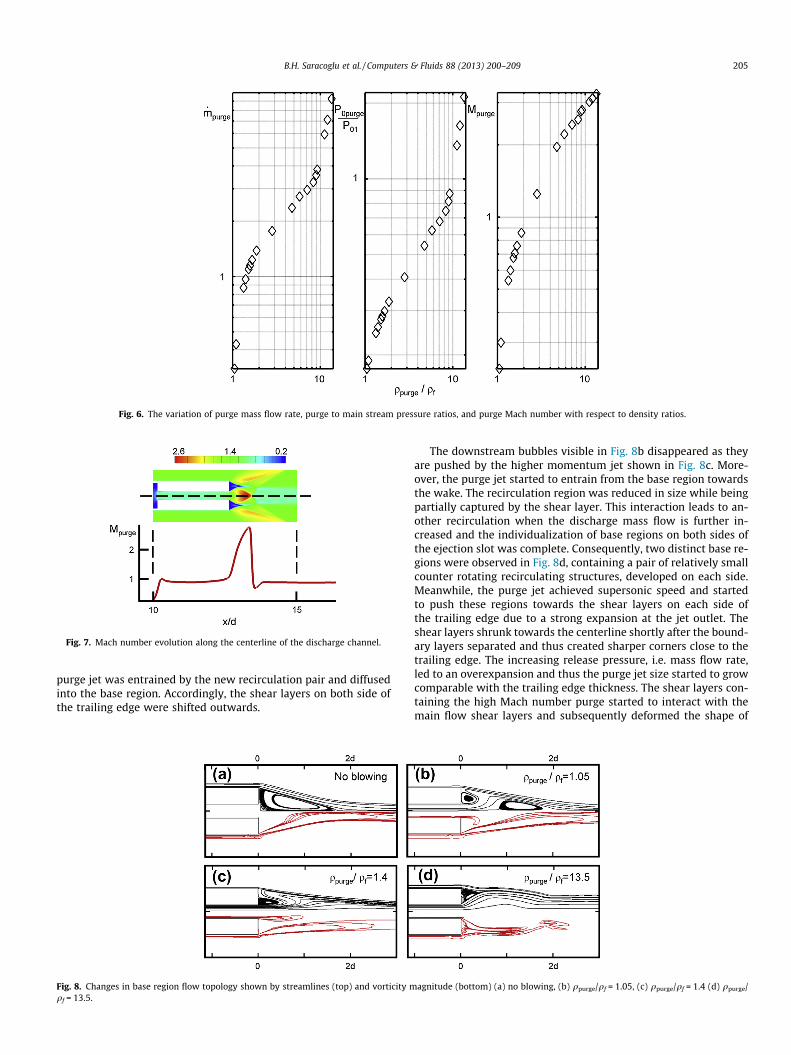
Fig. 6. The variation of purge mass flow rate, purge to main stream pressure ratios, and purge Mach number with respect to density ratios.
Fig. 7. Mach number evolution along the centerline of the discharge channel.
B.H. Saracoglu et al. / Computers & Fluids 88 (2013) 200–209 205
purge jet was entrained by the new recirculation pair and diffusedinto the base region. Accordingly, the shear layers on both side ofthe trailing edge were shifted outwards.
Fig. 8. Changes in base region flow topology shown by streamlines (top) and vorticity mqf = 13.5.
The downstream bubbles visible in Fig. 8b disappeared as theyare pushed by the higher momentum jet shown in Fig. 8c. More-over, the purge jet started to entrain from the base region towardsthe wake. The recirculation region was reduced in size while beingpartially captured by the shear layer. This interaction leads to an-other recirculation when the discharge mass flow is further in-creased and the individualization of base regions on both sides ofthe ejection slot was complete. Consequently, two distinct base re-gions were observed in Fig. 8d, containing a pair of relatively smallcounter rotating recirculating structures, developed on each side.Meanwhile, the purge jet achieved supersonic speed and startedto push these regions towards the shear layers on each side ofthe trailing edge due to a strong expansion at the jet outlet. Theshear layers shrunk towards the centerline shortly after the bound-ary layers separated and thus created sharper corners close to thetrailing edge. The increasing release pressure, i.e. mass flow rate,led to an overexpansion and thus the purge jet size started to growcomparable with the trailing edge thickness. The shear layers con-taining the high Mach number purge started to interact with themain flow shear layers and subsequently deformed the shape of
agnitude (bottom) (a) no blowing, (b) qpurge/qf = 1.05, (c) qpurge/qf = 1.4 (d) qpurge/
206 B.H. Saracoglu et al. / Computers & Fluids 88 (2013) 200–209
the base region by moving them outward. An additional compres-sion corner followed by an expansion was created on the mainflow. Subsequently, the flow deflected once again at the confluencepoint located more than two trailing edges downstream andformed the wake. The base pressure was observed to be increasingin this range mainly due to the entrapment of the base flow on asmall recirculation region and constantly compressed by the purgejet shear layers.
3.2. Shock wave properties
The characteristics of the trailing edge shock systems wereinvestigated for a wide range of purge flow rates. The shock waveproperties obtained in the absence of blowing were used as refer-ence case to normalize the trailing edge shock intensity and shockangle for all conditions.
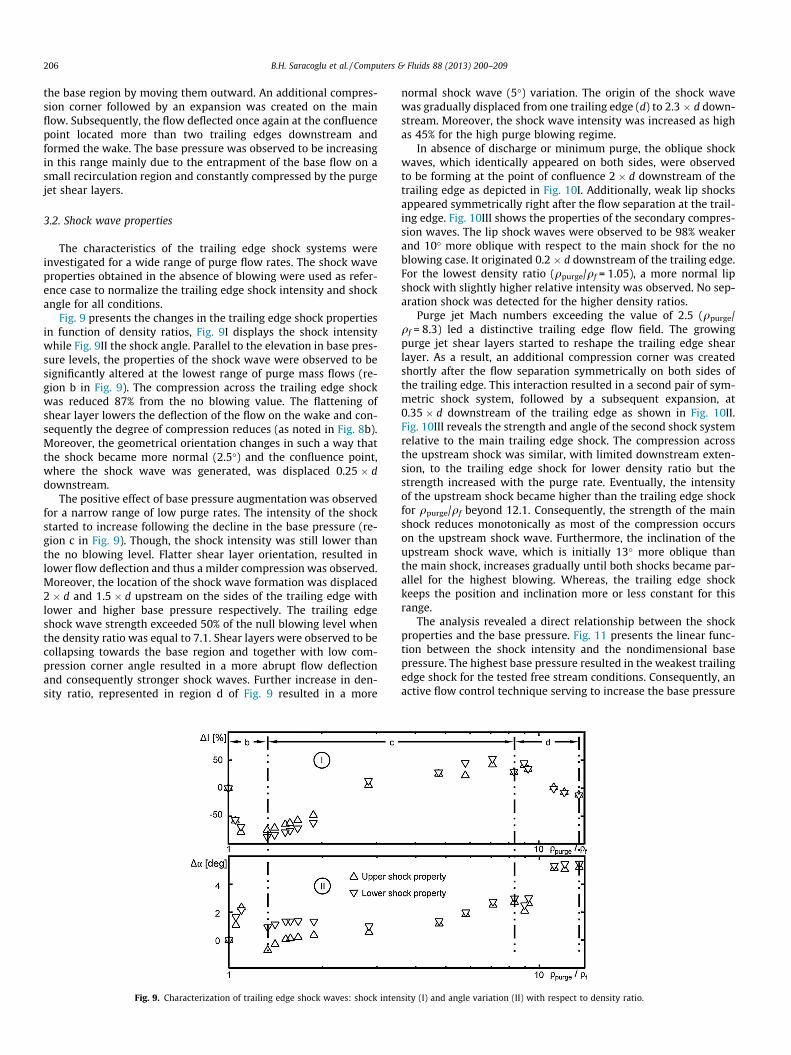
Fig. 9 presents the changes in the trailing edge shock propertiesin function of density ratios, Fig. 9I displays the shock intensitywhile Fig. 9II the shock angle. Parallel to the elevation in base pres-sure levels, the properties of the shock wave were observed to besignificantly altered at the lowest range of purge mass flows (re-gion b in Fig. 9). The compression across the trailing edge shockwas reduced 87% from the no blowing value. The flattening ofshear layer lowers the deflection of the flow on the wake and con-sequently the degree of compression reduces (as noted in Fig. 8b).Moreover, the geometrical orientation changes in such a way thatthe shock became more normal (2.5�) and the confluence point,where the shock wave was generated, was displaced 0.25 � ddownstream.
The positive effect of base pressure augmentation was observedfor a narrow range of low purge rates. The intensity of the shockstarted to increase following the decline in the base pressure (re-gion c in Fig. 9). Though, the shock intensity was still lower thanthe no blowing level. Flatter shear layer orientation, resulted inlower flow deflection and thus a milder compression was observed.Moreover, the location of the shock wave formation was displaced2 � d and 1.5 � d upstream on the sides of the trailing edge withlower and higher base pressure respectively. The trailing edgeshock wave strength exceeded 50% of the null blowing level whenthe density ratio was equal to 7.1. Shear layers were observed to becollapsing towards the base region and together with low com-pression corner angle resulted in a more abrupt flow deflectionand consequently stronger shock waves. Further increase in den-sity ratio, represented in region d of Fig. 9 resulted in a more
Fig. 9. Characterization of trailing edge shock waves: shock inten
normal shock wave (5�) variation. The origin of the shock wavewas gradually displaced from one trailing edge (d) to 2.3 � d down-stream. Moreover, the shock wave intensity was increased as highas 45% for the high purge blowing regime.
In absence of discharge or minimum purge, the oblique shockwaves, which identically appeared on both sides, were observedto be forming at the point of confluence 2 � d downstream of thetrailing edge as depicted in Fig. 10I. Additionally, weak lip shocksappeared symmetrically right after the flow separation at the trail-ing edge. Fig. 10III shows the properties of the secondary compres-sion waves. The lip shock waves were observed to be 98% weakerand 10� more oblique with respect to the main shock for the noblowing case. It originated 0.2 � d downstream of the trailing edge.For the lowest density ratio (qpurge/qf = 1.05), a more normal lipshock with slightly higher relative intensity was observed. No sep-aration shock was detected for the higher density ratios.
Purge jet Mach numbers exceeding the value of 2.5 (qpurge/qf = 8.3) led a distinctive trailing edge flow field. The growingpurge jet shear layers started to reshape the trailing edge shearlayer. As a result, an additional compression corner was createdshortly after the flow separation symmetrically on both sides ofthe trailing edge. This interaction resulted in a second pair of sym-metric shock system, followed by a subsequent expansion, at0.35 � d downstream of the trailing edge as shown in Fig. 10II.Fig. 10III reveals the strength and angle of the second shock systemrelative to the main trailing edge shock. The compression acrossthe upstream shock was similar, with limited downstream exten-sion, to the trailing edge shock for lower density ratio but thestrength increased with the purge rate. Eventually, the intensityof the upstream shock became higher than the trailing edge shockfor qpurge/qf beyond 12.1. Consequently, the strength of the mainshock reduces monotonically as most of the compression occurson the upstream shock wave. Furthermore, the inclination of theupstream shock wave, which is initially 13� more oblique thanthe main shock, increases gradually until both shocks became par-allel for the highest blowing. Whereas, the trailing edge shockkeeps the position and inclination more or less constant for thisrange.
The analysis revealed a direct relationship between the shockproperties and the base pressure. Fig. 11 presents the linear func-tion between the shock intensity and the nondimensional basepressure. The highest base pressure resulted in the weakest trailingedge shock for the tested free stream conditions. Consequently, anactive flow control technique serving to increase the base pressure
sity (I) and angle variation (II) with respect to density ratio.
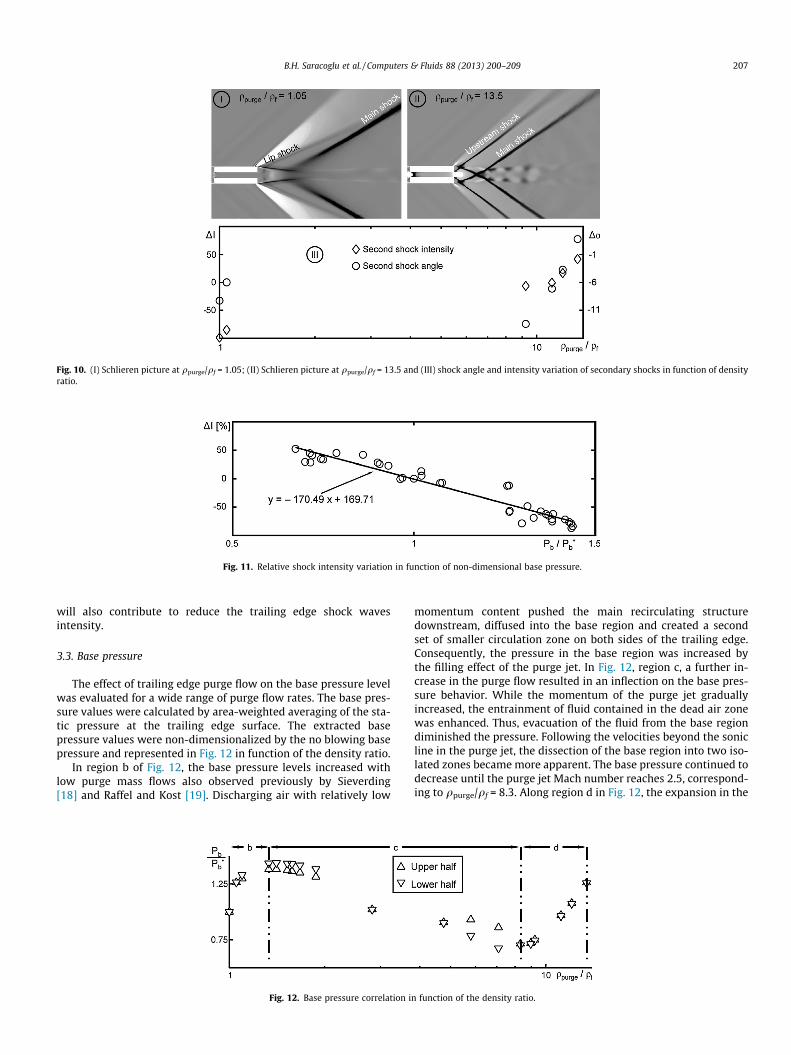
Fig. 10. (I) Schlieren picture at qpurge/qf = 1.05; (II) Schlieren picture at qpurge/qf = 13.5 and (III) shock angle and intensity variation of secondary shocks in function of densityratio.
Fig. 11. Relative shock intensity variation in function of non-dimensional base pressure.
B.H. Saracoglu et al. / Computers & Fluids 88 (2013) 200–209 207
will also contribute to reduce the trailing edge shock wavesintensity.
3.3. Base pressure
The effect of trailing edge purge flow on the base pressure levelwas evaluated for a wide range of purge flow rates. The base pres-sure values were calculated by area-weighted averaging of the sta-tic pressure at the trailing edge surface. The extracted basepressure values were non-dimensionalized by the no blowing basepressure and represented in Fig. 12 in function of the density ratio.
In region b of Fig. 12, the base pressure levels increased withlow purge mass flows also observed previously by Sieverding[18] and Raffel and Kost [19]. Discharging air with relatively low
Fig. 12. Base pressure correlation i
momentum content pushed the main recirculating structuredownstream, diffused into the base region and created a secondset of smaller circulation zone on both sides of the trailing edge.Consequently, the pressure in the base region was increased bythe filling effect of the purge jet. In Fig. 12, region c, a further in-crease in the purge flow resulted in an inflection on the base pres-sure behavior. While the momentum of the purge jet graduallyincreased, the entrainment of fluid contained in the dead air zonewas enhanced. Thus, evacuation of the fluid from the base regiondiminished the pressure. Following the velocities beyond the sonicline in the purge jet, the dissection of the base region into two iso-lated zones became more apparent. The base pressure continued todecrease until the purge jet Mach number reaches 2.5, correspond-ing to qpurge/qf = 8.3. Along region d in Fig. 12, the expansion in the
n function of the density ratio.
208 B.H. Saracoglu et al. / Computers & Fluids 88 (2013) 200–209
jet was enhanced substantially such that the jet shear layer com-pressed the recirculating region on both sides and consequentlythe base pressure increased.
The current analysis showed that flow properties, similar to thebase pressure levels, exhibited different absolute values on eachhalf of the domain although the trends for both sides were similar.Thus, the properties representing the top and the bottom half weredesignated distinctively. The base pressure values on each side ofthe trailing edge diverged between the density ratios of 1.1 and7.1. Uncertainty involved in the numerical methodology couldcause the difference for a certain range of purge. The variation onboth sides might also result from the jet deflection, probablycaused by Coanda effect. Such instability has been previously doc-umented on jet discharge and diverging flows in symmetric chan-nel studies in the literature [33–38]. Discharging flow deflected oneither side beyond a critical Reynolds number (17 � 103) and rees-tablished symmetry above large jet Reynolds numbers (2 � 105) asobserved by Allery et al. [33]. Such phenomena have not been pre-viously observed on airfoils with trailing edge discharge, becausethere exists a natural pressure gradient between both sides ofthe trailing edge owing to the uneven pressure distribution onthe each side of the airfoils.
4. Conclusions
The effect of discharge at the base region of a blunt trailing edgeexposed to supersonic flow was numerically investigated for awide range of mass flow rates, using URANS. The paper analyzedthe variation in the base pressure in conjunction with the base re-gion flow topology and trailing edge shock wave properties. Verylow purge rates caused significant base pressure augmentation,which in turn reduced the shock intensities, as low as 87% of theno blowing case, by modifying the base region flow topology to-wards a flatter shear layered configuration. For the density ratioslower than 2.8, the base pressure was observed to be kept higherand shock intensity remained lower than the no discharge condi-tion. Therefore, purging with density ratios between unity and2.8 provided a beneficial playground to modulate the shock wavesfor lower intensity without compromising the refrigerationrequirements in turbine applications.
The analysis of the Schlieren images captured the formation of asecond system of compression upstream of the main trailing edgeshocks, for the density ratios above 9.2, due to the excessivegrowth of the supersonic purge jet. The trailing edge shock anglewas observed to be less sensitive to the air ejection than the shockintensity. The high discharge rates resulted in shock wave deflec-tion as high as 5� and intensity comparable to the no blowing con-dition. The reduction in the shock intensity also resulted in lowerenergy dissipation across the shock wave in term of total pressureloss which is a significant parameter for the energy conversion de-vices. Moreover, trailing edge discharge is beneficial in reducingstatic pressure variability and consequently the flow-structureinteraction. Hence, the forcing exerted on the downstream compo-nents by the shock waves may be lowered.
Acknowledgements
The authors would like to acknowledge the financial support ofU.S. Air Force under the frame of the Project AFOSR FA 8655-08-1-3033. The authors also wish to thank the support of Dr. FloraTomasoni from von Karman Institute.
References
[1] Nash JF. A review of research on two-dimensional base flow. ARC R&M. No.3323; 1963. p. 1–25.
[2] Nash JF. A discussion of two-dimensional turbulent base flows. ARC R&M. No.3468; 1967 p. 1–46.
[3] Nash JF, Quincey VG, Callinan J. Experiments on two-dimensional base flow atsubsonic and transonic speeds. ARC R&M No. 3427; 1963. p. 1–34.
[4] Hama F. Experimental studies on the lip shock. AIAA J 1968;6:212–9.[5] Sieverding CH, Stanislas M, Snoeck J. The base pressure problem in transonic
turbine cascades. J Eng Power 1980;102:711–8.[6] Denton JD, Xu L. The trailing edge loss of transonic turbine blades. ASME J
Turbomach 1990;112:277–85.[7] Denton JD. Loss mechanisms in turbomachines. ASME J Turbomach
1993;115:621–56.[8] Paniagua G, Yasa T, de la Loma A, Castillon L, Coton T. Unsteady strong shock
interactions in a transonic turbine: experimental and numerical analysis. JPropuls Power 2008;24:722–31.
[9] Kost FH, Holmes AT. Aerodynamic effect of coolant ejection in the rear part oftransonic rotor blades. AGARD CP 390; 1985. p. 41–1–12.
[10] Kapteijn C, Wake development downstream of a transonic turbine inlet guidevane with trailing edge ejection. AGARD CP 571; 1995. 14–1–7.
[11] Bohn DE, Becker VJ, Behnke KD, Bonhoff BF, Experimental and numericalinvestigations of the aerodynamical effects of coolant injection through thetrailing edge of a guide vane. ASME Paper No. 95-GT-26. In: Proc. of ASMEInternational Gas Turbine and Aeroengine Congress and Exposition, June 5–8,Houston, TX; 1995.
[12] Sieverding CH, Arts T, Denos R, Martelli F. Investigation of the flow fielddownstream of a turbine trailing edge cooled nozzle guide vane. ASME JTurbomach 1996;118:291–300.
[13] Kapteijn C, Amecke J, Michelassi V. Aerodynamic performance of a transonicturbine guide vane with trailing edge coolant ejection: part I – experimentalapproach. ASME J Turbomach 1996;118:519–28.
[14] Uzol O, Camci C. Aerodynamic loss characteristics of a turbine blade withtrailing edge coolant ejection: part 2-external aerodynamics, total pressurelosses, and predictions. ASME J Turbomach 2001;123:249–57.
[15] Ames FE, Johnson JD, Fiala NJ, Gill slot trailing edge aerodynamics-effects ofblowing rate, reynolds number, and external turbulence on aerodynamicslosses and pressure distribution. ASME Paper No. GT2007-27399. In: Proc. ofASME Turbo Expo 2007: Power for Land, Sea and Air, May 14–17, Montreal,Canada, 2007.
[16] Kulasekharan N, Prasad BVSSS. Computational Investigation in the trailingedge region of cooled turbine vane-comparison of different channel shapes.ASME Paper No. GT2007-27421. In: Proc. of ASME Turbo Expo 2007: Power forLand, Sea and Air, May 14–17, Montreal, Canada; 2007.
[17] Joo J, Durbin P. Simulation of turbine blade trailing edge cooling. ASME J FluidsEng 2009;131:021102.
[18] Sieverding CH. The influence of trailing edge ejection on the base pressure intransonic turbine cascades. ASME J Eng Power 1983;105:215–22.
[19] Raffel M, Kost F. Investigation of aerodynamic effects of coolant ejection at thetrailing edge of a turbine blade model by PIV and pressure measurements. ExpFluids 1998;24:447–61.
[20] Carlson JR, Duquesne N, Rumsey CL, Gatski TB. Computation of turbulent wakeflows in variable pressure gradient. Comput Fluids 2001;30:161–70.
[21] Mulvany N, Tu TY, Chen L, Anderson B. Assessment of two-equation turbulencemodeling for high Reynolds number hydrofoil flow. Int J Numer Meth Fluids2004;45:275–99.
[22] Garnier E, Pamart PY, Dandois J, Sagaut P. Evaluation of the unsteady RANScapabilities for separated flows control. Comput Fluids 2012;61:39–45.
[23] Do T, Chen L, Tu J. Numerical study of turbulent trailing-edge flow with basecavity effects using URANS. J Fluids Struct 2010;26:1155–73.
[24] Smith HE. Experimental and theoretical investigation of the near wake behinda rearward facing step in supersonic flow. PhD Dissertation. University ofCincinnati; 1969.
[25] Richardson LF. The approximate arithmetical solution by finite differences ofphysical problems involving differential equations with an application tothe stresses in a Masonry Dam. Trans R Soc London Ser A 1910;210:307–57.
[26] Stern F, Wilson R, Shao J. Quantitative V&V of CFD simulations and certificationof CFD codes. Int J Numer Meth Fluids 2006;50:1335–55.
[27] Settles GS. Schlieren and shadowgraph techniques: visualizing phenomena intransparent media. Berlin: Springer-Verlag; 2001.
[28] Elsinga GE, van Oudheusden BW, Scarano F, Watt DW. Assessment andapplication of quantitative schlieren methods: calibrated color schlieren andbackground oriented schlieren. Exp Fluids 2004;36:309–25.
[29] Boiron O, Chiavassa G, Donat R. A high-resolution penalization method forlarge Mach number flows in the presence of obstacles. Comput Fluids2009;38:703–14.
[30] Saracoglu BH, Paniagua G, Salvadori S, Tomasoni F, Duni S, Miranda A. Trailingedge shock modulation by pulsating coolant ejection. Appl Therm Eng2012;48:1–10.
[31] Sambasivan SK, UdayKumar HS. Sharp interface simulations with Local MeshRefinement for multi-material dynamics in strongly shocked flows. ComputFluids 2010;39:1456–79.
[32] Bernsdorf S, Rose MG, Abhari RS. Experimental validation of quasisteadyassumption in modeling of unsteady film-cooling. ASME J Turbomach2008;130:011022.
[33] Allery C, Guerin S, Hamdouni A, Sakout A. Experimental and numerical PODstudy of the Coanda effect used to reduce self-sustained tones. Mech ResCommun 2004;31:105–20.

B.H. Saracoglu et al. / Computers & Fluids 88 (2013) 200–209 209
[34] Alleborn N, Nandakumar K, Raszillier H, Durst F. Further contributions on thetwo-dimensional flow in a sudden expansion. J Fluid Mech 1997;330:169–88.
[35] Durst F, Pereira JCF, Tropea C. The plane symmetric sudden-expansion flow atlow Reynolds numbers. J. Fluid Mech 1993;248:567–81.
[36] Fearn RM, Mullin T, Cliffe KA. Nonlinear flow phenomena in a symmetricsudden expansion. J Fluid Mech 1990;211:595–608.
View publication statsView publication stats
[37] Cherdron W, Durst F, Whitelaw JH. Asymmetric flows and instabilitiesin symmetric ducts with sudden expansions. J Fluid Mech 1978;84:13–31.
[38] Carroll BF, Dutton JC. Characteristics of multiple shock wave/turbulentboundary-layer interactions in rectangular ducts. J Propuls 1990;6:186–93.