Embed Size (px)
Citation preview
1
Effects of Airport Servicescape on Passengers’ Satisfaction: A Hierarchical
Approach and Importance-Performance Analysis
William JENa, Mingying (Lancaster) LU
b, Er-Hua HSIEH
c, Yi-Hua WU
d, Shih-Min CHAN
e
a,b,c,d,e Department of Transportation Technology and Management, National Chiao Tung
University, Hsinchu, 300, Taiwan a E-mail: [email protected]
b E-mail: [email protected]
c E-mail: [email protected]
d E-mail: [email protected]
e E-mail: [email protected]
Abstract By the threat of other countries’ new or renovated airports, Taiwan Tauyuan
International Airport endeavor to improve its service quality. Satisfaction has been discussed
to be one of the crucial factors that influence whether passenger will repurchase on specific
product. We focus on the physical surroundings and its further impact on the satisfaction. This
research proposes a 2-order model and explores the relationship between servicescape and
satisfaction through structural equation model (SEM). Furthermore, combining Importance-
Performance Analysis (IPA) this research finds out some key items needed to be improved
with high priority. Specifically, the results show that convenience of passenger traffic flow
system should be improved first. Lastly, we propose some implications and suggestions for
further research.
Key Words: Servicescape, Satisfaction, Structural Equation Model, Airport, Hierarchical,
Importance-Performance Analysis
1. INTRODUCTION
Due to the fast developing technology, we can get to other cities faster and much more
delightedly as well during the flight, and therefore need for air-transportation has increased
rapidly in pursuit of time-saving and satisfaction simultaneously. However, when passengers
take a flight or arrive from other airport, the terminal is the first place they see and use. How
they perceive will in turn affect the very first image of this country. Thus, it is important to
understand how the physical surrounding of the airport affects passengers’ perception.
Taiwan Taoyuan International Airport was first constructed in 1979. It was the most
novel airport among Asia at that time, boasting its service, such as rigid dealer control, fluent
passenger flow, and efficient customer service, etc., leading airport from neighboring
countries, (e.g.: Singapore Changi Airport) to emulate it. However, terminals fell into
disrepair and are no longer competent, while other Asian airports had gradually renovated. As
a result of that, Taiwan Taoyuan International airport has slipped in the global service
assessment, yet newly developing airport like Incheon International Airport won the Airport
Service Quality (ASQ) 2011 Awards. Recently Civil Aeronautics Administration of Taiwan
has attempted to renovate Taiwan Taoyuan International Airport. They expected to provide
customers better service both in hardware and software and further make customers more
satisfied with the environment of the airport.
Prior researches about service quality of air transportation were largely focus on the
service quality of airlines (Westwood, Pritchard, and Morgan, 2000; Chang and Yeh, 2002; Lu
Proceedings of the Eastern Asia Society for Transportation Studies, Vol.9, 2013
2
and Ling, 2008). Only few researches focus on how the design or the quality of physical
environment influences the passengers’ perception. However, a series of research show that
the facilities, equality, air, brightness, and music may influence customers’ perceptions
(Bitner, 1992; Baker, Grewal, and Parasuraman, 1994; Brady and Cronin Jr, 2001; Milfont
and Duckitt, 2004). In view of this plus airport is the gateway of Taiwan to foreigners, we
should attend to elevate the competence of international airport. In particular, we find out
what (how) will (it) affect customer satisfaction. Furthermore, different form earlier research
lacking considerations of servicescape, referring to Bitner (1992) as “the manmade, physical
surroundings as opposed to the natural or social environment”, we take that into account.
Thus, we focus on the effects of airport servicescape (e.g. architecture, facilities, signs, and so
on) on the passengers’ satisfaction in this research.
Lastly, all managers and executives want to use their resources in an effective way. They
would like to know what factors matter to passengers yet with low satisfaction. Thereby we
combine the Importance-Performance Analysis (IPA) to find out what is important yet poorly
satisfied to customer, aiming to dig out more about the customer insights and to provide a
better practical use. The following four chapters will present the previous literature, method of
analysis, analysis results, and conclusion respectively.
2. LITERATURE REVIEWS
2.1 Service Satisfaction and Airport Service Quality
Satisfaction is consisted of expectation and disconfirmation (Oliver, 1980). In particular,
expectation can be seen as adaptation level affected by factors mentioned in Helson’s (1959)
discussion of adaptation phenomena; positive disconfirmation occurs when the product
exceed our expectations, and vice versa. Churchill Jr. and Surprenant (1982) take satisfaction
as a crucial factor to post-purchase. However, they found that “for durable products
performance differences are the major determinant of satisfaction, and conversely that the
disconfirmation of initial expectations has little impact.” Here, durable goods are considered
to be goods that are expected to last for a long time and yields utility over time rather than
once and for all. This is also one of the natures of service in general.
Parasuraman, Zeithaml, and Berry (1985) suggest that the perceived quality of service
lies in the difference between expected service and perceived service. Parasuraman, Zeithaml,
and Berry (1988) further propose five dimensions of service, including Tangibles, Reliability,
Responsiveness, Assurance, and Empathy. Buzzell and Gale (1987) found that the relationship
between quality and profitability exist both in manufacturing and service industry. Voss,
Parasuraman, and Grewal (1988) found the relationship between service quality and customer
satisfaction.
The research about passenger needs and their perception of service quality have been
developed during the past few decades. A new generation of terminal assessment models
incorporating issues such as comfort, convenience, and ambience in the evaluation models has
emerged (Zidarova and Zografos 2011). The prior research focuses on the evaluation of
performance of airport passenger terminals reveals that compactness, delay, service reliability,
service reasonableness, cost, and comfort & diversion are the factors of performance from
passengers’ point of view (Lemer 1992). Comfort and diversion, which related to the tangible
facilities or equipment, is composed of “crowding”, “sound levels, clarity, and noise”,
“temperature, humidity levels”, “visual character”, “choice of things to do”, and “influence on
sociability”. Rhoades, Waguespack Jr, and Young (1991) confirm the importance of the key
factors relating to airport quality identified from previous research. The first factor is related
Proceedings of the Eastern Asia Society for Transportation Studies, Vol.9, 2013
3
to the passenger service: food and beverage, rest-room facilities, retail and duty free, and
special services. The second factor is related to the issues of airport access parking, rental car
services, and ground transportation. The third factor is related to areas of airline-airport
interface: gate boarding areas, baggage claim facilities, and information display. The final
factor contains a single item: inter-terminal transportation. Manataki and Zografos (2009)
proposed a hierarchical model to analysis the airport performance and structured into two
hierarchical levels. The first level of the hierarchy reflects the airport terminal system
decomposition into a set of Airport Functional Areas, and the second level reflects the Airport
Functional Areas’ decomposition into Service Facilities of the airport terminal. Yeh and Kuo
(2003) narrow the field of study down to international airport. By consulting related
professionals in Taiwan, they found out six constructs (Comfort, Processing Time,
Convenience, Courtesy of Staff, Information Visibility, and Security) to measure service
performance.
Research reveals that evaluating the service quality in may not accurately reflect the
concept of service quality in some way (Dabholkar et al. 1996). It is possible that customers
could focus on certain aspects of the services in their mind while responding to these
questions. Service quality is conceptualized as a formative construct which means the
dimensions of service quality cause the overall service quality perception. Prior research in
service quality shows that high inter-correlations among indicators across dimensions, and
several studies have found only one factor (Dabholkar et al. 1996). Thus, researchers
proposed a hierarchical conceptualization of service quality, which suggest that service
quality perceptions are not only multidimensional but multilevel (Dabholkar et al. 1996; Woo
and Ennew 2005; Jen, Tu, and Lu, 2011). There are two advantages for modeling in this way.
First, because the higher-order factor extracts the underlying commonality among the
dimensions, the hierarchical factor structure can capture dimensions important to the
passengers (Dabholkar et al. 1996). Secondly, the hierarchical structure recognizes that the
evaluation of service quality may be more complex than previously conceptualized (Dagger et
al. 2007).
2.2 Servicescape
Abundant researches of (service) environmental factors have been proposed. Specifically,
they include the subject of retailing store choices, quality inferences, marketing tools, Internet
shopping preference, buying behaviors, and psychology. Among them, variant terms are used,
for example “Economic Environment”, “Store Environment”, “Servicescape”, “Aesthetics”,
“Atmospherics” (see various: Arnold, Handelman, and Tigert, 1996; Baker, Grewal, and
Parasuraman, 1994; Bitner, 1992; Mathwick, Malhotra, and Rigdon, 2001; Kotler, 1973;
Turley and Milliman, 2000; and Weinrach, 2000). In our study, we employ the term
“servicescape” proposed by Bitner (1992), and take physical surroundings (Bitner 1992) and
social factor (Baker, Grewal, and Parasuraman, 1994) into account.
Bitner (1992) regard servicescape as the manmade, physical surroundings as opposed to
the natural or social environment. She contends that there are three main composite
dimensions of servicescape: ambient conditions, spatial layout and functionality, and signs,
symbols, and artifacts. Specifically, ambient conditions are refer to as background
characteristics that can affect our five senses, such as temperature, air quality, noise, etc.
Spatial layout and functionality are referring to as how things are put together and capabilities
that they can facilitate performance and the accomplishment of goals, such as equipment,
layout, furnishings, etc. Signs, symbols, and artifacts are refer to as items that implicitly or
explicitly communicate about the place to users, such as signage, style of décor, personal
artifacts, etc. Baker, Grewal, and Parasuraman (1994) contend that we should consider the
Proceedings of the Eastern Asia Society for Transportation Studies, Vol.9, 2013
4
social factor, which related to the person within the service. Various research about service environment and customers’ emotions attitudes, and
intentions have been conducted after the concepts “servicesacpe” was proposed. In the realm
of Chinese casino, Lio and Rody (2009) find out that aesthetic factor (i.e.: Signs, symbols,
and artifacts dimension) have a significant relevance toward customers’ perception of the
overall servicescape quality. Robert (2009) in the leisure cruise service industry discovers that
not only the ambient condition but layout, décor, size facilities and social factors as well,
influence cruisers overall experience. In the realm of coach transport, Jen, Tung, and Lu
(2005) confirm that servicescape is the main factor influencing the overall service quality and
can further influence customers’ intention. Athanasopoulou (2008) in the athletic service
industry points out that decent servicesacpe can improve relationship quality, for example
customer satisfaction and loyalty. However, in the literature of air transportation, little about
overall environment is taken into account, and therefore we combine this into our study.
3. METHOD
3.1 Research Model and Hypotheses
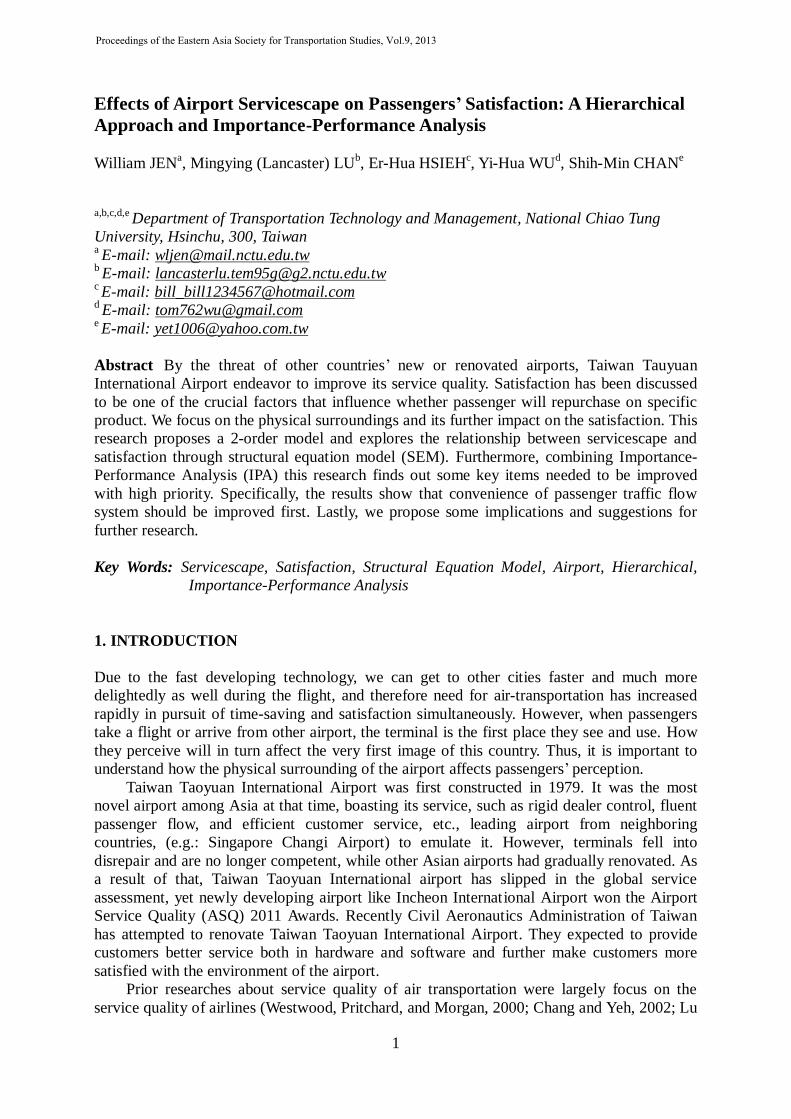
This research is aimed to examine the effects of servicescape on passengers’ satisfaction in the
airport domain. After reviewing the previous literature we refer to concept of servicescape
from Bitner (1992) and exploit the following constructs: ambient conditions, spatial layout
and functionality, and signs, symbols, and artifacts. Our model refers to the model of Brady
and Cronin Jr. (2001) suggesting that the primary dimension servicescape contain three
subdimensions: ambient conditions (with 3 items), spatial layout and functionality (with 3
items) , and signs, symbols, and artifacts(with 3 items). Furthermore, owing to the mean score
defect and the virtue of hierarchical factor structure, our model served servicescape as a
higher-order factor, which reflects on the three dimensions. We use the evaluations of each
item to form the perceptions on each if the three dimensions. Passengers may aggregate their
evaluations of these three subdimensions to form their perceptions of servicescape; this
perception may further influence satisfaction.
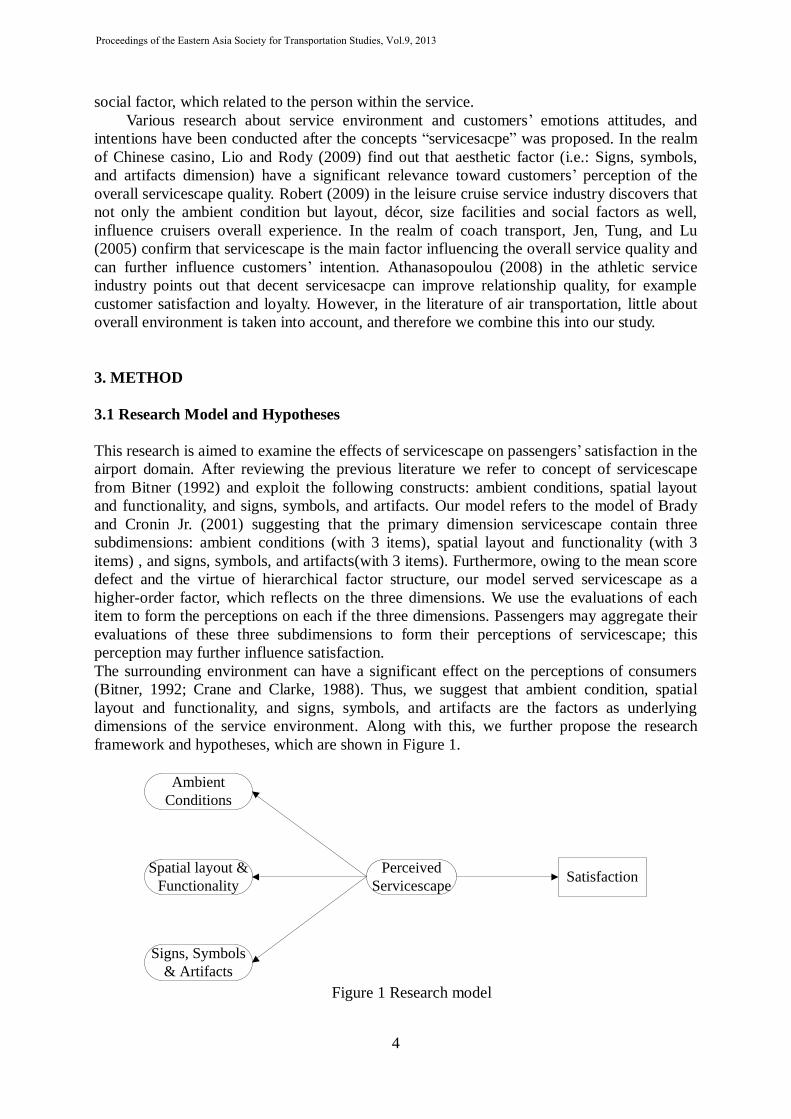
The surrounding environment can have a significant effect on the perceptions of consumers
(Bitner, 1992; Crane and Clarke, 1988). Thus, we suggest that ambient condition, spatial
layout and functionality, and signs, symbols, and artifacts are the factors as underlying
dimensions of the service environment. Along with this, we further propose the research
framework and hypotheses, which are shown in Figure 1.
Ambient
Conditions
Spatial layout &
Functionality
Signs, Symbols
& Artifacts
Perceived
ServicescapeSatisfaction
Figure 1 Research model
Proceedings of the Eastern Asia Society for Transportation Studies, Vol.9, 2013
5
H1:Perceived servicescape is a higher order construct that represents (a) ambient
conditions, (b) spatial layout and functionality, (c) signs, symbols, and artifacts.
H2:Perceived servicescape, constructed as a second-order construct, positively
influences the satisfaction.
3.2 Measurement
In the research model, we employed nine manifest variables as multiple indicators for three
latent variables related to servicescape and one manifest variable as single indicator for
satisfaction. Questionnaire is formulated to ask passengers’ opinion about airport service’s
performance and importance. A Likert five-level scale is applied to all questions to allow
respondents to rate each construct variable with 1 (5) meaning very poor (very good) in the
performance part and least important (most important) in the importance part.
The concept of servicescape proposed by Bitner (1992) is composed of three main
theoretical dimensions: 1. ambient conditions, 2. spatial layout and functionality, and 3. signs,
symbols, and artifacts. We refer to the concept of servicescape and related questions to design
the questionnaire. Regarding ambient conditions, which pertain to nonvisual aspects such as
temperature and scent, we devised three questions: “V1: Hygiene within the terminal”, “V2:
Brightness within the building site”, and “V3: Convenience of passenger traffic flow system”.
For spatial layout and functionality, which pertain to the layout or architecture of physical
environment, we designed three questions: “V4: Convenience of the airport facilities (e.g.,
elevator, washroom, ATM, etc.)”, “V5: Convenience of the restaurants and shops”, and “V6:
Preparedness of the fire control facilities”. With regard to signs, symbols, and artifacts, we
designed three questions: “V7: Clearness of flight information”, “V8: Clearness of the facility
signage”, and “V9: Clearness of the passenger traffic flow signage”.
As for the measurement of satisfaction, we use overall satisfaction to gauge it. Thus, the
whole questionnaire contains ten questions (nine for servicescape and one for satisfaction),
and each respondent needs to grade each question with respect to their performance and
importance.
3.3 Importance Performance Analysis
Important Performance Analysis (IPA) was first brought up by Martilla and James
(1986). By calculating the means of both performance and importance with respect to each
question, we can get a number of means (e.g.: 9 performance means and 9 importance means
in this research). We then plot them on the two dimensional coordinate with performance as
horizontal axis and importance as vertical axis. Letting the mean of the 9 performance means
and of the 9 importance means be the origin, we can divide each question into 4 quadrants:
Quadrant I (High Importance/Low Performance) is labeled Concentrate Here. The
attributes that fall into this quadrant represent key areas that need to be improved with top
priority.
Quadrant II (High Importance/High Performance) is labeled Keep up the good work. The
attributes that fall into this quadrant are the strength and pillar of the organizations, and they
should be the pride of the organizations.
Quadrant III (Low Importance/Low Performance) is labeled Low Priority. Any of the
attributes that fall into this quadrant are not important and pose no threat to the organizations.
Quadrant IV (Low Importance/High Performance) is labeled as Possible Overkill. It
denotes attributes that are overly emphasized by the organizations; therefore, organizations
Proceedings of the Eastern Asia Society for Transportation Studies, Vol.9, 2013
6
should reflect on these attributes, instead of continuing to focus in this quadrant, they should
allocate more resources to deal with attributes that reside in quadrant I.
3.4 Analysis
In this research, by employing structural equation modeling (SEM) together with importance-
performance analysis (IPA), we divided our analysis into three steps. We first apply
confirmatory factor analysis (CFA) to test whether the relationship between the observed
variable and the underlying latent construct fit our hypothesized measurement model.
Secondly, we test the proposed model (structural model) through path analysis to test our
predictions and to explore the intensity between different constructs. Last, we plot our IPA
grid to identify where we should concentrate and choose those with higher coefficients
representing the item which influence customer satisfaction much more than others. As a
result, this attribute represent resource-worthy service.
4. RESULTS
4.1 Sample and Reliability Analysis
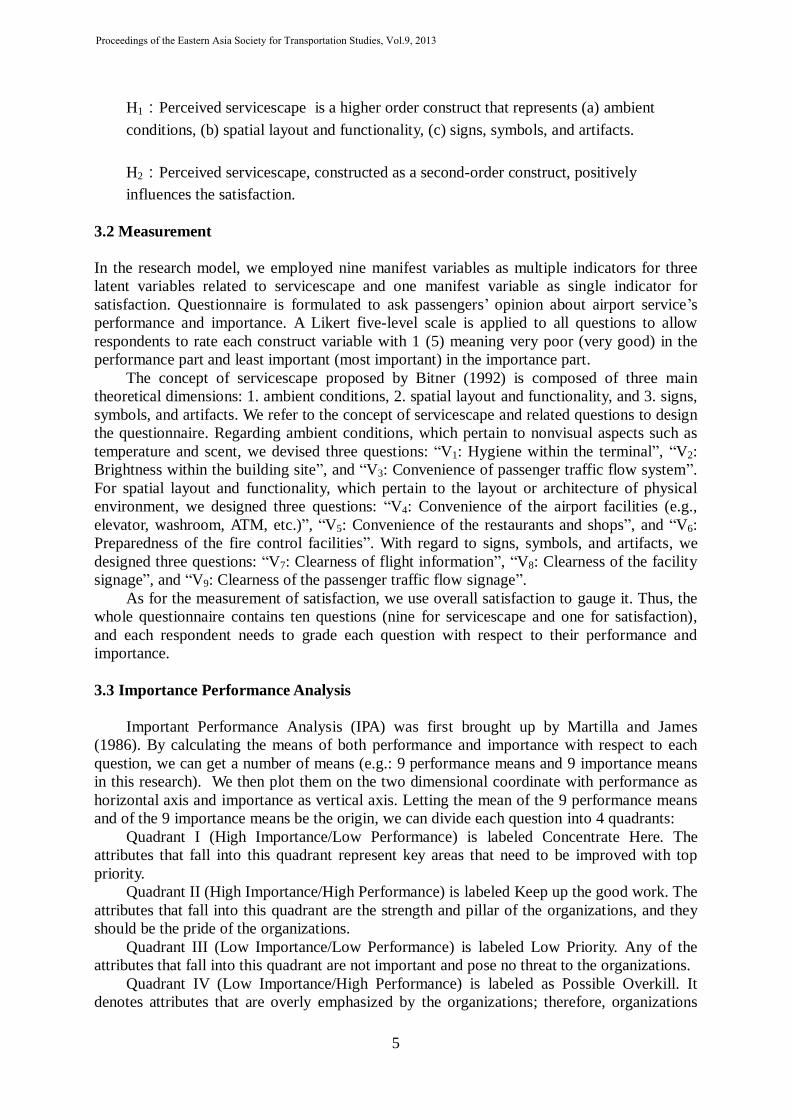
A total of 252 questionnaires were distributed from October to December in 2012 in Taiwan
Tauyuan International Airport. Specifically, we randomly recruit Chinese passengers who just
alighted from the airplane or those who pick up passengers. We omitted the incomplete
questionnaires. Totally 139 valid samples were received with rate of 55%. Among the poll, the
proportion of male (64%) are greater than the proportion of female (36%), and over half
(51%) of the respondents are in age under 30. For the part of income, most (41%) of the
respondents earn 25,000-50,000 NTD per month. Tourism is the purpose of the respondents at
large (61%). A majority (48%) of the passengers check Bachelor regarding their educational
attainment. Tabular form is presented in table 1.
Table 1 Sample Demographics of the Poll
item percentage item percentage
Sex Male
Female
64%
36%
Age Under 30
30-40
40-50
50-60
60 above
51%
35%
13%
1%
0%
Avg.
Income
Under NTD 25,000
NTD 25,000-50,000
NTD 50,000-75,000
NTD 75,000 above
31%
41%
23%
5% Education Under Jr. High
Sr. High
Prof. School
Bachelor
Master
0%
2%
11%
48%
39%
Purpose Business
Tourism
Others
32%
61%
7%
In this study, we have chosen Cronbach’s α reliability coefficient for the reliability analysis.
The reliability coefficients for ambient conditions, spatial layout and functionality, and signs,
symbols, and artifacts, presented in the questionnaire were 0.688, 0.660 and 0.741 which were
acceptable. Thus, this means all dimensions adopted in this research are acceptably reliable.
4.2 Confirmatory Factor Analysis
Proceedings of the Eastern Asia Society for Transportation Studies, Vol.9, 2013
7
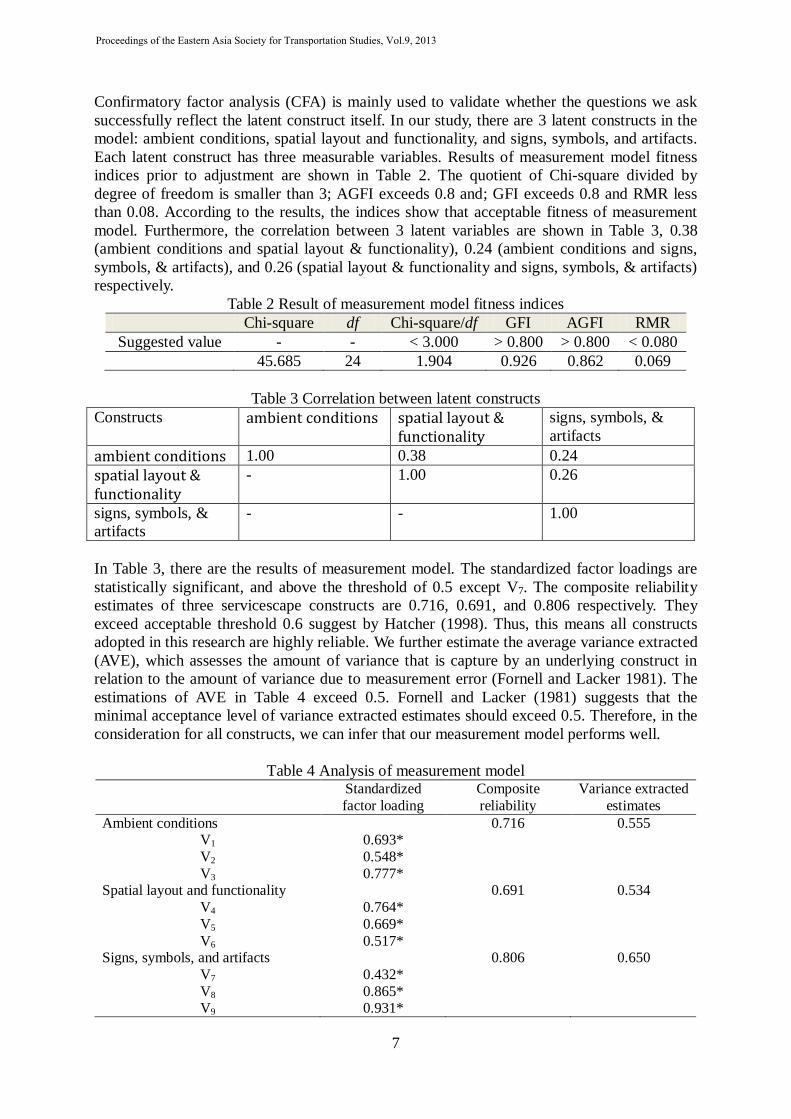
Confirmatory factor analysis (CFA) is mainly used to validate whether the questions we ask
successfully reflect the latent construct itself. In our study, there are 3 latent constructs in the
model: ambient conditions, spatial layout and functionality, and signs, symbols, and artifacts.
Each latent construct has three measurable variables. Results of measurement model fitness
indices prior to adjustment are shown in Table 2. The quotient of Chi-square divided by
degree of freedom is smaller than 3; AGFI exceeds 0.8 and; GFI exceeds 0.8 and RMR less
than 0.08. According to the results, the indices show that acceptable fitness of measurement
model. Furthermore, the correlation between 3 latent variables are shown in Table 3, 0.38
(ambient conditions and spatial layout & functionality), 0.24 (ambient conditions and signs,
symbols, & artifacts), and 0.26 (spatial layout & functionality and signs, symbols, & artifacts)
respectively.
Table 2 Result of measurement model fitness indices
Chi-square df Chi-square/df GFI AGFI RMR
Suggested value - - < 3.000 > 0.800 > 0.800 < 0.080
45.685 24 1.904 0.926 0.862 0.069
Table 3 Correlation between latent constructs
Constructs ambient conditions spatial layout & functionality
signs, symbols, &
artifacts
ambient conditions 1.00 0.38 0.24
spatial layout & functionality
- 1.00 0.26
signs, symbols, &
artifacts
- - 1.00
In Table 3, there are the results of measurement model. The standardized factor loadings are
statistically significant, and above the threshold of 0.5 except V7. The composite reliability
estimates of three servicescape constructs are 0.716, 0.691, and 0.806 respectively. They
exceed acceptable threshold 0.6 suggest by Hatcher (1998). Thus, this means all constructs
adopted in this research are highly reliable. We further estimate the average variance extracted
(AVE), which assesses the amount of variance that is capture by an underlying construct in
relation to the amount of variance due to measurement error (Fornell and Lacker 1981). The
estimations of AVE in Table 4 exceed 0.5. Fornell and Lacker (1981) suggests that the
minimal acceptance level of variance extracted estimates should exceed 0.5. Therefore, in the
consideration for all constructs, we can infer that our measurement model performs well.
Table 4 Analysis of measurement model
Standardized
factor loading
Composite
reliability
Variance extracted
estimates
Ambient conditions 0.716 0.555 V1 0.693*
V2 0.548*
V3 0.777* Spatial layout and functionality 0.691 0.534
V4 0.764*
V5 0.669*
V6 0.517* Signs, symbols, and artifacts 0.806 0.650
V7 0.432*
V8 0.865* V9 0.931*
Proceedings of the Eastern Asia Society for Transportation Studies, Vol.9, 2013
8
Note: *indicates t-test has reached the significance level of p<0.001
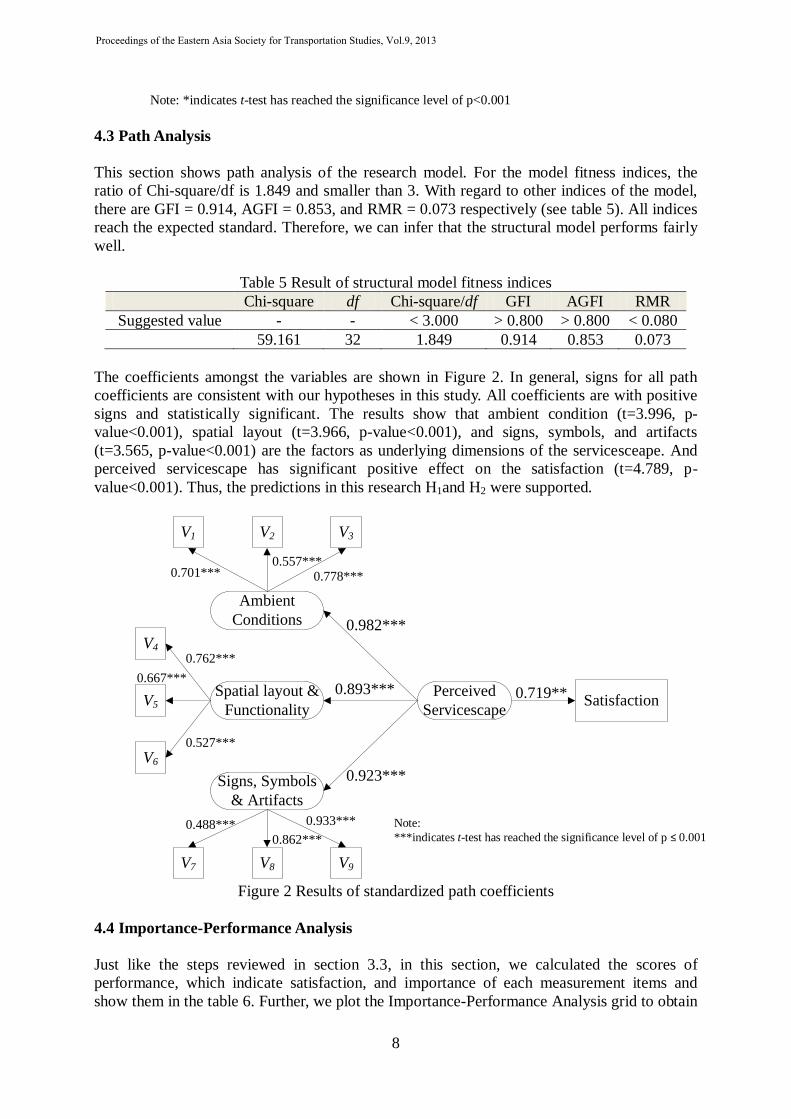
4.3 Path Analysis
This section shows path analysis of the research model. For the model fitness indices, the
ratio of Chi-square/df is 1.849 and smaller than 3. With regard to other indices of the model,
there are GFI = 0.914, AGFI = 0.853, and RMR = 0.073 respectively (see table 5). All indices
reach the expected standard. Therefore, we can infer that the structural model performs fairly
well.
Table 5 Result of structural model fitness indices
Chi-square df Chi-square/df GFI AGFI RMR
Suggested value - - < 3.000 > 0.800 > 0.800 < 0.080
59.161 32 1.849 0.914 0.853 0.073
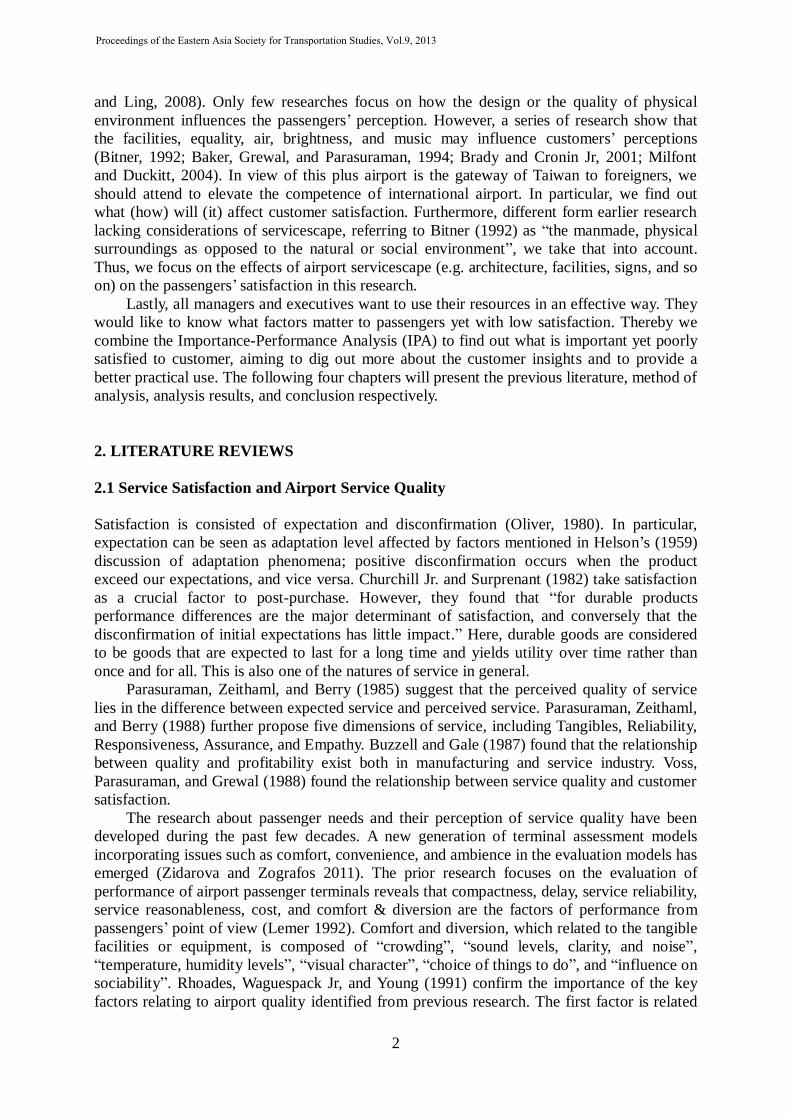
The coefficients amongst the variables are shown in Figure 2. In general, signs for all path
coefficients are consistent with our hypotheses in this study. All coefficients are with positive
signs and statistically significant. The results show that ambient condition (t=3.996, p-
value<0.001), spatial layout (t=3.966, p-value<0.001), and signs, symbols, and artifacts
(t=3.565, p-value<0.001) are the factors as underlying dimensions of the servicesceape. And
perceived servicescape has significant positive effect on the satisfaction (t=4.789, p-
value<0.001). Thus, the predictions in this research H1and H2 were supported.
Ambient
Conditions
Spatial layout &
Functionality
Signs, Symbols
& Artifacts
Perceived
ServicescapeSatisfaction
0.982***
V1
V5
V2 V3
V4
V6
V8V7 V9
0.893***
0.923***
0.778***0.557***
0.701***
0.762***
0.527***
0.667***
0.488***0.862***
0.933***
0.719**
Figure 2 Results of standardized path coefficients
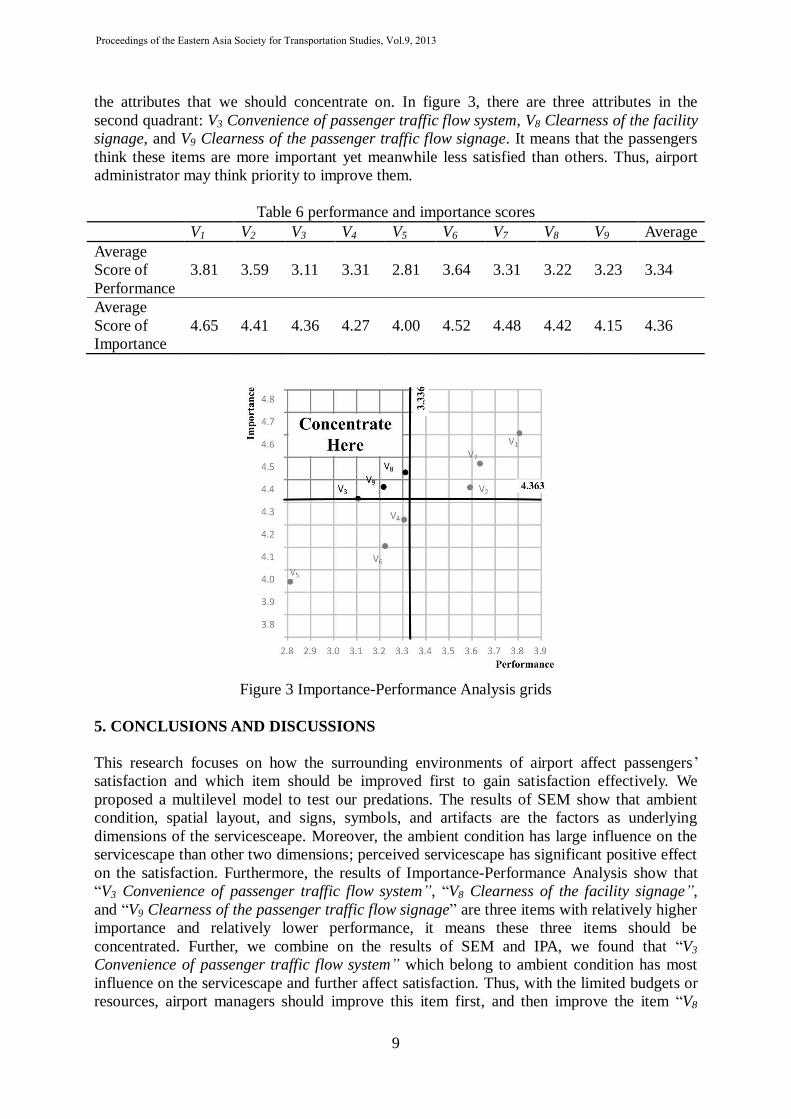
4.4 Importance-Performance Analysis
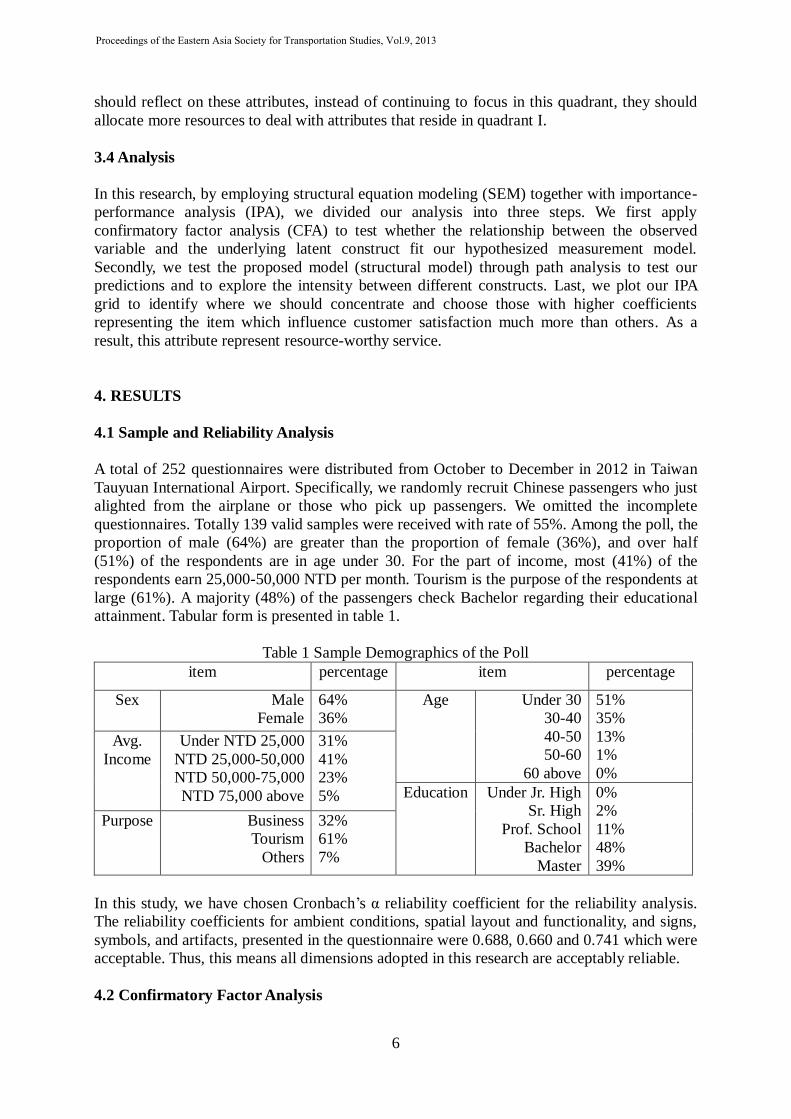
Just like the steps reviewed in section 3.3, in this section, we calculated the scores of
performance, which indicate satisfaction, and importance of each measurement items and
show them in the table 6. Further, we plot the Importance-Performance Analysis grid to obtain
Note:
***indicates t-test has reached the significance level of p ≤ 0.001
Proceedings of the Eastern Asia Society for Transportation Studies, Vol.9, 2013
9
the attributes that we should concentrate on. In figure 3, there are three attributes in the
second quadrant: V3 Convenience of passenger traffic flow system, V8 Clearness of the facility
signage, and V9 Clearness of the passenger traffic flow signage. It means that the passengers
think these items are more important yet meanwhile less satisfied than others. Thus, airport
administrator may think priority to improve them.
Table 6 performance and importance scores
V1 V2 V3 V4 V5 V6 V7 V8 V9 Average
Average
Score of
Performance
3.81 3.59 3.11 3.31 2.81 3.64 3.31 3.22 3.23 3.34
Average
Score of
Importance
4.65 4.41 4.36 4.27 4.00 4.52 4.48 4.42 4.15 4.36
Figure 3 Importance-Performance Analysis grids
5. CONCLUSIONS AND DISCUSSIONS
This research focuses on how the surrounding environments of airport affect passengers’
satisfaction and which item should be improved first to gain satisfaction effectively. We
proposed a multilevel model to test our predations. The results of SEM show that ambient
condition, spatial layout, and signs, symbols, and artifacts are the factors as underlying
dimensions of the servicesceape. Moreover, the ambient condition has large influence on the
servicescape than other two dimensions; perceived servicescape has significant positive effect
on the satisfaction. Furthermore, the results of Importance-Performance Analysis show that
“V3 Convenience of passenger traffic flow system”, “V8 Clearness of the facility signage”,
and “V9 Clearness of the passenger traffic flow signage” are three items with relatively higher
importance and relatively lower performance, it means these three items should be
concentrated. Further, we combine on the results of SEM and IPA, we found that “V3
Convenience of passenger traffic flow system” which belong to ambient condition has most
influence on the servicescape and further affect satisfaction. Thus, with the limited budgets or
resources, airport managers should improve this item first, and then improve the item “V8
Proceedings of the Eastern Asia Society for Transportation Studies, Vol.9, 2013
10
Clearness of the facility signage”, and “V9 Clearness of the passenger traffic flow signage”
which both belong to the signs, symbols, and artifacts. We suggest that the airport authority
should take this issue seriously and improve them as fast as they can. Practical examples
would be redesigning the passenger traffic flow system. In particular, make the contrast of the
signage sharper, use the consistent color in different terminals, or show the direction more
three-D or pop-out, because most of the passengers ask the instructor instead of watching the
instructions, to name a few. Satisfaction will genuinely be improved if the authority can solve
these problems.
This research aims to improve the surrounding environment quality of the Taiwan
Toayuan International Airport, and is surveyed in the arriving hall of terminal two only.
Nevertheless, we should cover more survey area, for example both departure and arriving hall
of terminal one (two) to avoid the state of being hurried of the respondents. And it is
suggested that follow-up researches expand the sample range and collect some different
country or culture samples to compare their servicescope perception.
REFERENCES
Arnold, S. J., Handelman, J. and Tigert, D. J. (1996) Organisational legitimacy and
retail store patronage. Journal of Business Research, 35(3), 229-239.
Athanasopoulou, P. (2008) Antecedents and consequences of relationship quality in
athletic services. Managing Service Quality, 18(5), 479-495.
Baker, J., Grewal, D., and Parasuraman, A. (1994) The influence of store environment
on quality inferences and store image. Journal of the Academy of Marketing Science,
22(4), 328-339.
Bitner, M. J. (1992) Servicescapes: the impact of physical surrounding on customer and
employees. Journal of Marketing, 56(2), 57-71.
Brady, Michael K. and Cronin Jr., J. Joseph (2001) Some new thoughts on
conceptualizing perceived service quality: a hierarchical approach. Journal of
Marketing, Vol. 65, 34-49.
Buzzel, R. D. and Gale, B. T. (1987) The PIMS principles: linking strategy to
performance, New York: The Free Press.
Chang, Yu-Hern and Yeh, Chung-Hsing (2002) A survey analysis of service quality for
domestic airlines. European Journal of Operational Research, Vol.139, 166-177.
Churchill, G. A. and Suprenant, C. (1982) An Investigation into determinants of
customer satisfaction. Journal of Marketing Research, 19, 491-504.
Crane, Fred G. and Clarke, T. K. (1988) The identification of evaluative criteria and
cues used in selecting services. Journal of Service Marketing, Vol. 2, 53-59.
Dagger, T.S., Sweeney, J.C., Johnson, L.W., (2007) “A hierarchical model of health
service quality: scale development and investigation of an integrated model,” Journal
of Service Research, 10(2), 123-142. Dabholkar, P.A., Thorp, D.I., Rentz, J.O. (1996), “A measure of service quality for
retail stores: scale development and validation,” Journal of the Academy of Marketing Science, 24(1), 3-16.
Hatcher, L. (1998) A step-by-step approach to using the SAS system for factor analysis
and structural equation modeling, 3rd Printing, Cary, NC: SAS Institute Inc.
Hoyle, R. H. and Panter, A. T. (1995) Structural Equation Modeling: Concepts, Issues
and Application, CA: Thousand Oaks.
James, P. S. (1982) Applied Multivariate Analysis, Malabar, FL: Robert E. Krieger
Publishing.
Jen, W., Tung, S., Lu, T. (2005) Effects of servicescape and waiting experience on
passengers‘ behavioral intentions and choice behavior in scheduled coach service.
Proceedings of the Eastern Asia Society for Transportation Studies, Vol.9, 2013
11
Transportation Planning Journal, 34(3), 413-442
Jen, William, Rungting Tu, and Tim Lu (2011), “Managing passenger behavioral
intention: an integrated framework for service quality, satisfaction, perceived value,
and switching barriers,” Transportation, 38 (2), 321-342.
Jöreskog, K. G. and Sörbom, D. (1993) LISREL8: User’s Reference Guide, Chicago, IL:
Scientific Software International.
Kotler, P. (1973) Atmospherics as a marketing tool. Journal of Retailing, 49(4), 48-65.
Lemer, Andrew C. (1992), “Measuring performance of airport passenger Terminals,”
Transportation Research Part A: Policy and Practice, 26, 37–45.
Lio, H. (Michael) and Rody, R. (2009) The emotional impact of casino servicescape.
UNLV Gaming Research & Review Journal, 13(2), 17.
Lu, Jin-Long and Ling, Feng-I (2008) Cross-cultural perspectives regarding service
quality and satisfaction in Chinese cross-strait airlines, Journal of Air Transport
Management, Vol. 14, 16-19.
Manataki, Ioanna E., and Konstantinos G. Zografos (2009), “A generic system
dynamics based tool for airport terminal performance analysis”, Transportation
Research Part C: Emerging Technologies, 17(4), 428-443.
Martilla, J. A., and James, J. C. (1977) Importance-performance analysis. Journal of
Marketing, 41(1), 77-79.
Mathwick, C., Malhotra, N., Rigdon, E. (2001) Experiential value: conceptualisation,
measurement and application in the catalogue and internet shopping environment.
Journal of Retailing, 77(1), 39-56.
Milfont, Taciano L., and Duckitt, John, (2004) The structural of environmental
attitudes: A first- and second-order confirmatory factor analysis, Journal of
Environmental Psychology, Vol. 24, 289-303.
Oliver, R. L., (1980) A cognitive model of the antecedents and consequences of
satisfaction decisions. Journal of Marketing Research, 17(4), 460-469.
Parasuraman, A., ZeithamI, V. A., Berry, L. L. (1996) The behavioral consequences of
service quality. Journal of Marketing, 60, 31 – 46.
Parasuraman, A., Zeithaml, V. A., Berry, L. L. (1985) A Conceptual Model of Service
Quality and Its Implications for Future Research. Journal of Marketing, 49, 41-50.
Parasuraman, A., Ziethaml, V. A., Berry L. L. (1988) SERVQUAL: A multiple-item
scale for measuring consumer perceptions of service quality. Journal of Retailing,
64(1), 12-40.
Rhoades, Dawna L., Blaise Waguespack Jr, and Seth Young (2000), “Developing a
quality index for US airports”, Managing Service Quality, 10 (4), 257-262.
Robert, J. K. (2009) Shipscape influence on the leisure cruise experience. International
Journal of Culture, Tourism and Hospitality Research, 2(4), 289-311.
Turley, L.W. and Milliman R. E. (2000) Atmospheric effects on shopping behavior: A
review of the experimental evidence. Journal of Business Research, 49(2), 193-211.
Voss, G. B., Parasuraman, A., Grewal, D. (1998) The roles of price, performance, and
expectations in determining satisfaction in service exchange. Journal of Marketing,
62, 46-61.
Weinrach, J. (2000) Environmental psychology: why should we care. Environmental
Quality Management, 10(2), 83-86.
Westwood, Sheena, Pritchard, Annette, and Morgan, Nigel J. (2000) Gender-blind
marketing: businesswomen's perceptions of airline services, Tourism Management,
Vol. 21, 353-362.
Woo, K.S., and Ennew, C.T. (2005), “Measuring business-to-business professional
service quality and its consequences,” Journal of Business Research, 58(9), 1178-
Proceedings of the Eastern Asia Society for Transportation Studies, Vol.9, 2013
12
1185
Yeh, C. H. and Kuo, Y. L. (2003) Evaluating passenger services of asia-pacific
international airports. Transportation Research Part E, 39, 35-48.
Zidarova, Elena D., and Konstantinos G. Zografos (2011), “Measuring Quality of
Service in Airport Passenger Terminals,” Transportation Research Record: Journal
of the Transportation Research Board, 2214, 69-76.
Proceedings of the Eastern Asia Society for Transportation Studies, Vol.9, 2013