Embed Size (px)
Citation preview

i
EFFECTS OF ACCESS TO MICROCREDIT ON THE FOOD SECURITY STATUS OF
CROP FARM HOUSEHOLDS IN NIGER DELTA, NIGERIA
BY
UKPE, OFFIONG UMA
PG/Ph.D/12/61560
DEPARTMENT OF AGRICULTURAL ECONOMICS,
UNIVERSITY OF NIGERIA, NSUKKA.
FEBUARY, 2016.

i
Title page
EFFECTS OF ACCESS TO MICROCREDIT ON THE FOOD SECURITY STATUS OF
CROP FARM HOUSEHOLDS IN NIGER DELTA, NIGERIA.
BY
UKPE, OFFIONG UMA
PG/Ph.D./12/61560
A Ph.D. THESIS SUBMITTED TO THE DEPARTMENT OF AGRICULTURAL
ECONOMICS, UNIVERSITY OF NIGERIA, NSUKKA IN FULFILLMENT OF THE
REQUIREMENT FOR THE AWARD OF DOCTOR OF PHILOSOPHY (Ph.D.) DEGREE IN
AGRICULTURAL ECONOMICS.
FEBRUARY, 2016

ii
Certification
This is to certify that Ukpe, Offiong Uma, a postgraduate student in the department of
Agricultural Economics with registration number PG/Ph.D./12/61560 has satisfactorily
completed the requirements for the award of Doctor of Philosophy (Ph.D.) degree in Agricultural
Economics. The work embodied in this thesis, except where duly acknowledged, is an original
work and has not been submitted in part or full for any other diploma or degree in this or any
other university.
--------------------------- --------------- ------------------------- --------------
Prof. Noble J. Nweze Date Prof. C. J. Arene Date
(Supervisor) (Supervisor)
------------------------------ ---------------- ------------------------- ---------------
Prof. S.A.N.D. Chidebelu Date External Examiner Date
(Head of Department)

iii
Dedication
This work is dedicated to my brother Mr. Etop Ukpe and family.

iv
Acknowledgement
I am eternally thankful to the almighty God for the grace and resources he has given me to do
this work; I would never have been able to come this far without you Lord, thank you for making
this dream come true, I owe it all to you.
I deeply appreciate my dear brother Mr. Etop Ukpe for sponsoring me through my Ph.D.
programme, my God reward you for making this a reality, you did not spare your resources and
made sure I had everything I needed at every point in time. You have in many ways showed me
what family means, thank you for the sacrifices you made to see me through school, thank you
for all your support. I will ever be grateful for this blessing.
My gratitude also goes to my late Dad; Mr. Uma Ukpe, who appreciated and believed in me.
Your words of encouragement to me, to always strife to improve myself and never be afraid of
excellence that the best will come to me, served as a spring board to me. You live on in my heart
Dad.
I appreciate my supervisors Prof. Noble J. Nweze and Prof. C.J. Arene for their guidance,
contributions and support towards the success of this work. They did not only supervise me but,
mentored and provided scholarly training in the process, thank you for everything. Many thanks
to the Head of Department Prof. S.A.N.D. Chidebelu, for his contributions to this work. I also
express my profound gratitude to Dr. A. A. Enete, Dr. F. U. Agbo, Dr. B. Okpukpara, Dr. E. C.
Amaechina, Mrs. C. U. Ike, other staff and students of the department of Agricultural
Economics, for their inputs during the pre and post field seminar presentations.
A big thank you to those who contributed towards the success of this work in many different
ways. To Dr I. C. Idiong, I say thank you for your contributions to this work, you are deeply
appreciated. To my colleagues, Dr. Ubokudom Okon, Dr. Sunday Brownson, Dr. Taofeeq
Amusa, Dr. Ubon .Essien, thank you so much for all your support. Thanks to Project Awake
team; Mrs. Rosemary Achonwa, Gerald Umeze, Godswill Emmanuel for your encouragement,
you are appreciated.
I am grateful for the contribution of my enumerators towards the successful completion of this
work. Many thanks to my family members, Mrs. Jelina Ukpe, Bassey, my Sister in-law Mrs.
v
Uduakobong Ukpe, Isang, Mfon, Enobong, Ekemini and Dickson, Eunice, Mary-Ann Kubianga,
Engr.& Mrs. Ekpo, Mrs. Catherine Olaitan, Helen Bassey, you are the best family there is, thank
for your overwhelming love and support. Special thanks to my pastors: Paul Idowu and Fred
Okeagu and Samuel Eyong for their spiritual support in the course of this work, God bless you.
My friends are deeply appreciated for their encouragement, love and support: Pharm. Samuel
Offor, you are one in a million, Mrs. Chidinma Okezie, Ginini Elemi, Essien Ekpenyong, Dr.
Ralph Iheke, Omolara Johnson, Iruka Obi, Mfon Oyelade, Dokwo Bassey and Chioma Okeagu.
Ignatius Nyong, Victoria Ndifon, Grace Demide, Ann Effa and Ngozi Otuonye, thank you for
making me feel at home in Nsukka.

vi
Abstract
The study evaluated the effects of access to microcredit on the food security status of crop farm
households in the Niger Delta. The study specifically: identified microcredit sources accessed by
small scale farmers in the region, determined factors that influence access to microcredit and the
amount of microcredit obtained, determined factors affecting frequency of accessing microcredit,
assessed the food security status of small scale farmers in the region, ascertained the effect of
microcredit access on food security status of small scale farmers and assessed the vulnerability of
farm households in Niger Delta to food insecurity. Primary data were collected using structured
questionnaires administered to three hundred and eighty four farm households, which were
selected by multistage, purposive, stratified and simple random sampling techniques. Data
collected were analyzed using: percentages, frequencies, Heckman Double hurdle model,
Poisson Regression model, Household Food Security Survey model, Multiple Discriminant
Function and Vulnerability Index analyses. The most accessed sources of microcredit were:
Cooperatives (36.03%), esusu (20.24%), and microfinance banks (10.93%). The following
explanatory variables: age (p<0.01), education (p<0.01), farm size (p<0.10), region of residence
(p<0.05) and organizational membership (p<0.01) had a positive and significant influence on
access to microcredit while, interest (p<0.01) had a negative and significant influence on access
to microcredit. On the other hand, variables that positively and significantly influenced amount
of microcredit accessed were: organizational membership (p<0.01), farm size (p<0.05) and
region of residence (p<0.10). Interest rate (p<0.01) had a significant and negative effect on the
amount of microcredit accessed. Analyzing factors influencing frequency of microcredit
accessed: gender (p<0.05), education (p<0.01), farm income (p<0.10) and interest (p<0.05) were
negatively significant while, age (p<0.01), experience in borrowing (p<0.01) and social capital
(p<0.01) were positively significant. The food security analysis results showed that majority
(87.76%) of farm households in the Niger Delta were food insecure while 12.24% were
marginally food secure. About18.49% of farm households occasionally allowed their children to
eat first, 67.45% occasionally bought food on credit, 45.57% sold their assets and 57.03% ate
once a day. These were some of the coping strategies mostly adopted by farmers against food
insecurity. The strongest predictor of the effect of microcredit on the respondents food security
status was, microcredit borrowed (0.749) while the weakest predictor was remittance status
(0.308).Vulnerability analysis showed that farm households in the study area were 51% more
likely to be vulnerable to food insecurity. Farmers should be encouraged to organize themselves
into cooperatives (for those who do not have cooperatives in their locality) or join cooperatives
(for non-members).This awareness can be created through; agricultural extension agents, village
meetings, social gatherings and through mass media such as; radio and television as, this will
enhance their access to microcredit and subsequently their food security status. Expanding the
scope and increasing the volume of microcredit to farmers, will alleviate their capital constraints
and enhance food security.

vii
Table of Contents
Title page
Approval page
Certification
Dedication
Acknowledgement
Abstract
Table of content
List of Tables
List of figures
List of Appendix
CHAPTER: ONE INTRODUCTION Page
1.1Background of the Study 1
1.2 Statement of Problem ` 8
1.3 Objectives of the Study 13
1.4 Research Hypothesis 14
1.5 Justification of the Study 15
1.6 Limitations of the Study 16
CHAPTERTWO: REVIEW OF RELATED LITERATURE
2.1 The concept of farm households 17
2.2 Definition of small scale farmers 18
2.3The concept of microcredit 18
2.4 The concept of food security 21
2.5 Access to credit 24

viii
2.6 Empirical evidence on credit accessibility 25
2.7 Empirical evidence on credit volume demanded 32
2.8 Components of food security 36
2.9 Food security in Nigeria and around the world 39
2.10 Measures of food security 43
2.11 Determinants of food security 45
2.12 Empirical framework on food security 47
2.13 Empirical evidence on effect of microcredit on food security 49
2.14 Household vulnerability to food insecurity 57
2.15 Empirical work on determinants of vulnerability 64
2.16 Theoretical framework 66
2.17 Analytical Framework 74
2.17.1. The Heckman Model 74
2.17.2 Poisson Model 76
2.17.3 Household Food Security Survey Model 78
2.17.4 Multiple Discriminant Function 79
CHAPTER THREE: METHODOLOGY
3.1The Study Area 86
3.2 Sampling Technique 87
3.3 Data Collection 88
3.4 Data Analyses 89
CHAPTER FOUR: RESULTS AND DISCUSSION
4.1 Socio-Economic Characteristics 98
4.1.1 Distribution of Respondents by Age 98
4.1.2 Distribution of Respondents by Education 98
4.1.3 Distribution of Respondents by Household Size 99
4.1.4 Distribution of Respondents by Farming Experience 99
4.1.5Distribution of Respondents by Gender 101

ix
4.1.6 Distribution of Respondents by Marital Status 101
4.1.7 Distribution of Respondents by Location 101
4.1.8 Distribution of Respondents by Production Pattern 102
4.1.9 Distribution of Respondents by Household Composition 103
4.1.10 Distribution of Respondents by Income sources 104
4.1.11 Distribution of Respondents by Total Household Income 104
4.1.12 Distribution of Respondents by Access to Remittance 105
4.1.13 Distribution of Respondents by Livelihood asset 106
4.2 Microcredit Sources accessed by Small Scale Farmers 107
4.3 Determinants of Access and Amount of Microcredit Obtained by
Sampled Farmers 109
4.4 Determinants of Frequency of Microcredit Accessed by Small Scale Farmers 113
4.5 Food Security Status of Farm Households 117
4.6 The Effects of Microcredit Access on Food Security Status of Farmers 118
4.7 Vulnerability of farm households to food insecurity 128
CHAPTER FIVE: SUMMARY, CONCLUSION AND RECOMMENDATIONS
5.1 Summary 136
5.2 Conclusion 139
5.3 Recommendation 140
5.4 Contributions to Knowledge 141
5.5 Suggestions for Further Research 142
REFERENCES 143

x
List of Tables
Table Page
4.1 Socio-economic characteristics of the respondents 100
4.2 Distribution of respondents according to geographical location 102
4.3 Percentage distribution of Production Patterns among the respondents 102
4.4 Household composition of the respondents 103
4.5 Distribution of the respondents by Major Income Sources 104
4.6 Distribution of respondents by Total Household Income 105
4.7 Distribution of Respondents by access to Remittance 106
4.8 Distribution of Respondents by Livelihood asset ownership 107
4.9Microcredit Sources accessed by Small Scale Farmers 108
4.10 Heckman Model Analysis of Factors influencing access and amount of microcredit 111
4.11 Poisson Model Analysis of Factors influencing Frequency of access to microcredit 115
4.12 Distribution of Respondents according to Food Security Status 117
4.13 Distribution of Respondents according to Coping Strategies to Food Shortage 118
4.14 Group Statistics of Factors Affecting Food Security 120
4.15 Standardized Canonical Discriminant Function Coefficient 121
4.16 Structure Matrix 122
4.17 Eigen Value 125
4.18 Wilks’ Lambda 126
4.19 Food Security Typology Classification 127
4.20 Test of Equality of Group means 128
4.21Vulnerability of Farm Households to Food insecurity in Niger Delta Region 132

xi
List of figures
Figure Page
2.1 Sustainable Livelihood Framework 71
3.1 Map of Niger Delta States Nigeria 87

xii
List of Appendix
Appendix No.
1 Questionnaire used 166

1
CHAPTER ONE
INTRODUCTION
1.1 Background of the Study
About 805 million people throughout the world and particularly in developing countries
do not have enough food to meet their basic nutritional needs (FAO,2014).Even though food
supplies have increased substantially the following factors prevent basic food needs from being
fulfilled:, continuing inadequacy of household and national incomes to purchase food, instability
of supply and demand, as well as natural and man-made disasters, prevent the poor from
achieving food security and earning a livelihood free of hunger (Fofana, 2006). The greatest
world major problem today is how to eliminate hunger and overcome poverty. This challenge is
the greatest in the developing countries where people starve for lack of adequate food and
nourishment and where starvation and poverty go hand in hand. The common strategy adopted
has been increasing output of food tonnage per year through land clearing, improved machinery,
better cultivation methods, improved seeds, and improved animal nutrition, breeding and health
without considering the quality and quantity of the agricultural products (food) that gets to the
ultimate consumer (Omotesho, Adewumi and Fadimula 2011). However, the world still faces a
serious food crises at least as perilous and life -threatening for millions of poor people as those of
the past. Although there is variation in the estimate of food insecure people all over the world,
available statistics show that a large portion of the world population have problem of food
insecurity (Wiebe, 2003; FAO, 2005a).
Hunger kills more people each year than AIDS, malaria and tuberculosis combined
(FAO, 2014). Food insecurity remains a global threat and human tragedy. It is by any measure a

2
miserable picture, which does not reflect well on the efforts that have gone into the hunger
alleviation programs on which enormous sums of public funds have been lavished (Abdulaziz,
2002).
Food insecurity is particularly serious in many low income countries. The United Nations
Food and Agricultural Organization estimates that one in eight people, were suffering from
chronic undernourishment between year 2010 and 2012. Almost all the hungry people live in
developing countries, representing 15 percent of the population of developing countries. There
are 16 million people undernourished in developed countries. The number of undernourished
people decreased by 30 percent in Asia and the Pacific, from 739 million to 563 million, largely
due to socio-economic progress in many countries in the region. The prevalence of
undernourishment in the region decreased from 23.7 percent to 13.9 percent. Latin America and
the Caribbean also made progress, falling from 65 million hungry in 1990-1992 to 49 million in
2010-2012, while the prevalence of undernourishment dipped from 14.6 percent to 8.3 percent.
But the rate of progress has slowed recently For instance, sub Saharan Africa and South Asia
stand out as the two developing regions where the prevalence of human malnutrition remains
high. The largest number of under nourished people are in Asia and south of the Sahara (FAO,
2012).
Estimates of the overall number of undernourished people in Africa have actually been
rising by the day as; one in four people are hungry. Over the past few decades it rose from 111
million in the period 1969-71, to 171 million in 1990-92, to 204 million in 1999-2001 (Benson,
2004). In sub-Saharan Africa, poverty is increasing and food security situation is deteriorating
(Hazell and Haddad, 2001). Children are the most visible victims of hunger and under nutrition,
which is the cause of 3.1 million child deaths annually (Black, Cesar, Walker 2013). Majority of

3
the death related to food security are reported to occur in sub-Saharan Africa and, the total
number of hungry people increases each year. In terms of proportionality, this was estimated at
34 percent in Africa and 23 percent in South Asia in 1998 (FAO, 1998). In sub-Saharan Africa,
the modest progress achieved in recent years up to 2007 was reversed, with hunger rising 2
percent per year since then (Lappe, Clapp, Anderson, Board, Messer, Pogge & Wise, 2013).
Though food insecurity is generally being reduced worldwide, the problem is actually
growing worse in Africa. This is due to increasing population growth and poor progress in effort
directed at reducing food insecurity in many countries in the continent. Given that food deficits
are projected to rise, the problem probably will only get worse (Trueblood and Shapouri, 2002;
Paarlberg, 2002).
The persistence of hunger in the developing world means ensuring adequate and
nutritious food for the population will remain the principal challenge facing policy makers in
many developing countries in the years to come (Omotesho, Adewumi, Muhammad-Lawal and
Ayinde, 2006).
The slow growth of agriculture and food production in Nigeria has resulted in growing
food imports and food insecurity. Households spend up to 70 per cent of their income on food
and yet nearly 50 per cent of the children under five are malnourished (Ibok, 2012). According
to West African Insight (2010), recent estimates put the number of hungry people in Nigeria at
over 53 million, which is about 30 percent of the Country’s total population of roughly 140
million people and, 52 percent live under the poverty line. These are matters of grave concern
largely because Nigeria was self-sufficient in food production and was indeed a net exporter of
food to other regions of the continent in the 1950’s and 1960’s.Things changed dramatically for

4
the worse following the global economic crises that hit the developing countries beginning from
the 1970’s onward. The discovery of crude oil and rising revenue from the country’s petroleum
sector encouraged official neglect of the agricultural sector and turned Nigeria into a net importer
of food.FAO named Nigeria in 2011 as one of the four countries facing imminent food crisis, our
food import bill has been skyrocketing. In 2015 for example, the Federal Ministry of Agriculture
reported that Nigeria was spending $11billion annually on food imports in the past few years
(Federal Ministry of Agriculture and Rural Development, 2015).
Before the emergence of oil as Nigeria’s dominant economic sector, the agricultural
sector contributed over 60 percent of Gross Domestic Product (GDP) and 90 percent of exports
(UN 2009). The economic relevance of the agricultural sector has since declined, with the share
of agriculture in GDP falling to 32.2 percent in the 1975-1979 periods and averaging 35 percent
between 1981 and 2006. The fall of agriculture in export share has been even more precipitous.
From 1960 to 1970, the export crop sub sector contributed 58.4 percent annually on average to
the total foreign exchange revenue. This declined to 5.2 percent over the period 1971-85 and
then further to 3 percent from 1995 to 1999. Similarly, the growth of output in the agricultural
sector declined from 3.8 percent in the 1987-1990 period to 2.2 percent between 1992 and 1995
(Adewuyi 2002). Within the 23 years from 1981 to 2003, aggregate agricultural production grew
by only 5.4 percent (Muhammad- Lawal and Atte 2006). Food and Agricultural Organization
(FAO) index of food prices indicated upward trends, increasing by 9 percent in 2006, 23 percent
in 2007 and 54 percent in 2008 (FAO, 2008).
Olajide, Akinlabi and Tijani (2011), in their study of agriculture resource and economic
growth in Nigeria reported that, the agricultural sector contributed 34.4 to GDP between 1970
and 2010. In the last quarter of 2012, the share of agriculture in GDP was 1.54 percent. This

5
further dropped to 1.43 percent in the first quarter of 2013. The drop was due to decrease in the
relative contribution of crop production, livestock, forestry and fishing from 1.27, 0.14, 0.04 and
0.09 in 2012 to 1.20, 0.13, 0.03 and 0.07 percent in 2013 (CBN, 2013).
Agriculture though a major contributor to Nigeria’s GDP, small scale farmers however
play a dominant role in this contribution but their productivity and growth are hindered by
limited access to credit facilities (Odemenem and Obinne 2010). Credit institutions can be
categorized into two groups: (a) formal, such as commercial Banks, micro finance Banks, the
Nigerian Agricultural and Cooperative Rural Development Bank (NACRDB), State
Government-owned credit institutions, NGO-MFIs and (b) Informal such as, Co-operative
Societies, money lenders, and rotating savings and credit association (Rahaji and Fakayode,
2009).
Ijaiya and Abduraheem (2000), define credit as financial resources obtained at a certain
period of time with an obligation to repay at a subsequent period in accordance with terms and
conditions of the credit obtained. Agricultural credit is loans extended to farmers for production,
storage, processing and marketing of farm products. Such credits can be short, medium or long
term depending on its duration. The purpose of agricultural credit may also be categorized as
livestock production credit, food crop production credit and cash crops production credit
depending on the purpose for which the credit is meant (Aku, 1995, CBN, 2004).
Explaining the effect of agricultural credit on agricultural output, Hazarika and Guha-
Khasnobis (2008) said that agricultural credit can have a secondary spillover effect on non-farm
households via input, labour and output linkages. When farmers face a credit constraint,
additional credit supply can raise input use, investment and hence output. This is referred to as

6
liquidity effect. Where agriculture still remains a risky activity, better agricultural credit facilities
can help farmers smooth out consumption, and therefore, increase the willingness of risk adverse
farmers to take risks and make agricultural investments; this is referred to as consumption
smoothing effect. Hence, a better agriculture credit may lead to a higher volume of food output if
the increase in credit is used to increase fertilizer, private investment in machines and food crops
(see also Rosenzweig and Binswanger,1993; Binswanger, Khander and Rosenzweig, 1993).
Microcredit is the extension of small loans given to borrowers who typically lack
collateral, and enables the poor to undertake income-generating activities to improve their
livelihoods. It has brought millions out of poverty and prompted economic sustainability
bringing a host of impacts on families that receive it. Microcredit is designed not only to support
entrepreneurship and alleviate poverty but, also in many cases to empower women and uplift
entire communities by extension (Yunus, 2004). It has been recognized as a significant means of
economic development in recent decades, especially during the microcredit summit held in
Washington DC in February 1997. In addition, the United Nations General Assembly nominated
2005 as the International Year of Microcredit in order to boost microcredit and microfinance
programs around the world. Since then, microcredit has attracted more attention from
governments, NGOs, researchers and development agencies (World Bank, 2006a).
A little over a decade, the issues confronting the Niger Delta region of Nigeria have
caused increasing National and International concern. The region produces immense oil wealth
and has become the engine of Nigeria’s economy, but it also portrays a paradox as the vast
revenues barely touch Niger Delta own pervasive poverty, hence giving birth to formidable
challenges to sustainable human development in the region (UNDP,2006). People are more
volatile, resulting in youth restiveness, conflicts between youths and community leaders, youth

7
and government agencies, youth and multinational companies (UNDP, 2006). These propagated
negative nominal and real shocks in every sector of the economy including agriculture, with the
economy operating under the atmosphere of politically unstable, eroded productivity and
declined private investments (Ministry of Niger Delta Affairs, 2011).
The credit market in the Niger Delta is dualistic in nature with small scale agro-based
producers relying on both formal and informal financial resources to fund production (Ministry
of Niger Delta Affairs, 2011). Whereas the formal credit market is organized, basically under
government supervision, the informal credit market is not organized with a lot of informality in
its operations (Essien and Idiong, 2008). However, while there can be little doubt of the formal
sectors superiority over the informal sector when it comes to financing large scale economic
development and projects of national and regional importance, the role and strength of informal
finance agents in small scale economies and their subsequent importance to low income
households cannot be under-estimated (Srinivas, 1993).
Within the parley of agricultural financing, informal credit sources are unquestionably
most popular (Udoh, 2005). Collateral free lending, proximity, timely delivery and flexibility in
loan transaction are some of the attractive features of informal credit available to farmers
(Khandler and Farugee, 2001). This is similar to what is obtainable in Islamic banking where
flexibility in transaction is highly emphasized, a situation which advocates that all parties in a
transaction share the risk, the profit or the loss of the transaction (James, 2008). However, unlike
formal financial sources, informal finance may not be adequate for meaningful food crop
production. The nature and operation of formal sources which have failed not only in delivering
credit to larger farmers but also in promoting a viable delivery system has caused an increase in
the patronage of informal credit sources by rural farmers (Egbe, 2000;Udoh, 2005).

8
With these issues, a well-organized credit market system can assist the poor and
marginalized people to access credit (Rutherford, 2001). Credit system facilitates the process of
job creation in which some will become self-employed entrepreneurs while others will be
involved with distinct business related activities (Thomas, 1992).
In fostering the development of a well-organized credit system, the CBN instituted the
micro-finance policy framework to guide and enhance the provision of diversified micro finance
services on a sustainable long-term basis for the poor and low-income group (CBN, 2010).
1.2 Problem Statement
Food is a basic necessity of life. Its importance is seen in the fact that it is a basic means
of sustenance and, an adequate food intake, in terms of quality and quantity, is a key for healthy
and productive life. The importance of food is also shown in the fact that it accounts for a
substantial part of a typical Nigerian household budget (Omonona and Agori, 2007). Food
insecurity remains a fundamental challenge in Nigeria. The Food and Agricultural Organization
(2002) enlisted the country among countries faced with serious food insecurity problems. The
problems of hunger and food insecurity have global dimensions and are likely to persist and even
increase dramatically in some regions, unless urgent, determined and concerted action is taken,
given the anticipated increase in the world’s population and stress on natural resources.
Agriculture provides food, employment and a means of livelihood for more than 60
percent of the productively engaged population. Regardless of the high level of involvement of
Nigeria in agriculture, acute shortage of food as a result of low productivity remains a major
problem. Agriculture receives less than 10 percent of the annual budgetary allocations. In 2013,
83 billion naira was allocated to the sector out of the over four trillion naira budget proposal, this

9
is just 1.7% of the budget and in 2014, it was allocated 1.47% and 0.89% in 2015, a far cry from
the 10% agreed by African Union member States to commit to agriculture in the Maputo
declaration on agriculture and food security. Underfunding in this regard is central to the crisis of
food production and food security in Nigeria (Vintagesam, 2014). The loss of food sovereignty
and dependence on food importation is also making the country quite susceptible to fluctuations
in global crisis. Abdullahi (2010), observed that massive food importation as a result of food
shortage, has led to the drainage of the nations scarce foreign reserves and decline in local
capacity due to competition from foreign food stuffs. The vision of Nigeria to have physical and
economic access to food on a continuous basis has therefore continued to remain a mirage (Rahji
and Fakayode, 2009; Adeyeye, 1999). As at 1986, about 14 million (16%) Nigeria was food
insecure with majority being peasant farming households (Abalu, 1990). Over 40% of
households across all agro-ecological zones in Nigeria face the problem of severe food insecurity
(Maziya-Dixton, Akinleye, Oguntona, Nokoe, Sanus and Hariss, 2004).
The 2010 Millennium Development Goal report states that the proportion of the Nigerian
population living below the hunger threshold increased from 29% to 33% between 2000 and
2009, implying little prospect of achieving the 2015 target of 14.5% of Nigerians living below
the hunger threshold. Worldwide financial crisis has sharply reversed trends of declining
numbers of hungry people: after dropping for much of the last decade, the ranks of the hungry
rose again in 2009. Roughly half of these are small scale farmers (Scherr, Wallace and Buck,
2011).
Available statistics show that low average per capita food intake, as well as energy,
constitutes perhaps the greatest obstacles to human and national development in Nigeria (Igene,
1997). The cost of inadequate diets to families and nations are considerably high. This includes

10
increased vulnerability to diseases and parasites, reduced strength for task requiring physical
effort, reduction of the benefit from schooling and training programs and general lack of vigour,
alertness and vitality. The outcomes of these is a reduction in the productivity of people in the
short and long terms, sacrifice in output and incomes, and increasing difficulty for families and
nations to escape the cycle of poverty. Attempt to ensure food security can therefore be seen as
an investment in human capital that will make for a more productive society. A properly fed,
healthy, alert and active population contributes more effectively to economic development than
one which is physically and mentally weakened by inadequate diet and poor health (World Bank,
1986).
There is no doubt that the Niger Delta region is blessed with natural resources. Apart
from oil, the region is also endowed with some of the country’s most fertile land. Ironically,
inhabitants of the region are not reaping the fruits of nature’s bounties as much as expected.
Petroleum exploration has ascended the scale of preference so much to the detriment of
agriculture and livelihood sources of communities in the Niger Delta. Petroleum exploration has
exposed the region to oil spillage (which affects fauna and flora of the ecosystem), flooding, the
depletion of aquatic lives, degradation of farmlands, which has led to hunger, starvation,
unemployment, etc. (Egbe, 2012).
There has been an ongoing debate on poverty during the last few decades. Poverty exists
everywhere in the world. The UNDP annual report from 2006 states that 2.5 billion people live
on less than 1.25 USD per day and account for only five percent of the global income, while the
richest 10 percent account for 54 percent of global income in developing regions. The proportion
of people living on less than 1.25 USD per day fell from 47 percent in 1990 to 22 percent in

11
2010. Furthermore, an estimated 800 million people will still be trapped in poverty and by 2015,
600 million will be left starving, most of them living in sub-Saharan Africa and South Asia.
Poverty is among the main determinants of hunger and inadequate access to food. Poor
households generally spend large portions of their incomes on food and most of them, including
many small scale farmers, are net food buyers. Most small scale farmers are too poor and cash
strapped and, even if they received adequate supplies of the right inputs, their land constraints
are so severe that any increase in productivity would still fall short of guaranteeing their food
security. The inability to consume enough food, in turn affects labour productivity and the ability
of the undernourished to generate income, thus reinforcing the poverty gap (Millennium
Development Goal report, 2013).
Some of the causes of poverty among these people are: low productivity and lack of
access to credit. Lack of adequate access to credit for the poor may have negative consequences
for various household level outcomes including technology adoption, agricultural productivity,
food security, nutrition, health and overall welfare (Diagne and Zeller, 2001). If households
operate poorly, the whole society is adversely affected. When a household malfunctions and
cannot satisfy the need of its members, it is the responsibility of the society and government
bodies to take action for the support of the household. For farm households, credit to support
farming as a policy alternative for alleviating their poverty and food insecurity is important
(Mattila-Wiro, 1999).
Microcredit interventions which had been in the core of economic analysis for two or
three centuries have re-emerged in research themes. This has happened because the target of
sustained capital accumulation, technological progress and economic growth has not been
achieved especially in the agricultural sector of developing countries. The per capita food

12
production in sub-Saharan Africa, including Nigeria has been on the decline in the past two
decades. This is because food production has not been able to keep pace with population growth.
The agricultural sector which provides food for this region needs to grow sustainably if it is to
meet the food needs of the people (Agom, 2001).
Low incomes and the savings capacity of people in most developing countries are
insufficient to finance farmers’ investment in new technology. Therefore external capital is
required to facilitate agricultural production which is dominated by small scale farmers, who
produce mainly for subsistence and have small land holdings which makes their demand for
credit small (Elhiraika, 1999).
Despite the investment opportunities which credit would offer poor households, formal
banks hardly lend to the rural people engaged in agricultural production because, they lack
collateral that they could offer as security for loans. Furthermore, owing to the small size of
loans, formal banks are averse to lending to the small borrowers because of high transaction cost.
Another reason why formal banks are reluctant to lend to people employed in agriculture is the
high uncertainty of their incomes which is highly dependent on weather and providence
(Nguyen, 2007).
The recognition of credit as a powerful instrument for the reduction of poverty and food
insecurity has led to multitude of programmes, aimed at providing credit to small scale farmers
in Nigeria (Oruonye and Musa, 2012).Considering the emergence of many credit programs and
financial institutions in the Nigeria and particularly in the Niger Delta region, there may be some
hope for small scale farmers, but to what extent has microcredit advanced to these farmers
improved their food security status?

13
In Nigeria, most of the work done has been on the effect of microcredit on poverty
alleviation, and very little work done on the effect of microcredit on food security, a case in point
is the research work carried out by Adebayo, Sanni and Baiyegunhi (2012) who examined the
impact of United Nations Development Programmes’ (UNDP) microcredit scheme on the food
security status of farm households in 3 Local Government Areas of Kaduna State. This study is
informative and methodologically sound, but it however examined the effect of only one source
of microcredit (formal) on food security status of beneficiaries. This research work attempted to
fill this research gap by providing answers to the following research questions:
1. What are the microcredit sources accessed by small scale farmers in the region?
2. What factors influence small scale farmers’ access to microcredit in the region?
3. What determines amount of microcredit obtained by small scale farmers in the region?
4. What determines the frequency of accessing microcredit by the small scale farmers in the
region?
5. What is the food security status of farmers in the region?
6. What is the effect of microcredit access on the food security status of small scale farmers
in the region?
7. Are farmers in the Niger Delta vulnerable to food insecurity?
1.3 Objectives of the Study
The general objective of this study was to evaluate the effects of access to microcredit on
the food security status of crop farm households in the Niger Delta.
The specific objectives were to:
1. identify microcredit sources accessed by small scale farmers in the region;

14
2. determine factors that influence access to microcredit and the amount of microcredit obtained
by small scale farmers in the region;
3. examine factors affecting frequency of accessing microcredit by the small scale farmers in the
region;
4. assess the food security status of small scale farmers in the region;
5. ascertain the effect of microcredit access on food security status of small scale farmers in the
region and
6. assess the vulnerability of farm households in Niger Delta to food insecurity.
1.4 Hypotheses of the Study
The following null hypotheses were tested in this study;
1. There is no significant relationship between the socio-economic attributes of the
respondents, their access to microcredit and the amount of microcredit they obtained;
2. Socio-economic attributes have no significant influence on frequency of microcredit
access among the respondents;
3. Socio-economic attributes have no effect on the food security status of small scale
farmers in the region;
4. Access to microcredit have no significant influence on the food security status of small
scale farmers and
15
5. Access to microcredit have no significant influence on farm households’ vulnerability to
food insecurity.
1.5 Justification of Study
The determination of the food security situation of the household can provide an
indispensible tool for assessment and planning, monitoring food security situation of a particular
population, may help in comparing the local food security situation to state and national patterns,
assess the local need for food assistance or track the effect of changing policies or economic
conditions and assess the effectiveness of existing programs (Bickel et al. 2000). Investing in the
agricultural sector by opening up access to microcredit will promote social cohesion and
reconciliation, which constitutes the building blocks for sustainable peace (United Nations,
2012).
Robust economic growth cannot be achieved without putting in place well focused
programme(s) to reduce poverty and food insecurity through empowering the people by,
increasing their access to factors of production, especially credit (Mafimisebi, Oguntade and
Mafimisebi, 2009). It is therefore imperative that the effects and relationships of microcredit on
farm household’s food security be well established as a reference point for economic policies. To
assess the achievement of the millennium development goal of halving the proportion of hungry
people by 2015, an evaluation of the effects of access to microcredit on the food security status
of farm households in the Niger Delta region will enable policy makers design appropriate
intervention measures to address this issue.
Essentially, the study attempts to extend literature on small scale agriculture financing in
a post-conflict region. Understanding the different drivers of microcredit to small scale farming

16
households, could help illuminate how financial institutions can rearrange lending mechanisms
in order to target vulnerable farmers in post conflict region. The outcome of this research will
provide a platform form for decisions involving the Niger Delta region and the betterment of the
life of its impoverished citizenry, who may not have carried arms but, are grossly affected by the
grave economic situation in the area. It is intended that at the end of this study, it will serve as a
guide and reference source to researchers; government, development planners and all others
interested in promoting food security in Nigeria and the world at large. It will add to the body of
existing knowledge with respect to food security and household microcredit accessibility in the
study area; and provide data for further study.
1.6 Limitations of the Study
The major problem encountered in the course of this study was that most
participating households do not keep records of their activities, and as such, many
households lacked sufficient information to adequately address all issues regarding income
composition. The study adopted expenditure approach in eliciting income data, because most
households were not willing to give information on their income, this reduced measurement
error. Furthermore, there was inconsistency in filling some of the research instruments; this
was addressed by using only the completed instruments for the study. Language barrier was
another challenge; this was overcome by recruiting and training of research assistant that
were indigenes of the area.

17
CHAPTER TWO
LITERATURE REVIEW
2.1 The Concept of Farm Household
The concepts of households have been defined by different researchers, for instance;
United Nation articulates that: “the concept of household is based on the arrangements made by
persons, individually or in groups, for providing themselves with food or other essentials for
living. A household may be either (a) a one- person household, that is to say, a person who
makes provision for his or her own food or other essentials for living without combining with any
other person to form part of a multi- person household, or (b) a multi- person household, that is
to say, a group of two or more persons living together who make common provision for food or
other essentials for living. The persons in the group may pool their incomes and may, to a
greater or lesser extent, have a common budget; they may be related or unrelated persons or
constitute a combination of persons both related and unrelated” (UN, 2008).
Mishra, Osta, Morehart, Johnnson and Hopkins (2002) in their study observed that the
households of primary operators of farms can be organized as individual operations,
partnerships, and family corporations. These farms are closely held (legally controlled) by their
operator and the operator’s household. Farm operator households exclude households associated
with farms organized as non-family corporations or cooperatives, as well as households where
the operator is a hired manager. Household members include all persons dependent on the
household for financial support, whether they live in the household or not. Students away at
school, for example are counted as household members if they are dependents. A household is
recognized as a group of more than one individual (although a single individual can also
constitute a household), who share economic activities necessary for the survival of the survival

18
of the household and for the generation of well-being for its members (Mattila-Wiro, 1999). This
study will adopt the definition of household by the Nigerian National Population Commission
which states that “a household consist of a person or group of persons living together usually
under the same roof or the same building/compound, who share the same source of food and
recognize themselves as a social unit with the head of the unit” (NPC, 2006).
2.2 Definition Small Scale Farmers
This study adopts Aina (2007) definition of small scale farming. He said that small scale
farms are small farms (0.5-4 hectares) operated by household. Small scale farmers have a poor
resource base and are daily faced with the problem of optimal utilization of their meager
resources to raise their income and subsequently their welfare and food security.
2.3 The Concept of Microcredit
The idea of microcredit is a Grameen Bank innovation and the success of the microcredit
scheme of the Grameen Bank among the poor women in Rural Bangladesh. This success story
has spread. Microcredit has been increasingly used as an effective tool for poverty alleviation
and is regarded as a “trickle-up approach” which has created new hope in poverty alleviation. It
has also been described as giving more hope in poverty alleviation than any other idea. There is
therefore a global consensus which has made microcredit approach a new paradigm for thinking
about economic development (Agom, 2001).
In recent times many authors have tried to distinguish the two terms; micro finance and
micro credit. Micro finance is defined as the provision of loans, savings opportunities, insurance,

19
money transfers and other financial products targeted at the poor and low income households
(Ehigiamuose, 2005).
Microcredit is the provision of small loans. In most cases, the average loan is equivalent
to 120 dollars to 150 US dollars. This study adopts N250, 000 as the maximum amount of
microcredit (Ehigiamusoe, 2005). Charistonenko (2004) defines microcredit as the extension of
small loans to micro entrepreneurs on low income and too poor to qualify for conventional bank
loans, which is channeled towards income generating enterprises. According to Mbat (2000),
microcredit involves making credit available to a group of poor people who are not properly
organized without asking for securities or determining their credit worthiness. Microcredit is a
credit specially packaged to suit the financial needs of the poor because they do not have the
necessary collateral demanded by the orthodox banks.
It is in this context that microcredit has recently assumed a certain degree of prominence.
It is based on the recognition that, the latent capacity of the poor for entrepreneurship would be
encouraged with the availability of small scale loans and would introduce them to small
enterprise sector. This could allow them to be more self-reliant, create opportunities and not the
least, engage women in economically productive activities (Zeller and Sharma, 1998). To avoid
incurring much loss, most microcredit entities adopt the group solidarity approach. This has to do
with lending to a group of five to twenty- five individuals who are pursuing common economic
objectives and micro enterprise activities. These groups provide joint guarantees of each other’s
loan. The essence of group selection will encourage the members of the group to have
confidence in one another to the extent that access to credit for any member of the group will
depend on the consent of all the members of the group. The group members share in the risk and

20
benefits that are associated with the loan collected (Zeller,Sharma,Ahmed and Rashid, 2001 and
Bullen, 2004).
However, any time the groups gather together or form a forum, they always discuss
common problems; offer business advice to each member on how the loan collected is to be
repaid. One common characteristic of many successful microcredit programs for the poor is the
regular meeting of solidarity groups on a weekly, bi-weekly or monthly basis. These elements of
collectiveness guarantees close supervision, and pressure from the other members which not only
facilitates the regular repayment of the loans, but also plays a crucial role in forging the
solidarity of the borrower group (World Bank, 2000a).
Most terms and conditions for microcredit loans are flexible and easy to understand and
suited to the local conditions of the community. From the aforementioned definitions, three
features distinguish microcredit from other financial products these are;
- The smallness of the loans
- The absence of collateral and
- Simplicity of operations
In this study, microcredit means the provision of small loans to the poor and low income
households especially farmers to be used for production. To have a clearer understanding of the
meaning of microcredit, it is good to classify it based on sources. Informal sources according to
Ijere (2000) are provided by traditional institutions that work together for the mutual benefits of
their members. These institutions provide savings and credit services to their client.
Adebayo (2004) affirmed that the informal/traditional microfinance institutions operate
under different names in Nigeria, for instance; ‘esusu’ among the Yorubas, ‘etoto’ for the Igbos

21
and ‘adashi’ for the Hausas. The key features of these schemes are savings and credit
components, informality of operations and higher interest rates are prevalent. The informal
associations that operate micro finance in various names and forms are found in all the rural
communities in Nigeria, they also operate in the urban centres. Members of this group include
individuals, friends, relatives, neighbours, shopkeepers, moneylenders, landlords, cooperatives
and leasing associations (Otu, 2003).
Formal micro finance suppliers are licensed, supervised and regulated by the Central
Bank of Nigeria to operate as financial institutions. Their key features include; taking deposits
for members of the public and lending the funds to the users directly or indirectly, singly or in
groups. They have complete management structure, specialized manpower and are generally
motivated by profit drive. They may be fully owned by public or private institutions or
individuals. Members of this group include; Nigeria Agricultural Cooperative and Rural
Development Bank (NACRBD), Micro finance Banks (MFB), among others (Adebayo, 2004).
The source of funds for multipurpose cooperatives is the individual membership monthly
contribution, while for the organized micro finance; they are aids and grants which mainly come
from abroad. Major donor organizations are; United Nations Development Programme (UNDP);
Department for International Development (DFID), Ford Foundation, African Development
Foundation (ADF), Community Development Foundation among others (Otu, 2003).
2.4 The Concept of Food Security
Generally, whatever is consumed to provide energy and nourishment for the human body
for an active healthy life is termed food (Okolo, 2004).While it is difficult to properly
conceptualize the nature of food security in Nigeria, a wide variety of measures have been

22
utilized in an attempt to begin to quantify its scope. In this section, trends in the evolution of
definitions of food security are explained, while the state of food security in the country is
assessed based on the four broad categories of food security measures, namely; food availability,
food access, stability of access, as well as food utilization.
Food security is a multidimensional concept that has evolved over time and space.
Concern about food security originated in the mid-1970s due to the international food problems
that emerged as part of a larger global economic crisis. The initial food security focus was
macroeconomic in nature and was mainly concerned with assuring the availability and price
stability of foodstuffs at the international and national levels. Consequently, food security was
traditionally measured through aggregate food supplies, food availability, accessibility, and
adequacy (Busch and Lacy 1984; FAO 2003a; FAO 2003b). In addition to economic factors, the
preponderance of drought and famine in some developing regions of the world led to further
rethinking and refinement of the concept. Sen (1997), in a seminar publication, helped redefine
the food security discussion in the development literature. His contribution extended the concept
beyond mere availability of food in the macro sense to considerations of the constraints on
individual access to food (Webb, Coates, Frongillo, Rogers, Swindale and Bilinsky 2006).
Definitions of food security have evolved over time. At the 1974 world food summit,
food security was defined as, “availability at all times of adequate world food supplies of basic
foodstuff to sustain a steady expansion of food consumption and to offset fluctuations in
production and prices” (UN 1975). By 2001, the definition of food security evolved to, “a
situation that exist when all people , at all times, have physical, social and economic access to
sufficient, safe and nutritious food that meets their dietary needs and food preferences for an
active and healthy life” (FAO 2002). This definition implies that food insecurity reflects

23
uncertain access to enough and appropriate foods (Barrett 2002). This continuing evolution of
food security as an operational concept in public has reflected the wider recognition of the
complexities of the technical and policy issues involved. A comparism of these definitions
highlights the considerable reconstruction of official thinking on food security that has occurred
over time. These statements also provide sign post to researches and policy analysis which have
reshaped our understanding of food security problem as a problem of international and national
responsibility (FAO, 2002).
Food security is one of the several necessary conditions for a population to be healthy
and well nourished. Focus on food security ensures that the basic needs of the poorest and most
vulnerable groups are not neglected in policy formulation (Ajibola, 2000). One important aspect
of the wealth of a nation is the ability to make food available for the populace. In this connection,
food security therefore becomes an important factor in any consideration of sustaining the wealth
of the nations (Osundare, 1999).
Nigeria is one of the food deficit countries in sub-Saharan Africa, although it is arguably
better, in terms of food production than the others. Policy makers, economic planners and
agricultural experts believe that the country is not completely immune from having food crises
(World Food Summit, 1996). Food security has two aspects; ensuring that adequate food
supplies are available, and that households whose members suffer from under nutrition have the
ability to acquire food, either by producing it themselves or by being able to purchase it
(Riscopoulos, Mukanganya and Guyaux, 1998). However, irrespective of how food security is
defined, it is generally agreed that four distinct variables are central to the attainment of food
security- namely; food availability, access, utilization, and stability of access. Developing
policies and interventions to increase food security therefore requires an understanding of each

24
of these variables, their relationships and their relevance to particular groups of people
(Omotesho, Adewumi, Muhammad-Lawal and Ayinde , 2006).
2.5 Access to Credit
A household has access to a particular source of credit if it is able to borrow from that
source. The extent of access to credit is measured by the maximum amount a household can
borrow (its credit limit) Diagne and Zeller, (2001). This study considers access to microcredit
from the perspective of all those farmers whose credit applications were approved to obtain
either part or full amount of the loan.
In most developing countries, agricultural credit is considered an important factor for
increased agricultural production and food security because, it enhances productivity and
promotes standard of living by breaking the vicious cycle of poverty of small scale farmers
(Adebayo and Adeola, 2008). Credit is regarded as more than just another resource such as land,
labour and equipment, because it determines access to most of the farm resources required by
farmers. The explanation is that farmer’s adoption of new technologies requires the use of
improved inputs which may be purchased (Oladeebo and Oladeebo, 2008). Agricultural credit
can be obtained from both formal institutions and informal sources. In most cases, small scale
farmers are seen as conservative and unattractive to new and improved technology. However, the
fact is that they are rational not to engage in uncertainty bearing in mind their resource poor
circumstances. They will need external support in the form of credit to accommodate the
adoption of new practices and technology (Fosu, 1998).
Credit enables individuals to smooth out consumption in the face of varying incomes,
provides income for investment and improves ability to cope with unexpected expenditure shock

25
(Atieno, 2009). Most literature on microfinance suggests that non-market institutions such as
social networks can play an important role in dealing with credit market imperfections (Okten
and Osili, 2004), ironically, the role of social networks in enhancing access to credit is either not
taken too seriously or less well understood.
According to Porteous (2003), access to formal financial services in South Africa tends
to be limited to salary workers. This scenario prevails because of the practice of banks to demand
pay slip as a prerequisite for opening account. Daniels (2001) holds a similar view that, low level
of collateral among the poor to a great extent explained their limited access to financial
instruments in the formal banking sector.
2.6 Empirical Evidence on Credit Accessibility
There are many factors that influence access to credit in the formal and informal sectors
in both developing and undeveloped countries. Dallimore and Mgimeti (2003), observed that
long distances and high transport cost constrains the rural poor from access to formal financial
services mainly located in urban areas. Okurut (2006), reported that the features of the financial
product that influences access to credit include interest rates and collateral requirements. Diagne
and Zeller (2001) hold a similar view that, low levels of collateral among the poor to a great
extent explains their limited access to financial instruments in the formal banking sector.
According to Onogwu and Arene 2007, the low level of income and savings among small
holder farmers in Nigeria, impose limitations on the availability of adequate equity capital for
financing small-holder agriculture. They further stressed that; the remoteness of micro finance
institutions to small holder farmers in critical need of credit and the cumbersome lending
procedures further affects their accessibility to credit. This hits small holder farmers most as they

26
are being discriminated against by the financial system on the grounds that they are generally
risky and unviable, and the transaction costs for small loans are higher than those for large loans
(Okoye and Arene, 2005).
Vaessen (2001), in a study on accessibility of rural credit in Northern Nicarugua, showed
that access to credit is influenced by both lender and household characteristics. Hence at the
institutional level, the lender makes decisions based on the target group (men, women or both),
the selection criteria of clients ,the geographic area of operation, and the features of financial
products to be provided to address sustainability concerns, all of which influence credit supply.
At the household level, being part of the specific target group or in the target geographical area
influences credit access. Empirical analysis of the study revealed that probability of access is
positively and significantly influenced by education level, family size, off-farm activities and
access to a network of information/recommendations. According to Okojie, Monye-Emina,
Eghagona, Osaghae and Ehiakamen (2010), the lack of bank accounts, collateral, and
information regarding the procedure for accessing credits from banks limit rural women’s access
to credit from financial institutions in Nigeria.
Moreover, while Agnet (2004) opined that the complex mechanism of commercial
banking is least understood by the small-scale farmers, and thus, limits their access. Philip et al.
(2009) further observes that high interest rate and the short- term nature of loans with fixed
repayment periods do not suit annual cropping, and thus constitute a hindrance to credit access.
Gine, Jakiela, Karlan and Morduch (2006) conducted a study on micro finance games.
They created an experimental economics laboratory in a large urban market in Lima, Peru and
over seven months conducted eleven games that allowed them unpack micro finance mechanism
27
in a systematic way. The results help to explain why pioneering micro finance institutions (such
as Grameen Bank of Bangladesh and Bolivia’s Bancosol) have been moving away from group
based contacts towards individual loans. Further findings show that factors such as: age,
attendance in church activities, place of birth, assets, ownership of enterprise, household size,
number of workers in business determine access to credit schemes. He also observed that,
participants in games behaved strategically as economic theory would predict, making
investment choice under risk. Ultimately, these micro finance games show how strategic
behaviour and social concerns interact to yield effective contracts that can work both for
customers and lenders. He also observed that evidence exist that, the social factors undermine
profit maximization by customers and may blunt effectiveness of group-based approaches in
enhancing welfare and stimulating investment.
Okurut and Bategeka (2005) in their study, investigated the impact of micro finance on
the welfare of the poor in Uganda, noted that location influences access to credit schemes. The
urban households were more likely to have access to credit compared to rural households. He
further observed that other factors such as: educational level of household head, sex and age of
household head also influences access.
Similarly, Hongbin,Rozelle and Zhang (2004) in their study of microcredit programs and
off-farm migration in China observed that the following factors influence access: household size,
employment status, household heads off-farm employment, sex and education level of household
head.
In a study conducted by Diagne, Zeller and Sharma, (2000) on the empirical
measurement of household’s access to credit and credit constraints in developing countries, the

28
study showed a new methodological framework for measuring the level of household access to
credit. Empirical application of this method involves directly eliciting information in household
surveys. The methodology presented in this paper corrects the shortcomings of the direct method
by developing a conceptual framework and data collection methodology that focuses on the
concept of credit limit. This focus is justified by the fact that every potential borrower faces a
credit limit because of asymmetries of information between borrowers and lenders and, the
imperfect enforcement of loan contracts. Therefore, a household’s credit limit from any given
source of credit is the best measure of its degree of access to that credit source. Furthermore, the
changes in household behavioural and welfare outcomes in response to changes in its credit limit
represents the effects of access to credit (or improvement in access) on those household
outcomes.
Using data from Vietnam, Nguyen (2007), assessed the determinants of rural household
credit activity paying particular attention to identifying the separate channels of credit demand
and supply on the amount of credit obtained by households. To find the effects of household
characteristics on credit demand and supply, a bivariate Probit with partial observability and a
Heckman selection model was estimated. The findings of the study were thus: it was observed
that there is uniform access to formal credit across rural communities in Vietnam. The education
level of household head seems to have inverse u- shape effect on formal credit access: the least
and the most educated households borrow least. Subsequently, household size and rate of
working adults are found to have large positive and significant effects on access. Given the
employment nature in Vietnam where agricultural production dominated, more labour available
in a house is clearly an advantage as agricultural projects are easier to form and implement.
Furthermore, age of household head, household head sex, household working in agricultural
29
production, land holding and house ownership were all found to have positive and significant
effect and increase participation in household credit activity. Prediction of formal credit demand
is estimated reducing over the years suggesting lack of investment opportunities for rural
households.
Amudavi (2005), studied the effect of farmer community group participation on rural
livelihoods in Kenya. He examined the relationship between group participation and household
welfare and, the determinants of participation in different types of groups. Empirical analysis is
made with reference to local groups formed through communities’ own drive; and other groups
formed with the support of agencies external to a local area. The results show that human,
physical and natural capital holdings and gender are important factors explaining variation in the
economic welfare measures. Also, levels of education, size of livestock, size of land and secure
land tenure have the expected, significant and positive effects on welfare. Age of household head
was found to have a negative and statistically significant effect on welfare. Income and assets are
also measures of welfare, which also have a link with the level of participation. Furthermore,
sex, residence, assets and income were found to influence or enhance opportunities for
participation. Bebbington (1999); Narayan and Pritchett (2000), Weinberger and Juting (2006),
and Lyon (2003) also share similar views.
In analyzing the pattern of household participation in financial institutions and its effect
on access to credit as measured by the concept of credit limits (Diagne et al. 2000; Diagne and
Zeller, 2001) using bivariate Probit model with partial observability, they found out that, land
ownership, household size, education, distance to home of parents of household head and
residence determine participation in NGO credit groups.

30
Udonsi (2007), in his analysis of small holder farmers under Abia State Agricultural Loan
Scheme randomly selected ninety small holder farmer beneficiaries of Abia State Agricultural
Credit Loan Scheme from three agricultural zones of the State comprising, sixty crop farmers
and thirty livestock farmers. The results of the study show that, farm income, household asset
holding age and loan transaction cost were factors that had positive significant influence on
participation of small holder livestock farmer beneficiaries of the State loan scheme. The study
recommended that, loan should be made easily accessible to the farmer, by ensuring that source
of loan is located close to farm families.
Anacleti and Kydd (1996), used a discriminant analysis procedure to investigate the
factors that restrict Tanzanian small holder farmers’ access to credit. The study uses data
collected from three regions of the country in the analysis. The results indicate that, apart from
the banks’ targeted crop enterprises; there are a number of factors that constrain farmers’ access
to formal credit. These include: limited awareness of the credit facilities, lack of previous
experience in formal credit use, and the gender of the credit recipient.
Mohamen (2003), analyzed access to formal and quasi- formal credit by small holder
farmers and artisanal fishermen in Zanzibar. In collecting the primary data, questionnaires were
administered to 300 randomly selected households in some villages on Unguja and Pemba. Study
results show that there was inadequate flow of credit to the farming and fishing sub-sectors in
Zanzibar. The empirical evidence of the study indicates that age, gender, education, income
levels and degree of awareness on credit availability are factors that influence credit accessibility
by smallholder farmers and artisanal fishermen in Zanzibar. Moreover, the results of the mean
significant T-tests indicate that there is significant difference between the credit users and non-
users in relation to income levels, and value of productive assets owned by the respondents.

31
Evans, Adams, Mohammed and Norris, (1999) in their study of demystifying non-
participation in microcredit a population based analysis report that, given the current popularity
of microcredit schemes as a means of poverty alleviation, their accessibility to the poorest is of
obvious concern. Their work examines a targeted microcredit programme in Bangladesh to
access its coverage among the poor and to identify program-client related barriers impeding
participation. A population survey of over 24,000 households reveals that although three-quarters
are eligible to microcredit, less than one-quarter participate. Rates of participation in microcredit
are higher among poorer households. Multivariate analysis identifies lack of female education,
small household size and landlessness as risk factors for non-participation, based on 7% random
sample of this population.
Daniel, Job and Ithinji (2013), in their study of the social capital dimensions and other
determinants influencing household participation and level of participation in microcredit groups
in Uasin Gishu County, Kenya specifically Moiben division. In the study area, the microfinance
institutions and other lending organizations extended credit facilities to households through
individual and group lending schemes in their bid to increase household access to credit. A
structured questionnaire was used to gather information from 174 households from the division,
using the multistage sampling technique. Heckman selection model was applied to identify
factors that influenced households to join and the level of participation in the microcredit group.
The results indicate that age, gender, education, farm size, household size, farm income and
distance to the nearest financial institution influenced household decision to join the microcredit
groups. On the other hand age, farm size, total income, heterogeneity index, density of
membership, years of experience in group borrowing and decision making index significantly
influenced the level of participation.

32
Richard, Job and Wambua (2015), in their study of effects of microcredit on welfare of
households: The Case of Ainamoi Sub County, Kericho County, Kenya, examined factors
affecting access to microcredit, the levels availed and their effects on households’ incomes and
expenditures in Kericho County, specifically in Ainamoi Sub County, Kenya. A sample of 96
households which had accessed microcredit was compared with a similar number which had not
accessed microcredit. Stratification of households was done according to their membership to
microfinance institutions. Random sampling method was used to select loan beneficiary
households. The data was collected by administration of a structured questionnaire and Heckman
selection model was applied to identify the factors and their effect on the level of participation of
households in the microcredit. A total of nine explanatory variables were considered and the
overall power of the model used was found to be satisfactory at 8.497. The following factors
influenced access to microcredit: age, household size, gender, education, occupation, and
farming experience. Factors determining the levels of microcredit assessed by households were;
age, education and gender.
2.7 Empirical Evidence on Credit Volume Demanded
Studying credit demand and credit rationing in the informal financial sector in Uganda,
Okurut, Scoombee and Berg (2006), investigated the household and individual characteristics
that acts as determinants of both the demand and supply of formal and informal credit. Results
show that, credit demand (both whether individuals apply for credit and the volume of credit they
apply for) can be fairly well modeled using socio-economic characteristics of household. Credit
supplied by lenders is determined to a large extent by regional residence, although observed
socio-economic variables such as; household expenditure per adult equivalent, value of assets,
amount of land owned and even education all seem to play a role.

33
From the perspective of understanding the credit granting process, it is these informal
institutions that need to be understood most for their willingness to lend reduces credit
constraints for a sizeable proportion of the population allowing borrowers both to smooth
consumption and thereby improve their long run welfare, and to invest in productive activities or
human capital to lift their long run constraint (Okurut et al. 2006). This household data set has
confirmed what the literature on informal finance tells us, particularly regarding the large role of
non- observed variables such as character references. However, the macro- economic situation in
Uganda, with high economic growth sustained over a substantial period may have lifted some of
the constraints which may be more binding in other poor countries, such as scarcity of credit. In
this respect, the Ugandan case may be typical.
In a study of determinants of credit rationing, Zeller (1994) presents an analysis of the
determinants of loan rationing by informal lenders and by members of community-based groups
that obtain credit from formal lenders. The results show that formal groups obtain and use
information about the credit worthiness of the credit applicant in a similar way than formal
lenders do. Thus, the results confirm the theoretical argument that community-based groups have
an information advantage over digital formal bank agents. However, the results show that formal
group members and informal lenders similarly consider wealth and leverage ratio as criteria for
rationing. Thus, inequalities in frequency of loan rationing between the poorer and the richer
households not only exist in the group- based credit schemes, but also in informal credit markets.
The leverage ratio is seen as valid banking criteria for loan rationing. To the extent that poorer
households may tend to have higher leverage ratio, it has to be concluded that credit for the poor
has also its limit.

34
Kedir, Ibrahim and Torres (2009), in their study of determinants of access to credit and
loan amount: Household-level evidence from urban Ethiopia, restricted household level analysis
of credit rationing to rural data sets collected mainly from South East Asia. In Africa, credit
constraints are often investigated using firm level data. Empirical evidence on determinants of
credit constraints and amount borrowed by urban household is almost non-existent from sub-
Saharan Africa. Using an extended direct approach, they analyzed the Fourth Round Ethiopian
Urban Household Survey (2000) to separate households that do not have access to credit from
those who do. Results show a high percentage (26.6%) of credit constrained households, the
majority of which constitute discouraged borrowers. A probit model and a tobit procedure that
allows potential selectivity bias identified factors affecting households’ likelihood of being credit
constrained and the volume of loan amount respectively. Further analysis showed geographical
location of households, current household resources, schooling of the household head, value of
assets, collateral, and number of respondents, marital status and outstanding debt as significant
factors.
In a study of supply and demand for livestock in sub-Saharan Africa: lessons for
designing new credit schemes by Jabber, Ehui and Von (2002) based on analysis of credit supply
in Ethiopia, Kenya, Uganda and Nigeria, results show that public credit institutions do not have
sufficient funds to meet the demand for livestock credit and cannot mobilize savings from their
clients or other commercial sources for one reason or another. In addition, available credit does
not reach those who need it most and with whom it could have the greater impact due to the
application of inappropriate screening procedures and criteria to determine credit worthiness. In
the analysis of demand based on borrowing and non-borrowing sample households using
improved dairy technology, it is shown that not all borrowers borrowed due to liquidity

35
constraints while, some borrowers and some non-borrowers had liquidity constraint but did not
have access to adequate credit. Logistic regression analysis show that sex and education of
household head, training in diary, prevalence of outstanding loan and the number of improved
cattle on the farm had significant influence on both borrowing and liquidity status of household,
though the degree and direction of influence were not always the same in each country. Based on
the findings, it is suggested that combining public and commercial finance could solve the
problem of inadequate credit supply while inventory finance to community level input suppliers
and service providers might help in getting credit worthy and needy small holders at lower cost
than providing credit to small holders directly.
In a study of the factors that affect microcredit demand in Pakistan Kausar (2013), found
out that, there are many factors which may affect the demand of microcredit by the borrowers.
These includes the interest rate, relationship between lenders and borrower, government policies,
gender differences, perspective, credit worthiness of borrower, transaction cost, limited access to
credit, economic condition and the availability of information, etc, affects the demand of
microcredit in Pakistan. Microfinance institution provides small loan to poor people who are
disqualified for the formal loan. Micro finance is the wide range of provision of financial
services which include; services of payment, accepting deposits, lending loans, transfer of money
and insurance to low income and poor people. At the end, he concludes that the basic purpose of
microcredit is to provide the money to low income people and the poor to use it in activities of
businesses and also for improving their life standards. Nawai and Bashir, (2010) shares similar
view.
Fernado, (2006) in his study of understanding and dealing with high interest rates on
microcredit, noted that the interest rates charged on microcredit loans is higher than other loans.

36
This happens because; the credit services provided are for small sums of money and the cost of
these loans make interest on them very high.
Anang, Sipiläinen, Bäckman and Kola (2015) conducted a study on factors influencing
smallholder farmers access to agricultural microcredit in Ghana using household survey data
collected for the 2013/2014 farming season. The study approaches the access to microcredit from
two angles pertaining to the factors influencing access to loan and when accessed, the
determinants of loan size. Heckman selection model was chosen as the analytical tool for
addressing the possible presence of sample selectivity bias in the loan size regression. A multi-
stage stratified random sampling technique was used to select 300 smallholder rice farmers from
three irrigation schemes in Northern Ghana who were interviewed using a semi-structured
questionnaire. The study revealed that the following factors influenced access to agricultural
microcredit in Northern Ghana: gender, household income, farm capital, improved technology
adoption, contact with extension, the location of the farm, and awareness of lending institutions
in the area. Gender, household size, farm capital, cattle ownership and improved technology
adoption were the significant factors determining loan size.
2.8 Components of Food Security
Food availability
Food security research was on a micro level before, Sen (1997) focused on food
availability in a macro sense. The goal was to ensure that sufficient quantities of appropriate
kinds of food were available from domestic sources, imports, or donor sources (FAO 2003b;
Webb, Coates, Frongillo, Rogers, Swindale and Bilinsky, 2006). The focus of both domestic and
international policy was on removing constraints to food availability by concentrating on
agricultural policy, trade policy, marketing and transportation systems, the role of natural

37
disasters, and the price effects of economic policies. Eventually, the realization grew that
availability was necessary, but not sufficient to promote food security. Food can be available in a
country because of effective agricultural policy, good harvest in a particular year or massive
importation of food or food handout (aid). Massive food import, particularly, by developing
countries, usually has negative effect, on foreign reserve and causes budgetary hemorrhage,
while food aid, which is sometimes used as an economic instrument in the service of political
goal of donor countries, may even discourage food production activities in the recipient
countries. Therefore, any country that needs massive food import or food aid before its citizens
could feed would have only a short term solution to its food crises, but would not be food secure
for all time because the feeding of the people in that country will be dependent on the
willingness and sometimes the ability of the external suppliers to supply (Ikoku, 1980).
Food availability means that the overall supply should potentially cover all nutritional
needs in terms of quantity (energy) and quality (providing all essential nutrients); furthermore, it
should be safe (free of toxic factors and contaminants) and or good food quality (taste, texture,
and so on). In addition to this, types of food stuffs commonly available nationally, in local
market, and eventually at household level should be culturally accepted (Oshang, 1994).
Food security should be seen from the perspective of availability in quantitative and
qualitative terms. Food quality (hygiene) has to do with the cleanliness of food from its source to
consumption. Food, for instance, may be available, the source from which the food is produced
or processed may be unhygienic or, that the chemical substances used to produce or preserve the
food may constitute a health hazard. Health and safety consideration therefore becomes
important in food production. For example, given the general misuse of chemicals due to
illiteracy and ignorance particularly in developing countries (some chemicals used for treating

38
livestock disease types, indiscriminate application of pesticides to treat crop diseases or control
pest and other agricultural parasites) may be harmful to humans much later after consumption of
such products (Sinha, 1976). In essence a country should be considered as food secure when
food is not only available in quantity needed by the population consistent with decent living, but
the consumption of the food should not pose any health hazard to the citizen (Ibok, 2012).
Food access
Food may be available and hygienic but not accessible to the citizens. Recognizing that
the main problem of food security is lack of access rather than aggregate shortage of supplies,
focus on food security has since shifted from macro supply to focus on the ability of households
to obtain food in the market place or from other sources (Webb et al. 2006). Even though food
security for individuals is often the main focus of attention, food security is however a measure
of a household’s condition, not that of each individual in the household. Therefore, not all
individuals in a food insecure or hungry household are food insecure. This issue is especially
important for young children who are often shielded from even the most severe forms of food
insecurity and hunger (Hazarika and Guha-Khasnobis, 2008).
Having access to food includes having physical access to a place where food is available
and economic access, as well as a socially legitimate claim to food. It is important to note that in
many developing countries, the availability and access dimensions of food security are strongly
linked. While availability reflects the supply side of food security, access reflects effective
demand. The two concepts are linked by food prices (Staatz, Boughton, Duncan and Donovan.
2009).

39
Food utilization/consumption
This aspect of food security speaks to the proper usage of food and includes processing,
storage, consumption and digestion. How food is prepared (which affects nutritional value) and
the health of the individual consuming the food (which affects the ability to absorb and use
nutrients) affects food security. Providing nutritional education and family management skills is
another aspect of the process of ensuring food security (Staaz et al. 2009).
Stability of access
This aspect addresses the stability of household access to nutritious food. Fear of
instability in access to nutritious food in itself can have significant effect on the production and
consumption decisions of households which eventually directly affects the food security
experience and outcomes (nutritional and health) and is thus an important consideration (Ibok,
2012).
2.9 Food Security Situation in Nigeria and around the World
Shala and Stacey (2001), found that many countries experience food insecurity with food
supplies being inadequate to maintain their citizen’s per capita consumption. They also found
that sub-Saharan Africa was the most vulnerable region. The average amount of food available
per person per day in the region was 1,300 calories compared to the world wide average of 2,700
calories. F.A.O. (2004) concluded that Africa has more countries with food insecurity problems
than any other region.
The target set at the 1996 World Food summit was to halve the number of
undernourished people by 2015 from their number in 1990-92. The number of undernourished
people in developing countries using the old estimate was 824 million in 1990-92 and the world

40
population was 5,370million (US census estimates for 1991). In 2010-2012, the number had
increased to 870 million people. So rather than being cut in half to 420, the number has increased
to 870 million with the 500 million people millennium goal target. Thus the proportion was .143
and halving it would be .071. The current proportion (870 million hungry divided by 2013 world
population of 7, 095) is .122. Thus in 2013 the world is .051 of world population away from
reaching this target, or 362 million people. Thus, in summary, the world is from 870 million to
234 million people away from reaching a hunger reduction goal (FAO, 2013).
Nigeria, the most populous country in Africa having over 140 million people constitutes
about a quarter of continental total population and has agriculture as the largest sector of the
economy providing about two-thirds of the nation’s workforce (NISER, 2002). Agriculture
generates employment, income and provides food security (Braun, 2004). Food security should
emphasize local sources of production and processing within a food system that supports
economic and environmental sustainability but focuses primarily on creating food access,
especially for low-income people (Rimkus, 2004). Community food security cannot be expected
to solve all the ills emerging from current global food system “nor” is it intended as a
replacement for Federal entitlement programs aimed at poor and vulnerable residents
(Pothuskuchi, 2004).
American Dietic Association (2004) report shows that, age has an effect on mobility and
access to food as well as adoption, utilization and excretion of nutrients. Low income, limited
mobility and poor health are the factors most often attributed to causing food insecurity among
adults. Poverty is a string indicator of nutrition risk and food security (Brink, 2001, Wolfe,
1998).

41
The literature is replete with studies in food security especially in developing countries.
Clover (2003), Smith (2007), Babatunde, Omotesho and Sholatan (2007), Swaminathan (2008),
Oriola (2009), Fayeye and Ola (2007), are some of the works that have examined food security
in developing countries. Authors have argued that domestic policies in many developing
countries have contributed very marginally to food security especially in Africa, and that, despite
the growing global food production, hunger, malnutrition and famine are prevalent in many
developing countries. Oriola (2009) states that Nigeria’s case is particularly worrisome owing to
the abundant natural resources endowed the country. Clover (2003), acknowledged that actions
and plans to address food security have continued to fall short, while food insecurity remains a
theory issue. Fayeye and Ola (2007), further stress the fact that sub-Saharan Africa is ravaged by
poverty and severe malnutrition with 30 of the 45 countries having low or critically low level of
food security between 1991 and 2003. The author observed that food availability in the Sub-
continent which stood at 210 kcal/person/day within the same period is the poorest in the world.
Ukoha (1997) shows in his work that domestic food production was considered to be the major
determinant of food security.
There have been several attempts made by the Federal government to create programs to
achieve food security in Nigeria; many of which are developed with the aid and inputs of
international organizations. Some of the programs that have been implemented include:
Agricultural and Co-operative Bank (1973); National Accelerated Food Production Program
(1973); Agricultural Development projects (1975); River Basin and Rural Development
Authorities (1976); Operation Feed the Nation (1976); Agricultural Credit and Guarantee
Scheme Fund (1977); Land Use Decree (1978); the Green Revolution Program (1979/80); and
the Cassava Multiplication Program (1985-1999). Several institutions were also set up in order to

42
facilitate these programs including the Agricultural Credit Guarantee Scheme (ACGS); Rural
Banking Scheme (RBS); Nigeria Agricultural Insurance Company (1984); Directorate for Food,
Roads and Rural Infrastructure (DFRRI) (1986);Nigerian Agricultural Development Bank
(NADB); and the National Agricultural Land Development Authority (NALDA) (1991)
(Adewuyi 2002; Okafor, 2004).
Many of these initiatives were not successful because they were ad-hoc programs that
lacked focus. They were poorly conceived and implemented and were duplicates of already
existing programs and organizations (Fasoranti 2006). In addition, government policy was
inconsistent and projects were improperly monitored and implemented (Okafor 2004; Adewuyi
2002). Also in existence was an unfriendly macroeconomic policy environment characterized by
an overvalued exchange rate, a mismanaged subsidy regime and bad export crop pricing
schedules (Adewuyi and Okunmadewa 2001).This environment encouraged imports at the
expense of local crops, which led to crowding out of local production (Yusuf, 2008; Adewuyi
2002; Zarkari 1997, Muhammad-Lawal and Atte 2006). Several food crops (particularly tubers),
were also neglected in favour of cash crops, while government invested very little funding in
support of agricultural related research.
More recent programs created to achieve food security include several presidential
initiatives on selected crops (rice, cassava, vegetable, oil palm); Root and Tuber Expansion
Program (RTEP); The National Special Program on food security (NSPFS); Community Based
Agriculture and Rural Development Project (CBARDP); various phases of the National Fadama
Development Program (NFDP), amongst several other efforts. There is preliminary evidence that
some of these programs are improving productivity of farmers by encouraging technology
adoption and expanding farmer’s access to inputs, credit and extension services (Olawepo 2010;

43
Abubakar 2010). Assessment of the impact of these programs is ongoing (Oruouye 2011; IFAD
2009).
2.10 Measures of Food Security
It is generally accepted that addressing issues of food security in Africa (and the world at
large) necessitates a proper identification of the food insecure, the reasons for their insecurity
and the monitoring of changes in food security over time with explanations for the changes. In
many developing countries, particularly in sub-Saharan Africa, food security is commonly
measured through consumption and anthropometric measures. Food insecurity is also often used
interchangeably with similar concepts such as poverty, malnutrition and hunger, which can be
seen as extreme forms of food insecurity. However, many of the food security categorizations
based on these concepts do not sufficiently capture the multidimensionality of the concept
(Coates, Swindale and Bilinsky, 2007).
Methods for assessing whether families in developing countries are meeting their food
needs has evolved over time, but measuring food security has always been difficult due to lack of
sufficient nationally representative data collected at the household or individual level (Smith,
Alderman and Aduayom, 2006). As a result, a variety of methods have been utilized to assess
food security including measures based on national food supplies (Naiken 2003) and
anthropometric methods (Marcoux 2002; Madise, Matthews and Margetts, 1999). More recently,
attempts have been made to develop measures for developing countries patterned after
procedures utilized in the United States (Wunderlich and Norwood 2006; Nord, Satpathy, Raj,
Webb and Houser,2002; Melgar-Quinonez,Nord,Perez-Escamilla and Segall-Correa, 2008).
Another method often used to measure food insecurity in the developing world is the coping

44
strategies index. Coping strategies can be defined as a response to adverse events or shocks
(Devereux, 2001). These activities range in intensity from activities like food rationing or
drawing down savings, to more permanent strategies like the sale of assets.
As mentioned above, there is no unified concept of food security in sub-Saharan Africa
and Nigeria, more specifically. Some studies focus on limited access to food measured by
income and/or poverty, while others focus more on availability of food measured by caloric
intake. Some others focus more on the outcome of food insecurity such as low weights and
extreme hunger, while some care about dietary diversity, coping mechanisms or strategies with a
few more recent studies also considering household perception about their food security (Coates
et al. 2007; Meade, Rosen and Shapouri 2007; Barret 2002). Thus, as one would expect, this
diverse concept of food security is accompanied by similarly diverse food security measures,
which do not satisfactorily capture the multiple dimensions of food security.
In recent times, there has been a move towards survey-based collection of indicators.
These measures have been shown to be reasonably good at predicting who is most likely to
suffer food insecurity as a result of shocks. The US has a widely tested and accepted module for
gathering information, measuring and monitoring food security in the nation known as ;
Household Food Security Survey model. While limited, some interesting work has been done on
developing food security scale across the developing world. Fakayode, Raji, Oni, and Adeyemi
(2009) examined food security situation in Nigeria using the HFSS Model- where household
food security is a measure using a food continuum scale. Nord et al. (2002) explored the internal
validity of certain food security measures in Bangladesh, India and Uganda. Their results imply
that the US modules appropriately contextualized for different African countries could provide a
good basis for building an appropriate food security module. Following this work, the USAID,

45
Food and Nutrition technical assistance (FANTA) has developed the Household Food Insecurity
Access Scale (HFIAS), which is an adaptation of the approach used to estimate the prevalence of
food insecurity in the United States annually. The method is based on the idea that the
experience of food insecurity (access) causes predictable reactions and responses that can be
captured and quantified through a survey and summarized in a scale (Coates et al. 2007).
However, this study adopts the Household Food Security Survey Model in measuring food
security in the study area.
2.11 Determinants of Food Security
Determinants of food security in sub-Saharan Africa have been investigated by several
authors. Olayemi (1998) categorized factors affecting food security at the household level into
supply-side factors, demand- side factors, and the stability of access to food, which includes
household food and non- food production variability; household economic assets; household
income variability; the quality of human capital within the households; degree of producer and
consumer price variability and household food storage and inventory practices.
Nyangwesoi, Odaiambo, Odungari, Koriri ,Kipsat and Serem, (2007), in a study of
household food security in Vihiga district of Kenya found that household income, number of
adults, ethnicity, savings behavior and nutrition awareness significantly influence household
food security. In a similar study, Kohai,Tayebwa and Bashaasha (2005) established that the
significant determinants of food security in the Mwingi district of Kenya were participation of
households in the food-for-work program, marital status of the household heads and their
education level. Similarly, in a study of food security in the Lake Chad area of Bornu State,

46
Nigeria, Goni (2005) reported factors that influenced household food security, which include
household size, stock of home-produced food, and numbers of income earners in the household.
Food security and agricultural productivity are closely related in a country like Nigeria
with a very large rural and agrarian population. Therefore, factors that affect the agricultural
industry also have direct impacts on food security, in seven different categories they include:
1. Land and water related factors such as pollution, desertification, and erosion (Akinyosoye
2000; Adejoh 2009; Idumah 2006),
2. Climatic factors, particularly climate change leading to adverse and inconsistent weather
patterns (Adewuyi 2002; Egwuda 2001),
3. Agronomic factors mainly related to the scarcity and high cost of quality inputs (Egwuda
2001; Ojo,2005; Adejoh 2009; Peke 2008),
4. Farm management factors which emphasize the production technologies as well as the
relevance of cropping patterns used for particular crops (Adewuyi 2002; Oseni 2001),
5. Factors related to poor supporting Infrastructure including inadequate storage and
marketing facilities, inadequate extension services, poorly organized rural input, output
and financial markets, and substantial rural infrastructure including poor feeder roads
and limited access to clean potable water, good health services, electricity, telephone and
educational facilities (Fasoranti 2006; Okafor 2004; Adewuyi and Okunmadewa 2001;
Yusuf and Wuyah 2015; Peke 2008; Adewuyi 2002; Adejoh 2009) and
6. Policy related factors where; poorly conceived, poorly funded and inconsistent
government policy add another layer of constraints to the agricultural industry and
reduces the productivity of poor farmers (Adewuyi 2002; Okafor 2004). A related macro

47
factor is trade liberalization because globalization makes it difficult for developing
countries to develop an appropriate apparatus for equitable food production and
distribution (Usman and Ijaiya 2010).
The socioeconomic factors identified as increasing food insecurity are; household size,
this is important because it increases the number of consumers putting pressure on household
resources particularly food (Ayantoye 2009; Ibrahim, Uba-Eze,Oyewole and Onuk, 2009;
Agbola 2005), and households with a high dependency ratio are particularly prone to food
insecurity (Ayantoye 2009). In addition, households with farming as a primary occupation and
with many years of farming experience are also more likely to be food insecure, as most rural
farmers are subsistence or semi subsistence farmers with low incomes. Despite being food
producers, their productivities are so low that they can barely feed their families (Ayantoye
2009). Other characteristics of households that experience food insecurity include households
with older heads, male headed households, as well as farm households that experienced food
shortage prior to harvest (Ayantoye 2009; Agbola 2005). Factors that have been found to provide
a buffer against food insecurity include the education level of household head, the size of the
farm (households with larger farms are more food secure ) (Ayantoye 2009; Ibrahim et al. 2009),
as well as remittances received from relatives working in other towns or cities (Agbola 2005;
Ayantoye 2009; Ibrahim et al. 2009).
2.12 Empirical Framework on Food Security
Various researches have been done on food security. Omonona and Agoi (2007) carried
out an analysis of food security situation among urban households evidence from Lagos State
Nigeria. Primary data were used and these were obtained with a structural questionnaire. The

48
analytical tools used include tables, percentages and food insecurity incidence. The major
findings of the study are- the food insecurity incidence of the study area is 0.49. Food insecurity
incidence is higher in female headed households at 0.49 than in male headed households at 0.30.
Food insecurity incidence decreases with increase in level of education. There is decline in food
insecurity incidence as income increases from 0.41 for low income group to 0.20 for the high
income group.
Muhammadu- Lawal and Omotesho (2008), highlighted the place of cereals in farming
households and food security in Kwara State. The analytical tools used include descriptive
statistics and indices of food security. The study showed that more than 60% of the total
household in the study area are food insecure. Cereals provide 34% of the farming household’s
total calorie intake and 47% of protein supply, respectively. In view of its importance to food
security, this study suggests the need for increased domestic cereal production.
Idrisa, Gwary and Shehu, (2008), analyzed food security status among farming
households in Jere Local Government Area of Bornu State in North-eastern Nigeria. Primary
data were collected from 120 households selected through multistage sampling procedure. The
data were analyzed using frequency, percentage, the ad count method, food security gap and
squared food security gap. Major findings of this study indicated that the incidence of food
insecurity was high among the age bracket of 40-49 years (27.5%) but the depth and severity was
higher (0.24 and 0.41 respectively) among the age group of 50 years and above. Also households
with large family size, low income level and low level of education were mostly affected by food
insecurity condition. Eating once a day, allowing children to eat first and buying food on credit
were among the coping strategies adopted by respondents.

49
Fakayode, Rahji, Oni and Adeyemi (2009), examined the food security situations of the
Nigerian’s major farm households using Ekiti State, as a case study. The study comprised a
random sample of 160 farm households selected across 16 villages in the two Agricultural
Development Project (ADP) zones of Ekiti State. The USDA approach for analysis of farm
household’s food security was used to measure the intensity of food severity among the farm
households. Results showed that only 12.2% of the farm households were food secure, 43.6%
were food insecure with hunger (moderate) and 8.3% were food insecure with hunger (Severe).
Cassava, yam and their products were shown to contribute immensely to the food security status
of the farm household. The vast majority of Nigerians are reported to be food insecure as
revealed by studies on availability, utilization and access to food.
2.13 Empirical Evidence on Effect of Microcredit on Food Security
Thuita, Mwadime and Wangombe (2013), examined the effect of access to micro finance
credit by women on household food security in three urban low income areas in Nairobi, Kenya.
A total of 787 respondents comprising; 337 micro finance clients and 450 non-clients
participated in this study. Structured questionnaire was used to interview respondents in both
groups. Findings showed that, households of micro finance clients consumed more nutritious and
diverse diets compared to those of non-clients reflected in the dietary diversity scores for the two
groups which were significantly different. Participation in micro finance programmes led to
improved food security in the households of clients. The study provides evidence that access to
micro finance credit influences household food consumption patterns positively in urban low
income areas.

50
Using data from the 1995 Malawi Financial markets and Food Security survey, Hazarika
and Khasnobis (2008), in their study of household access to microcredit and children’s food
security in rural Malawi reports that, women’s relative control over household resources or intra
household bargaining power in rural Malawi, gauged by their access to microcredit plays a role
in children’s food security, measured by anthropometric nutritional z-scores. Access to micro
credit is assessed in a novel way as self-reported credit limits at microcredit organizations. It is
indicated that whereas the access to microcredit of adult female household members improves 0-
6 year old girls’, though not boys’, long- term nutrition as measured by height-for-age, the access
to microcredit of male members has no salutary effect on either girls or boys nutritional status.
This may be interpreted as evidence of a positive relation between women’s relative control over
household resources and young girls’ food security status. The women’s access to microcredit
improves young girls long-term nutrition may be explained in part by the subsidiary finding that
it raises household expenditure on food.
Diagne and Zeller (2001), in their study of access to credit and its impact in Malawi
report that, adequate access to credit enhances welfare outcomes by alleviating the capital
constraints on agricultural households, hence enabling poor households with little or no saving to
acquire agricultural inputs. This reduces the opportunity cost of capital intensive assets relative
to family labour, thus encouraging the adoption of labour-saving, higher-yielding technologies
and therefore increasing land and labour productivity. They also found out that, access to credit
increases the household’s risk-bearing ability, improves their risk-coping strategies and enables
consumption smoothing over time.
Zeller and Sharma (1998), argued that microcredit can help establish or expand family
enterprises, potentially making the difference between grinding poverty and economically stable

51
and secure life. But Burger (1989), observed that microcredit tends to stabilize rather than
increase income, and tends to preserve rather than create jobs.
Using a sample of four hundred and forty five (445) households from Northeast Thailand,
the findings of Coleman (1999), in his study of the impact of group lending in Northeast
Thailand reported that, the village bank credit did not have any significant effect on physical
asset accumulation, production and expenditure on education. The women ended up in a vicious
circle of debt as they used the money from the village bank for consumption and were forced to
borrow from money lenders at high interest rates to repay the village bank loans so as to qualify
for more loans. The main conclusion from their study was that credit is not an effective tool for
helping the poor enhance their economic condition and, that the poor are poor because, of other
factors but not lack of access to credit. A similar view is shared by Adams and Von Pischke
(1992) in a related research.
Mosely and Hulme (1998), in their study of thirteen (13) microcredit institutions in seven
developing countries concluded that, household income tended to increase at a decreasing rate,
as the debtors income and asset position improved. Diagne and Zeller (2001), in their Malawi
study also suggested that microcredit did not have any significant effect on household income.
Studying the effectiveness and the capability of micro finance institutions in enhancing
women’s livelihood and empowerment in rural areas, using both theoretical and empirical
approach that represents the interaction of women’s livelihood and microfinance; Fofana (2006)
carried out an empirical analysis which consist of micro finance institutions, and a survey
analysis applied to cross-sectional data collected from 185 women who have access to credit
from micro finance institutions and, 209 women who have no access to micro finance credit. The

52
results show that microfinance institutions have increased the income of female borrowers and
improved the level of farm production which is a main development goal in most African
countries whose economies are based on the agricultural sector. The study found, on the one
hand that women with more power in decision making have more chance to obtain micro finance
institution’s credit, on the other hand, access to micro finance institution’s credit led to the
improvement of women’s participation in household decision making through their contribution
in the household standard of living.
Zeller et al. (2001), in their study of group based financial institutions for rural poor in
Bangladesh measured the impact of the access to NGO credit services on various household
welfare indicators. Overall, the results show that, the targeted credit programs have had a
positive impact on household welfare in a number of ways; the quantity and quality of food
consumed, the health of household members, and the children’s education improved. The survey
on social attitudes and social capacity shows progress in social change, particularly in the areas
of inter household decision making and women’s coping capacity, physical mobility and
attitudes. An econometric analysis shows that credit access has a significant and strong effect on
income generation as, it improved income levels during unfavourable seasons, implying a
positive link between credit access and welfare. Morduch (1998) also affirmed this by using a
data set from Bangladesh. Pitt and Khandker (1995) using the same data as Morduch (1998)
found sizeable and significant effect of microcredit on household income.
On access to credit and its impact on welfare in Malawi, Diagne and Zeller (2001)
argued that, access to microcredit may not be an effective way of alleviating poverty, if the
necessary infrastructure and socio-economic environment are lacking. Findings from their study
shows that, formal lenders in Malawi such as, rural banks, savings and credit co-operatives and

53
special-credit programs prefer to lend to households with diversified asset portfolio and
therefore, more diversified incomes. The majority of households cannot borrow as much as they
want from either the formal or informal credit markets. When households are deciding on which
microcredit institution to participate in, interest rates on loans do not appear to be an important
factor, other characteristics of credit institutions and their services play a larger role. In terms of
impact of access to credit on household welfare, the study does not support the notion that
improving access to microcredit is always a potent means of alleviating poverty. In fact, the
analysis shows that when households choose to borrow, they realize lower net crop incomes than
non-borrowers. While this result is not statistically significant, it nonetheless indicates the risk of
borrowing.
Hulme and Mosley (1998), examined the impact of microcredit programme on income
and poverty through the effects on productivity, technology and employment. Khandker (1998),
expands the analysis to include effects on seasonality of consumption and labour, children’s
nutrition and schooling and, fertility and contraception. Zeller and Sharma (1998) analyses the
effects that microcredit programs might have on food security. Cohen and Sebstad (2000)
examined the effects of the programs on risk management strategies of poor households, which
affect the degree of their deprivation and vulnerability. These studies by and large support the
claim with some caution notes that microcredit can have potential to help poor people improve
their food security situation and welfare.
Rahman (1986) and Goetz and Gupta (1994) reported that, borrowers from the Grameen
Bank have had to sell household assets or their own food supplies, or have had to leave their
homes in search for wage labour in an urban area to repay their loans hence, indicating the
negative effect of microcredit on household food security and welfare.

54
Cheng (2006), conducted a study on the demand for microcredit as a determinant for
micro finance outreach-evidence from China. Evidence from the study showed that, improved
access to microcredit is basically accepted to have two effects; it could help generate income or it
could decrease the cost of consumption smoothing.
In a study of the implications of credit constraint for risk behavior in Malawi, Eswaran
and Kotwal (1999) observed that, the provision of microcredit to farmers is an effective tool and
strategy for promoting the adoption of improved technologies which will bring about
improvement in their living standards. Access to credit they say, promotes the adoption of risky
technology through the relaxation of the liquidity constraint as well as, through the boosting of
household’s risk bearing ability. With an option of borrowing, a household can do away with risk
reducing and inefficient income diversification strategies and concentrate on more risky but
efficient investment.
Nissanke (2002),in a study of donor support for microcredit as a social enterprise
examined the nature of support rendered by the donor community to micro finance programs and
the effectiveness of this particular outlet of official aid for micro-enterprise development and
poverty alleviation. To this end, the economics of micro finance as an instrument of micro-
enterprise development and poverty alleviation as well as its delivery mechanisms were
examined. The study further examined/ accessed empirical evidence of the performance of micro
finance institutions and their impacts on poverty alleviation and micro-enterprise development.
Findings showed that contributions of rural micro finance institutions to small holder income can
be limited or outright negative, if the design of the institutions and their services does not take
into account the constraints and demand of their clients. Furthermore, he noted that, developing

55
attentive credit services requires identifying farm and non- farm enterprises and technologies that
are profitable under the conditions experienced by subsistence-oriented farmers.
In a study conducted in Bolivia among women involved in microcredit schemes,
women’s control of household resources was associated with improvements in quantity and
quality of food available to young children (Kenya Women’s Finance Trust, 2002). A study in
Ghana by; Foote, Murphy, Wilkens and Basiotis (2004) showed little significant difference in
household diet and food security between participants and non-participants. Brannen (2010),
conducted a study in India and concluded that micro finance can contribute to poverty alleviation
and food security through enhanced investment which contributes to consumption smoothing.
In another work by, Hamad, Lia and Fernald (2010), on microcredit participation and
nutrition outcomes among women in Peru, the study showed that longer participation in micro
credit schemes, lowered food insecurity. It supports the notion that microcredit participation has
positive effects on the nutritional status of female clients.
Siyom , Hilhorst and Pankhurst (2012), conducted a study on the differential impact of
microcredit on rural Ethiopian household. Though credit is generally expected to have positive
impact on household livelihoods, this study argues that credit affects households differently
depending on wealth. Results show that credit failed to enable poor households to move out of
poverty and food insecurity, whereas better-off and labour rich households used credit to
improve their livelihoods. For poor households, rather than achieving long term livelihood
improvements, access to credit only means short term consumption smoothing with a risk of
being trapped into a cycle of indebtedness. Participation in a safety net programme could, to
some extent, break through this cycle, because such participation enhanced the credit worthiness

56
of poor households. This study is based on ethnographic research, including a survey of 106
households, over an 18 –month period.
In their study of access to microcredit and its impact on farm profit among rural farmers
in dry land Sudan, Ibrahim and Bauer (2013), assessed the access to credit problem that persist
in dry land of Sudan, taking North Kordofan as a case in point. Using data from field survey
conducted in 2009, using structured questionnaire, two hundred (200) farm households were
selected through multi stage sampling technique. Results showed that the credit users were found
to be better off compared to non-users. Results obtained from a Probit model showed that
savings, value of assets and income are significant variables determining the credit constrained
conditions. In addition, the results of Heckman model showed that credit has limited effect on
farm profits. This indicates that loan volumes may be too small to making significant impact on
farm production.
Richard, Job and Wambua (2015), in their study of effects of microcredit on welfare of
households: The Case of Ainamoi Sub County, Kericho County, Kenya. This study examined
factors affecting access of microcredit, the levels availed and their effects on households’
incomes and expenditures in Kericho County, specifically in Ainamoi Sub County, Kenya. In the
study area, different portfolios have been used to extend credit, suggesting ability to reach a wide
section of all cadres of the population. However, the impact on the welfare across beneficiaries
had not been established. This study sought to fill this knowledge gap. A sample of 96
households which had accessed microcredit was compared with a similar number which had not
accessed microcredit. Stratification of households was done according to their membership to
microfinance institutions. Random sampling method was used to select loan beneficiary
households. The data was collected by administration of a structured questionnaire and,
57
difference in difference (DID) model was used to analyze the effects of microcredit on incomes
and expenditure of households. Results showed that participation in microcredit program resulted
in improvement of the beneficiaries’ quality of life.
Adebayo, Sanni and Baiyegunhi (2012), examined the impact of microcredit scheme on
food security status of beneficiaries in Kaduna State, Nigeria. They used the food security index
and propensity score matching to evaluate the impact of the United Nations Development
Programs (UNDP) microcredit scheme on the food security status of farm households in 3 Local
Government Areas of Kaduna State. A purposive random sampling technique was used to select
fifty-six (56) beneficiaries and one hundred and sixty (160) non-beneficiaries’ households. Thirty
nine percent of beneficiaries household are food insecure with a food security index of 1.83. The
propensity score match showed that the United Nations Development Programs microcredit
scheme had no significant impact on the food security status of beneficiaries, while the
calculated Average impact of treatment on the treated (ATT) was negative (-60.68), indicating
that the UNDP microcredit scheme in the study area has not contributed significantly to the food
security status of beneficiaries.
2.14 Households Vulnerability to Food Insecurity
Considerable attention has been given to the study of food insecurity in developing
countries however; there are relatively fewer empirical studies, in the literature, on the
vulnerability of households to future food insecurity. Yet reducing vulnerability is a pre-requisite
for achieving global and national food security targets (Lovendal and Knowels, 2005).
Vulnerability to food insecurity refers to people’s propensity to fall or stay below a pre-
determined food security line/status (Zeller, 2006). The concept of vulnerability is used with
58
different connotations. A fundamental difference exists between vulnerability as defenselessness
vis-a-vis a harmful event (for example, vulnerability to drought) and vulnerability to a specific
negative outcome, following a harmful event for example, vulnerability to food insecurity.
Vulnerability is a “forward looking” concept; it seeks to describe people’s proness to a future
acute loss in their capacity to acquire food. Vulnerability ideas play an important role in
predicting the onset of food crises. Vulnerability is a function of exposure to risks/shocks and the
resilience to these risks. Risks/shocks are events that threaten households’ food access,
availability and utilization and hence their food security status. Resilience in the food security
context is determined by the effectiveness of risk management strategies (through prevention,
mitigation and coping) and by the resources that can be drawn upon. Vulnerable groups comprise
people with common characteristics, who are likely to fall or remain below the welfare threshold
in the near future. While most of those who are presently below the threshold level may face a
high probability of being so in the future, food security and poverty are not static, people move
in and out of food insecurity and poverty. (Lovendal and Knowles, 2005)
Vulnerability is linked to the uncertainty of events, everyone is vulnerable to food
insecurity, but some more so than others. Vulnerability can be thought of as a continuum. The
higher the probability of becoming food insecure, the more vulnerable one is. Being food
insecure today does not necessarily indicate vulnerability, because the food situation could
improve. The probability of becoming food insecure in the future is determined by present
conditions, the risks potentially occurring within a defined period and the capacity to manage the
risks. Vulnerability is determined by a cumulative of events over time. What happened yesterday
is reflected in today’s status and what happened today influences tomorrow’s status. Risks
factors threaten food security today and cause vulnerability.

59
Farm household’s make considerable movement in and out of poverty depending on the
natural, social and economic environments of varying degrees of risks and uncertainty they are
embedded in. At the household level, the major types of risk include health (illness, disability,
injuries), life cycle- related (old age, death, dowry), social (inequitable, intra-household food
distribution) and economic risks (unemployment/underemployment, harvest failure, fall in
prices) which are very common in Nigeria and other developing countries. This may be mainly
due to the absence of easy access to medical care, portable drinking water, unhygienic living
conditions, and limited opportunities of diversifying income sources (Azam & Imai, 2012).
These difficulties are compounded by lack of financial intermediation and formal insurance,
credit market imperfections, and weak infrastructural facilities (Gaiha & Imai, 2004).
These risks cause food insecurity by lowering food production, reduce income, reduce
assets holding, increase indebtedness and reduce uptake of macro and micro-nutrients (Lovendal
and Knowels, 2005). In addition to some of the above risks, threats related to natural
environment, health and social conditions could affect groups of households or communities.
Farm households and communities face the risks of suffering from different types of
shocks. Some shocks affect communities as a whole (these are often referred to as covariate
shocks), such as economic and financial crises and natural disasters. Others affect one or a few
households (idiosyncratic shocks), such as a death or a loss of a job (Ninno & Marini, 2005).
Even though, any household can be affected by those shocks, not all of them have the same
probability of recovering from the consequences of suffering from them. Poor households that
lack the necessary physical, financial and human capital will be less likely to recover from it.
The concept of risk is gaining increasing importance in poverty literature (Azam & Imai,
2012). Sen (1999) observed that “the challenge of development does not only include the

60
elimination of persistent and endemic deprivation, but also the removal of vulnerability of
sudden and severe destitution”. This implies that adequate understanding of the risk-poverty
nexus and the way vulnerability affects basic household’s welfare is important generally for the
design of the developmental policies and poverty reduction in particular. In line with this,
Christiaensen, 2004 described vulnerability as an intrinsic aspect of wellbeing, he observed that
“one cannot limit oneself to the person’s actual welfare status today, but must also account for
his prospect for being well in the future. Since being well today does not imply being well
tomorrow. Chaudhuri (2003),construed vulnerability broadly as an ex-ante measure of wellbeing,
reflecting not so much on how well a household currently is, but what their future prospects are.
According to Calvo & Davon (2005), vulnerability can be understood as impact of risk in the
“threat of poverty, measured ex-ante, before the veil of uncertainty has been lifted”.
Vulnerability analysis takes into account the occurrence of shock, the level of poverty
and the availability of household’s livelihood assets. Vulnerability is thus a dynamic concept
and could be thought of as products of poverty, household’s exposure to risk and their ability to
cope with such risks. However, the presence of risks can distort household’s inter-temporal
allocation behavior, not only for those who are currently poor, but also for the non-poor who
have a high probability of becoming poor in the future. These distorted behaviours can be
economically costly and may propel household into persistence poverty (Carter & Barrett, 2006).
Ajah & Rana (2005), in their view underscored the need for adequate understanding of the risk-
poverty linkage, which they observed could be beneficial in identifying some of the key
constraints to poverty reduction binding at micro level. Identifying who are most vulnerable, as
well as what characteristics are correlated with movements in and out of poverty, can yield a
critical insight for policy makers. World Bank (2000b), emphasized that in order to address the

61
objective of poverty reduction, “policies should not only highlight poverty alleviation
interventions to support those who are identified as the poor ex-post, but also the poverty
‘preventions’ to help those who are poor ex-ante, that is, prevent those who are vulnerable to
shocks not to fall into poverty. These observations gave birth to the World Bank’s risk
management which highlights three types of risk management strategies: Prevention, Mitigation
and Coping (Holzmann & Jorgensen, 2000).
2.14.1 Prevention (ex-ante) Strategies
These are strategies that are implemented before a risk event occurs. Reducing the
probability of an adverse risk increases people’s expected income and reduces income variance,
and both of these effects increase welfare. There are many possible strategies for preventing or
reducing the occurrence of risks, many of which fall outside of social protection, such as sound
macroeconomic policies, environmental policies, and investments in education. Preventive social
protection interventions typically form part of measures designed to reduce risks in the labor
market, notably the risk of unemployment, under-employment, or low wages due to
inappropriate skills or malfunctioning labor markets. Examples include: savings, building up
stores, social networks, growing drought resistant crops, diversifying crops and income sources
and building up livestock (Ellis, 2000).
2.14.2 Mitigation Strategies
As with prevention strategies, mitigation strategies aim to address the risk before it
occurs. Whereas preventive strategies reduce the probability of the risk occurring, mitigation
strategies help individuals to reduce the impact of a future risk event through pooling over assets,
individuals, and over time. For example, a household might invest in a variety of different assets

62
that yield returns at different times (for example, two kinds of crops that can be harvested in
different seasons), which would reduce the variability of the household’s income flow. Another
mitigation strategy for households that face largely uncorrelated risks is to “pool” them through
formal and informal insurance mechanisms.
2.14.3 Coping (ex-post) Strategies
These are strategies designed to relieve the impact of the risk once it has occurred. It
captures the resilience and sustainability behaviours of the food insecure household. Food
insecure households adjust their behavior in the face of lack or perceived lack of food to ensure
food security based on their best judgement of the situation (Maxwell et al. 2003). Households
are known to cope with food insecurity using four different kinds of consumption strategy
namely: changing their diet from expensive or more preferred foods to less preferred ones; using
strategies that are not sustainable over a long period to increase short-term foods supply;
reducing the number of people they have to feed; and (the most common strategy) managing the
shortfall by limiting the quantity of food and the number of times foods are eaten. Other coping
strategies include: seeking off- farm employment, migration and selling livestock (Maxwell and
Slater 2003; Maxwell & Caldwell 2008). The severity of lack determines the nature of coping
strategies employed. The government has an important role to play in helping people to cope (for
example, when individuals or households have not been able to accumulate enough assets to
handle repeated or catastrophic risks). The smallest income loss would make these people
destitute and virtually unable to recover.

63
2.14.4 Quantifying Vulnerability
Hoddinot & Quisumbing (2003), identified three different methodologies used to assess
vulnerability, these include: Vulnerability as uninsured Exposure to Risk (VER), Vulnerability as
low Expected Utility (VEU) and Vulnerability as Expected Poverty (VEP). All the three methods
construct a measure of welfare of the farm households.
2.14.5 Vulnerability as Uninsured Exposure to Risk (VER)
This method is based on ex-post facto assessment of the extent to which a negative shock
causes welfare loss (Hoddinot & Quisumbing, 2003) the impact of shocks is assessed using panel
data to quantify the change in induced consumption.
2.14.6 Vulnerability as a Low Expected Utility (VEU)
VEU focuses on the magnitude of the difference in welfare/utility associated with a
certainty equivalent level of welfare (a benchmark) and the household’s own expected
welfare/utility. Under this method, Ligon & Schechter (2003) defined vulnerability as the
difference between utility derived from some level of consumption at and above, which the
household would not be considered vulnerable. The limitation of VER and VEU methods is that,
in the absence of panel data, estimates of impacts, especially from cross sectional data are often
biased and thus inconclusive (Skoufias, 2003).
2.14.7 Vulnerability as Expected Poverty (VEP)
VEP focuses on the likelihood that well-being will be below the benchmark in the future,
under this framework, a farmer’s vulnerability is considered as the probability of that farmer
becoming poor in the future if currently not poor or the prospect of that farmer continuing to be

64
poor if currently poor (Christiaensen & Subbarao, 2004). It is argued that pre-existing conditions
and forces influences the magnitude and the ability of farm households or communities to reduce
their vulnerability to shocks. Hence, under this scenario, vulnerability is seen as expected
poverty, with consumption or income being used as the welfare indicator. In this conception, the
vulnerability is measured by estimating the probability that a given shock, or set of shocks,
moves consumption of an individual/household below a given minimum level (for example a
consumption poverty line) or forces the consumption level to stay below the given minimum
requirement if it is already below that level (Chaudhuri, Jalan & Suryahadi, 2002). In this case,
vulnerability can be measured using the cross sectional data unlike the other methods that require
panel data. Both measures have much in common.
2.15 Empirical Evidence on Determinants of Vulnerability
Babatude, Omotesho, Olorunsanya and Owotoki (2008), in their study of determinants of
vulnerability to food insecurity among male and female-headed households in Kwara state of
North-central Nigeria found out that, off-farm income, total household income and available
labour hours were significantly higher in male than female-headed households. Furthermore,
farm size and crop outputs were significant in determining vulnerability to food insecurity in
male-headed households. In the female-headed households, age, education of household’s head
and off-farm income were the significant determinants. In both the types of households, food
expenditure, household size and number of labour hours were identified as significant
determinants of vulnerability to food insecurity.
Welderufael (2014), carried out a study of determinants of household vulnerability to
food insecurity in Ethiopia, results show that those households with large family sizes, lower

65
consumption expenditure, old age, unemployed and male headed households were more food
insecure in urban areas. Farm inputs, farm size, shocks such as drought and illness were the
determinants of rural household vulnerability to food insecurity.
Asmamaw, Budusa and Teshager (2015), in their analysis of vulnerability to food
insecurity in the case of Sayint district, Ethiopia, results indicated that livestock ownership and
access to off-farm employment opportunities were the most significant determinants of a
household’s vulnerability to food insecurity.
Amusa, Okoye and Enete, (2015), carried out a study on gender-based vulnerability and
contributions to climate change adaptation decisions among farm households in Southwest
Nigeria. The study was conducted in three randomly selected states of southwest Nigeria. Data
collection for the study was carried out in two phases. Firstly, there was a rapid rural appraisal of
the selected states followed by the second phase which was a detailed survey using a structured
questionnaire administered to 360 randomly sampled farm units. Using household adaptive
capacity approach, female headed farm households had higher climate change vulnerability
index of 0.73 while male headed households had relatively lower index of 0.43.
Zaman (2000), studied the relationship between microcredit and the reduction of poverty
and vulnerability, focusing on Bangladesh Rural Action Committee (BRAC), one of the largest
microcredit providers in Bangladesh. Household consumption data from one thousand and
seventy two (1072) households was used. Results showed that microcredit contributed to
mitigating a number of factors that contribute to vulnerability. A number of pathways by which
microcredit can reduce vulnerability, (namely by strengthening crisis-coping mechanism,
building assets and empowering women) were discussed. One channel is the asset-creation

66
associated with series of loan financial investments. A household who has taken several loans
would typically have focused its asset-building on the creation or expansion of one or more
income earning assets and would have invested in improving living condition.
Another channel through which credit reduces household vulnerability is through income
and consumption smoothing. This occurs through the creation of non- farm sources of income as
well as, by saving part of the loan disbursed for the lean season. This view was expressed by
Schrieder and Sharma (1999) in their study of impact of finance on poverty reduction and social
capital formation.
2.16 Theoretical Framework
2.16.1 Sustainability theory
Theories of sustainability attempt to prioritize and integrate social responses to
environmental and cultural problems. An economic model relates to sustain natural and financial
capital; an ecological model relates to biological diversity and ecological integrity; a political
model relates to social systems that realize human dignity. Religion has entered the debate with
symbolic, critical, and motivational resources for cultural change. Economic models propose to
sustain opportunity, usually in the form of capital. According to the classic definition formulated
by the economist Robert Solow (1991), “we should think of sustainability as an investment
problem, in which we must use returns from the use of natural resources to create new
opportunities of equal or greater value”. The theoretical basis of sustainability theory is the forms
of progress that meet the needs of the present without compromising the ability of future
generations to meet their needs (Shahan, 2009). One of the major concerns of economist is how
to make efficient use of scarce natural resources with alternative uses so as to ensure

67
sustainability and improved environmental quality for man (Hoffman & Ashwell, 2001).
Sustainability as regards natural resources such as land and its deposits, forests, air and water
bodies means a balanced use of these resources over a long period of time without impairing the
fundamental ability of the natural resource base to support future generation. An environmentally
sustainable system must maintain a stable resource base, avoiding over-exploitation of renewable
resource systems or environmental sink functions, and depleting non-renewable resources only to
the extent that investment is made in adequate substitutes.
Sustainability has become a key concept to solving global resource and environmental
issues (McGee, 2006) most especially in the management of natural resources. Sustainable
agriculture according to Olowookere (2010) is the ability of farmers to produce food
continuously in such a way that the environment and surrounding ecosystem, is unaffected by
their agricultural activities. This study assessed how farm household utilize the available
resources (microcredit) in attaining food security.
2.16.2 Sustainable Livelihoods Framework
Diverse theories have been formulated to explain food shortages that can happen on
various geographical scales, ranging from global to individual. The most widely cited include:
food availability decline (Devereux, 1993; Millman and Kates, 1990); food entitlement decline
(Sen, 1997); political economy explanations (Devereux, 1993); food shortage as a disaster
(Blaikie, Cannon, Davis, and Wisner, 1991); and the sustainable livelihoods framework (SLF),
which looks at food insecurity as an outcome of undesirable/vulnerable livelihoods. The
sustainable livelihoods framework is the most appropriate approach for the study at hand, and it
also captures the central idea of other food security theories.

68
The concept of sustainable livelihoods has many supporters and the usage of the term
sustainable livelihood framework gained prominence through the Brundtland report of the world
Commission on Environment and Development in 1990s (Bennet, 2010). Hassen (2008)
emphasizes that the concept of sustainable livelihoods requires a mind-shift from the traditional
approaches. A number of international development agencies have developed and utilized the
concept. These include Oxfam, Care International, Canadian International Development Agency,
Swedish International Development Cooperation Agency, World Bank, Department for
International Development and the United Nations Development Program.
The sustainable livelihoods framework (SLF) puts people at the center of development.
The starting point of the SLF is that individuals and households can draw on their assets and
respond to opportunities and risks, minimizing vulnerability and maintaining, smoothing or
improving well- being, by adopting livelihood and coping strategies. Individuals and households
are embedded in a specific context made up of exposure to risks and opportunities on the one
hand and to services and policies, institutions, organizations, processes and structures on the
other hand. These influence the way in which a person or household can use a combination of
assets to develop a particular livelihood activity or coping strategy. The way in which these
components link together to influence an individual’s or household’s livelihood options,
activities and outcomes is meditated by a range of transforming institutions and processes
operating at all levels from household to the international arena. Such institutions and processes
have a profound influence on access (example: to assets, to livelihood strategies), on terms of
exchange between different forms of assets, and on returns to a given livelihood strategy (Ludi
and Slater, 2008).

69
Sustainable livelihoods framework acknowledges that people pursue a multitude of
strategies to secure their livelihoods and that these can lead to a wide range of livelihood
outcomes. As a result the SLF enables agencies to develop flexible and locally appropriate
responses to risk, vulnerability and poverty and can provide the evidence and analysis necessary
for the prioritized and strategic selection of interventions (Ludi and Slater, 2008).
A livelihood comprises the capabilities, assets (stores, resources, claims and access) and
activities required for a means of living: a livelihood is sustainable which can cope with and
recover from stress and shocks, maintain or enhance its capabilities and assets, and provide
sustainable livelihood opportunities for the next generation, and which contributes net benefits to
other livelihoods at the local and global levels and in the short and long term (Chambers and
Conway, 1992).
Scoones (2009) and Asa (2008) articulate that sustainable livelihoods framework
emanated due to increased attention to poverty reduction, people oriented approaches to
development theory and sustainability in political arena. In studies, livelihoods thinking have
been adapted to situations ranging from exploring livelihood in situations of chronic conflict
(Longley and Maxwell, 2003) and from examining the relationships of HIV/AIDS to food
security and livelihoods.
The important works Amartya Sen (1984; 1987) form the basis for the inclusion of
‘capabilities’ within sustainable livelihoods thinking. The contextually dependent concept of
capabilities refers to “being able to perform certain basic functioning’s, to what a person is
capable of doing and being” (Chambers and Conway, 1992). The ability to feed oneself, one’s
access to commodities, and the length of one’s life, for example, all contribute to one’s capability

70
to function (Sen, 1984). Capabilities can also be seen as the ‘freedom’ of individuals or
households to choose pathways and participate in activities that increase their quality of life
(Sen, 1984; Chambers and Conway, 1992). Chambers and Conway’s definition of sustainable
livelihoods also incorporates Swift’s (1989) work on human vulnerability and famine through
distinguishing between three types of assets: investments, stores and resources, and claims. In
Swift’s view, assets are built up or invested when production exceeds consumption requirements
with the end goal of reducing the vulnerability of households and communities to shocks and
stresses.
Four important components of the SLF can be identified: capital, assets, existing context,
mediating processes and livelihood outcomes and indicators (Carney, 1998, Ellis 2000). The
interaction between these factors determines whether a household pursues a sustainable
livelihood strategy or lives under vulnerability (see figure 2.1).

71
Figure 2.1: Sustainable Livelihoods Framework. Source:Department for International Development (DFID’s) (Adopted from Carney, 1998)
Vulnerability Context
Shocks
Trends
Seasonality
Transforming Structures
& Processes
Structures
Levels of government
Private Sector
Policies
Laws
Policies
Culture
Institutions
Human
Capital
Financial
Capital
Natural
Capital
Social
Capital
Physical
Capital
Livelihood
Assets
Livelihood Outcomes
More Income
Increased
Wellbeing
Reduced
Vulnerability
Improved Food
Security
More
sustainable use
of NR base
Influence
Access Livelihood
Strategies

72
Livelihood assets are grouped under five types of capitals: natural (natural resource-based
assets, including land, water, wildlife, biodiversity, environmental resources); social (networks,
membership of groups, relationships of trust, access to wider institutions of society); human
(skills, knowledge, ability to labour, good health); physical (transport, shelter, water supply,
energy, communication and production equipment) and financial (savings, supplies of credit,
regular remittances or pensions) (Carney, 1998; Pretty, 1998; Scoones, 1998).For Nigerians, the
overwhelming majority of whom draw their livelihood from agriculture, access to natural capital
(specifically land and water) and credit are decisive factors.
Context refers to the trends, shocks and local cultural practices affecting livelihoods in
different ways. It determines the extent to which households are vulnerable to various
disasters/risk, which has direct implications for assets capital possessed. Understanding contexts
in which poor people try to make a living is important for pro-policy. Knowledge about the types
of shocks and stresses that poor people face helps us understand the coping strategies open to
them. It also can help illuminate the likely impact that different policies will have on particular
groups of people living in poverty (Ludi and Slater, 2008).
Two issues are relevant in Nigeria; the first is the rapid growth of the population over
several decades, which has tremendous implications for the decline of per capita land holdings at
household level. The second is shock owing to recurrent national insecurities like terrorism and
flood. The mediating processes means action by organizations (both informal and formal –
government, private and non-governmental) and institutions (policies, laws, rules and incentives)
which define people’s livelihood options (Carney, 1998). In terms of improving the overall well-
being and food security status of the people, there have been several attempts made by the
Federal government. The most recent programs include several presidential initiatives on

73
selected crops (rice, cassava), Root and Tuber Expansion Program (RTEP), National Special
Program on Food Security (NSPFS), Community Based Agriculture Development Project
(CBARDP), various phases of the National Fadama Development Program (NFDP), amongst
several others (Ibok, 2012).
The fourth component of SLF relates to livelihood outcomes and indicators. Livelihood
outcomes can be desirable or undesirable depending on how households under an existing
context combine different forms of capitals and how these combinations are enhanced or
constrained by the organizational and institutional frameworks in place. If the outcome is
desirable, then feedbacks contribute to building up the five capital assets; where they are
undesirable, they reduce the asset base (Scoones,1998).

74
2.17 Analytical Framework
The nature and purpose of study determine the type of analysis to be employed
(Chukwuone, 2009). Also, the choice of techniques depends on a host of factors in particular the
objectives of the study, the availability of data, time and budget. Different approaches could be
used to analyze data. The first step of simple but important analytical tool used in data analysis is
the descriptive statistical tools (McNally & Othman, 2002). These include frequency
distributions, percentages, mean, bar charts and standard deviation. However, any study that
requires a detailed analysis of quantitative relations needs a higher level of analysis other than
descriptive statistical tools (Eboh, 2009). In this study, in addition to descriptive statistical tools,
the following specific models were employed: Heckman model, Poisson model, Household Food
Security Survey Model, Multiple Discriminant Function analysis and Vulnerability Index was
used in the study to examine; factors influencing access to micro credit, amount of microcredit
accessed and frequency of access to microcredit, food security status, effects of microcredit on
food security and the vulnerability of farm households to food insecurity.
2.17.1The Heckman Double Hurdle Model:
The Heckman double hurdle model was used to estimate determinants of access to
microcredit and the amount of microcredit received. This model enables our study to take
account of the selection problem that is likely since the process of selection of microcredit
recipient is not governed by principles. The model is specified as follows.
The model is specified as follows: 𝐵𝑖∗ = 𝛼 + 𝛿𝑋𝑘𝑖 + 𝜑𝑉𝑗𝑖 + 휀𝑖 ---------------------------- (1)
Where 𝐵𝑖∗the amount of microcredit received by the 𝑖𝑡ℎ farmer, 𝑋𝑖 is 𝐾𝑡ℎ
characteristics of the 𝑖𝑡ℎ farmer, and 𝑉𝑗𝑖 is the explanatory variable that affects microcredit

75
amount by the 𝑖𝑡ℎ farmer. Using the two step Heckman method, data was tested for selection
bias, which was overcome by including the inverse mills ratio from the sample selection model.
Let 𝐵𝑖∗ denote latent variable (unobservable) and 𝐵2
∗ denotes outcome variable, say amount of
microcredit received. The outcome variable 𝐵2 is observable when 𝐵𝑖∗ is greater than zero.
Thus, estimation of 𝐵1 (accessed microcredit) on 𝑥1 (farmer’s characteristics) and 𝐵2 (amount
of microcredit received) on 𝑥2 (farmer’s characteristics) will lead to sample selection bias since
the residuals of both regression are correlated. Using the Heckman’s model for efficient and
consistent estimates, we estimate the probit model considering regression of 𝐵1(accessed micro
credit) on 𝑥1 to obtain 𝛿1.The estimated 𝛿1 shall be substituted in the inverse mills ratio {given
as 𝛾(𝑥1, 𝛿1) = ∅(𝑥1𝛿1)
∅(𝑥1𝛿1)}
In the second step, we consider the model of interest by regressing 𝑄2∗ on 𝑥1 and the mills ratio
to ascertain the determinants of quantity of microcredit received. The model is noted as:
𝐵𝑖∗ = 𝛼 + 𝛿𝑋𝑘𝑖 + 𝜑𝑉𝑗𝑖 + 𝑀𝛾(𝑥1𝛿1) + 𝑒𝑖 -------------------------------------------------- (2)
Based on the estimation, an inference about the possible existence of sample selection is
noted if the coefficient of the inverse mills ratio is significant or insignificant. If the inverse mills
ratio is significant, then the sample selection bias prevails, thereby indicating that additional
regressor (inclusive of the inverse mills ratio) increases efficiency. If the inverse mills ratio is
insignificant, then there is no selection bias implying that the ordinary least square regression is
appropriate (Diagne and Zeller, 2001). Heckman double hurdle model was used by Ibrahim and
Bauer (2013) in analyzing access to microcredit and its impacts on farm profit among rural

76
farmers in Sudan. Also, Essien et al. (2013) employed it in investigating credit receipt by
entrepreneurs in Nigeria. Furthermore, Anang, Sipiläinen, Bäckman and Kola (2015) conducted
a study on factors influencing smallholder farmers access to agricultural microcredit in Ghana
using household survey data collected for the 2013/2014 farming season. The authors used
Heckman double hurdle model to examine the factors influencing access to loan and when
accessed, the determinants of loan size.
2.17.2 The Poisson Regression Model
There are many phenomena where the regressand is of the count type, example;
number of books read in a library per year, number of days stayed in the hospital in a given
period, number of cars passing through a toll booth in a span of, say 5 minutes etc. The
underlying variable in each case is discrete, taking only a finite number of variables. Sometimes
it can also refer to rare or infrequent occurrences such as getting hit by lightning in a span of a
week. The probability distribution specifically suited for count data is the Poisson probability
distribution (Gujarati, 2005). The preponderance of small values and the clearly discrete nature
of the dependent variable (positive numbers or count data). The log- linear regression in the
Poisson model naturally accounts for the non-negativity of the Poisson distribution dependent
variable (Winkelmann and Zimmermann, 1995; Gujarati, 2005). The model was used by Essien,
Arene, and Nweze (2013) to examine what determines the frequency of loan demand in credit
markets among agro based enterprises in the Niger Delta Region of Nigeria? Katchova (2005) to
investigate farm and personal characteristics that influence the number of loan demands for
United State farms. It was also employed by Netere, Kutner, Nachtsheim and Williams (1996),
on geriatric study of falls in Chicago.
The Poisson probability distribution is given as:

77
𝑓(𝑌𝑖) = 𝜇𝑌𝑒−𝜇
𝑌! ------------------------------------------------------------------------------------ (3)
Where 𝑌 𝑖 = 0, 1 ,2, 3,
𝑓(𝑌) denotes the probability that the variable Y takes non-negative integer values, and where
Y! (Y factorial) stands for Y! = Y x (Y-1) x (Y-2) x (Y-3) x 3 x 2 x 1
The Poisson regression model is therefore specified as:
𝑌𝑖 = 𝐸(𝑌𝑖) + 𝑈𝑖 = 𝜇𝑖 + 𝑈𝑖 ------------------------------------------------------------------- (4)
Where the Y’s are independently distributed as Poisson random variables with mean 𝜇𝑖 for each
individual expressed as:
𝜇𝑖 = 𝐸(𝑌𝑖) = 𝛽1 + 𝛽2𝑋2𝑖 + 𝛽3𝑋3𝑖 + … … … . + 𝛽𝑘𝑋𝑘𝑖 ------------------------------- (5)
Where the X’s are some of the variables that might affect the mean value. The partial or marginal
effect of X’s on the mean value of 𝑌𝑖 is given as follows:
𝛿𝜇
𝛿𝑋′𝑠= 𝑋′𝑠𝑒𝛽1+ 𝛽2𝑋2𝑖+ 𝛽3𝑋3𝑖+ ……….+ 𝛽𝑘𝑋𝑘𝑖 = 𝛽′𝑠𝜇𝑖 --------------------------------------- -(6)
In this study, the count variable will be the number of times small scale farmers have access to
microcredit in a year, this number will depend on variables such as income, experience in
borrowing, interest rate, etc. For estimation purposes, the model is written as:
𝑌𝑖 = 𝜇𝑌𝑒−𝜇
𝑌! + 𝑈𝑖⁄ --------------------------------------------------------------------------- (7)

78
2.17.3 Household Food Security Survey Model (HFSSM)
This study adopted the USDA (United States Department of Agriculture) Household
Food Security Survey model for the analysis of farm households food security in the study area.
This method categorizes households using a constructed food security scale. This scale is a
number continuum in a linear scale that ranges between 0 and 18. The scale measures the degree
of food insecurity/hunger experienced by households in terms of a single numerical value. The
procedure that determines a household scale fundamentally depends on the household responses
to some structured survey questions. These questions capture four kinds of situations or events
all related to the general definition of food security. These include both qualitative and
quantitative aspects of households’ food supply as well as household members’ psychological
and behavioural responses. It reflects the households’ situation over the 12 months before the
interview.
A household is classified into one of the food security status- level categories on the basis
of its score on the food security scale, while the households’ scale score is determined by its
overall pattern of response to a set of indicator questions. For instance a household with a scale
value of 6, has responded affirmatively to more questions that are indicators of food insecurity
than for a household with a scale value of 3. A household that has not experienced any of the
conditions of food insecurity covered by the core questions will be assigned a scale value 0,
while a household that has experienced all of them will be scored scale values close to 18. In
general, the set of questions works symmetrically together to provide a measurement tool for
identifying with considerable sensitivity, the level of food insecurity/hunger experienced in a
household. (Coleman-Jensen, Rabbitt, Gregory and Singh, 2014). Ibok (2012) carried out a study
on analysis of food security and productivity of urban crop farmers in Cross River State, the

79
author used household food security survey model to determine the food security status of the
respondents. Fakayode, Rahji, Oni and Adeyemi (2009) used household food security survey
model to analyze farm household’s food security in Ekiti State. It was used to measure the
intensity of food severity among these households.
2.17.4 Multiple Discriminant Function analysis
The discriminant function analysis is used for predicting membership in more than two
mutually exclusive groups to determine which variables discriminate between the groups
naturally (Tabacknick and Fidell, 1996). There are other tools for handling dichotomous
response variables such as linear probability models (LPM); the logit model, the probit model
and the tobit model (Damoder, 1995). However, the discriminant analysis model has been proven
a more powerful and efficient tool. (Tabachnick and Fidell, 1996). It was also found to provide
more accurate classification and hypothesis testing (Grimm and Yarnold, 1995). Ogbanje,
Chidebelu and Nweze (2014) employed multiple discriminant function in examining off-farm
diversification among small-scale farmers in North-Central Nigeria. Ajah, (2012) used
discriminant function in analyzing credit worthiness, loan utilization and loan repayment among
NACRD loan beneficiaries in Cross River State. Agom, (2001) examined the impact of
microcredit on agricultural enterprises in Cross River State, Nigeria, using Discriminant
function. Also, Arene (1996) in his study of corporate bankruptcy of community banks in
Nigeria, used discriminant function analysis.
Discriminant analysis has been found to be a very useful tool in causative research, to
proffer reasons why things happen the way they do (Ajah, 2012). Discriminant analysis would
separate variables that affect food security status, it will also ascribe to what degree the variables
affect an individual to be food secure or food insecure. In a linear function, the coefficients are

80
computed such that the ratio of the sum of squares between group means to the ratio of sum of
squares within group means is maximized. This ratio can then be used to test the hypothesis that
the two points representing the position of the n- means of the group in the n-dimensional space
occupy the same point for the population under consideration. The linear function that
maximizes this ratio is the discriminant function. There must always be one less discriminant
function, as there are groups. The analysis is done by grouping objects of known identities into
where they belong. This is achieved by substituting these values into the discriminant function.
Next, the scaled coefficients are computed to discern the relative importance of the variables in
discriminating between memberships (Agom, 2001).
The grouping in this study will put farmers into three groups in terms of food security status:
1. Marginal food security
2. Low food security
3. Very low Food security
The model is presented explicitly as:
𝐷1 =𝑏0+ 𝑏1𝑍1𝑖 +𝑏2𝑍2𝑖………………………….𝑏𝑛𝑍𝑛𝑖 – α……………………………………. (8)
𝑍𝑖 = 𝑋𝑖𝑗-𝑥………………………………………………………………………………………. (9)
Where 𝑍𝑖 = the 𝑖𝑡ℎ individual’s discriminant score or the contribution of each independent
variable to the total discriminant score(𝐷1).
𝐷1 = total discriminant score
𝑋𝑖𝑗 = the ith individual value of the jth independent variable

81
𝑏𝑖𝑗 = the discriminant coefficient for the jth variable
X̅ = mean value of the independent variables
Α = standard deviation of the independent variables.
Let each individual score 𝑍𝑖 be a function of the independent variables; that is
𝑍𝑖 = 𝑏0 + 𝑏1𝑋𝑖𝑗 +𝑏2𝑋2𝑖 +……………………………………𝑏𝑛𝑋𝑛𝑖 ------------------------------ (10)
(Ogbanje,Chidebelu and Nweze, 2014)
4. Classification procedure is as follows if 𝑍𝑖 = 𝑍𝑐𝑟𝑖𝑡 classify individual I as belonging to
group three (very low food security) and if 𝑍𝑖 <𝑍𝑐𝑟𝑖𝑡, classify individual I as belonging to
group two (low food security) and if 𝑍𝑖 >𝑍𝑐𝑟𝑖𝑡, classify individual I as belonging to group
one (marginal food security)
The between group variance is given as
( D̅ 1 - D̅ 2 )2
Where
D̅ 1 = n1
1
1
j
jpX
D̅ 2 = n1
1
2
j
jpX
These are the means for group one, two and three respectively. The within group variance are:
(D j1 -D̅ 1 ) 2
and (D̅ j2 -D̅ 2 ) 2
presenting (D̅ j1 -D̅ i ) in terms of X p and b p for group one we have:

82
(D j1 -D̅ 1 ) 2 = b p X ij - bp X̅ pj
squaring this we have,
(D j1 -D 1 ) 2 = b p (X pij - X̅p 1 ) b p (X pij -X̅ 1p )
Thus, the within group variance will be:
(D j1 -D̅ 1 ) 2 = ( b p (Xpij -X̅pi) bp (Xpij- X̅pi))
The above may be expressed as:
(D j1 -D̅ 1 ) 2 = bp bq Spq
Where Spq is a matrix given by:
S11 S12………. S1k
S21 S22………. S2k
, , …………. ,
, , …………. ,
, , …………. ,
Sk1 Sk2……….. Skk
S 11 = (X j11 -X̅ 11 ) 2
S 12 =S 21 = (X j11 -X̅ 11 ) (X j21 -X̅ 21 )
We assume homoscedasticity, such that the within group variance of the group of food secure
households is the same as that of food insecure households. That is Spq is common to the three
83
groups. The coefficients are derived such that the differences in mean values are a maximum,
subject to the condition that the variance is a constant (Olomola 1990, Olayemi 1996).
To maximize these differences we have
F= (D i j- D̅ 1 ) 2 =λV= bpbq-λ bpbqSpq
Where λ= Langrangian multiplier
We differentiate F partially with respect to bj and equate it to zero, and we have:
df/dbp=dp bq dq-λ bq Spq = 0
the computation is simplified by making
λ = bq dq , (Agom 2001).
therefore, dj bq dq = bq dq bq Spq
dp= bq Spq
The function was derived to have a matrix equation as given by Olomola, (1990) and Olayemi,
(1998) and we had:
D= bS
B=S 1 d
-1

84
This gives the required solution for the b p s in the discriminant function. These coefficients (bp)
are the coefficients of the linear function, which in the population discriminates best between the
three groups and is used to classify farmers into food secure and food insecure typologies.
Significance Test
The discriminant function is subjected to a statistical test. This determines whether the function
is more able to discriminate than just any chance event. This is done by computing a coefficient,
p.
P=n
nn 21p
k
p
pdb1 ----------------------------------------------------------------- (11)
Where:
k= number of discriminating variables
bp = weighting coefficients
dp =Xp 1 - Xp 2 Xp ־3
b1
b2
bp
=
S11 S12 ……….. S1k
S21 S22 ……….. S2k
Sk1 Sk2 ……….. Skk
●
d1
d2
dp

85
n= n 1 + n 2 + n3 = total number of respondents (farmers)
The test statistic for the variance ratio is given by
F = )1(
)1(
pk
pkn
--------------------------------------------------------------------------------------- (12)
This has Snedecor’s distribution with k and n-k-1 degrees of freedom. If the calculated F- value
is greater than the tabulated value the hypothesis that the discriminant function may have arisen
by chance is rejected (Olayemi, 1998).

86
CHAPTER THREE
METHODOLOGY
3.1The study area
The study area is the Niger Delta region of Nigeria. It lies between latitude 4°2′ and
6°2′ north of the equator and longitude 5°1′ and 7°2′ east of the Greenwich meridian (Tawan,
2006). Nine Of Nigeria’s constituent States makes up the region, namely; Abia, Akwa Ibom,
Bayelsa, Cross River, Delta, Edo, Ondo, Imo, Rivers States, with an area of 112,000 sq. km, a
population of 27 million people, 185 LGA’s, about 13,329 settlements; 94% of which have
populations of less than 5,000 (Ichite, 2015).
According to the Ministry of Niger Delta Affairs (2011), the climate of the Niger Delta
Region varies from the hot equatorial forest type in the southern lowlands to the humid tropical
in the northern highlands and the cool montane type in the Obudu plateau area. Further, the wet
season is relatively long, lasting between seven and eight months of the year from the months of
March to October.
The region has huge oil reserves and ranks sixth exporter of crude oil and third as world’s
largest producer of palm oil after Malaysia and Indonesia. Further, the Delta leads in the
production of timber, pineapple and fish, also; cocoa, cashew, cassava, rice, yam and oranges are
produced in large quantities in the area. The major occupation of the people is fishing and
agriculture (Omafonmwan and Odia, 2009).

87
Figure 3.1: Map of Niger Delta States Nigeria,
Source: Nigeria Bureau of Statistics, (2006).
3.2 Sampling Technique
The study used cross sectional data from beneficiaries and non-beneficiaries of
microcredit. The target population in the study is the microcredit sources and their clients or
customers. The study employed multistage, stratified, simple random sampling techniques in
selecting the respondents. The first stage involved random selection of four out of the nine Niger
Delta States; Abia, Akwa Ibom, Delta and Rivers States. Secondly, one agricultural zone out of
three was randomly selected from each of the states except Akwa Ibom where two zones were
selected out of six. Thirdly, two Local Government areas were selected by random sample from
three states and four from Akwa Ibom. In the fourth stage, three communities were randomly
selected from each Local Government Area giving a total of 30 communities. In the fifth stage,

88
based on the list of crop farmers obtained from the Agricultural Development Programmes in the
states, sixteen (16) crop farmers stratified into beneficiaries and non-beneficiaries of microcredit
schemes were randomly selected from each community to give a total of four hundred and eighty
four (480) crop farmers. Out of this number, only 384 questionnaires were correctly filled and
were therefore used for the analysis.
3.3 Data Collection
Data for this study was obtained from primary sources. Primary data was obtained
through field survey using structured questionnaire and oral interview to elicit response from
respondents regarding household consumption, socio-economic attributes of the respondents,
available microcredit sources, microcredit access, amount of microcredit received, frequency of
access to microcredit, food security status and vulnerability of farm households to food
insecurity. A pilot study was conducted where enumerators were used for pre-testing of the
questionnaires. This was to ensure clear understanding of the instrument to avoid inconsistency
and incomplete response. Data from the 2013/2014 farming season were collected for a period of
three months and used for the study.
It is assumed that, many household surveys lack sufficient information to adequately
assess income composition. In this case, the study adopted interviews and establishment of good
rapport with the participating households. This reduced measurement errors which could have
arisen from poor memory recall. The income data was collected using expenditure approach.
Validation and Reliability of Research Instrument
Some copies of the structured questionnaire were given to my supervisors and some other
specialist who gave advice which were used in the restructuring of the instruments to suit the

89
research objectives. The purpose of the validation was to remove any obscure or ambiguous
questions and to observe farmer’s reactions to the questions which ensured the clarity and
appropriateness of the measuring instrument. The instrument passed face and content validity.
Reliability test to check the consistency of the measuring instrument over time was conducted
using the test-retest method. The same questionnaire was given to the same respondent at two
points in time (an interval of seven days) and the scores were compared. The reliability
coefficient was 0.81 which showed that the reliability of the questionnaire was good.
3.4 Data Analyses
Data collected were analyzed with the use of descriptive statistics such as frequencies,
averages and percentages. Heckman double hurdle model, Poisson model, Household Food
Security Survey model, Multiple Discriminant function analysis and Vulnerability Index
Analysis were also used for analyses of data.
3.4.1 Model specification
Objective (i) was achieved using descriptive statistics, frequency and averages.
To evaluate objective (ii) Heckman double hurdle model was used. It consists of two
hurdles. The first hurdle is microcredit access, analyzed using the Probit, while the second is the
amount of microcredit accessed, analyzed with a truncated Torbit regression model. The
Heckman model therefore is illustrated by the following equations:
(a) Index equation 𝑑𝑖∗ = 𝑋𝐼𝑖
′ 𝐵1 + 𝑈𝑖Uί N(0,1) ------------------------------------------- (1)
Threshold index equation = {1 𝑖𝑓 𝑑𝑖 ∗ > 0, 𝑎𝑛𝑑 𝑖𝑠 0 𝑑𝑖
∗ ≤ 0}

90
(b) Amount of microcredit received: t* = 𝑋2𝑖 𝛽2 + 𝑉𝑖 V N(0,𝛿2) ------------------------- (2)
Threshold equation 𝑡𝑖 ={𝑡1∗ 𝑖𝑓 𝑑𝑖 = 1. 0 𝑖𝑓 𝑑𝑖 = 0}
Where 𝑑𝑖= probability of access to micro credit
t*= amount of microcredit received
𝑡𝑖= amount of microcredit received if respondent I has access to microcredit, 0 otherwise
Other variables in the model were defined below:
INT= Interest amount (this is the total amount the borrower pays as interest charges on money
borrowed).
GEN =Gender of the farmer (takes the value of 1 for male and 0 for female)
EDU =Education (This is the level of formal education attained by the household head measured
by the total number of years spent in receiving formal education)
AGE= Age of house hold head measured in years
MTS= Marital status (defines the marital state of the household head)
RR=Region of residence (1 for urban, 0 for rural)
FRMSIZE=Farm Size (measured in hectares)
ORGMEM= Social Capital (it describes membership of co-operative society, Measured as
dummy. 1 if borrower is a member of a co-operative, 0 otherwise).
To evaluate objective (iii), the Poisson regression model was employed. In the Poisson
model, the response variable is a count variable.
Following the analytical framework, the Poisson probability distribution is given as:
91
𝑓(𝑌𝑖) = 𝜇𝑌𝑒−𝜇
𝑌! ---------------------------------------------------------------------------------- (3)
Where 𝑌 𝑖 = 0, 1 ,2, 3,
𝑓(𝑌) denotes the probability that the variable Y takes non-negative integer values, and where
Y! (Y factorial) stands for Y! = Y x (Y-1) x (Y-2) x (Y-3) x 3 x 2 x 1
The Poisson regression model is therefore specified as:
𝑌𝑖 = 𝐸(𝑌𝑖) + 𝑈𝑖 = 𝜇𝑖 + 𝑈𝑖 ------------------------------------------------------------------- (4)
Where the Y’s are independently distributed as Poisson random variables with mean 𝜇𝑖 for each
individual expressed as:
𝜇𝑖 = 𝐸(𝑌𝑖) = 𝛽1 + 𝛽2𝑋2𝑖 + 𝛽3𝑋3𝑖 + … … … . + 𝛽𝑘𝑋𝑘𝑖 ------------------------------ (5)
Therefore, Y=FCA=Frequency of microcredit accessed by the 𝑖𝑡ℎ farmer in a year (captured as a
count. 1 if farmer accessed microcredit once, 2 if twice, 3 if thrice, etc.).
The X’s are defined below:
GEN Gender of the farmer (takes the value of 1 for male and 0 for female)
EDU=Education (this is the level of formal education attained by the household head, measured
by the total number of years spent in receiving formal education).
AGE= Age of house hold head measured in years
INC= Farm income of farmer (receipts of the from sales in the last one year, measured in Naira)

92
EIB=Experience in borrowing (being the total number of years the borrower has been borrowing
money for farming)
SOC= Social Capital (it describes borrowers acquaintance with lender. Measured as dummy. 1 if
borrower is acquainted with lender, 0 otherwise).
INT= Interest amount (this is the total amount the borrower pays as interest charges on money
borrowed).
To realize objective (iv) Household Food Security Survey model was used. Nord and
Bickel (2000) of the United States Department of Agriculture introduced the food security index.
Household Food Security Survey model used coding survey responses for food security scale:
each household’s response was assessed from the food security continuum. To do this, their
response to each of the questions as either affirmative or negative was coded. These questions
have three response categories namely: “often true” and “sometimes true” and “never true”. For
these questions both “often true” and sometimes true” are considered as affirmative responses
because they indicate that the condition occurred sometime during the period of study. The
distinction between “often true” is, therefore, not used in the scale. Four categories are defined
for this purpose- high food security, marginal food security, low food security and very low food
security.
High food secure households: these are households that had no problems, or anxiety about,
consistently accessing food. The group’s value is 0 on the food security scale.
Marginal food secure households: Households had problems at times, or anxious about
accessing adequate food, but the quality, variety and quantity of their food intake were not

93
substantially reduced. They, therefore, show adjustments in their daily food management. This
group’s value ranges from 1 to 2 on the food security scale.
Low food secure households: These groups of households reduce the quality, variety and
desirability of their diets but, the quantity of food intake and normal eating patterns were not
substantially disrupted. The group’s value ranges from 3 to 7 on the scale.
Very low food secure households: For this group of households, at times during the year, eating
patterns of one or more members were disrupted and food intake reduced because the household
lacked money and other resources for food. The group’s value on the food security scale ranges
from 8 to 18.
To evaluate objective (v) Multiple Discriminant function analysis was used. The Multiple
Discriminant Analysis was used to classify the farmers into three mutually exclusive and
exhaustive categories. Using food security status as a basis, farmers were classified into three
groups. Group one consist of farm households who were marginally food secure, group two
consist of farm households whose food security was low whereas, group three consist of farm
households whose food security status was very low.
The model is presented explicitly as:
𝐷1 =𝑏0+ 𝑏1𝑍1𝑖 +𝑏2𝑍2𝑖 + 𝑏3𝑍3𝑖……………………….𝑏𝑛𝑍𝑛𝑖 – α……………………………... (6)
𝑍𝑖 = 𝑋𝑖𝑗-𝑥…………………………………………………………………………………......... (7)
Where 𝑍𝑖 = the 𝑖𝑡ℎ individual’s discriminant score or the contribution of each independent
variable to the total discriminant score(𝐷1).
𝐷1 = total discriminant score

94
𝑋𝑖𝑗 = the ith individual value of the jth independent variable
𝑏𝑖𝑗 = the discriminant coefficient for the jth variable
X̅ = mean value of the independent variables
Α = standard deviation of the independent variables.
Let each individual score 𝑍𝑖 be a function of the independent variables; that is
𝑍𝑖 = 𝑏0 + 𝑏1𝑋𝑖𝑗 +𝑏2𝑋2𝑖 + 𝑏3𝑋3𝑖……………………………………𝑏𝑛𝑋𝑛𝑖 ------------------ (8)
(Oganje, Chidebelu and Nweze 2014)
The variables used in the discriminant function analysis were;
MST =Marital Status (defines the marital state of the household head)
SIZE = Household size (defined as the total number of persons in the farm household)
EDU= Education (this is the level of formal education attained by the household head measured
by the total number of years spent in receiving formal education).
AGE = Age of household head (measured in years)
GEN = Gender of farmer (takes the value of 1 for male and 0 female)
DEP= Dependant Relatives (Children under 18 years and adults above 70 years)
EXP = farming experience (number of years in farming)
FS = Farm Size (measured in hectares)
REM= Remittance (money received from relatives working in other towns or cities)

95
TINC=Total household income (receipts of the farm sales in the last one year, measured in Naira
including non-farm income)
BM= Borrow money for farming (dummy, 1=borrowed and 0=otherwise)
COOPMEM=Co-operative membership (dummy, 1= member, 0 = non-member)
To achieve Objective (vi) which aimed at assessing the level of household’s vulnerability to food
insecurity, vulnerability analysis was employed. Amusa, Okoye and Enete (2015) used it in the
analysis of gender based vulnerability and contributions to climate change adaptation decisions
among farm households in South-West Nigeria. Also, Okon (2014) used vulnerability index
analysis to assess income generating activities among urban farm households in South-South
Nigeria.
For each component of vulnerability, the collected data were then arranged in the form
of a rectangular matrix with rows representing households’ microcredit status and columns
representing vulnerability indicators. Thus, vulnerability is potential impact (I ) minus
microcredit status (MC). This leads to the following mathematical equations for vulnerability.
V = f (I - MC)........................................................................................................... (9)
Microcredit status
Indicators of Vulnerability
1 2 . . K
Beneficiaries (B) Xf1 Xf2 . . Xkm
Non- beneficiaries (NB) Xn1 Xn2 . . Xkf

96
The obtained data from all the estimated indicators as used in the study are normalized to
be free from their respective units so that they all lie between 0 and 1. The household with the
higher value corresponds to high vulnerability and vice versa. Hence, the normalisation is
achieved with this formular following (UNDP, 2006):
yij = .................................................................................... (10)
Where: Xfi represents the value of the vulnerability indicator 1 for farm household for x
indicator.
Max&Min represent maximum and minimum values of indicators respectively.
When equal weights are given for the vulnerability indicators, simple average of all the
normalized scores is computed to construct the vulnerability index using:
VI = ............................................................................ (11)
VI = represent the vulnerability indicator
K = represents the number of indicators used
After normalization, the average index (AI) for each source of vulnerability is worked out and
then the overall vulnerability index is computed by employing the following formula:
VI = ∑xf1(AIi)α ....................................................................................... (12)
∑xf1 + ∑xfk
j j K
n
i-1
1/α
n
Max{Xfi} – Xfi
1
Max {Xfi} – Min {Xfi}
11

97
Where n is the number of sources of vulnerability and α = n. The vulnerability indicators that
were used in this study include:
X1 = Years of Formal Education (years of formal schooling)
X2 = Farm size (measured in hectares)
X3 =Ownership of land (dummy, 1= owned land, 0 = otherwise)
X4= Remittance (Naira)
X5 = Household size (number of persons in the household)
X6= Total farm Income (in Naira)
X7 = Age of household head (measured in years)
X8 = Value of productive assets owned (in Naira).
X9 = Dependent Relatives (Children under 18 years and adults above 70 years)
X10 =Membership of co-operative (dummy, 1= member, 0 = non-member)

98
CHAPTER FOUR
RESULTS AND DISCUSSION
4.1 Socio-economic characteristics of the respondents
4.1.1 Age of respondents
From table 4.1, the survey showed that 44.79% of microcredit beneficiaries are within the
age range of 41-50 and 39.58% of non-beneficiaries are within the age range of 31-40. The mean
age of the farmers is 42.87 years for beneficiaries and 42.19 years for non beneficiaries. For the
sample as a whole, approximately 71.87% of the household heads were in the active and
productive age range. Age has been found to determine how active and productive the head of
the household would be, which implies that majority of the farmers, in the region are energetic
and still able to do manual farm work, which confirms the result of a study done by Okurut and
Bategeka (2005), who noted that this age bracket is called the “Working age”, and that when the
head of a household is of working age, the likelihood of moving out of poverty and food
insecurity is high.
4.1.2 Level of education of respondents.
The table 4.1 shows that majority (62.97% and 69.79% of beneficiaries and non-
beneficiaries respectively) of the respondents acquired one form of formal education or the other.
Beneficiaries had a higher mean literacy level (11.65%) than non-beneficiaries (11.41%). The
mean literacy level is 11.53 years indicating a high literacy level among respondents in the
region. The level of education could determine the level of opportunities available to improve
livelihood strategies, enhance food security and reduce the level of poverty. High education
status of farmers will enable them acquire knowledge and skills, for budgeting, saving, adoption
of innovations and using resources (Esturk and Oren, 2014). Okojie (2002) also reported that, the

99
higher the educational level of the household head, the greater the household welfare and food
security and, the lower the probability of the household being poor.
4.1.3 Household size of the respondents
The survey in table 4.1 showed that 64.58% of beneficiaries and 60.94% of non-
beneficiaries had a household size of 5-8 persons and, the mean household size is 5 for
beneficiaries and non beneficiaries respectively. The mean household size in the study area was
approximately 5 persons. The household is not large, which could also indicate a low supply of
labour to the family enterprise. Household size is important because, decrease or increase in
household size, decreases or increases the number of consumers, thereby reducing or putting
pressure on household resources particularly food. Furthermore, households with high
dependency ratio are particularly prone to food insecurity (Ibok, 2012).
4.1.4 Farming experience of respondents
According to table 4.1, 51.56% of beneficiaries and 52.09% of non-beneficiaries have
spent 6-15 years in farming and, the mean farming experience did not vary widely between
beneficiaries and non beneficiaries. The mean farming experience was 13 years for beneficiaries
and 14 years for non-beneficiaries. Results show that the farming experience of the respondents
in the surveyed area varied widely, with a minimum of 1 year and a maximum of 44 years. The
mean farming experience in the study area is 14 years. This shows that farm households in the
region had considerable experience in farming. Nwaru (2004) noted that, the number of years a
farmer spends in the farming business may give an indication of the practical knowledge he has
acquired. This implies that, the experience gained enables the farmer to use his resources
prudently and consequently enhance his welfare and food security status.

100
Table 4.1Socio-economic characteristics of the respondents.
Variable Pooled data N=384 Beneficiaries
N=192
Non
Beneficiaries
N=192
Age
Freq. Percentage Freq. % Freq. %
<30 48 12.51 26 13.54 22 11.46
31-40 125 32.55 49 25.52 76 39.58
41-50 151 39.32 86 44.79 65 33.85
51-60 54 14.06 31 16.15 23 11.98
>60 6 1.56 0 0 6 3.13
mean 42.53 42.87 42.19
Education
No Edu 6 1.56 4 2.08 2 1.04
Prim. Edu 88 22.92 43 22.39 45 23.44
Sec. Edu. 165 42.97 76 39.58 89 46.35
OND 46 11.98 23 11.98 23 11.98
HND/B.Sc. 74 19.27 42 21.88 32 16.67
M.Sc 5 1.30 4 2.08 5 5.00
Mean 11.53 11.65 11.41
Household size
1-4 128 33.33 59 30.73 69 35.94
5-8 241 62.76 124 64.58 117 60.94
9-12 15 3.91 9 4.69 6 3.12
Mean 5 5 5
Gender
Males 315 82.03 161 83.85 154 80.21
Females 69 17.97 31 16.15 38 19.79
F/experience
1-5 57 14.84 33 17.19 24 12.50
6-10 104 27.08 48 25.00 56 29.16
11-15 95 24.74 51 26.56 44 22.92
Above 15 128 33.33 60 31.25 68 35.42
Mean 14.36 13.96 14.76
M/status
Married 315 82.03 167 86.98 148 77.08
Divorced 6 1.56 3 1.56 3 1.56
Widowed 30 7.81 7 3.65 23 11.98
Separated 12 3.13 7 3.65 5 2.60
Never married 11 2.86 4 2.08 7 3.65
Single parent 10 2.60 4 2.08 6 3.13
Source: Field survey, 2014

101
4.1.5 Gender of respondents
The results in table 4.1 show that 83.85% and 80.21% of beneficiary and non-beneficiary
households were headed by males while, 16.15% and 19.79% of beneficiary and non-beneficiary
households were headed by females, this confirms Jibowo’s (1992) findings that, patriarchal
marriages where the base of family power rests with males are common in Nigeria.
4.1.6 Marital Status of the respondents
Table 4.1 shows that a high percentage of respondents (86.98% beneficiaries and 77.08%
of the non- beneficiaries) were married. However, a cursory look at Table 4.1 shows that on the
average, about 94.53% of the respondents were once married, while only 5.47 % never got
married. This is consistent with Ekong (2003) who noted that, getting married is a highly
cherished value among farm households in Nigeria, not only because of the need for children and
the continuation of the family, but also because in some areas, the women and children form a
vital source of unpaid family labour.
4.1.7 Geographical distribution of the respondents
The survey results in table 4.2 showed that most of the respondents dwell in the rural
areas. This confirms World Bank (1989) report that, rural dwellers engage mainly in agricultural
production. Berth (2004), stated that agriculture is the mainstay of people’s livelihood in rural
sub-Saharan Africa.

102
Table 4.2 Percentage distribution of respondents according to geographical location
Geographical
Location
All Sample Beneficiaries Non-beneficiaries
Freq % Freq % Freq %
Urban 135 35.16 78 40.62 57 26.69
Rural 249 64.84 114 59.38 135 70.31
Total 384 100 192 100 192 100
Source: Field survey 2014
4.1.8 Production Patterns of the respondents
Table 4.3 shows production pattern among the respondents, 88.02% beneficiaries and
66.67 % non-beneficiaries practiced mixed cropping; while only 22.66 % of the entire sample
practiced sole cropping. Mixed cropping seems to be the major pattern of production by farm
households in the region. Mixed cropping is the dominant cropping system generally adopted by
farm households and the assurance of food security is the most prevailing reason for the practice
(Fawole and Oladele, 2007, Lawal, Omotesho and Adewumi, 2010).
Table 4.3 Percentage distribution of Production Patterns among the respondents
Production
Pattern
All Sample Beneficiaries Non-beneficiaries
Freq % Freq % Freq %
Mixed Cropping 297 77.34 169 88.02 128 66.67
Sole Cropping 87 22.66 23 11.98 64 33.33
Total 384 100 192 100 192 100
Source: Field survey 2014.

103
4.1.9 Respondent Households’ Composition
Table 4.4 shows that 85.94 % of the beneficiaries and 71.87 % of non-beneficiaries had
dependent relatives with, a minimum of 1 and maximum of 8 dependent relatives (comprising
children less than 18 years of age and adults above 70 years). Anderson (2002) defined
household composition as the number of individuals in the household, their ages and gender.
Household composition may have effect on the objectives of the household, as it largely
determines the way in which a household is able to respond to changes. Household composition
affects the amount of available farm labour, determines the food and nutritional requirements of
the household, and often affects household food security (Yincheng, Shuzhuo, Marcus, and
Grtchen, 2012). Dependents are more likely to place a strain on the household, both in terms of
the cost of providing their material needs and also in terms of caring requirements they may
need. Older children on the other hand, may actually bring a net economic benefit to the
household in the short run at least, if they are working and contributing to household income or
food production (O’ Donnell, 2004).
Table 4.4 Household composition of the respondents
Household
composition
All Sample Beneficiaries Non beneficiaries
Freq % Freq % Freq %
Dependent relatives 303 86.72 165 85.94 138 71.87
No dependent
relatives
81 13.28 27 14.06 54 28.12
Total 384 100 192 100 192 100
Source: Field survey 2014.

104
4.1.10 Income sources of the respondents
The table 4.5 shows that farming was the most important activity as 100% farm
households were involved in it. Off- farm work was the second most important activity (80.21%
of the respondents were involved) followed by remittance income (36.98%). Agriculture is a
major contributor to Nigeria’s GDP, small scale farmers play a dominant role in this contribution
by producing most of the food in the country, and this also applies to other developing countries.
However, their productivity and growth are hindered by limited access to credit facilities
(Odemenem and Obinne 2010). Results show that, there is likely to be heavy reliance on
agricultural production for household food security in the region.
Table 4.5 Distribution of respondents by major categories of income sources.
Major source All Sampled
States
Beneficiaries Non-beneficiaries
Freq % Freq % Freq %
Farming 384 100 192 100 192 100
Off-farm work 308 80.21 152 79.17 156 81.25
Remittance 142 36.98 109 56.77 33 17.19
Source: Field Survey: 2014. * Multiple responses allowed
4.1.11 Summary statistics of total household income of the respondent
Table 4.6 shows a mean annual income of N 816789.1 and N793293.8 for beneficiaries
and non-beneficiaries respectively. Beneficiaries earned more income than non-beneficiaries.
These findings are in inline with the results of Fofana (2006), who carried out an empirical
analysis of micro finance institutions, and a survey analysis applied to cross-sectional data
collected from 185 women who had access to credit from micro finance institutions and, 209
women who had no access to micro finance credit. The results show that microfinance

105
institutions credit, increased the income of borrowers and improved their level of farm
production, contributing to the household’s food security and standard of living, which is a main
development goal in most African countries whose economies are based on the agricultural
sector. Microcredit contributes to increase in scale farm operations which results to increase in
farm output and income (Tasie, Wonodi and Wariboko, 2012). Also, Cheng (2006) had similar
findings.
Table 4.6 Summary statistics of total household income.
Variable Mean
(N)
Standard
Deviation
Minimum
(N)
Maximum
(N)
Beneficiaries 816789.1 256423.3 199500 1,960000
Non-beneficiaries 793293.8 275875.1 250000 1,810000
Total observations 384
Source: Field survey, 2014
4.1.12 Respondent’s access to remittance
From table 4.7, 56.77% and 17.19% of beneficiaries and non-beneficiaries accessed
remittance. For the whole sample, 63.02 % do not access remittance, while 36.98% had access to
remittance. Remittances often induce family members to alter their own lifestyle and behavior.
They represent unearned income and lowers the frequency and the severity of coping strategies.
Households with remittance have lower anxiety about not being able to procure sufficient food; it
increases household income, enhances ability to secure adequate quality food, and lowers
experience of insufficient quantity of food intake than those without remittance. (Abadi,
Techana, Tesfay, Maxwell and Vaitla, 2013).

106
Table 4.7 Percentage distribution of respondents according to remittance accessed
Access to
remittance
All Sample Beneficiaries Non beneficiaries
Freq % Freq % Freq %
Access remittance 142 36.98 109 56.77 33 17.19
No access to
remittance
242 63.02 83 43.23 159 82.81
Total 384 100 192 100 192 100
Source: Field survey2014
4.13 The level of Livelihood asset owned by the respondents
Table 4.8 presents the assets owned by households covered in the study. Results show
that other assets (farm implements and other small equipments) were the most common asset
owned by the surveyed households (100%), followed by mobile phones (66.93%). This is
indicative of improved economic welfare among the surveyed farm households. Owning mobile
phones implies that the household can easily access market information on price changes, as well
as information on credit availability to access for an improved living standard. Respondents
livestock assets was 64.32%, Yisehak (2008) reported that, livestock are significant in
maintaining the livelihoods of their keepers by providing food, draught power, manure, skin,
hide, cash, security, social and cultural identity, medium of exchange and means of savings.
Other assets owned by the respondents include land (41.15%), motorcycles (29.95%) and
Radio/TV sets (17.71%). However, 11.72% of the respondents owned bicycles, while
refrigerators were owned by 10.94 % of the respondents. The level of asset ownership in a
household is an indication of its endowment and provides a good measure of household
resilience in times of food crisis, resulting from famine, crop failures, government policies, loss
of job, or natural disasters. This is because a household can easily fall back on its asset in times

107
of need by selling or leasing them. Food security is also explained by the households ability to
accumulate assets and, microcredit access leads to a significant rise in assets which is a good
indicator of economic well-being (Crepon, Duflo and Pariente, 2014).
Table 4.8 Percentage distribution of respondents by asset ownership.
Asset All (sampled
States)
Beneficiaries Non-beneficiaries
Freq % Freq % Freq %
Radio/TV set 68 17.71 24 12.50 44 22.92
Mobile Phones 257 66.93 131 68.23 126 65.63
Land 158 41.15 87 45.31 71 36.98
Bicycles 45 11.72 18 9.38 27 14.06
Motorcycles 115 29.95 69 35.94 46 23.96
Keke-napep 20 5.21 11 5.73 9 4.69
Livestock 247 64.32 124 64.58 123 64.06
Sewing machines 17 4.43 10 5.21 7 3.65
Refrigerators 42 10.94 22 11.46 20 10.42
Motor vehicles 22 5.73 14 7.29 8 4.17
Others (wheel barrow
etc)
384 100 192 100 192 100
Source: Field survey 2014.
*Multiple responses allowed
4.2 Microcredit sources accessed by small scale farmers in the region.
Table 4.9 below shows the microcredit sources accessed by small scale farmers in the
region. The most accessed sources of microcredit were: Cooperatives (36.03%), followed by
Esusu (20.24%), closely followed by Microfinance Banks (10.93%).To avoid incurring much
loss, most microcredit entities adopt the group solidarity approach (lending to farmers in
cooperatives). This has to do with lending to a group of five to twenty- five individuals who are
pursuing common economic objectives and micro-enterprise activities. These groups provide
joint guarantees of each other’s loan. The essence of group selection will encourage the members

108
of the group to have confidence in one another to the extent that access to credit for any member
of the group will depend on the consent of all the members of the group. The group members
share in the risk and benefits that are associated with the loan collected (Zeller, Sharma, Ahmed
and Rashid, 2001 and Bullen, 2004).
Furthermore, in the Niger Delta region, the informal sources were the most patronized
sources (73.77%) while the patronage of the formal sources was 26.31%. Udoh, (2005) noted
that in agricultural financing, informal credit sources are unquestionably the most popular. The
nature and operation of formal sources which have failed not only in promoting a viable delivery
system has caused an increase in the patronage of informal credit sources by small scale farmers
(Egbe, 2000). Informal sources according to Ijere (2000) are provided by traditional institutions
that work together for the mutual benefits of their members. These institutions provide savings
and credit services to their client.
Table 4.9 Percentage distribution of respondents according to microcredit sources accessed
Sn Microcredit sources
Frequency Percentage Total percentage
patronage of formal
& informal sources
1 Micro finance banks
27 10.93
26.31
2 Government
25 10.12
3 NGO
13 5.26
4 Esusu
50 20.24 73.77
5 Cooperative
89 36.03
6 Money lender
21 8.50
7 Friends,neighbours and
relatives
22 9.00
Source: Field survey 2014. * Multiple responses allowed

109
4.3 Factors that determine access and the amount of microcredit received.
The Heckman double stage model was used to examine the factors that determine access
and the amount of microcredit received by small scale farmers. The first stage being the selection
model was the decision of whether (1) or not (0) to access microcredit while the second stage
being the outcome model was continuous and a percentage of the amount of microcredit
accessed. The results justified the use of Heckman double hurdle model with rho value (0.45526)
which was significantly different from zero (0). Moreover, the likelihood function of the
Heckman double hurdle model was significant (Wald chi2 =3151.13, with p< 0.0000) showing
strong explanatory power of the model.
As presented in Table 4.10, the results from the regression showed that most of the
explanatory variables affected access to microcredit and the amount of microcredit accessed.
Variables that positively and significantly influenced access to microcredit were: age, education
region of residence, farm size and organizational membership. However, interest rate was
significant and negatively related with the first discrete decision. On the other hand, variables
that positively and significantly influenced amount of microcredit accessed include: region of
residence, farm size and organizational membership. Interest rate was found to significantly and
negatively affect amount of microcredit accessed.
The parameter estimates of the Heckman’s double hurdle model only provided the
direction of the effect of the explanatory variables on the factors that influence access to
microcredit and amount of microcredit accessed, and did not present the actual magnitude of
change or probabilities in the coefficients. Thus, the marginal effects (dy/dx) from the
Heckman’s double hurdle model, which measures the expected change in probability
determinants of microcredit access and amount of microcredit accessed with respect to a unit

110
change in an independent variable was also presented in Table 4.11.For both selection and
outcome models respectively.
Interest rate (INT) had a negative and significant effect on access to microcredit and on
the amount of microcredit accessed at p<0.01. A unit increase in the interest rate will have a
marginal effect of reducing the probability of access to microcredit by -0.00733 (-7.3%) and
probability of amount of microcredit accessed by - 0.08556 (-8.5%).This result is in line with the
findings of Kausar, (2013) who reported that there is an inverse relationship between interest rate
and demand for microcredit. Increase in interest rate causes decrease in demand for microcredit.
Philip et al. (2009) further observes that high interest rate and the short- term nature of loans
with fixed repayment periods do not suit annual cropping, and thus constitute a hindrance to
microcredit access. Fernando, (2006) in his study of understanding and dealing with high interest
rates on microcredit, noted that the interest rates charged on microcredit loans is higher than
other loans. This happens because; the credit services provided are for small sums of money and
the cost of these loans makes interest on them very high (Agnet 2004)
The coefficient of years of formal education (EDU) was positive and significantly
(p<0.01) correlated with the determinants of microcredit access. A unit increase in years of
formal education of the farmer will have a marginal effect of increasing the probability of
accessing microcredit by 0.02179 (2.1%). This result shows that, education has a positive
significant effect on access to microcredit. Weir (1999) confirms that educations increases the
household head’s probability of accessing microcredit, enhances diversification of household
income sources and thus reduces risk and improves food security.

111
Table 4.10 Parameter Estimates and Marginal effects of the Heckman Double Hurdle
Model analysis of factors that determine access to microcredit and the amount of
microcredit received by respondents.
Selection Result (Access model) Outcome Result (Amount model)
Variables Regression
Coefficients
Marginal
effects
Regression
coefficients
Marginal
effects
INTEREST - 0.00716
(-2.30) ***
-0.00733
(-2.30) ***
-0.55886
(-8.62) ***
-0.08556
(-8.62) ***
GENDER -0.02758
(-0.74)
-0.02703
(-0.74)
-0.02129
(-0.08)
-0.00326
(-0.08)
EDU 0.02043
(5.88) ***
0.02179
(5.88) ***
-0.05239
(-1.35)
-0.00802
(-1.35)
AGE 0.01193
(7.73) ***
0.012524
(7.73) ***
-0.02265
(-1.47)
-0.00346
(-1.47)
MT STATUS
-0.02525
(-0.60)
-0.02647
(-0.60)
-0.18503
(-0.65)
-0.02689
(-0.65)
RR 0.06860
(2.13) **
0.05676
(2.13) **
0.45628
(1.68) *
0.06986
(1.68) *
FRMSIZE 0.02933
(1.72) *
0.03721
(1.72) *
0.30401
(2.02) **
0.04654
(2.02) **
ORGMEM 0.09193
(2.72) ***
0.06239
(2.72) ***
1.58953
(4.00) ***
0.16864
(4.00) ***
Source: Field survey 2014 ***,**,* indicates significance at 1, and 5% and 10% respectively
Figure in parenthesis are z- ratios, Number of observation=384, Prob >chi 2=0.0000, rho value=
0.45526
Age of household head (AGE) had a positive and significant relationship with the
determinants of microcredit access at p<0.01. A unit increase in the age of household head will
have a marginal effect of raising the probability of accessing microcredit by 0.012524 (1.2%).
This finding supports the result of studies conducted by Fred (2009), Olujide (2008) and Zeller et
al. (2001) who confirm that, age affects the probability of accessing microcredit. The older the
household head, the more his experience and the higher the probability of access.

112
Region of residence (RR) was positive and significantly related with determinants of
access to microcredit at p<0.05 and amount of microcredit accessed at p<0.10. The result of the
marginal impact showed that, a unit increase in region of residence will yield 0.05676 (5.6%)
increase in the probability of access to microcredit and 0.06986 (6.9%) increase in the
probability of amount of microcredit accessed. This implies that living in an urban area enhances
access to microcredit and the amount of microcredit accessed. This result is in line with the
findings of Okurut and Bategeka (2005), who investigated the impact of micro finance on the
welfare of the poor in Uganda. They noted that location influences access to credit schemes and
urban households were more likely to have access to credit compared to rural households. Egyir,
(2010) reported that, in urban areas; different types of microcredit sources and financing
institutions are available, and most available loans are primarily focused on the production phase
of the agriculture - growing crops or raising animals. Okurut, Scoombee and Berg (2006) and
Nguyen, (2007) share similar views.
The coefficient of farm size (FMSIZE) of the farmers had a positive and significant
relationship with the determinant of access to microcredit at p<0.10 and with the amount of
microcredit accessed at p<0.05. The result of the marginal effects on farm size indicated that, a
one-unit increase in farm holdings of the farmers ceteris paribus would lead to 0.03721 (3.7%)
increase in probability of accessing microcredit and 0.04654 (4.6%) increase in probability of
amount of microcredit accessed by the farmers. This finding agree with Okurut, Scoombee and
Berg (2006) who, investigated the household and individual characteristics that acts as
determinants of demand for formal and informal credit, and reported that farm size influences
demand to credit.

113
Organizational membership (OGMEM) of the farmers was found to be significant and
positively affected access to microcredit and the amount of microcredit accessed at p<0.01. The
result of the marginal impact showed that a unit increase in organizational membership of the
household head, will result in increase of the probability of access to microcredit by 0.06239
(6.2%) and increase in the probability of the amount of microcredit accessed by 0.16864
(16.8%). This finding supports the result of the study of Mwangi and Ouma (2012) who reported
a positive relationship between organizational membership and credit access; the higher the
number of group one pledges loyalty to, the higher the probability of accessing credit. At the
household level, being part of a specific target group influences credit access as well (Kausar
2013 and Vaessen, 2001).
4.4 Factors that determine the frequency of microcredit received.
Factors influencing frequency of microcredit accessed is presented in table 4.11. The Mac
Fadden R-squared is 0.87, which implies that all the explanatory variables included in the model
were able to explain 87% of the frequency of small scale farm households’ access to microcredit
in the study area. Gender, education, farm income and interest were negatively significant at 5%,
1% and, 10% and 5% level of significance while, age, experience in borrowing and social capital
were positively significant at 1% level each.
The coefficient of gender was significant at 5% level of significance with a negative sign.
This implies that frequency of access to microcredit had an indirect relationship with gender.
Female household heads accessed microcredit more than the male household heads. The antilog
of the coefficient of gender is 1.2175, implying that female headed household’s accessed
microcredit once a year. Ololade and Olaguji (2013) from their findings reported that there is a
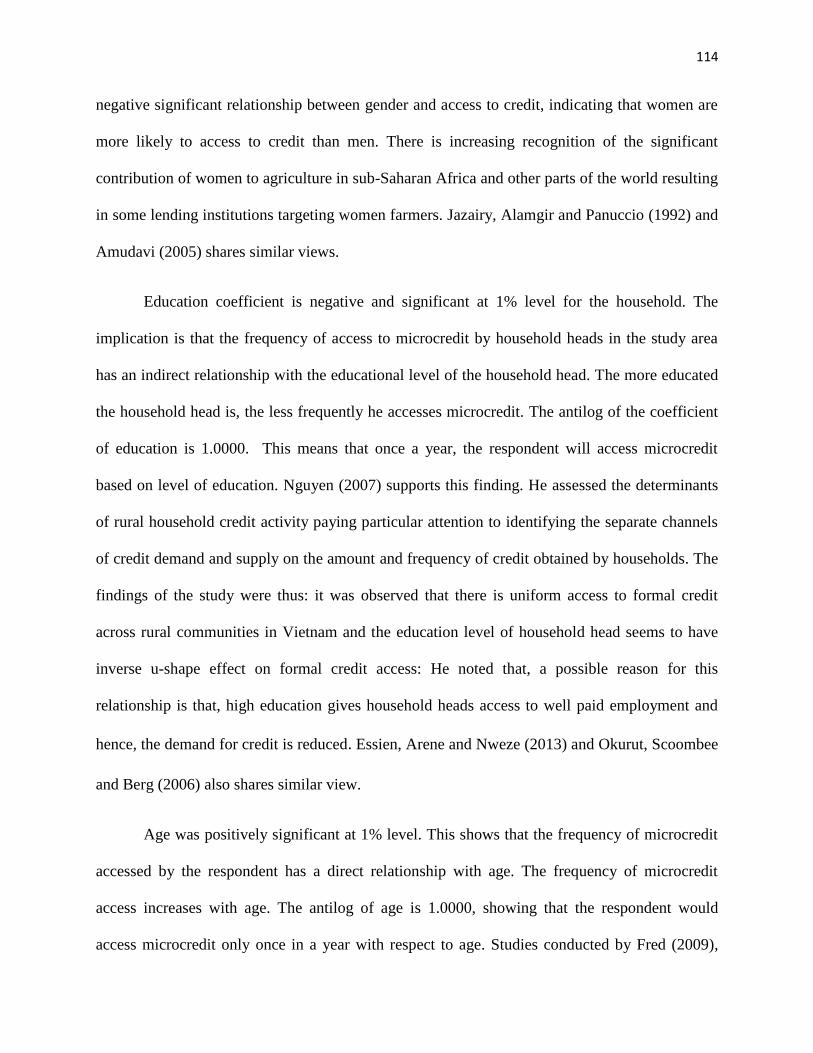
114
negative significant relationship between gender and access to credit, indicating that women are
more likely to access to credit than men. There is increasing recognition of the significant
contribution of women to agriculture in sub-Saharan Africa and other parts of the world resulting
in some lending institutions targeting women farmers. Jazairy, Alamgir and Panuccio (1992) and
Amudavi (2005) shares similar views.
Education coefficient is negative and significant at 1% level for the household. The
implication is that the frequency of access to microcredit by household heads in the study area
has an indirect relationship with the educational level of the household head. The more educated
the household head is, the less frequently he accesses microcredit. The antilog of the coefficient
of education is 1.0000. This means that once a year, the respondent will access microcredit
based on level of education. Nguyen (2007) supports this finding. He assessed the determinants
of rural household credit activity paying particular attention to identifying the separate channels
of credit demand and supply on the amount and frequency of credit obtained by households. The
findings of the study were thus: it was observed that there is uniform access to formal credit
across rural communities in Vietnam and the education level of household head seems to have
inverse u-shape effect on formal credit access: He noted that, a possible reason for this
relationship is that, high education gives household heads access to well paid employment and
hence, the demand for credit is reduced. Essien, Arene and Nweze (2013) and Okurut, Scoombee
and Berg (2006) also shares similar view.
Age was positively significant at 1% level. This shows that the frequency of microcredit
accessed by the respondent has a direct relationship with age. The frequency of microcredit
access increases with age. The antilog of age is 1.0000, showing that the respondent would
access microcredit only once in a year with respect to age. Studies conducted by Fred (2009),

115
Olujide (2008) and Zeller et al. (2001) confirm that, age affects the probability of accessing
credit. The older the respondent, the more his experience and the higher the frequency of
accessing microcredit, when properly utilized; leads to increased productivity, ownership of
assets and the end result will be improved household incomes and food security.
Table 4.11 Parameter estimates of Poisson Model analysis of determinants of frequency of
microcredit accessed by respondents
Variables Coefficients Standard Error Z value
CONSTANT
0.07875 0.45653 0.1725
GENDER
-0.08546 0.03169** -2.6963
EDU
-0.00128 4.1599e-04*** -3.0782
AGE
0.00403 1.16985e-03*** 3.4501
FARM INC
-3.02796e-07 1.77802e-07* -1.7030
EIB
0.00301 0.00058*** 5.1872
SOC
0.29109 0.16274*** 4.7887
INT
-7.02313e-06 6.07096e-06** -2.4568
McFadden R-squared 0.871093 Adjusted R-squared 0.616550
Log-likelihood 234.0424 Akaike criterion 486.0848
Source: Field survey 2014. ***, **, * indicates significance at 1, 5% and 10% respectively
Farm income is negative, consistent with a priori expectation signs and statistically
significant at 10%. This implies that the frequency of microcredit access will decrease with
increase in respondent’s income. The more income the farmer earns, the less likely he will go for
external funds. The antilog of the coefficient of farm income is 1.0000 showing that small scale
farmers in the study area will access microcredit once in a year based on farm income. This
result could be attributed to increased income as a result of increase in economic activities in the

116
area. This result is substantiated by Udonsi (2007) in his analysis of small holder farmers under
Abia State Agricultural Loan Scheme. The results of the study showed that, farm income is one
of the factors that had positive significant influence on small holder livestock farmers frequency
of accessing credit. Nwaru, Essien and Onuoha (2011) and Mohamen (2003) supports this
finding
The coefficient of experience in borrowing was significant at 1% level with a positive
sign, this implies that there is a direct relationship between frequency of microcredit access by
borrowers in the study area and the experience they have acquired borrowing money for farming.
The antilog of the coefficient of experience in borrowing is 1.0000, this implies that small scale
farm household heads would only access microcredit once in a year based on their experiences in
borrowing money. Years of experience in borrowing from microcredit groups increases the
frequency of borrowing (Daniel, Job and Ithinji 2013). Essien, Arene and Nweze (2013) share
similar views.
The Social Capital coefficient was positively signed and significant at 1% level. This is in
consonance with a priori expectation; the frequency of microcredit access by small scale farm
household heads in the study area has a direct relationship with the borrower’s acquaintance with
the lender. The more the respondent is acquainted with the lender, the greater his chances of
accessing funds. The antilog of the coefficient of social capital is 2.0000. The implication is that
microcredit borrowers that have formed an acquaintance with the lender would be able to access
funds twice in a year as against those without close acquaintance with lender. Informal lending is
usually on trust, and being acquainted with the lender certainly tends to be a trust booster. In a
study of the factors that affect microcredit demand in Pakistan Kausar (2013), found out that,
there are many factors which may affect the demand of microcredit by the borrowers one of

117
which is the relationship between lenders and borrower. Essien, Arene and Nweze (2013) also
share similar view.
Interest amount was significant at 5% with the right a priori sign. This implies that the
frequency of microcredit access has an indirect relationship with interest. The more the amount
to be paid as interest, the less microcredit that is accessed. The antilog of the coefficient on
interest is 1.000. This implies that a unit increase in interest amount will reduce frequency of
access to once a year.
4.5 Food security status of farm households in the Niger delta region
Based on the food security analysis results, derived using the Household Food Security
Survey model earlier described, table 4.12 shows that very few farm households in the Niger
Delta (12.24%) were marginally food secure, while most of them (87.76) were food insecure at
different levels of food insecurity. This result agrees with Ibok (2012) which indicated that 1.84
% of the country’s households were food secured and 98.16% were food insecure. This is an
issue of great concern, as the Millennium Development Goal of halving the population of food
insecure households by 2015 and the proposed Sustainable Development Goal may remain a
mirage if concerted efforts are not taken to alleviate food insecurity.
Table 4.12 Distribution of respondents according to food security status
Food security status
Scale/value Frequency Percentages
Marginal food security
1-2 47 12.24
Low food security
3-7 138 35.94
Very low food security
8-18 199 51.82
Source: Field survey, 2014

118
4.5.1 Coping strategies to food shortage adopted by farm households
Table 4.13 shows the coping strategies adopted by farm households against food security.
The strategies span from eating once a day to picking leftover food at social functions. About
18.49% of farm households occasionally allowed their children to eat first, 67.45% occasionally
bought food on credit,45.57% sold their assets and 57.03% ate once a day.
Table 4.13 Percentage distribution of respondents according to coping strategies to food
shortage
Coping Strategy Very Often
(%)
Occasionally
(%)
Regularly
(%)
Never (%)
Allowing children to eat first
46.88 18.49 31.77 0.52
Eating wild fruits
0.26 12.76 1.56 85.42
Selling assets
1.56 45.57 4.95 47.92
Buying food on credit
2.08 67.45 3.91 26.56
Picking leftover food at social
functions
0.26 7.29 1.30 91.15
Eating once a day
8.59 57.03 8.59 25.79
Source: Field survey, 2014. * Multiple responses allowed
4.6 The effects of microcredit access on food security status of small scale farmers in the
region.
The respondents were separated into three food security groups; marginally food secure,
low food security and very low food security. Along with their individual characteristics, twelve
variables were hypothesized to influence and distinguish respondents into food security groups.
4.6.1 Group Statistics of factors affecting food security
The means and standard deviations of the independent variables in the group statistics
presented in table 4.14 indicated that large differences existed between the variables. This
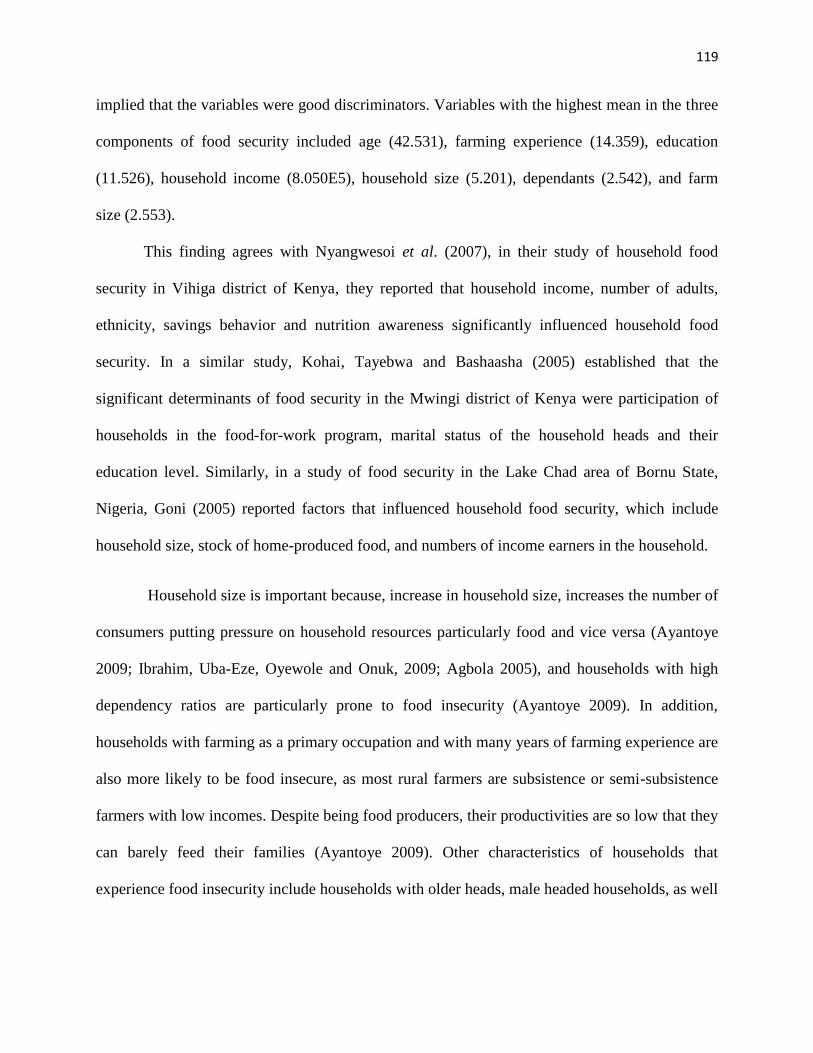
119
implied that the variables were good discriminators. Variables with the highest mean in the three
components of food security included age (42.531), farming experience (14.359), education
(11.526), household income (8.050E5), household size (5.201), dependants (2.542), and farm
size (2.553).
This finding agrees with Nyangwesoi et al. (2007), in their study of household food
security in Vihiga district of Kenya, they reported that household income, number of adults,
ethnicity, savings behavior and nutrition awareness significantly influenced household food
security. In a similar study, Kohai, Tayebwa and Bashaasha (2005) established that the
significant determinants of food security in the Mwingi district of Kenya were participation of
households in the food-for-work program, marital status of the household heads and their
education level. Similarly, in a study of food security in the Lake Chad area of Bornu State,
Nigeria, Goni (2005) reported factors that influenced household food security, which include
household size, stock of home-produced food, and numbers of income earners in the household.
Household size is important because, increase in household size, increases the number of
consumers putting pressure on household resources particularly food and vice versa (Ayantoye
2009; Ibrahim, Uba-Eze, Oyewole and Onuk, 2009; Agbola 2005), and households with high
dependency ratios are particularly prone to food insecurity (Ayantoye 2009). In addition,
households with farming as a primary occupation and with many years of farming experience are
also more likely to be food insecure, as most rural farmers are subsistence or semi-subsistence
farmers with low incomes. Despite being food producers, their productivities are so low that they
can barely feed their families (Ayantoye 2009). Other characteristics of households that
experience food insecurity include households with older heads, male headed households, as well

120
as farm households that experienced food shortage prior to harvest (Ayantoye 2009; Agbola
2005).
Food insecurity incidence decreases with increase in farm size. According to Gebrehiwot
and Van der Veen (2010), food production can be increased extensively through expansion of
areas under cultivation and households can also diversify. This outcome is consistent with the
findings from a research conducted by Aidoo, Mensah and Tuffor (2013).
Table 4.14 Group statistics of factors affecting food security
Discriminators of food
security
Group statistics mean
Standard deviation
Marital status 0.706 0.4563
Household size 5.201* 1.7475
Education 11.526* 3.7873
Age 42.531* 9.2651
Gender 0.716 0.4515
Dependants 2.542* 1.7034
Farming experience 14.359* 8.9373
Farm size 2.553* 0.8943
Remittance status 0.370 0.4834
Household income 8.050E5* 266238.8862
Borrow money for farming 0.497 0.5006
Cooperative membership 0.284 0.4515
Source: Field survey, 2014
The discriminant analysis was carried out using variables expected to discriminate
between the three groups. Twelve variables thought to possibly place farm households into the

121
three groups were included in the analysis. To assess the ability of the variables to discriminate
between food secure and food insecure households, the function coefficients were standardized
by giving the mean a standard value of zero and a standard deviation of 1. The standardized
coefficients so obtained are presented in table 4.15 with related statistics.
Table 4.15 Standardized Canonical Discriminant Function Coefficients
Variables Coefficients
marital status 0.180
household size 0.002
Education 0.459
Age 0.486
Gender 0.275
Dependants 0.396
farming experience -0.162
farm size 0.27
remittance status -0.264
household income -0.694
borrow money for farming -2.338
cooperative membership 0.436
Source: Field survey, 2014
The higher the values of the coefficient in table 4.15, the higher the contribution of the
variable in discriminating between food security groups. The standardized discriminant
coefficient usually does not show the relative importance of the different variables. This was

122
achieved by calculating the correlation between the values of the discriminant function and the
coefficients of the variables. The result gave the pooled within group correlation between
discriminating variables and the canonical discriminant functions represented in table 4.16.
These values effectively rank the variables according to their discriminating contributions.
Table 4.16 Structure Matrix
Variables Function
borrow money for farming 0.749*
Dependants -0.428*
cooperative membership 0.399*
household size -0.335*
Gender 0.327*
farm size 0.318*
remittance status 0.308*
Education 0.127
marital status -0.019
Age 0.003
household income 0.123
farming experience -0.091
Source: Field survey, 2014*indicates significance
From table 4.16 above, the strongest predictor was borrowing money for farming (0.749)
while the weakest predictors were remittance status (0.308), farm size (0.318), gender (0.327),
household size (-0.335) and Cooperative membership (0.399) and dependants (-0.428). This

123
shows that borrowing money for farming (microcredit) is the highest determinant of whether a
household is food secure or not; implying that, microcredit has effect on the food security status
of small scale farmers in the region. The result supports the findings of Thuita, Mwadime and
Wangombe (2013) who examined the effect of access to micro finance credit by women on
household food security in three urban low income areas in Nairobi, Kenya. Findings showed
that, households of micro finance clients consumed more nutritious and diverse diets compared
to those of non-clients reflected in the dietary diversity scores for the two groups which were
significantly different. Participation in micro finance programmes led to improved food security
in the households of clients. The study provides evidence that access to micro finance credit
influences household food consumption patterns positively. Aidoo, Mensah and Tuffor (2013),
Brannen (2010), Hamad, Lia and Fernald (2010) and Hazarika and Khasnobis (2008) also share
similar views. Furthermore, households that have the opportunity to receive microcredit would
build their capacity to produce more and enhance their food security status through the use of
improved seeds and adoption of improved technologies Bogale and Shimelis (2009).
Remittance makes a difference in households’ living standards. Household receiving
remittances fare much better that household not receiving any remittance. Furthermore, it
increases household’s income significantly and raises the probability of a household being food
secure Regmi, Paudel and Mishra (2015). This outcome is consistent with the findings from a
research conducted by Abadi,Techane,Tesfay,Maxwell and Vaitla (2013).
Farm size was found to have significant effect on household food security. Food
insecurity incidence decreases with increase in farm size. According to Gebrehiwot and Van der
Veen (2010), food production can be increased extensively through expansion of areas under
cultivation and households can also diversify. Aidoo, Mensah and Tuffor (2013) and Bogale and

124
Shimelis (2009) also share similar views. Considering gender, Omonona and Agoi (2007) in
their work on analysis of food security situation among urban households evidence from Lagos
State Nigeria, reported that, food insecurity incidence is higher in female headed households than
in male headed households.
Household size is also a determinant of the food security status of a household. Aidoo,
Mensah and Tuffor (2013), in their study of determinants of household food security in Sekyere-
afam plains district of Ghana reported that larger households were found to be food insecure
compared with households with smaller sizes ceteris paribus. This outcome is consistent with the
findings from a research conducted by Idrisa, Gwary and Shehu, (2008). However, the negative
sign of household size implies an inverse relationship with food security, the smaller the
household size, the higher the level of food security.
Agricultural Cooperative membership has effect on food security. Gibremichael (2014),
supports this finding in his study of the Role of Agric Cooperatives in Promoting Food Security
and Rural Women’s Empowerment in Ethiopia. His findings show that cooperatives have the
capacity to improve the living standard of their members, as they undertake various economic
activities which helps in promoting food security and gender equity. The negative sign of
dependants parameter estimate implies that the lower the number of dependants, the higher the
chances of food security, Ayantoye (2009), supports this result noting that, households with high
dependency ratios are particularly prone to food insecurity and vice versa.

125
Summary of Canonical Discriminant Functions
Squaring the canonical correlation (0.597) in table 4.17 suggested that 35.64% of the
variation in the grouping variable was explained – whether a respondent belonged to either of the
food security typology. The low canonical correlation was attributed to the obvious overlapping
of the groups. The Eigen value reflects the ratio of importance of the dimensions which classify
cases of independent function.
In table 4.18 the chi-square statistic (189.30) of Wilks’ lambda was significant (p<0.01),
implying that the discriminant function was significant and appropriate for the data and confirms
the existence of difference between the characteristic of food secure and food insecure
households. The Wilks’ Lambda’s value of 0.60 confirms that the identified variables (estimated
function coefficients) were significant in discriminating between food secure and food insecure
households.
Table 4.17 Eigen values
Function Eigenvalue % of Variance Cumulative %
Canonical
Correlation
1 .555* 89.4 89.4 .597
2 .066* 10.6 100.0 .248
a. First 2 canonical discriminant functions were used in the analysis.
Source: Field survey, 2014.
*First 2 discriminant functions were used in the analysis
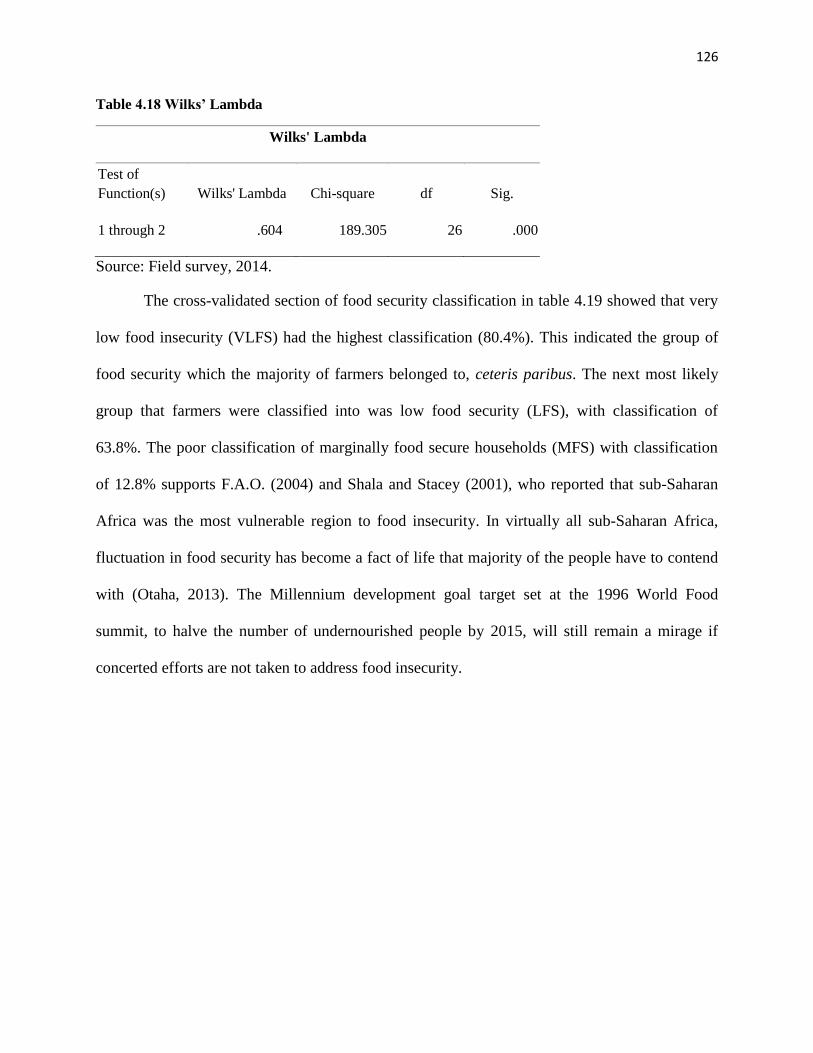
126
Table 4.18 Wilks’ Lambda
Wilks' Lambda
Test of
Function(s) Wilks' Lambda Chi-square df Sig.
1 through 2 .604 189.305 26 .000
Source: Field survey, 2014.
The cross-validated section of food security classification in table 4.19 showed that very
low food insecurity (VLFS) had the highest classification (80.4%). This indicated the group of
food security which the majority of farmers belonged to, ceteris paribus. The next most likely
group that farmers were classified into was low food security (LFS), with classification of
63.8%. The poor classification of marginally food secure households (MFS) with classification
of 12.8% supports F.A.O. (2004) and Shala and Stacey (2001), who reported that sub-Saharan
Africa was the most vulnerable region to food insecurity. In virtually all sub-Saharan Africa,
fluctuation in food security has become a fact of life that majority of the people have to contend
with (Otaha, 2013). The Millennium development goal target set at the 1996 World Food
summit, to halve the number of undernourished people by 2015, will still remain a mirage if
concerted efforts are not taken to address food insecurity.

127
Table 4.19 Food security typology classification
Predicted Group Membership
Food Security Status MFS LFS VLFS Total
Ori
gin
al
Cou
nt
MFS 7 29 11 47
LFS 7 91 40 138
VLFS 3 34 162 199
%
MFS 14.9 61.7 23.4 100
LFS 5.1 65.9 29.0 100
VLFS 1.5 17.1 81.4 100
Cro
ss-v
ali
date
d
Cou
nt
MFS 6 30 11 47
LFS 8 86 44 138
VLFS 3 36 160 199
%
MFS 12.8*** 63.8** 23.4 100
LFS 5.81 62.3 31.9 100
VLFS 1.5 18.1 80.4* 100
Cross validation is done only for those cases in the analysis. In cross validation, each case is
classified by the functions derived from all cases other than that case.
b. 67.7% of original cases correctly classified
c. 65.6% of cross-validated grouped cases correctly classified
* best classified group ** averagely classified group *** poorly classified group
Source: Field survey, 2014
The test of equality of group means in table 4.20 provided strong statistical evidence of
significant differences between means among the components of food security. All the variables
produced significant F-statistic with the highest F-statistic coming from borrowing money for
farming. Furthermore, 6 out of 12 variables were significant. These are; borrowing microcredit
for farming, cooperative membership, household size, dependants, education and gender.

128
Table 4.20 Test of equality of group means
Wilks' Lambda F value Significance
Marital status .994 1.119 .328
Household size .978 4.375 .013
Education .985 2.804 .062
Age .998 .300 .741
Gender .985 2.905 .056
Dependants .977 4.555 .011
Farming experience .995 .987 .374
Farm size .992 1.608 .202
Remittance status .994 1.229 .294
Household income .990 1.887 .153
Borrow money for farming .760 60.112 .000
Cooperative membership .948 10.370 .000
Source: Field survey, 2014.
4.7 Vulnerability of farm households to food insecurity in Niger Delta Region.
Households experience food insecurity because of different kinds and magnitude of risk
they face (Alayande & Alayande, 2004). When there are not enough assets to reduce shocks or
risk to livelihood, household sometimes may experience losses including reduction in quality and
quantity of nutritious food intake; or sometimes school-aged children can temporally or
permanently stop schooling (Osawe, 2013), this could reduce household human capital base,
thereby making them vulnerable to food insecurity.

129
The estimation of household vulnerability to food insecurity was done using asset
capacity approach. Table 4.21 shows vulnerability analysis of the respondents. The vulnerability
indicators assessed in this study include: years of formal schooling (education), farm size, land
ownership status of the farmer, access to remittance to support farming, household size, total
farm income, age of household head, asset value, dependent relatives, and membership of social
organizations. It is assumed that most of these factors either reduces or increases respondents’
vulnerability to food insecurity. As presented in table 4.22, the actual values of the asset base
indicators are in different units and scales. To obtain the vulnerability indices on each of the
indicators, the methodology used by United Nations Development Programme (UNDP) (2006)
for assessing Human Development Index was followed to normalize and standardize the values
to lie between 0 and 1. A value less than 0.5 implies that the household is not vulnerable to food
insecurity, while a value greater than 0.5 indicates that the household is vulnerable to food
insecurity. The most preferred and natural candidate for the vulnerability threshold is 0.5. This
midway dividing point has an attractive feature, it makes intuitive sense to say a household is
‘vulnerable’ if it faces a 50% or higher probability of falling into poverty in the near future
(Suryahadi,Widyanti & Sumarto, 2003). The underlying logic is that the “observed food
insecurity level represents the mean vulnerability level in the population, anyone whose
vulnerability level lies above this threshold faces the risk of food insecurity, that is greater than
the average risk in the population and hence can be legitimately included among the vulnerable”
(Chaudhuri, 2003). In practice, therefore most of the empirical studies adopted the vulnerability
threshold of 0.5.
Using education of the household head as an indicator, microcredit beneficiary
households in the surveyed area had a vulnerability index of 0.40 while microcredit non-

130
beneficiary households had a vulnerability index of 0.50. The implication of this finding is that
microcredit non-beneficiary households are 50% vulnerable to food insecurity, while their
microcredit beneficiary counterparts are not vulnerable. It could also mean that microcredit non-
beneficiary households had low educational qualifications which could deny them opportunities
to be employed in more remunerative jobs, which otherwise could assist them to be food secure.
Osawe (2013), reported that poverty and vulnerability diminishes as one moves up the education
ladder. Education can affect people’s standard of living through a number of channels: it helps
skill formation resulting in higher marginal productivity of labour that eventually enables people
to engage in more remunerative jobs. Highly educated people may have better coping abilities
against future odds. Indeed, educated people may adapt more easily to changing circumstances,
therefore showing greater ex-post coping capacity (Christiansen & Subbarao, 2004). Considering
farm size, beneficiary households had a low vulnerability index of 0.54 compared to non-
beneficiary households that had a high vulnerability index of 0.60. This indicates that
beneficiaries operated more farm sizes in the area than non-beneficiaries; increasing farm size
would reduce the risk of beneficiaries falling into food insecurity in the future (Babatunde et al.
2008).
On the ownership of land for agricultural production, the vulnerability index of
beneficiaries of microcredit was 0.48 while that of non-beneficiaries was 0.63. This is not
unconnected to their access to microcredit which could have given them the financial
empowerment to purchase land, and this made them less vulnerable to food insecurity. Birungi
and Hassan (2010), reported that land tenure security increases the probability of investment in
land management hence, reducing vulnerability. Regarding remittance, the survey showed that
microcredit beneficiaries had a vulnerability index of 0.35 and non-beneficiaries had a

131
vulnerable index of 0.58. Remittance makes a difference in households’ living standards as,
household receiving remittances fared much better that household not receiving any remittance.
Yang and Martinez (2005) support this finding. Considering household size, beneficiaries of
microcredit had a vulnerability index of 0.54 and non-beneficiaries had a vulnerability index of
0.46. Babatunde, Owotoki, Heidhues and Buchenrieder (2007) said that households become
more vulnerable to food insecurity as their household size increases.

132
Table 4.21 Vulnerability status of the respondents (N=384)
ABIA AKWA
IBOM DELTA RIVERS AVERAGE
SN VULNERABILITY
INDICATORS
STATUS ACTUAL
VALUE
Vul.
Index
ACTUAL
VALUE
Vul.
Index
ACTUAL
VALUE
Vul.
Index
ACTUAL
VALUE
Vul.
Index
ACTUAL Vul.
Index
1 EDUCATION B 11.92 0.18 10.00 1.00 12.33 0.00 11.38 0.41 11.40 0.40
NB 10.88 1.00 11.54 0.57 12.42 0.00 11.75 0.43 11.65 0.50
2 FARM SIZE B 2.63 0.47 2.60 0.69 2.70 0.00 2.56 1.00 2.62 0.54
NB 2.30 1.00 2.73 0.00 2.47 0.61 2.38 0.81 2.50 0.60
3 LAND OWNERSHIP B 0.52 0.58 0.44 1.00 0.63 0.00 0.56 0.37
0.54 0.48
NB 0.44 0.90 0.63 0.00 0.42
1.00 0.50 0.62 0.50 0.63
4 REMITTANCE
B 0.46 0.00 0.40 0.24 0.21 1.00 0.42 0.16 0.37 0.35
NB 0.69 0.00 0.52 0.81 0.58 0.52 0.48 1.00 0.56 0.58
5 HOUSEHOLD SIZE B 4.79 0.68 5.60 0.00 5.04 0.47 4.40 1.00 2.15 0.54
NB 5.35 0.48 5.75 0.00 5.46 0.35 4.92 1.00 1.83 0.46
6 TOTAL FARM
INCOME B 329904 0.00 302854 0.45 311354 0.31 269791 1.00 303476 0.44
NB 268343 0.74 314312 0.00 296333 0.29 252500 1.00 886645 0.50
7 AGE B 42.88 0.45 47.17 0.00 37.54 1.00 43.90 0.34 42.87 0.45
NB 38.44 0.84 48.23 0.00 36.60 1.00 43.50 0.41 41.69 0.56
8 ASSET VALUE B 514208 0.00 482916 0.19 346208 1.00 391666 0.73 433750 0.48
NB 452500 0.34 396250 0.75
362645 1.00 499687 0.00 427770 0.52
9
DEPENDENT
RELATIVES
B 2.00 1.00 2.88 0.00 2.52 0.41 2.06 0.93 2.37 0.59
NB 2.23 1.00 2.98 0.12 3.08 0.00 2.58 0.59 2.72 0.43
10 CO-OPERATIVE
MEMBERSHIP B 0.67 0.19 0.48 0.80 0.73 0.00 0.42 1.00 0.54 0.50
NB 0.02 1.00 0.02 1.00 0.08 0.00 0.02 1.00 0.04 0.75
Mean
Vulnerability
Index
0.54 0.38 0.44 0.69 0.51
Source: field survey 2014
Beneficiaries vulnerability index=0.48
Non-beneficiaries vulnerability index=0.58

133
For total farm income, the vulnerability index of beneficiaries was 0.44 while that of non-
beneficiary households was 0.50. This implies that vulnerability to food insecurity decreased as
farm income increased. Fofana (2006) supports this finding. He conducted an empirical analysis
of micro finance institutions, and a survey analysis applied to cross- sectional data collected from
185 women who had access to credit from microfinance institutions and, 209 women who had no
access to microfinance credit. The results showed that microfinance credit increased the income
of female borrowers and improved the level of farm production which is a main development
goal in most African countries whose economies are based on the agricultural sector. Regarding
age, beneficiaries had a vulnerability index of 0.45 and non-beneficiaries a vulnerability index
0.56. Age of household head appears to make a difference in vulnerability status as age increases
vulnerability, Babatunde et al. (2008). In terms of asset value, beneficiary households had a
vulnerability index of 0.48 while the non-beneficiary households had a vulnerability index of
0.52. Households that have low asset value are more likely to be poor and food insecure with
higher level of vulnerability Bebbington, (1999).
Using dependent relatives, beneficiary households had a vulnerability index of 0.59 and
non-beneficiary households had a vulnerability index of 0.43, households become more
vulnerable as dependency ratio increases. Whitehead (2002), noted that households with more
adult members had lower vulnerability and poverty status than those with few adult members,
implying that households demonstrating higher dependency ratios are more vulnerable from a
food security standpoint. Vulnerability threshold on co-operative membership indicated that
beneficiary households had a vulnerability index of 0.50 than their non-beneficiary counterpart
who had 0.75. This indicates that beneficiary households had more social ties than their
counterparts. Through cooperatives, farmer members share information, have more access to

134
agricultural inputs, technologies and training from extension agents thus reducing vulnerability
to food insecurity Amusa, Okoye and Enete, (2015).
Vulnerability indicators gives information on the processes or interventions implemented
to target food security or with the determinants or sources of risk associated with food security
Santeramo (2015). The vulnerability indicators among microcredit beneficiary and non-
beneficiary households in the study area, showed high level of vulnerability among non-
beneficiary households (0.55), while beneficiary households (0.47) were not vulnerable. The
vulnerability of non-beneficiary households is not surprising as; results from a study conducted
by Zaman (2000) on the relationship between microcredit and the reduction of poverty and
vulnerability, showed that microcredit reduces vulnerability by; strengthening crisis-coping
mechanism, building assets and providing emergency assistance during natural disasters. Having
access to microcredit, improves a borrowing households ability to cope with potential shocks,
thus reducing its vulnerability to poverty and food insecurity (Montgomery and Weiss (2005)
and Morduch, 1998).
The State based analysis shows that Rivers and Abia States respondents were vulnerable
with 0.69 and 0.54 levels of vulnerability respectively, while Akwa Ibom and Delta States
respondents were not vulnerable with 0.38 and 0.44 levels of vulnerability. This finding therefore
showed that, beneficiaries of microcredit in the Niger Delta region were less vulnerable to food
insecurity than non-beneficiaries. The mean vulnerability index was 0.51; this suggested that the
surveyed farm households in Niger Delta, Nigeria were 51% more likely to be vulnerable to food
insecurity. Thuita, Mwadime and Wangombe (2013) support this finding. Results of their
findings show that, participation in microfinance programmes led to improved food security in
the households of clients. Swain and Floro (2012) in assessing the effect of microfinance on

135
vulnerability and poverty among low income households in India said that, borrowing improves
economic welfare via increased income and consumption. It prevents households from falling
into food insecurity and poverty and enables them to meet their survival needs, make productive
investments and avoid selling their limited resources in times of income or expenditure shocks.
Lovendal and Knowles (2005), Cohen and Sebstad (2000) also share similar views.
136
CHAPTER FIVE
SUMMARY, CONCLUSION AND RECOMMENDATIONS
5.1 Summary
This study examined the effects of access to microcredit on the food security status of
crop farm households in Niger Delta, Nigeria using descriptive and inferential statistics. Six
specific objectives were developed to guide the study. Purposive, stratified, multi-stage and
simple random sampling techniques were employed in selecting 384 farm households from four
(out of nine) States for the study. Out of the 480 copies of the questionnaire administered, 384
copies were retrieved and used for the study. Data for the study were obtained from primary
source using interview schedule guided by structured questionnaire. Descriptive and relevant
inferential statistics such as frequencies, percentages, mean, Heckman Double Hurdle Model,
Poisson Model, Household Food Security Survey Model, Multiple Discriminant Function and
Vulnerability Analysis were used for data analysis.
Majority of the beneficiaries (83.85%) and non-beneficiaries (80.21%) were males while
16.15% and 19.79% of beneficiaries and non-beneficiaries were females. About 71.85% of the
respondents were in active and productive age between 31-50 years of age, with the mean age of
42.87 for beneficiaries and 42.19 for non-beneficiaries. Furthermore, Majority (98.44%) of the
respondents had some form of formal education. For instance, about 43% of the respondents had
at least secondary education and 23% had primary education. The remaining 32% had at least
tertiary education with 12% of them having Ordinary National Diploma (OND), 19% having
Higher National Diploma HND/ Bachelor degree, while 1% had Masters degree. The mean
literacy level among the respondents was 11 years, an indication of high literacy level among
respondents in the region. The average household size of the respondent was about 5 persons.

137
64.58% of beneficiaries and 60.94% of non-beneficiaries had a household size of 5-8 persons.
Majority of the respondents (51.56% and 52.08% of the beneficiaries and non-beneficiaries)
spent 6-15 years in farming. The average year of farming experience of the respondents was
about 14years. A high percentage of the respondents (86.98% of beneficiaries and 77.08% of
non-beneficiaries) were married. Majority (82%) of the sampled respondents were once married,
while about 5.46% never got married.
The most accessed sources of microcredit were: Cooperatives (36.03%), Esusu (20.24%)
and Microfinance Banks (10.93%). Furthermore, in the Niger Delta region, the informal sources
were the most patronized sources (73.77%) while the patronage of the formal sources was
(26.31%).
Heckman double hurdle model analysis of factors that determined access to microcredit
and the amount of microcredit received by small scale farmers indicates that, the variables that
had positive and significant influence on access to microcredit were: education, age, region of
residence, farm size and organizational membership. However, interest rate was significant and
negatively related with the first discrete decision. On the other hand, variables that positively
and significantly influenced amount of microcredit accessed were: region of residence, farm size
and organizational membership. Interest rate was also found to significantly and negatively
affect amount of microcredit accessed.
Region of residence (RR) was positive and significantly related with determinants of
access to microcredit at p<0.05 and amount of microcredit accessed at p<0.10. The results of the
marginal impact showed that, a unit increase in region of residence will yield 0.05676 (5.6%)
increase in the probability of access to microcredit and 0.06986 (6.9%) increase in the
probability of amount of microcredit accessed. The coefficient of farm size (FMSIZE) of the

138
farmers had a positive and significant relationship with access to microcredit at p<0.10 and the
amount of microcredit accessed at p<0.05. The results of the marginal effects on farm size
indicated that, a one-unit increase in farm holdings of the farmers ceteris paribus would lead to
0.03721 (3.7%) increase in probability of accessing microcredit and 0.04654 (4.6%) increase in
probability of amount of microcredit accessed by the farmers.
Organizational membership (OGMEM) of the farmers was found to be significant and
positively affected access to microcredit and the amount of microcredit accessed at p<0.05. The
result of the marginal impact showed that a unit increase in organizational membership of the
household head, will result in increase in the probability of access to microcredit by 0.06239
(6.2%) and increase in the probability of the amount of microcredit accessed by 0.16864
(16.8%). Interest rate (INT) was negative and significantly related with access to microcredit and
the amount of microcredit accessed at p<0.01. A unit increase in the interest rate will have a
marginal effect of decreasing the probability of access to microcredit by -0.00733 (-7.3%) and
probability of amount of microcredit accessed by - 0.08556 (-8.5%).
The Poisson regression analysis of factors influencing frequency of microcredit accessed,
showed that the Mac fadden R-squared was 0.87. Gender, education, farm income and interest
were negatively significant at 5%, 1% and, 10% and 5% level of significance while, age,
experience in borrowing and social capital were positively significant at 1% level each.
Based on the food security analysis results, derived using the Household Food Security
Survey Model earlier described, very few farm households in the Niger Delta (12.24%) were
marginally food secure, while most of them (87.76%) were food insecure at different levels of
food insecurity. About 18.49% of farm households occasionally allowed their children to eat

139
first, 67.45% occasionally bought food on credit, 45.57% sold their assets and 57.03% ate once a
day. These were some of the coping strategies mostly adopted by farmers against food insecurity.
To measure the effect of microcredit on the food security status of respondents, Multiple
Discriminant Function was used. The respondents were separated into three food security
groups; marginal food security, low food security and very low food security, along with their
individual characteristics. Twelve variables were hypothesized to influence and distinguish
respondents into food security groups and, 7 out of 12 variables were significant. These were;
borrowing microcredit for farming, cooperative membership, household size, dependants,
remittance, farm size and gender. Furthermore, the strongest predictor was borrowing money for
farming (0.749) while the weakest predictors were remittance (0.308), farm size (0.318), gender
(0.327), household size (-0.335), Co-operative membership (0.399) and dependants (-0.428),
respectively. This shows that borrowing money for farming (microcredit) was the highest
determinant of whether a household was food secure or not; implying that, microcredit had effect
on the food security status of small scale farmers in the region. Vulnerability analysis suggests
that farm households in the study area were 51% more likely to be vulnerable to food insecurity.
5.2 Conclusion
Majority of farm households in Niger Delta Nigeria are faced with serious food insecurity
problems. This is evidenced in the fact that, in this study 87.76% small scale farmers were not
food secure, only 12.24% were food secure. This implies that the Millennium Development Goal
of halving the proportion of hungry people at the end of 2015 has not been achieved in this
region. For farmers to cope with this high level of food insecurity, selling of assets, allowing their
children to eat first and buying food on credit were some coping strategies adopted in the study
area. Hunger and poverty will remain at unacceptable levels unless purposeful action is taken to

140
give them higher priority and to mobilize resources towards fighting them. Lack of adequate
capital is one of the major constraints to increased agricultural output which in turn has affected
overall agricultural development and food security in Nigeria. Farm households borrow
microcredit and engage in agricultural production, to reduce poverty and food insecurity
problems. Microcredit schemes in the study area have been successful in raising income levels
and improving food security of beneficiaries.
Microcredit still remains a great tool with the potential of alleviating food insecurity
among the poor. To achieve this goal, the scope should be expanded and the volume increased,
this will go a long way in alleviating capital constraints and enhance food security in the region.
Furthermore, placing the Millennium Development goal of; eradicating hunger and food
insecurity in the world, at the center of financing for development is a step in the right direction.
5.3 Recommendations
i. In line with the findings of this study, there is an urgent need to remedy food insecurity
problems in Nigeria. Microcredit has shown a significant effect on food security as such,
to remedy food insecurity; microcredit schemes should be set up by government,
development organizations, agricultural cooperatives and individuals among others to
support small scale farmers in agricultural production. The loans should be properly
managed, released on time and given on regular basis to genuine farmers to ensure proper
utilization since agricultural operations are time bound.
ii. Policies that will make microcredit accessible to farmers will go a long way in addressing
their resource acquisition constraints and eventually improve household food security in
the country.

141
iii. The processing of formal loan should be decentralized to area offices with only the final
stage being done at the State capital. This will enable farmers resident in rural areas
access microcredit easily. Furthermore, rural branches of microfinance Banks and other
financial institutions should be established to facilitate access to formal credit.
iv. Educated farmers are better able to understand the dynamics of agricultural production
and resource management therefore; the Federal and State governments should establish
more adult education centres in the region to increase farmers’ access to education.
Government should also provide favourable conditions to encourage the educated to
engage in farming as; education has shown a significant effect on the farmers’ food
security status.
v. Farmers should be encouraged to organize themselves into cooperatives (for those who
do not have cooperatives in their locality) or join cooperatives (for non-members).This
awareness can be created through; agricultural extension agents, village meetings, social
gatherings and through mass media such as; radio and television as, this will enhance
their access to microcredit and subsequently their food security status.
5.4 Contributions to Knowledge
i. Most studies have focused on effect of microcredit on poverty not much has been done in the
area of effect of microcredit access on the food security status of small scale farmers in Nigeria.
Results of this study show that microcredit has effect on food security status of farmers.
ii. It has empirically established a link between microcredit access and food security in the Niger
Delta Region.

142
iii. There are relatively fewer empirical studies in literature, on vulnerability of households to
future food security. Both theoretical and empirical literature fails to address vulnerability to food
insecurity in the Niger Delta region; this work has made pioneering effort towards this gap, as it
has shown the extent of vulnerability of farm households in Niger Delta to food insecurity.
Furthermore, the study has also shown that microcredit access gives support against economic
shocks and reduces vulnerability to food insecurity.
iv. This study essentially attempts to extend literature on small scale financing in a post conflict
region.
5.5 Suggestions for further studies
Future researchers may focus on the following:
i. Replicating this study in other geopolitical regions in Nigeria.
ii. A comparative study of household microcredit access in Urban and Rural areas
iii. Impact of microcredit access on vulnerability to food insecurity among male and female
headed households in Niger Delta Region of Nigeria

143
REFERENCES
Abadi,N.,Techane, A., Tesfay,G.,Maxwell,D. & Vaitla,B.(2013). The Impact of Remittances on
Household Food Security: A Micro Perspective from Tigray, Ethiopia. Department of
National Resource Economics and Management, Mckelle University, Ethiopia.
Abalu,G.O. (1990). The Attainment of food security in Nigeria: The Role of Resource
Constrained in Nigeria Farmers. In O.Oluwasola (Ed). Implications of peasant
Agricultural practices for Environmental Resources, Food Security and Agricultural
Sustainable Development in Nigeria. Poverty Alleviation and Food Security in Nigeria.
NAAE 197-206. National Farming System Research Nigeria, Ibadan Network Bulletin.
Abdullahi, H. (2010). History and Structure of the Nigerian Economy: Pre-Colonial Period to
2007 and Beyond. Kaduna: Halygraph Publications.
Abdulaziz, T. (2002). “Corruption” Sustainable Food Security for All by 2020, IFPRI, pp 172-
175.
Abubakar,A. (2010). Economic analysis of resource-use efficiency of rice farmers under
National Fadama Development Project (NFDP-II) in Adamawa State.” (Unpublished
master’s thesis). Bayero University, Kano, Nigeria.
Adams, D. & Von Pischke J.D. (1992). “Micro enterprise credit programs: Deji vu”. World
Development, 20: 1463-1470.
Adebayo,C.O. (2004). Analysis of rural savings mobilization for poverty alleviation in Ijumu
L.G.A of Kogi State. (Unpublished master’s thesis). Ahmadu Bello University,Zaria,
Nigeria.
Adebayo,C.O.,Sanni,S.A. & Baiyegunhi L.S. (2012). Impact of microcredit scheme and food
security status of beneficiaries in Kaduna State, Nigeria. African Journal of Agricultural
Research, 7(37), 5191-5197.
Adebayo,O.O. & Adeola,R.G. (2008). Sources and uses of agricultural credit by small scale
farmers in Surulere Local Government Area of Oyo State. Anthropologist, 10(4), 313-
314.
Adejoh,S.D (2009). Analysis of production efficiency and profitability of yam-based production
systems in Ijumu LGA of Kogi State (Unpublished master’s thesis). Ahmadu-Bello
University, Zaria, Nigeria.
Adewuyi, S.A. (2002). Resource use productivity in food crop production in Kwara State,
Nigeria (Unpublished doctoral dissertation). University of Ibadan, Nigeria.
Adewuyi,S. A. & Okunmadewa,F.Y. (2001). Economic efficiency of crop farmers in Kwara
State, Nigeria. Nigerian Agricultural Development Studies, 2(1).
Adeyeye, V.A. (1999). Food and Nutrition survey in Nigeria (I ed). Pp.35-39 Ibadan:
University of Ibadan press.

144
Agbola,P.O. (2005). Analysis of food insecurity and coping strategies among farming
households in Osun State (Unpublished doctoral dissertation).University of Ibadan,
Nigeria.
Agnet, C.O. (2004). Making Farm Credit Work for Small Scale Farmers. Retrieved from
http://agnet.org/library/nc/1456.
Agom, D. I. (2001). Impact of microcredit on agricultural enterprises in Cross River State,
Nigeria (Unpublished doctoral dissertation). University of Ibadan, Nigeria.
Aidoo, R.,Mensah, J. & Tuffor, T. (2013). Determinants of household food security in the
Sekyere-afram plains district of Ghana. Ist Annual International Interdisciplinary
Conference AIIC Azores, Portugal.
Aina,L.O. (2007). Globalization and Small-Scale farming in Africa: What role for Information
Centre. World Library and Information Congress, 73rd General Conference and Council,
August 19-23rd , Durban South Africa.
Ajah, T. & Rana, H. (2005). “ Conceptualizing and Measuring Poverty as Vulnerability”: Does
it make a difference? ERD Policy Brief Series No. 41, Manila. Asian Development Bank.
Ajah, E. A. (2012).Analysis of credit worthiness, loan utilization and loan repayment among
NACRD loan beneficiaries in Cross River State. (Unpublished doctoral dissertation).
University of Calabar, Nigeria.
Ajibola,O. (2000). Institutional Analysis of the National Food Storage Programme. Research
Report, 23, Development Policy Centre, Ibadan.
Akinyosoye,V.O. (2000). Agricultural development projects (ADPs) and food crops production
in Nigeria since 70s. Nigeria Agricultural Development Studies, 1(1), 115-123.
Aku P.S. (1995), Comparative analysis of NACB and ACGSF loan disbursement to
agriculture in Nigeria. Journal of Social and Management Studies, 2: 99-108.
Alayande, B. A. & Alayande, O. (2004). A Quantitative and Qualitative Assessment of
Vulnerability to Poverty in Nigeria. A paper submitted for presentation at the CSAE
Conference on Poverty Reduction, Growth and Human Development in Africa, March.
American Dietic Association (2002). Food, Nutrient and Supplement Needs of older Adult.
Retrieved from http://www.eatright.com/adapo500htm
Amudavi, D. M. (2005). The Effects of Farmer-Community Group Participation on Rural
Livelihood in Kenya. Paper presented at the 19th Annual Conference of AIAEE, Raleigh,
North Carolina, USA.
Amusa, T.A., Okoye, C.U & Enete, A.A. (2015). Gender based vulnerability and contributions to
climate change adaptation decisions among farm households in Southwest Nigeria.
American- Eurasian Journal of Agriculture and Environmental Science, 15 (19), 1779-
1789.

145
Anacletic A. & Kydd L. (1996). Determinants of bank credit for small holder farmers in
Tanzania: A discriminant analysis application. Savings and Development, 20(3).
Anderson,A.(2002). The effect of cash cropping, credit and household composition in Southern
Malawi. African Studies Quarterly 6(1).
Anang, B. T., Sipiläinen, T., Bäckman, S., & Kola, J. (2015). Factors influencing smallholder
farmers’ access to agricultural microcredit in Northern Ghana. African Journal of
Agricultural Research, 10(24), 2460-2469.
Arene, C. J. (1996). Agricultural financial ratios, discriminant analysis and prediction of
corporate bankruptcy in the community banking system in Nigeria. Vikapla, 21(3), 37-45.
Asa,U.A. (2008). Livelihood activities and poverty alleviation among rural women in Akwa Ibom
State (Unpublished doctoral dissertation). Michael Okpara University of Agriculture,
Umudike, Abia State, Nigeria.
Asmamaw, T., Budusa,M. & Teshager, M. (2015). Analysis of vulnerability to food insecurity in
the case of Sayint District, Ethiopia. Journal of Rural Development, 5 (1), 1-11.
Atieno,R. (2009). Linkages, Access to Finance and Performance of Small Scale Enterprises in
Kenya. Research Paper No. 2009/06. United Nations University, World Institute for
Development Economics Research, 15p.
Ayantoye,K. (2009). Food insecurity status and transitions among rural households in South
Western Nigeria (Unpublished doctoral dissertation). University of Ibadan, Nigeria.
Azam, M. S. & Imai, K. S. (2012). Measuring Households Vulnerability to Idiosyncratic and
Covariate Shocks-The case of Bangladesh. Being a discussion paper for Institute of
Economics and Business Administration. Kobe University Japan.
Babatunde, R.O., Omotesho, O.A., & Sholatan, O.S. (2007). Socio-economic characteristics and
food security of farming households in Kwara State, North-Central Nigeria. Pakistan
Journal of Nutrition, 6: 49-58.
Babatunde,R.O.,Owotoki,G.M.,Heidhues,F. & Buchenrieder,G. (2007). Vulnerability and food
insecurity differentials among male and female headed farming households in Nigeria.
Pakistan Journal of Social Sciences, 4(3), 414-418.
Babatunde,R.O., Omotesho,O.A., Olorunsanya,E.O. & Owotoki,G.M. (2008). Determinants of
vulnerability to food insecurity: A gender-based analysis of farming households in
Nigeria. Indian Journal of Agricultural Economics, 63(1).
Barrett, C.B. (2002). ‘Food Security and Food Assistance Programs’, in B.L. Gardnerand G.C.
Rausser (eds), Handbook of Agricultural Economics, Vol. 2, North-Holland, Amsterdam.

146
Bebbington, A. (1999). “Capitals and capabilities. Framework for analyzing peasant viability,
rural livelihoods and poverty”. World Development, 12: 2021-2044.
Bennett, N. (2010). Sustainable Livelihoods from Theory to Conservation Practice: An Extended
Annotated Bibliography for Prospective Application of Livelihoods Thinking in
Protected Area Community Research. Protected Area and Poverty Reduction Alliance
Working Paper No.1, Victoria, Canada.
Berth, S. A. (2004). From Subsistence to Sustainable Agriculture in Africa. Mexico City:
Sasakawa Africa Association.
Bickel,G.,Nord,M., Price,C.,Hamilton,W. & Cook,J. (2000). Guide to measuring household food
security. Revised 2000, USDA, Food and Nutrition Service.
Binswanger, H.,Khandaker,S.R. & Rosenzweig,M. (1993). How infrastructure and financial
institutions affect agricultural output and investment in India. Journal of Development
Economics 41: 337-366.
Birungi, P. & Hassan, R. (2010). Poverty, property rights and land management in Uganda.
African Journal of Agricultural and Resource Economics, 4(1), 48–69.
Bogale, A. & Shimelis, A. (2009). Household level determinants of food security in rural areas
of Dire Dawa, Eastern Ethiopia. African Journal of Food and Agriculture, Nutrition and
Development 9, (9).
Black, Robert, E., Cesar, G. & Walker, S. (2013).“Maternal and child under nutrition and
overweight in low-income and middle-income countries”. Lancet, 382, (9890):427–
451. http://www.thelancet.com/journals/lancet/article/PIIS0140-6736%2813%2960937-
X/abstract.
Blaike,P.,Canon,T.,Davis,I. & Wisner,B. (1991). At Risk: natural hazards, people’s vulnerability
and disaster. New York: UNDP.
Brannen,C. (2010). An impact study of the Village Savings and Loan Association (VSLA)
Program in Zanzibar, Tanzania (Unpublished master’s thesis). Wesleyan University,
Middletown, Connecticut, U.S.A.
Braun,J.V. (2004). Towards a renewed focus on rural development. New York: Author.
Bullen, F. A. (2004). Analysis of micro finance group savings linkage scheme in Cross River
State Nigeria (Unpublished master’s thesis). University of Calabar, Nigeria.
Burger, M. (1989).Giving women credit: The strengths and limitations of credit as a tool for
alleviating poverty. World Development, 17, (7), 1017-1032
Busch,L. & Lacy, W.(1984). What does Food Security Mean? In Food Security in the United
States. In L. Buschand & W. L. Boulder (Eds.). USA: West View Press.

147
Calvo, C. & Davon, S. (2005). “Measuring Individual Vulnerability”. Economic Series working
Papers No. 229, Oxford, Department of Economics, University of Oxford.
Carney, D. (1998) ‘Implementing the Sustainable Rural Livelihoods Approach’, Ch.1in D.
Carney (ed), Sustainable Rural Livelihoods: What Contribution Can We Make? London:
Department for International Development.
Carter, M. R. & Barrett, C. B. (2006). The economics of poverty traps and persistent
poverty. Journal of Development Studies, (2), 178-199.
Central Bank of Nigeria (2004). Annual Report, Abuja CBN.
Central Bank of Nigeria (2005), Statistical Bulletin, Abuja CBN
Central Bank of Nigeria (2010). Monetary, Credit, Foreign Trade and Exchange Policy
Guidelines for Fiscal Years 2010/2011 (Monetary Policy Circular No. 38) pp 1-78.
Central Bank of Nigeria (2013), Statistical Bulletin, Abuja CBN.
Chambers, R. & Conway, R. (1992) ‘Sustainable rural livelihoods: Practical concepts for the
21st century’, Institute of Development Studies (IDS), Discussion Paper 296, IDS,
Brighton, UK.
Charistonenko, S. (2004). Policy Issues in Licensing Microfinance Institutions and Microcredit.
Paper Presented at International Validation Summit on Microfinance Policy and
Regulatory Guidelines. Organized by CBN, Abuja, Nigeria.
Chaudhuri, S.,Jalan, J. & Suryahadi, A. (2002). Assessing household vulnerability to poverty: A
methodology and estimates for Indonesia. Department of Economics Discussion Paper
No. 0102-52. New York: Columbia University.
Chaudhuri, S. (2003). “Assessing Vulnerability to Poverty: Concepts, Empirical Methods, and
Illustrative Examples”. Mimeo, Columbia University.
Cheng, E. (2006). “The Demand for Micro-Credit as a Determinant for Microfinance Outreach –
Evidence from China”. Paper presented at ACESA 2006 Emerging China: Internal
Challenges and Global Implications, Victoria University, Melbourne, July, 13-14.
Christiaensen, L. (2004): Measuring Households Vulnerability: Conceptual issues and
illustrative examples. PADI conference on Measuring, Understanding and Alleviating
Households Vulnerability, Dares Salaam, 2-3 February. World Bank.
Christiaensen, J. & Subbarao, K. (2004). Towards an understanding of household vulnerability
in rural Kenya. World Bank Policy Research Working Paper 3326. Washington D.C:
World Bank.

148
Chukwuone, N.A. (2009). “Analysis of conservation and utilization of non-wood forest products
in Southern Nigeria: Implications for forest management and poverty alleviation
(Unpublished doctoral dissertation). University of Nigeria, Nsukka.
Clover, J. (2003). Food security in sub-Saharan Africa. Africa Security Review, 12(5), 15.
Coates, J.,Swindle, A. & Bilinsky, P. (2007). Household Food Insecurity Access Scale (HFIAS)
for Measurement of Food Access: Indicator Guide (v.3). Working paper, Washington,
D.C.: FHI 360/FA
Cohen, M. & Sebstad, J. (2000). Microfinance, Risk Management and Poverty. AIMS Paper
Washington, D.C. USAID.
Coleman B. E. (1999). The impact of group lending in North East Thailand. Journal of
Development Economics, 60, 105-141.
Coleman-Jensen, A., Rabbitt, M., Gregory, C. & Singh,A. (2015). Household Food Security in
the United States in 2014, ERR-194, U.S. Department of Agriculture, Economic
Research Service, September 2015.
Crepon,B., Duflo,E. & Periente, W. (2014). Estimating the impact of Microcredit on those who
take it up: Evidence from a randomized experience in Morocco. National Bureau of
Economic Research, U.S.A.
Dallimore, A. & Mgimeti, M. (2003). Democratic Banking in the New South Africa:
Challenging Contemporary Banking Practices at Grass Roots” unpublished Report,
Durban: Development Research Africa, February, 2003.
Damoder, N.G. (1995). Basic Econometrics 3rd (Edn). Singapore: Macgraw-Hill Int. Edn. Econ.
Series, pp: 541-577.
Daniels, R.C. (2001). Consumer Indebtedness among Urban South African households: A
Descriptive Overview”, Working Paper No 01/55, Development Policy Research Unit,
University of Cape Town.
Daniel, K. Job, L. & Ithinji, G. (2013). Social capital dimensions and other determinants
influencing household participation in microcredit groups in Uasin Gishu Country Kenya.
Developing Country Studies, 3 (3).
Devereux, S. (1993). ‘Goats before Ploughs: Dilemmas of Household Response Sequencing
During Food Shortages’. IDS Bulletin, Vol.24, No.4, pp.52-59.
Devereux, S. (2001). Livelihood insecurity and social protection: A re-emerging issue in rural
development. Development Policy Review, 19(4), 507-519.
Diagne, A. & Zeller, M. (2001). Access to Credit and Its Impact in Malawi. Research Report No.
116 Washington D.C., USA. International Food Policy Research Institute (IFPRI).

149
Diagne, A., Zeller, M. & Sharma,M. (2000). Empirical Measurement of Households Access to
Credit Constraints in Developing Countries: Methodological Issues and Evidence. Food
Consumption and Nutrition Division. Discussion paper No. 90, Washington, D.C
Eboh, E. C. (2009). Developing Conceptual Framework for Empirical Research. In Anyakoha, E.
U. (Ed) Developing Research Skills: Concepts and Conceptual Frameworks. Nsukka:
Great AP Express.
Egbe,A.B.(2000) Financial institutions and agricultural finance. The role of the Central Bank of
Nigeria. CBN Economic and Financial Studies, 29, (141).
Egbe, O. (2012). Nigeria: State violence against agriculture in the Niger Delta. American Journal
of Contemporary Research, 2 (3), 215-217.
Egwuda,J.E. (2007). Economic analysis of lowland rice production in Ibaji L.G.A. of Kogi State.
(Unpublished master’s thesis) Ahmadu Bello University, Nigeria.
Egyir, I.S. (2010). Applied study on local finance for poor urban and peri-urban producers in
Accra, Ghana. Report submitted to the International Water Management Institute
(IWMI/RUAF), Accra.
Ehigiamuose,G. (2005). Tested Institutional Practises for Efficient Microfinance Services
Delivery. Paper Presented at the National Seminar to mark the International Year of
Microcredit in Nigeria. Held at Transcorp Hilton, Abuja, Nigeria. November.
Ekong, E. E. (2003), An Introduction to Rural Society (2nd Edition), Uyo. Nigeria: Dove
Educational. Pp 20-47, 341-395.
Elhiaraika,A.B. (1999). The growth and potential of savings and credit co-operative societies in
Swaziland. Development Policy Review, 17(4), 355-374.
Ellis, F. (2000). Rural Livelihoods and Diversity in Developing Countries. Oxford:
Oxford University Press
Essien U.A. & Idiong I.C. (2008). The determinants of the use of credit by food crop farmers
in Akwa Ibom State of Nigeria. Global Journal, 6 (8), 32.
Essien U.A.,Arene,C.J & Nweze, N.J. (2013). An investigation into credit receipt and enterprise
performance among agro small scale agro based enterprises in the Niger Delta Region of
Nigeria? International Journal of Agricultural Management and Development, 3(4), 245-
258.
Essien U.A.,Arene,C.J & Nweze, N.J. (2013). What determines the frequency of loan demand in
credit markets among agro based enterprises in the Niger Delta Region of Nigeria? An
empirical analysis. Journal of Agriculture and Sustainability, 4(1).
Estruk,O. & Oren,M.(2014). Impact of household socio-economic factors on food security:
Case of Adana, Turkey. Pakistan Journal of Nutrition, 13(1), 1-6.
150
Eswaran, M. & Kotwal A. (1999). Implications of credit constraints for risk behaviour. Oxford
Economic Papers, 42 (2),473-482.
Evans, T. G., Adams, A. M., Mohammed, R. & Norris, A. H. (1999). Demystifying Non
participation in microcredit: A Population-Based Analysis. World Development, 27(2),
421 – 424.
Fakayode, S.B.,Rahji, M.A.Y.,Oni, O.A. & Adeyemi, M.O. (2009). An assessment of food
security situations of farm households in Nigeria: A USDA Approach. The Social
Sciences, 4(1), 24-29.
Fasoranti,M.M.(2006). A stochastic frontier analysis of effectiveness of cassava-based cropping
systems in Ondo State, Nigeria (Unpublished doctoral dissertation). Federal University of
Technlogy and Agriculture, Akure, Nigeria.
Fawole, O. P. & Oladele, O.I. (2007), Sustainable food crop production through multiple
cropping patterns among farmers in South Western Nigeria. Journal of Human Ecology,
21(4), 245-249.
Fayeye,T. R. & Ola,J.D. (2007). Strategies for food security and health improvement in the
sub-Saharan African. World Journal of Agricultural Science, 3(6), 808-814.
Federal Ministry of Agriculture and Rural Development (FMARD), (2015). New Agricultural
Policy Thrust, Federal Republic of Nigeria.
Fernando,N.A. (2006). Dealing with High Interest Rates on Microcredit. International
Conference on Applied Economics,Washinton D.C.
Food & Agricultural Organization (FAO), (1998) “Urgent Action Needed to Combat Hunger as
Number of Undernourished in the World Increases”. Retrieved from www.fao.org.
Food & Agricultural Organization (FAO), (1996). World Food Summit. 13-17th November.
Rome, Italy.
Food & Agricultural Organization (FAO), (2002). The State of Food Insecurity in the World
2001. Rome : Author.
Food & Food & Agricultural Organization (FAO), (2003a).The State of Food Insecurity in the
World, Rome: Author Agricultural Organization (FAO), (2003b). Trade Reforms and
Food Security: Conceptualizing the Linkages. Rome: Author.
Food & Agricultural Organization (FAO), (2004) The State of Food Insecurity in the World:
Monitoring progress towards the world food summit and Millennium Development
Goals. Rome: Author
Food & Agricultural Organization (FAO), (2005a). “Eradicating World Hunger-Key to
Achieving the Millenium Development Goals: Italy.

151
Food & Agricultural Organization (FAO), (2005b), “FAO Warns World Cannot Afford
Hunger”.Retrieved from www.fao.org./fao newsroom.
Food & Agricultural Organization (FAO), (2008).What happened to world food prices and why?
Rome: Author
Food & Agricultural Organization (FAO), (2012). The State of Food Security in the World 2012.
Retreived fromwww.fao.org
Food & Agricultural Organization (FAO), (2013).The State of Food Insecurity in the World
2013. The multiple dimensions of food security. Rome, FAO.
Food & Agricultural Organization (FAO), (2014). The State of Food Insecurity in the World
2015. Rome: Author
Food & Agricultural Organization (FAO), (2015). The State of Food Insecurity in the World
2015. Rome: Author.
Fofana, N. (2006). Micro Finance, Food Security and Women Empowerment in Cote d’ Ivoire.
Cote d’ Ivoire: Ivorian Economic and Social Research Center.
Fosu,K.Y. (1998). Monetary policy, credit market liberalization and institutional agricultural
credit supply in Ghana. Paper Presented at the European Association of Agricultural
Economist Conference on Agricultural Markets Beyond Liberalization. Wageningen,
Netherlands.
Fred,P.B. (2009). Accessing microcredit, borrowers’ characteristics and household income in
rural areas- case of Kasese (Unpublished master’s thesis).University of
Makerere,Kampala,Uganda.
Gaiha, R. & Imai, K. (2004). Vulnerability, persistence of poverty and shocks- estimates for
semi- arid rural India. Oxford Development Studies, 32(2), 261-281.
Gebrehiwot,T. & Van der Veen A. (2010). Effect of policy interventions on food security in
Tigray,Northern Ethiopia University Twente, Faculty of Geo-Information Science and
Earth Observation, Netherlands. Working paper series-paper 6.
Gibremichael, B. A. (2014). The role of agricultural coops in promoting food security and rural
women’s empowerment in Eastern Tigray Region, Ethiopia. Journal of Developing
Country Studies, 4(11).
Gine, X., Jakiela, P., Karlan, D. & Morduch,J. (2006). Microfinance Games. World Bank
Research Paper, Washington, D.C.
Goetz, A. M. & Gupta, S. (1994). “Who takes the credit? Gender, power and control over loans
use in rural credit programmes in Bangladesh. World Development, 24 (1), 45-63.
Goni,M. (2005). Analysis of household food security in the Lake Chad area of Bornu State,
Nigeria (Unpublished master’s thesis). University of Maiduguri, Nigeria.

152
Grimm,L.G & Yarnold,P.R (1995). Reading and Understanding Multivariate Statistics.
Washington, D.C. American Psychological Association.
Gujarati, D. I. (2005). Basic Econometrics (4thEd). New Delhi: Tata McGraw-Hill.
Hamad,R. , Lia,C. & Fernald,L. (2010). Microcredit participation and nutrition outcomes among
women in Peru. World Journal of Agricultural Science, 9(8), 56-59.
Hassen,E.K. (2008). Fighting Poverty in South Africa: A Civil Society.http://www.naledi.org.
Hazarika,G. & Guha-Khasnobis,B. (2008). Household Access to Microcredit and Children’s
Food Security in Rural Malawi: A Gender Perspective. Washington D.C.: IFPRI.
Hazell,P. & Haddad,L. (2001), Agricultural Research and Poverty Reduction. Food, Agriculture
and the Environment Discussion Paper, No. 34. Washington D.C.:IFPRI.
Hoddinott, J., & Quisumbing, A, (2003). Methods for micro econometric risk and vulnerability
assessments. Social Protection Discussion Paper Series No. 0324. Social Protection Unit,
Human Development Network. Washington D.C: World Bank.
Hoffman, T. & Ashwell, A. (2001). Nature Divided: Land Degradation in the South Africa.
Cape Town: University of Cape Town Press.
Holzmann, R. & Jorgensen, S. (2000). “Social Protection as Social Risk Management:
Conceptual Underpinnings for the Social Protection Sector Strategy Paper”. Journal of
International Development, 1: 1005-27.
Hongbin, L., Rozelle, S. & Zhang,L. (2004). Microcredit programmes and off-farm migration in
China. Pacific Economic Review, 9(3), 209-223.
Hulme, D. & Mosley, P. (1998). Finance against Poverty. London: Routledge
Ibok,O.W. (2012) Analysis of food security and productivity of urban food crop farmers in
Cross River State. (Unpublished master’s thesis) University of Calabar, Nigeria.
Ibrahim,A.H. & Bauer, S. (2013). Access to microcredit and its impact on farm profit among
rural farmers in dry land of Sudan. International Journal of Society for Development and
Sustainability, 6(8).
Ibrahim,H. Uba-Eze,N.R.,Oyewole, S.O. & Onuk, E.G. (2009). Food security among urban
households: A case study of Gwagwalada Area Council of the Federal Capital Territory
Abuja, Nigeria. Pakistan Journal of Nutrition, 8(6), 810-813.
Ichite ,C. (2015). Land conflict, population pressure and lethal violence in the Niger Delta 2006-
2014. IFRA- Nigeria Working Paper Series No. 48

153
Idrisa,Y.I., Gwary,M.M. & Shehu,H. (2008). Analysis of food security status among farming
household in Jere Local Government of Borno State, Nigeria. Journal of Tropical
Agriculture, Food, Environment and Extension, 7(3), 199-205.
Idumah,F.O. (2006). Productivity differentials among food crop farmers in the Niger Delta.
(Unpublished doctoral dissertation) University of Ibadan, Nigeria.
International Fund for Agricultural Development (IFAD), (2009). Country Program Evaluation:
Federal Republic of Nigeria. Report No. 1959-N. Rome: IFAD
Igene,J.O. (1997). Food production and nutrition in Nigeria. In Integrated Agricultural
Production in Nigeria: Strategies and Mechanisms for Food Security, B.Shaib., N.O.
Adedipe, A. Aliyu and M.M. Jir (Eds). The NARP AND FMANR pp 189-195.
Ijaiya G.T., & Abdulraheem A. (2000), Commercial banks credits to the agricultural sector and
poverty reduction in Nigeria: A calibration analysis. Nigerian Journal of Agribiz and
Rural Development,1(1), 143-157.
Ijere,M.O.(2000). Microfinance and Economic Development. Ibadan:University of Ibadan Press.
Ikoku,E. (1980). Self reliance: Africa’s survival. Enugu: Fourth Dimension.
Jabber,M.A.,Ehui,S.K. & Von,R. (2002). Supply and demand for livestock in sub-Saharan
Africa: Lessons for designing new credit schemes. World Development, 30 (6), 1029-
1042.
James,K. (2008). “Investing and finance”. Africa investor magazine, January-February, a special
in-flight magazine for aero contractors. Pp 22-24.
Jazairy, I., Alamgir, M. & Panuccio, T. (1992). The state of world poverty: an inquiry into its
causes and consequences. Rome, IFAD.
Jibowo, G. (1992). Essentials of Rural Sociology.Ogun: Gbemi Sodipo Press. Pp 15-25
Katchova, A.L. (2005). Factors affecting farm credit use. Agricultural Finance Review, 65:17-
29.
Kausar,A. (2013). Factors affecting microcredit demand in Pakistan. International Journal of
Academic Research in Accounting, Finance and Management Science, 2(4).
Kedir, A.,Ibrahim,G. & Torres, S. (2009). Household level Credit Constraints in Urban Ethiopia,
University of Leicester, Nottingham Trent University and Catholic University of
Uruguay p34.
Kenya Women’s Finance Trust (2002). Report of a Client-Centered Impact Assessment Survey.
Pp 38-45
Khandker, S.R. & Farugee,R.R. (2001). “The Impact of Farm Credit in Pakistan.” World Bank
Technical Paper No. 258, Washington, D.C.

154
Khandker, S. (1998). Fighting Poverty with Micro-credit: London: Oxford University Press.
Kohai,E., Tayebwa,B. & Bashaasha,B.(2005). Food Security Status of households in Mwingi
district, Kenya. Proceedings of the 7th African Crop Science Society Conference,
Kampala, Uganda. P 867-880.
Lappe,F.M., Clapp,J., Anderson, M., Board,R.,Messer,E.,Pogge,T. & Wise,T.(2013). “How we
count hunger matters,” Ethics and International Affairs, 9(5).
Lawal,A.F.,Omotesho,O.A. & Adewumi,M.O. (2010). Land use pattern and sustainability of
food crop production in the Fadama of Southern Guinea Savanna of Nigeria. African
Journal of Agric Research, 5(3), 178-187.
Ligon, E., & Schechter, L. (2003). Measuring vulnerability. Manuscript. California: University
of California, Berkeley.
Longley,C. & Maxwell D.(2003). Livelihoods, Chronic Conflict and Humanitarian Response: A
Synthesis of Current Practice. Working Paper 182. London:ODI.
Lovendal, R.C. & Knowles M. (2005). Tomorrow’s Hunger: A Framework for Analysing
Vulnerability to Food Insecurity, FAO-ESA Working Paper No. 05-07.
Ludi, E & Slater, R (2008). Using Sustainable Livelihood Framework to Understand and Tackle
Poverty. Working paper. London: ODI
Lyon, F. (2003). Community groups and livelihoods in remote rural areas of Ghana: How small
size farmers sustain collective action. Community Development Journal, 38, 323-331.
Madise, N., Matthews, Z. & Margetts, B.(1999). Heterogeneity of child nutritional status
between households: A comparison of six sub-Saharan African countries. Population
Studies, 53(3), 331-343.
Mafimisebi, T.E., Oguntade, A.E. & Mafimisebi O.E. (2009). A perspective on Partial Credit
Guarantee Schemes in Developing Countries; the case of the Nigerian Agric Credit
Guarantee Scheme Fund (ACGSF) pp 2-4. A paper presented at a World Bank
Conference, Washinghton D.C March 13-14.
Marcoux,A. (2002). “Sex differentials in under nutrition: A look at survey evidence.
Population and Development Review, 28, 275-284
Maziya-Dixton,B., Akinleye,E., Oguntona, S.,Nokoe, R.,Sanus, A. & Hariss, E. (2004). Nigeria
Food Consumption and Nutrition Survey (2001-2003 summary). International Institute
for Tropical Agriculture (IITA). Ibadan,1-30.
Mattila-Wiro,P. (1999). Economic Theories of the Household: A Critical Review. Working
Paper 159. pp33-37.
Maxwell, S.R. & Slater, M. (2003). Food policy old and new. Development policy review, 21(2),
155-170.
155
Maxwell, D.& Cladwell, R. (2008). The coping strategies index. A tool for measurement of
household food security and impact of food aid programs in humanitarian emergencies.
African Journal of Agric and Food Security, 10 (18).
Mbat, D. O. (2000).The Role of Microcredit in Poverty Alleviation: Paper presented during
training workshop on capacity Administration Entities in Cross River State. May 29th –
31st June.
McGee,T. (2006). Constructal Theory: Sustainability. Retrieved from
http://www.treehugger.com/about.
McNally, R. & Othman, M. S. (2002). Environmental Economics: A practical Guide. Malaysia,
WWF – UK.
Meade, B., Rosen, S.& Shapouri, S. (2007). Food security assessment, 2006.USDA.Retrieved
from http://www.Ers.Usda.Gov/Publication/Gfa18.Pdf.
Melgar-Quinonez,H., Nord,M., Perez-Escamilla,R.& Segall-Correa, A. (2008). Psychometric
Properties of a Modified US-Household Food Security Survey Module in Campinas,
Brazil. European Journal of Clinical Nutrition, 62, 665-673
Millennium Development Goal Report (2013). United Nations, New York.
Millman, S. & Kates, R. W. (1990). Toward understanding hunger. In L. F. Newman, W.
Crossgrove, R. W. Kates, R. Mathews, & S. Millman (Eds.), Hunger in history: Food
shortage, poverty and deprivation (pp. 3-24). Cambridge: Basil Blackwell.
Ministry of Niger Delta Affairs (2011). Federal Republic of Nigeria. Retrieved from
htpp://MNDA.gov/ng/resources/download-resources.
Mishra, A.,Osta, H.,Morehart, M., Johnson, J. & Hopkins, J. (2002). Income, Wealth and the
Economic well being of Farm Households. Farm Sector Performance and Well-Being
Branch, Resource Economics Division, Economic Research Service, U.S. Department of
Agriculture. Agricultural Economic Report No. 812.
Mohamen,I. (2003). Access to formal and quasi-formal credit by small holder farmers and
artisanal fishermen. A case of Zanzibar. Research Report on poverty alleviation. No. 03.6
Montgomery, H., & Weiss, J. (2005). Great expectations: Microfinance and poverty reduction in
Asia and Latin America. Oxford Development Studies, Taylor and Francis Journals, 33
(3-4), 391-416.
Montgomery, R., Bhattacharaya, D. & Hulme.D. (1996).” Credit for the Poor in Bangladesh”. In:
D. Hulme and P. Mosley (eds). Finance against Poverty. London: Routledge.
Morduch, J. (1998). Does Microfinance Really Help the Poor: New Evidence from Flagship
Programmes in Bangladesh. Development of Economics and HIID, Harvard University
and Hoover Institution.

156
Mosely, P. & Hulme, D. (1998). Micro enterprise finance: Is there is conflict between growth
and poverty alleviation? World Development, 26(5), 783-780.
Muhammed-Lawal, A. & Atte,O.A. (2006). An analysis of agricultural production in Nigeria.
African Journal of General Agriculture, 2(1).
Muhammed-Lawal, A. & Omotesho,O.A. (2008). Cereals and farming household’s food
security in Kwara State, Nigeria. Agricultural Journal, 3(3), 235-240.
Muhammed-Lawal, A. & Omotesho,O.A. (2010). Intensity of food insecurity in rural
households of Kwara State Nigeria. Journal of Agricultural Resources,2, 21-30.
Murphy,S.,J. Foote,L. Wilkens,P. Basiotis, J. & Carlson, A. (2004). Dietary variety increases the
probability of nutrient adequacy among adults. Journal of Nutrition, 134, 1779-1785.
Mwangi,I.W. &Ouma,S.A. (2012). Social capital access to credit in Kenya. American Journal of
Social Management Sciences, 3(1).
Naiken,L. (2003). FAO Methodology for Estimating the Prevalence of Undernourishment.”
Proceedings of International Scientific Symposium on Measurement and Assessment of
Food Deprivation and Undernourishment, 26-28 June 2002, 7-47. Rome: Food and
Agricultural Organization of the United Nations.
National Population Commission. NPC (2006) National Population Census, Federal Republic of
Nigeria official gazette, Lagos, Nigeria.
Narayan, D. & Pritchett, L. (2000). Social Capital: Evidence and Implications. In P. Dasgupta
and I. Serageldin (Eds), Social Capital: A Multifaceted Perspective, Pp. 269-295.
Washington, D.C.:World Bank.
Nawai, N. & Bashir, M. S. (2010). Evaluation of microcredit program for poverty alleviation: A
case of Amanah Ikhtiar Malaysia (AIM). Retrieved from
http://ddms.usim.edu.my/handle/123456789/1555
Nguyen, C. H. (2007). Access to Credit and Borrowing Behaviour or Rural Households in a
Transition. Food and Agricultural Organization, Rome.
Nigeria Bureau of Statistics, (2006).Figure 3.1: Map of Niger Delta States Nigeria. Retrieved
April, 18 2014 from http.//www.nigeriamasterweb.com/
Nigerian Institute of Social and Economics Research (NISER), (2002). Assessment of
Economics, Social and Environmental Impacts of Rice Production in Nigeria within the
Trade Liberalization Framework. A research paper.
Ninno, C. D. & Marini, A. (2005). Household’s Vulnerability to Shocks in Zambia. Special
protection Discussion Paper No. 0536, World Bank.

157
Nissanke, M. (2002). Donors Support for Microcredit as Social Enterprise. A Critical Economic
Research (WIDER) Discussion Paper. No. 127. United Nations University
Nord,M., Satpathy,A.,Raj,N., Webb,P. & Houser,R. (2002). Comparing Household Survey-
Based Measures of Food Insecurity across Countries: Case Studies in India, Uganda and
Bangladesh. The Gerald J. and Dorothy R. Friedman School of Nutrition Science and
Policy. Food Policy and Applied Nutrition Program Discussion Paper No. 7
Nord, M. & Bickel, G.(2000). Guide to Measuring Household Food Security. USDA,
Alexandrais,VA.
Netere,J., Kutner,M.,Nachtsheim, C. &William,W.(1996). Applied Linear Statistical Models. 4th
edition, Richard D. Irwin Incorporated Burr Ridge, Illinois.
Nwaru,J.C.,Essien,U.A.& Onuoha,R.E. (2011). Determinants of informal credit demand and
supply among food crop farmers in Akwa Ibom State, Nigeria. Journal of Rural and
Community Development, 6(1), 129-139.
Nwaru,J.C. (2004). Rural credit markets and resource use in arable crop production in Imo
State of Nigeria (Unpublished doctoral dissertation). Michael Okpara University of
Agriculture, Umudike, Nigeria.
Nyangwesoi,P.M.,Odaiambo,M.O.,Odungari,P.,Koriri,M.K.,Kipsat,M.J. & Serem,A.K. (2007).
Household food security in Vihiga district, Kenya: Determinants of Dietary Diversity.
Proceedings of the 8th African Crop Science Society Conference, El-Minia University,
Egypt. October 27-31.
Odemenem,I.U. & Obinne,C.P.O. (2010). Assessing the Factors Influencing the Utilization of
Improved Cereal Crop Production Technologies by Small Scale Farmers in Nigeria.
Retrieved from http://www.indjst.org/archive/(3) 2/innocent-17.pdf
O’Donnell,M.O.(2004). Food Security, Livelihoods and HIV/AIDS. A Guide to the Linkages,
Measurements and Programming Implications. Save the Children,U.K.
Ogbanje, E. C., Chidebelu, S.A.N.D. & Nweze, N. J. (2014). Off-farm diversification among
small-scale farmers in North-Central Nigeria. Journal of Economics and Sustainable
Development ,5(13).
Okafor,F. (2004). Analysis of trends in production, area harvested yield per hectare of major
Root and Tuber Crops in Nigeria (1961-2003) (Unpublished master’s thesis). University
of Ibadan,Nigeria.
Okojie, C. (2002) “Gender and Education as Determinants of Household Poverty in Nigeria”in
Hoeven, R.V. and A. Shorrocks (eds). Perspective of Growth and Poverty.
UNNU/WIDER, Helsinki Pp 268-302.
Okojie,C., Monye-Emina,A., Eghagona,K., Osaghae,G. & Ehiakamen,J.O. (2010). Institutional
Environment and Access to Microfinance by Self Employed Women in Rural Areas of

158
Edo State. NSSP Brief No. 14. Washington D.C. International Food Policy Research
Institute.
Okolo, D.A. (2004): Regional study on Agricultural support: Nigeria case. Special Study Report
Prepared for the Food and Agriculture Organization, Rome.
Okon, U. E. (2014). Assessment of income generating activities among urban farm households in
South-South Nigeria (Unpublished doctoral dissertation). University of Nigeria, Nsukka,
Nigeria.
Okoye,C.U. & Arene, C.J. (2005). Enhancing Targeting Flows and Impact of Micro-
Credit(NACRDB,CBs,ACGSF). Legislative and Policy Agenda for Nigerian
Agriculture.1.
Okten,G. & Osili,U.O. (2004). Social networks and credit access in Indonesia. World
Development, 32(7), 1225-46.
Okurut, F. N. (2006). Access to credit by the poor in South Africa: Evidence from household
survey data 1995 and 2000. Stellenbosch Economic Working Paper: 13/06
Okurut, F. N. & Bategeka,L. (2005). The Impact of Micro Finance on the Welfare of the Poor in
Uganda, AERC Publication Pp 13-17.
Okurut,N., Scoombee,A. & Berg,S. (2006). “Credit Demand and Credit Rationing in the
Informal Financial Sector, in Uganda”.Paper to the DPRU/Tips/Cornell Conference on
African Development and Poverty Reduction. The Macro-Micro Linkage Forum Paper.
Oladeebo,J.O. & Oladeebo,O.E. (2008). Determinants of loan repayment among small holder
farmers in Ogbomosho agricultural zone of Oyo State, Nigeria. Journal of Social
Science, 17(1), 59-62.
Olajide,O.T., Akinlabi, B.H. & Tijani, A.A. (2011). Agriculture resource and economic growth
in Nigeria. European Scientific Journal, 8(22).
Olawepo,V.O. (2010). Analysis of productivity and poverty status of Root and Tuber Crop
Expansion Programme of Farmers in Kwara State (Unpublished master’s thesis).
University of Ibadan, Nigeria.
Olayemi,J.K. (1998). Food Security in Nigeria. Research Report No.2. Development Policy
Center, Ibadan, Nigeria.
Ololade R.A. & Olagunju F.I. (2013). Determinants of access to credit among rural farmers in
Oyo State, Nigeria. Global Journal of Scientific Frontier Research, Agric. Veterinary
Science, 13(2), 16-22.
Olomola, A. (1990). Capture Fisheries and Aquaculture in Nigeria. A Comparative Economic
Analysis. Africa Rural Social Science Series Report, No. 13.Ibadan, Nigeria: University
Press Limited

159
Olowookere, S. (2010). Sustainable Agriculture. Retrieved from
http://www.education.ezinemark.com/
Olujide,M.G. (2008). Assessment of microcredit supply by Country Women Association of
Nigeria (COWAN) to Rural Women in Ondo State, Nigeria. World Journal of
Agricultural Science, 4(1), 79-85.
Omafonmwan, S.I. & Odia,L.O. (2009). Oil exploitation and conflict in the Niger-Delta region
of Nigeria. Journal of Human Ecology, 26(1), 25-30.
Omnona, T. & Agoi, G.A. (2007). An analysis of food security situation among Nigeria urban
household: Evidence from Lagos State, Nigeria. Journal of Central European
Agriculture, 8(3).
Omotesho,O.A., Adewumi, M.O., & Fadimula, K.S. (2011). Food Security and Poverty of the
Rural Households in Kwara State Nigeria. AAEE Conference Proceedings. 571-575.
Omotesho, O. A, Adewumi,M. O.,Muhammad-Lawal,A., & Ayinde,O.E. (2006). Determinants
of food security among the rural farming households in Kwara State, Nigeria. African
Journal of General Agriculture, 2(1), 7-8.
Onogwu,G.O. & Arene C.J. (2007). Effects of lending policies of formal and informal micro-
finance institutions on access to agricultural credit in Nigeria. Journal of Rural
Development, 26(2), 177-187.
Oriola,E. O. (2009). A framework for food security and poverty reduction in Nigeria. European
Journal of Social Science, 8(1).
Oruonye, E. D. (2011). An assessment of Fadama dry season farming through small scale
irrigation system in Jalingo LGA, Taraba State. International Research Journal of
Agricultural Science and Soil Science, 1(1), 014-019.
Oruonye E. D. & Musa Y. N. (2012).Challenges of small scale farmers access to microcredit
(Bada Kaka) in Gassol LGA, Taraba State, Nigeria. Journal of Agricultural Economics
and Development, 1 (13), 62-68.
Osawe, O.W. (2013). Livelihood Vulnerability and Migration Decision making Nexus: The Case
of Rural Farm Households in Nigeria. Invited paper presented at the 4th International
Conference of the African Association of Agricultural Economist, September 22-
25,Hammamet, Tunisia.
Oseni,S.O. (2001). Econometric analysis of productivity of tuber crops in Nigeria (1966-1998)
(Unpublished master’s thesis). University of Ibadan, Nigeria.
Oshang,O. (1994). Nutrition security in Norway? A situation analysis. 194 Scandinarian Journal
of Nutrition, 10(38), 1-68.

160
Osundare,F. (1999). Analysis of the Demand for Certified maize seeds in Ondo State:
Implications for food security. Poverty Alleviation and Food Security in Nigeria,Y.L
Fabiyi and E.O.Idowu (Eds). NAAE pp.238-239.
Otaha,I. J. (2013). Food insecurity in Nigeria: Way forward. International Multidisiplinary
Journal, Ethiopia, 7(4).
Otu,M.F. (2003). Informal Credit Market and Monetary Management in Nigeria. In: Central
Bank of Nigeria Research Department Occasional Paper.p.29.
Paarlberg, R. (2002). Governance and Food Security in an Age of Globalization. A 2020 Vision
for Food Agriculture, and the Environment 2020 Brief 72 February 2002,IFPRI.
Peke,O.R. (2008). Economic analysis of food crop farming under Ekiti State ADP. (Unpublished
master’s thesis) Federal University of Technology and Agriculture,Akure, Nigeria.
Philip,D., Nkonya,E.,Pender,J. & Oni,O.A. (2009). Constraints to Increasing Agricultural
Productivity in Nigeria. A review. Nigeria Strategy Support Program (NSSP)
Background Paper No. 006.
Pitt, M. & Khandker,S. (1995). “Household and Intra household Impacts and Social Programme
Sustainability by: the Education and Social Policy Department, Washington D.C. and
Bangladesh Institute of Development Studies, Dhaka.
Porteous,D. (2003). “The Landscape of Access to Financial Services in South Africa”, Labour
Markets and Social Frontiers No. 3, South African Reserve Bank, Pretoria.
Pothukuchi,K. (2004) Community food assessment: A first step for planning for community
food security. Journal of Planning Education and Research, 23.
Pretty, J. (1998). Social capital and sustainable livelihoods. Pretty, J. (ed.). Rural Livelihoods,
Empowerment, and the Environment: Going Beyond the Farm Boundary, 11-
21.Association for Farming Systems Research Extension, Pretoria, South Africa.
Rahji, M.A.Y. & Fakayode S.B. (2009). A multinomial logit analysis of agricultural credit
rationing by commercial banks in Nigeria. International Research Journal of Finance
and Economics, 24, 91. Retrieved from http://www.Eurojournals. Com/finance.htm.
Rahman, R. I. (1986). “Impact of Grameen Bank on the Situation of the Poor Rural Women”
BIDS Working paper No. 1 Grammen Evaluation Project, Dhaka: Bangladesh Institute of
Development Studies.
Regmi, M. Paudel K. & Mishra, A. (2015). Selected paper prepared for presentation at the
Southern Agricultural Economics Association (SAEA) Annual Meeting, Atlanta,
Georgia, February 1-4, 2015.
Richard, L., Job, L.& Wambua T. (2015). Effects of microcredit on welfare of households: the
case of Ainamoi sub country, Kericho country, Kenya. Developing Country Studies,
5(18).

161
Rimkus, L. (2004). The San Francisco Food Systems Guidebook. San Francisco.CA:San
Francisco Food System.
Riscopoulos.S.,Mukanyanye,J. & Guyanx,O. (1998). Agriculture in the year 2000. The
Agriculture and trade reports: Food aid needs assessment. Situation and outlook series,
United States Department of Agriculture, Economic research service, GFA-5 November.
Rosenzweig, M. & Binswanger,H. (1993).“Wealth, weather, risk and the composition and
profitability of agricultural investments”. Economic Journal, 103(416), 56-78.
Rutherford,S.(2001). The Poor and their Money.London: Oxford University Press.
Saliu, H.A. & Omotola J.S. (2006), Food Security and National Question in Nigeria, In:
H.A.Saliu et al.,(Eds.), The National Question and Some Selected Topical Issues on
Nigeria, Ibadan:Vantage.
Santeramo, F. G. (2015). Composite indicators for food security: decisions matter! Food Reviews
International 31: 63-73.
Sen, A. (1997). “Editorial: Human capital and human capital”. World Development, 25, 1959-
1961.
Scherr,S.J.,Wallace,C. & Buck,L. (2011) Agricultural Innovation for Food Security and Poverty
reduction in the 21st Century: Issues paper for State of the world 2011: Innovations that
nourish the Planet.
Schrieder, G. & Sharma, M. (1999). “Impact of finance on poverty reduction and social capital
formation: A review and synthesis of empirical evidence” Savings and Development, 23
(1), 67-92.
Scoones, I. (1998). Sustainable Rural Livelihoods: A Framework for Analysis. IDS Working
Paper 72. Sussex: IDS,University of Sussex.
Scoones, I. (2009). Livelihoods perspectives and rural development. Journal of Peasant Studies,
36(1), 171-196.
Sen, A. (1981). Poverty and famines: An essay on entitlement and deprivation. Oxford:
Clarendan press.
Sen, A. (1984). Resources, Values and Development. Oxford: Basil Blackwell.
Sen, A. (1987). The Standard of living: The Tanner Lectures. Cambridge: Cambridge University
Press.
Sen, A. (1997). “Editorial: Human capital and human capital”. World Development, 25, 1959-
1961.
Sen, A. (1999). A plan for Asia's Growth.” Asia Week. 25 October 8. Retrieved from
http://www.asiaweek.com/asiaweek/magazine/99/1008/viewpoint.html.

162
Shahan, Z. (2009). What is Sustainability? The Practice Makes the Ideal, the Critical 4th Component.
Retrieved December 10, 2012 from http://www.blog.sustainablog.org/
Shala & Stacey (2001). United States Department of Agriculture: Economic Research Service.
Food Security Assessment, Regional Overview Information Bulletin.
Sinha,R. (1976). Food and Poverty. London: Croom Helin.
Siyom,A.D., Hilhorst,D. & Pankhurst,A. (2012). The differential impact of microcredit on
rural livelihoods: A case study from Ethiopia. International Journal of Society for
Development and Sustainability, 12(4).
Skoufias, E. (2003). Consumption smoothing in Russia. Economics of Transition, 11(1), 67–91.
Smith,L.,Alderman,H. & Aduayom,D. (2006). Food Insecurity in sub-Saharan Africa. Research
Report No. 146:IFPRI
Smith,J.(2007). Food Security in Sudan. Darfur-overview. Sudan. June 2007. UNICEF.
http://www.unicef.org/infobycountry/sudan_darfuroverview.html.
Solow, R. M. (1991). Sustainability: An Economist Perspectives. A Paper presented at the
eighteenth J. Seward Johnson Lecture to the Marine policy center. Woods Hole
Oceanographic Institution, Massachussetts, June 11.
Srinivas, H. (1993) A Review of Informal Credit Market Studies: Final Report “Unpublished
Special Study Assignment, Bangkok: Asian Institute of Technology, p. 33.
Staatz,J., Boughton,M., Duncan,H. & Donovan,C. (2009). Food Security in Developing
Countries. In Critical Food Issues: Problems and State-of-the-art Solutions Worldwide,
(eds.) Laurel Phoenix and Lynn Walter. West
Suryahadi,A., Widyanti,W. & Sumarto,S. (2003). “Short term poverty dynamics in rural
Indonesia during the economic crisis”. Journal of International Development, 15, 133-
144.
Swain,R.B & Floro M. (2012). Assessing the effect of microfinance on vulnerability and poverty
among low income households in India. Journal of Development Economics, 48 (5), 605-
618.
Swaminathan,M.S. (2008). Food security and sustainable development. Current Science, 81(8),
948-954.
Swift, J., 1989, ‘Why Are Rural People Vulnerable to Famine? IDS Bulletin, Vol.20, No.2, pp.8-
15
Tabacknick,B. & Fidell,L. (1996). Using Multivariate Statistics .3rd edition. New York:
Harpercollins College.
Tasie,C.M.,Wonodi,J.O. & Wariboko,O.N. (2012). The effect of microcredit delivery on rural
crop farmers in Rivers State, Nigeria. Journal of Vocational Education and Technology,
9(2).

163
Tawan, C. C. (2006) Effectiveness of Agricultural Agencies in Fisheries Management and
Production in the Niger Delta. (Unpublished doctoral dissertation) Rivers State
University of Science and Technology (RSUST) Port Harcourt, Nigeria 180pp.
Thomas,W. (1992) Supporting Job Creation: Small Business and Informal Sector Development.
In R. Schire, (Ed), Wealth or Poverty? Critical Choices for South Africa. Cape Town:
Oxford University Press.
Thuita,F.M., Mwadime.K.N. & Wangombe,J.K. (2013). Influence of access to microfinance
credit by women on household food consumption patterns in an urban low income
setting in Nairobi, Kenya. European International Journal of Science and Technology
2(3).
Trueblood,M. & Shapouri,S. (2002). Food Security in the least Developed Countries and the
International Response. AAEA Selected Paper Long Beach,California July 29-31.
Udoh, E.J. (2005). Demand and control of credit from informal sources by rice producing
female farmers of Akwa Ibom State Nigeria. Journal of Agriculture and Social Sciences.
1(2), 152-155.
Udonsi, M. U. (2007). Analysis of small holder farmers’ credits under Abia State Agricultural
Loan Scheme. (Unpublished master’s thesis) Michael Okpara University of Agriculture,
Umudike, Abia State, Nigeria.
Ukoha,O.O. (1997). “Determinants of Food Security in Nigeria and its implication for poverty
Alleviation” In Poverty Alleviation in Nigeria, Nigeria Economic Society conference
proceedings.
United Nations (1975). Report of the World Food Conference, Rome 5-16 November 1974. New
York.
United Nations Development Program (2006) Human Development Report. New York: Oxford
University Press.
United Nations Development Program (2008) Millennium Development Goals Report. New
York: Author
United Nations Development Program (2009). Human Development Report. New York: Author.
United Nations (2012). The Millennium Development Goals Report, New York: Author.
Usman,A. & Ijaiya,A.T (2010). Agricultural trade liberalization and food security in Nigeria”.
Journal of Economics and International Finance, 2(12), 299-307.
Vaessen,J. (2001). Accessibility of rural credit in Northern Nicaragua: The importance of
networks of information and recommendation. Savings and Development, 25(1), 5-32.
Retrieved from www.scopus.com

164
Vintagesam,M.(2014). 2014 National Budget. The wane in Agricultural sector budget allocation.
Nigeria INTEL, p.8.
Webb,P., Coates,J., Frongillo,E.A.,Rogers, B.,Swindale,A. & Bilinsky,P. (2006). Measuring
household food insecurity: why it is so important and yet so difficult to do. Journal of
Nutrition, 136,1404S-1408S.
Welderufael, M. (2014). Determinants of household vulnerability to food insecurity in Ethiopia:
Econometric analysis of rural and urban households. Journal of Economic Sustainable
Development, 5(24).
Weibe (2003). Land Quality, Agricultural Productivity and Food Security at Local, Regional and
Global Scales. Paper Presented at the American Agricultural Economics Association
Annual Meeting, Montreal, Canada, July 27-30. Economic Research Service, USDA.
Weinberger, K. & Juting, J. (2006). Women’s participation in local organizations: Conditions
and constraints. World Development, 29, 1391-1404.
Weir, S. (1999). The effect of education on farmer productivity in rural Ethiopia. Center for the
study of African economics, University of Oxford, Oxford.
West African Insight (2010).Special Report on Food Security Challenges in West Africa: A
Focus on Agriculture. West Africa Horizon Scanning.
Whitehead, A. (2002). Tracking livelihood change: Theoretical, methodological and empirical
perspectives from North-East Ghana. Journal of Southern African Studies, 28(3), 573-
598, Special Issue: changing livelihoods.
Wiebe,K. (2003) Land Quality, Agricultural Productivity, and Food Security at Local Regional
and Global Scales. Paper presented at the American Agricultural Economics Association
Annual Meeting, Montreal, Canada, July 27-30, Economic Research Service, USDA.
Winklemann,R. & Zimmermann, K. F. (1995). “Recent developments in count data modelling,
theory and applications. Journal of Economic Surveys, 9(1), 1-24.
World Bank (1986). Poverty and Hunger: Issues and Option for Food Security in Developing
Countries. A World Bank Policy Study. The World Bank, Washington D.C., U.S.A
World Bank. (2000a). World Development Report 2000/2001: attacking poverty. Washington
D.C.
World Bank, (2000b). “Attacking Poverty”. World Development Report. New York: Oxford
University press.
World Bank (2006a). The State of Micro-Credit Summit Campaign. Washington,D.C
Wunderlich,G. & Norwood,J. (2006). Food insecurity and hunger in the United States: An
assessment of the measure. Washington,D.C.: National Academic press.
165
Yang,D. & Martinez, C.A. (2005).Remittances and Poverty in Migrant Home Areas: Evidence
from Philippines. World Bank’s International; Migration and Development Research
Group.
Yicheng, L., Shuzhuo, L., Marcus, W. F. & Gretchen, C. D., (2012). Does household composition
matter? The impact of grain for green program on rural livelihoods in China.
Ecological Economics, 75: 152-160.
Yisehak, K. (2008). Gender responsibility in smallholder mixed crop-livestock production
systems of Jimma Zone, South West Ethiopia. Livestock Research for Rural
Development, 20(1).
Yunus,M.(2004). Impact of microcredit on the livelihood of borrowers: Evidence from Mekelse
City, Ethiopia. Journal of Research in Economics and International Finance, 3(1), 25-32.
Yusuf,S.A.(2008). Social capital and household welfare in Kwara State”. Nigerian Journal of
Human Economics, 23(30).
Yusuf, A. & Wuyah, Y.T.(2015). Economic analysis of small scale sweet potato production in
Zaria local Government area of Kaduna State. American Journal of Economics, Finance
and Management, 1(3), 171-178.
Zakari,A.S. (1997). Socio-economic analysis of the production of selected main crops involved in
cross-border trade in Katsina State of Nigeria (Unpublished master’s thesis). Ahmadu-
Bello University, Zaria, Nigeria.
Zaman, H. (2000). Accessing the Poverty and Vulnerability Impact of Microcredit in
Bangladesh: A Case Study of Bangladesh Rural Action Committee (BRAC). World
Bank, Washington, D.C.
Zeller, M. (1994). Determinants of credit rationing. A study of informal lenders and formal
credit groups in Madagascar. World Development, 22(12), 1895-1097
Zeller, M., Sharma, A., Ahmed, U. & Rashid, S. (2001). Group-Base Financial Institutions for
the Rural Poor in Bangladesh. An Institutional and Household Level Analysis.
International Food Policy Research Institute. Washington D.C.
Zeller, M. & Sharma, M. (1998). “Rural Finance and Poverty Alleviation” Washington D. C.
USA. International Food Policy Research Institute (IFPRI).

166
APPENDIX
A RESEARCH QUESTIONNAIRE
Department of Agricultural Economics,
University of Nigeria Nsukka,
Nsukka, Enugu.
Dear Respondent,
I am a Post graduate student in the above department, presently undertaking a research with the
topic: Household micro redit access and Food Security in the Niger Delta region.
Your household has been selected to supply the required information towards addressing the
specific objectives of the study. I therefore solicit your co-operation to respond objectively as
possible to the questions in the questionnaire. It is purely for academic purpose and all
information supplied will be strictly confidential and for research purpose only.
Thank you for the anticipated cooperation.
Ukpe, O. U.
PERSONAL DATA
Tick [ ] or provide answers where appropriate
1. State: Abia [ ] Akwa Ibom [ ] Delta [ ] Rivers [ ]
Local Government Area ……………………………………
2 .Clan/ Community …………………………………………….
3. Gender of household head: Male [ ] Female [ ]
4. What is the highest educational level of your household head
(i) Primary Education [ ] (ii) SSCE/GCE [ ]
(iii) NCE/OND/Nursing [ ] (iv) B.Sc/ HND [ ]
(iv) Master’s Degree [ ] (v) Others specify ………………..
5. How old are you? …………………..
6. Marital Status: Single [ ] Married [ ]

167
6b. If single, tick the one that best describes your condition
(i) Divorced [ ] (ii) Widowed [ ] (iii) Separated [ ]
(iv)Single Parent [ ] (v) Others, (Specify) ……………………
7. Where do you live? Rural area [ ] Urban area [ ]
8. How many of your household members fall in the following age group?
Age group (in years) Number of males Number of Females
1-9
10-18
19-30
31-65
Above 65
FARM DATA
1. When did you start farming? ………………………………………………………..
2. What is the size of your farm? ……………………………………………hectares
3. What is your production pattern? Mixed cropping [ ] Sole cropping [ ]
4. Do you work off farm? ......................................
If yes, how much does your household earn monthly from the following sources of
income?
S/no Income source Amount in Naira
1. Non- agric. based
2. Self employed
3. Remittance ( money sent by
relatives in other cities)
5. How much income do you get from your farm in a year? …………………………………

168
6. Kindly indicate if you own any of the following assets
ITEMS Number Are you the sole
owner of these
items or do you
share ownership
with someone?
Sole=1; share=0
How many
years ago did
you acquire
these items?
Do you purchase
(p) these items or
receive them as
gifts (g)? p=1;
g= 0
Bicycle
Kekenapep
Motor vehicle
Radio/TV set
Motor cycle
Refrigerator
Mobile phone
Sewing Machine
Others(specify)
7. Please kindly indicate the number of livestock in your farm and other related information
Poultry
Goats
Sheep
Pigs
Others(specify)
8.
ITEMS Item purchased last week or month or year
for household consumption (please indicate
whether for a week or month or year)
Wk=1, Mth=2,yr=3 Purchased value(N)
Groundnut oil
Palm oil
Other oils(specify) 1.
2.
Fish/meat
Yam
Garri
Rice
Beans

169
Yam flour
Cassava flour
Maize
Sugar
Bread
Cigarettes, tobacco, kolanuts
Drinks (beer, gin,etc)
Shoes (Leather, slippers, plastic, etc)
Clothing (fabric, etc)
Purchase of motor vehicle
Purchase of motor cycle
Repairs of vehicle/bicycles
Home repairs (painting/ roofing,
plastering)
Kitchen utensils (pots,cups,etc)
Furniture (bed,tables,chairs,etc)
Petrol for vehicles or generating set
Kerosene
Detergents (soap)
Pomades
Toothpaste
Remittances/gifts/Donations
Festivals
Funerals
Agro services (spraying, threshing)
Electric bills
Money spent on transportation
Agrochemicals (herbicide, pesticide, etc)
Fertilizer
Debts
Others (specify)
MICRO CREDIT DATA
1. Are you aware of credit availability? Yes [ ] No [ ]
2. Have you ever borrowed money for farming activities? Yes [ ] No [ ]
3. If yes, please tick where appropriate
(i) Less than 50,000 [ ] (iv) 151,000 – 200,000 [ ]
(ii) 51,000 – 100,000 [ ] (v) 201,000 – 250,000 [ ]
(iii) 101,000 – 150,000 [ ]

170
1. If ‘Yes’, please tick [ ] below the sources from which you borrowed
(i) Microfinance Bank [ ]
(ii) Government [ ] (v) Co-operative [ ]
(iii) NGO [ ] (vi) Money Lender [ ]
(iv) Esusu [ ] (vii) Friends, Neighbours & Relatives [ ]
2. When did you start borrowing for your business?
(i) Over one year ago [ ] (ii) over five years [ ]
iii) Over ten years [ ] (iv) over fifteen years [
(v) Twenty years and above [ ]
3. How many times did you borrow in the last one year from the source(s)?
Please specify below accordingly;
(i) Microfinance Bank [ ] (v) Co-operative [ ]
(ii) Government [ ] (vi) Money lender [ ]
(iii) NGO [ ] (vii) Friends ,Neighbours & Relatives [ ]
(iv) Esusu [ ]
4. What amount did you borrow from the source(s) below?
(i) Microfinance Bank ……………… (v) Co-operative …………..
(ii) Government ………… (vi) Money Lender ………..
(iii) NGO ………………. (vii) Friends, Neighbours & Relatives
(iv) Esusu ……………….
5. Please indicate below the interest rate charged in each case.
(i) Bank loan [ %] (v) Co-operative [ %]
(ii) Government Loan [ %] (vi) Money Lender [ %]
(iii) NGO loan [ %] (vii) Friends, Neighbours & Relatives [ %]
(iv) Esusu loan [ %]
SOCIAL CAPITAL
1. Do you have any close relationship with the lender?
(i) Yes [ ] (ii) No [ ]
2. If ‘Yes’, does this relationship help you to obtain loan?
(i) Yes [ ] (ii) No [ ]
3. Are you in a co-operative? (i) Yes [ ] (ii) No [ ]

171
4. If ‘Yes’ does your being in a co-operative help you obtain loan easily?
(i) Yes [ ] (ii) No [ ]
5. How many people make up your co-operative? ……………
FOOD SECURITY
1. Instruction: please select the appropriate answer
S/N Questions Often true Sometimes true Never True
1. Do you worry if your food stock will finish
before you get another to eat?
2. Do you have enough resource to acquire enough
food?
3. Could you afford to eat balanced meals?
4. Do you supplement your children’s feed with
low cost foods?
5. Can you afford to feed your children balanced
meals?
6. Were your children not eating enough because
you couldn’t afford enough food?
7. Do adults in your household skip meals or cut
the size of their usual meals?
8. Do you eat less than you feel you should?
9. Were you ever hungry but did not eat?
10. Did you lose weight because there was not
enough food to eat?
11. Did you or other adults in your household ever
not eat a whole day because there wasn’t
enough food?
12. How often did this happen?
13. Did you ever cut the size if any of your
children’s meal because there wasn’t enough
money for food?
14. Did any of the children ever skip meals
because there wasn’t enough food to eat?
15. Did any of your children ever not eat for a
whole day?
16. Were the children ever hungry but you just
couldn’t afford more food.

172
2. COPING STRATEGIES
Coping strategy Very often Regularly Occasionally Never
Eating once a day
Allowing children to eat first
Eating wild fruit
Selling of assets
Buying food on credit
Picking leftover food at social
functions