Embed Size (px)
Citation preview

Effectiveness of the mud
motor near Koehool
Results and interpretion of a tracer study


Effectiveness of the mud motor
near Koehool
Results and interpretion of a tracer study
1209751-004
© Deltares, 2017, B
Julia Vroom
Bas van Maren
Jon Marsh
Amrit Cado van der Lelij

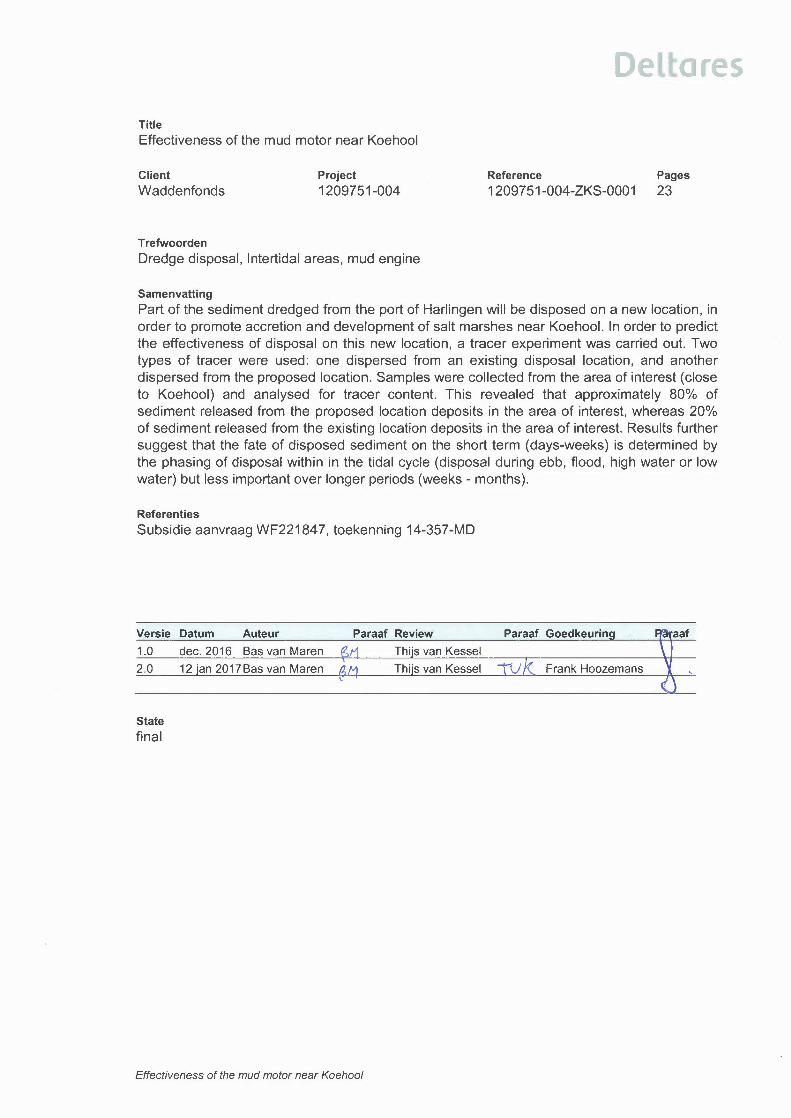
DeltaresTitleEffectiveness of the mud motor near Koehooi
ClientWaddenfonds
Project1209751-004
Reference1209751-004-ZKS-0001
Pages23
TrefwoordenDredge disposal, Intertidal areas, mud engine
SamenvattingPart of the sediment dredged from the port of Harlingen will be disposed on a new location, inorder to promote accretion and development of salt marshes near KoehooI. In order to predictthe effectiveness of disposal on this new location, a tracer experiment was carried out. Twotypes of tracer were used: one dispersed from an existing disposal location, and anotherdispersed from the proposed location. Samples were collected from the area of interest (closeto Koehooi) and analysed for tracer content. This revealed that approximately 80% ofsediment released from the proposed location deposits in the area of interest, whereas 20%of sediment released from the existing location deposits in the area of interest. Results furthersuggest that the fate of disposed sediment on the short term (days-weeks) is determined bythe phasing of disposal within in the tidal cycle (disposal during ebb, flood, high water or lowwater) but less important over longer periods (weeks - months).
ReferentiesSubsidie aanvraag WF221847, toekenning 14-357-MD
1.0 dec.2016 Bas van MarenParaaf GoedkeurinVersie Datum Auteur
2.0 12 'an 2017Bas van Maren ---u Frank Hoozemans
Statefinal
Effectiveness of the mud motor near Koehaal

1209751-004-ZKS-0001, 13 January 2017, final
Effectiveness of the mud motor near Koehool
i
Inhoud
1 Introduction 1 1.1 Study area 1 1.2 Tracer techniques 2 1.3 Aim of the experiment 3
2 Methods 5 2.1 Tracer characteristics 5 2.2 Tracer release 5 2.3 Sampling 9 2.4 Lab analysis 12
3 Results 13 3.1 Tracer analysis 13 3.2 Interpretation 16 3.3 Uncertainties 18
4 Conclusions and recommendations 21 4.1 Conclusions 21 4.2 Recommendations 22
5 References 23


1209751-004-ZKS-0001, 13 January 2017, final
Effectiveness of the mud motor near Koehool
1 van 23
1 Introduction
1.1 Study area
The Dutch port of Harlingen dredges large amounts of fine-grained sediment from its port,
which is currently released in the Wadden Sea. In order to make beneficial use of the
dredged sediments, it is planned/proposed to dispose this material closer to shore in order to
generate land for salt marsh accretion. By releasing the dredged material closer to existing
bare mudflats and a small fringe of salt marshes (Figure 1.1), we aim to enhance salt marsh
growth by increasing the sediment availability in the tidal channel near the area of interest.
Active stimulation of salt marsh growth is a century-long common practice in the Wadden
Sea, as the Frisian and Groningen coast has been progressing for centuries by constructing
brushwood groynes and in this way creating mild conditions where (fine) sediment can settle.
The mud motor project evaluates the effectiveness of a strategy which increases the
sediment supply to mud flats, as a less-intrusive alternative for land creation through the use
of brushwood groins.
Figure 1.1 Project site, showing development of pioneer marsh vegetation on the tidal flats close to the dike.

Effectiveness of the mud motor near Koehool
1209751-004-ZKS-0001, 13 January 2017, final
2 van 23
Figure 1.2 Proposed and existing disposal locations plotted on a bathymetric map and names of most important
channels and flats.
Approximately 1 million m3 of fine sediment is dredged in the port of Harlingen annually and
released at nearby disposal locations (Figure 1.2). From September 2016 onwards, an
amount of approximately 300,000 m3/yr will be released at a proposed disposal location, for a
period of 2 years. The aim is to bring as much sediment as possible to Koehool (Figure 1.2).
The new disposal location has been chosen based on the accessibility of the hopper dredger
(as the water depth is limited) and the estimated sedimentation footprint assessed by a
simple numerical model (Vroom, 2015). The model allows evaluation of the importance of the
along-channel disposal location and the proximity to the coast (in the cross-shore direction).
This revealed that the amount of sediment depositing close to Koehool is more sensitive to a
cross-shore location shift than an along-channel location shift. The optimal location indicated
by the model is given in Figure 1.2, marked as the proposed new disposal location.
1.2 Tracer techniques
The effectiveness of the new disposal location can be measured through observations in the
water column (suspended sediment concentrations; SSC), the bed (bed level change), and
through release of sediment tracers. Evaluating bed level changes with observational
techniques is difficult because the expected sedimentation thickness on the mudflat is very
small (possibly millimetres or a few centimetres) compared to (1) measuring errors of
common altimetry techniques and (2) the natural variation in bed level. The expected impact
on SSC near Koehool is even smaller, and therefore a long period is needed in order to
detect changes as a result of the dredge sediment release compared to the natural variability.
A sediment tracer experiment has several advantages over SSC or bed level measurements
to determine the amount of dredged sediment depositing on the mudflat:

1209751-004-ZKS-0001, 13 January 2017, final
Effectiveness of the mud motor near Koehool
3 van 23
• the technique has a much higher accuracy than measuring a sedimentation thickness;
• deposition due to natural processes can be separated from deposition of sediment from
the dredger hopper by labelling the dredge material with a sediment tracer;
• the relative importance of multiple disposal locations can be identified through multiple
sediment tracer signatures;
• the sedimentation can be followed on multiple time scales (days to months).
Therefore, a sediment tracer experiment was executed in the spring of 2016, using two
different colours of sediment tracer to label sediments released from the (proposed) new and
existing dredge disposal site. Preparing the tracer experiment involved the following steps:
• selecting the type and amount of sediment tracer
• determining the release method, timing and locations
• defining the sampling methodology
Execution of this experiment involved:
• release of the sediment tracers
• collecting bed samples in the area of interest
• analysing the samples
• interpreting the results
1.3 Aim of the experiment
The sediment tracer experiment aims to give insight into the sedimentation of fine sediment
onto the mudflats in the area of interest, both from the (proposed) new disposal location, and
from one of the existing disposal locations. To this end, two colours of tracer were used. By
using a large amount of sampling locations (~100), not only the amount but also the variability
of the sedimentation within the area of interest can be assessed. By making a mass balance,
the total amount of sedimentation of each sediment tracer in the area of interest can be
compared to the total amount of tracer particles released as a measure of the effectiveness of
the disposal location. The evolution of sedimentation patterns over time is assessed by
carrying out multiple sampling campaigns (one, two, and 4-5 weeks after release of the
tracer).
Summarizing, we aim to answer the following questions with the sediment tracer experiment:
what is the effectiveness of the (proposed) new and the (existing) old disposal
location?
what is the variability in sedimentation over the area of interest?
what is the variability in sedimentation over time?


1209751-004-ZKS-0001, 13 January 2017, final
Effectiveness of the mud motor near Koehool
5 van 23
2 Methods
2.1 Tracer characteristics
Deltares commissioned Environmental Tracing Systems Ltd (ETS) to manufacture a
fluorescent tracer with a particle size distribution (PSD) and behaviour similar to sediment
dredged from the port of Harlingen (Figure 2.1). The PSD of the dredged sediments indicate a
d50 of 4-9 μm, depending on the measuring equipment. The d50 of the two sediment tracers
was ~5 μm (measured with a Coulter LS230). After complete mixing each sediment tracer
with sediments in the hopper, we expect the tracer particles to be encapsulated in flocs
formed by the natural sediments, and thereby behave similarly.
Figure 2.1 Particle size distribution of sample taken from the port of Harlingen (left) and the tracer material (right)
Two different tracer colours were used: a green tracer at the (proposed) new disposal location
and a blue tracer at the existing disposal location. For both locations an amount of 100 kg dry
weight per tracer colour was used equivalent to ~4 x 10¹⁴ tracer particles (exact numbers:
green 4.0364 x 10¹⁴
, blue 3.952 x 10¹⁴
). These numbers are measured by counting the total
number of tracer particles within a known dry weight and verified with the particle size
distribution data. The amount was chosen based on the expected sedimentation rate and the
spreading area and the experience of the sediment tracer expert (ETS), who has 20+ years of
experience with tracer experiments in similar systems.
The tracer has a grain density of ~2600 kg/m3, similar to natural sediment. The particles are
composed of a natural mineral and thermoplastic polymer base to which fluorescent dye is
added. The impact of the tracer on the environment is described in the Material Safety Data
Sheet (MSDS), is classified as environmentally inert, and reports no harm for the
environment.
2.2 Tracer release
The sediment tracers were released on the 30th (green tracer, proposed dredge disposal
location) and 31st (blue tracer, existing dredge disposal location) of March, 2016. The dry
tracer material was first mixed with water to prevent dispersion by wind when adding the
tracer to the dredge hopper. Subsequently the tracer material was diluted with a hose, and
then mixed in the hopper. To avoid the sediment tracer being spilled or prematurely released
through the hopper doors, the dredge hopper (with a volume of 600 m3) was filled to
Effectiveness of the mud motor near Koehool
1209751-004-ZKS-0001, 13 January 2017, final
6 van 23
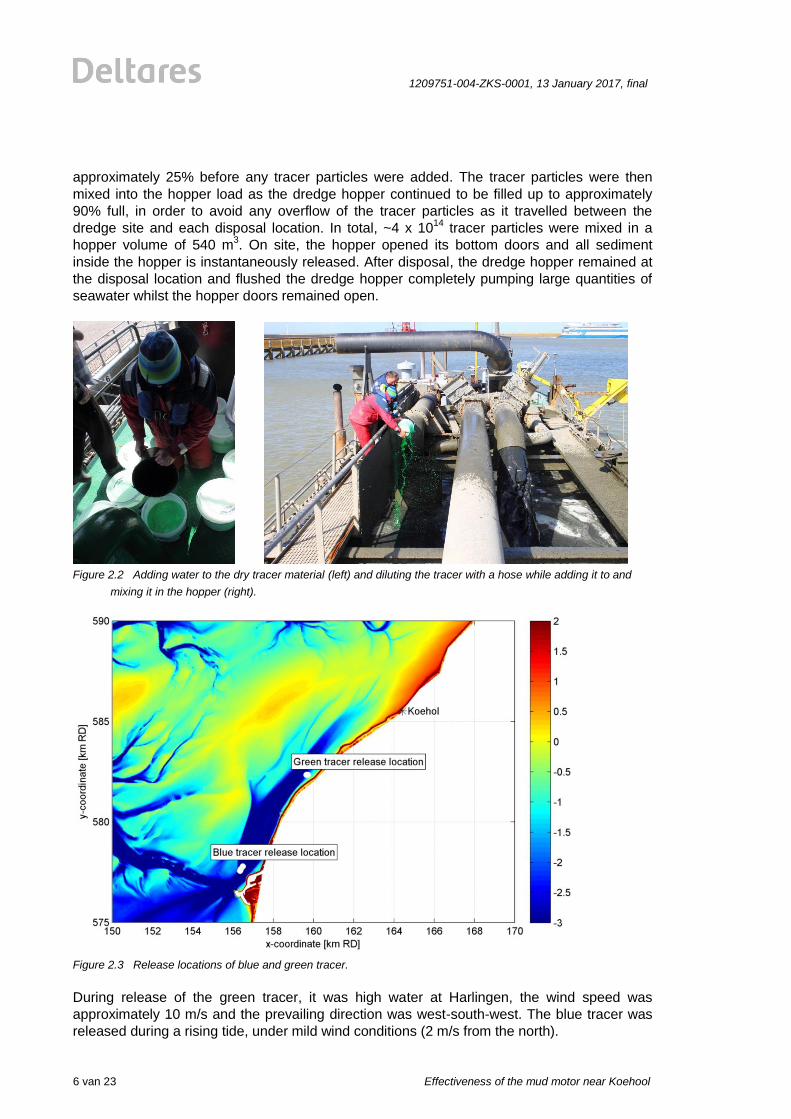
approximately 25% before any tracer particles were added. The tracer particles were then
mixed into the hopper load as the dredge hopper continued to be filled up to approximately
90% full, in order to avoid any overflow of the tracer particles as it travelled between the
dredge site and each disposal location. In total, ~4 x 10¹⁴
tracer particles were mixed in a
hopper volume of 540 m3. On site, the hopper opened its bottom doors and all sediment
inside the hopper is instantaneously released. After disposal, the dredge hopper remained at
the disposal location and flushed the dredge hopper completely pumping large quantities of
seawater whilst the hopper doors remained open.
Figure 2.2 Adding water to the dry tracer material (left) and diluting the tracer with a hose while adding it to and
mixing it in the hopper (right).
Figure 2.3 Release locations of blue and green tracer.
During release of the green tracer, it was high water at Harlingen, the wind speed was
approximately 10 m/s and the prevailing direction was west-south-west. The blue tracer was
released during a rising tide, under mild wind conditions (2 m/s from the north).

1209751-004-ZKS-0001, 13 January 2017, final
Effectiveness of the mud motor near Koehool
7 van 23
Longitude Latitude Date & time [UTC] Remark
5.456793 53.227662 2016-03-30 12:12:58 Disposal green tracer
5.457800 53.227619 2016-03-30 12:15:49 Flushing hopper after green disposal
5.407349 53.184826 2016-03-31 08:52:26 Disposal blue tracer
5.407958 53.185605 2016-03-31 08:53:49 Flushing hopper after blue disposal
5.409391 53.186714 2016-03-31 08:56:53 Flushing hopper after blue disposal
Table 2.1 Disposal locations of green and blue sediment tracer. Local time is UTC + 2 hours (incl. daylight saving
time).
Figure 2.4 Observed water level in Harlingen (blue), astronomical tide (green) and the two releases (vertical lines).

Effectiveness of the mud motor near Koehool
1209751-004-ZKS-0001, 13 January 2017, final
8 van 23
Figure 2.5 Wind speed at 3 nearby stations (Leeuwarden, blue; Hoorn, red; and Vlieland, green) and the two
releases (vertical lines).
Figure 2.6 Wind direction at 3 nearby stations (Leeuwarden, blue; Hoorn, red; and Vlieland, green) and the two
releases (vertical lines).

1209751-004-ZKS-0001, 13 January 2017, final
Effectiveness of the mud motor near Koehool
9 van 23
2.3 Sampling
Samples were collected on foot and by boat. Sampling of the area of interest on foot was
challenging, as the tidal flats consist of very soft mud. Sampling the upper tidal flat by boat
was also difficult due to the very shallow water depth and short duration of inundation. Timing
of the sampling campaign was therefore crucial. Figure 2.7 displays the sampling locations.
The majority of the samples were collected by boat, using a custom-made vacuum sample
corer (Figure 2.8). The sample tubes for collection by boat had a diameter of ~4 cm and a
minimal length of 50 cm. The long length was chosen to be able to capture both a possible
soft unconsolidated top layer and the more consolidated bed underneath to ensure sealing of
the vacuum in the sample tube. It was very important to collect the soft
(unconsolidated/nepheloid) fluffy layer as this was likely to be the layer with most tracer
accumulation.
Figure 2.7 Sample locations in the area of interest. The green tracer release location is indicated with a green star.
The blue tracer release location lies outside the figure.
Sample locations on the upper tidal flat were collected on foot during low water. To ensure
safe walking over the mud flat, snow shoes were used to enlarge the footprint (Figure 2.8).
Sample tubes for the sampling campaign on foot had the same diameter (~4 cm) as the tubes
used for boat sampling, but where shorter (length of 10 cm). A tube length of 10 cm was
chosen based on the bed irregularities of the mudflats which comprised harder more
consolidated areas interspersed with pockets of much softer unconsolidated sediment with a
very high water content; all samples were taken in these pockets in the mud flats (Figure 2.8).
The sample tube was pushed into the mud, making sure the top layer was not disturbed.
Then a cap was placed on top of the tube to ensure vacuum, the tube was taken out of the

Effectiveness of the mud motor near Koehool
1209751-004-ZKS-0001, 13 January 2017, final
10 van 23
mud and the bottom cap was placed. A new pair of disposable gloves was used for each
sample to prevent cross-contamination of the samples. The samples were kept in an upright
position all the time to avoid mixing and disturbance of the surface water-sediment interface.
In between the second and third sampling campaign, on the 18th of April, a total of 7 samples
were collected by the Navicula research vessel from NIOZ in the Kimstergat channel in
between the port of Harlingen and Koehool (Figure 2.9). These samples were taken with a
box corer, and the top layer of the sediment was collected into a plastic bag and delivered to
Deltares. In total 3 field sampling campaigns were conducted (see Table 2.2).
During each sampling campaign two samples were also taken by boat in the port of Harlingen
(see results section hereafter for the location). Sampling was done in sheltered, rapidly
accreting areas of the port.
Figure 2.8 Testing the custom-made vacuum sample corer for very soft mud in the lab (top left), walking on the
mud flat using snow shoes and ski poles (top right) and humps and troughs (pockets) on the mudflat
(bottom).
After sample collection, the long samples tubes from the boat sampling were shortened for
shipment to ETS’ laboratory in the UK using the following methodology; a small hole was
drilled a couple of centimetres above the sediment bed-water interface to let any surface

1209751-004-ZKS-0001, 13 January 2017, final
Effectiveness of the mud motor near Koehool
11 van 23
water drain from the sample. The tube was then shortened while the sample was not
disturbed. The shortened samples were packed in a crate and sent.
Table 2.2 Timing of the field campaigns
Campaign By boat On Foot Timing
A 4 and 5 April 4 and 5 April after 1 week (4-6 days)
B 12 and 13 April 14 and 15 April after 2 weeks (12-16 days)
Navicula 18 April - after 2.5 weeks (18-19 days)
C 3 and 4 May 28 and 29 April after 4-5 weeks (28-35 days)
Collection of samples by boat and on foot could not always be done simultaneously, as the
collection by boat needed to be done during high water during daylight and the collection on
foot could only be done during low water during daylight. For the collection by boat the
weather conditions were also important, as they could only be conducted during fair weather
conditions.
Figure 2.9 Locations of the samples (white triangles) taken during the Navicula cruise on April 18 th plotted on top
of the bathymetric map of the Kimstergat channel. The blue and green dots indicate the release locations of
the blue and green tracers respectively.
After a certain period of time, period vertical mixing of sediments may lead to deep burial of
sediments. Sampling is then required to be several dm deep (and to be consistent, such deep
cores are then needed for all campaigns). Deeper cores are logistically difficult (in the field
and in the laboratory) and therefore sampling was terminated after 4-5 weeks (after which
most of the green tracer was recovered, as will be shown later).

Effectiveness of the mud motor near Koehool
1209751-004-ZKS-0001, 13 January 2017, final
12 van 23
2.4 Lab analysis
The samples were analysed in ETS’ laboratory in the UK. For the long sample tubes
(collected by boat), the top 10 cm were taken and homogenised. For the small sample tubes,
the entire sample was homogenised. After weighing the total homogenised sample, a
subsample of 2-4 gram was taken and (after weighing) suspended in approximately 50 ml of
water. A subsample (of around 0.2-0.5 ml) of the suspension was taken with a pipette, in
which all individual tracer particles were counted using a fluorescent optical counting device.
This is an equivalent detection limit of counting 1 tracer particle (or more if a higher
concentration) in approximately 200-500 million natural sediment particles, based on the
particle size distribution data of the native sediment and tracer particles released.
As will be shown in the following chapter, the typical count per subsample is 1-10 tracer
particles, with the majority being 1-3 tracers. This amount is too low to generate a statistically
reliable map of the tracer distribution. In hindsight the dilution of the sample should have been
lower (now the sample was diluted with a factor 1:5000 to 1:20.000), more tracer material
should have been dispersed, or duplicate / triplicate tests been executed to ensure the
accuracy of the (sub) sampling methodology.
1209751-004-ZKS-0001, 13 January 2017, final
Effectiveness of the mud motor near Koehool
13 van 23
3 Results
3.1 Tracer analysis
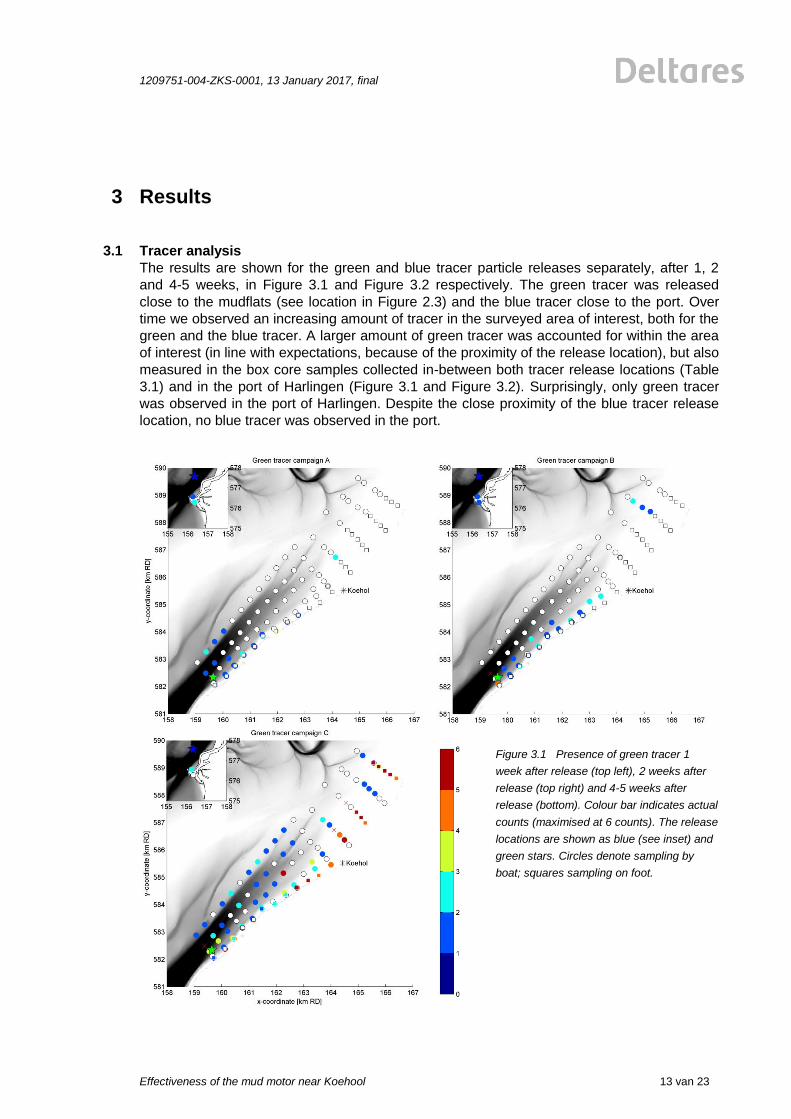
The results are shown for the green and blue tracer particle releases separately, after 1, 2
and 4-5 weeks, in Figure 3.1 and Figure 3.2 respectively. The green tracer was released
close to the mudflats (see location in Figure 2.3) and the blue tracer close to the port. Over
time we observed an increasing amount of tracer in the surveyed area of interest, both for the
green and the blue tracer. A larger amount of green tracer was accounted for within the area
of interest (in line with expectations, because of the proximity of the release location), but also
measured in the box core samples collected in-between both tracer release locations (Table
3.1) and in the port of Harlingen (Figure 3.1 and Figure 3.2). Surprisingly, only green tracer
was observed in the port of Harlingen. Despite the close proximity of the blue tracer release
location, no blue tracer was observed in the port.
Figure 3.1 Presence of green tracer 1
week after release (top left), 2 weeks after
release (top right) and 4-5 weeks after
release (bottom). Colour bar indicates actual
counts (maximised at 6 counts). The release
locations are shown as blue (see inset) and
green stars. Circles denote sampling by
boat; squares sampling on foot.
Effectiveness of the mud motor near Koehool
1209751-004-ZKS-0001, 13 January 2017, final
14 van 23
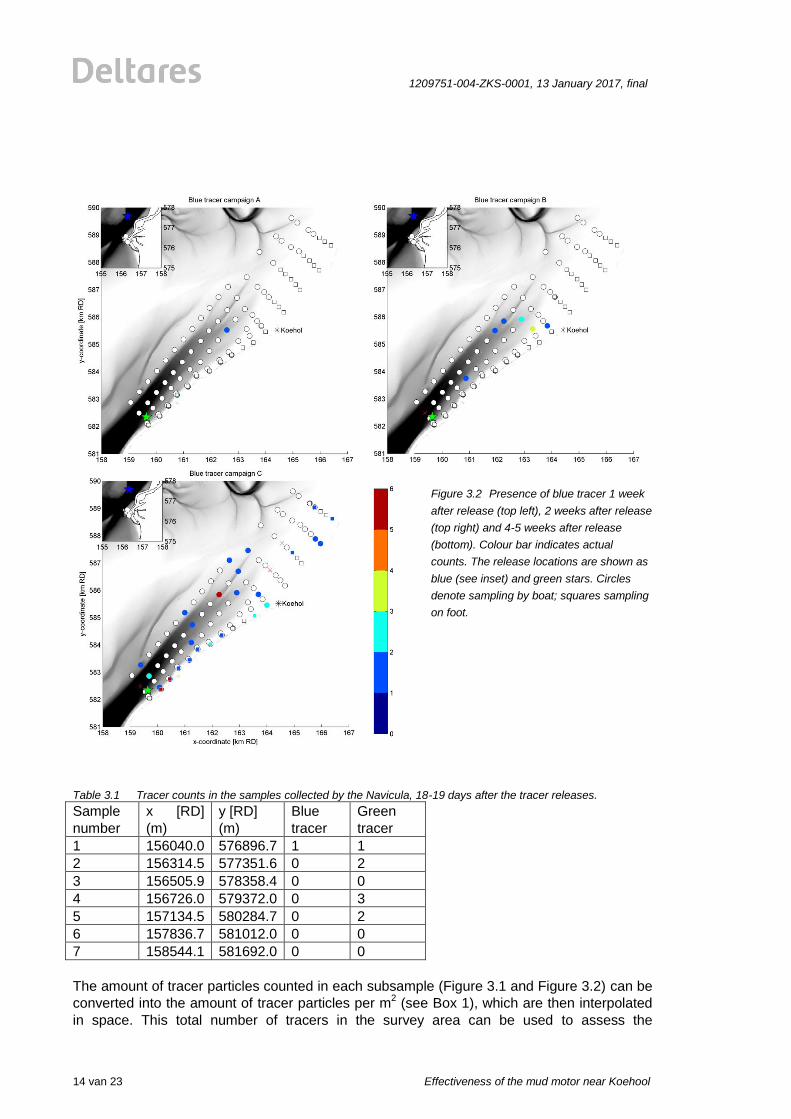
Figure 3.2 Presence of blue tracer 1 week
after release (top left), 2 weeks after release
(top right) and 4-5 weeks after release
(bottom). Colour bar indicates actual
counts. The release locations are shown as
blue (see inset) and green stars. Circles
denote sampling by boat; squares sampling
on foot.
Table 3.1 Tracer counts in the samples collected by the Navicula, 18-19 days after the tracer releases.
Sample
number
x [RD]
(m)
y [RD]
(m)
Blue
tracer
Green
tracer
1 156040.0 576896.7 1 1
2 156314.5 577351.6 0 2
3 156505.9 578358.4 0 0
4 156726.0 579372.0 0 3
5 157134.5 580284.7 0 2
6 157836.7 581012.0 0 0
7 158544.1 581692.0 0 0
The amount of tracer particles counted in each subsample (Figure 3.1 and Figure 3.2) can be
converted into the amount of tracer particles per m2 (see Box 1), which are then interpolated
in space. This total number of tracers in the survey area can be used to assess the

1209751-004-ZKS-0001, 13 January 2017, final
Effectiveness of the mud motor near Koehool
15 van 23
effectiveness of the tracer release (in percentage of the originally released amount of tracer:
see Table 3.2). These results suggest that
(1) Initially (in the first 2 weeks) only 10-15% of the green tracer (proposed location) was
transported towards and deposited within the surveyed area. Between week 2 and
weeks 4-5, this increased to 80%.
(2) The amount of blue tracer (existing location) accounted for within the surveyed area
increased more gradually; around 1% was retrieved in the study area after 5 days,
around 5% after 2 weeks (~40% of the amount of green tracer), to approximately 20%
after weeks 4-5.
Note that over time, the amount of tracers accounted for within the surveyed area (especially
the blue tracer) might still increase (as the last sampling campaign showed the largest tracer
content).
Table 3.2 Estimated percentage of tracer accounted for within the surveyed area of interest.
Sampling
Campaign
Time after
release
Blue Green
A 5 days 1 13
B 2 weeks 5 12
C 4-5 weeks 20 80
Box 1. Conversion of tracer particle counts to estimated sedimentation
thickness
Per tracer colour, approximately 4 x 10¹⁴
individual tracer particles were released
with 540 m3 of hopper sediment. When distributed uniformly, each tracer particle is
therefore associated with 1.4 x 10⁻¹²
m3 of the sediment-water mixture in the hopper.
We estimate the dry density in the hopper to be 450 kg/m3. Therefore, each tracer
particle is associated with a dry sediment mass Mt,o of 0.6 x 10⁻⁹
kg.
Of each core, only a subsample is analysed for tracer content (as reported in Figure
3.1 and 3.2). The average dilution F for subsampling differs strongly per core, and
therefore the exact conversion of tracer count to sedimentation thickness differs for
each individual core. Using a typical dilution value as an example (F = 15000), the
associated mass per tracer per core Mt,c = 9 10-6
kg (Mt,c = Mt,o F). The associated
mass per m2 (Mt) follows from the diameter of the core D as in Mt = Mt,c / (3.14
(D/2)2). With D = 4.5 cm, Mt = 5.7 10-3
kg/m2.
A rough indication of the effectiveness of the mud engine can be obtained by
assuming the measured tracer dispersion after campaign C is representative for
long-term deposition rates. In two years’ time, 600.000 m3 of sediment will be
released. This would result in a total mass M = 600.000/540 Mt = 6.3 kg.
This sediment mass is then converted to vertical accretion rates using the dry density
dry . Using dry = 500 kg/m3 (the average of 470-567 kg/m
3 as reported by Vroom,
2015), the long-term accretion rate z = M / dry = 1.26 cm for every observed
tracer. The maximum amount of observed tracer (10) then corresponds to z = 12.6
cm. Any deviations between the observed tracer maps (Figure 3.1 and 3.2) and the
accretion rates (Figure 3.3) result from variations in the dilution factor F (which varied
per core).

Effectiveness of the mud motor near Koehool
1209751-004-ZKS-0001, 13 January 2017, final
16 van 23
The results of the tracer measurements can also be used to provide a first estimate of the
siltation rate resulting from the new disposal location. As the total number of particles and
sediment released from the hopper is known, we can estimate the siltation rate resulting from
dredged sediment disposal. Applying the methodology described in Box 1 to the complete
surveyed area (using sampling campaign C) yields a map with accretion rates (Figure 3.3)
after disposal of 600.000 m3 of sediment from the hopper (from the existing and proposed
disposal location). This map reveals that the highest sedimentation rates of particles released
from the new disposal location occurs several kilometres north and south of Koehool, at a
depth of 0.5 below to 1 meter above chart datum (NAP).
Figure 3.3 Estimated sediment thickness in [m] for a dredging disposal of 600.000 m3, computed by interpolating
sample results of sampling campaign C in space, and scaling tracer count per subsample to total sample.
The proposed release location is shown as a green star.
3.2 Interpretation
The tracer results suggest that the amount of green tracer accounted for increased slowly
within the sampled area of interest. This slow increase in tracer amount can be explained
through 2 hypotheses:
1) The disposed sediment placed by the dredger was initially deposited on the bed, and
subsequently slowly resuspended from the bed and was transported towards and
deposited within the area of interest by the flood currents (& possibly wind-driven
circulation and waves).
2) The green tracer was released at HW, and was initially transported southwest-ward
by the ebb flow. Subsequent transport (back) to the mudflat through diffusion by tidal
currents (& possibly wind-driven circulation and waves) was slow.
Which of these hypotheses is more likely, will be estimated through a closer analysis of the
data and previous model results. Important observations are the following.
Some of the green tracer was retrieved in-between its disposal location and the port
of Harlingen (Table 3.1) and in the port itself (Figure 3.1) suggesting that at least part
of the tracer material was dispersed southward (as in Hypothesis 2).
Hypothesis 2 is further supported by the computed bed shear stress distribution
(Figure 3.4). A typical critical bed shear stress for erosion of the disposed sediments
is 0.3 Pa, which is exceeded >80% of time at the green tracer disposal location
(situated close to the flats but still in the channel). It is therefore unlikely that the

1209751-004-ZKS-0001, 13 January 2017, final
Effectiveness of the mud motor near Koehool
17 van 23
disposed fine-grained sediment was still present at the disposal location 2 weeks after
disposal.
The disposal area is part of the sampling area. Even in absence of erosion, some
lateral migration of the disposed sediment is to be expected, and the tracer counts
should have been higher. The observation of low tracer values in the proximity of the
release location shortly after tracer release therefore supports hypothesis 2.
The green tracer results show a net migration and deposition over time towards the
east as it spreads. Such a pattern can be explained by both hypothesis 1 and 2.
Based on these considerations, it is most likely that the majority of the released sediment and
tracer remained in suspension after release, was transported south-westward by the ebb
currents following the tracer release, and slowly returned to the area of interest (Hypothesis
2).
Figure 3.4 Computed percentage of time that the bed shear stress is lower than a typical critical bed shear stress
of 0.3 Pa (from Vroom, 2015). In the channel, this critical bed shear stress is exceeded ~80% of time,
whereas it is exceeded ~20% of time on the flats.
The absence of blue tracer particles measured in the port samples is more difficult to explain.
The blue tracer was released in the tidal channel in which the computed bed shear stress is
exceeded for ~80% of time (Figure 3.4). It may be that the settling rates within the port are so
large, that the majority of the blue tracer was already buried by non-tracer sediment before
the first samples were collected (samples in the port were taken in a strongly depositional
area). Equally surprising is the low counts of blue tracer particles found in Navicula samples
(Table 3.1). Even though most of these samples were collected closer to the release of the
blue tracer, more green samples were observed.
We also observe that the green tracer deposited mostly on the mud flats and less in the tidal
channel (both in the primary study area and in the Navicula samples). Probably, the tidal
channel is too energetic for the fine sediment to deposit (Figure 3.4).
The effectiveness of the release location is much larger than earlier predictions with a
numerical model (Vroom, 2015) suggest: see also Figuur 3.5. The observations suggest that

Effectiveness of the mud motor near Koehool
1209751-004-ZKS-0001, 13 January 2017, final
18 van 23
sediment deposits in relatively shallower areas than the model indicates (where large
amounts of sediment deposited in the channel). This is probably the result of wave-induced
resuspension, which was not modelled. In the model, sediment cannot be transported over
the flats towards Koehool, because the bed shear stress by currents is too low. In reality,
sediment is regularly stirred up by waves, and transported landward by the (weak) tidal
currents. Future model simulations of the dredge plume dispersal therefore need to include
wave-induced resuspension.
Figuur 3.5 Computed deposition pattern resulting from 10 days continues release of sediment (settling velocity of
0.5 mm/s; critical shear stress of 0.3 Pa) from the location indicated with a white dot. From Vroom (2015).
The model also predicts relatively more deposition north of the Kimstergat tidal channel than
the observations confirm. The reasons for this differences are at this point not understood, but
possibly also related to resuspension by waves.
3.3 Uncertainties
The presented tracer results are subject to a number of inaccuracies and uncertainties. The
main sources of uncertainty are related to
Laboratory procedures related to measuring mass and volumes which lead to errors
between 0.1% or higher, but can compound to several % overall. However, such
errors are considered insignificant overall.
Given the relatively low counts of tracer particles, the potentially largest (random)
error arises from sampling and subsampling. Mass balance calculations, summarised
in Table 4.2, assume spatial homogeneity in the tracer concentrations between each
sample location over a wide area; clearly there is likely to be variability in the tracer
counts per unit area as a result of sedimentology, distribution and the ability to collect
a representative sample at each sample location. In addition, sub-sampling of the
core sample, dilution and subsequent analysis of each sub-sample can result in errors
especially when tracer counts range between 0 and 1-3 tracer particles being counted
in each subsample especially when the counted particles are diluted out of an

1209751-004-ZKS-0001, 13 January 2017, final
Effectiveness of the mud motor near Koehool
19 van 23
estimated total of several 10’s of thousands of tracer particles per the original core
sample. Counting 2 instead of 1 or 3 tracer particles can easily result from random
sampling and subsampling errors, leading to a factor of 2 difference. However, over
large areas and large sample numbers (~100 per sampling campaign) such random
errors are likely to cancel or average out.
The initial amount of tracer particles released per colour (~4 x 10¹⁴
) is based on a
count of tracers per known mass, which is then extrapolated to the complete released
tracer mass (100 kg). However, this total amount of tracer particles released has a
large influence on the computed percentage of tracer deposited within the surveyed
area of interest (Table 3.2) and the computed deposition rate as a result of two years
of sediment disposal (Figure 3.3). An error of 10% in the initial amount of tracers
leads to an error of 10% in the predicted siltation rates and tracer recovery rate
.


1209751-004-ZKS-0001, 13 January 2017, final
Effectiveness of the mud motor near Koehool
21 van 23
4 Conclusions and recommendations
4.1 Conclusions
The main conclusions of the tracer study are that
1) After 5 weeks, approximately 80% of the (green) sediment tracer released at the new
disposal location was deposited within the surveyed area. The effectiveness of the
proposed disposal location is greater than expected based on earlier numerical model
results (Vroom, 2015). This is probably the result of wave-induced resuspension, allowing
transport of sediment over the flats.
2) By comparison, approximately 20% of (blue) sediment tracer released from the existing
old dredge disposal location was deposited within the surveyed area.
3) Sediment settles preferentially on the flats within 2-3 km southwest and northeast of
Koehool. Relatively less sediment settles in the Kimstergat channel because it is too
energetic.
4) The total percentage of green tracer particles accounted for within the surveyed area of
interest took more than 2 weeks to increase above 10-15%. This can be explained by
two hypotheses:
Hyp. 1: the green tracer was very immobile. Sediment released from the hopper
immediately settled and was only slowly resuspended and transported into the
study area
Hyp. 2: the green tracer was very mobile. Since the disposal of the green tracer at the
new location occurred at HW, sediment may have been initially transported in
the SW direction. The tracer (and disposed sediment) only slowly dispersed
over a wide area, and therefore the amount of tracer in the study area slowly
increased.
5) Hypothesis 2 is supported by
The observation of fines (t racer particles) far away from the study area (in the port of
Harlingen and the Navicula samples)
The strong current velocities at the release locations (flood flow velocities of ~ 1m/s
according to the numerical model – Vroom, 2015). This is further supported by the
preferential settling of tracers on the flats.
There is no direct evidence supporting Hypothesis 1.
6) There are no clear indications for the low retrieval rate of tracer in the Navicula samples
and in the port of Harlingen released from the old location. The blue tracer release took
place during a rising tide (promoting northward transport) in an area with (according to the
model) flood flow velocities >1.2 m/s.
7) In hindsight, the amount of tracer initially released and/or the size of the subsample is
considered small. The result is a count of tracer particles in the samples which is too low
for detailed statistical analyses of tracer distribution. Consequently, there is considerable
uncertainty in the observed pattern, and extrapolations should be interpreted with
caution.
Effectiveness of the mud motor near Koehool
1209751-004-ZKS-0001, 13 January 2017, final
22 van 23
4.2 Recommendations
The main recommendations resulting from this study are the following:
The results of the tracer experiment can be utilized to optimise the dredging release
strategies. However, the results of the experiment indicate that the new release
location is close to optimal, and no adaptation to dredging strategies is needed.
No further sampling campaigns are foreseen, because over time sediment will
gradually mix deeper into the bed. Differences with the initial tracer distribution is then
related to (1) horizontal dispersion and (2) vertical mixing. Since both aspects are
unknown, a comparison with earlier sample distribution is difficult.
A new model will be setup, or existing models adapted, to hindcast the observed
tracer behaviour. A major adaptation should be to include wave-induced resupension.
Such a model can then be applied to estimate the long-term fate of the dredged
sediment.
In a following study, the samples should not be diluted as much as has been done
during this tracer experiment (larger subsamples should have been analysed).

1209751-004-ZKS-0001, 13 January 2017, final
Effectiveness of the mud motor near Koehool
23 van 23
5 References
Vroom, J. (2015). Modelresultaten slibverspreiding t.b.v. slibmotor Koehool. Deltares memo
1209751-000-ZKS-0001, 20 pages.