Embed Size (px)
Citation preview
Effectiveness of the Florida Building Code to
Hurricane Wind Field Parameters
James M. Done
National Center for Atmospheric
Research, Boulder CO
Kevin Simmons Austin College, Sherman TX;
and National Institute for Risk and
Resilience, University of Oklahoma,
Norman OK
Jeffrey Czajkowski Wharton School Risk Management Center
University of Pennsylvania
February 2017
Working Paper # 2017-01
_____________________________________________________________________
Risk Management and Decision Processes Center The Wharton School, University of Pennsylvania
3730 Walnut Street, Jon Huntsman Hall, Suite 500
Philadelphia, PA, 19104 USA
Phone: 215-898-5688 Fax: 215-573-2130
http://opim.wharton.upenn.edu/risk/ ___________________________________________________________________________

THE WHARTON RISK MANAGEMENT AND DECISION PROCESSES CENTER
Established in 1985, the Wharton Risk Management and Decision Processes Center develops and promotes effective corporate and public policies for low-probability events with potentially catastrophic consequences through the integration of risk assessment, and risk perception with risk management strategies. Natural disasters, technological hazards, and national and international security issues (e.g., terrorism risk insurance markets, protection of critical infrastructure, global security) are among the extreme events that are the focus of the Center’s research.
The Risk Center’s neutrality allows it to undertake large-scale projects in conjunction with other researchers and organizations in the public and private sectors. Building on the disciplines of economics, decision sciences, finance, insurance, marketing and psychology, the Center supports and undertakes field and experimental studies of risk and uncertainty to better understand how individuals and organizations make choices under conditions of risk and uncertainty. Risk Center research also investigates the effectiveness of strategies such as risk communication, information sharing, incentive systems, insurance, regulation and public-private collaborations at a national and international scale. From these findings, the Wharton Risk Center’s research team – over 50 faculty, fellows and doctoral students – is able to design new approaches to enable individuals and organizations to make better decisions regarding risk under various regulatory and market conditions.
The Center is also concerned with training leading decision makers. It actively engages multiple viewpoints, including top-level representatives from industry, government, international organizations, interest groups and academics through its research and policy publications, and through sponsored seminars, roundtables and forums.
More information is available at https://riskcenter.wharton.upenn.edu/.
1
Effectiveness of the Florida Building Code to Hurricane Wind Field Parameters
James M. Done, Ph.D. ([email protected]), National Center for Atmospheric Research,
Boulder CO.
Kevin M. Simmons, Ph.D. ([email protected]), Austin College, Sherman TX,
and National Institute for Risk and Resilience, University of Oklahoma, Norman OK.
Jeffrey Czajkowski, Ph.D. ([email protected]), Wharton Risk Management and
Decision Processes Center, University of Pennsylvania, Philadelphia PA.
Abstract
The effectiveness of the Florida building code against the impacts of wind speed, duration of strong
winds and wind directional change is quantified. For seven historical hurricanes that impacted
Florida during 2004 and 2005, wind speed, duration, and directional change are significantly
correlated with insured wind loss. Loss increases log-linearly with wind speed, loss has a step-
function relationship with directional change, and duration effects are only important for minor
hurricanes. Loss is most sensitive to major hurricane wind speeds, followed closely by minor
hurricane wind speeds, and is less sensitive to duration and directional change. A multiple
regression analysis finds homes built after implementing a statewide Florida Building Code (FBC)
in the early 2000s experience significantly lower losses than homes built in the previous decade,
in agreement with previous literature. The total effect of the FBC in reducing losses appears to be
effective against wind speed, wind duration and wind directional change effects. Understanding
the importance of different wind parameters in driving loss, combined with assessments of how
building codes perform against those parameters, may inform effective building code
development.
2
Introduction
Tropical cyclones (TCs) are the most damaging atmospheric hazard (Smith and Katz 2013),
causing 41% of U.S. insured losses from 1995 to 2014. Despite updated building codes, TC losses
continue to increase (Munich Re, 2016; Kunreuther and Michel-Kerjan 2009), largely due to
increases in exposure (Weinkle et al. 2012; Pielke et al. 2008), but also partly due to climate change
(Estrada et al. 2015; Ranson et al. 2014; Schmidt et al. 2009).
Understanding the physical processes that drive TC loss is key to informing effective adaptation.
Watson and Johnson (2004) found huge uncertainty in hurricane loss estimations using an
ensemble of claims-based, engineering-based and theoretical damage models, and called for
deeper understanding of the relative importance of loss drivers. Theoretical damage models
typically focus on TC intensity. Murnane and Elsner (2012) found an exponential relationship
between maximum wind speed and losses, whereas Malmstadt et al. (2009) and Mendelsohn et al.
(2012) found minimum pressure – a less volatile measure of intensity - to be a better predictor of
damage. Intensity relationships have also been used widely in wind engineering (Pita et al. 2014)
and in assessing climate change impacts on losses (e.g., Mendelsohn et al. 2012; Emanuel 2011).
Geiger et al. (2016) found the relationship between loss and maximum wind speed holds at both
the storm-scale and at local scales accounting for the spatial field of maximum wind speed. Yet
recent U.S. experience from Hurricanes Ike, Irene and Sandy suggests peak hurricane wind speed
alone can be a poor predictor of hurricane losses, particularly when losses due to storm surge and
freshwater flooding are included.
3
Several studies have shown hurricane size to be an important driver of loss. Czajkowski and Done
(2014) used state level loss data to show the importance of hurricane size (as measured by the
radius of damaging winds) in explaining loss differences between a pair of U.S. landfalling
hurricanes. They found size influenced loss through the impacted area, the duration of damaging
winds, and the likelihood of large changes in wind direction. A broader study across 73 historical
U.S. landfalling tropical cyclones by Zhai and Jiang (2014) showed that wind speed and size
together captures more variance of losses (using normalized loss data of Pielke et al. 2008) than
using wind speed or size alone. The importance of size has been recognized by a number of indices
of hurricane damage indices (Holland et al. 2016; Smith 2010; Kantha 2006).
The importance of wind field parameters other than the maximum wind speed has also been found
at local scales. Using loss data over 39 South Florida zip codes impacted by Hurricane Andrew in
1992, Powell et al. (1995) found relationships between loss ratio (loss divided by exposed value)
and maximum wind speed, but also with duration, gustiness and wind pressure. Dunion et al.
(2003) found the damage swath for Hurricane Donna in 1960 over South Florida was coincident
with the region of peak winds, maximum duration and high wind directional change. Analysis of
single family homes claims data by Jain et al. (2009) for selected 2004-2005 hurricanes found
‘wind speed duration at a location can significantly amplify building damage, particularly at low
to moderate wind speeds’. Jain (2010) found increased insurance losses for storm-strength wind-
duration events greater than ten hours compared to those of less than ten hours. Moreover, post-
disaster surveys, engineering analysis and claims data consistently indicate that the duration of
winds matters (Jain 2010). Yet, existing building codes are primarily designed to withstand wind
speed effects only.
4
The American Society of Civil Engineers wind design codes are based primarily on maximum
wind speed (ASCE, 2013), and their effectiveness against long duration events or events with a
large degree of directional change are relatively unexplored. While much work has explored the
cost-effectiveness of design alternatives for a typical residential building (e.g., Unnikrishnan and
Barbato 2016; Stewart et al. 2003), the effectiveness of the mitigation measures against different
wind-field effects has received less attention. This may be particularly important for locations
where storms may be large in size, but not necessarily have high wind speeds, and therefore not
covered by a strong building code.
This work builds on the existing literature in two important ways. First, a better understanding of
the relative importance of different wind field parameters in driving hurricane wind losses is
established through empirical analysis of a large historical hurricane loss dataset for Florida.
Florida is highly vulnerable to hurricane loss, with approximately $1.8 trillion of residential
property exposure (Hamid et al., 2011). Wind causes the largest loss for Florida property insurers,
totaling $5.178 billion in insured losses between 2001 and 2010, as well as being the most frequent
source of claims, totaling 317,005 claims over the same period (Simmons et al. 2017). In the
aftermath of Hurricane Andrew in 1992, Florida enacted a statewide building code, which took
effect in early 2002. Simmons et al. (2017) demonstrated wind loss reductions up to 72% due to
the Florida Building Code (FBC). In this study, the roles of the spatial wind field parameters of
speed, duration, and directional change in driving losses are investigated using historical hurricane
cases that impacted Florida during the active 2004 and 2005 hurricane seasons.
5
Second, this study makes a novel contribution to our understanding of the value of building codes
by quantifying their effectiveness against wind speed, wind duration and wind directional change
effects. The relationship between wind speed and damage is well known. But duration may also
be important for loss through repeated loading caused by cycles of gusts, and the increased
likelihood of being impacted by wind borne debris. Wind directional change may also be important
for loss by increasing the likelihood that winds will impact a structure at its weakest angle.
Combining understanding of the role of different wind field parameters in driving loss with how
building codes perform for those different wind field parameters is critical to informing future
hurricane adaptation strategies and future code development.
The next section describes the loss and wind data and includes an initial analysis of wind loss
relationships. The methods section describes a statistically driven loss modeling methodology to
understand the relative importance of loss drivers and the effectiveness of the building code. A
results section follows and last section presents conclusions.
Data
Private market residential insured loss data are sourced from the Insurance Services Office (ISO).
These data are aggregated at the five-digit zip code level for all Florida zip codes, and inflated to
2010 values. ISO industry data represents a 40% market share of total private property insurance
in FL (ISO, personal communication), and aggregated annual policyholders range from 669,000
to just over 1 million. Losses are provided for seven historical hurricanes that made landfall in
Florida.
6
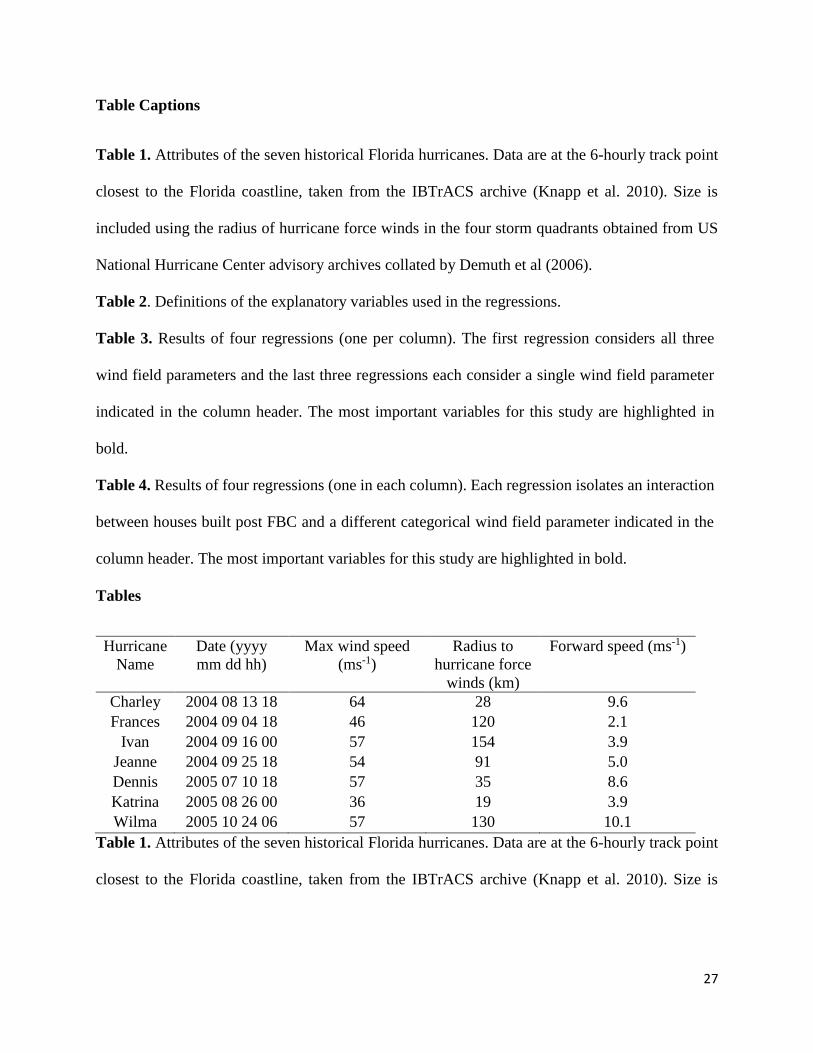
Attributes of the seven historical hurricanes are summarized in Table 1 at the closest 6-hourly
observational time to the Florida coastline (data taken from IBTrACS (Knapp et al. 2010) and
extended best track (Demuth et al. 2006) archives). The hurricanes all occurred in the very active
2004 and 2005 seasons and span a range of maximum wind speed, size (as measured by the radius
of hurricane force winds), and forward speed. The hurricanes span from low intensity Katrina to
high intensity Dennis, and from slow-moving and large Jeanne (i.e., long duration, large size storm
with high directional change) to fast-moving and compact Charley (i.e., short duration, small size
storm with high directional change).
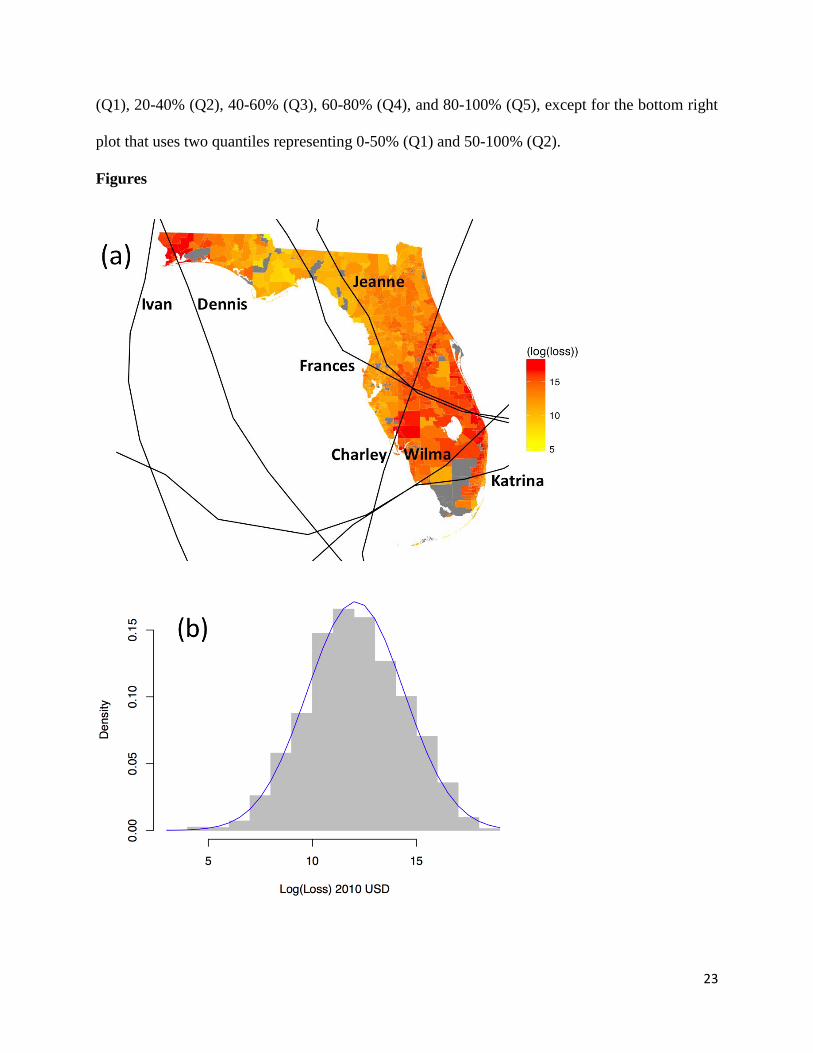
The spatial distribution of total loss (Fig. 1a) shows losses are distributed across most of the state,
with high losses at the western end of the Florida panhandle associated with hurricanes Ivan and
Dennis, high losses across central Florida along the track of hurricane Charley, and higher losses
towards South Florida and extending down the east coast associated with hurricanes Frances and
Jeanne. The distribution of the zip-code level losses over the seven hurricanes (10564 data points)
closely follows a lognormal distribution (Fig. 1b), in agreement with Hogg and Klugmann (1984).
Lognormal distributions have been used to model hurricane losses for individual storm damage
(e.g., Jagger et al. 2011; Katz 2002), and Fig. 1b shows the lognormal distribution also describes
zip-code level losses. A quantile-quantile plot (not shown) indicates good agreement between the
observed and theoretical distributions.
Spatial hurricane wind field data are taken from a gridded surface wind field analysis available
from the National Oceanic and Atmospheric Administration (NOAA) Hurricane Research
Division (HRD) Real-time Hurricane Wind Analysis System (HWind) project
7
(http://www.hwind.co/legacy_data/, Powell et al. 1998). HWind analyses are based on available
surface, aircraft, and remote sensing data and are a readily accessible, publically available
surface wind analysis for historical hurricanes. HWind data are regridded from the original ~6km
grid to a finer grid before interpolating to 959 Florida five-digit zip-codes, taking the mean of all
HWind values that intersect each zip code. The regridding step was necessary to ensure each zip-
code contained at least one value. Three spatial wind field parameters are extracted for each
hurricane:
1. Maximum wind speed over the storm lifetime, hereafter referred to as ‘wind speed’;
2. Duration of wind speed above 33 ms-1 (corresponding to hurricane category 1 strength on
the Saffir-Simpson scale) over the storm lifetime in units of hours, hereafter referred to
simply as ‘duration’;
3. Directional change of the winds as defined by the ratio of the vector mean wind to the
scalar mean over the storm lifetime, hereafter referred to as ‘steadiness’. If the hurricane
eye passes over a site, steadiness values will be close to zero since the vector wind shifts
180 degrees. Steadiness values close to 1 indicate little change in wind direction over the
lifetime of the storm and these values are confined to the far right-of-track and left-of-track
edges of the hurricane wind field.
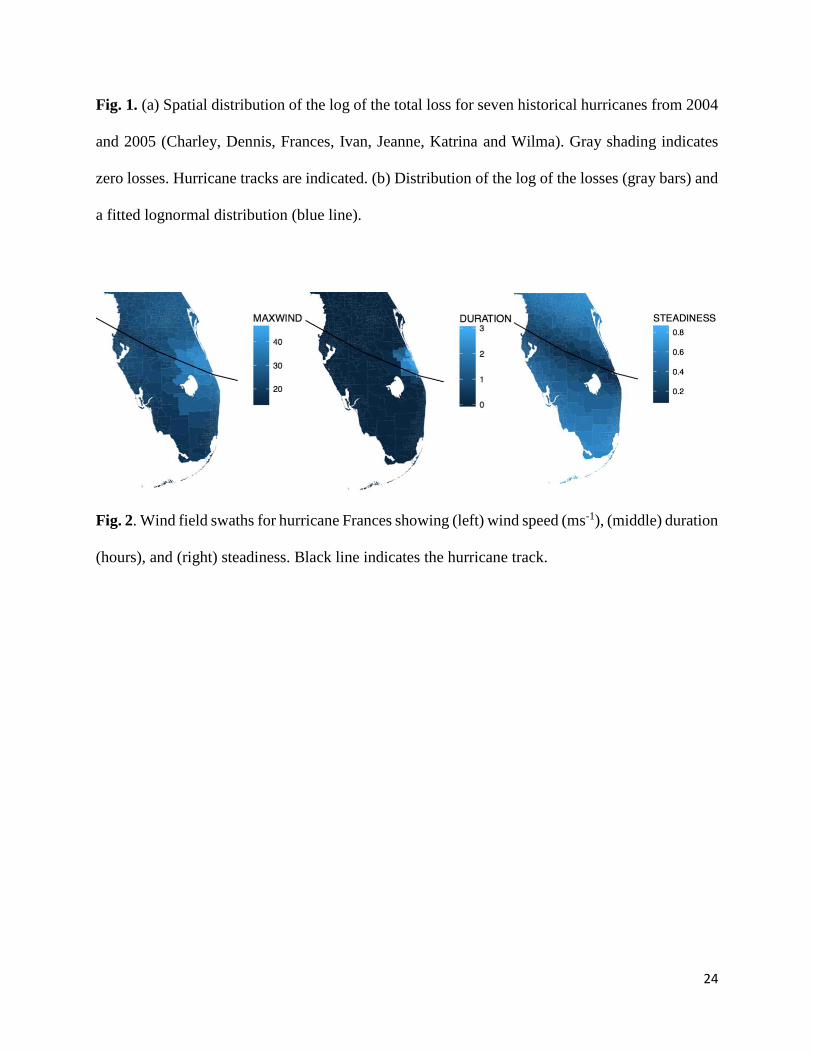
The spatial characteristics of these three wind field parameters are shown for hurricane Frances in
Fig. 2. This large hurricane produced a large wind speed footprint across much of eastern and
central Florida, whereas zip codes that experienced long duration were confined to coastal or near-
coastal locations at the point of landfall and concentrated right-of-track. The swath of low
steadiness followed the hurricane track far inland.
8
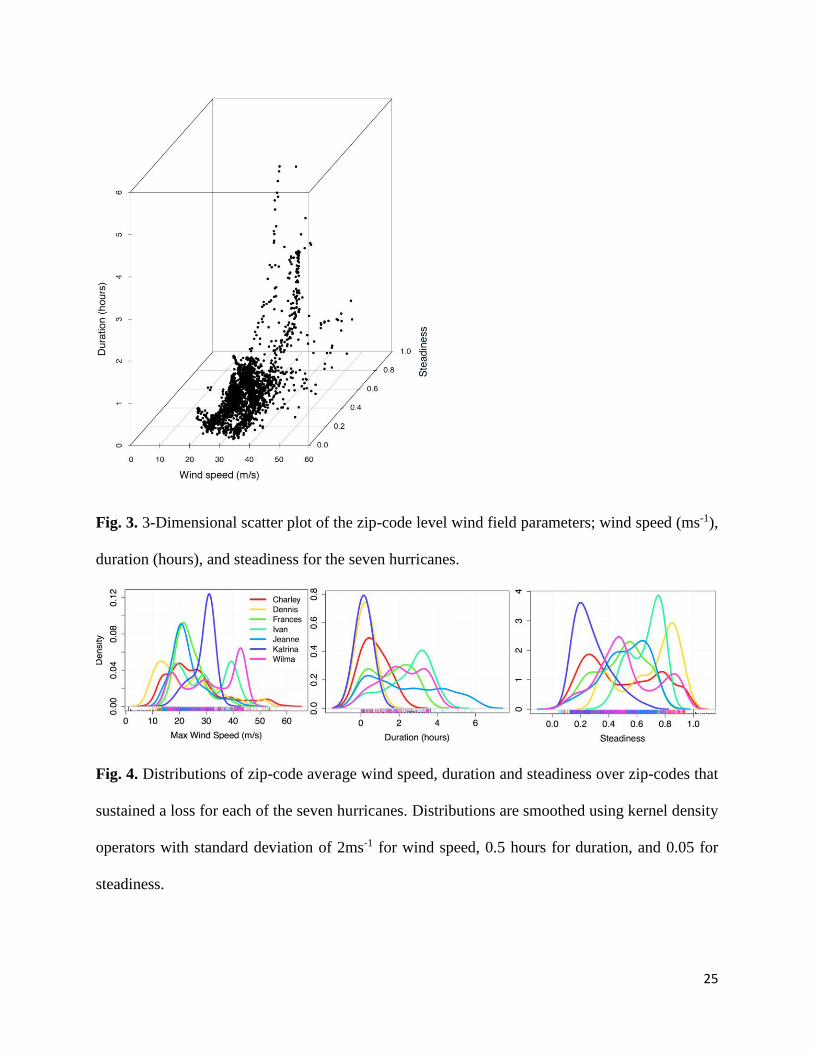
Figure 3 shows the sampling of the 3-dimensional spatial wind field parameter space by the zip-
code level data for the seven hurricanes. Data points fall into the quadrants of long duration and
low wind speed, short duration and high wind speed, low steadiness and low wind speed and high
steadiness and high wind speed. This broad sampling is important to explore the relative
importance of the different wind field parameters to loss and building code effectiveness. Yet
hazard data points are far from evenly distributed. Wind speed and duration are positively
correlated with a Pearson correlation coefficient of r=0.68, and wind speed and steadiness are
negatively correlated at r=-0.45, thereby requiring some caution when interpreting the results.
However, steadiness and duration are not correlated (r=0.00).
Distributions of the spatial wind field parameters over the zip-codes that sustained a loss for each
of the seven hurricanes are shown in Fig. 4. The hurricanes have very different combinations of
parameter distributions. This diversity of hurricane wind fields will help to identify the role of each
wind field parameter in driving loss and any parameter-dependent effectiveness of the building
code. For example, large and slow moving hurricanes Jeanne and Frances (Table 1, and green and
light blue lines in Fig. 4) produced the longest durations but are also skewed towards low wind
speeds. On the other hand, small and fast moving hurricane Charley (Table 1, and red line in Fig.
4) produced the highest wind speeds but some of the shortest durations.
Method: Wind Field Parameters versus Loss
An initial exploratory analysis of the combined wind field parameter and loss data is first
performed to explore empirical loss relationships to each wind field parameter individually. Wind
9
field parameters are categorized into quantiles to reduce correlation among the parameters and to
better identify any relationships. Motivated by Powell (1995) who found relationships between
multiple wind field parameters and loss ratio, this initial analysis explores relationships between
the wind field and loss ratio. Here, loss is normalized by a simple measure of exposure: the total
residential value calculated as the zip-code average residential value multiplied by the number of
residential housing units. A fourth wind field parameter is also considered, related to the design
wind speed. A given wind speed will result in different losses depending on the strength of the
building code, and building codes are based on the spatially varying design wind speed. Therefore
the fourth wind field parameter considered here is the wind speed divided by the ASCE design
wind speed (ASCE, 2013), referred to hereafter as the ‘wind ratio’.
Method: Multiple Regression Analysis
The relative importance of the three wind field parameters in driving hurricane wind losses is then
quantified through a statistically driven loss methodology that systematically accounts for relevant
wind hazard, exposure, and vulnerability characteristics. This methodology is adapted from
Simmons et al. (2017).
The general model form is a semi-log, ordinary least squares, fixed effects (time and space)
regression with the natural log of loss as the dependent variable. The base level of observation is
per zip code, per hurricane, per decade of construction, which allows the model to control for the
effect of the FBC implemented in 2002. The general model controls for other relevant exposure
and vulnerability factors that may also drive hurricane losses, such as construction type (brick,
frame), demographic factors (income), and geographic factors (proximity to the coast).
10
Demographic data are sourced from the 2000 and 2010 decennial census at the zip code level for
median household income and housing counts. Intervening years are interpolated from decennial
data with an allocation factor based on the number of building permits for each zip and each year.
For median household income a linear interpolation method is used and adjusted for changes in
the consumer price index (CPI-U) to 2010. CPI data are from the Bureau of Labor Statistics.
The effect of the FBC is quantified through a binary or ‘dummy’ variable of the number of homes
built after 2000 to capture the value of an improved building code at the extensive margin, i.e.,
the number (extent) of new residential properties built under the new code. Potential intensive
benefits (i.e., how well the code is maintained and enforced at the local level) are therefore ignored
in this study (Czajkowski et al. 2017 found intensive benefits to be a relatively minor
contribution). The dummy variable for post 2000 construction is related to structure age, but age
affects loss in ways not related to the FBC, such as depreciation and differences in materials and
construction practices across time. To account for both the effect of age on loss as well as the
implementation of the FBC, dummy variables for each decade are added (omitting the decade of
the 1990s to examine the effect of the FBC against the most recent decade). This accounts for how
changing construction practices and materials across time have impacted loss compared to post
FBC homes. The general form of the model is:
(1)
Natural log of losses = β0 + β1*Brick_Plus + β2*ln_Income + β3*unit_fac_density +
β4*CCCL + β5*ln_near_dist + β6*Citizens + β7*Major_hurr + β8*Minor_hurr +
β9*High_duration + β10*High_steadiness + β11*d_2000 + β12*d_1980 +
11
β13*d_1970 + β14*d_1960 + β15*d_1950 + β16*pre_1950 + Vector of dummy
variables for zip code + Vector of dummy variables for hurricane,
where the variable definitions are given in Table 2.
Given the significant correlation among the continuous wind field parameters, hazard variables are
converted to categorical variables (described in Table 2) to reduce correlation effects and better
identify signals in the data.
Regression models are limited by available data to understand how the dependent variable varies
as explanatory variables change. If important variables are left out of the model, some bias can be
expected. One way to minimize bias is to employ a fixed effects model. This is done using two
sets of dummy variables for hurricane and geography (five-digit zip codes). These dummy
variables will contain all across-group variation leaving the remainder of the model to contain the
within-group variation (Greene, 2003).
Starting with the general model form (Eqn. 1), a set of four regressions are performed. Three
regressions each consider a single wind parameter to identify the contribution of each wind
parameter to loss, while controlling for the vulnerability and exposure factors. A fourth regression
includes all wind field parameters to assess their relative importance to loss. This regression
allows comparison among loss per unit increase in wind speed, duration and steadiness.
Method: Effectiveness of the Florida Building Code
12
A second set of four regressions are performed to assess the effectiveness of the building code
against the different wind field parameters. These regressions utilize an additional interaction
component to the general model form of Eqn. 1 to isolate the varying effect of the different wind
field parameters on those homes built after the passage of the FBC. Four regressions each isolate
a different interaction effect between a wind field parameter and the post 2000 decade of
construction (our dummy variable for code implementation), using the categorical variables of
major hurricane, minor hurricane, high duration and high steadiness.
Results: Wind Field Parameters versus Loss
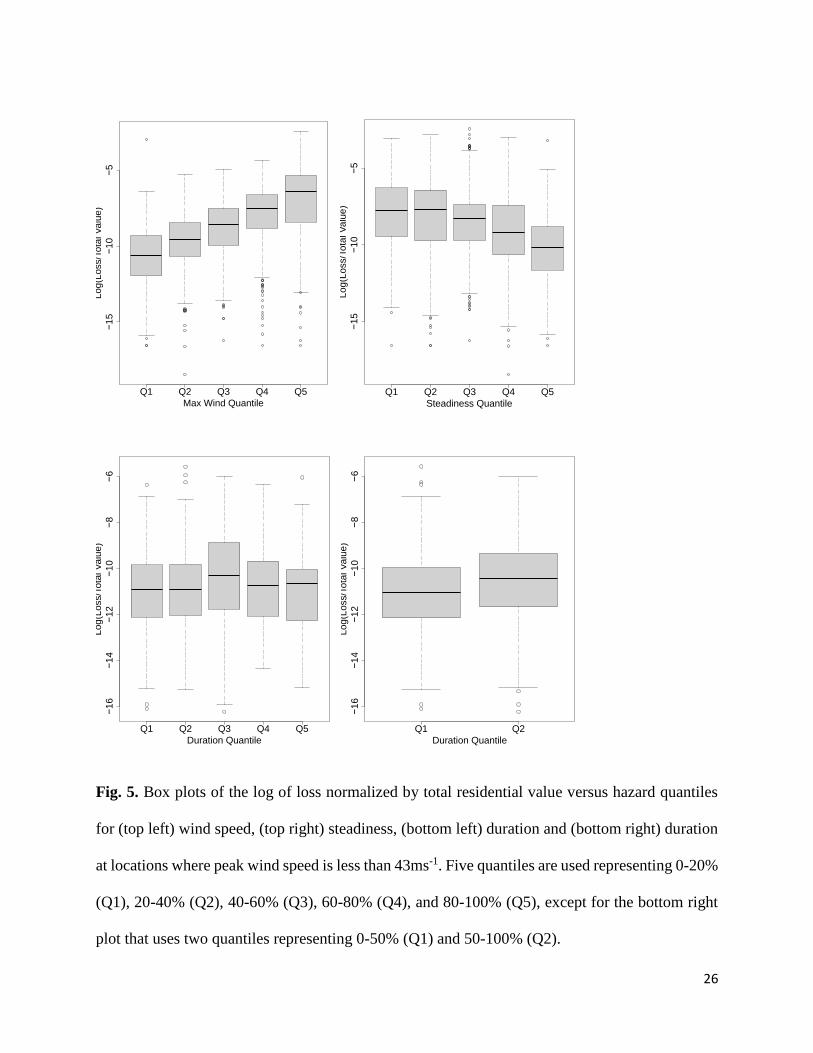
Figure 5 shows how the distribution of loss ratio varies by wind field parameter quantile. Overall,
wind speed explains 30% of the loss ratios, steadiness explains 14%, and duration explains 9%.
Loss ratios increase log-linearly with wind speed quantile, in agreement with Murnane and Elsner
(2012) who found an exponential relationship between maximum wind speed and loss at the per
hurricane level. For steadiness, loss ratios are lower at higher steadiness, as expected. However,
there is no significant difference among the higher loss ratio distributions across the first three
quantiles. This agrees well with Powell (1995) whose data suggest the relationship with steadiness
is perhaps closer to a step function, with no loss above a steadiness of 0.6. For duration, there is
no indication of higher loss ratios at the higher duration quantiles. A claims analysis by Jain (2010)
found duration to be most important at lower wind speeds: higher wind speeds dominate losses. A
positive duration-loss ratio relationship is found here at wind speeds less than 43ms-1 (though the
precise threshold is somewhat arbitrary), in a comparison of two duration quantiles divided at
approximately 1.5 hours. (Fig 5, lower right). The Powell (1995) analysis suggests an exponential
or power law relationship between duration and loss ratio, with loss ratios above 0.5 at durations
13
greater than 1.5 hours. Very similar relationships were found between the three wind field
parameters and loss, rather than loss ratio (not shown).
The relationship of wind ratio to loss ratio is very similar to the relationship between wind speed
and loss ratio (not shown). Indeed, wind speed and design speed are positively correlated at r=0.52.
This suggests that wind ratio, which is also a measure of the return wind speed value, may also be
used to model loss.
Given that our wind field parameter sample is not homogeneously distributed across the 3-
dimensional parameter space (Fig. 3), this analysis may miss some important behavior. This
limitation is particularly acute for high intensity and high duration where only one or two
hurricanes provide all the data. As a result, this initial analysis should be treated as exploratory
and serves to provide a first order indication that all three wind field parameters have a role in
driving wind losses. Their relative importance is further quantified in the next subsection using
multiple regression analysis.
Results: Multiple Regression Analysis
The three regressions that each consider a single wind field parameter (wind speed, duration,
steadiness) are presented in Table 3 (last three columns). The regression models are all statistically
significant and explain approximately a quarter to a third of the variance in loss, indicating that
modeling zip-code level losses is feasible. The remaining variance could be due to errors in the
wind field, exposure or loss data, model error, higher order effects, omitted predictors, or missing
predictor interactions. Each wind field parameter has significant correlations (at the 99.9%
confidence level) with loss and in the directions expected and consistent with the exploratory
14
analysis. Wind speed and duration have significant positive relationships with loss, and steadiness
has a significant negative relationship.
The fourth regression that includes all three wind field parameters (Table 3, first column) retains
significant hazard-loss relationships. Loss is most sensitive to major hurricane wind speeds (>
49ms-1) with unit increases in loss 2.49 times the omitted category (tropical storm strength wind
speed). Loss is less sensitive to minor hurricane wind speeds (between 32 and 49ms-1) with a
smaller unit loss increase of 1.76. Durations longer than 1.5 hours increase loss by 0.50 compared
to durations below 1.5 hours. Steadiness has a negative relationship to loss, as expected, and
decreases loss by 0.78 for steadiness greater than 0.6 compared to steadiness below 0.6.
Of particular interest to this study is the parameter d_2000, a dummy variable for homes built in
the decade of the 2000s. Homes built in the 2000s consistently drive down losses by 68% (1-e
βd_2000) relative to homes built in the 1990s. Older homes built in the 1980s significantly drive up
losses whereas still older homes significantly drive down losses. Possible reasons include more
robust construction materials in older homes and that weaker older structures may have been
removed during previous wind events. This is strong evidence for the effectiveness of the FBC
against hurricane winds and is consistent with the range of loss reductions found by Simmons et
al (2017).
Results: Effectiveness of the Florida Building Code
15
In this section, the performance of the building code is explored in terms of its particular
effectiveness against the different wind field parameters. The set of four regressions that isolate
the varying effect of single wind field parameters on those homes built after the passage of the
FBC are presented in Table 4.
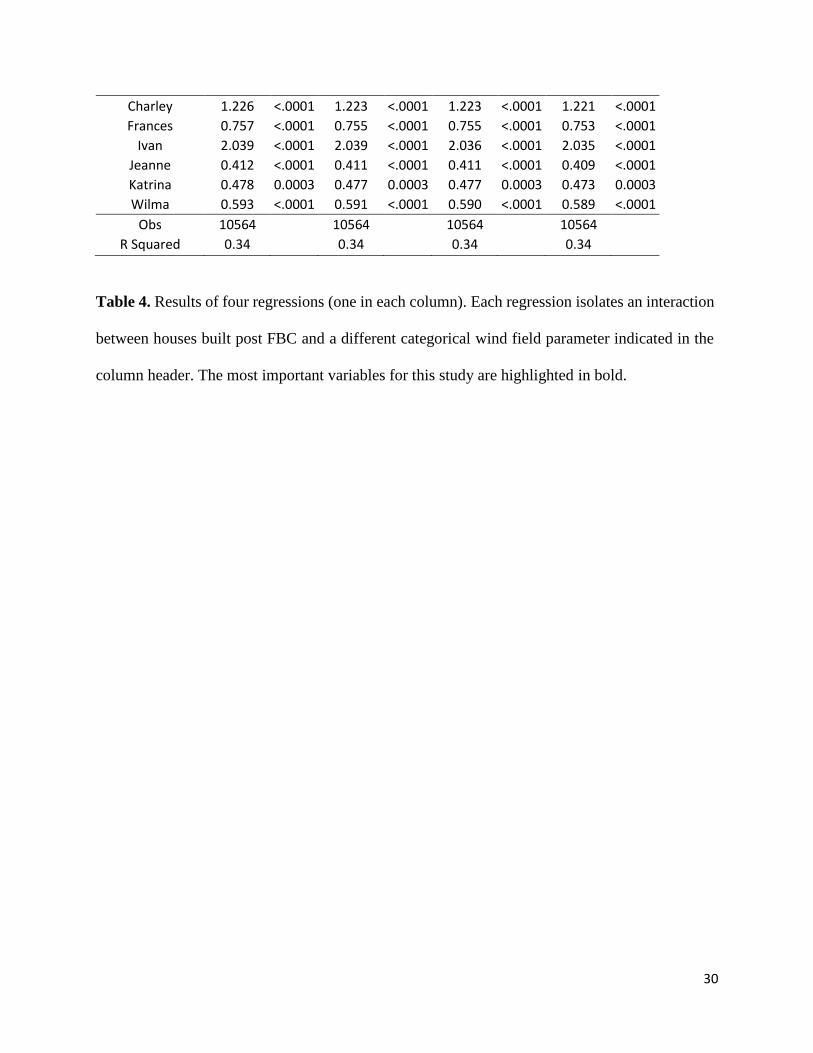
Major hurricane wind speed has a positive correlation with damage to all decades of construction
with a coefficient of 2.35, whereas the marginal damage due to major hurricanes for post-FBC
construction (the interaction effect) is an additional 0.93 (Table 4, first column). However, this
interaction effect is barely statistically different from zero (Pr > |t| = 0.05). Therefore, given the
negative and statistically significant post 2000 dummy value of -1.14, the total damage to post
2000 homes for major hurricanes (= 2.35 – 1.14 + 0.0) is less than the total damage to pre 2000
homes (2.35) everything else being equal. This is evidence of the effectiveness of the FBC
against damage due to major hurricane wind speed damage for which new construction has been
designed. The same is true for minor hurricane damage (Table 4, second column) with a
coefficient of 1.73 for all decades of construction and a coefficient of 0.19 for the marginal
damage due to minor hurricanes for post-FBC construction (the interaction effect) that is not
significant. The total damage to post 2000 homes for minor hurricanes is therefore
(1.73Minor_hurr - 1.17d_2000 + 0.0) which is less than the 1.73 for pre 2000 construction given
the extensive benefit from the post 2000 dummy. For duration and steadiness, the interaction
terms are again not significant. Therefore, given the extensive benefits from the post 2000
dummy (-1.11 and -1.15 from columns 3 and 4 of Table 4), the total damages to post 2000
homes for duration and steadiness effects are less than for pre 2000 construction.
16
Conclusions
Recent studies show wind speed is not the only wind field parameter that can drive wind-related
losses, and point to the potential importance of other loss drivers such as wind duration, and wind
directional change. Given that hurricane building codes are based primarily on wind speed, their
effectiveness against wind duration or wind directional change effects is unknown.
This work builds on the existing literature in two important ways. For seven historical hurricanes
that impacted Florida during 2004 and 2005, a comprehensive loss database at the zip-code level
is combined with three spatial hurricane wind field parameters (wind speed, duration of damaging
winds and steadiness - a measure of wind directional change) to i) quantify the relative importance
of the different wind field parameters in driving hurricane wind losses, and ii) quantify the
effectiveness of the Florida Building Code (FBC) in lowering losses associated with the different
wind field parameters. The seven hurricanes span a range of intensity, size, and forward speed
combinations, and correspondingly sample a range of wind speed, duration and steadiness
combinations.
An exploratory data analysis shows median loss follows a log-linear increase with wind speed
quantile, in broad agreement with the functional relationship found using storm total losses and
storm maximum wind speed (Murnane and Elsner 2012). Median loss also follows a log-linear
increase with wind ratio - the wind speed relative to the design wind speed. This is evidence that
the return value of wind speed may also be used to model loss. For steadiness, loss follows a step-
function, with an abrupt increase in losses at a steadiness of 0.6. For duration, losses are higher
for durations longer than 1.5 hours than for shorter durations, but this relationship only holds across
locations that did not experience major hurricane wind speeds (above 43ms-1), and is in agreement
with a damage analysis (Powell, 1995) and a claims analysis (Jain 2010). A regression analysis
17
confirms that wind speed, duration, and steadiness have significant correlations (at the 99.9%
confidence level) with loss and are in the directions expected. Loss is most sensitive to major
hurricane wind speeds, followed closely by minor hurricane wind speeds.
Homes built in the 2000s consistently drive down losses (by 68%) relative to homes built in the
decade prior to implementing the FBC, confirming the effectiveness of the FBC against reducing
hurricane wind-driven losses as found by Simmons et al. (2017). Interaction effects between wind
speed, duration, steadiness and the decade of construction were used to quantify the performance
of the FBC against the different wind field parameters. The total effect of the FBC in reducing
damages appears to be effective against wind speed, wind duration and wind steadiness impacts.
Combining this new understanding of wind field effects with the effectiveness of wind building
codes can inform future code development. This study shows the FBC performs well against the
effects of all three wind field parameters. Many of the protections added under the FBC were to
prevent structural catastrophic failures (Dixon 2009). Indeed, losses during the 2004 and 2005
hurricane season were primarily from component failures (sidings, windows, doors) and cladding
failures (soffits, roof coverings) (Dixon 2009). These protections include enhanced nailing down
of roof decks, bracing gable ends, and adding metal connectors to prevent pulling apart of wall-to-
wall, wall-to-roof and wall-to-foundation connections. While these were designed primarily to
guard against wind pressure effects (proportional to the square of the wind speed), they are likely
to also guard against duration and steadiness effects related to repeated loading of gusts and lulls,
wind-borne debris, and directionally dependent structural weakness.
Limitations of this study arise from data quality and sample size. Loss data commonly contain
unknown uncertainties due to inaccuracies and inconsistencies in the collection and reporting
procedures (Gall et al 2009). Uncertainties are also inherent to the wind field data (as described in
18
Powell et al 1998). That our wind field parameter data are not homogenous across the 3-d
parameter space means the analysis may miss some important behavior. In particular, high
intensity and high duration locations are not well sampled. Finally, since there remains substantial
correlation between the categorical wind field parameters, future work will explore their joint
effects on loss.
Acknowledgements
The authors would like to acknowledge the assistance of the Insurance Services Office, the
Florida Division of Emergency Management, Florida International University and the Willis
Research Network for data and research support. The National Center for Atmospheric
Research is sponsored by the National Science Foundation. Author Done wrote the
manuscript and conducted the initial data analysis, Simmons conducted the regression
analyses, and Czajkowski interpreted the regression results.
References
ASCE (American Society of Civil Engineers). (2013). Minimum Design Loads for Buildings and
Other Structures, ASCE/SEI 7-10, pp. i-xli. doi: 10.1061/9780784412916.fm
Czajkowski, J., Simmons K. M., and Done, J. M. (2017). “Demonstrating the Intensive Benefit
to the Local Implementation of a Statewide Building Code.” Risk Management and
Insurance Review, in press.
Czajkowski J, and Done, J. M. (2014). “As the Wind Blows? Understanding hurricane damages
at the local level through a case study analysis.” Weather Clim. Soc., 6, 202–217.
19
Demuth, J., DeMaria, M., and Knaff, J. A. (2006). “Improvement of advanced microwave sounder
unit tropical cyclone intensity and size estimation algorithms.” J. Appl. Meteor., 45, 1573-
1581.
Dixon, R. (2009). The Florida Building Code. Florida’s response to hurricane risk.”
<http://www.sbafla.com/method/portals/methodology/WindstormMitigationCommittee/2
009/20090917_DixonFLBldgCode.pdf>
Dunion, J., Landsea, C., Houston, S., and Powell, M. (2003). “A reanalysis of the surface winds
for Hurricane Donna of 1960.” Mon. Wea. Rev., 131, 1992–2011.
Emanuel, K. (2011).“Global warming effects on US hurricane damage.”Weather Clim. Soc.,
3, 261–8.
Estrada, F., Botzen, W. J. W., and Tol, R. S. J. (2015).“Economic losses from US hurricanes
consistent with an influence from climate change.”Nat. Geosci., 8, 880–4.
Gall, M., Borden, K. A., and Cutter, S. L. (2009). “When do losses count?” Bull. Amer. Meteor.
Soc., 90, 799–809, doi:10.1175/2008BAMS2721.1.
Geiger, T., Frieler, K., and Levermann, A. (2016) “High-income does not protect against
hurricane losses.” Environ. Res. Lett., 11(084012), doi:10.1088/1748-9326/11/8/084012.
Greene, W. (2003). Econometric Analysis, 5th Ed., Prentice Hall, Upper Saddle River, NJ, US.
Hamid, S. S., Pinelli, J. –P., Chen, S. –C., and Gurley, K. (2011). “Catastrophe model-based
assessment of hurricane risk and estimates of potential insured losses for the state of
Florida.” Natural Hazards Review, 12(4), 171-176.
Holland, G., Done, J. M., Ge, M., and Douglas, R. (2016). “An Index for Cyclone Damage
Potential.” 32nd Conference on Hurricanes and Tropical Meteorology, American
Meteorological Society, Boston, MA, US.
20
Jagger, T. H., Elsner, J. B., and Burch, R. K. (2011). “Climate and solar signals in property damage
losses from hurricanes affecting the United States.” Nat. Hazards, 58, 541–557.
Jain, V., Guin, J., and He, H. (2009). “Statistical Analysis of 2004 and 2005 Hurricane Claims
Data.” 11th Americas Conference on Wind Engineering, International Association for
Wind Engineering, Japan.
Jain, V. (2010). “The role of wind duration in damage estimation.” <http://www.air-
worldwide.com/Publications/AIR-Currents/2010/The-Role-of-Wind-Duration-in-
Damage-Estimation>.
Kantha, L. (2006). “Time to Replace the Saffir-Simpson Hurricane Scale?” EOS Trans. AGU,
87(1), 3.
Katz, R.W. (2002). “Stochastic modeling of hurricane damage.” Journal of Applied Meteorology,
41, 754-762.
Knapp, K., Kruk, M. C., Levinson, D. H., Diamond, H. J., and Neumann, C. J. (2010). “The
International Best Track Archive for Climate Stewardship (IBTrACS).” Bull. Amer.
Meteor. Soc., 91, 363–376.
Kunreuther, H., Michel-Kerjan, E. (2009). At war with the weather: Managing large-scale risks
in a new era of catastrophes. MIT Press, New York, NY.
Mendelsohn, R., Emanuel, K., Chonabayashi, S., and Bakkensen, L. (2012). “The Impact of
Climate Change on Global Tropical Storm Damages.” Nature Climate Change. 2, 205–209,
doi:10.1038/nclimate1357.
Munich Re (2016) Topics Geo: Natural catastrophes 2015 Analyses, assessments, positions.
<www.munichre.com/topicsgeo2015>.
21
Murnane, R. J., and Elsner, J. B. (2012). “Maximum wind speeds and US hurricane losses.”
Geophys. Res. Lett., 39(L16707), doi:10.1029/2012GL052740.
Pielke Jr, R. A., Gratz, J., Landsea, C. W., Collins, D., Saunders, M. A., and Musulin, R. (2008).
“Normalized hurricane damage in the united states: 1900–2005.” Natural Hazards Review,
doi: 10.1061/ASCE1527-698820089.
Pita, G., Pinelli, J., Gurley, K., and Mitrani-Reiser, J. (2014). “State of the Art of Hurricane
Vulnerability Estimation Methods: A Review.” Nat. Hazards Rev.,
10.1061/(ASCE)NH.1527-6996.0000153, 04014022.
Powell, M. D., Houston, S. H., Amat, L. R., and Morisseau-Leroy, N. (1998). “The HRD real-time
hurricane wind analysis system.” J. Wind Engineer. and Indust. Aerodyn., 77&78, 53-64.
Ranson, M., Kousky, C., Ruth, M. et al. (2014). “Tropical and extratropical cyclone damages under
climate change.” Clim. Change, 127, 227–41, doi:10.1007/s10584-014-1255-4.
Schmidt, S., Kemfert, C., and Höppe, P. (2009). “The impact of socio-economics and climate
change on tropical cyclone losses in the USA.” Reg. Environ. Change. 10, 13–26.
Simmons, K. M., Czajkowski, J., and Done, J. M. (2017). “Economic Effectiveness of
Implementing a Statewide Building Code: The Case of Florida.” Land Economics, in
review.
Smith, S. E. (2010). Managing Catastrophic Risk: Beyond Cat Bonds, Weather Risk
Management: A Guide for Corporations, Hedge Funds and Investors. Incisive Financial
Publishing Ltd, London, UK, 199-213.
Stewart, M. G., Rosowsky, D. V., and Huang, Z. (2003). “Hurricane risks and economic viability
of strengthened construction.” Natural hazards review. 4(1), 12–19.
Unnikrishnan, V. U., and Barbato, M. (2016). “Performance-based comparison of different
22
storm mitigation techniques for residential buildings.” J. Struct. Eng. 04016011.
Watson Jr., C.C. and Johnson, M. E. (2004). “Hurricane Loss Estimation Models: Opportunities
for Improving the State of the Art.” Bull. Amer. Met. Soc., 85(11), 1713-1726.
Weinkle, J., Maue, R., and Pielke Jr, R. (2012). “Historical global tropical cyclone landfalls.”
Journal of Climate. 25(13), 4729–4735.
Zhai, A. R. and Jiang, J. H. (2014). “Dependence of US hurricane economic loss on maximum
wind speed and storm size.” Environmental Research Letters, 9, 064019.
Figure Captions
Fig. 1. (a) Spatial distribution of the log of the total loss for seven historical hurricanes from 2004
and 2005 (Charley, Dennis, Frances, Ivan, Jeanne, Katrina and Wilma). Gray shading indicates
zero losses. Hurricane tracks are indicated. (b) Distribution of the log of the losses (gray bars) and
a fitted lognormal distribution (blue line).
Fig. 2. Wind field swaths for hurricane Frances showing (left) wind speed (ms-1), (middle) duration
(hours), and (right) steadiness. Black line indicates the hurricane track.
Fig. 3. 3-Dimensional scatter plot of the zip-code level wind field parameters; wind speed (ms-1),
duration (hours), and steadiness for the seven hurricanes.
Fig. 4. Distributions of zip-code average wind speed, duration and steadiness over zip-codes that
sustained a loss for each of the seven hurricanes. Distributions are smoothed using kernel density
operators with standard deviation of 2ms-1 for wind speed, 0.5 hours for duration, and 0.05 for
steadiness.
Fig. 5. Box plots of the log of loss normalized by total residential value versus hazard quantiles
for (top left) wind speed, (top right) steadiness, (bottom left) duration and (bottom right) duration
at locations where peak wind speed is less than 43ms-1. Five quantiles are used representing 0-20%
23
(Q1), 20-40% (Q2), 40-60% (Q3), 60-80% (Q4), and 80-100% (Q5), except for the bottom right
plot that uses two quantiles representing 0-50% (Q1) and 50-100% (Q2).
Figures
24
Fig. 1. (a) Spatial distribution of the log of the total loss for seven historical hurricanes from 2004
and 2005 (Charley, Dennis, Frances, Ivan, Jeanne, Katrina and Wilma). Gray shading indicates
zero losses. Hurricane tracks are indicated. (b) Distribution of the log of the losses (gray bars) and
a fitted lognormal distribution (blue line).
Fig. 2. Wind field swaths for hurricane Frances showing (left) wind speed (ms-1), (middle) duration
(hours), and (right) steadiness. Black line indicates the hurricane track.
25
Fig. 3. 3-Dimensional scatter plot of the zip-code level wind field parameters; wind speed (ms-1),
duration (hours), and steadiness for the seven hurricanes.
Fig. 4. Distributions of zip-code average wind speed, duration and steadiness over zip-codes that
sustained a loss for each of the seven hurricanes. Distributions are smoothed using kernel density
operators with standard deviation of 2ms-1 for wind speed, 0.5 hours for duration, and 0.05 for
steadiness.
26
Fig. 5. Box plots of the log of loss normalized by total residential value versus hazard quantiles
for (top left) wind speed, (top right) steadiness, (bottom left) duration and (bottom right) duration
at locations where peak wind speed is less than 43ms-1. Five quantiles are used representing 0-20%
(Q1), 20-40% (Q2), 40-60% (Q3), 60-80% (Q4), and 80-100% (Q5), except for the bottom right
plot that uses two quantiles representing 0-50% (Q1) and 50-100% (Q2).
Q1 Q2 Q3 Q4 Q5
−15
−1
0−
5
Max Wind Quantile
Log
(Loss/T
ota
l V
alu
e)
Q1 Q2 Q3 Q4 Q5
−1
5−
10
−5
Steadiness Quantile
Lo
g(L
oss/T
ota
l V
alu
e)
Q1 Q2 Q3 Q4 Q5
−16
−14
−1
2−
10
−8
−6
Duration Quantile
Lo
g(L
oss/T
ota
l V
alu
e)
Q1 Q2
−16
−14
−1
2−
10
−8
−6
Duration Quantile
Lo
g(L
oss/T
ota
l V
alu
e)
27
Table Captions
Table 1. Attributes of the seven historical Florida hurricanes. Data are at the 6-hourly track point
closest to the Florida coastline, taken from the IBTrACS archive (Knapp et al. 2010). Size is
included using the radius of hurricane force winds in the four storm quadrants obtained from US
National Hurricane Center advisory archives collated by Demuth et al (2006).
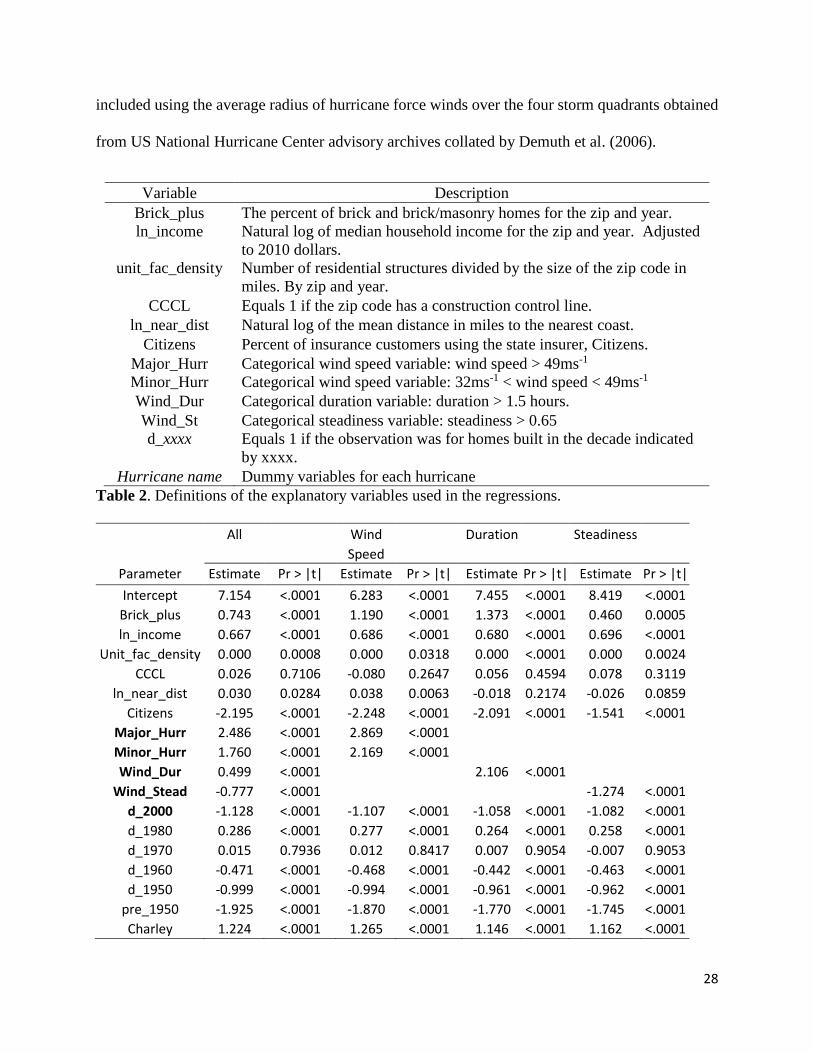
Table 2. Definitions of the explanatory variables used in the regressions.
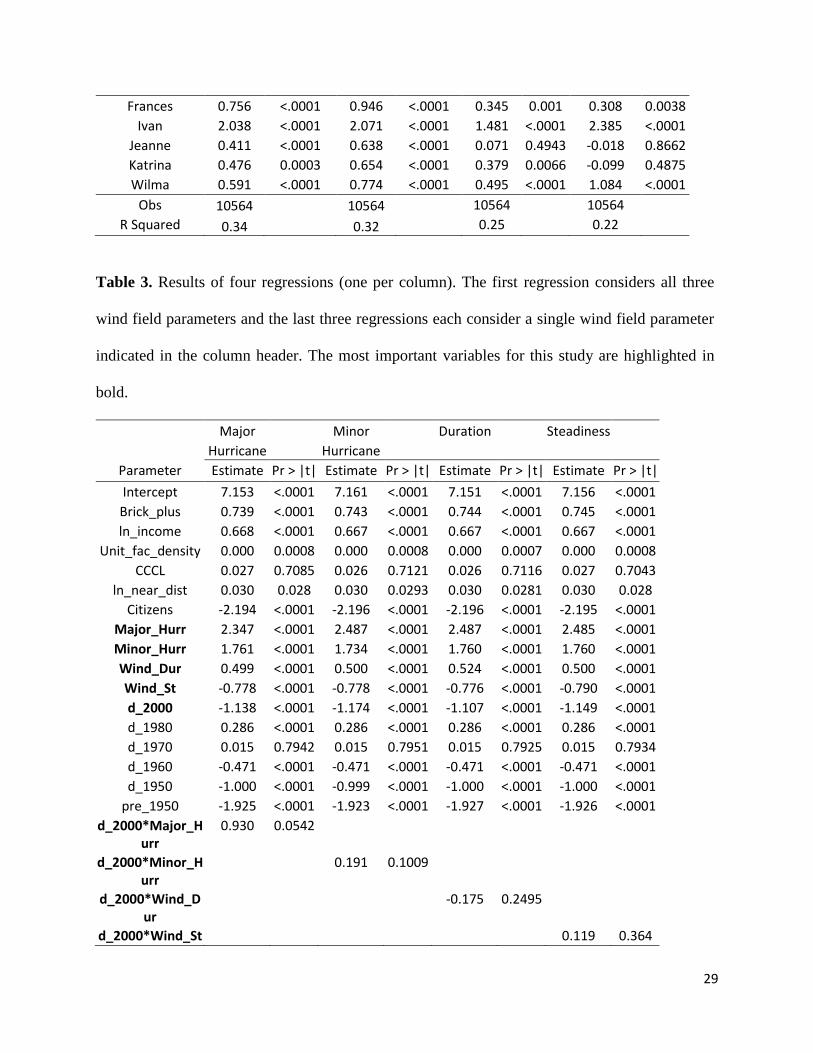
Table 3. Results of four regressions (one per column). The first regression considers all three
wind field parameters and the last three regressions each consider a single wind field parameter
indicated in the column header. The most important variables for this study are highlighted in
bold.
Table 4. Results of four regressions (one in each column). Each regression isolates an interaction
between houses built post FBC and a different categorical wind field parameter indicated in the
column header. The most important variables for this study are highlighted in bold.
Tables
Hurricane
Name
Date (yyyy
mm dd hh)
Max wind speed
(ms-1)
Radius to
hurricane force
winds (km)
Forward speed (ms-1)
Charley 2004 08 13 18 64 28 9.6
Frances 2004 09 04 18 46 120 2.1
Ivan 2004 09 16 00 57 154 3.9
Jeanne 2004 09 25 18 54 91 5.0
Dennis 2005 07 10 18 57 35 8.6
Katrina 2005 08 26 00 36 19 3.9
Wilma 2005 10 24 06 57 130 10.1
Table 1. Attributes of the seven historical Florida hurricanes. Data are at the 6-hourly track point
closest to the Florida coastline, taken from the IBTrACS archive (Knapp et al. 2010). Size is
28
included using the average radius of hurricane force winds over the four storm quadrants obtained
from US National Hurricane Center advisory archives collated by Demuth et al. (2006).
Variable Description
Brick_plus The percent of brick and brick/masonry homes for the zip and year.
ln_income
Natural log of median household income for the zip and year. Adjusted
to 2010 dollars.
unit_fac_density
Number of residential structures divided by the size of the zip code in
miles. By zip and year.
CCCL Equals 1 if the zip code has a construction control line.
ln_near_dist Natural log of the mean distance in miles to the nearest coast.
Citizens Percent of insurance customers using the state insurer, Citizens.
Major_Hurr Categorical wind speed variable: wind speed > 49ms-1
Minor_Hurr Categorical wind speed variable: 32ms-1 < wind speed < 49ms-1
Wind_Dur Categorical duration variable: duration > 1.5 hours.
Wind_St Categorical steadiness variable: steadiness > 0.65
d_xxxx
Equals 1 if the observation was for homes built in the decade indicated
by xxxx.
Hurricane name Dummy variables for each hurricane
Table 2. Definitions of the explanatory variables used in the regressions.
All Wind Duration Steadiness
Speed
Parameter Estimate Pr > |t| Estimate Pr > |t| Estimate Pr > |t| Estimate Pr > |t|
Intercept 7.154 <.0001 6.283 <.0001 7.455 <.0001 8.419 <.0001
Brick_plus 0.743 <.0001 1.190 <.0001 1.373 <.0001 0.460 0.0005
ln_income 0.667 <.0001 0.686 <.0001 0.680 <.0001 0.696 <.0001
Unit_fac_density 0.000 0.0008 0.000 0.0318 0.000 <.0001 0.000 0.0024
CCCL 0.026 0.7106 -0.080 0.2647 0.056 0.4594 0.078 0.3119
ln_near_dist 0.030 0.0284 0.038 0.0063 -0.018 0.2174 -0.026 0.0859
Citizens -2.195 <.0001 -2.248 <.0001 -2.091 <.0001 -1.541 <.0001
Major_Hurr 2.486 <.0001 2.869 <.0001
Minor_Hurr 1.760 <.0001 2.169 <.0001
Wind_Dur 0.499 <.0001 2.106 <.0001
Wind_Stead -0.777 <.0001
-1.274 <.0001
d_2000 -1.128 <.0001 -1.107 <.0001 -1.058 <.0001 -1.082 <.0001
d_1980 0.286 <.0001 0.277 <.0001 0.264 <.0001 0.258 <.0001
d_1970 0.015 0.7936 0.012 0.8417 0.007 0.9054 -0.007 0.9053
d_1960 -0.471 <.0001 -0.468 <.0001 -0.442 <.0001 -0.463 <.0001
d_1950 -0.999 <.0001 -0.994 <.0001 -0.961 <.0001 -0.962 <.0001
pre_1950 -1.925 <.0001 -1.870 <.0001 -1.770 <.0001 -1.745 <.0001
Charley 1.224 <.0001 1.265 <.0001 1.146 <.0001 1.162 <.0001
29
Frances 0.756 <.0001 0.946 <.0001 0.345 0.001 0.308 0.0038
Ivan 2.038 <.0001 2.071 <.0001 1.481 <.0001 2.385 <.0001
Jeanne 0.411 <.0001 0.638 <.0001 0.071 0.4943 -0.018 0.8662
Katrina 0.476 0.0003 0.654 <.0001 0.379 0.0066 -0.099 0.4875
Wilma 0.591 <.0001 0.774 <.0001 0.495 <.0001 1.084 <.0001
Obs 10564 10564 10564 10564
R Squared 0.34 0.32 0.25 0.22
Table 3. Results of four regressions (one per column). The first regression considers all three
wind field parameters and the last three regressions each consider a single wind field parameter
indicated in the column header. The most important variables for this study are highlighted in
bold.
Major Minor Duration Steadiness
Hurricane Hurricane
Parameter Estimate Pr > |t| Estimate Pr > |t| Estimate Pr > |t| Estimate Pr > |t|
Intercept 7.153 <.0001 7.161 <.0001 7.151 <.0001 7.156 <.0001
Brick_plus 0.739 <.0001 0.743 <.0001 0.744 <.0001 0.745 <.0001
ln_income 0.668 <.0001 0.667 <.0001 0.667 <.0001 0.667 <.0001
Unit_fac_density 0.000 0.0008 0.000 0.0008 0.000 0.0007 0.000 0.0008
CCCL 0.027 0.7085 0.026 0.7121 0.026 0.7116 0.027 0.7043
ln_near_dist 0.030 0.028 0.030 0.0293 0.030 0.0281 0.030 0.028
Citizens -2.194 <.0001 -2.196 <.0001 -2.196 <.0001 -2.195 <.0001
Major_Hurr 2.347 <.0001 2.487 <.0001 2.487 <.0001 2.485 <.0001
Minor_Hurr 1.761 <.0001 1.734 <.0001 1.760 <.0001 1.760 <.0001
Wind_Dur 0.499 <.0001 0.500 <.0001 0.524 <.0001 0.500 <.0001
Wind_St -0.778 <.0001 -0.778 <.0001 -0.776 <.0001 -0.790 <.0001
d_2000 -1.138 <.0001 -1.174 <.0001 -1.107 <.0001 -1.149 <.0001
d_1980 0.286 <.0001 0.286 <.0001 0.286 <.0001 0.286 <.0001
d_1970 0.015 0.7942 0.015 0.7951 0.015 0.7925 0.015 0.7934
d_1960 -0.471 <.0001 -0.471 <.0001 -0.471 <.0001 -0.471 <.0001
d_1950 -1.000 <.0001 -0.999 <.0001 -1.000 <.0001 -1.000 <.0001
pre_1950 -1.925 <.0001 -1.923 <.0001 -1.927 <.0001 -1.926 <.0001
d_2000*Major_Hurr
0.930 0.0542
d_2000*Minor_Hurr
0.191 0.1009
d_2000*Wind_Dur
-0.175 0.2495
d_2000*Wind_St
0.119 0.364
30
Charley 1.226 <.0001 1.223 <.0001 1.223 <.0001 1.221 <.0001
Frances 0.757 <.0001 0.755 <.0001 0.755 <.0001 0.753 <.0001
Ivan 2.039 <.0001 2.039 <.0001 2.036 <.0001 2.035 <.0001
Jeanne 0.412 <.0001 0.411 <.0001 0.411 <.0001 0.409 <.0001
Katrina 0.478 0.0003 0.477 0.0003 0.477 0.0003 0.473 0.0003
Wilma 0.593 <.0001 0.591 <.0001 0.590 <.0001 0.589 <.0001
Obs 10564 10564 10564 10564
R Squared 0.34 0.34 0.34 0.34
Table 4. Results of four regressions (one in each column). Each regression isolates an interaction
between houses built post FBC and a different categorical wind field parameter indicated in the
column header. The most important variables for this study are highlighted in bold.