Embed Size (px)
Citation preview
Medit. Mar. Sci., 18/1, 2017, 161-178 161
Research ArticleMediterranean Marine ScienceIndexed in WoS (Web of Science, ISI Thomson) and SCOPUSThe journal is available on line at http://www.medit-mar-sc.netDOI: http://dx.doi.org/10.12681/mms.1893
Introduction
The implementation of the European Water Frame-work Directive (WFD 2000/60/EC) has been a key driver for increasing research effort focused on the development of several biological or ecological indicators (Marbà et al., 2012).
Seagrasses (i.e. marine angiosperms) are increasingly being used as ecological indicators for the assessment of overall environmental health status (Pergent et al., 1995; Short and Wyllie-Echeverria, 1996; Hemminga & Du-arte, 2000), due to their wide spatial distribution, essen-tial ecological role, and high sensitivity to anthropogenic disturbances. The indicator value of seagrasses has been clearly outlined in the WFD, thus being included among the four Biological Quality Elements (BQEs) that need to be monitored for the ecological classification of coastal waters (EC, 2000). In fact, the use of BQEs along with detailed knowledge of anthropogenic pressures and their impact on the coastal marine environment is fully rec-ommended by the WFD. The DPSIR (Driver, Pressure, State, Impact, Response) approach (IMPRESS, 2002) is the main framework used for determining pressures, im-pacts and responses under the WFD and is considered to
provide an overall mechanism for analysing environmen-tal problems (Borja et al., 2006).
The implementation of the WFD has led to the devel-opment of several biotic indices aiming to assess the re-sponse of marine communities to anthropogenic impacts (Marbà et al., 2012). The efficiency of biotic indices as classification and monitoring tools is mainly determined by their ability to identify the ecological quality objec-tives to be achieved and their ability to provide guidance to policy-makers and managers in planning adequate in-tervention policies to restore water quality (Bacci et al., 2013).
Posidonia oceanica (L.) Delile is the most common and abundant seagrass in the Mediterranean Sea, forming extensive meadows and playing a key ecological, geo-logical and economic role (Boudouresque et al., 2012). Due to its high sensitivity to environmental degradation and its responses to specific human-induced disturbances, P. oceanica is widely considered as an effective ecologi-cal indicator (Pergent et al., 1995; Ruiz & Romero 2001; Martínez-Crego et al., 2008; Boudouresque et al., 2012). Indeed, the indicator value of P. oceanica has been high-lighted through intercalibration exercises performed by the Mediterranean Geographical Intercalibration Group
Effectiveness of Posidonia oceanica biotic indices for assessing the ecological status of coastal waters in the Saronikos Gulf (Aegean Sea, Eastern Mediterranean)
V. GERAKARIS1,2, P. PANAYOTIDIS1, S. VIZZINI3, A. NICOLAIDOU2 and A. ECONOMOU-AMILLI2
1 Institute of Oceanography, Hellenic Centre for Marine Research, 19013 Anavyssos, Greece2 Department of Ecology & Systematics, Faculty of Biology, University of Athens, 15784 Athens, Greece
3 Department of Earth and Marine Sciences, University of Palermo, CoNISMa, Via Archirafi 18, 90123 Palermo, Italy
Corresponding author: [email protected]
Handling Editor: Sotiris Orfanidis
Received: 30 August 2016; Accepted: 15 February 2017; Published on line: 31 March 2017
Abstract
Biotic indices are considered key assessment tools in most national and European policies aimed at improving the quality of coastal waters. At present, several Water Framework Directive (WFD)-compliant biotic indices based on the marine angiosperm Posidonia oceanica have been developed and applied in the Mediterranean Sea. In this study, we investigated the effectiveness of four different P. oceanica indices (POMI, PREI, Valencian CS, and BiPo) in evaluating the ecological status of coastal waters in a case study area of Greece. The evaluation, comparison, and validation of the Ecological Status Class (ESC) assessments obtained by each index were based on a set of eight common sites that encompasses the maximum range of environmental quality in the study area. Four sampling sites separated by tens of km were chosen in each of the two water bodies (WBs) studied. The spatial variations of the features of P. oceanica meadows were examined according to a hierarchical sampling design across four spatial scales, ranging from metres to tens of km, using independent nested analysis of variance. Except for the BiPo index, the reference values for each metric/index were defined by the dataset available for the study area. All biotic indices classified the WBs of the study area in Good ESC category. Only three of the four indices (PREI, Valencian CS, and BiPo) showed high comparability in the assessment of ESC at study site level. It is assumed that the differences found in the remaining index (POMI) are due to the different type of metrics taken into consideration and the different weighting given to them. Our findings suggest that all indices can provide an overall view of the cumulative impact of multiple environmental stressors existing in the study area, and can thus help raise awareness of ecosystem degradation.
Keywords: Seagrass, Biotic index, Ecological status, Water Framework Directive, Eastern Mediterranean.
162 Medit. Mar. Sci., 18/1, 2017, 161-178
(MedGIG), where the species was selected as BQE rep-resentative of Mediterranean marine angiosperms for monitoring the ecological status of coastal waters (Med-GIG, 2007). Several biotic indices have been proposed to assess the ecological quality of coastal waters using P. oceanica (POMI: Romero et al., 2007; Valencian CS: Fernandez-Torquemada et al., 2008; PREI: Gobert et al., 2009; BiPo: Lopez y Royo et al., 2010). Most of P. oce-anica biotic indices are WFD-compliant, i.e. they meet a set of required criteria, including: (i) the expression of ecological status, called the Ecological Quality Ratio (EQR), as a numerical value between 0 and 1, (ii) the existence of a significant relationship between EQR and anthropogenic pressures, and (iii) the use of a common scale of five ecological status classes: High, Good, Mod-erate, Poor and Bad.
P. oceanica biotic indices has been used successfully mainly in the Western Mediterranean and the Adriatic Sea (central Mediterranean Sea) (Nicolic et al., 2009; Lopez y Royo et al., 2011; Mascaró et al., 2012; Costan-tino et al., 2015). In Greece, P. oceanica is the dominant seagrass species with a wide distribution along the coast-lines of the Ionian and Aegean Seas (Telesca et al., 2015). Indeed, P. oceanica meadows can be found from the very remote and pristine areas up to the most urbanized areas with significant human pressure. However, none of the proposed biotic indices has ever been applied in Greek seas or the wider area of the Eastern Mediterranean Sea.
In this context, the aim of this study was to evalu-ate the efficiency of P. oceanica biotic indices as clas-sification and monitoring tools in a case study area in the
Eastern Mediterranean Sea (Saronikos Gulf, Aegean Sea, Greece). To this end, the main objectives of our study include: (i) the application and comparison of four bi-otic indices (POMI, PREI, Valencian CS, and BiPo), (ii) the validation of the obtained results by correlating ESCs and anthropogenic pressures, and (iii) an overall evalua-tion of the performance of biotic indices and their useful-ness as monitoring tools.
Materials and Methods
Study areaThe Saronikos Gulf is a semi-enclosed embayment
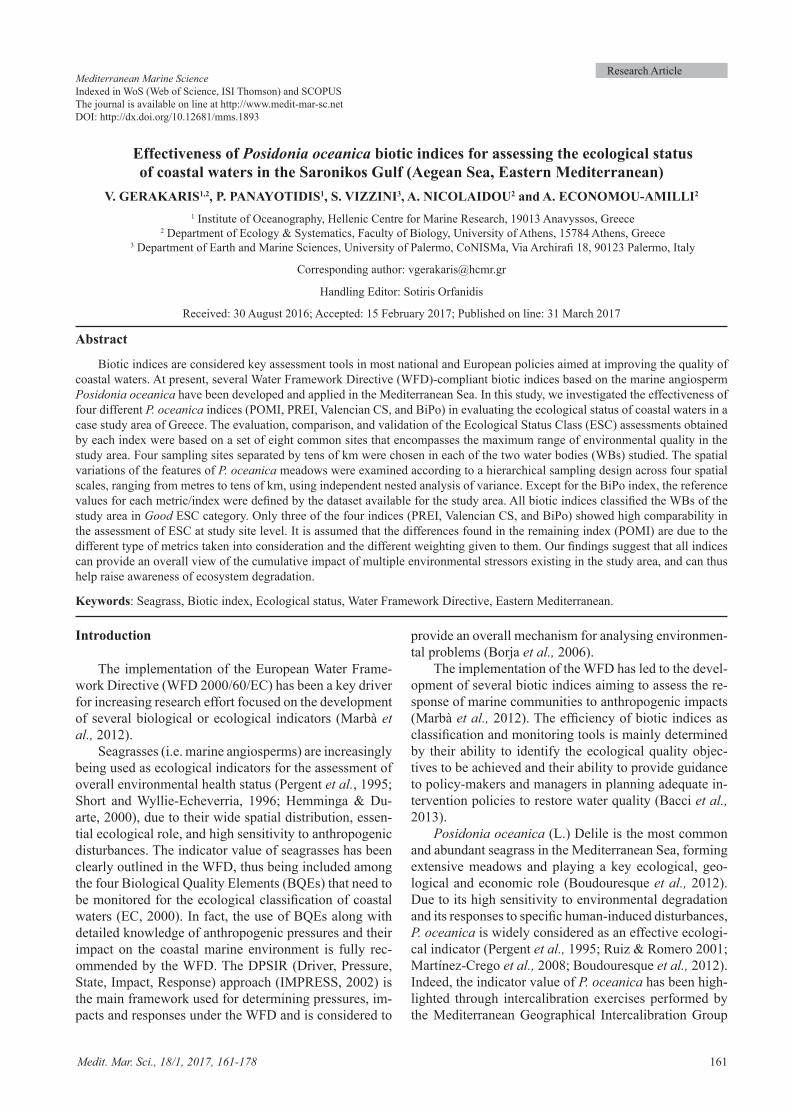
on the western coastline of the Aegean Sea in the Eastern Mediterranean (Fig. 1). The Gulf is characterised by sea surface temperatures (13-26 oC) and salinities (38-39 ‰) that are typical of the Eastern Mediterranean basin (Kon-toyiannis et al., 2005). The Gulf region exhibits very low rainfall rates throughout the year while the prevail-ing winds blow predominantly from the north (HNMS, 1999). Around the Gulf, there are ten river basins with one main river system (Kifissos River). However, these river basins have limited runoff to the coastal areas.
The main human activities that are considered to have major impacts on the marine environment of the study area include national and international shipping (the port of Piraeus is the third largest port in the Mediterranean in terms of container traffic), urbanization and extensive modification of the coastline (Athens metropolitan area: ca. 4 million inhabitants), industrial discharges, increas-
Fig. 1: Geographic location of the eight sampling sites along the coasts of Saronikos Gulf. The main river basins, main rivers and streams, and water bodies are also included on the map.
Medit. Mar. Sci., 18/1, 2017, 161-178 163
ing recreational and fishing activities, and urban sew-age discharges (Psittalia’s Waste Water Treatment Plant - WWTP).
Sewage discharge from Psittalia’s WWTP outfall, in particular, is considered as the main source of stress ex-erted on the marine ecosystem of the Gulf, and the effects have been monitored regularly for more than two dec-ades (Siokou et al., 1999; Simboura et al., 1995; 2005). Integrative studies on different aspects of the marine environment (benthic communities, macroalgae, chemi-cal compounds) indicate the presence of a clear environ-mental gradient along the coasts of the Saronikos Gulf (Simboura et al., 2005; 2014; Tsiamis et al., 2013). More specifically, earlier studies on the Ecological Quality Status (EQS) of the Saronikos Gulf indicated that water quality –especially in the inner part of the Gulf– presents a clear gradient from Poor to Good status, depending on the distance from Psittalia’s WWTP outfall (Simboura et al., 2005; 2014; Tsiamis et al., 2013).
Under the WFD monitoring plan, four distinct coast-al water bodies (WB) have been designated in the study area: “Inner (Central) Saronikos Gulf”, and “Inner (Cen-tral) Saronikos-Psittalia” as operational WB, i.e. WBs identified as being at risk of failing to meet their envi-ronmental objectives, and “Western Saronikos Gulf”, and “Outer Saronikos Gulf” as surveillance WB, i.e. WBs as-sessed for the likelihood of failing to meet their environ-mental objectives (Fig. 1) (HCMR, 2008). Definition of the boundaries of each WB was based on hydrological and geomorphological features (Coachman et al., 1976), as well as on the distribution of anthropogenic pressures along the coastal zone of the study area (HCMR, 2008).
However, the division of each WB was carried out irre-spective of the extent or ecological status of P. oceanica meadows within the study area.
P. oceanica meadows are absent in two of the four WBs (“Western Saronikos Gulf” and “Inner (Central) Sa-ronikos-Psittalia”) (Panayotidis & Simboura, 1989; au-thors’ personal observations). Therefore, the assessment of ESC was conducted only in the other two WBs (“Inner (Central) Saronikos Gulf” and “Outer Saronikos Gulf”). In the inner Saronikos Gulf, P. oceanica meadows colo-nize mostly sandy bottom with mild slopes, whereas, in the outer Saronikos Gulf, meadows extend both on sandy and rocky bottoms with moderate to high slopes.
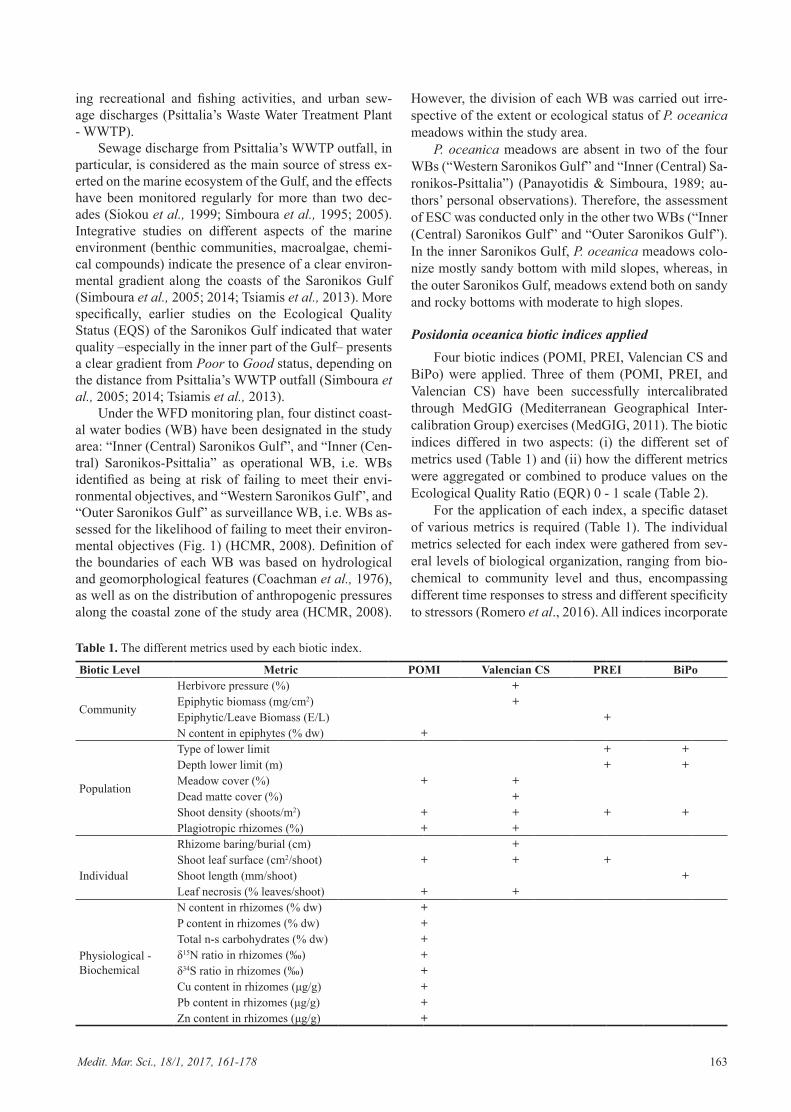
Posidonia oceanica biotic indices appliedFour biotic indices (POMI, PREI, Valencian CS and
BiPo) were applied. Three of them (POMI, PREI, and Valencian CS) have been successfully intercalibrated through MedGIG (Mediterranean Geographical Inter-calibration Group) exercises (MedGIG, 2011). The biotic indices differed in two aspects: (i) the different set of metrics used (Table 1) and (ii) how the different metrics were aggregated or combined to produce values on the Ecological Quality Ratio (EQR) 0 - 1 scale (Table 2).
For the application of each index, a specific dataset of various metrics is required (Table 1). The individual metrics selected for each index were gathered from sev-eral levels of biological organization, ranging from bio-chemical to community level and thus, encompassing different time responses to stress and different specificity to stressors (Romero et al., 2016). All indices incorporate
Table 1. The different metrics used by each biotic index.
Biotic Level Metric POMI Valencian CS PREI BiPo
Community
Herbivore pressure (%) + Epiphytic biomass (mg/cm2) +Epiphytic/Leave Biomass (E/L) +N content in epiphytes (% dw) +
Population
Type of lower limit + +Depth lower limit (m) + +Meadow cover (%) + +Dead matte cover (%) +Shoot density (shoots/m2) + + + +Plagiotropic rhizomes (%) + +
Rhizome baring/burial (cm) +
IndividualShoot leaf surface (cm2/shoot) + + +Shoot length (mm/shoot) +Leaf necrosis (% leaves/shoot) + +
Physiological - Biochemical
N content in rhizomes (% dw) +P content in rhizomes (% dw) +Total n-s carbohydrates (% dw) +δ15N ratio in rhizomes (‰) +δ34S ratio in rhizomes (‰) +Cu content in rhizomes (μg/g) +Pb content in rhizomes (μg/g) +Zn content in rhizomes (μg/g) +
164 Medit. Mar. Sci., 18/1, 2017, 161-178
metrics from individual, population and community lev-els while POMI also embodies metrics from biochemical and physiological levels (Table 1).
Concerning the integration or combination of metrics into a single index, two different approaches (classification methods) have been used. The BiPo and PREI indices are multimetric and thus the integration of their metrics into a single index is based on averaging the scores of the chosen individual metrics (Gobert et al., 2009; Lopez y Royo et al., 2010), while POMI and Valencian CS are considered as multivariate indices, since multivariate analysis meth-ods (e.g. Principal Component Analysis-PCA) are used for the aggregation of the metrics (Romero et al., 2007; Fernandez-Torquemada et al., 2008).
Regarding the POMI index, the isotopic ratio in rhi-zomes δ34S was not included in the current evaluation due to technical and logistic constraints. Still, according to Bennett et al. (2011), the classification precision of POMI is resilient enough in a reduced version as long as the different levels of organization are still represented. Reduced versions of POMI (POMI 9 and POMI 5) have
been previously applied and revealed consistent results compared to those of the initial POMI version (POMI 14) (Bennett et al., 2011; Mascaró et al., 2012).
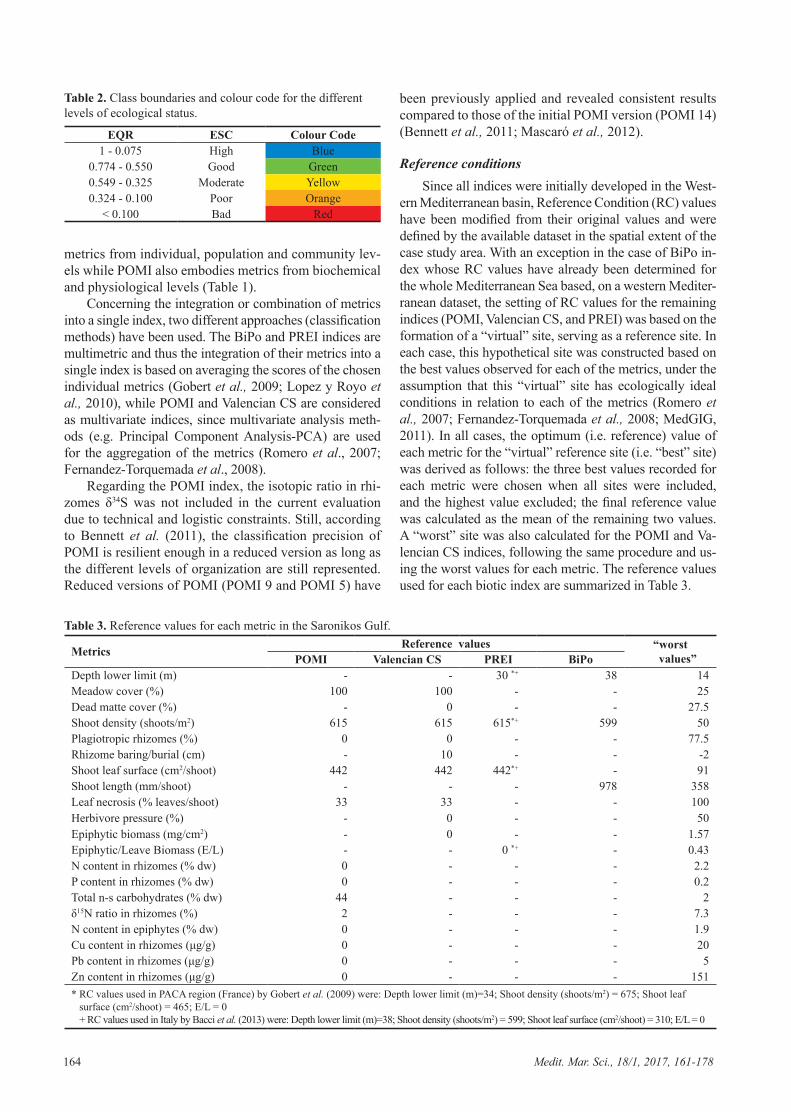
Reference conditionsSince all indices were initially developed in the West-
ern Mediterranean basin, Reference Condition (RC) values have been modified from their original values and were defined by the available dataset in the spatial extent of the case study area. With an exception in the case of BiPo in-dex whose RC values have already been determined for the whole Mediterranean Sea based, on a western Mediter-ranean dataset, the setting of RC values for the remaining indices (POMI, Valencian CS, and PREI) was based on the formation of a “virtual” site, serving as a reference site. In each case, this hypothetical site was constructed based on the best values observed for each of the metrics, under the assumption that this “virtual” site has ecologically ideal conditions in relation to each of the metrics (Romero et al., 2007; Fernandez-Torquemada et al., 2008; MedGIG, 2011). In all cases, the optimum (i.e. reference) value of each metric for the “virtual” reference site (i.e. “best” site) was derived as follows: the three best values recorded for each metric were chosen when all sites were included, and the highest value excluded; the final reference value was calculated as the mean of the remaining two values. A “worst” site was also calculated for the POMI and Va-lencian CS indices, following the same procedure and us-ing the worst values for each metric. The reference values used for each biotic index are summarized in Table 3.
Table 2. Class boundaries and colour code for the different levels of ecological status.
EQR ESC Colour Code1 - 0.075 High Blue
0.774 - 0.550 Good Green0.549 - 0.325 Moderate Yellow0.324 - 0.100 Poor Orange
< 0.100 Bad Red
Table 3. Reference values for each metric in the Saronikos Gulf.
Metrics Reference values “worst values”POMI Valencian CS PREI BiPo
Depth lower limit (m) - - 30 *+ 38 14Meadow cover (%) 100 100 - - 25Dead matte cover (%) - 0 - - 27.5Shoot density (shoots/m2) 615 615 615*+ 599 50Plagiotropic rhizomes (%) 0 0 - - 77.5Rhizome baring/burial (cm) - 10 - - -2Shoot leaf surface (cm2/shoot) 442 442 442*+ - 91Shoot length (mm/shoot) - - - 978 358Leaf necrosis (% leaves/shoot) 33 33 - - 100Herbivore pressure (%) - 0 - - 50Epiphytic biomass (mg/cm2) - 0 - - 1.57Epiphytic/Leave Biomass (E/L) - - 0 *+ - 0.43N content in rhizomes (% dw) 0 - - - 2.2P content in rhizomes (% dw) 0 - - - 0.2Total n-s carbohydrates (% dw) 44 - - - 2δ15N ratio in rhizomes (%) 2 - - - 7.3N content in epiphytes (% dw) 0 - - - 1.9Cu content in rhizomes (μg/g) 0 - - - 20Pb content in rhizomes (μg/g) 0 - - - 5Zn content in rhizomes (μg/g) 0 - - - 151* RC values used in PACA region (France) by Gobert et al. (2009) were: Depth lower limit (m)=34; Shoot density (shoots/m2) = 675; Shoot leaf
surface (cm2/shoot) = 465; E/L = 0+ RC values used in Italy by Bacci et al. (2013) were: Depth lower limit (m)=38; Shoot density (shoots/m2) = 599; Shoot leaf surface (cm2/shoot) = 310; E/L = 0
Medit. Mar. Sci., 18/1, 2017, 161-178 165
Sampling design and data acquisitionEight sampling sites were chosen encompassing the
maximum range of environmental quality in the study area. Four sites (Floisvos, Voula, Vouliagmeni, Aigina) located in the inner Saronikos Gulf and four sites (Lago-nissi, Anavyssos, Patroklos, Poros) in the outer Saronikos Gulf (Fig. 1). The study was conducted in August 2013, thus avoiding the possible masking effects of seasonal variability (Alcoverro et al., 1995; Vizzini et al., 2003).
The data required for the application of the indices was collected using a sampling protocol resulting from the com-bination of sampling methods used for the four indices.
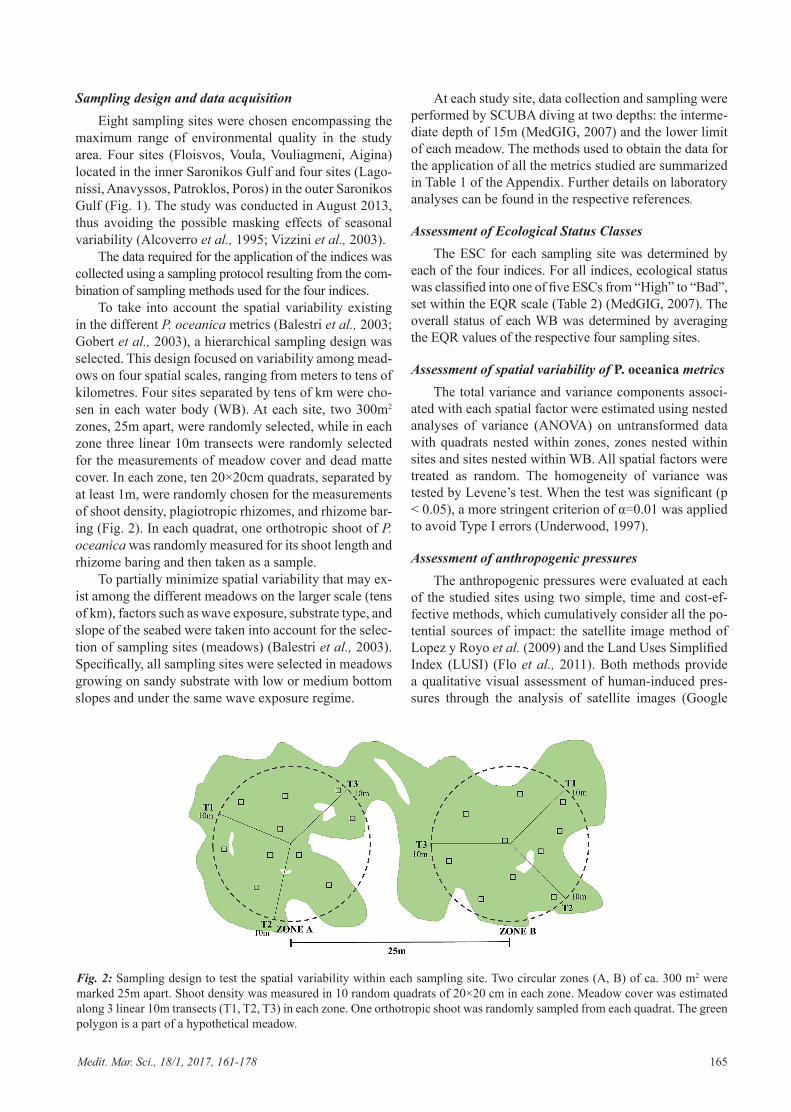
To take into account the spatial variability existing in the different P. oceanica metrics (Balestri et al., 2003; Gobert et al., 2003), a hierarchical sampling design was selected. This design focused on variability among mead-ows on four spatial scales, ranging from meters to tens of kilometres. Four sites separated by tens of km were cho-sen in each water body (WB). At each site, two 300m2
zones, 25m apart, were randomly selected, while in each zone three linear 10m transects were randomly selected for the measurements of meadow cover and dead matte cover. In each zone, ten 20×20cm quadrats, separated by at least 1m, were randomly chosen for the measurements of shoot density, plagiotropic rhizomes, and rhizome bar-ing (Fig. 2). In each quadrat, one orthotropic shoot of P. oceanica was randomly measured for its shoot length and rhizome baring and then taken as a sample.
To partially minimize spatial variability that may ex-ist among the different meadows on the larger scale (tens of km), factors such as wave exposure, substrate type, and slope of the seabed were taken into account for the selec-tion of sampling sites (meadows) (Balestri et al., 2003). Specifically, all sampling sites were selected in meadows growing on sandy substrate with low or medium bottom slopes and under the same wave exposure regime.
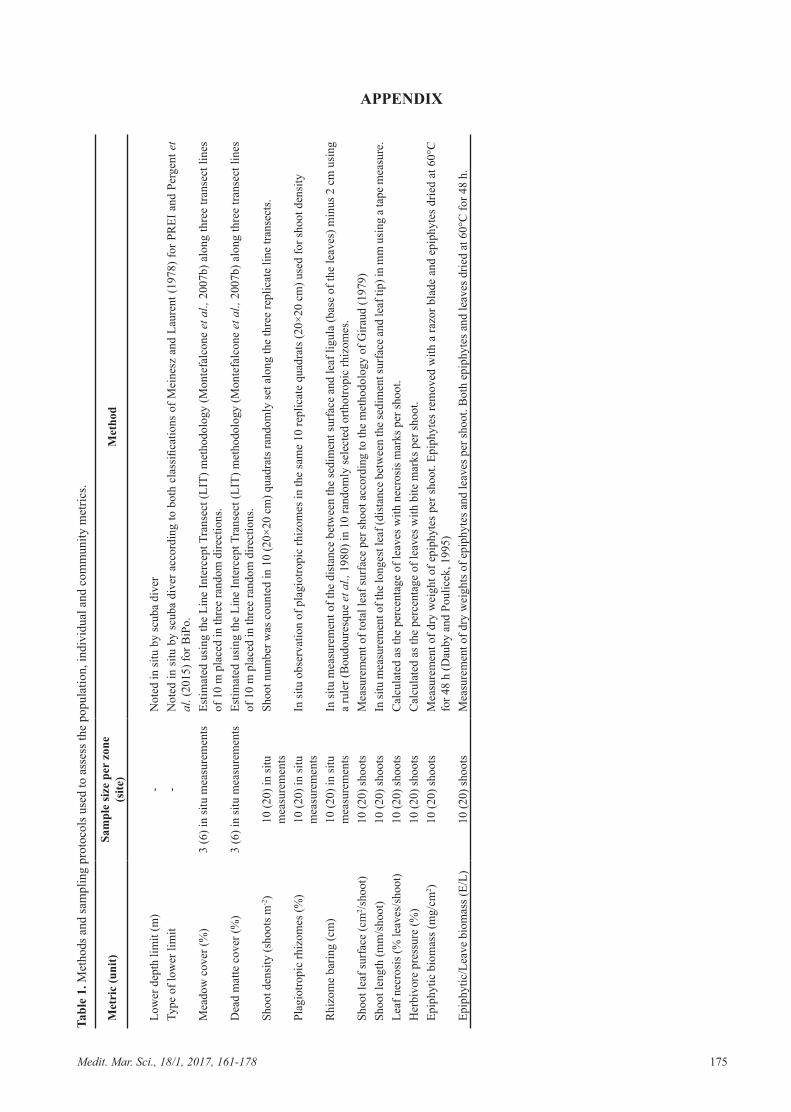
At each study site, data collection and sampling were performed by SCUBA diving at two depths: the interme-diate depth of 15m (MedGIG, 2007) and the lower limit of each meadow. The methods used to obtain the data for the application of all the metrics studied are summarized in Table 1 of the Appendix. Further details on laboratory analyses can be found in the respective references.
Assessment of Ecological Status ClassesThe ESC for each sampling site was determined by
each of the four indices. For all indices, ecological status was classified into one of five ESCs from “High” to “Bad”, set within the EQR scale (Table 2) (MedGIG, 2007). The overall status of each WB was determined by averaging the EQR values of the respective four sampling sites.
Assessment of spatial variability of P. oceanica metrics The total variance and variance components associ-
ated with each spatial factor were estimated using nested analyses of variance (ANOVA) on untransformed data with quadrats nested within zones, zones nested within sites and sites nested within WB. All spatial factors were treated as random. The homogeneity of variance was tested by Levene’s test. When the test was significant (p < 0.05), a more stringent criterion of α=0.01 was applied to avoid Type I errors (Underwood, 1997).
Assessment of anthropogenic pressuresThe anthropogenic pressures were evaluated at each
of the studied sites using two simple, time and cost-ef-fective methods, which cumulatively consider all the po-tential sources of impact: the satellite image method of Lopez y Royo et al. (2009) and the Land Uses Simplified Index (LUSI) (Flo et al., 2011). Both methods provide a qualitative visual assessment of human-induced pres-sures through the analysis of satellite images (Google
Fig. 2: Sampling design to test the spatial variability within each sampling site. Two circular zones (A, B) of ca. 300 m2 were marked 25m apart. Shoot density was measured in 10 random quadrats of 20×20 cm in each zone. Meadow cover was estimated along 3 linear 10m transects (T1, T2, T3) in each zone. One orthotropic shoot was randomly sampled from each quadrat. The green polygon is a part of a hypothetical meadow.
166 Medit. Mar. Sci., 18/1, 2017, 161-178
Earth, 2013) or land use map data (e.g. CORINE Land Cover 2000 database). The main types of pressure that have been taken into consideration in the method of Lopez y Royo et al. (2009) were: land use, industrial ac-tivity, river discharges, port activities and artificial struc-tures. Regarding the application of the LUSI index, we selected the LUSIsg version that takes into consideration indirect (land-based: urban, commercial and industrial, agriculture) and direct (sea-based: mariculture, sewage outfall, harbour) anthropogenic pressures within a 3 km radius (MedGIG, 2011).
Biotic indices comparabilityThe results obtained by each index were compared
pairwise both qualitatively and quantitatively. The qualita-tive comparison was performed using the absolute aver-age class difference (AACD), an indicator recommended by the WFD-GIG (EC, 2011). The criterion proposed to define sufficient comparability between classification sys-tems is that of less than a half class (0.5) difference (EC, 2011). The quantitative comparison was carried out using non-parametric Spearman’s rank correlation analysis be-tween the EQR values obtained by each method. The abil-ity of each biotic index to reflect human-induced pressures was also demonstrated using Spearman’s rank correlation analysis. Correlation analyses were conducted using sam-pling sites as replicates. All statistical analyses were per-formed using IBM SPSS Statistics 20 (IBM Corp., 2011).
Results
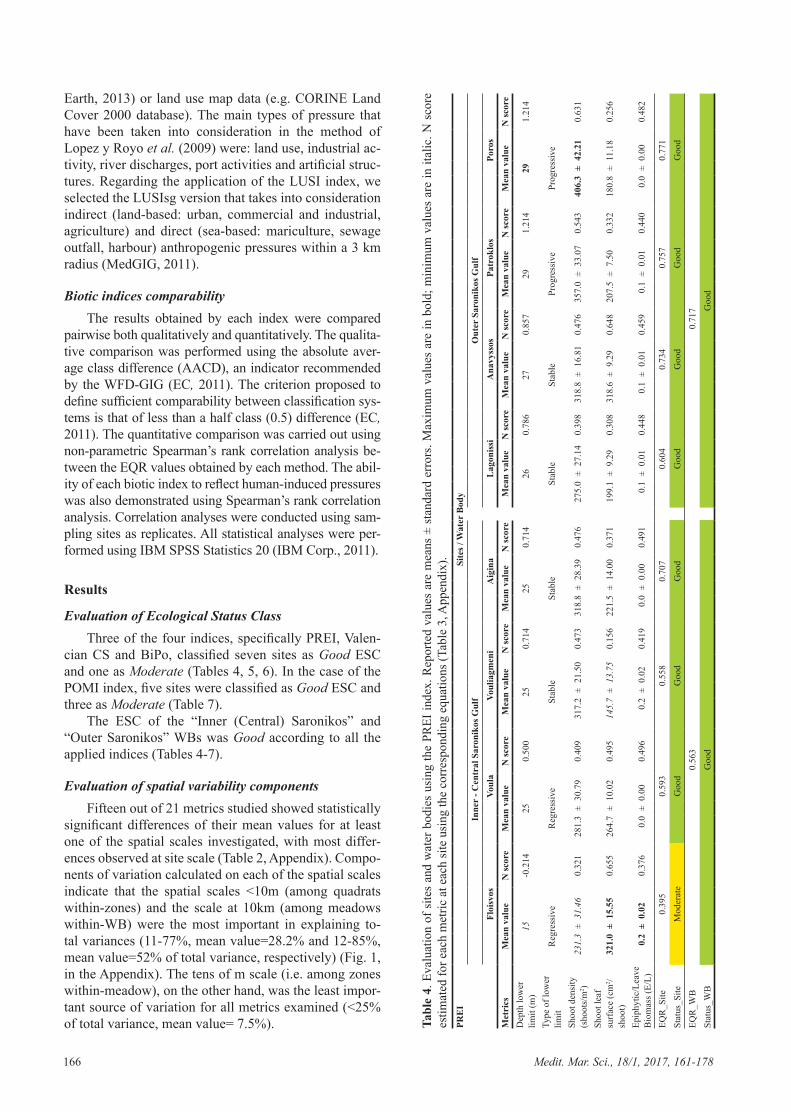
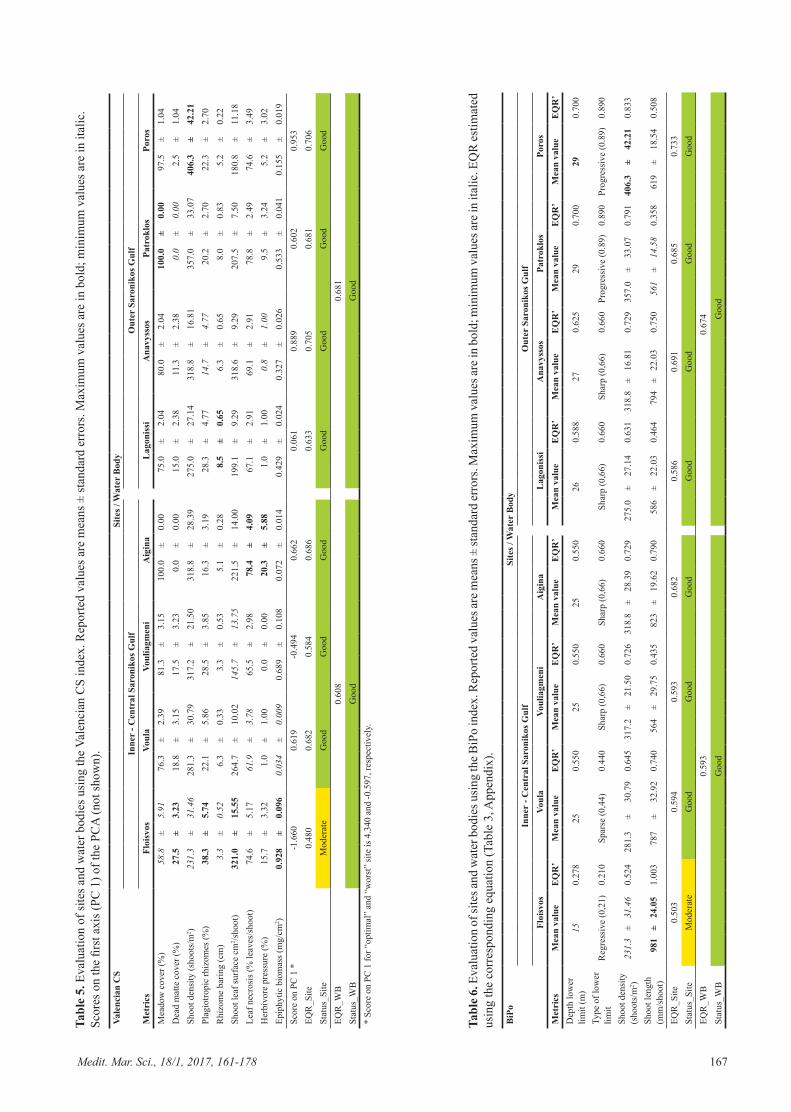
Evaluation of Ecological Status Class Three of the four indices, specifically PREI, Valen-
cian CS and BiPo, classified seven sites as Good ESC and one as Moderate (Tables 4, 5, 6). In the case of the POMI index, five sites were classified as Good ESC and three as Moderate (Table 7).
The ESC of the “Inner (Central) Saronikos” and “Outer Saronikos” WBs was Good according to all the applied indices (Tables 4-7).
Evaluation of spatial variability componentsFifteen out of 21 metrics studied showed statistically
significant differences of their mean values for at least one of the spatial scales investigated, with most differ-ences observed at site scale (Table 2, Appendix). Compo-nents of variation calculated on each of the spatial scales indicate that the spatial scales <10m (among quadrats within-zones) and the scale at 10km (among meadows within-WB) were the most important in explaining to-tal variances (11-77%, mean value=28.2% and 12-85%, mean value=52% of total variance, respectively) (Fig. 1, in the Appendix). The tens of m scale (i.e. among zones within-meadow), on the other hand, was the least impor-tant source of variation for all metrics examined (<25% of total variance, mean value= 7.5%). Ta
ble
4. E
valu
atio
n of
site
s an
d w
ater
bod
ies
usin
g th
e PR
EI in
dex.
Rep
orte
d va
lues
are
mea
ns ±
sta
ndar
d er
rors
. Max
imum
val
ues
are
in b
old;
min
imum
val
ues
are
in it
alic
. N s
core
es
timat
ed fo
r eac
h m
etric
at e
ach
site
usi
ng th
e co
rres
pond
ing
equa
tions
(Tab
le 3
, App
endi
x).
PRE
ISi
tes /
Wat
er B
ody
Inne
r - C
entr
al S
aron
ikos
Gul
f
O
uter
Sar
onik
os G
ulf
Fl
oisv
osVo
ula
Voul
iagm
eni
Aig
ina
Lag
onis
siA
navy
ssos
Patr
oklo
sPo
ros
Met
rics
Mea
n va
lue
N sc
ore
Mea
n va
lue
N sc
ore
Mea
n va
lue
N sc
ore
Mea
n va
lue
N sc
ore
Mea
n va
lue
N sc
ore
Mea
n va
lue
N sc
ore
Mea
n va
lue
N sc
ore
Mea
n va
lue
N sc
ore
Dep
th lo
wer
lim
it (m
)15
-0.2
1425
0.50
025
0.71
425
0.71
426
0.78
627
0.85
729
1.21
429
1.21
4
Type
of l
ower
lim
itR
egre
ssiv
eR
egre
ssiv
eSt
able
Stab
leSt
able
Stab
lePr
ogre
ssiv
ePr
ogre
ssiv
e
Shoo
t den
sity
(s
hoot
s/m
2 )23
1.3
±31
.46
0.32
128
1.3
±30
.79
0.40
931
7.2
±21
.50
0.47
331
8.8
±28
.39
0.47
627
5.0
±27
.14
0.39
831
8.8
±16
.81
0.47
635
7.0
±33
.07
0.54
340
6.3
±42
.21
0.63
1
Shoo
t lea
f su
rfac
e (c
m2 /
shoo
t)32
1.0
±15
.55
0.65
526
4.7
±10
.02
0.49
514
5.7
±13
.75
0.15
622
1.5
±14
.00
0.37
119
9.1
±9.
290.
308
318.
6±
9.29
0.64
820
7.5
±7.
500.
332
180.
8±
11.1
80.
256
Epip
hytic
/Lea
ve
Bio
mas
s (E/
L)0.
2±
0.02
0.37
60.
0±
0.00
0.49
60.
2±
0.02
0.41
90.
0±
0.00
0.49
1
0.1
±0.
010.
448
0.1
±0.
010.
459
0.1
±0.
010.
440
0.0
±0.
000.
482
EQR
_Site
0.39
50.
593
0.55
80.
707
0.60
40.
734
0.75
70.
771
Stat
us_S
iteM
oder
ate
Goo
dG
ood
Goo
d
Goo
dG
ood
Goo
dG
ood
EQR
_WB
0.56
30.
717
Stat
us_W
BG
ood
Goo
d
Medit. Mar. Sci., 18/1, 2017, 161-178 167
Tabl
e 5.
Eva
luat
ion
of si
tes a
nd w
ater
bod
ies u
sing
the
Vale
ncia
n C
S in
dex.
Rep
orte
d va
lues
are
mea
ns ±
stan
dard
err
ors.
Max
imum
val
ues a
re in
bol
d; m
inim
um v
alue
s are
in it
alic
. Sc
ores
on
the
first
axi
s (PC
1) o
f the
PC
A (n
ot sh
own)
.Va
lenc
ian
CS
Site
s / W
ater
Bod
yIn
ner
- Cen
tral
Sar
onik
os G
ulf
O
uter
Sar
onik
os G
ulf
Met
rics
Floi
svos
Voul
aVo
ulia
gmen
iA
igin
aL
agon
issi
Ana
vyss
osPa
trok
los
Poro
sM
eado
w c
over
(%)
58.8
±5.
9176
.3±
2.39
81.3
±3.
1510
0.0
±0.
0075
.0±
2.04
80.0
±2.
0410
0.0
±0.
0097
.5±
1.04
Dea
d m
atte
cov
er (%
)27
.5±
3.23
18.8
±3.
1517
.5±
3.23
0.0
±0.
0015
.0±
2.38
11.3
±2.
380.
0±
0.00
2.5
±1.
04Sh
oot d
ensi
ty (s
hoot
s/m
2 )23
1.3
±31
.46
281.
3±
30.7
931
7.2
±21
.50
318.
8±
28.3
927
5.0
±27
.14
318.
8±
16.8
135
7.0
±33
.07
406.
3±
42.2
1Pl
agio
tropi
c rh
izom
es (%
)38
.3±
5.74
22.1
±5.
8628
.5±
3.85
16.3
±3.
1928
.3±
4.77
14.7
±4.
7720
.2±
2.70
22.3
±2.
70R
hizo
me
barin
g (c
m)
3.3
±0.
526.
3±
0.33
3.3
±0.
535.
1±
0.28
8.5
±0.
656.
3±
0.65
8.0
±0.
835.
2±
0.22
Shoo
t lea
f sur
face
cm
2 /sho
ot)
321.
0±
15.5
526
4.7
±10
.02
145.
7±
13.7
522
1.5
±14
.00
199.
1±
9.29
318.
6±
9.29
207.
5±
7.50
180.
8±
11.1
8Le
af n
ecro
sis (
% le
aves
/sho
ot)
74.6
±5.
1761
.9±
3.78
65.5
±2.
9878
.4±
4.09
67.1
±2.
9169
.1±
2.91
78.8
±2.
4974
.6±
3.49
Her
bivo
re p
ress
ure
(%)
15.7
±3.
321.
0±
1.00
0.0
±0.
0020
.3±
5.88
1.0
±1.
000.
8±
1.00
9.5
±3.
245.
2±
3.02
Epip
hytic
bio
mas
s (m
g/cm
2 )0.
928
±0.
096
0.03
4±
0.00
90.
689
±0.
108
0.07
2±
0.01
4
0.42
9±
0.02
40.
327
±0.
026
0.53
3±
0.04
10.
155
±0.
019
Scor
e on
PC
1 *
-1.6
600.
619
-0.4
940.
662
0.06
10.
889
0.60
20.
953
EQR
_Site
0.48
00.
682
0.58
40.
686
0.63
30.
705
0.68
10.
706
Stat
us_S
iteM
oder
ate
Goo
dG
ood
Goo
d
Goo
dG
ood
Goo
dG
ood
EQR
_WB
0.60
80.
681
Stat
us_W
BG
ood
G
ood
* Sc
ore
on P
C 1
for “
optim
al”
and
“wor
st”
site
is 4
.340
and
-0.5
97, r
espe
ctiv
ely.
Tabl
e 6. E
valu
atio
n of
site
s and
wat
er b
odie
s usi
ng th
e BiP
o in
dex.
Rep
orte
d va
lues
are m
eans
± st
anda
rd er
rors
. Max
imum
val
ues a
re in
bol
d; m
inim
um v
alue
s are
in it
alic
. EQ
R es
timat
ed
usin
g th
e co
rres
pond
ing
equa
tion
(Tab
le 3
, App
endi
x).
BiP
oSi
tes /
Wat
er B
ody
Inne
r - C
entr
al S
aron
ikos
Gul
f
O
uter
Sar
onik
os G
ulf
Fl
oisv
osVo
ula
Voul
iagm
eni
Aig
ina
Lag
onis
siA
navy
ssos
Patr
oklo
sPo
ros
Met
rics
Mea
n va
lue
EQ
R’
Mea
n va
lue
EQ
R’
Mea
n va
lue
EQ
R’
Mea
n va
lue
EQ
R’
Mea
n va
lue
EQ
R’
Mea
n va
lue
EQ
R’
Mea
n va
lue
EQ
R’
Mea
n va
lue
EQ
R’
Dep
th lo
wer
lim
it (m
)15
0.27
825
0.55
025
0.55
025
0.55
026
0.58
827
0.62
529
0.70
029
0.70
0
Type
of l
ower
lim
itR
egre
ssiv
e (0
,21)
0.21
0Sp
arse
(0,4
4)0.
440
Shar
p (0
,66)
0.66
0Sh
arp
(0,6
6)0.
660
Shar
p (0
,66)
0.66
0Sh
arp
(0,6
6)0.
660
Prog
ress
ive
(0.8
9)0.
890
Prog
ress
ive
(0.8
9)0.
890
Shoo
t den
sity
(s
hoot
s/m
2 )23
1.3
±31
.46
0.52
428
1.3
±30
.79
0.64
531
7.2
±21
.50
0.72
631
8.8
±28
.39
0.72
927
5.0
±27
.14
0.63
131
8.8
±16
.81
0.72
935
7.0
±33
.07
0.79
140
6.3
±42
.21
0.83
3
Shoo
t len
gth
(mm
/sho
ot)
981
±24
.05
1.00
378
7±
32.9
20.
740
564
±29
.75
0.43
582
3±
19.6
20.
790
58
6±
22.0
30.
464
794
±22
.03
0.75
056
1±
14.5
80.
358
619
±18
.54
0.50
8
EQR
_Site
0.50
30.
594
0.59
30.
682
0.58
60.
691
0.68
50.
733
Stat
us_S
iteM
oder
ate
Goo
dG
ood
Goo
d
Goo
dG
ood
Goo
dG
ood
EQR
_WB
0.59
30.
674
Stat
us_W
BG
ood
Goo
d
168 Medit. Mar. Sci., 18/1, 2017, 161-178
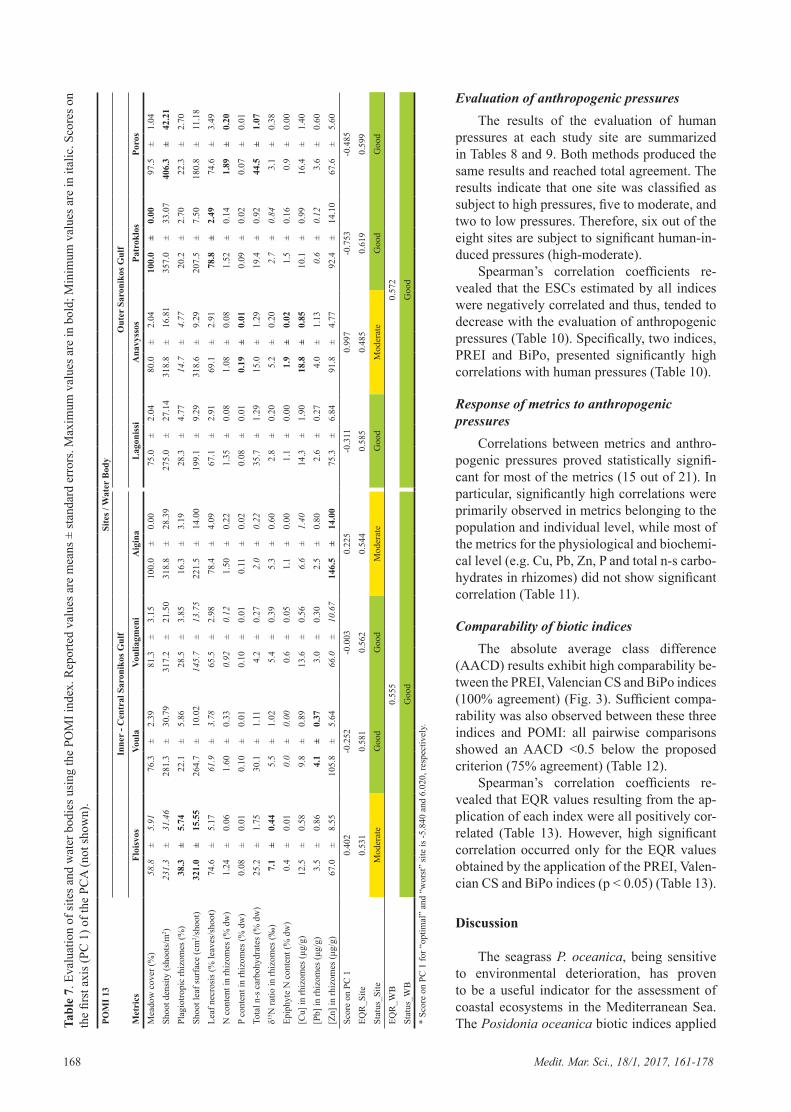
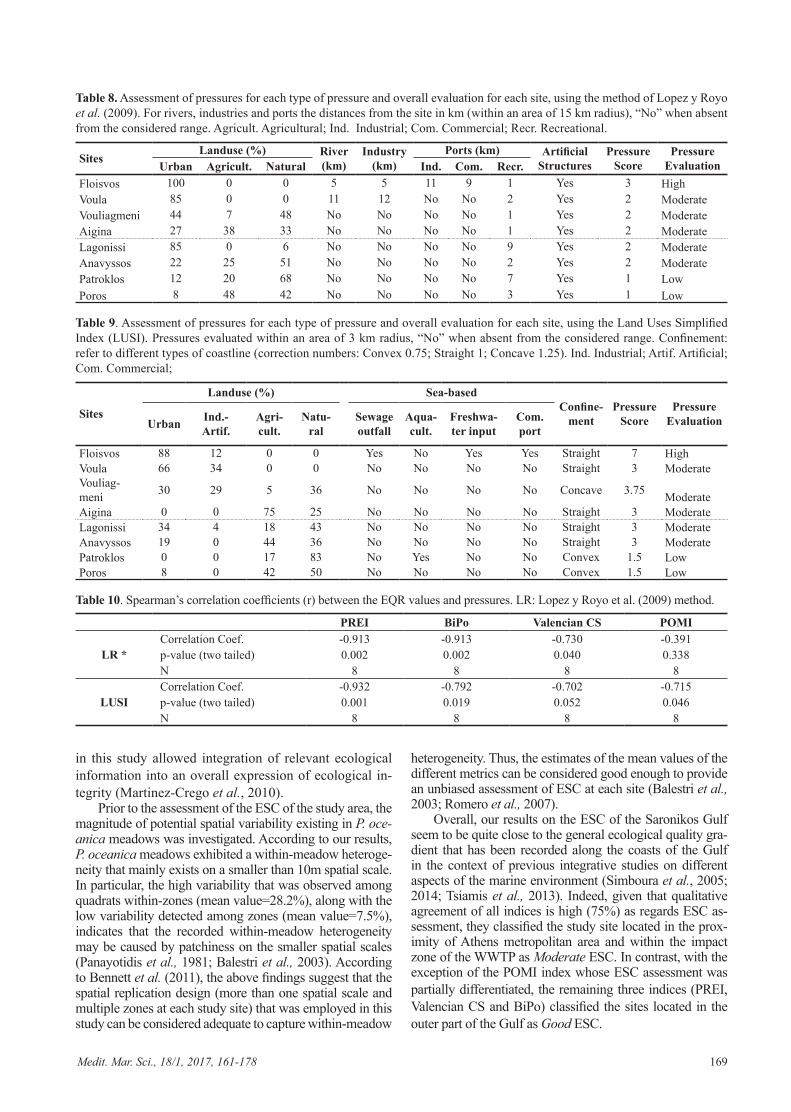
Evaluation of anthropogenic pressuresThe results of the evaluation of human
pressures at each study site are summarized in Tables 8 and 9. Both methods produced the same results and reached total agreement. The results indicate that one site was classified as subject to high pressures, five to moderate, and two to low pressures. Therefore, six out of the eight sites are subject to significant human-in-duced pressures (high-moderate).
Spearman’s correlation coefficients re-vealed that the ESCs estimated by all indices were negatively correlated and thus, tended to decrease with the evaluation of anthropogenic pressures (Table 10). Specifically, two indices, PREI and BiPo, presented significantly high correlations with human pressures (Table 10).
Response of metrics to anthropogenic pressures
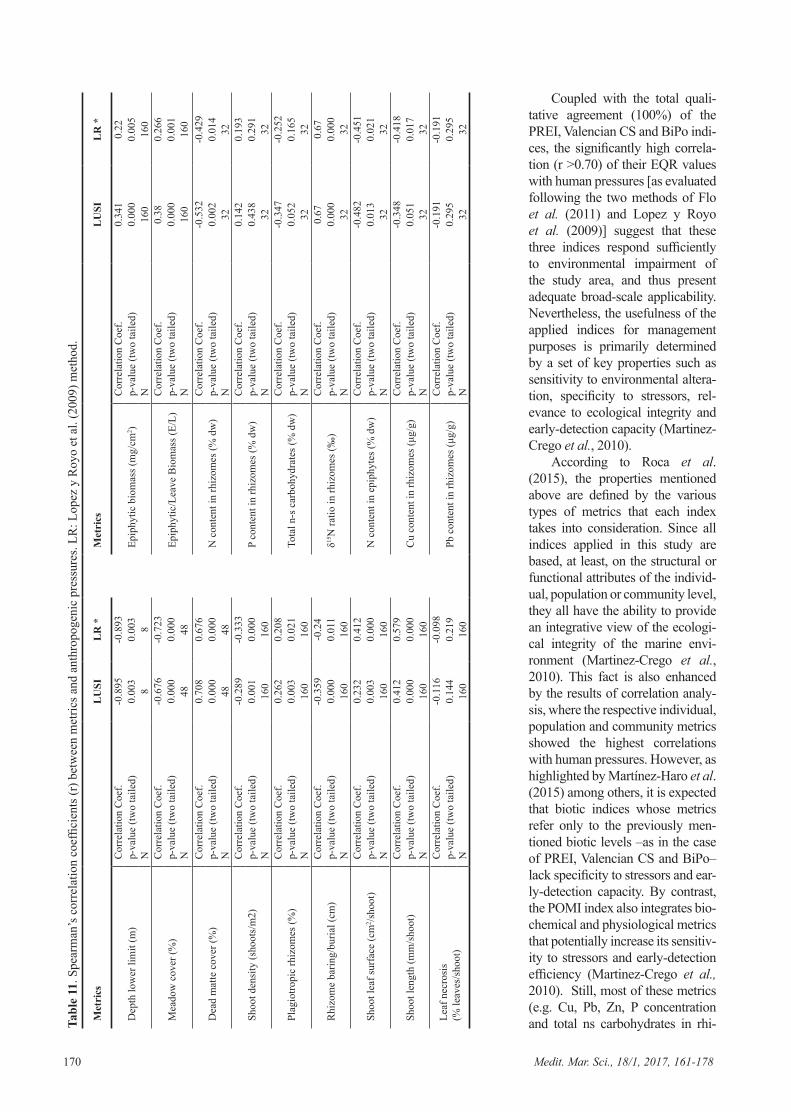
Correlations between metrics and anthro-pogenic pressures proved statistically signifi-cant for most of the metrics (15 out of 21). In particular, significantly high correlations were primarily observed in metrics belonging to the population and individual level, while most of the metrics for the physiological and biochemi-cal level (e.g. Cu, Pb, Zn, P and total n-s carbo-hydrates in rhizomes) did not show significant correlation (Table 11).
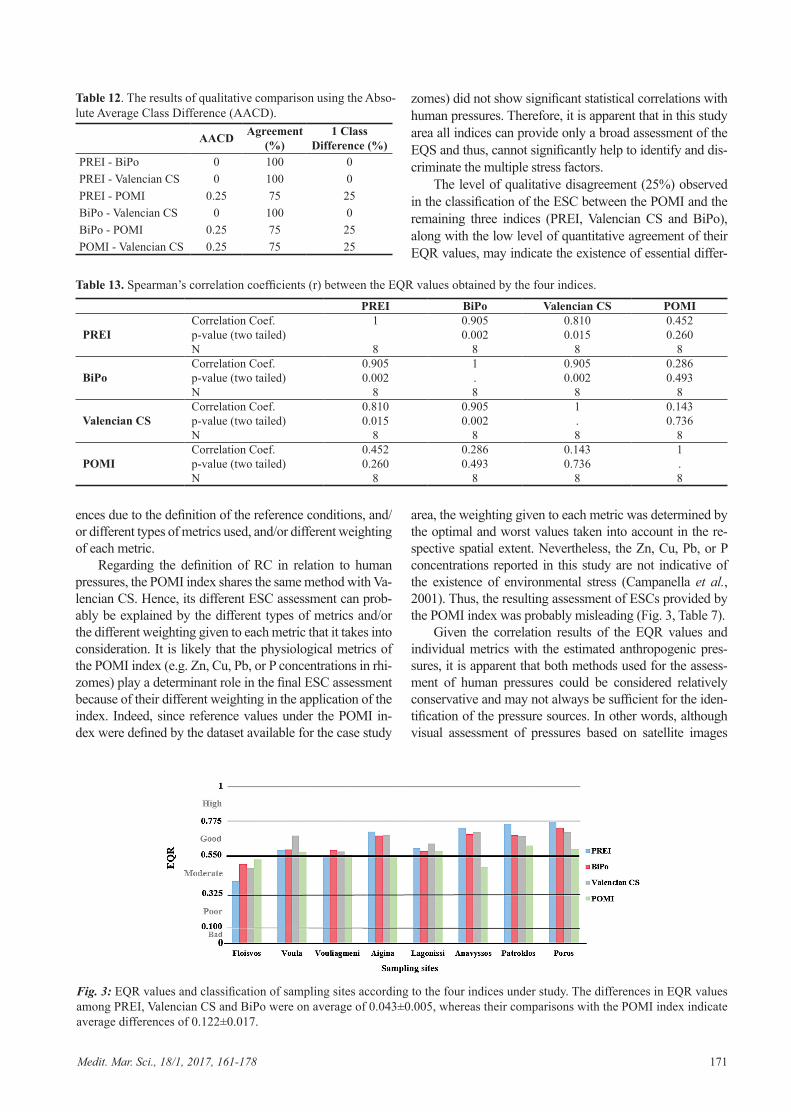
Comparability of biotic indicesThe absolute average class difference
(AACD) results exhibit high comparability be-tween the PREI, Valencian CS and BiPo indices (100% agreement) (Fig. 3). Sufficient compa-rability was also observed between these three indices and POMI: all pairwise comparisons showed an AACD <0.5 below the proposed criterion (75% agreement) (Table 12).
Spearman’s correlation coefficients re-vealed that EQR values resulting from the ap-plication of each index were all positively cor-related (Table 13). However, high significant correlation occurred only for the EQR values obtained by the application of the PREI, Valen-cian CS and BiPo indices (p < 0.05) (Table 13).
Discussion
The seagrass P. oceanica, being sensitive to environmental deterioration, has proven to be a useful indicator for the assessment of coastal ecosystems in the Mediterranean Sea. The Posidonia oceanica biotic indices applied Ta
ble
7. E
valu
atio
n of
site
s and
wat
er b
odie
s usi
ng th
e PO
MI i
ndex
. Rep
orte
d va
lues
are
mea
ns ±
stan
dard
err
ors.
Max
imum
val
ues a
re in
bol
d; M
inim
um v
alue
s are
in it
alic
. Sco
res o
n th
e fir
st a
xis (
PC 1
) of t
he P
CA
(not
show
n).
POM
I 13
Site
s / W
ater
Bod
yIn
ner
- Cen
tral
Sar
onik
os G
ulf
O
uter
Sar
onik
os G
ulf
Met
rics
Floi
svos
Voul
aVo
ulia
gmen
iA
igin
aL
agon
issi
Ana
vyss
osPa
trok
los
Poro
sM
eado
w c
over
(%)
58.8
±5.
9176
.3±
2.39
81.3
±3.
1510
0.0
±0.
0075
.0±
2.04
80.0
±2.
0410
0.0
±0.
0097
.5±
1.04
Shoo
t den
sity
(sho
ots/
m2 )
231.
3±
31.4
628
1.3
±30
.79
317.
2±
21.5
031
8.8
±28
.39
275.
0±
27.1
431
8.8
±16
.81
357.
0±
33.0
740
6.3
±42
.21
Plag
iotro
pic
rhiz
omes
(%)
38.3
±5.
7422
.1±
5.86
28.5
±3.
8516
.3±
3.19
28.3
±4.
7714
.7±
4.77
20.2
±2.
7022
.3±
2.70
Shoo
t lea
f sur
face
(cm
2 /sho
ot)
321.
0±
15.5
526
4.7
±10
.02
145.
7±
13.7
522
1.5
±14
.00
199.
1±
9.29
318.
6±
9.29
207.
5±
7.50
180.
8±
11.1
8Le
af n
ecro
sis (
% le
aves
/sho
ot)
74.6
±5.
1761
.9±
3.78
65.5
±2.
9878
.4±
4.09
67.1
±2.
9169
.1±
2.91
78.8
±2.
4974
.6±
3.49
N c
onte
nt in
rhiz
omes
(% d
w)
1.24
±0.
061.
60±
0.33
0.92
±0.
121.
50±
0.22
1.35
±0.
081.
08±
0.08
1.52
±0.
141.
89±
0.20
P co
nten
t in
rhiz
omes
(% d
w)
0.08
±0.
010.
10±
0.01
0.10
±0.
010.
11±
0.02
0.08
±0.
010.
19±
0.01
0.09
±0.
020.
07±
0.01
Tota
l n-s
car
bohy
drat
es (%
dw
)25
.2±
1.75
30.1
±1.
114.
2±
0.27
2.0
±0.
2235
.7±
1.29
15.0
±1.
2919
.4±
0.92
44.5
±1.
07δ15
N ra
tio in
rhiz
omes
(‰)
7.1
±0.
445.
5±
1.02
5.4
±0.
395.
3±
0.60
2.8
±0.
205.
2±
0.20
2.7
±0.
843.
1±
0.38
Epip
hyte
N c
onte
nt (%
dw
)0.
4±
0.01
0.0
±0.
000.
6±
0.05
1.1
±0.
001.
1±
0.00
1.9
±0.
021.
5±
0.16
0.9
±0.
00[C
u] in
rhiz
omes
(μg/
g)12
.5±
0.58
9.8
±0.
8913
.6±
0.56
6.6
±1.
4014
.3±
1.90
18.8
±0.
8510
.1±
0.99
16.4
±1.
40[P
b] in
rhiz
omes
(μg/
g)3.
5±
0.86
4.1
±0.
373.
0±
0.30
2.5
±0.
802.
6±
0.27
4.0
±1.
130.
6±
0.12
3.6
±0.
60[Z
n] in
rhiz
omes
(μg/
g)67
.0±
8.55
105.
8±
5.64
66.0
±10
.67
146.
5±
14.0
0
75.3
±6.
8491
.8±
4.77
92.4
±14
.10
67.6
±5.
60Sc
ore
on P
C 1
0.40
2-0
.252
-0.0
030.
225
-0.3
110.
997
-0.7
53-0
.485
EQR
_Site
0.53
10.
581
0.56
20.
544
0.58
50.
485
0.61
90.
599
Stat
us_S
iteM
oder
ate
Goo
dG
ood
Mod
erat
e
Goo
dM
oder
ate
Goo
dG
ood
EQR
_WB
0.55
50.
572
Stat
us_W
BG
ood
G
ood
* Sc
ore
on P
C 1
for “
optim
al”
and
“wor
st”
site
is -5
.840
and
6.0
20, r
espe
ctiv
ely.
Medit. Mar. Sci., 18/1, 2017, 161-178 169
in this study allowed integration of relevant ecological information into an overall expression of ecological in-tegrity (Martinez-Crego et al., 2010).
Prior to the assessment of the ESC of the study area, the magnitude of potential spatial variability existing in P. oce-anica meadows was investigated. According to our results, P. oceanica meadows exhibited a within-meadow heteroge-neity that mainly exists on a smaller than 10m spatial scale. In particular, the high variability that was observed among quadrats within-zones (mean value=28.2%), along with the low variability detected among zones (mean value=7.5%), indicates that the recorded within-meadow heterogeneity may be caused by patchiness on the smaller spatial scales (Panayotidis et al., 1981; Balestri et al., 2003). According to Bennett et al. (2011), the above findings suggest that the spatial replication design (more than one spatial scale and multiple zones at each study site) that was employed in this study can be considered adequate to capture within-meadow
heterogeneity. Thus, the estimates of the mean values of the different metrics can be considered good enough to provide an unbiased assessment of ESC at each site (Balestri et al., 2003; Romero et al., 2007).
Overall, our results on the ESC of the Saronikos Gulf seem to be quite close to the general ecological quality gra-dient that has been recorded along the coasts of the Gulf in the context of previous integrative studies on different aspects of the marine environment (Simboura et al., 2005; 2014; Tsiamis et al., 2013). Indeed, given that qualitative agreement of all indices is high (75%) as regards ESC as-sessment, they classified the study site located in the prox-imity of Athens metropolitan area and within the impact zone of the WWTP as Moderate ESC. In contrast, with the exception of the POMI index whose ESC assessment was partially differentiated, the remaining three indices (PREI, Valencian CS and BiPo) classified the sites located in the outer part of the Gulf as Good ESC.
Table 8. Assessment of pressures for each type of pressure and overall evaluation for each site, using the method of Lopez y Royo et al. (2009). For rivers, industries and ports the distances from the site in km (within an area of 15 km radius), “No” when absent from the considered range. Agricult. Agricultural; Ind. Industrial; Com. Commercial; Recr. Recreational.
Sites Landuse (%) River
(km)Industry
(km)Ports (km) Artificial
StructuresPressure
ScorePressure
EvaluationUrban Agricult. Natural Ind. Com. Recr.Floisvos 100 0 0 5 5 11 9 1 Yes 3 HighVoula 85 0 0 11 12 No No 2 Yes 2 ModerateVouliagmeni 44 7 48 No No No No 1 Yes 2 ModerateAigina 27 38 33 No No No No 1 Yes 2 ModerateLagonissi 85 0 6 No No No No 9 Yes 2 ModerateAnavyssos 22 25 51 No No No No 2 Yes 2 ModeratePatroklos 12 20 68 No No No No 7 Yes 1 LowPoros 8 48 42 No No No No 3 Yes 1 Low
Table 9. Assessment of pressures for each type of pressure and overall evaluation for each site, using the Land Uses Simplified Index (LUSI). Pressures evaluated within an area of 3 km radius, “No” when absent from the considered range. Confinement: refer to different types of coastline (correction numbers: Convex 0.75; Straight 1; Concave 1.25). Ind. Industrial; Artif. Artificial; Com. Commercial;
Sites
Landuse (%) Sea-basedConfine-
mentPressure
ScorePressure
EvaluationUrban Ind.- Artif.
Agri-cult.
Natu-ral Sewage
outfallAqua-cult.
Freshwa-ter input
Com. port
Floisvos 88 12 0 0 Yes No Yes Yes Straight 7 HighVoula 66 34 0 0 No No No No Straight 3 ModerateVouliag-meni 30 29 5 36 No No No No Concave 3.75 ModerateAigina 0 0 75 25 No No No No Straight 3 ModerateLagonissi 34 4 18 43 No No No No Straight 3 ModerateAnavyssos 19 0 44 36 No No No No Straight 3 ModeratePatroklos 0 0 17 83 No Yes No No Convex 1.5 LowPoros 8 0 42 50 No No No No Convex 1.5 Low
Table 10. Spearman’s correlation coefficients (r) between the EQR values and pressures. LR: Lopez y Royo et al. (2009) method.
PREI BiPo Valencian CS POMI
LR * Correlation Coef. -0.913 -0.913 -0.730 -0.391p-value (two tailed) 0.002 0.002 0.040 0.338N 8 8 8 8
LUSI Correlation Coef. -0.932 -0.792 -0.702 -0.715p-value (two tailed) 0.001 0.019 0.052 0.046N 8 8 8 8
170 Medit. Mar. Sci., 18/1, 2017, 161-178
Coupled with the total quali-tative agreement (100%) of the PREI, Valencian CS and BiPo indi-ces, the significantly high correla-tion (r >0.70) of their EQR values with human pressures [as evaluated following the two methods of Flo et al. (2011) and Lopez y Royo et al. (2009)] suggest that these three indices respond sufficiently to environmental impairment of the study area, and thus present adequate broad-scale applicability. Nevertheless, the usefulness of the applied indices for management purposes is primarily determined by a set of key properties such as sensitivity to environmental altera-tion, specificity to stressors, rel-evance to ecological integrity and early-detection capacity (Martinez-Crego et al., 2010).
According to Roca et al. (2015), the properties mentioned above are defined by the various types of metrics that each index takes into consideration. Since all indices applied in this study are based, at least, on the structural or functional attributes of the individ-ual, population or community level, they all have the ability to provide an integrative view of the ecologi-cal integrity of the marine envi-ronment (Martinez-Crego et al., 2010). This fact is also enhanced by the results of correlation analy-sis, where the respective individual, population and community metrics showed the highest correlations with human pressures. However, as highlighted by Martínez-Haro et al. (2015) among others, it is expected that biotic indices whose metrics refer only to the previously men-tioned biotic levels –as in the case of PREI, Valencian CS and BiPo– lack specificity to stressors and ear-ly-detection capacity. By contrast, the POMI index also integrates bio-chemical and physiological metrics that potentially increase its sensitiv-ity to stressors and early-detection efficiency (Martinez-Crego et al., 2010). Still, most of these metrics (e.g. Cu, Pb, Zn, P concentration and total ns carbohydrates in rhi-Ta
ble
11. S
pear
man
’s c
orre
latio
n co
effic
ient
s (r)
bet
wee
n m
etric
s and
ant
hrop
ogen
ic p
ress
ures
. LR
: Lop
ez y
Roy
o et
al.
(200
9) m
etho
d.
Met
rics
LU
SIL
R *
Met
rics
LU
SIL
R *
Dep
th lo
wer
lim
it (m
)C
orre
latio
n C
oef.
-0.8
95-0
.893
Epip
hytic
bio
mas
s (m
g/cm
2 )C
orre
latio
n C
oef.
0.34
10.
22p-
valu
e (tw
o ta
iled)
0.00
30.
003
p-va
lue
(two
taile
d)0.
000
0.00
5N
88
N16
016
0
Mea
dow
cov
er (%
)C
orre
latio
n C
oef.
-0.6
76-0
.723
Epip
hytic
/Lea
ve B
iom
ass (
E/L)
Cor
rela
tion
Coe
f.0.
380.
266
p-va
lue
(two
taile
d)0.
000
0.00
0p-
valu
e (tw
o ta
iled)
0.00
00.
001
N48
48N
160
160
Dea
d m
atte
cov
er (%
)C
orre
latio
n C
oef.
0.70
80.
676
N c
onte
nt in
rhiz
omes
(% d
w)
Cor
rela
tion
Coe
f.-0
.532
-0.4
29p-
valu
e (tw
o ta
iled)
0.00
00.
000
p-va
lue
(two
taile
d)0.
002
0.01
4N
4848
N32
32
Shoo
t den
sity
(sho
ots/
m2)
Cor
rela
tion
Coe
f.-0
.289
-0.3
33P
cont
ent i
n rh
izom
es (%
dw
)C
orre
latio
n C
oef.
0.14
20.
193
p-va
lue
(two
taile
d)0.
001
0.00
0p-
valu
e (tw
o ta
iled)
0.43
80.
291
N16
016
0N
3232
Plag
iotro
pic
rhiz
omes
(%)
Cor
rela
tion
Coe
f.0.
262
0.20
8To
tal n
-s c
arbo
hydr
ates
(% d
w)
Cor
rela
tion
Coe
f.-0
.347
-0.2
52p-
valu
e (tw
o ta
iled)
0.00
30.
021
p-va
lue
(two
taile
d)0.
052
0.16
5N
160
160
N32
32
Rhi
zom
e ba
ring/
buria
l (cm
)C
orre
latio
n C
oef.
-0.3
59-0
.24
δ15N
ratio
in rh
izom
es (‰
)C
orre
latio
n C
oef.
0.67
0.67
p-va
lue
(two
taile
d)0.
000
0.01
1p-
valu
e (tw
o ta
iled)
0.00
00.
000
N16
016
0N
3232
Shoo
t lea
f sur
face
(cm
2 /sho
ot)
Cor
rela
tion
Coe
f.0.
232
0.41
2N
con
tent
in e
piph
ytes
(% d
w)
Cor
rela
tion
Coe
f.-0
.482
-0.4
51p-
valu
e (tw
o ta
iled)
0.00
30.
000
p-va
lue
(two
taile
d)0.
013
0.02
1N
160
160
N32
32
Shoo
t len
gth
(mm
/sho
ot)
Cor
rela
tion
Coe
f.0.
412
0.57
9C
u co
nten
t in
rhiz
omes
(μg/
g)C
orre
latio
n C
oef.
-0.3
48-0
.418
p-va
lue
(two
taile
d)0.
000
0.00
0p-
valu
e (tw
o ta
iled)
0.05
10.
017
N16
016
0N
3232
Leaf
nec
rosi
s
(% le
aves
/sho
ot)
Cor
rela
tion
Coe
f.-0
.116
-0.0
98Pb
con
tent
in rh
izom
es (μ
g/g)
Cor
rela
tion
Coe
f.-0
.191
-0.1
91p-
valu
e (tw
o ta
iled)
0.14
40.
219
p-va
lue
(two
taile
d)0.
295
0.29
5N
160
160
N32
32
Medit. Mar. Sci., 18/1, 2017, 161-178 171
zomes) did not show significant statistical correlations with human pressures. Therefore, it is apparent that in this study area all indices can provide only a broad assessment of the EQS and thus, cannot significantly help to identify and dis-criminate the multiple stress factors.
The level of qualitative disagreement (25%) observed in the classification of the ESC between the POMI and the remaining three indices (PREI, Valencian CS and BiPo), along with the low level of quantitative agreement of their EQR values, may indicate the existence of essential differ-
Table 13. Spearman’s correlation coefficients (r) between the EQR values obtained by the four indices.
PREI BiPo Valencian CS POMI
PREICorrelation Coef. 1 0.905 0.810 0.452p-value (two tailed) 0.002 0.015 0.260N 8 8 8 8
BiPoCorrelation Coef. 0.905 1 0.905 0.286p-value (two tailed) 0.002 . 0.002 0.493N 8 8 8 8
Valencian CSCorrelation Coef. 0.810 0.905 1 0.143p-value (two tailed) 0.015 0.002 . 0.736N 8 8 8 8
POMICorrelation Coef. 0.452 0.286 0.143 1p-value (two tailed) 0.260 0.493 0.736 .N 8 8 8 8
Table 12. The results of qualitative comparison using the Abso-lute Average Class Difference (AACD).
AACD Agreement (%)
1 Class Difference (%)
PREI - BiPo 0 100 0PREI - Valencian CS 0 100 0PREI - POMI 0.25 75 25BiPo - Valencian CS 0 100 0BiPo - POMI 0.25 75 25POMI - Valencian CS 0.25 75 25
Fig. 3: EQR values and classification of sampling sites according to the four indices under study. The differences in EQR values among PREI, Valencian CS and BiPo were on average of 0.043±0.005, whereas their comparisons with the POMI index indicate average differences of 0.122±0.017.
ences due to the definition of the reference conditions, and/or different types of metrics used, and/or different weighting of each metric.
Regarding the definition of RC in relation to human pressures, the POMI index shares the same method with Va-lencian CS. Hence, its different ESC assessment can prob-ably be explained by the different types of metrics and/or the different weighting given to each metric that it takes into consideration. It is likely that the physiological metrics of the POMI index (e.g. Zn, Cu, Pb, or P concentrations in rhi-zomes) play a determinant role in the final ESC assessment because of their different weighting in the application of the index. Indeed, since reference values under the POMI in-dex were defined by the dataset available for the case study
area, the weighting given to each metric was determined by the optimal and worst values taken into account in the re-spective spatial extent. Nevertheless, the Zn, Cu, Pb, or P concentrations reported in this study are not indicative of the existence of environmental stress (Campanella et al., 2001). Thus, the resulting assessment of ESCs provided by the POMI index was probably misleading (Fig. 3, Table 7).
Given the correlation results of the EQR values and individual metrics with the estimated anthropogenic pres-sures, it is apparent that both methods used for the assess-ment of human pressures could be considered relatively conservative and may not always be sufficient for the iden-tification of the pressure sources. In other words, although visual assessment of pressures based on satellite images
172 Medit. Mar. Sci., 18/1, 2017, 161-178
or land uses is considered adequate and evaluates human-induced pressures on the coastal environment reliably, not all sources of pressure or special conditions that may oc-cur only at local scale were taken into consideration. Both methods used could be considered reliable only in terms of broad assessment (Lopez y Royo et al., 2009; Bacci et al., 2013). The use of an enriched with water and sediment key abiotic factors dataset may thus be useful for both an ac-curate identification of all sources of impact that can affect the meadows of the study area, and discrimination between pressures (Lopez y Royo et al., 2009; Bacci et al., 2013).
Additionally, Lopez y Royo et al. (2009) noted the need for more precise identification of pressures in the case of classifications where EQR values are close to the bound-ary of Good/Moderate ecological status (EQR=0.550), as observed at the sites of Vouliagmeni and Aigina when clas-sified by the POMI index. In such cases, the risk of misclas-sification is significantly high (up to 50%) (Bennett et al., 2011); hence, it is possible that they have been subjected to pressures shifting their ESC from Good to Moderate (Lopez y Royo et al., 2009).
Our results on the classification of WBs (Good status for both WBs: “Inner-Central Saronikos Gulf” and “Outer Saronikos Gulf”) are not completely consistent with a previ-ous integrative classification of the Gulf by Simboura et al. (2014). Specifically, the classification of the “Inner-Central Saronikos Gulf” WB as Good ESC by all indices proved less conservative than the classification given by other BQEs (macroalgae, macroinvertebrates), which classified the WB as Moderate ESC.
The fact that the WBs of the study area are subject to several sources of anthropogenic pressures indicates that the ESC assessment based on P. oceanica biotic indices should be considered accordingly (Mascaro et al., 2012). In such cases, it is possible that the effects of human pressures are unevenly distributed among the different P. oceanica mead-ows in each WB. This widens the natural variability among meadows within a WB, and thus potentially increases the level of uncertainty of the ESC classification of P. oceanica meadows (Mascaro et al., 2012).
As also noted by Mascaro et al. (2012), such high levels of variability among meadows within a WB might be due to either a high natural heterogeneity of meadows or a possi-ble inadequate definition of the spatial extent and number of WBs in the study area. Indeed, the spatial replication design used in this study revealed the existence of spatial hetero-geneity on the larger spatial scale (tens of km: among sites (meadows) within a WB). It is possible that an adequate spatial replication design could capture the extra variability caused by anthropogenic pressures. However, the differ-ences in mean EQR values among different meadows of the same WB were high (e.g. PREI: 0.395 - 0.707 in WB “Inner Central Saronikos”), and a greater replication effort will not be able to reduce the uncertainty associated with the classification system (Mascaro et al., 2012). A possible re-definition of the spatial extent and the number of WBs in the study area may therefore be needed to ensure that the clas-
sification of the spatial extent of coastal WBs adequately re-flects their water quality and the human pressures to which the coastline is exposed (EC, 2000; Mascaro et al., 2012). Nevertheless, the EQR values obtained by all indices for the “Inner-Central Saronikos Gulf” WB are close to the bound-ary of Good/Moderate ecological status (EQR=0.550). This different classification of P.oceanica biotic indices may be due to the significantly high (up to 50%) risk of misclassifi-cation that exists in such cases (Bennett et al., 2011).
In conclusion, the P. oceanica biotic indices examined in this study provided a broad assessment of the ecologi-cal quality status of the Saronikos Gulf’s coastal waters. Our findings suggest that only three out of the four indices (PREI, Valencian CS and BiPo) can provide an overall view of the cumulative impact of multiple environmental stres-sors existing at two different spatial scales (site, WB) in the study area, and can thus help raise awareness of ecosystem degradation. In comparison, the fourth index (POMI) pro-vided a corresponding assessment of environmental impair-ment only at WB spatial scale.
Moreover, it is apparent that our results regarding the broad assessment of ecological quality status and human-induced pressures in the study area cannot adequately sup-port the determination of the appropriate remedial actions to be implemented by decision-makers and managers. Hence, precise estimation of human-induced pressures and iden-tification of their sources proved to be a critical point for validating the effectiveness of the indices for both ESC as-sessment and decision-making.
Still, it should be noted that our findings are based on a single case study, where the actual dataset on P. oceanica used for the evaluation of biotic indices is rather limited, particularly regarding the availability of data from critically degraded meadows (belonging to the Poor ESC). There-fore, it is evident that further research on the application of P. oceanica biotic indices in different case studies with known environmental gradients in the Aegean and Ionian Seas could contribute significantly to drawing conclusions on the larger scale of the Eastern Mediterranean basin.
Acknowledgements
We are very grateful to Dr. K. Tsiamis, Y. Issaris, P. Lardi and N. Katsiaras for their valuable assistance in the field and the laboratory. Also, we would like to thank the two anonymous reviewers and the editor for their useful comments on the manuscript.
References
Alcoverro, T., Duarte, C.M., Romero, J., 1995. Annual growth dynamics of Posidonia oceanica: Contribution of large-scale versus local factors to seasonality. Marine Ecology Progress Series, 120, 203-210.
Bacci, T., Rende, S.F., Penna, M., Trabucco, B., Montefalcone, M. et al., 2013. A methodological approach to understand
Medit. Mar. Sci., 18/1, 2017, 161-178 173
functional relationships between ecological indices and human-induced pressures: the case of the Posidonia oce-anica meadows. Journal of Environmental Management, 129, 540-547.
Balestri, E., Cinelli, F., Lardicci, C., 2003. Spatial variation in Posidonia oceanica structural, morphological and dynam-ic features in a northwestern Mediterranean coastal area: a multi-scale analysis. Marine Ecology Progress Series, 250, 51-60.
Bennett, S., Roca, G., Romero, J., Alcoverro, T., 2011. Ecologi-cal status of seagrass ecosystems: An uncertainty analysis of the meadow classification based on the Posidonia oce-anica multivariate index (POMI). Marine Pollution Bulle-tin, 62, 1616-1621.
Borja, A., Galparsoro, I., Solaun, O., Muxika, I., Tello, E.M. et al., 2006. The European Water Framework Directive and the DPSIR, a methodological approach to assess the risk of failing to achieve good ecological status. Estuarine Coas-tal Shelf Science, 66 (1-2), 84-96.
Boudouresque, C.F., Bernard, G., Bonhomme, P., Charbonnel, E., Diviacco, G. et al., 2012. Protection and conservation of Posidonia oceanica meadows. RAMOGE, RAC/SPA and GIS Posidonie publications, Marseilles, 202 pp.
Campanella, L., Conti, M.E., Cubadda, F., Sucapane, C., 2001. Trace metals in seagrass, algae and molluscs from an un-contaminated area in the Mediterranean. Environmental Pollution, 11, 117-126.
Coachman, L. K., Hopkins, T. S., Dugdale, R. C., 1976. Water masses of the Saronikos Gulf in winter. Acta Adriatica, 18, 131-161.
Costantino, G., Ungaro, N., Blonda, M., Mariani, M., Battista, D. et al., 2015. Recent monitoring data of Posidonia oce-anica meadows distributed along the Apulian coasts (East-ern-Central Mediterranean Sea) according to the 2000/60 EC Directive. PeerJ PrePrints, 3, 14-19.
Dauby, P., Poulicek, M., 1995. Methods for removing epi-phytes from seagrasses: SEM observations on treated leaves. Aquatic Botany, 52, 217-228.
EC, 2000. Directive 2000/60/EC of the European Parliament and of the Council, of 23 October 2000, establishing a framework for Community action in the field of Water Policy. Official Journal of the European Communities L327, 72 pp.
EC, 2011. Common Implementation Strategy for the Water Framework Directive (2000/60/EC). Guidance Document 14. Guidance on the Intercalibration Process 2008-2011. Official Publications of the European Communities, Lux-embourg (2011).
Fernandez-Torquemada, Y., Diaz-Valdes, M., Colilla, F., Luna, B., Sanchez-Lizaso, J.L. et al., 2008. Descriptors from Posidonia oceanica (L.) Delile meadows in coastal wa-ters of Valencia, Spain, in the context of the EU Water Framework Directive. ICES Journal of Marine Science, 65, 1492-1497.
Flo, E., Camp, J., Garcés, E., 2011. Assessment pressure meth-odology: Land Uses Simplified Index (LUSI). Work docu-Work docu-ment, Catalonia, Spain.
Giraud, G., 1979. Sur une méthode de mesure et de comptage des structures foliares de Posidonia oceanica (Linné) Delile. Bulletin du Muséum national d’histoire Naturelle Marseille, 39, 33-39.
Gobert, S., Kyramarios, M., Lepoint, G., Pergent-Martini, C., Bouquegneau, J.M., 2003. Variations at different spatial scales of Posidonia oceanica (L.) Delile beds; effects on the physico-chemical parameters of the sediment. Ocea-nologica Acta, 26,199-207.
Gobert, S., Sartoretto, S B., Rico-Raimondino, V.C., Andral, B., Chery, A.D. et al., 2009. Assessment of the ecological status of Mediterranean French coastal waters as required by the Water Framework Directive using the Posidonia oceanica Rapid Easy Index: PREI. Marine Pollution Bul-letin, 58 (11), 1727-1733.
Google Earth 7.1. 2013. Saronikos Gulf, Greece 51°42’39.17”N, 0°26’11.30”W, elevation 60M.<http://www.google.com/earth/index.html> [Viewed 1 August 2013].
Hemminga, M.A., Duarte, C.M. (Eds), 2000. Seagrass Ecol-ogy. Cambridge University Press, Cambridge, United Kingdom, 298 pp.
HNMS (Hellenic National Meteorological Service), 1999. Cli-matic data of the Greek network. Volume A, period 1955-1998 (in Greek), Athens, Greece.
HCMR (Hellenic Centre for Marine Research), 2008. Devel-opment of the monitoring network for the ecological sta-tus quality of the inland, transitional and coastal waters of Greece - Classification of their ecological quality status. Typo-characteristic reference conditions. Development of a monitoring network according to the WFD 2000/60/EE. HCMR-MINENV. Coordination of Coastal & Transitional waters part. Scientific responsible for Coastal waters part. Technical Report, (In Greek).
IMPRESS, 2002. Guidance for the analysis of pressures and impacts in accordance with the Water Framework Direc-tive. Common Implementation Strategy Working Group 2.1. Office for Official Publications of the European Com-munities, 156 pp.
Kontoyiannis, H., Krestenitis, I., Petihakis, G., Tsirtsis, G., 2005. Coastal areas: circulation and hydrological features. p. 95-103. In: State of the Hellenic marine environment. Papathanassiou, E., Zenetos, A. (Eds.), HCMR, Athens.
Lopez y Royo, C., Silvestri, C., Pergent, G., Casazza, G., 2009. Assessing human-induced pressures on coastal areas with publicly available data. Journal of Environmental Man-agement, 90, 1494–501.
Lopez y Royo, C., Silvestri, C., Salivas-Decaux, M., Pergent, G., Casazza, G., 2009. Application of an angiosperm-based classification system BiPO to Mediterranean coastal waters: Using spatial analysis and data on metal contami-nation of plants in identifying sources of pressure. Hydro-biologia, 633, 169-179.
Lopez y Royo, C., Casazza, G., Pergent-Martini, C., Pergent, G., 2010. A biotic index using the seagrass Posidonia oce-anica (BiPo), to evaluate ecological status of coastal wa-ters. Ecological Indicators, 10, 380-389.
Lopez y Royo, C., Pergent, G., Alcoverro, T., Buia, M.-C., Casazza, G. et al., 2011. The seagrass Posidonia oceanica as indicator of coastal water quality: Experimental inter-calibration of classification systems. Ecological Indica-tors, 11, 557-563.
Marbà, N., Krause-Jensen, D., Alcoverro, T., Birk, S., Peder-sen, A. et al., 2012. Diversity of European seagrass indi-cators: patterns within and across regions. Hydrobiologia, 704 (1), 265-278.
174 Medit. Mar. Sci., 18/1, 2017, 161-178
Martínez-Crego, B., Vergés, A., Alcoverro, T., Romero, J., 2008. Selection of multiple seagrass indicators for envi-Selection of multiple seagrass indicators for envi-ronmental biomonitoring. Marine Ecology Progress Se-ries, 361, 93-109.
Martínez-Crego, B., Alcoverro, T., Romero, J., 2010. Biotic in-dices for assessing the status of coastal waters: a review of strengths and weaknesses. Journal of environmental moni-toring, 12 (5), 1013-1028.
Martinez-Haro, M., Beiras, R., Bellas, J., Capela, R., Coelho, J.P. et al., 2015. A review on the ecological quality sta-tus assessment in aquatic systems using community-based indicators and ecotoxicological tools: What might be the added value of their combination? Ecological Indicators, 48, 8-16.
Mascaro, O., Bennett, S., Marba, N., Nikolić, V., Romero, J. et al., 2012. Uncertainty analysis along the ecological quality status of water bodies: the response of the Posidonia oce-anica multivariate index (POMI) in three Mediterranean regions. Marine Pollution Bulletin, 64 (5), 926-931.
MedGIG, 2007. WFD Intercalibration technical report for coastal and transitional waters in the Mediterranean ecore-gion. In: WFD Intercalibration Technical Report - Part 3: Coastal and Transitional waters. EU-JRC, Ispra, 342 pp.
MedGIG, 2011. WFD Intercalibration technical report for coastal and transitional waters in the Mediterranean ecore-gion. In: WFD Intercalibration Phase 2: Milestone 5 re-port: Coastal Waters, Marine Angiosperms. EU-JRC, 22 pp.
Meinesz, A., Laurent, R., 1978. Cartographie et état de la li-mite inférieure de l’herbier de Posidonia oceanica dans les Alpes-maritimes (France). Campagne Poséıdon 1976. Botanica Marina, 21 (8), 513-526.
Montefalcone, M., Albertelli, G., Morri, C., Bianchi, C.N., 2007b. Urban seagrass: status of Posidonia oceanica fac-ing the Genoa city water-front (Italy) and implications for management. Marine Pollution Bulletin, 54, 206-213.
Nikolić, V., Despalatović, M., Alcoverro, T., Romero, J., Antolić, B. et al., 2009. First classification of coastal wa-ters in the central Adriatic Sea using Posidonia oceanica as bioindicator of water quality. p. 53. In: Proceedings of the Mediterranean Seagrass Workshop 09, Hvar, Croatia.
Panayotidis, P., Boudouresque, C.F., Marcot-Coqueugniot, J., 1981. Microstructure de l’herbier de Posidonia oceanica (Linnaeus) Delile. Botanica Marina, 24 (3), 115–124.
Panayotidis, P., Simboura, N., 1989. Distribution and phenolo-gy of Posidonia oceanica in Saronikos Gulf (Aegean Sea, Greece). p. 43-48. In: Boudouresque, C.F., Meinesz, A., Fresi, E., Gravez, V., (Eds), 2nd International Workshop on Posidonia oceanica Beds, Ischia, Italy.
Pergent, G., Pergent-Martini, C., Boudouresque, C.F., 1995. Utilisation nde l’herbier a Posidonia oceanica comme in-dicateur biologique de la qualite du milieu littoral en Me-diterranee: Etat des connaissances. Mesogee, 54, 3-27.
Pergent, G., Pergent-Martini, C., Bein, A., Dedeken, M., Ober-ti, P. et al., 2015. Dynamic of Posidonia oceanica seagrass meadows in the northwestern Mediterranean: Could cli-mate change be to blame? Comptes Rendus Biologies, 338, 484-493.
Roca, G., Alcoverro, T., de Torres, M., Manzanera, M., Mar-tínez-Crego, B. et al., 2015. Detecting water quality im-Detecting water quality im-provement along the Catalan coast (Spain) using stress-specific biochemical seagrass indicators. Ecological Indi-cators, 54, 161-170.
Romero, J., Martínez-Crego, B., Alcoverro, T., Pérez, M., 2007. A multivariate index based on the seagrass Posidonia oce-anica (POMI) to assess the ecological status of coastal wa-ters under the water framework directive (WFD). Marine Pollution Bulletin, 55, 196-204.
Romero, J., Alcoverro, T., Roca, G., Pérez, M., 2016. Bioindi-Bioindi-cators, Monitoring, and Management Using Mediterranean Seagrasses: What Have We Learned from the Implementa-tion of the EU Water Framework Directive? p. 161-182. In: Experiences from Ground, Coastal, and Transitional Water Quality Monitoring: The EU Water Framework Directive Implementation in the Catalan River Basin Dis-trict (Part II). Munné, A., Ginebreda, A., Prat, N. (Eds.). Springer International Publishing, Cham.
Ruiz, J. M., Romero, J., 2001. Effects of in situ experimental shading on the Mediterranean seagrass Posidonia oceani-ca. Marine Ecology Progress Series, 215, 107-120.
Short, F., Willie-Echeverria, S., 1996 Natural and human-in-duced disturbance of seagrasses. Environmental Conser-vation, 23, 17-27.
Simboura, N., Zenetos, A., Panayotidis, P., Makra, A., 1995. Changes in benthic Community structure along an envi-ronmental pollution gradient. Marine Pollution Bulletin, 30 (7), 470-474.
Simboura, N., Panayotidis, P., Papathanassiou, E., 2005. A synthesis of the biological quality elements for the imple-mentation of the European Water Framework Directive in the Mediterranean ecoregion: The case of Saronikos Gulf. Ecological Indicators, 5 (3), 253-266.
Simboura, N., Zenetos, A., Pancucci-Papadopoulou, M., 2014. Benthic community indicators over a long period of moni-toring (2000-2012) of the Saronikos Gulf, Greece, Eastern Mediterranean. Environmental monitoring and assess-ment, 186 (6), 3809-3821.
Siokou-Fragou, I., and collaborators, 1999. Monitoring of the Saronikos Gulf ecosystem affected by the Psittalia Sea outfalls (1998–1999). In: Hellenic Centre for Marine Re-search (HCMR). Siokou-Fragou, I., (Ed.), Technical Re-port, Greece, 338 pp.
Telesca, L., Belluscio, A., Criscoli, A., Ardizzone, G., Apos-tolaki, E.T. et al., 2015. Seagrass meadows (Posidonia oceanica) distribution and trajectories of change. Scientific Reports, 5, 12505.
Tsiamis, K., Panayotidis, P., Economou-Amilli, A., Katsaros, C., 2013. Macroalgal community response to re-oligo-Macroalgal community response to re-oligo-trophication in Saronikos Gulf. Marine Ecology Progress Series, 472, 73-85.
Underwood, A.J., 1997. Experiments in ecology: their logi-cal design and interpretation using analyses of variance. Cambridge University Press, Cambridge, 504 pp.
Vizzini, S., Sarà, G., Mateo, M. A., Mazzola, A., 2003. δ13C and δ15N variability in Posidonia oceanica associated with sea-sonality and plant fraction. Aquatic Botany, 76, 195-202..
Medit. Mar. Sci., 18/1, 2017, 161-178 175
Tabl
e 1.
Met
hods
and
sam
plin
g pr
otoc
ols u
sed
to a
sses
s the
pop
ulat
ion,
indi
vidu
al a
nd c
omm
unity
met
rics.
Met
ric
(uni
t)Sa
mpl
e si
ze p
er z
one
(site
)M
etho
d
Lo
wer
dep
th li
mit
(m)
-N
oted
in si
tu b
y sc
uba
dive
rTy
pe o
f low
er li
mit
-N
oted
in s
itu b
y sc
uba
dive
r acc
ordi
ng to
bot
h cl
assi
ficat
ions
of M
eine
sz a
nd L
aure
nt (1
978)
for P
REI
and
Per
gent
et
al. (
2015
) for
BiP
o.M
eado
w c
over
(%)
3
(6) i
n si
tu m
easu
rem
ents
Estim
ated
usi
ng th
e Li
ne In
terc
ept T
rans
ect (
LIT)
met
hodo
logy
(Mon
tefa
lcon
e et
al.,
200
7b) a
long
thre
e tra
nsec
t lin
es
of 1
0 m
pla
ced
in th
ree
rand
om d
irect
ions
. D
ead
mat
te c
over
(%)
3 (6
) in
situ
mea
sure
men
tsEs
timat
ed u
sing
the
Line
Inte
rcep
t Tra
nsec
t (LI
T) m
etho
dolo
gy (M
onte
falc
one
et a
l., 2
007b
) alo
ng th
ree
trans
ect l
ines
of
10
m p
lace
d in
thre
e ra
ndom
dire
ctio
ns.
Shoo
t den
sity
(sho
ots m
-2)
10 (2
0) in
situ
m
easu
rem
ents
Shoo
t num
ber w
as c
ount
ed in
10
(20×
20 c
m) q
uadr
ats r
ando
mly
set a
long
the
thre
e re
plic
ate
line
trans
ects
.
Plag
iotro
pic
rhiz
omes
(%)
10 (2
0) in
situ
m
easu
rem
ents
In si
tu o
bser
vatio
n of
pla
giot
ropi
c rh
izom
es in
the
sam
e 10
repl
icat
e qu
adra
ts (2
0×20
cm
) use
d fo
r sho
ot d
ensi
ty
Rhi
zom
e ba
ring
(cm
)10
(20)
in si
tu
mea
sure
men
tsIn
situ
mea
sure
men
t of t
he d
ista
nce
betw
een
the
sedi
men
t sur
face
and
leaf
ligu
la (b
ase
of th
e le
aves
) min
us 2
cm
usi
ng
a ru
ler (
Bou
dour
esqu
e et
al.,
198
0) in
10
rand
omly
sele
cted
orth
otro
pic
rhiz
omes
. Sh
oot l
eaf s
urfa
ce (c
m2 /s
hoot
)10
(20)
shoo
tsM
easu
rem
ent o
f tot
al le
af su
rfac
e pe
r sho
ot a
ccor
ding
to th
e m
etho
dolo
gy o
f Gira
ud (1
979)
Shoo
t len
gth
(mm
/sho
ot)
10 (2
0) sh
oots
In si
tu m
easu
rem
ent o
f the
long
est l
eaf (
dist
ance
bet
wee
n th
e se
dim
ent s
urfa
ce a
nd le
af ti
p) in
mm
usi
ng a
tape
mea
sure
.Le
af n
ecro
sis (
% le
aves
/sho
ot)
10 (2
0) sh
oots
Cal
cula
ted
as th
e pe
rcen
tage
of l
eave
s with
nec
rosi
s mar
ks p
er sh
oot.
H
erbi
vore
pre
ssur
e (%
)10
(20)
shoo
tsC
alcu
late
d as
the
perc
enta
ge o
f lea
ves w
ith b
ite m
arks
per
shoo
t.
Epip
hytic
bio
mas
s (m
g/cm
2 )10
(20)
shoo
tsM
easu
rem
ent o
f dry
wei
ght o
f epi
phyt
es p
er s
hoot
. Epi
phyt
es re
mov
ed w
ith a
razo
r bla
de a
nd e
piph
ytes
drie
d at
60°
C
for 4
8 h
(Dau
by a
nd P
oulic
ek, 1
995)
Epip
hytic
/Lea
ve b
iom
ass (
E/L)
10 (2
0) sh
oots
Mea
sure
men
t of d
ry w
eigh
ts o
f epi
phyt
es a
nd le
aves
per
shoo
t. B
oth
epip
hyte
s and
leav
es d
ried
at 6
0°C
for 4
8 h.
APPENDIX
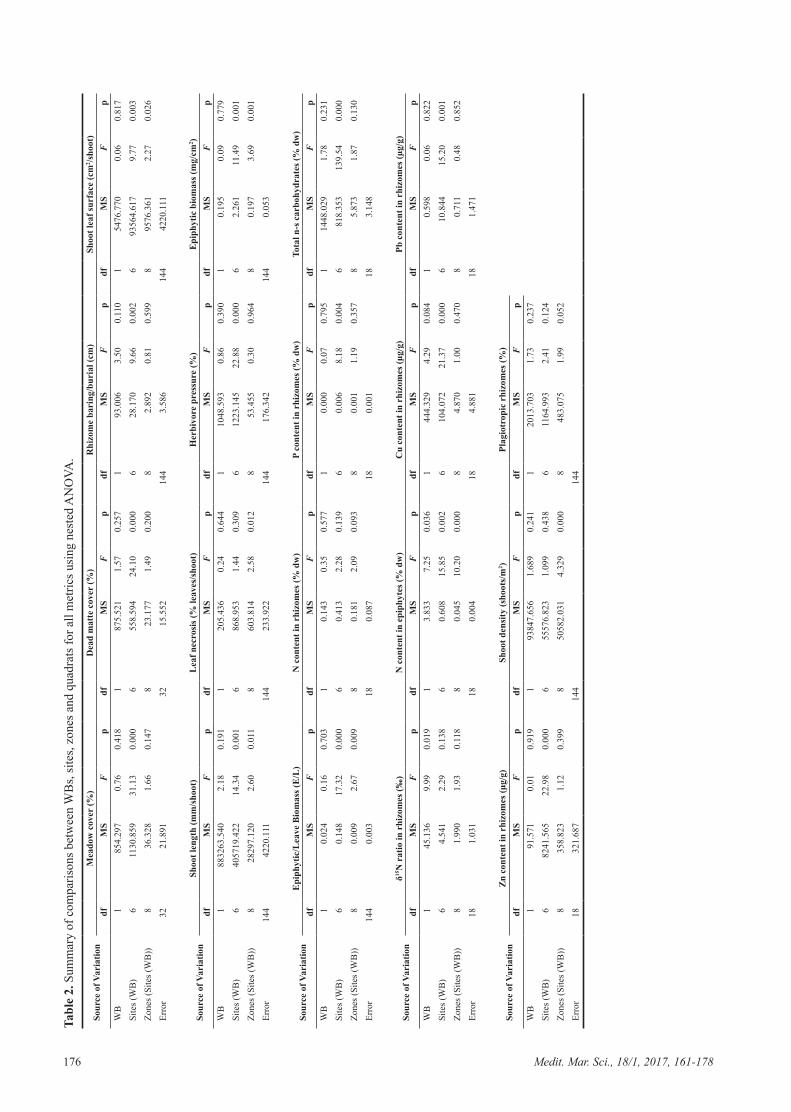
176 Medit. Mar. Sci., 18/1, 2017, 161-178
Tabl
e 2.
Sum
mar
y of
com
paris
ons b
etw
een
WB
s, si
tes,
zone
s and
qua
drat
s for
all
met
rics u
sing
nes
ted
AN
OVA
.
Sour
ce o
f Var
iatio
nM
eado
w c
over
(%)
Dea
d m
atte
cov
er (%
)R
hizo
me
bari
ng/b
uria
l (cm
)Sh
oot l
eaf s
urfa
ce (c
m2 /s
hoot
)df
MS
Fp
dfM
SF
MS
Fp
dfM
SF
pW
B1
854.
297
0.76
0.41
81
875.
521
1.57
0.25
71
93.0
063.
500.
110
154
76.7
700.
060.
817
Site
s (W
B)
611
30.8
5931
.13
0.00
06
558.
594
24.1
00.
000
628
.170
9.66
0.00
26
9356
4.61
79.
770.
003
Zone
s (Si
tes (
WB
))8
36.3
281.
660.
147
823
.177
1.49
0.20
08
2.89
20.
810.
599
895
76.3
612.
270.
026
Erro
r32
21.8
9132
15.5
5214
43.
586
144
4220
.111
Sour
ce o
f Var
iatio
nSh
oot l
engt
h (m
m/s
hoot
)L
eaf n
ecro
sis (
% le
aves
/sho
ot)
Her
bivo
re p
ress
ure
(%)
Epi
phyt
ic b
iom
ass (
mg/
cm2 )
dfM
SF
MS
Fp
dfM
SF
MS
Fp
WB
188
3263
.540
2.18
0.19
11
205.
436
0.24
0.64
41
1048
.593
0.86
0.39
01
0.19
50.
090.
779
Site
s (W
B)
640
5719
.422
14.3
40.
001
686
8.95
31.
440.
309
612
23.1
4522
.88
0.00
06
2.26
111
.49
0.00
1Zo
nes (
Site
s (W
B))
828
297.
120
2.60
0.01
18
603.
814
2.58
0.01
28
53.4
550.
300.
964
80.
197
3.69
0.00
1Er
ror
144
4220
.111
144
233.
922
144
176.
342
144
0.05
3
Sour
ce o
f Var
iatio
nE
piph
ytic
/Lea
ve B
iom
ass (
E/L
)N
con
tent
in r
hizo
mes
(% d
w)
P co
nten
t in
rhiz
omes
(% d
w)
Tota
l n-s
car
bohy
drat
es (%
dw
)df
MS
Fp
dfM
SF
MS
Fp
dfM
SF
pW
B1
0.02
40.
160.
703
10.
143
0.35
0.57
71
0.00
00.
070.
795
114
48.0
291.
780.
231
Site
s (W
B)
60.
148
17.3
20.
000
60.
413
2.28
0.13
96
0.00
68.
180.
004
681
8.35
313
9.54
0.00
0Zo
nes (
Site
s (W
B))
80.
009
2.67
0.00
98
0.18
12.
090.
093
80.
001
1.19
0.35
78
5.87
31.
870.
130
Erro
r14
40.
003
180.
087
180.
001
183.
148
Sour
ce o
f Var
iatio
nδ15
N r
atio
in r
hizo
mes
(‰)
N c
onte
nt in
epi
phyt
es (%
dw
)C
u co
nten
t in
rhiz
omes
(μg/
g)Pb
con
tent
in r
hizo
mes
(μg/
g)df
MS
Fp
dfM
SF
MS
Fp
dfM
SF
pW
B1
45.1
369.
990.
019
13.
833
7.25
0.03
61
444.
329
4.29
0.08
41
0.59
80.
060.
822
Site
s (W
B)
64.
541
2.29
0.13
86
0.60
815
.85
0.00
26
104.
072
21.3
70.
000
610
.844
15.2
00.
001
Zone
s (Si
tes (
WB
))8
1.99
01.
930.
118
80.
045
10.2
00.
000
84.
870
1.00
0.47
08
0.71
10.
480.
852
Erro
r18
1.03
118
0.00
418
4.88
118
1.47
1
Sour
ce o
f Var
iatio
nZ
n co
nten
t in
rhiz
omes
(μg/
g)Sh
oot d
ensi
ty (s
hoot
s/m
2 )Pl
agio
trop
ic r
hizo
mes
(%)
dfM
SF
MS
Fp
dfM
SF
pW
B1
91.5
710.
010.
919
193
847.
656
1.68
90.
241
120
13.7
031.
730.
237
Site
s (W
B)
682
41.5
6522
.98
0.00
06
5557
6.82
31.
099
0.43
86
1164
.993
2.41
0.12
4Zo
nes (
Site
s (W
B))
835
8.82
31.
120.
399
850
582.
031
4.32
90.
000
848
3.07
51.
990.
052
Erro
r18
321.
687
144
14
4
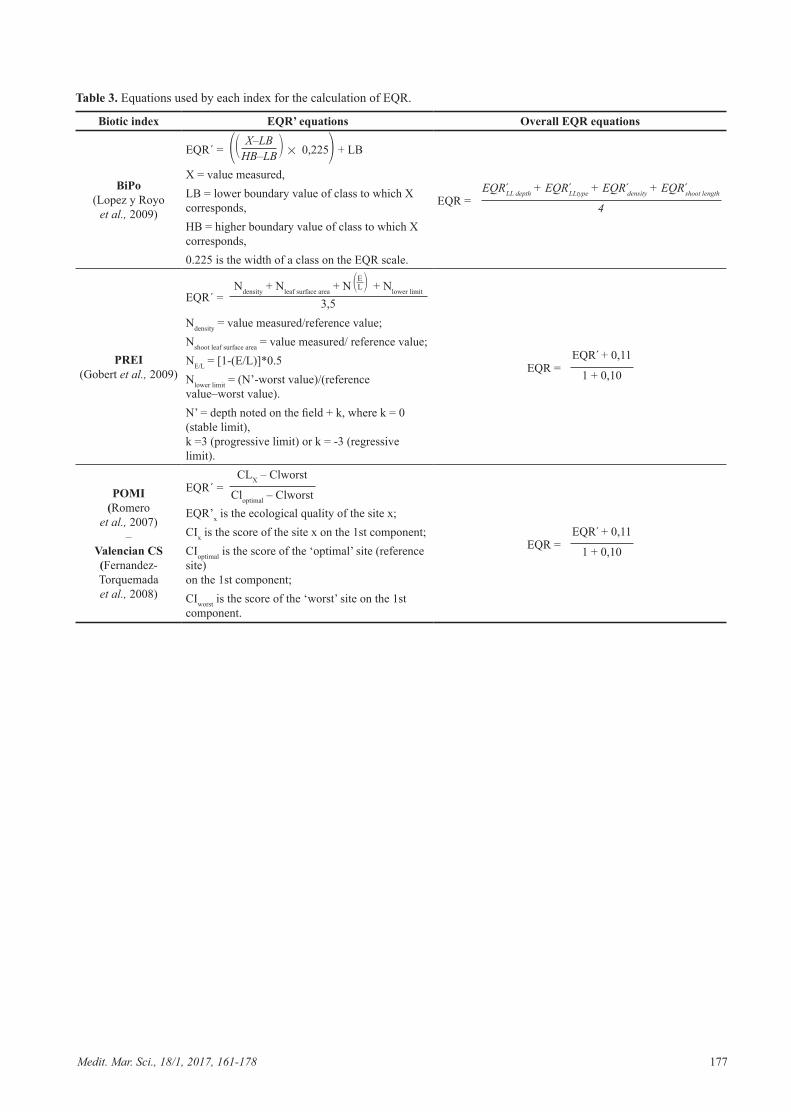
Medit. Mar. Sci., 18/1, 2017, 161-178 177
Table 3. Equations used by each index for the calculation of EQR.
Biotic index EQR’ equations Overall EQR equations
BiPo (Lopez y Royo
et al., 2009)
EQR΄ = 0,225 + LBX‒LB
HB‒LΒ X = value measured,
EQR = EQRLL depth + EQRLLtype + EQR density + EQR shoot length
4LB = lower boundary value of class to which X corresponds, HB = higher boundary value of class to which X corresponds, 0.225 is the width of a class on the EQR scale.
PREI (Gobert et al., 2009)
EQR΄ = Ndensity + Nleaf surface area + N E
L + Nlower limit
3,5Ndensity = value measured/reference value;
EQR = EQR΄ + 0,11
1 + 0,10
Nshoot leaf surface area = value measured/ reference value;NE/L = [1-(E/L)]*0.5Nlower limit = (N’-worst value)/(reference value–worst value).N’ = depth noted on the field + k, where k = 0 (stable limit), k =3 (progressive limit) or k = -3 (regressive limit).
POMI (Romero
et al., 2007)‒
Valencian CS (Fernandez-Torquemada et al., 2008)
EQR΄ = CLX ‒ Clworst
Cloptimal ‒ ClworstEQR’x is the ecological quality of the site x;
EQR = EQR΄ + 0,11
1 + 0,10
CIx is the score of the site x on the 1st component; CIoptimal is the score of the ‘optimal’ site (reference site) on the 1st component; CIworst is the score of the ‘worst’ site on the 1st component.
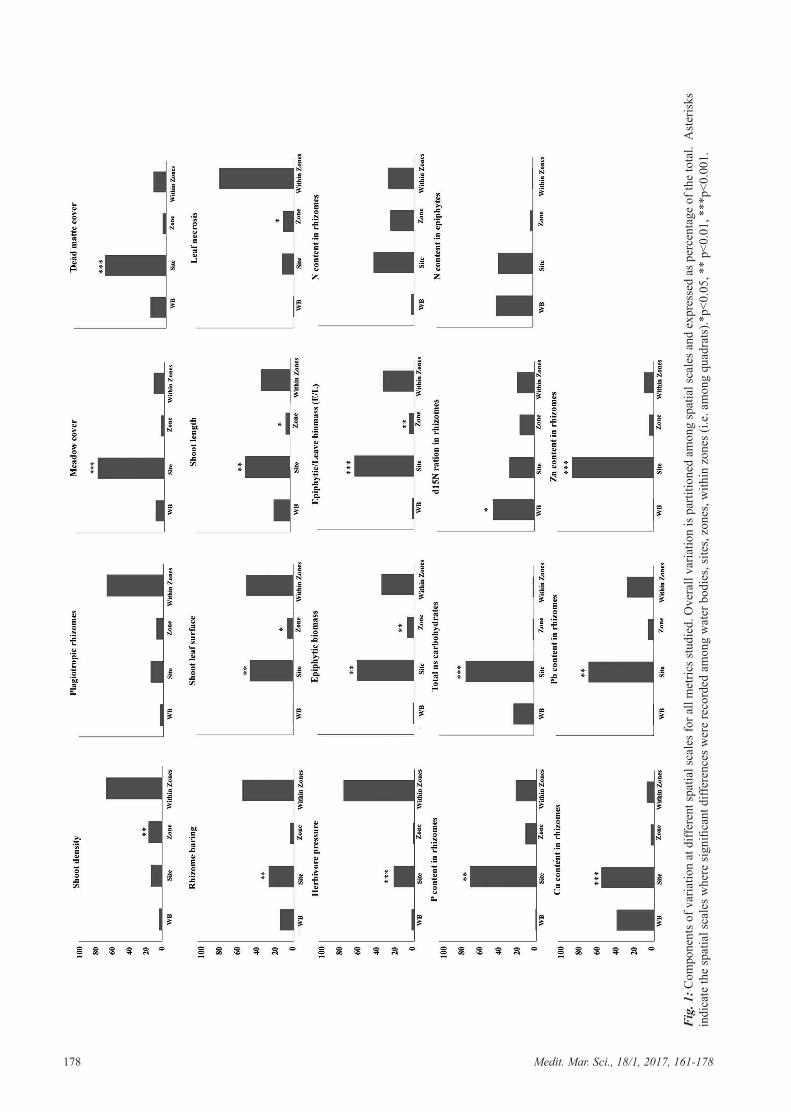
178 Medit. Mar. Sci., 18/1, 2017, 161-178
Fig
. 1: C
ompo
nent
s of v
aria
tion
at d
iffer
ent s
patia
l sca
les f
or a
ll m
etric
s stu
died
. Ove
rall
varia
tion
is p
artit
ione
d am
ong
spat
ial s
cale
s and
exp
ress
ed a
s per
cent
age
of th
e to
tal.
Ast
eris
ks
indi
cate
the
spat
ial s
cale
s whe
re si
gnifi
cant
diff
eren
ces w
ere
reco
rded
am
ong
wat
er b
odie
s, si
tes,
zone
s, w
ithin
zon
es (i
.e. a
mon
g qu
adra
ts).*
p<0.
05, *
* p<
0.01
, ***
p<0.
001.