Embed Size (px)
Citation preview
Effectiveness of operative interventions in individuals with a
hemi or total hip arthroplasty who sustain a Vancouver B2
peri-prosthetic femoral fracture.
Thesis prepared for the degree of Master of Clinical Science by
Dr Jamie Raffaele Ianunzio, M.D. with Distinction, B Pharm
The Joanna Briggs Institute, Faculty of Health Sciences
Supervisors
A/Prof. Zachary Munn, PhD
Associate Professor
The Joanna Briggs Institute
School of Public Health
The University of Adelaide
2018
Dr Daniel Mandziak, MBBS
Orthopaedic Surgeon
The Royal Adelaide Hospital
Dr Matthew Stephenson, PhD
Research Fellow
The Joanna Briggs Institute
School of Public Health
The University of Adelaide


i
Dedication To my parents George and Sherrie, thank you from the bottom of my heart for
providing me with the foundations which have enabled me to undertake the Master of
Clinical Science program and complete my 10th year of tertiary studies.
To my fiancé Dandara Gabriela, thank you for your unconditional love and support
during my candidature, I simply could not have done it without you. Beijos.

iii
Preface This thesis reports on research by way of a systematic review carried out during my Masters
of Clinical Science candidature at the University of Adelaide, Adelaide, South Australia from
February 2016 to May 2018.
This thesis consists of 4 chapters. Chapter 1 presents the background and context of the review,
which develops the foundation for the study aims. Chapter 2 provides a description of the
methodology for the systematic review. Chapters 3 presents the results of the study. Finally,
Chapter 4 presents an overall discussion of the findings, its clinical implications, summarises
the major conclusions and highlights the future directions in research.

v
Abstract Hip arthroplasty is a commonly performed orthopaedic intervention employed in the
management of various hip pathologies. Australian registry data indicate that over 42,000
primary hip arthroplasties including a stemmed femoral prosthesis were performed during
2016 (Australian Orthopaedic Association 2017). Post-operative peri-prosthetic femur
fractures (PFFs) around hip arthroplasties have an incidence around 0.4% to 4% and although
infrequent, are a significant complication imparting a heavy burden upon patient, orthopaedic
surgeon and the health care system, costing on average around AUD 40,000 per patient, per
fracture to manage (Phillips, Boulton et al. 2011). The Vancouver classification system,
devised by Brady and colleagues is the most commonly utilised system for classifying PFFs,
with Type B fractures occuring at the level of or just below the femoral stem, further
subdivided according to stem stability and bone stock, with our study population, type B2
exhibiting an unstable stem with preserved proximal bone stock (Brady, Garbuz et al. 1999).
Although revision arthroplasty is currently recommended for management of Vancouver
Type B2 PFFs, open reduction internal fixation (ORIF) has been shown in some small studies
to yield similar outcomes when compared to revision. If selected Vancouver type B2
fractures were shown to be amenable to ORIF alone rather than revision, it would be
beneficial given that much intra-operative risk would be mitigated by way of shorter
operative times, and a reduction in skill set demands upon the surgeon, reduce implant costs,
and allow for subsequent revision in arthroplasty in younger individuals. The objective of this
thesis was to identify the effectiveness of operative interventions for individuals who have
undergone a hemi or total hip arthroplasty who sustain a Vancouver type B2 peri-prosthetic
femoral fracture or equivalent, by conducting a systematic review. Specifically, the review
vi
investigated open reduction and internal fixation and femoral revision arthroplasty with or
without internal fixation.
Unpublished and published studies across PubMed Medline, EMBASE, CINAHL, The
Cochrane Central Register of Controlled Trials (CENTRAL), Web of Science,
ClinicalTrials.gov and Proquest Theses and Dissertations were considered for the systematic
review. We assessed both experimental and observational studies written in English from
1990 or later, which reported on five or more Vancouver B2 periprosthetic fractures and
assessed at least one outcome of interest, including intra-operative (e.g. surgical time,
bleeding), radiographic (e.g. subsidence), clinical (e.g. union, mortality, parker mobility) and
patient reported outcomes (e.g. functional status and health-related quality of life). The
quality assessment of the papers was performed by two independent reviewers using
standardised critical appraisal instruments according to the study design from the Joanna
Briggs Institute. The critical appraisal was compared and in case of disagreement a third
reviewer’s opinion was sought for further discussion. Data was extracted from papers
included in the review using the standardised data extraction tool from the JBI-System for the
Unified Management, Assessment and Review of Information (SUMARI).
From the electronic searches, 1805 potential articles were found, of which 860 duplicates
were removed. In the first screening, 213 studies were selected for full text reading. The
reference lists of these articles revealed another 45 articles, and a total of 258 studies were
selected for full-text reading. After the evaluation, 37 studies were finally included in the
systematic review. There were 27 retrospective case series and 10 retrospective cohort
studies, which together evaluated outcomes of 926 Vancouver B2 fracture cases. With
regards to the intervention, 25 studies evaluated revision with or without wires, cables or
cerclage, while three studies investigated revision plus ORIF with plate. There were three
vii
studies that analysed revision and cortical strut allografts. There were 11 studies that
evaluated revision with mixed methods or without specifying the revision technique. Ten
studies assessed ORIF with plate. Two studies evaluated ORIF with wires, cerclage or cables.
Three studies evaluated ORIF with mixed methods or without specifying ORIF technique.
One study evaluated a non-operative intervention. Among the 37 included studies, 24 papers
evaluated one intervention of interest, six articles included two interventions, five studies
included three interventions and two studies investigated four interventions of interest.
Comparative meta-analysis revealed small differences between management strategies across
different outcomes. While the surgical time was shorter and the transfusion requirement was
less for ORIF with plate vs Revision +/- wires, cerclage and cables, pre and post-operative
parker mobility scores, subsidence, union, mortality, dislocation and infection rates were
similar. Regarding Revision via any method vs ORIF any method, union, malunion and
infection rates were similar, however, mortality rates were lower for ORIF and re-operation
rates were lower for revision. Overall, no management strategies have been shown to be
consistently superior for the outcomes included in this systematic review and meta-analysis.

ix
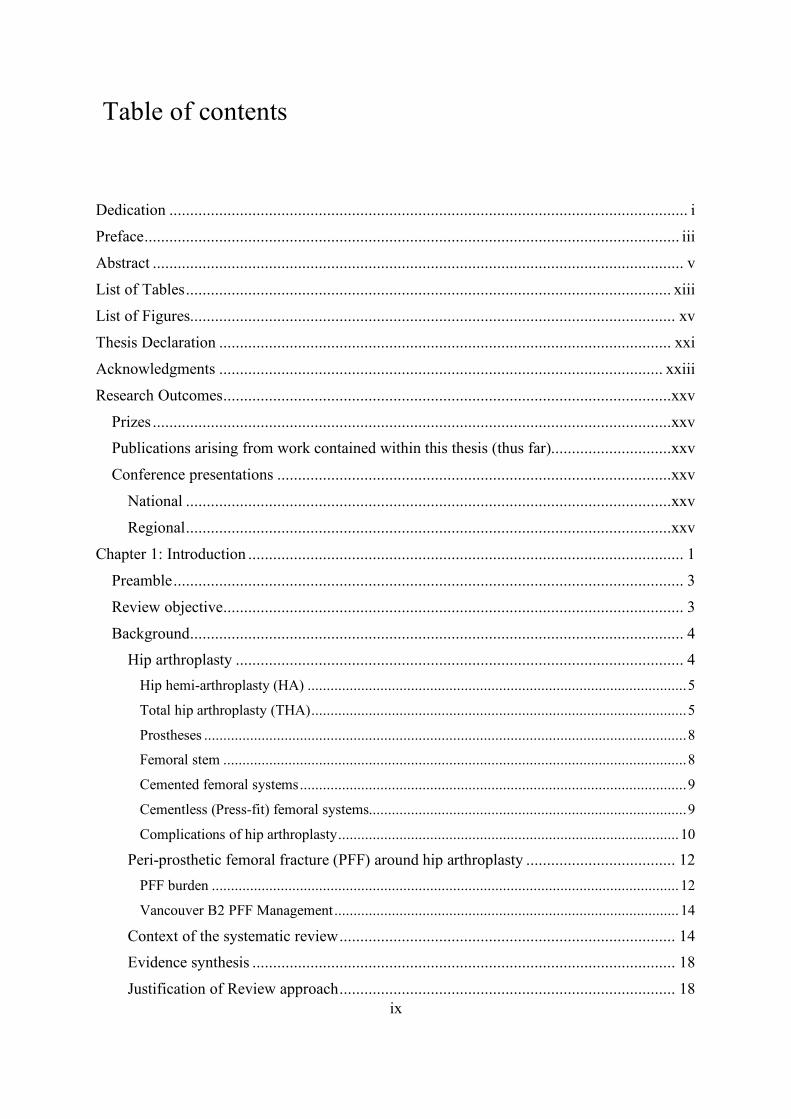
Table of contents
Dedication ............................................................................................................................. i Preface ................................................................................................................................. iii Abstract ................................................................................................................................ v List of Tables ..................................................................................................................... xiii List of Figures ..................................................................................................................... xv Thesis Declaration ............................................................................................................. xxi Acknowledgments ........................................................................................................... xxiii Research Outcomes ............................................................................................................xxv
Prizes .............................................................................................................................xxv Publications arising from work contained within this thesis (thus far).............................xxv Conference presentations ...............................................................................................xxv
National .....................................................................................................................xxv Regional .....................................................................................................................xxv
Chapter 1: Introduction ......................................................................................................... 1 Preamble ........................................................................................................................... 3 Review objective ............................................................................................................... 3 Background ....................................................................................................................... 4
Hip arthroplasty ............................................................................................................ 4 Hip hemi-arthroplasty (HA) ................................................................................................... 5 Total hip arthroplasty (THA) .................................................................................................. 5 Prostheses .............................................................................................................................. 8 Femoral stem ......................................................................................................................... 8 Cemented femoral systems ..................................................................................................... 9 Cementless (Press-fit) femoral systems................................................................................... 9 Complications of hip arthroplasty ......................................................................................... 10
Peri-prosthetic femoral fracture (PFF) around hip arthroplasty .................................... 12 PFF burden .......................................................................................................................... 12 Vancouver B2 PFF Management .......................................................................................... 14
Context of the systematic review ................................................................................. 14 Evidence synthesis ...................................................................................................... 18 Justification of Review approach ................................................................................. 18
x
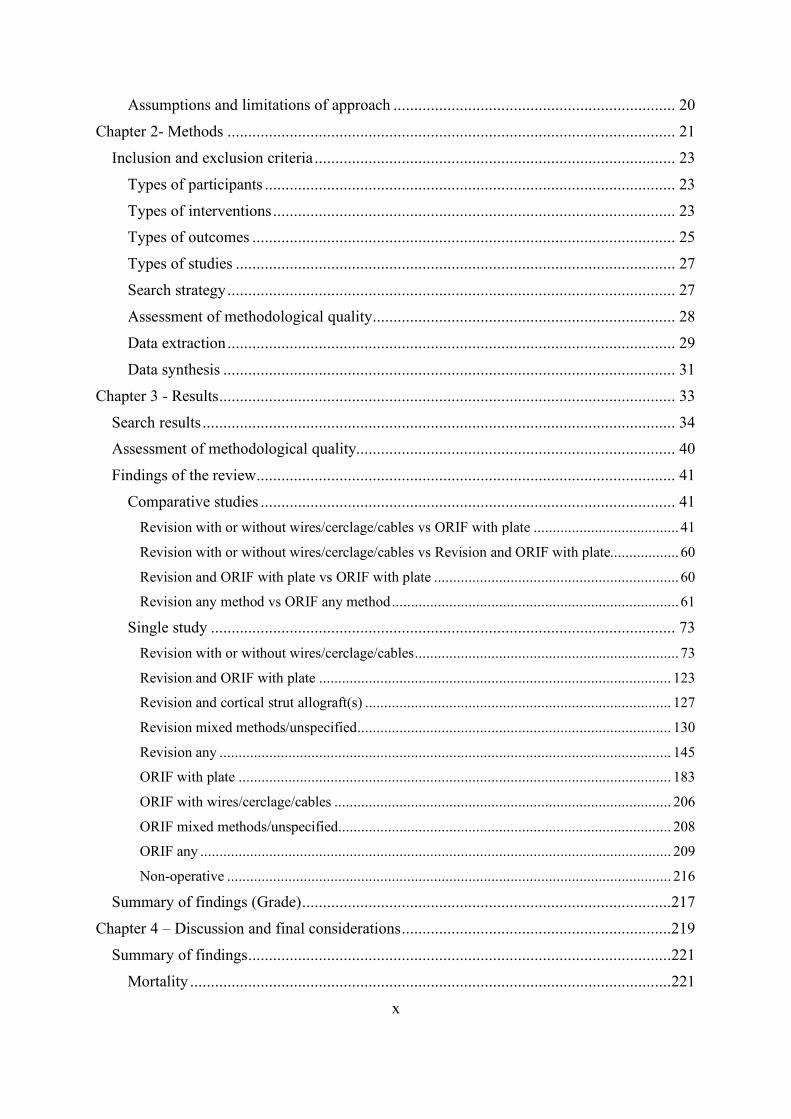
Assumptions and limitations of approach .................................................................... 20 Chapter 2- Methods ............................................................................................................ 21
Inclusion and exclusion criteria ....................................................................................... 23 Types of participants ................................................................................................... 23 Types of interventions ................................................................................................. 23 Types of outcomes ...................................................................................................... 25 Types of studies .......................................................................................................... 27 Search strategy ............................................................................................................ 27 Assessment of methodological quality ......................................................................... 28 Data extraction ............................................................................................................ 29 Data synthesis ............................................................................................................. 31
Chapter 3 - Results .............................................................................................................. 33 Search results .................................................................................................................. 34 Assessment of methodological quality............................................................................. 40 Findings of the review ..................................................................................................... 41
Comparative studies .................................................................................................... 41 Revision with or without wires/cerclage/cables vs ORIF with plate ...................................... 41 Revision with or without wires/cerclage/cables vs Revision and ORIF with plate.................. 60 Revision and ORIF with plate vs ORIF with plate ................................................................ 60 Revision any method vs ORIF any method ........................................................................... 61
Single study ................................................................................................................ 73 Revision with or without wires/cerclage/cables ..................................................................... 73 Revision and ORIF with plate ............................................................................................ 123 Revision and cortical strut allograft(s) ................................................................................ 127 Revision mixed methods/unspecified .................................................................................. 130 Revision any ...................................................................................................................... 145 ORIF with plate ................................................................................................................. 183 ORIF with wires/cerclage/cables ........................................................................................ 206 ORIF mixed methods/unspecified....................................................................................... 208 ORIF any ........................................................................................................................... 209 Non-operative .................................................................................................................... 216
Summary of findings (Grade) .........................................................................................217 Chapter 4 – Discussion and final considerations .................................................................219
Summary of findings ......................................................................................................221 Mortality ....................................................................................................................221
xi
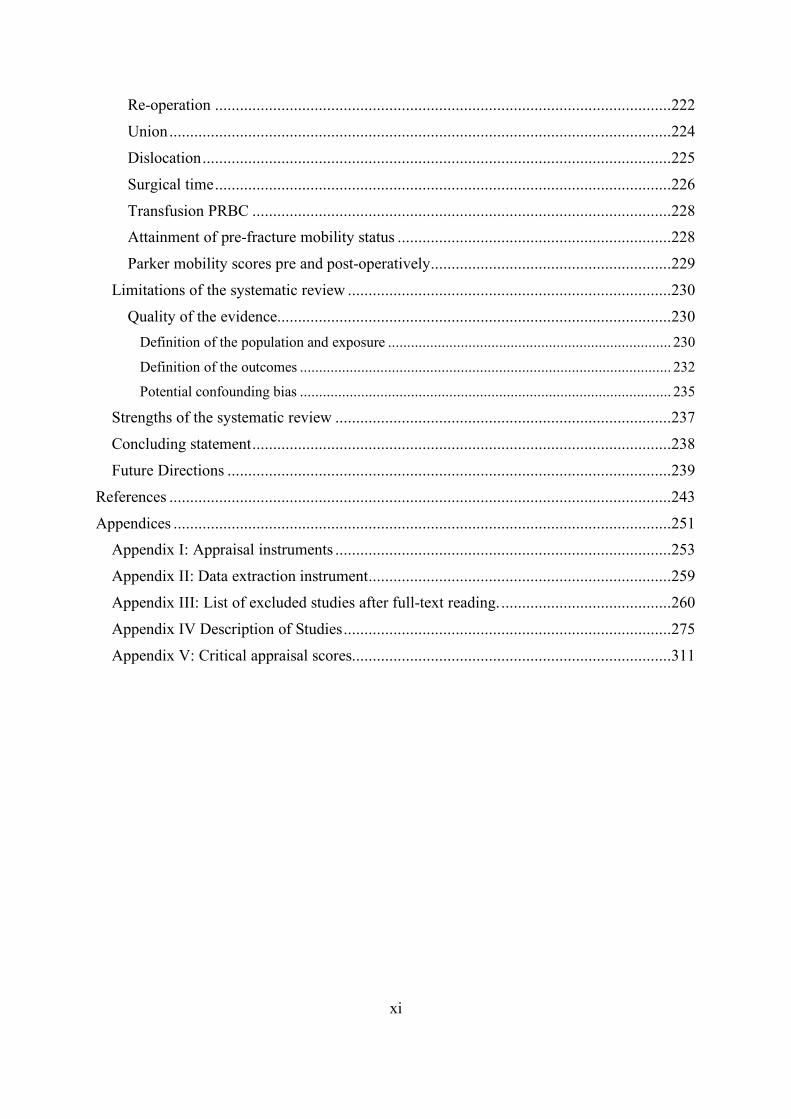
Re-operation ..............................................................................................................222 Union .........................................................................................................................224 Dislocation .................................................................................................................225 Surgical time ..............................................................................................................226 Transfusion PRBC .....................................................................................................228 Attainment of pre-fracture mobility status ..................................................................228 Parker mobility scores pre and post-operatively ..........................................................229
Limitations of the systematic review ..............................................................................230 Quality of the evidence...............................................................................................230
Definition of the population and exposure .......................................................................... 230 Definition of the outcomes ................................................................................................. 232 Potential confounding bias ................................................................................................. 235
Strengths of the systematic review .................................................................................237 Concluding statement .....................................................................................................238 Future Directions ...........................................................................................................239
References .........................................................................................................................243 Appendices ........................................................................................................................251
Appendix I: Appraisal instruments .................................................................................253 Appendix II: Data extraction instrument .........................................................................259 Appendix III: List of excluded studies after full-text reading. .........................................260 Appendix IV Description of Studies ...............................................................................275 Appendix V: Critical appraisal scores.............................................................................311

xiii
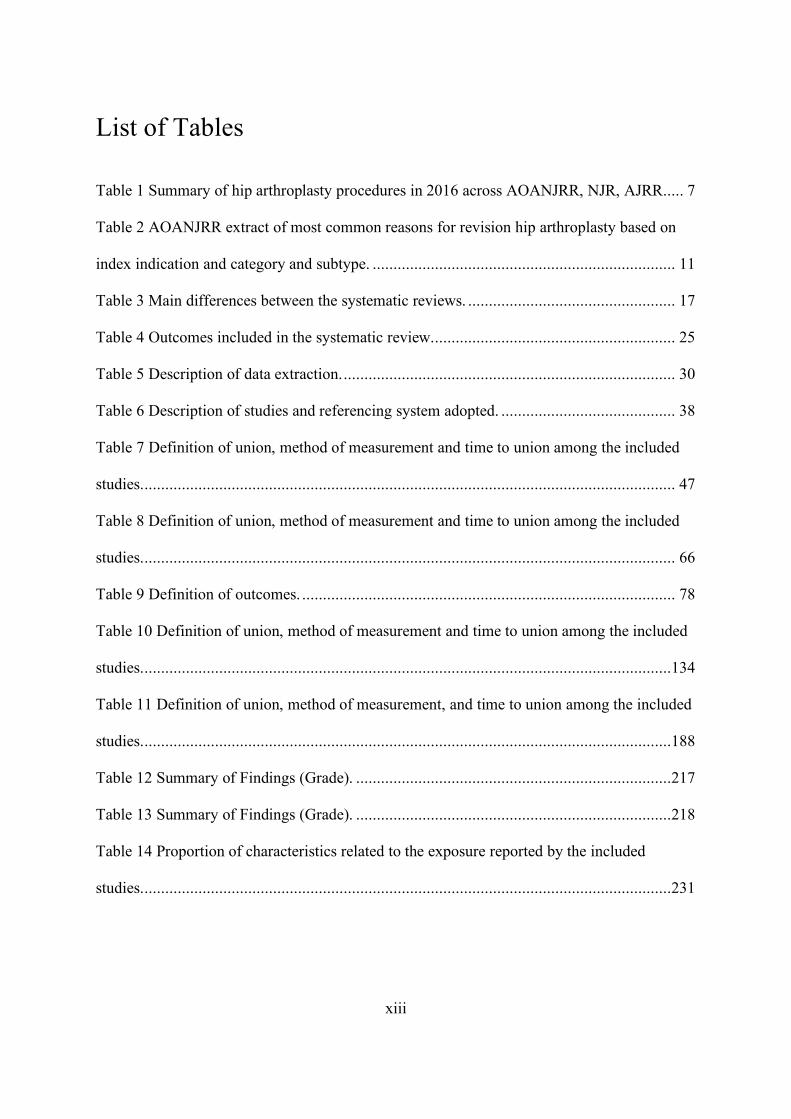
List of Tables
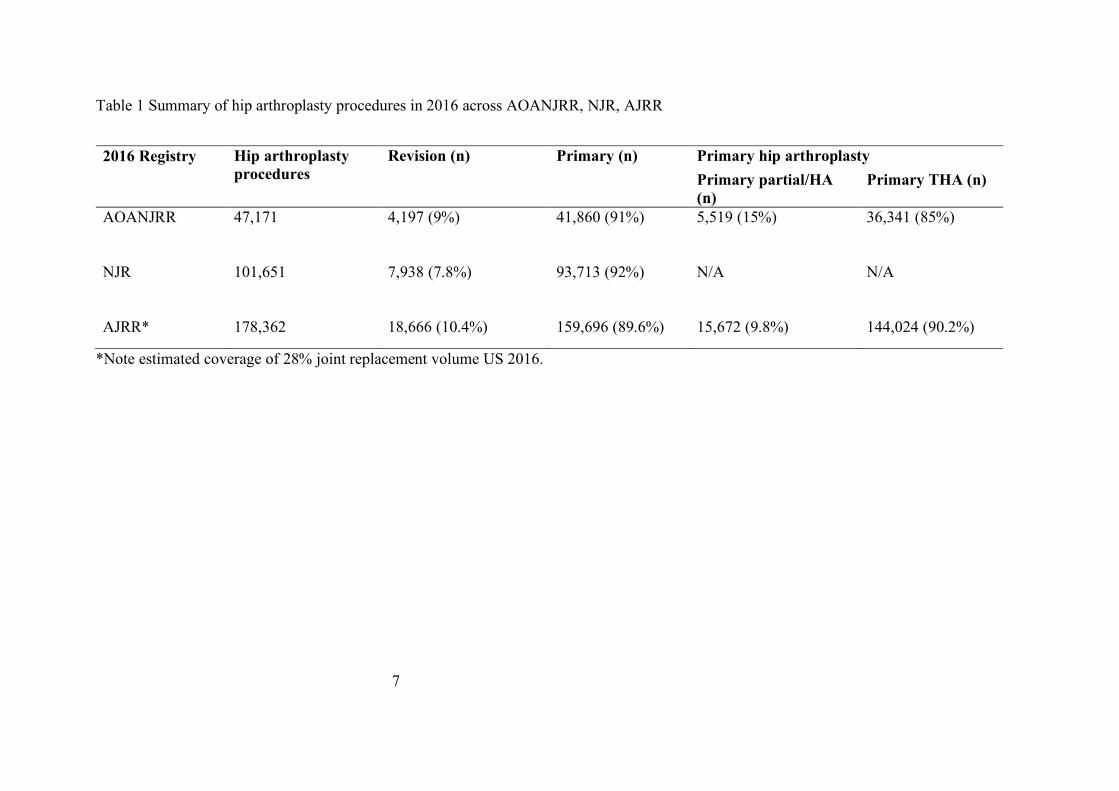
Table 1 Summary of hip arthroplasty procedures in 2016 across AOANJRR, NJR, AJRR..... 7
Table 2 AOANJRR extract of most common reasons for revision hip arthroplasty based on
index indication and category and subtype. ......................................................................... 11
Table 3 Main differences between the systematic reviews. .................................................. 17
Table 4 Outcomes included in the systematic review. .......................................................... 25
Table 5 Description of data extraction. ................................................................................ 30
Table 6 Description of studies and referencing system adopted. .......................................... 38
Table 7 Definition of union, method of measurement and time to union among the included
studies. ................................................................................................................................ 47
Table 8 Definition of union, method of measurement and time to union among the included
studies. ................................................................................................................................ 66
Table 9 Definition of outcomes. .......................................................................................... 78
Table 10 Definition of union, method of measurement and time to union among the included
studies. ...............................................................................................................................134
Table 11 Definition of union, method of measurement, and time to union among the included
studies. ...............................................................................................................................188
Table 12 Summary of Findings (Grade). ............................................................................217
Table 13 Summary of Findings (Grade). ............................................................................218
Table 14 Proportion of characteristics related to the exposure reported by the included
studies. ...............................................................................................................................231

xv
List of Figures
Figure 1 PRISMA flow diagram of search and study selection process. ............................... 35
Figure 2 Surgical time (minutes) for Revision with or without wires/cerclage/cables vs ORIF
with plate. ........................................................................................................................... 42
Figure 3 Surgical time (minutes) for Revision with or without wires/cerclage/cables vs ORIF
with plate. ........................................................................................................................... 43
Figure 4 Transfusion PRBC (units) for Revision with or without wires/cerclage/cables vs
ORIF with plate. ................................................................................................................. 44
Figure 5 Union (overall) for Revision with or without wires/cerclage/cables vs ORIF with
plate. ................................................................................................................................... 45
Figure 6 Union (overall) for Revision with or without wires/cerclage/cables vs ORIF with
plate. ................................................................................................................................... 48
Figure 7 Union (overall) for Revision with or without wires/cerclage/cables vs ORIF with
plate. ................................................................................................................................... 49
Figure 8 Deep surgical site infection (DSSI) for Revision with or without
wires/cerclage/cables vs ORIF with plate. ........................................................................... 52
Figure 9 Dislocation for Revision with or without wires/cerclage/cables vs ORIF with plate.
........................................................................................................................................... 54
Figure 10 Dislocation for Revision with or without wires/cerclage/cables vs ORIF with plate.
........................................................................................................................................... 55
Figure 11 Dislocation for Revision with or without wires/cerclage/cables vs ORIF with plate.
........................................................................................................................................... 56
Figure 12 Revision with or without wires/cerclage/cables vs ORIF with plate. .................... 57
xvi
Figure 13 Attainment of pre-fracture mobility status for Revision with or without
wires/cerclage/cables vs ORIF with plate. ........................................................................... 59
Figure 14 Surgical time (minutes) for Revision any vs ORIF any. ....................................... 62
Figure 15 Surgical time (minutes) for Revision any vs ORIF any. ....................................... 63
Figure 16 Union (overall) for Revision any vs ORIF any. ................................................... 64
Figure 17 Mortality (overall at final follow-up) for Revision any vs ORIF any. ................... 68
Figure 18 Deep surgical site infection (DSSI) for Revision any vs ORIF any. ..................... 69
Figure 19 Superficial surgical site infection (SSSI) for Revision any vs ORIF any. ............. 70
Figure 20 Re-operation for Revision any vs ORIF any. ....................................................... 71
Figure 21 Surgical time (minutes) for Revision with or without wires/cerclage/cables......... 73
Figure 22 Transfusion packed red blood cell (PRBC) requirement for Revision with or
without wires/cerclage/cables. ............................................................................................. 74
Figure 23 Subsidence (any) for Revision with or without wires/cerclage/cables. ................. 76
Figure 24 Subsidence (>5mm OR requiring revision) for Revision with or without
wires/cerclage/cables. ......................................................................................................... 80
Figure 25 Union (overall) for Revision with or without wires/cerclage/cables. .................... 82
Figure 26 Non-union (overall) for Revision with or without wires/cerclage/cables. ............. 87
Figure 27 Mortality (overall at final follow-up) for Revision with or without
wires/cerclage/cables. ......................................................................................................... 90
Figure 28 Aseptic loosening for Revision with or without wires/cerclage/cables. ................ 93
Figure 29 Peri-prosthetic femoral fracture (post-operatively) for Revision with or without
wires/cerclage/cables. ......................................................................................................... 95
Figure 30 Deep surgical site infection (DSSI) for Revision with or without
wires/cerclage/cables. ......................................................................................................... 97
xvii
Figure 31 Superficial surgical site infection (SSSI) for Revision with or without
wires/cerclage/cables. ......................................................................................................... 99
Figure 32 Dislocation (any) for Revision with or without wires/cerclage/cables. ................101
Figure 33 Re-operation for Revision with or without wires/cerclage/cables. .......................103
Figure 34 Deep vein thrombosis for Revision with or without wires/cerclage/cables. .........105
Figure 35 Leg length discrepancy for Revision with or without wires/cerclage/cables. .......107
Figure 36 Harris hip score (HHS) (post-operative) for Revision with or without
wires/cerclage/cables. ........................................................................................................109
Figure 37 Beals and Towers’ criteria excellent outcome for Revision with or without
wires/cerclage/cables. ........................................................................................................111
Figure 38 Beals and Towers’ criteria good outcome for Revision with or without
wires/cerclage/cables. ........................................................................................................113
Figure 39 Beals and Towers’ criteria poor outcome for Revision with or without
wires/cerclage/cables. ........................................................................................................115
Figure 40 Attainment of pre-fracture mobility status for Revision with or without
wires/cerclage/cables. ........................................................................................................121
Figure 41 Length of stay for Revision and ORIF with plate. ...............................................124
Figure 42 Union (overall) for Revision mixed methods/unspecified. ..................................132
Figure 43 Mortality (overall) for Revision mixed methods/unspecified. .............................136
Figure 44 Deep surgical site infection (DSSI) for Revision mixed methods/unspecified. ....139
Figure 45 Re-operation for Revision mixed methods/unspecified. ......................................141
Figure 46 Surgical time (minutes) for Revision any. ...........................................................145
Figure 47 Subsidence (any) for Revision any. ....................................................................147
Figure 48 Subsidence (>5mm OR requiring revision) for Revision with or without
wires/cerclage/cables. ........................................................................................................149

xviii
Figure 49 Union (overall) for Revision any. .......................................................................151
Figure 50 Non-union (overall) for Revision any. ................................................................157
Figure 51 Mortality (overall) for Revision any. ..................................................................159
Figure 52 Aseptic loosening for Revision any. ...................................................................161
Figure 53 Peri-prosthetic femoral fracture (post-operatively) for Revision any. ..................163
Figure 54 Deep surgical site infection (DSSI) for Revision any. .........................................165
Figure 55 Superficial surgical site infection (SSSI) for Revision any. .................................167
Figure 56 Dislocation for Revision any. .............................................................................169
Figure 57 Re-operation for Revision any. ...........................................................................171
Figure 58 Harris hip score (HHS) (post-operative) for Revision any...................................173
Figure 59 Beals and Towers’ criteria excellent outcome for Revision any. .........................174
Figure 60 Beals and Towers’ criteria good outcome for Revision any. ...............................176
Figure 61 Beals and Towers’ criteria poor outcome for Revision any. ................................178
Figure 62 Oxford hip score (OHS) (post-operative) for any. ...............................................180
Figure 63 Attainment of pre-fracture mobility status for Revision with or without
wires/cerclage/cables. ........................................................................................................181
Figure 64 Surgical time (minutes) for ORIF with plate. ......................................................183
Figure 65 Blood loss (intra-operative) for ORIF with plate.................................................184
Figure 66 Transfusion packed red blood cell (PRBC) requirement for ORIF with plate. .....185
Figure 67 Union (overall) for ORIF plate. ..........................................................................186
Figure 68 Mortality (overall) for ORIF with plate. .............................................................191
Figure 69 Deep surgical site infection (DSSI) for ORIF with plate. ....................................193
Figure 70 Dislocation for ORIF with plate (combined) .......................................................195
Figure 71 Dislocation for ORIF with plate (Analysis 2) .....................................................197
Figure 72 Re-operation for ORIF with plate. ......................................................................199

xix
Figure 73 Attainment pre-fracture mobility status for ORIF with plate. ..............................204
Figure 74 Re-operation for ORIF mixed methods/unspecified. ...........................................208
Figure 75 Union (overall) for ORIF any). ...........................................................................210
Figure 76 Deep surgical site infection (DSSI) for ORIF any. ..............................................212
Figure 77 Re-operation for ORIF with plate. ......................................................................214


xxi
Thesis Declaration
I certify that this work contains no material which has been accepted for the award of any
other degree or diploma in my name in any university or other tertiary institution and, to
the best of my knowledge and belief, contains no material previously published or written
by another person, except where due reference has been made in the text. In addition, I
certify that no part of this work will, in the future, be used in a submission in my name for
any other degree or diploma in any university or other tertiary institution without the prior
approval of the University of Adelaide and where applicable, any partner institution
responsible for the joint award of this degree.
The author acknowledges that copyright of published works contained within this thesis
resides with the copyright holder(s) of those works.
I give permission for the digital version of my thesis to be made available on the web, via
the University's digital research repository, the Library Search and also through web
search engines, unless permission has been granted by the University to restrict access for
a period of time.
I acknowledge the support I have received for my research through the provision of an
Australian Government Research Training Program Scholarship.
____________________________
Jamie Raffaele Ianunzio
Date: 8thth of June 2018

xxiii
Acknowledgments
I would like to thank Associate Professor Zachary Munn, Mr Daniel Mandziak and
Dr Matthew Stephenson for their supervision, assistance, feedback and general support
during the development of this thesis. I would like to also acknowledge Dr Megan Cain for
her support in critical appraisal. Finally, I would like to acknowledge the support of The
University of Adelaide and Joanna Briggs Institute staff.

xxv
Research Outcomes Prizes
RJ Bauze Prize for the best paper presentation (podium) at the 2018 Australian Orthopaedic
Association SA/NT Branch Scientific Meeting held at The Queen Elizabeth Hospital on
Friday, 23 February 2018. Effectiveness of operative interventions in individuals with a hemi
or total hip arthroplasty who sustain a Vancouver B2 peri-prosthetic fracture: a systematic
review and meta-analysis
Publications arising from work contained within this thesis (thus far)
Effectiveness of operative interventions in individuals with a hemi or total hip arthroplasty
who sustain a Vancouver B2 peri-prosthetic femoral fracture: a systematic review protocol.
Ianunzio JR, Munn Z, Mandziak D, Stephenson M, Cain ME. JBI Database System Rev
Implement Rep. 2017 Feb; 15: 245-258. https://www.ncbi.nlm.nih.gov/pubmed/28178018
Conference presentations
National
June 2016
The Australasian Orthopaedic Trauma Society Annual Scientific Meeting, Uluru, Northern
Territory. Effectiveness of operative interventions in individuals with a hemi or total hip
arthroplasty who sustain a Vancouver B2 peri-prosthetic fracture: a systematic review
protocol. Ianunzio JR, Munn Z, Mandziak D, Stephenson M, Cain ME.
Regional
February 2018
The Australian Orthopaedic Association SA/NT branch Annual Scientific Meeting, The
Queen Elizabeth Hospital, Adelaide, South Australia. Effectiveness of operative interventions
xxvi
in individuals with a hemi or total hip arthroplasty who sustain a Vancouver B2 peri-
prosthetic fracture: a systematic review and meta-analysis. Ianunzio JR, Munn Z, Mandziak
D, Stephenson M, Cain ME, February 2017
The Australian Orthopaedic Association SA/NT branch Annual Scientific Meeting, Lyell
McEwin Hospital, Adelaide, South Australia. Effectiveness of operative interventions in
individuals with a hemi or total hip arthroplasty who sustain a Vancouver B2 peri-prosthetic
fracture: a systematic review protocol.
Ianunzio JR, Munn Z, Mandziak D, Stephenson M, Cain ME
November 2016
The Joanna Briggs Institute (JBI) 20th Anniversary Symposium, Adelaide, South Australia
Effectiveness of operative interventions in individuals with a hemi or total hip arthroplasty who
sustain a Vancouver B2 peri-prosthetic fracture: a systematic review protocol
Ianunzio JR, Munn Z, Mandziak D, Stephenson M, Cain ME

1
Chapter 1: Introduction

3
Preamble
Peri-prosthetic femoral fractures (PFF) around hip arthroplasties may occur intra or post-
operatively, and although infrequent, their incidence is rising and are a significant
complication imparting a heavy burden upon the patient, orthopaedic surgeon and the health
care system (Lindahl 2006 and Phillips et al. 2011). In 1999, Brady and colleagues devised a
classification system known as the Vancouver classification in conjunction with the
development of a treatment algorithm for post-operatively sustained fractures which is based
on location of the fracture, whether or not the stem is loose and the quality of bone stock in
the proximal femur (Brady, Garbuz et al. 1999). PFFs where the fracture is at the level of the
stemmed femoral prosthesis, where the femoral component is loose and there is
uncompromised proximal femoral bone stock are referred to as Vancouver B2 fractures.
There is a modest amount of literature assessing the outcomes of management by way of
open reduction internal fixation (ORIF) vs femoral revision, with or without internal fixation
with some studies suggesting ORIF is a viable alternative to the current gold standard femoral
revision.
Review objective
The general aim of this thesis was to identify the effectiveness of operative interventions in
individuals with a hemi or total hip arthroplasty who sustain a Vancouver type B2 peri-
prosthetic femoral fracture (PFF) or equivalent. Specifically, this thesis aimed to investigate
open reduction and internal fixation (ORIF) and femoral revision arthroplasty with or without
internal fixation.
4
Background
Hip arthroplasty
Generally speaking, hip arthroplasty (also known as hip replacement) involves open
surgery to the hip joint, resection of the diseased femoral head or defunct femoral head/neck
junction, along with implantation of a stemmed femoral prosthesis and prosthetic femoral
head, with or without additional acetabular preparation and replacement. Globally, the goals
of hip arthroplasty are to restore pre-morbid, stable, pain-free hip joint motion and effective
load transfer from pelvis to femur to enable long-term repetitive ambulation. These
procedures may be primary interventions, including those performed on a native hip joint
without any prior surgery, or revision interventions, where patients have had previous hip
arthroplasty procedure(s) and existing implants are replaced (femoral stem, femoral head or
neck, acetabular cup or liner) or the construct changed (e.g. conversion of hemi to total hip
arthroplasty).
In Australia, hip arthroplasty is a commonly performed orthopaedic intervention
employed in the management of various hip pathologies, most commonly, osteoarthritis and
fractured neck of femur. (Jones, Beaupre et al. 2005). The Australian national joint registry
indicates that from September 1999 to December 2016, over half a million hip arthroplasties
in around 430,000 patients were recorded. Furthermore, as at the end of December 2016, in
Australia 310,630 living patients had one or more hip prostheses in situ, accounting for
1.27% of the population (ABS data end 2016 population 24,385,600) (Australian Orthopeadic
Association 2017).
During 2016, The Australian national joint registry data indicated 47,171 hip
arthroplasty procedures were performed including; primary (partial and total) and revision
procedures, accounting for 91% (n=41,860) and 9% (n=4,197), respectively. This was an
increase by 1,639 (3.7%) compared with 2015 (Australian Orthopeadic Association 2017).
5
The National Joint Registry for England, Wales, Northern Ireland and the Isle of Man
reported over 100,000 hip arthroplasty procedures were performed during 2016 (an increase
of 3.5% from 2015), including over 90,000 primary hip replacements and almost 8,000
revision procedures (The National Joint Registry for England, Wales, Northern Ireland and
the Isle of Man 2017).
Furthermore, The American joint replacement registry (AJRR) reported 178,362 hip
arthroplasty procedures were performed during 2016 including; primary (partial and total)
and revision procedures, accounting for 89.6% (n=159,696) and 10.4% (n=18,666),
respectively. It should be noted the reporting to the AJRR is voluntary, and 2016 data
estimates the registry covers approximately 28% of the estimated annual procedural volume
in the US (The American joint replacement registry 2017).
Hip hemi-arthroplasty (HA)
Of the primary hip arthroplasty procedures performed in Australia during 2016, 15%
(5,519) were hip hemi-arthroplasty (HA), which incorporates a system where a prosthetic
femoral head (attached to a stemmed femoral prosthesis) articulates with the patient’s native
acetabulum. In over 90% of cases, fractured neck of femur was the principal diagnosis and
mean patient age was around 80 to 85 years depending on subcategory of HA system
employed. Furthermore, global registry data for partial hip replacement indicates females
account for over 70% of the cohort.
Total hip arthroplasty (THA)
Of the primary hip arthroplasty procedures performed in Australia during 2016, 85%
(36,341) were total conventional hip arthroplasty (THA) which incorporates the components
of a HA with the addition of acetabular replacement, which includes preparation of the
acetabular surface and implantation of a cup and liner, resulting in the prosthetic femoral
6
head articulating with prosthetic liner (Table 1). The two most common indications for
primary THR were osteoarthritis and fracture, accounting for 88.8% and 4.3% of cases,
respectively. Mean age was 67.7 and around 55% were female (Australian Orthopeadic
Association 2017).
7
Table 1 Summary of hip arthroplasty procedures in 2016 across AOANJRR, NJR, AJRR
2016 Registry
Hip arthroplasty procedures
Revision (n) Primary (n) Primary hip arthroplasty Primary partial/HA (n)
Primary THA (n)
AOANJRR 47,171 4,197 (9%) 41,860 (91%) 5,519 (15%) 36,341 (85%)
NJR 101,651 7,938 (7.8%) 93,713 (92%) N/A N/A
AJRR* 178,362 18,666 (10.4%) 159,696 (89.6%) 15,672 (9.8%) 144,024 (90.2%)
*Note estimated coverage of 28% joint replacement volume US 2016.
8
Prostheses
The core prosthetic components that are used in HA are a femoral head and stemmed
femoral prosthesis, and additionally an acetabular cup and liner in THA. Given that our
review investigates peri-prosthetic femoral fracture (PFF) only, acetabular cup and liner
prostheses will not be discussed in further detail.
Femoral stem
The stemmed femoral prosthesis transfers load from the prosthetic femoral head to the
native femur and comes in two broad categories, including cemented and press-fit
(cementless) stems. Femoral stem prosthesis behaviour within the femoral canal is impacted
by many factors including both implant (prosthesis and instrumentation) and patient bone
quality. Implant factors include; stem finish (polished or roughened/coated), stem geometry,
encompassing shape (straight or anatomical), cross-section (oval or square), collared or
collarless, stem tip shape, length of stem, the degree of rounding of edges and preparation of
femoral canal. (Scheerlinck and Casteleyn 2006, Khanuja, Vakil et al. 2011). In the case of
cemented femoral systems, this load traverses the stem-cement and cement-bone interface.
During 2016, AOANJRR data reports that regarding HA, 35 different types of
femoral stem were implanted with over two-thirds of these being cemented. Furthermore,
regarding THA, 10 different types of femoral stem accounted for over two-thirds of the
femoral stems implanted (Australian Orthopeadic Association 2017). In contrast to HA
procedures, approximately two thirds of the femoral systems used in primary conventional
THA were cementless. This Australian registry data indicates there is a substantial variation
in the character of hip arthroplasty implants currently in use. It is important to recognise,
these characteristics may ultimately impact performance on an ‘implant to implant’ basis, let
alone the consideration of inter-surgeon variability.
9
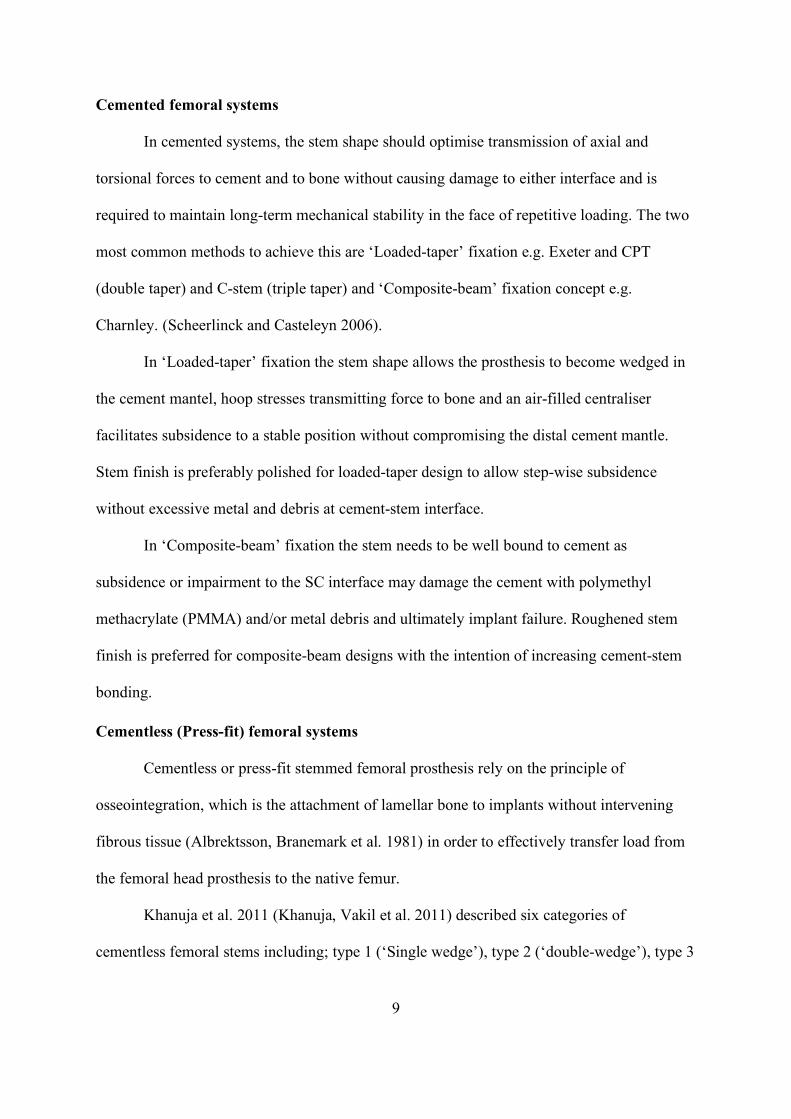
Cemented femoral systems
In cemented systems, the stem shape should optimise transmission of axial and
torsional forces to cement and to bone without causing damage to either interface and is
required to maintain long-term mechanical stability in the face of repetitive loading. The two
most common methods to achieve this are ‘Loaded-taper’ fixation e.g. Exeter and CPT
(double taper) and C-stem (triple taper) and ‘Composite-beam’ fixation concept e.g.
Charnley. (Scheerlinck and Casteleyn 2006).
In ‘Loaded-taper’ fixation the stem shape allows the prosthesis to become wedged in
the cement mantel, hoop stresses transmitting force to bone and an air-filled centraliser
facilitates subsidence to a stable position without compromising the distal cement mantle.
Stem finish is preferably polished for loaded-taper design to allow step-wise subsidence
without excessive metal and debris at cement-stem interface.
In ‘Composite-beam’ fixation the stem needs to be well bound to cement as
subsidence or impairment to the SC interface may damage the cement with polymethyl
methacrylate (PMMA) and/or metal debris and ultimately implant failure. Roughened stem
finish is preferred for composite-beam designs with the intention of increasing cement-stem
bonding.
Cementless (Press-fit) femoral systems
Cementless or press-fit stemmed femoral prosthesis rely on the principle of
osseointegration, which is the attachment of lamellar bone to implants without intervening
fibrous tissue (Albrektsson, Branemark et al. 1981) in order to effectively transfer load from
the femoral head prosthesis to the native femur.
Khanuja et al. 2011 (Khanuja, Vakil et al. 2011) described six categories of
cementless femoral stems including; type 1 (‘Single wedge’), type 2 (‘double-wedge’), type 3
10
(tapered round (3A), spline/cone (3B), tapered rectangle (3C)), type 4 (cylindrical fully
coated), type 5 (modular) and type 6 (anatomic).
Complications of hip arthroplasty
Requirement for revision arthroplasty is a significant complication following hip
arthroplasty, with fracture being in the top three reasons for revision based on Australian
registry data. Where fracture ranks depends on the indication and category and subtype of
index procedure e.g. bipolar vs unipolar modular HA for fractured neck of femur, and THA
for osteoarthritis of the hip vs neck of femur fracture (Table 2).
11
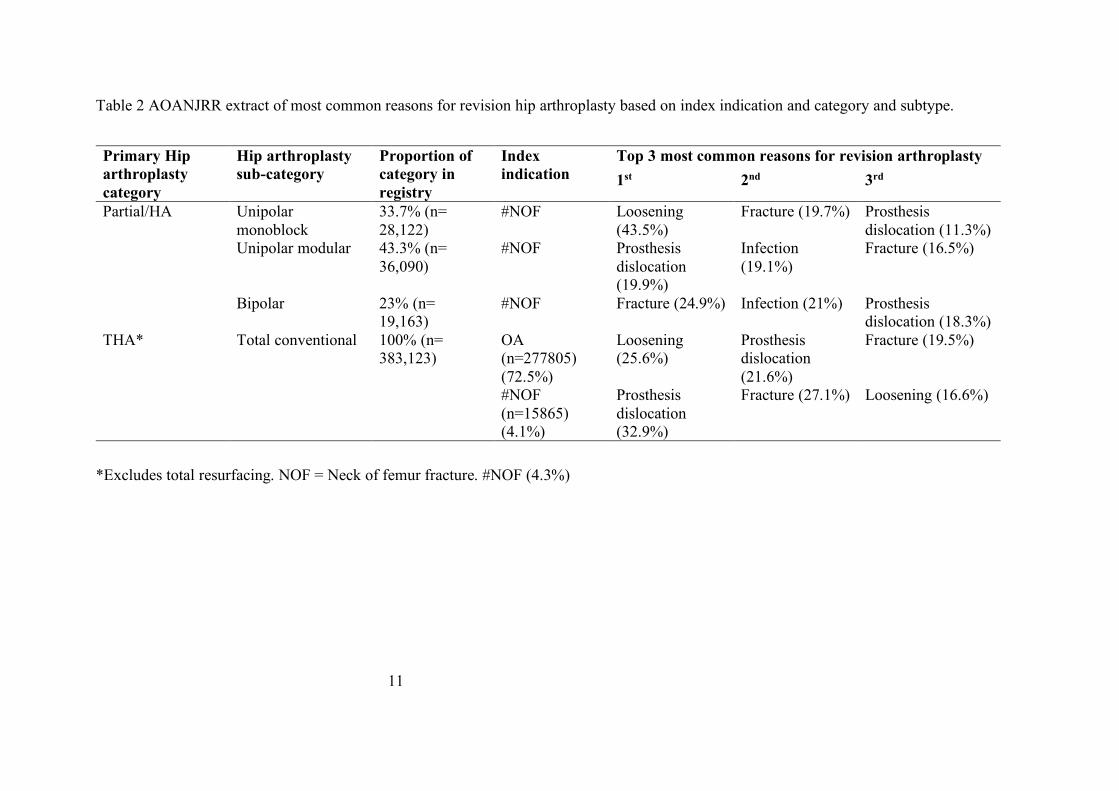
Table 2 AOANJRR extract of most common reasons for revision hip arthroplasty based on index indication and category and subtype.
Primary Hip arthroplasty category
Hip arthroplasty sub-category
Proportion of category in registry
Index indication
Top 3 most common reasons for revision arthroplasty 1st 2nd 3rd
Partial/HA Unipolar monoblock
33.7% (n= 28,122)
#NOF Loosening (43.5%)
Fracture (19.7%) Prosthesis dislocation (11.3%)
Unipolar modular 43.3% (n= 36,090)
#NOF Prosthesis dislocation (19.9%)
Infection (19.1%)
Fracture (16.5%)
Bipolar 23% (n= 19,163)
#NOF Fracture (24.9%) Infection (21%) Prosthesis dislocation (18.3%)
THA* Total conventional 100% (n= 383,123)
OA (n=277805) (72.5%)
Loosening (25.6%)
Prosthesis dislocation (21.6%)
Fracture (19.5%)
#NOF (n=15865) (4.1%)
Prosthesis dislocation (32.9%)
Fracture (27.1%) Loosening (16.6%)
*Excludes total resurfacing. NOF = Neck of femur fracture. #NOF (4.3%)
12
Peri-prosthetic femoral fracture (PFF) around hip arthroplasty
Post-operative PFFs usually occur during minor trauma with epidemiological studies
revealing a lifetime incidence anywhere between 0.4% to 3.5% for primary THA and around
4% following revision THA (Kavanagh 1992, Berry 1999, Lindahl, Garellick et al. 2006,
Abdel, Houdek et al. 2016) being more common in uncemented femoral systems. With regard
to HA, incidence of PFF has been estimated between 2 to 4 percent for cementless implants
and 0.5 to 1 percent for cemented implants (McGraw, Spence et al. 2013, Phillips, Moran
et al. 2013). Alarmingly, PFF rates have been projected in a recent analysis of multiple joint
registries to increase by 4.6% every decade over the next 30 years (Pivec, Issa et al. 2015).
Intra-operative PFFs usually occur during femoral stem implantation and are classified
differently to post-operative PFFs and are therefore not dealt with in our study (Greidanus,
Mitchell et al. 2003).
Risk factors for PFF include patient gender, increasing age, osteoporosis, and type of
implant; with cementless femoral components having a higher incidence of post-operative
PFF (Berend, Smith et al. 2006, Lindahl 2007). Stress risers in femoral cortical bone may
occur during broaching intra-operatively, however, they may not fracture until an enticing
event such as a simple low energy fall post-operatively. It is important to note intra-operative
PFF may go un-noticed, which is a limitation of investigating PPFs.
PFF burden
Mortality risk for PFF varies in the literature. Young and colleagues and
Bhattacharyya and colleagues (Bhattacharyya, Chang et al. 2007, Young, Walker et al. 2008)
reported an overall 11% increase in risk of death within 12 months of experiencing the
complication. Furthermore, Shields et al. 2014 (Shields, Behrend et al. 2014) revealed a
1 year mortality of 18%, with 80% of deaths occurring within the first 3 months. If the
13
patients do survive, even with surgical treatment, they are four times more likely to require
re-admission post-operatively due to complications and are often left with a functional
limitation (Carli, Negus et al. 2017).
Economic analysis of PFF management around hip arthroplasties raises an additional
challenge for all stakeholders, with an average cost estimate of £23,469 per patient reported
in the United Kingdom setting between 1999-2009 (Phillips, Boulton et al. 2011).
Furthermore, Shields et al. 2014 (Shields, Behrend et al. 2014) reported an economic analysis
on treatment costs for PFF being around $50,000 USD for revision arthroplasty and $25,000
USD for ORIF.
A multi-disciplinary approach is required for management of such fractures with both
orthopaedic traumatologists and arthroplasty surgeons fundamental in the planning and
execution of surgical intervention. The Vancouver classification system, devised by Brady
et al. 1999 (Brady, Garbuz et al. 1999), is the most commonly utilised system for classifying
peri-prosthetic fractures around hip arthroplasties. This classification system has been shown
to be both reliable and valid (Brady, Garbuz et al. 1999, Brady, Garbuz et al. 2000). The
system considers the site of fracture, stability of implant and quality of surrounding bone
stock, which are collective pillars for management decision-making. Type A fractures are
confined to the greater or lesser trochanter. Type B fractures are diaphyseal, around the
prosthesis or immediately distal to it and are further classified into type; B1, B2 and B3,
characterised by: a well-fixed stem, an unstable stem with sufficient bone stock and an
unstable stem with poor quality bone stock, respectively. Type C is significantly distal to the
prosthetic tip.
14
Vancouver B2 PFF Management
Broadly, goals of PFF are facilitating early weight bearing without compromising
fracture healing and return to pain free functional status. The Swedish National Hip
Arthroplasty Registry data spanning from 1979-2000 identified 1,049 PFFs, with over half
being Vancouver type B2 (52%) (Lindahl, Garellick et al. 2006). Vancouver type B2 fracture
management recommendations are currently that of long femoral stem revision arthroplasty,
with or without internal fixation, with the aim of re-establishing implant stability and
facilitating a fracture healing (Masri, Meek et al. 2004, Abdel, Cottino et al. 2015). In most
cases, revision femoral arthroplasty involves open surgical dislocation of the hip, removal of
the loose femoral implant and exchange for an uncemented long stem prosthesis which
bypasses the fracture site (Abdel, Cottino et al. 2015).
Open reduction and internal fixation (ORIF) for Vancouver B2 fractures has not
traditionally been recommended due to the non-union rates, prolonged immobilisation
periods and risk of further revision surgery being required for an unstable femoral implant
(Lindahl, Garellick et al. 2006, Solomon, Hussenbocus et al. 2015).
In contrast to revision, ORIF strategies generally attract a shorter operative time and
involve surgical dissection to directly visualise the fracture site, anatomical reduction and
subsequent internal fixation with plates, screws which are temporised with clamping tools
and subsequently internally fixed with plate(s), screws or allografts or a combination.
Common fixation strategies include locking plates, compression plates, or cables with or
without cortical strut allografts (Dehghan, McKee et al. 2014).
Context of the systematic review
At the time of systematic review protocol registration, a modest amount of literature
existed assessing the outcomes of Vancouver type B2 fracture management by way of ORIF
15
and femoral revision with or without internal fixation. Our scoping search revealed
approximately 1000 published cases of Vancouver type B2 fracture management in the
literature, including case studies, case series and cohort studies.
Although revision arthroplasty is currently recommended for management of
Vancouver Type B2 PFFs, open reduction internal fixation (ORIF) has been shown in some
small studies to yield similar outcomes when compared to revision (Solomon, Hussenbocus
et al. 2015, Joestl, Hofbauer et al. 2016). If selected Vancouver type B2 fractures were shown
to be amenable to ORIF alone rather than revision, it would be beneficial given that much
intra-operative risk would be mitigated by way of shorter operative times; there is a reduction
in skill set demands upon the surgeon, reduced implant costs, and allowance for subsequent
revision in arthroplasty in younger individuals.
On the 4th of August 2016, we searched the JBI Database of Systematic Reviews and
Implementation Reports, Cochrane Database of Systematic Reviews and PubMed and found
no recent systematic review specifically on Vancouver B2 PFF management. Our systematic
review protocol was published in February 2017.
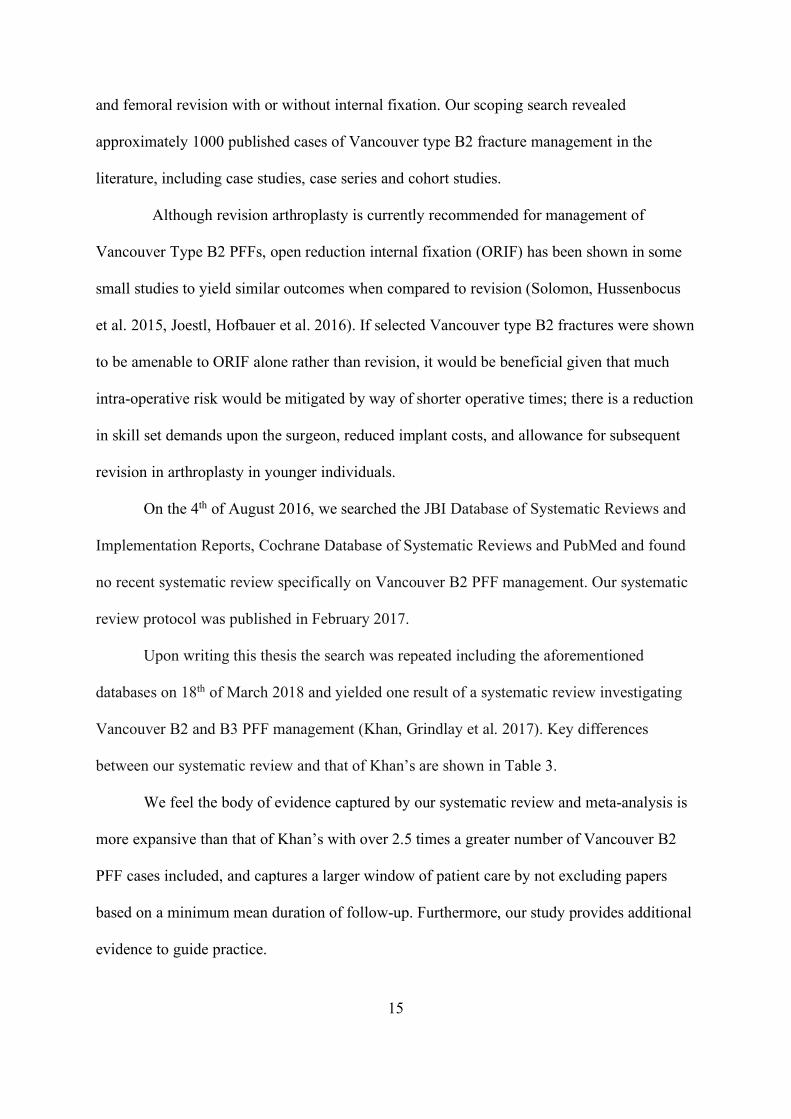
Upon writing this thesis the search was repeated including the aforementioned
databases on 18th of March 2018 and yielded one result of a systematic review investigating
Vancouver B2 and B3 PFF management (Khan, Grindlay et al. 2017). Key differences
between our systematic review and that of Khan’s are shown in Table 3.
We feel the body of evidence captured by our systematic review and meta-analysis is
more expansive than that of Khan’s with over 2.5 times a greater number of Vancouver B2
PFF cases included, and captures a larger window of patient care by not excluding papers
based on a minimum mean duration of follow-up. Furthermore, our study provides additional
evidence to guide practice.

16
17
Table 3 Main differences between the systematic reviews.
(Khan, Grindlay et al. 2017) Ianunzio PROSPERO registration
Registration 5/2/2016, completion 7/3/2017 Registration 20/2/2017 and publication protocol Feb 2017 (Ianunzio, Munn et al. 2017)
Databases Ovid MEDLINE, Embase, and the Cochrane Central Register of Controlled Trials and Database of Systematic Reviews
PubMed Medline, EMBASE, CINAHL, The Cochrane Central Register of Controlled Trials (CENTRAL) and Web of Science. And grey literature databases were searched, including; ClinicalTrials.gov and Proquest Theses and Dissertations.
Inclusion criteria Conducted search on both B2 and/or B3 fractures, studies with 10 or more case
Inclusion criteria and analysis on B2 fractures only, studies with 5 or more B2 PFF
Exclusion criteria Excluded studies with less than 2-year mean follow-up, no exclusion based on publication date
Did not exclude studies based on follow-up duration, excluded papers published prior to 1990
Number of studies included Khan included 14 studies including 14 case series
37 studies including 27 retrospective case series and 10 retrospective cohort studies
Number of Vancouver B2 PFF management cases included
n=343 n=926
18
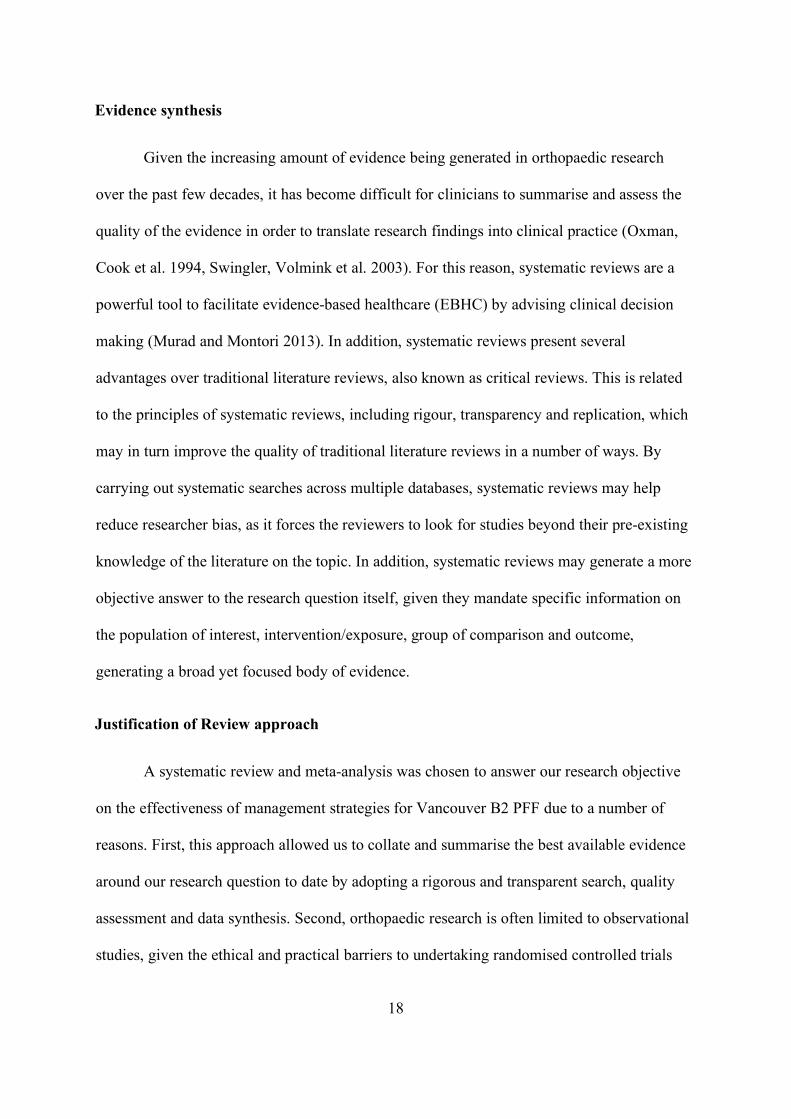
Evidence synthesis
Given the increasing amount of evidence being generated in orthopaedic research
over the past few decades, it has become difficult for clinicians to summarise and assess the
quality of the evidence in order to translate research findings into clinical practice (Oxman,
Cook et al. 1994, Swingler, Volmink et al. 2003). For this reason, systematic reviews are a
powerful tool to facilitate evidence-based healthcare (EBHC) by advising clinical decision
making (Murad and Montori 2013). In addition, systematic reviews present several
advantages over traditional literature reviews, also known as critical reviews. This is related
to the principles of systematic reviews, including rigour, transparency and replication, which
may in turn improve the quality of traditional literature reviews in a number of ways. By
carrying out systematic searches across multiple databases, systematic reviews may help
reduce researcher bias, as it forces the reviewers to look for studies beyond their pre-existing
knowledge of the literature on the topic. In addition, systematic reviews may generate a more
objective answer to the research question itself, given they mandate specific information on
the population of interest, intervention/exposure, group of comparison and outcome,
generating a broad yet focused body of evidence.
Justification of Review approach
A systematic review and meta-analysis was chosen to answer our research objective
on the effectiveness of management strategies for Vancouver B2 PFF due to a number of
reasons. First, this approach allowed us to collate and summarise the best available evidence
around our research question to date by adopting a rigorous and transparent search, quality
assessment and data synthesis. Second, orthopaedic research is often limited to observational
studies, given the ethical and practical barriers to undertaking randomised controlled trials
19
(RCTs). Specifically, in relation to our objective, randomising exposure allocation would
require unanimous support of surgeons within a unit, as well as flexible skill sets, which
would enable them to perform either intervention in a reproducible way. In addition, the cost
and time burden associated with running such an RCT would not be feasible without
significant funding from government and health industry, which has ethical implications.
Finally, even if a large, high-quality RCT was conducted, it may still not be enough to guide
clinical practice. In light of this, a systematic review and meta-analysis (where heterogeneity
allows) is seen as an effective research tool which can be conducted in a timely fashion and
generate good quality evidence, which can be rapidly translated into clinical practice.
There are a number of factors that characterise a rigorous systematic review. Firstly,
the systematic review should explicitly declare the review questions as well as the eligibility
criteria before the search across databases. Globally, the process should follow the guidelines
from Preferred Reporting Items for Systematic reviews and Meta-Analyses (PRISMA)
(Moher, Liberati et al. 2009) and be published in the form of a protocol in reliable databases,
such as PROSPERO. Furthermore, the search strategy should be tailored to the clinical
question and cover multiple databases, ideally including the grey literature, and be subject to
dual critical appraisal using an approved checklist, such as the tool provided by the Joanna
Briggs Institute. Where heterogeneity allows, meta-analyses should be performed, and forest-
plots generated to summarise pooled estimates from single group and comparative studies.
Finally, the Grading of Recommendations Assessment, Development and Evaluation
(GRADE) approach should be employed to generate a Summary of Findings Table where
appropriate.
Objectives, inclusion criteria and methods were specified in advance and published in
a protocol (Ianunzio, Munn et al. 2017) and registration number CRD42017057776 in
PROSPERO.

20
Assumptions and limitations of approach
Although systematic reviews and meta-analysis provide a good level of evidence, the
quality of the review is associated with the methodological quality of the included studies
themselves. Therefore, the quality of the systematic review cannot be superior to that of the
included studies. Unfortunately, orthopaedic research is often of low quality and this limits
the findings presented in this current study.

21
Chapter 2- Methods

23
Inclusion and exclusion criteria
Types of participants
The review considered studies including individuals with a total hip arthroplasty or hip
hemi-arthroplasty, primary or revision, who sustained a Vancouver type B2, or
equivalent, PFF. Those who sustained intra-operative fractures were excluded, given the
classification system is different. Additionally, studies utilising alternative methods of
classification other than Vancouver or equivalent were excluded.
Types of interventions
This review considered studies that evaluate the following:
• ORIF by any method including but not limited to, cable plate, compression plate,
locking plates, screws, cerclage wires, cortical strut allografts or a combination of
methods; and/or
• Any form of femoral revision arthroplasty, with or without internal fixation.
The review compared the aforementioned interventions with each other. Studies that have
evaluated two or more interventions and studies that have investigated only a single
intervention were considered for inclusion. If any of the interventions were compared
with a different approach, including non-operative management, these were considered
for inclusion.

25
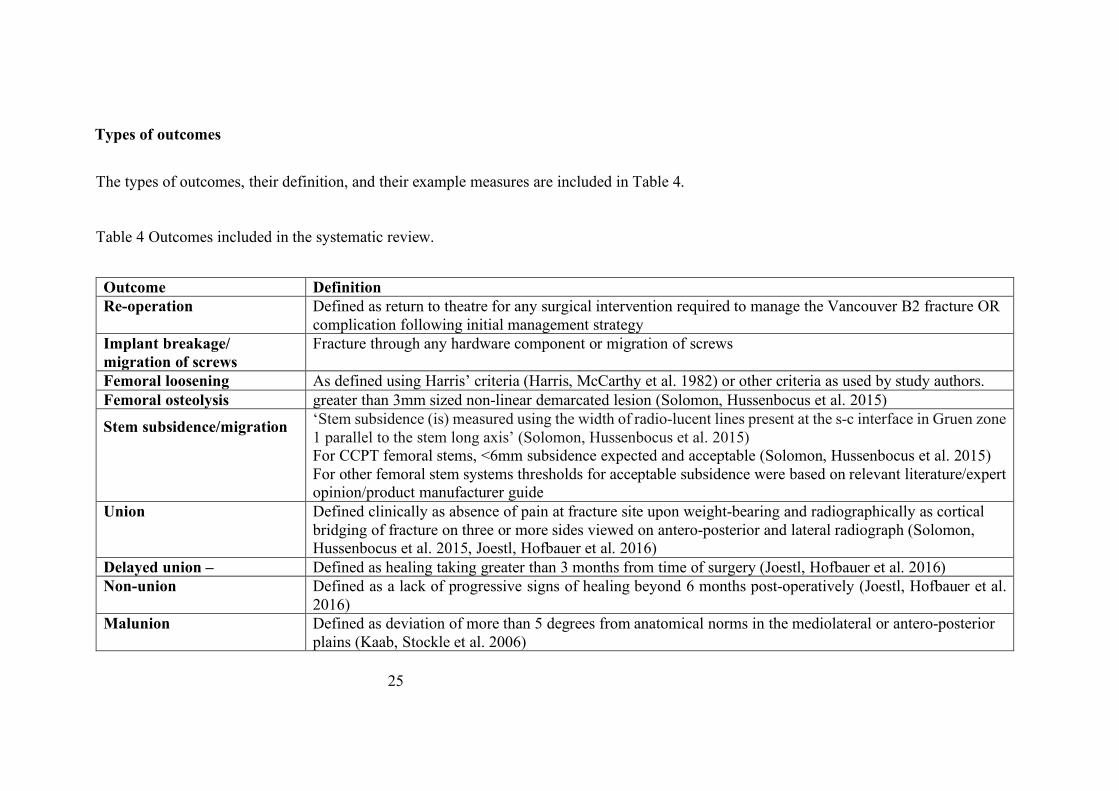
Types of outcomes
The types of outcomes, their definition, and their example measures are included in Table 4.
Table 4 Outcomes included in the systematic review.
Outcome Definition Re-operation Defined as return to theatre for any surgical intervention required to manage the Vancouver B2 fracture OR
complication following initial management strategy Implant breakage/ migration of screws
Fracture through any hardware component or migration of screws
Femoral loosening As defined using Harris’ criteria (Harris, McCarthy et al. 1982) or other criteria as used by study authors. Femoral osteolysis greater than 3mm sized non-linear demarcated lesion (Solomon, Hussenbocus et al. 2015)
Stem subsidence/migration
‘Stem subsidence (is) measured using the width of radio-lucent lines present at the s-c interface in Gruen zone 1 parallel to the stem long axis’ (Solomon, Hussenbocus et al. 2015) For CCPT femoral stems, <6mm subsidence expected and acceptable (Solomon, Hussenbocus et al. 2015) For other femoral stem systems thresholds for acceptable subsidence were based on relevant literature/expert opinion/product manufacturer guide
Union Defined clinically as absence of pain at fracture site upon weight-bearing and radiographically as cortical bridging of fracture on three or more sides viewed on antero-posterior and lateral radiograph (Solomon, Hussenbocus et al. 2015, Joestl, Hofbauer et al. 2016)
Delayed union – Defined as healing taking greater than 3 months from time of surgery (Joestl, Hofbauer et al. 2016) Non-union Defined as a lack of progressive signs of healing beyond 6 months post-operatively (Joestl, Hofbauer et al.
2016) Malunion Defined as deviation of more than 5 degrees from anatomical norms in the mediolateral or antero-posterior
plains (Kaab, Stockle et al. 2006)
26
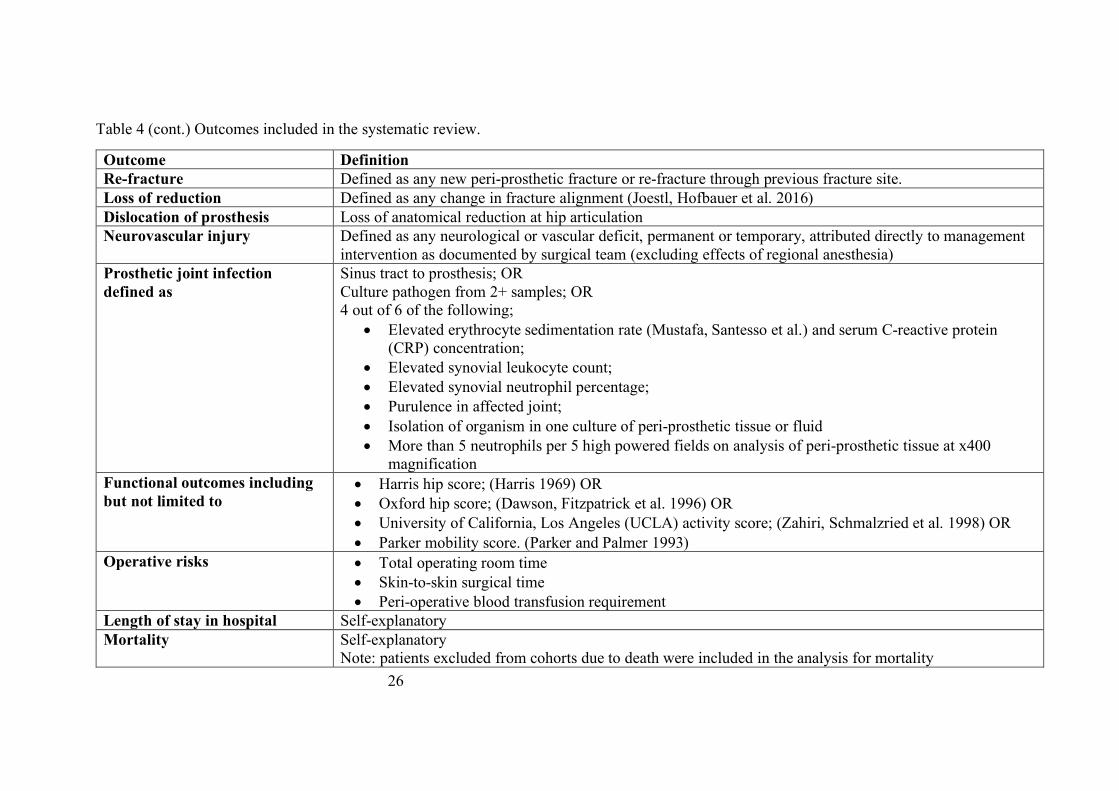
Table 4 (cont.) Outcomes included in the systematic review.
Outcome Definition Re-fracture Defined as any new peri-prosthetic fracture or re-fracture through previous fracture site. Loss of reduction Defined as any change in fracture alignment (Joestl, Hofbauer et al. 2016) Dislocation of prosthesis Loss of anatomical reduction at hip articulation Neurovascular injury Defined as any neurological or vascular deficit, permanent or temporary, attributed directly to management
intervention as documented by surgical team (excluding effects of regional anesthesia) Prosthetic joint infection defined as
Sinus tract to prosthesis; OR Culture pathogen from 2+ samples; OR 4 out of 6 of the following;
• Elevated erythrocyte sedimentation rate (Mustafa, Santesso et al.) and serum C-reactive protein (CRP) concentration;
• Elevated synovial leukocyte count; • Elevated synovial neutrophil percentage; • Purulence in affected joint; • Isolation of organism in one culture of peri-prosthetic tissue or fluid • More than 5 neutrophils per 5 high powered fields on analysis of peri-prosthetic tissue at x400
magnification Functional outcomes including but not limited to
• Harris hip score; (Harris 1969) OR • Oxford hip score; (Dawson, Fitzpatrick et al. 1996) OR • University of California, Los Angeles (UCLA) activity score; (Zahiri, Schmalzried et al. 1998) OR • Parker mobility score. (Parker and Palmer 1993)
Operative risks • Total operating room time • Skin-to-skin surgical time • Peri-operative blood transfusion requirement
Length of stay in hospital Self-explanatory Mortality Self-explanatory
Note: patients excluded from cohorts due to death were included in the analysis for mortality
27
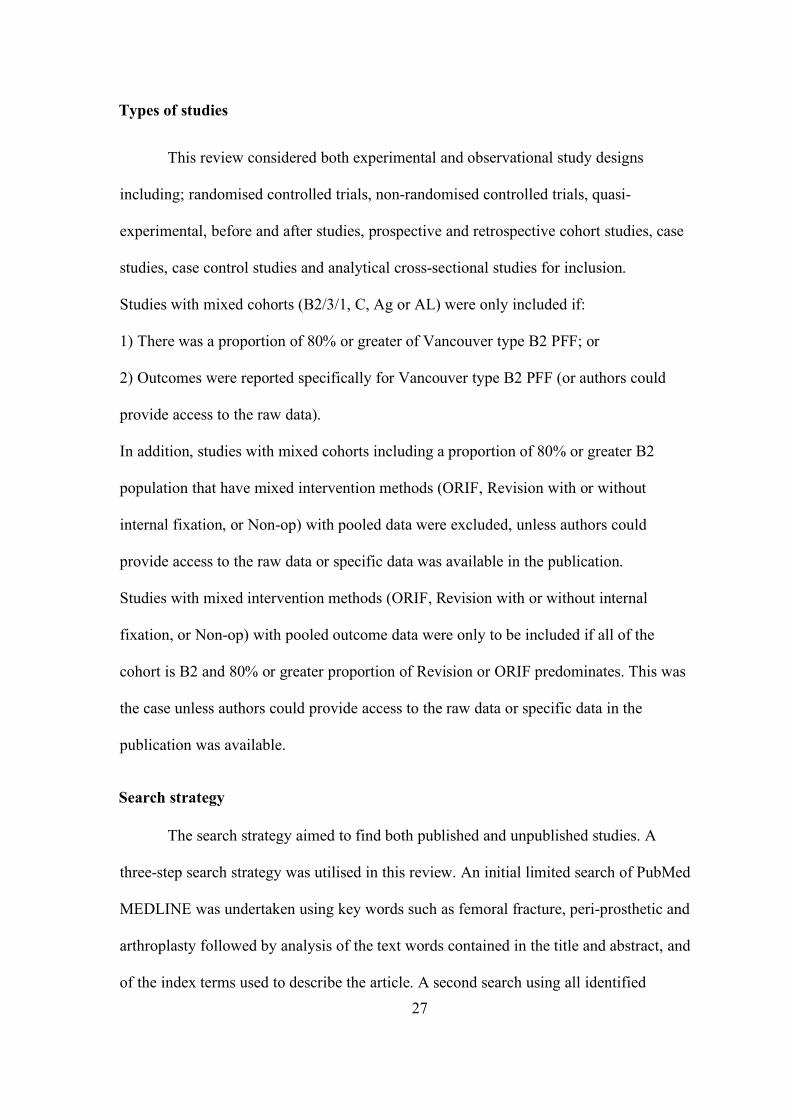
Types of studies
This review considered both experimental and observational study designs
including; randomised controlled trials, non-randomised controlled trials, quasi-
experimental, before and after studies, prospective and retrospective cohort studies, case
studies, case control studies and analytical cross-sectional studies for inclusion.
Studies with mixed cohorts (B2/3/1, C, Ag or AL) were only included if:
1) There was a proportion of 80% or greater of Vancouver type B2 PFF; or
2) Outcomes were reported specifically for Vancouver type B2 PFF (or authors could
provide access to the raw data).
In addition, studies with mixed cohorts including a proportion of 80% or greater B2
population that have mixed intervention methods (ORIF, Revision with or without
internal fixation, or Non-op) with pooled data were excluded, unless authors could
provide access to the raw data or specific data was available in the publication.
Studies with mixed intervention methods (ORIF, Revision with or without internal
fixation, or Non-op) with pooled outcome data were only to be included if all of the
cohort is B2 and 80% or greater proportion of Revision or ORIF predominates. This was
the case unless authors could provide access to the raw data or specific data in the
publication was available.
Search strategy
The search strategy aimed to find both published and unpublished studies. A
three-step search strategy was utilised in this review. An initial limited search of PubMed
MEDLINE was undertaken using key words such as femoral fracture, peri-prosthetic and
arthroplasty followed by analysis of the text words contained in the title and abstract, and
of the index terms used to describe the article. A second search using all identified
28
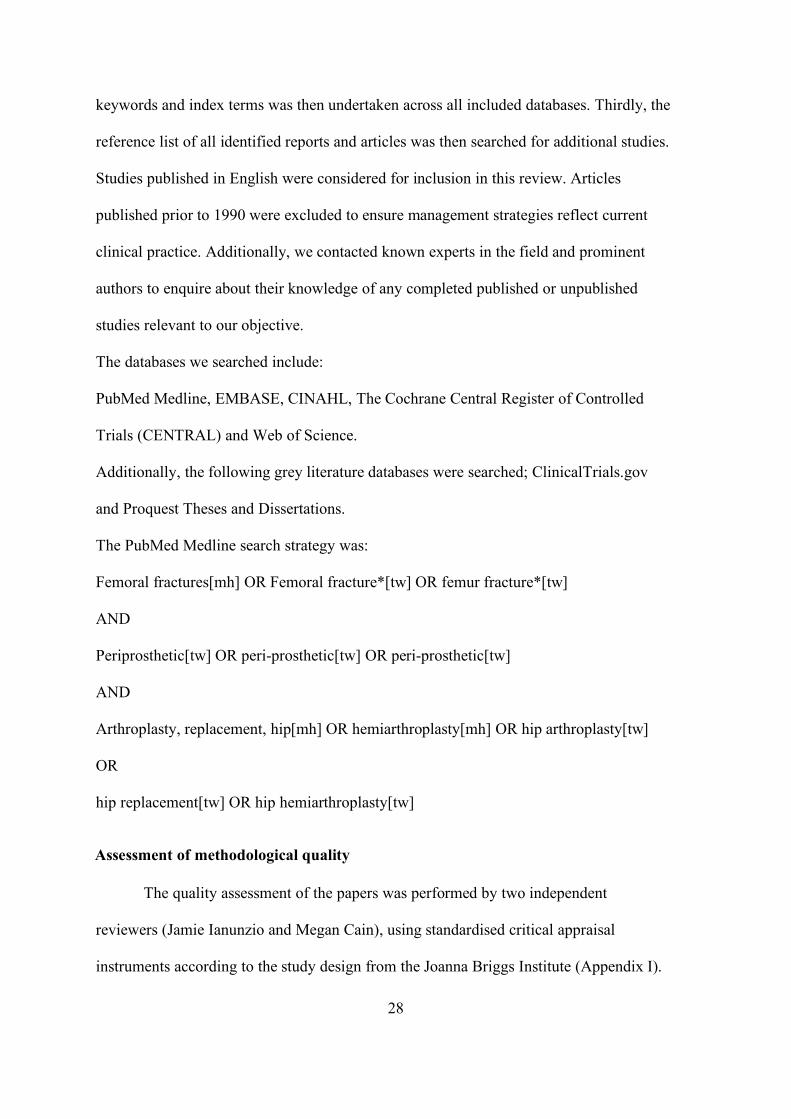
keywords and index terms was then undertaken across all included databases. Thirdly, the
reference list of all identified reports and articles was then searched for additional studies.
Studies published in English were considered for inclusion in this review. Articles
published prior to 1990 were excluded to ensure management strategies reflect current
clinical practice. Additionally, we contacted known experts in the field and prominent
authors to enquire about their knowledge of any completed published or unpublished
studies relevant to our objective.
The databases we searched include:
PubMed Medline, EMBASE, CINAHL, The Cochrane Central Register of Controlled
Trials (CENTRAL) and Web of Science.
Additionally, the following grey literature databases were searched; ClinicalTrials.gov
and Proquest Theses and Dissertations.
The PubMed Medline search strategy was:
Femoral fractures[mh] OR Femoral fracture*[tw] OR femur fracture*[tw]
AND
Periprosthetic[tw] OR peri-prosthetic[tw] OR peri-prosthetic[tw]
AND
Arthroplasty, replacement, hip[mh] OR hemiarthroplasty[mh] OR hip arthroplasty[tw]
OR
hip replacement[tw] OR hip hemiarthroplasty[tw]
Assessment of methodological quality
The quality assessment of the papers was performed by two independent
reviewers (Jamie Ianunzio and Megan Cain), using standardised critical appraisal
instruments according to the study design from the Joanna Briggs Institute (Appendix I).
29
The instruments consist of 9 or 10 ‘yes/no/unclear’ questions, depending on the study
design, regarding different aspects of the included papers aiming to assess the quality of
the papers. Both the reviewers were properly trained by attending a course to apply the
above-mentioned instrument. The critical appraisal was compared and in case of
disagreement a third reviewer’s opinion was sought for further discussion. All articles
were included in the systematic review regardless of their methodological quality.
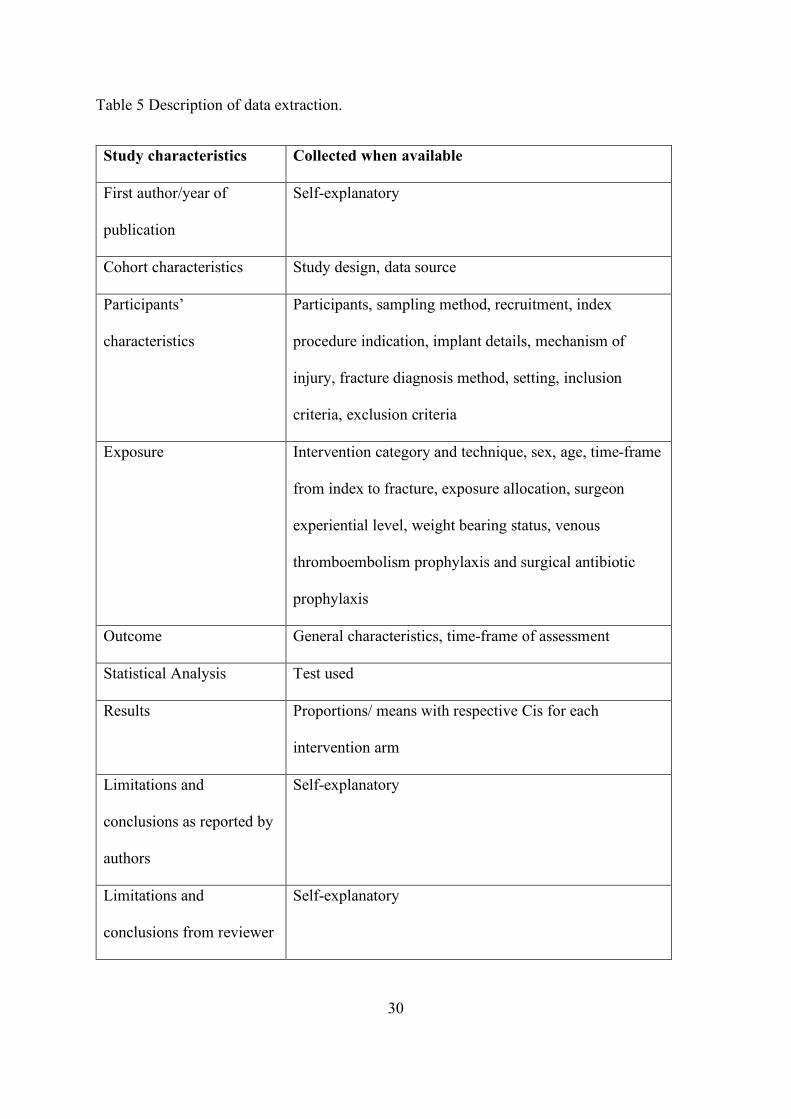
Data extraction
Data was extracted from papers included in the review using the standardised data
extraction tool from JBI-System for the Unified Management, Assessment and Review of
Information (SUMARI) (Appendix II). The data extracted included specific details about
the interventions, populations, study methods and outcomes of significance to the review
objective and specific objectives. In the event of data of interest being absent in the
published article(s), raw data was requested via direct contact with corresponding
author(s) and we allowed them 4 weeks to respond. We sought raw data in 37 studies and
obtained a response from 10 studies, with only three providing raw data. Table 5 presents
the detailed information collected for each study.
30
Table 5 Description of data extraction.
Study characteristics Collected when available
First author/year of
publication
Self-explanatory
Cohort characteristics Study design, data source
Participants’
characteristics
Participants, sampling method, recruitment, index
procedure indication, implant details, mechanism of
injury, fracture diagnosis method, setting, inclusion
criteria, exclusion criteria
Exposure Intervention category and technique, sex, age, time-frame
from index to fracture, exposure allocation, surgeon
experiential level, weight bearing status, venous
thromboembolism prophylaxis and surgical antibiotic
prophylaxis
Outcome General characteristics, time-frame of assessment
Statistical Analysis Test used
Results Proportions/ means with respective Cis for each
intervention arm
Limitations and
conclusions as reported by
authors
Self-explanatory
Limitations and
conclusions from reviewer
Self-explanatory
31
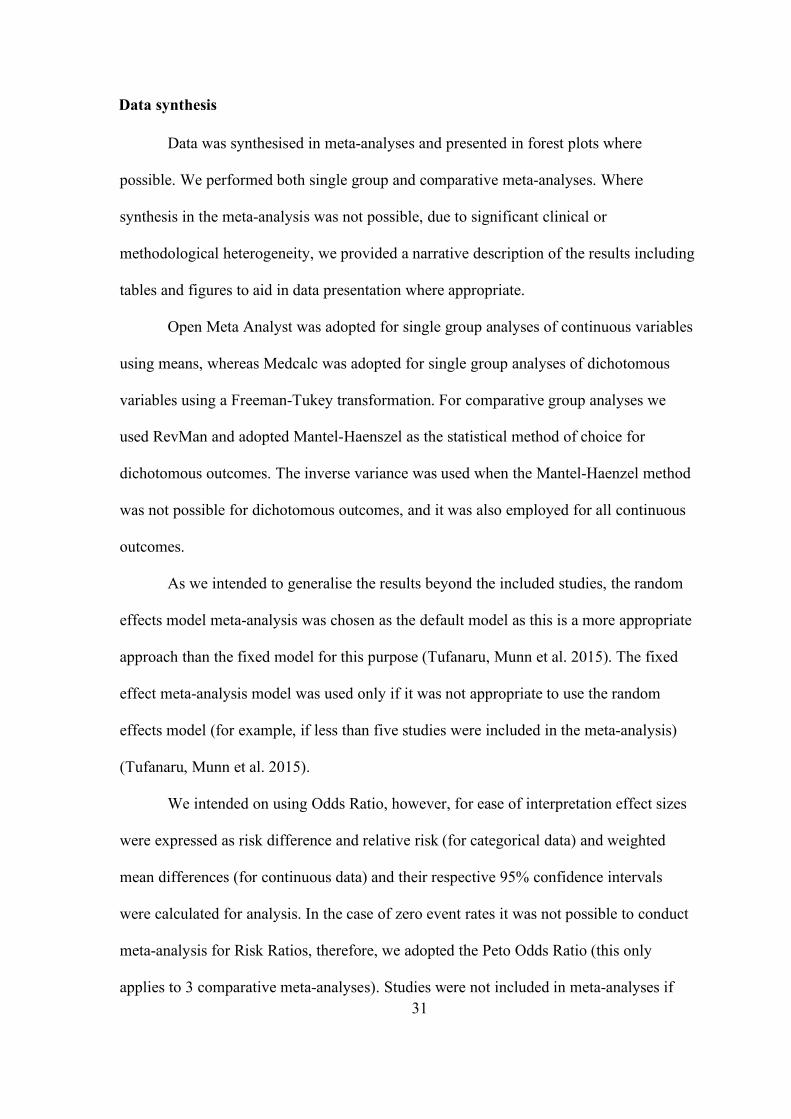
Data synthesis
Data was synthesised in meta-analyses and presented in forest plots where
possible. We performed both single group and comparative meta-analyses. Where
synthesis in the meta-analysis was not possible, due to significant clinical or
methodological heterogeneity, we provided a narrative description of the results including
tables and figures to aid in data presentation where appropriate.
Open Meta Analyst was adopted for single group analyses of continuous variables
using means, whereas Medcalc was adopted for single group analyses of dichotomous
variables using a Freeman-Tukey transformation. For comparative group analyses we
used RevMan and adopted Mantel-Haenszel as the statistical method of choice for
dichotomous outcomes. The inverse variance was used when the Mantel-Haenzel method
was not possible for dichotomous outcomes, and it was also employed for all continuous
outcomes.
As we intended to generalise the results beyond the included studies, the random
effects model meta-analysis was chosen as the default model as this is a more appropriate
approach than the fixed model for this purpose (Tufanaru, Munn et al. 2015). The fixed
effect meta-analysis model was used only if it was not appropriate to use the random
effects model (for example, if less than five studies were included in the meta-analysis)
(Tufanaru, Munn et al. 2015).
We intended on using Odds Ratio, however, for ease of interpretation effect sizes
were expressed as risk difference and relative risk (for categorical data) and weighted
mean differences (for continuous data) and their respective 95% confidence intervals
were calculated for analysis. In the case of zero event rates it was not possible to conduct
meta-analysis for Risk Ratios, therefore, we adopted the Peto Odds Ratio (this only
applies to 3 comparative meta-analyses). Studies were not included in meta-analyses if
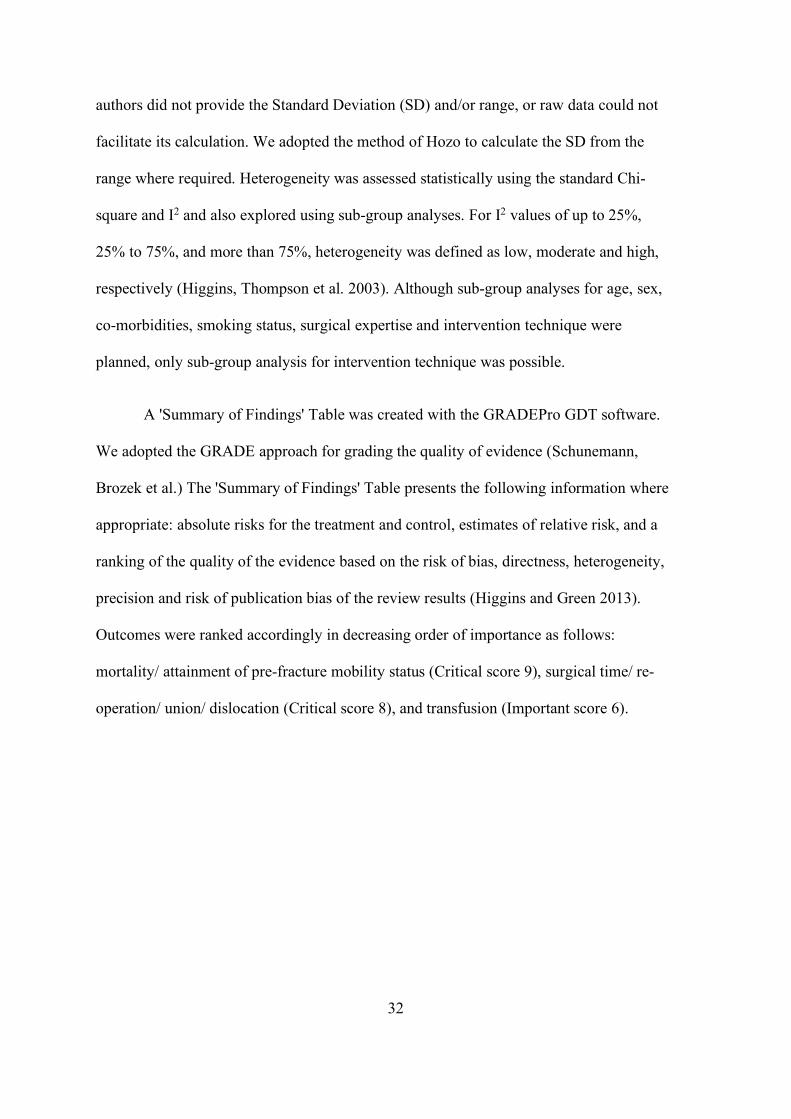
32
authors did not provide the Standard Deviation (SD) and/or range, or raw data could not
facilitate its calculation. We adopted the method of Hozo to calculate the SD from the
range where required. Heterogeneity was assessed statistically using the standard Chi-
square and I2 and also explored using sub-group analyses. For I2 values of up to 25%,
25% to 75%, and more than 75%, heterogeneity was defined as low, moderate and high,
respectively (Higgins, Thompson et al. 2003). Although sub-group analyses for age, sex,
co-morbidities, smoking status, surgical expertise and intervention technique were
planned, only sub-group analysis for intervention technique was possible.
A 'Summary of Findings' Table was created with the GRADEPro GDT software.
We adopted the GRADE approach for grading the quality of evidence (Schunemann,
Brozek et al.) The 'Summary of Findings' Table presents the following information where
appropriate: absolute risks for the treatment and control, estimates of relative risk, and a
ranking of the quality of the evidence based on the risk of bias, directness, heterogeneity,
precision and risk of publication bias of the review results (Higgins and Green 2013).
Outcomes were ranked accordingly in decreasing order of importance as follows:
mortality/ attainment of pre-fracture mobility status (Critical score 9), surgical time/ re-
operation/ union/ dislocation (Critical score 8), and transfusion (Important score 6).

33
Chapter 3 - Results
34
Search results
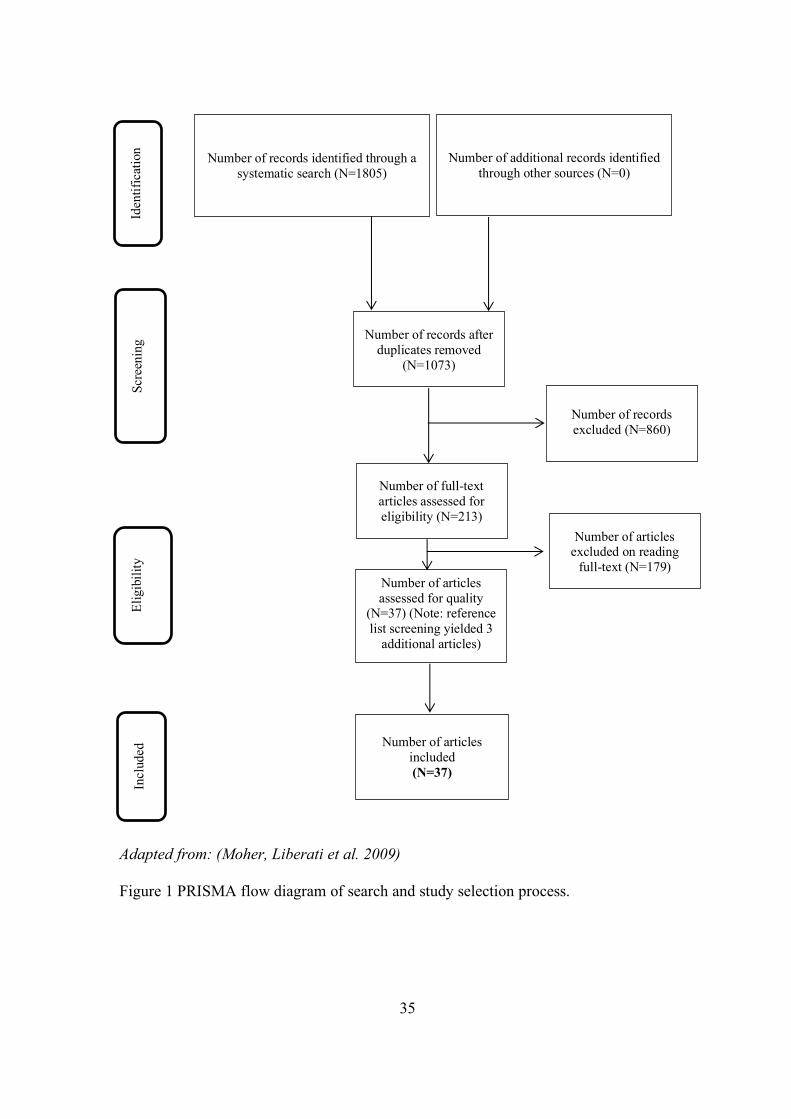
Figure 1 shows a flowchart of the study selection. From the electronic searches,
1805 potential articles were found, of which 860 duplicates were removed. In the first
screening, 213 studies were selected for full text reading. The reference lists of these
articles revealed another 45 articles, and a total of 258 studies were selected for full-text
reading. After the evaluation, 37 studies were finally included in the systematic review.
The main reasons for exclusion were inclusion of mixed exposures and pooled outcomes
(n=39), none (n=33) or less than 5 B2 PPF (n=33), and studies not written in English
(n=20) (Appendix III).
35
v Adapted from: (Moher, Liberati et al. 2009) Figure 1 PRISMA flow diagram of search and study selection process.
Number of records identified through a systematic search (N=1805)
Number of additional records identified through other sources (N=0)
Number of records after duplicates removed
(N=1073)
Number of records excluded (N=860)
Number of full-text articles assessed for eligibility (N=213)
Number of articles excluded on reading
full-text (N=179) Number of articles assessed for quality
(N=37) (Note: reference list screening yielded 3
additional articles)
Number of articles included (N=37)
Iden
tific
atio
n Sc
reen
ing
Elig
ibil i
ty
Incl
uded
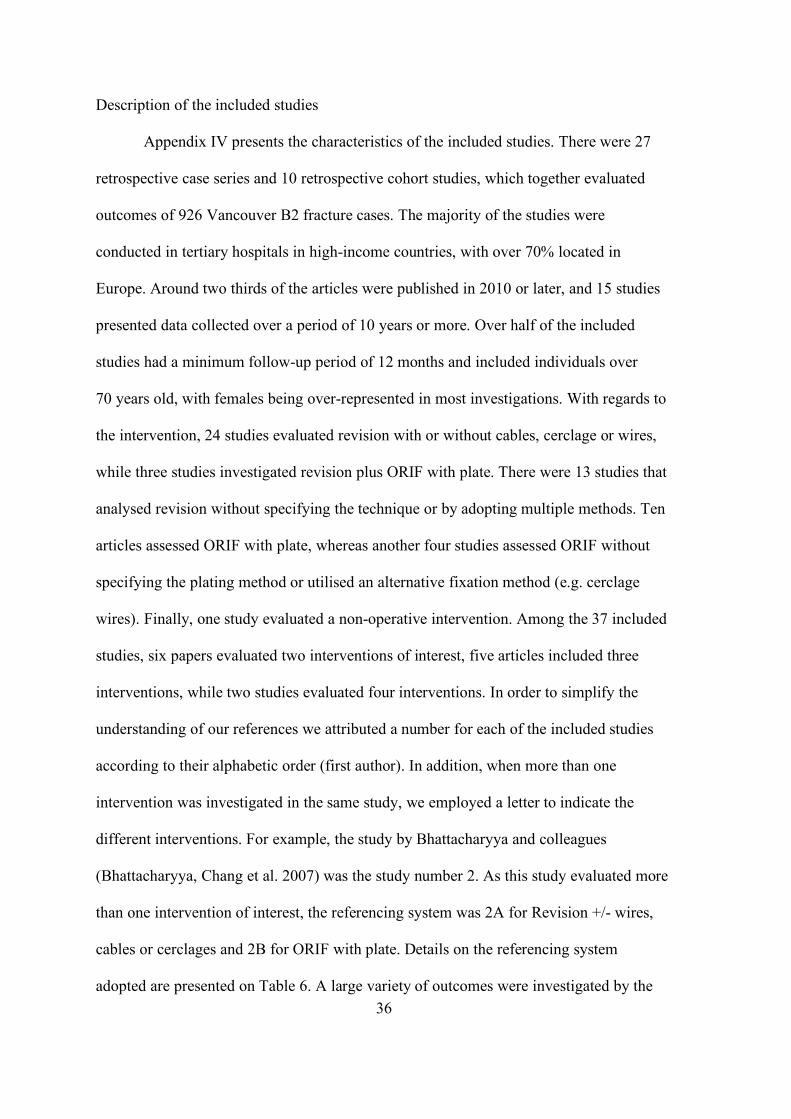
36
Description of the included studies
Appendix IV presents the characteristics of the included studies. There were 27
retrospective case series and 10 retrospective cohort studies, which together evaluated
outcomes of 926 Vancouver B2 fracture cases. The majority of the studies were
conducted in tertiary hospitals in high-income countries, with over 70% located in
Europe. Around two thirds of the articles were published in 2010 or later, and 15 studies
presented data collected over a period of 10 years or more. Over half of the included
studies had a minimum follow-up period of 12 months and included individuals over
70 years old, with females being over-represented in most investigations. With regards to
the intervention, 24 studies evaluated revision with or without cables, cerclage or wires,
while three studies investigated revision plus ORIF with plate. There were 13 studies that
analysed revision without specifying the technique or by adopting multiple methods. Ten
articles assessed ORIF with plate, whereas another four studies assessed ORIF without
specifying the plating method or utilised an alternative fixation method (e.g. cerclage
wires). Finally, one study evaluated a non-operative intervention. Among the 37 included
studies, six papers evaluated two interventions of interest, five articles included three
interventions, while two studies evaluated four interventions. In order to simplify the
understanding of our references we attributed a number for each of the included studies
according to their alphabetic order (first author). In addition, when more than one
intervention was investigated in the same study, we employed a letter to indicate the
different interventions. For example, the study by Bhattacharyya and colleagues
(Bhattacharyya, Chang et al. 2007) was the study number 2. As this study evaluated more
than one intervention of interest, the referencing system was 2A for Revision +/- wires,
cables or cerclages and 2B for ORIF with plate. Details on the referencing system
adopted are presented on Table 6. A large variety of outcomes were investigated by the

37
included studies and the associations between interventions and outcomes were expressed
in multiple ways, including means with standard errors or standard deviations, odds
ratios, prevalence ratios and β coefficient.
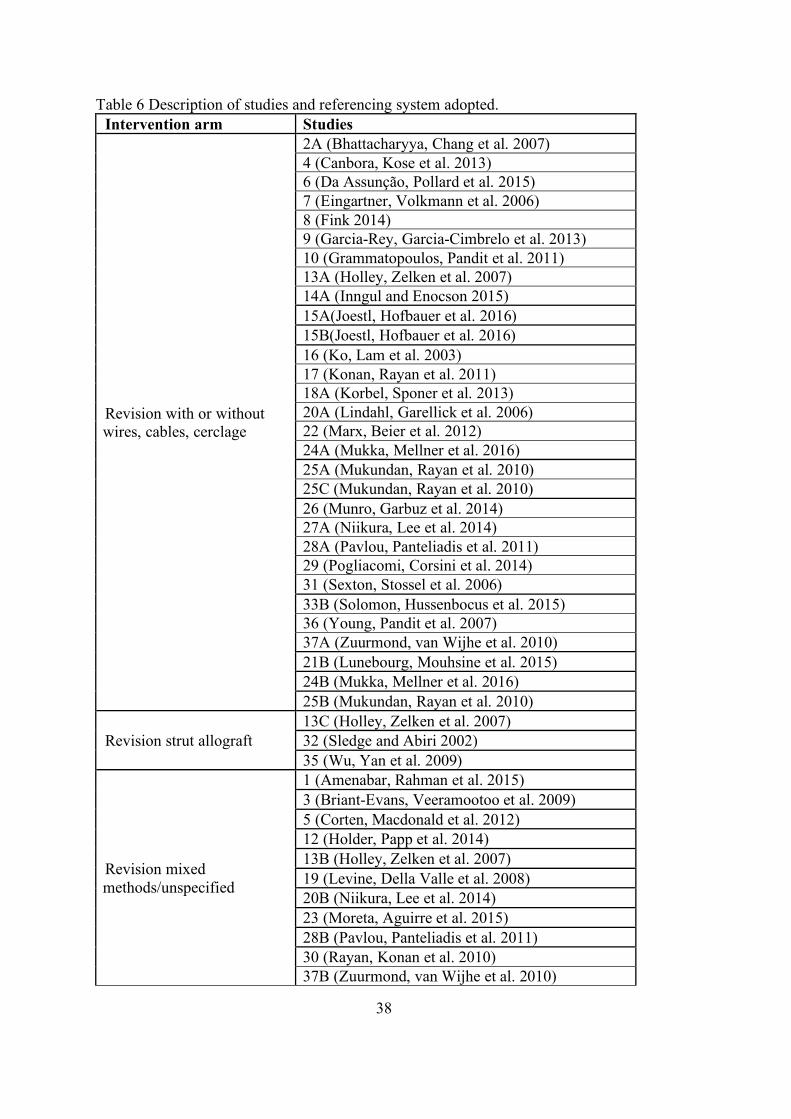
38
Table 6 Description of studies and referencing system adopted. Intervention arm Studies
Revision with or without wires, cables, cerclage
2A (Bhattacharyya, Chang et al. 2007) 4 (Canbora, Kose et al. 2013) 6 (Da Assunção, Pollard et al. 2015) 7 (Eingartner, Volkmann et al. 2006) 8 (Fink 2014) 9 (Garcia-Rey, Garcia-Cimbrelo et al. 2013) 10 (Grammatopoulos, Pandit et al. 2011) 13A (Holley, Zelken et al. 2007) 14A (Inngul and Enocson 2015) 15A(Joestl, Hofbauer et al. 2016) 15B(Joestl, Hofbauer et al. 2016) 16 (Ko, Lam et al. 2003) 17 (Konan, Rayan et al. 2011) 18A (Korbel, Sponer et al. 2013) 20A (Lindahl, Garellick et al. 2006) 22 (Marx, Beier et al. 2012) 24A (Mukka, Mellner et al. 2016) 25A (Mukundan, Rayan et al. 2010) 25C (Mukundan, Rayan et al. 2010) 26 (Munro, Garbuz et al. 2014) 27A (Niikura, Lee et al. 2014) 28A (Pavlou, Panteliadis et al. 2011) 29 (Pogliacomi, Corsini et al. 2014) 31 (Sexton, Stossel et al. 2006) 33B (Solomon, Hussenbocus et al. 2015) 36 (Young, Pandit et al. 2007) 37A (Zuurmond, van Wijhe et al. 2010) 21B (Lunebourg, Mouhsine et al. 2015) 24B (Mukka, Mellner et al. 2016) 25B (Mukundan, Rayan et al. 2010)
Revision strut allograft 13C (Holley, Zelken et al. 2007) 32 (Sledge and Abiri 2002) 35 (Wu, Yan et al. 2009)
Revision mixed methods/unspecified
1 (Amenabar, Rahman et al. 2015) 3 (Briant-Evans, Veeramootoo et al. 2009) 5 (Corten, Macdonald et al. 2012) 12 (Holder, Papp et al. 2014) 13B (Holley, Zelken et al. 2007) 19 (Levine, Della Valle et al. 2008) 20B (Niikura, Lee et al. 2014) 23 (Moreta, Aguirre et al. 2015) 28B (Pavlou, Panteliadis et al. 2011) 30 (Rayan, Konan et al. 2010) 37B (Zuurmond, van Wijhe et al. 2010)
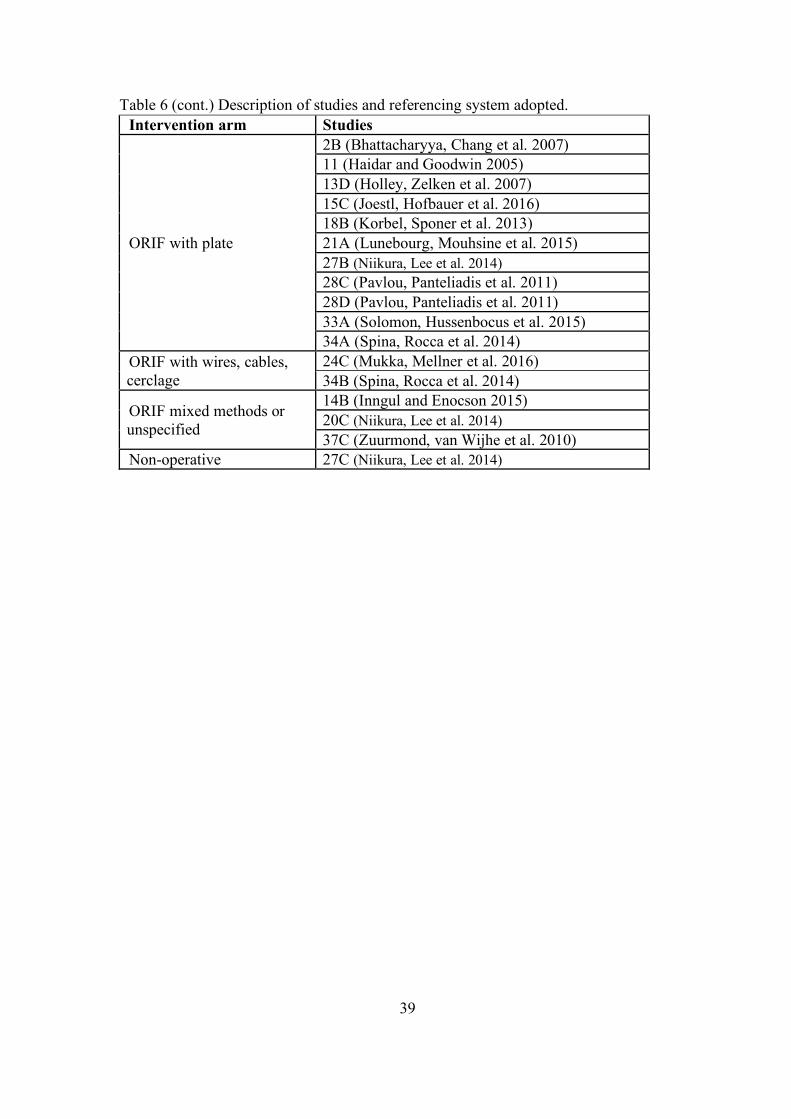
39
Table 6 (cont.) Description of studies and referencing system adopted. Intervention arm Studies
ORIF with plate
2B (Bhattacharyya, Chang et al. 2007) 11 (Haidar and Goodwin 2005) 13D (Holley, Zelken et al. 2007) 15C (Joestl, Hofbauer et al. 2016) 18B (Korbel, Sponer et al. 2013) 21A (Lunebourg, Mouhsine et al. 2015) 27B (Niikura, Lee et al. 2014) 28C (Pavlou, Panteliadis et al. 2011) 28D (Pavlou, Panteliadis et al. 2011) 33A (Solomon, Hussenbocus et al. 2015) 34A (Spina, Rocca et al. 2014)
ORIF with wires, cables, cerclage
24C (Mukka, Mellner et al. 2016) 34B (Spina, Rocca et al. 2014)
ORIF mixed methods or unspecified
14B (Inngul and Enocson 2015) 20C (Niikura, Lee et al. 2014) 37C (Zuurmond, van Wijhe et al. 2010)
Non-operative 27C (Niikura, Lee et al. 2014)
40
Assessment of methodological quality
Most studies obtained a score of over 70% on the methodological quality assessment
(Appendix V). Regarding cohort studies (n=10) the most common methodological
inadequacies identified were around addressing confounding factors in the analysis, with
no studies addressing confounding factors. Additionally, only one out of seven studies
were assessed to have measured outcomes in a valid and reliable way. Regarding case
series (n=27), the most common methodological flaws were around inadequate
identification of the condition and unclear reporting of outcomes and follow-up.
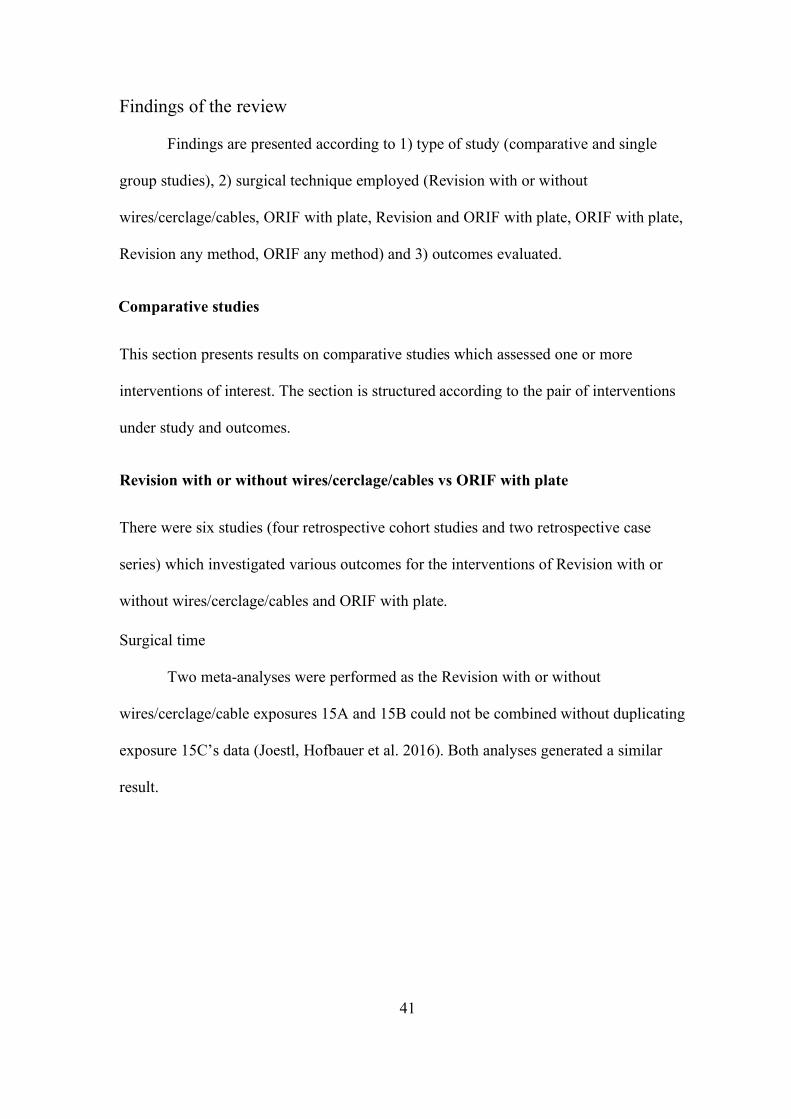
41
Findings of the review
Findings are presented according to 1) type of study (comparative and single
group studies), 2) surgical technique employed (Revision with or without
wires/cerclage/cables, ORIF with plate, Revision and ORIF with plate, ORIF with plate,
Revision any method, ORIF any method) and 3) outcomes evaluated.
Comparative studies
This section presents results on comparative studies which assessed one or more
interventions of interest. The section is structured according to the pair of interventions
under study and outcomes.
Revision with or without wires/cerclage/cables vs ORIF with plate
There were six studies (four retrospective cohort studies and two retrospective case
series) which investigated various outcomes for the interventions of Revision with or
without wires/cerclage/cables and ORIF with plate.
Surgical time
Two meta-analyses were performed as the Revision with or without
wires/cerclage/cable exposures 15A and 15B could not be combined without duplicating
exposure 15C’s data (Joestl, Hofbauer et al. 2016). Both analyses generated a similar
result.
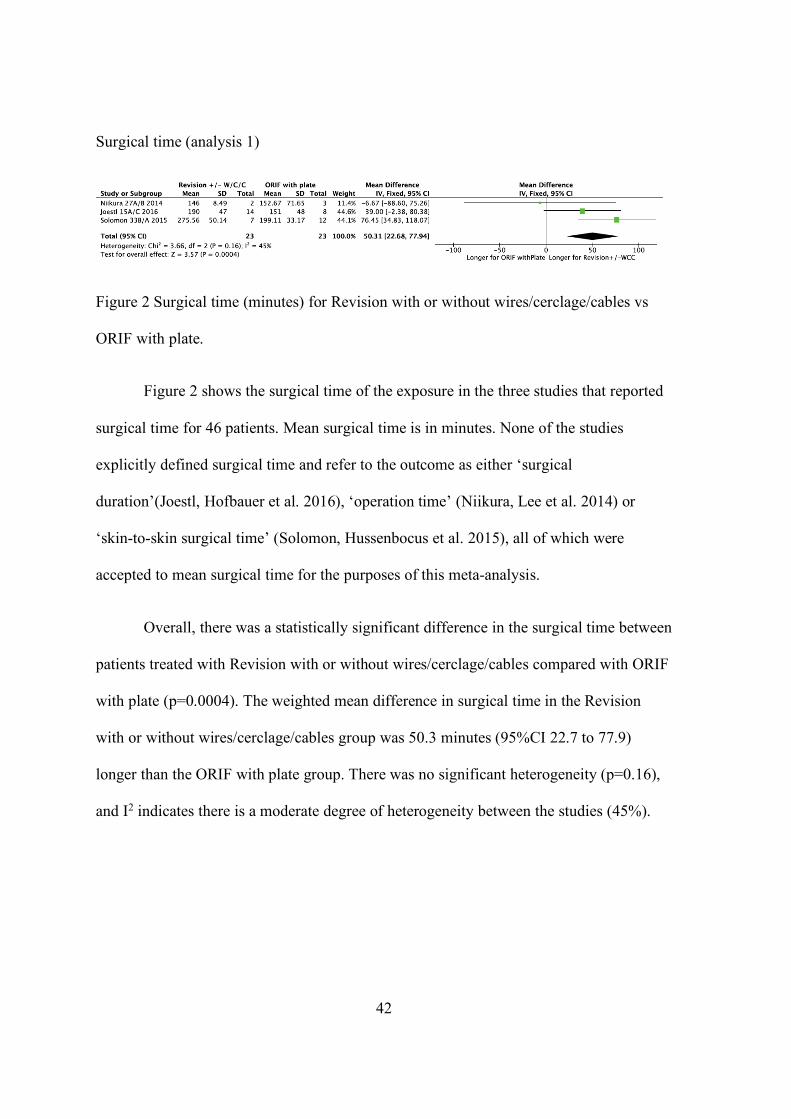
42
Surgical time (analysis 1)
Figure 2 Surgical time (minutes) for Revision with or without wires/cerclage/cables vs
ORIF with plate.
Figure 2 shows the surgical time of the exposure in the three studies that reported
surgical time for 46 patients. Mean surgical time is in minutes. None of the studies
explicitly defined surgical time and refer to the outcome as either ‘surgical
duration’(Joestl, Hofbauer et al. 2016), ‘operation time’ (Niikura, Lee et al. 2014) or
‘skin-to-skin surgical time’ (Solomon, Hussenbocus et al. 2015), all of which were
accepted to mean surgical time for the purposes of this meta-analysis.
Overall, there was a statistically significant difference in the surgical time between
patients treated with Revision with or without wires/cerclage/cables compared with ORIF
with plate (p=0.0004). The weighted mean difference in surgical time in the Revision
with or without wires/cerclage/cables group was 50.3 minutes (95%CI 22.7 to 77.9)
longer than the ORIF with plate group. There was no significant heterogeneity (p=0.16),
and I2 indicates there is a moderate degree of heterogeneity between the studies (45%).
43
Surgical time (analysis 2)
Figure 3 Surgical time (minutes) for Revision with or without wires/cerclage/cables vs
ORIF with plate.
Figure 3 shows the surgical time of the three studies that reported surgical time for 46
patients. Mean surgical time is in minutes.
Overall, there was a statistically significant difference in the surgical time between
patients treated with Revision with or without wires/cerclage/cables compared with ORIF
with plate (p=0.0002). The weighted mean difference in surgical time in the Revision
with or without wires/cerclage/cables group was 49.9 minutes (95%CI 23.4 to 76.5)
longer than the ORIF with plate group. There was no significant heterogeneity (p=0.16),
and I2 indicates there is a moderate degree of heterogeneity between the studies (45%).
Blood loss intra-operatively
One study compared intra-operative blood loss for Revision with or without
wires/cerclage/cables, exposure 27A (n=2) and ORIF with plate, exposure 27B (n=3),
with a mean intra-operative blood loss of 1502 mL (SD 1368) and 390 mL (SD 233),
respectively (Niikura, Lee et al. 2014).
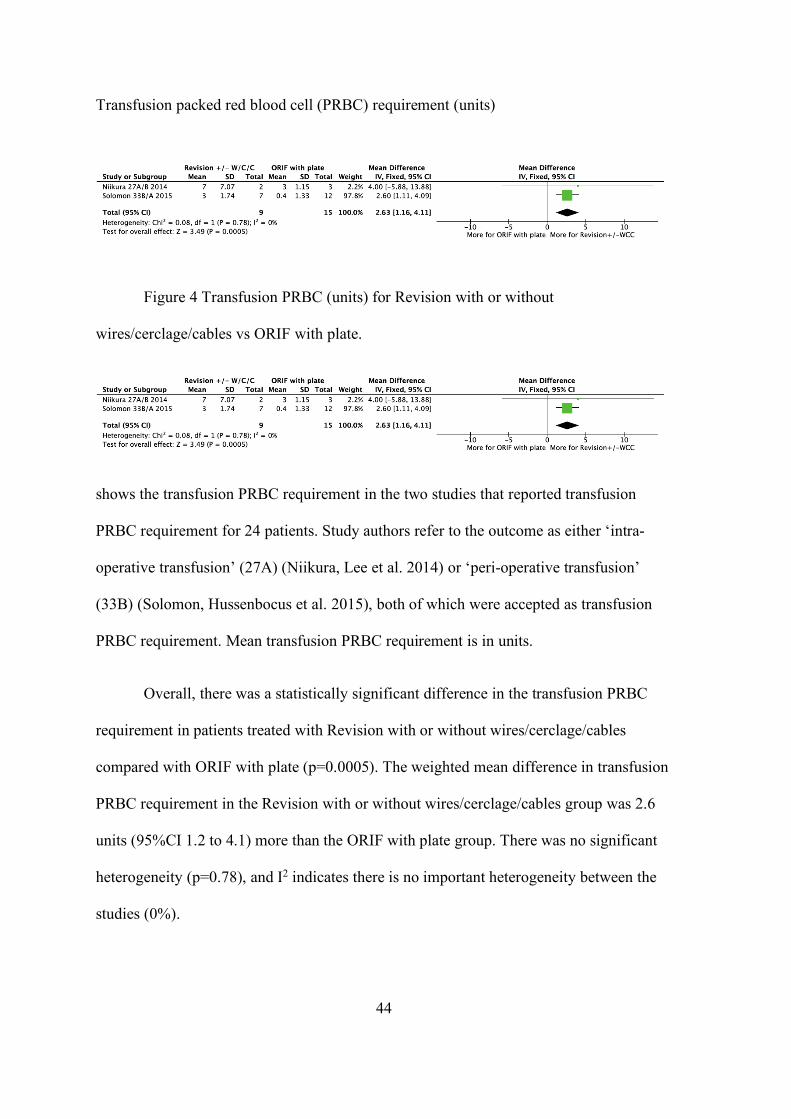
44
Transfusion packed red blood cell (PRBC) requirement (units)
Figure 4 Transfusion PRBC (units) for Revision with or without
wires/cerclage/cables vs ORIF with plate.
shows the transfusion PRBC requirement in the two studies that reported transfusion
PRBC requirement for 24 patients. Study authors refer to the outcome as either ‘intra-
operative transfusion’ (27A) (Niikura, Lee et al. 2014) or ‘peri-operative transfusion’
(33B) (Solomon, Hussenbocus et al. 2015), both of which were accepted as transfusion
PRBC requirement. Mean transfusion PRBC requirement is in units.
Overall, there was a statistically significant difference in the transfusion PRBC
requirement in patients treated with Revision with or without wires/cerclage/cables
compared with ORIF with plate (p=0.0005). The weighted mean difference in transfusion
PRBC requirement in the Revision with or without wires/cerclage/cables group was 2.6
units (95%CI 1.2 to 4.1) more than the ORIF with plate group. There was no significant
heterogeneity (p=0.78), and I2 indicates there is no important heterogeneity between the
studies (0%).
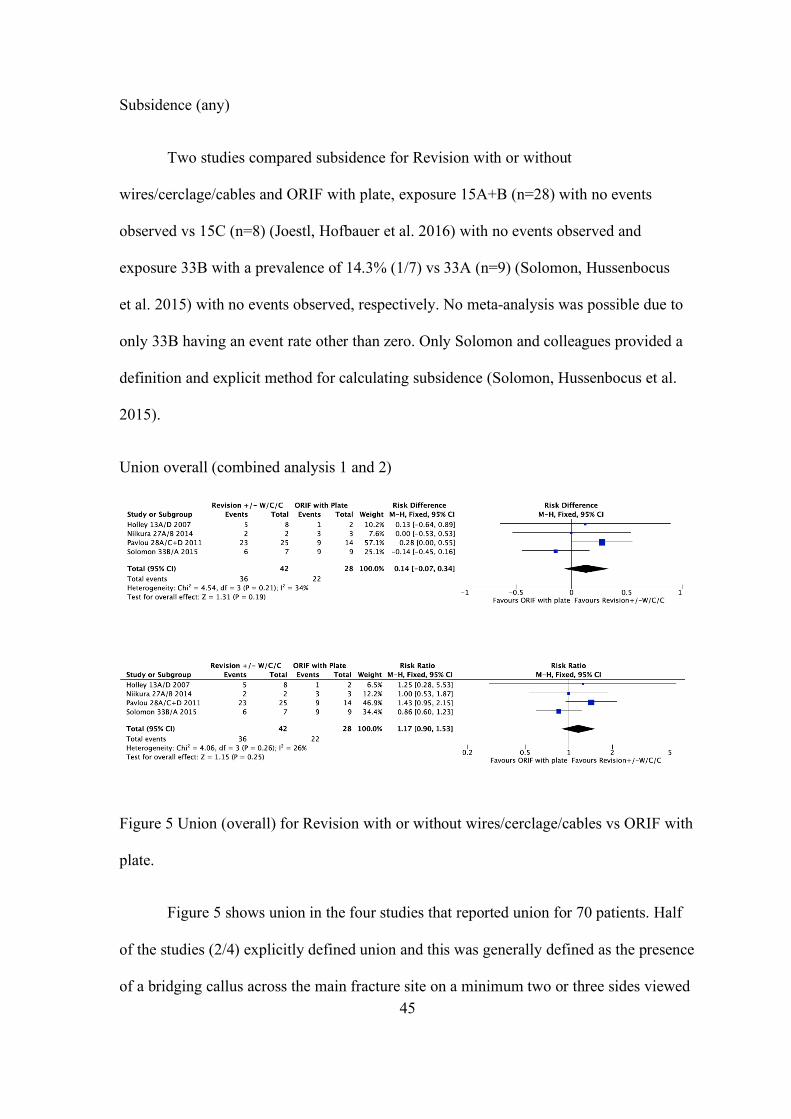
45
Subsidence (any)
Two studies compared subsidence for Revision with or without
wires/cerclage/cables and ORIF with plate, exposure 15A+B (n=28) with no events
observed vs 15C (n=8) (Joestl, Hofbauer et al. 2016) with no events observed and
exposure 33B with a prevalence of 14.3% (1/7) vs 33A (n=9) (Solomon, Hussenbocus
et al. 2015) with no events observed, respectively. No meta-analysis was possible due to
only 33B having an event rate other than zero. Only Solomon and colleagues provided a
definition and explicit method for calculating subsidence (Solomon, Hussenbocus et al.
2015).
Union overall (combined analysis 1 and 2)
Figure 5 Union (overall) for Revision with or without wires/cerclage/cables vs ORIF with
plate.
Figure 5 shows union in the four studies that reported union for 70 patients. Half
of the studies (2/4) explicitly defined union and this was generally defined as the presence
of a bridging callus across the main fracture site on a minimum two or three sides viewed
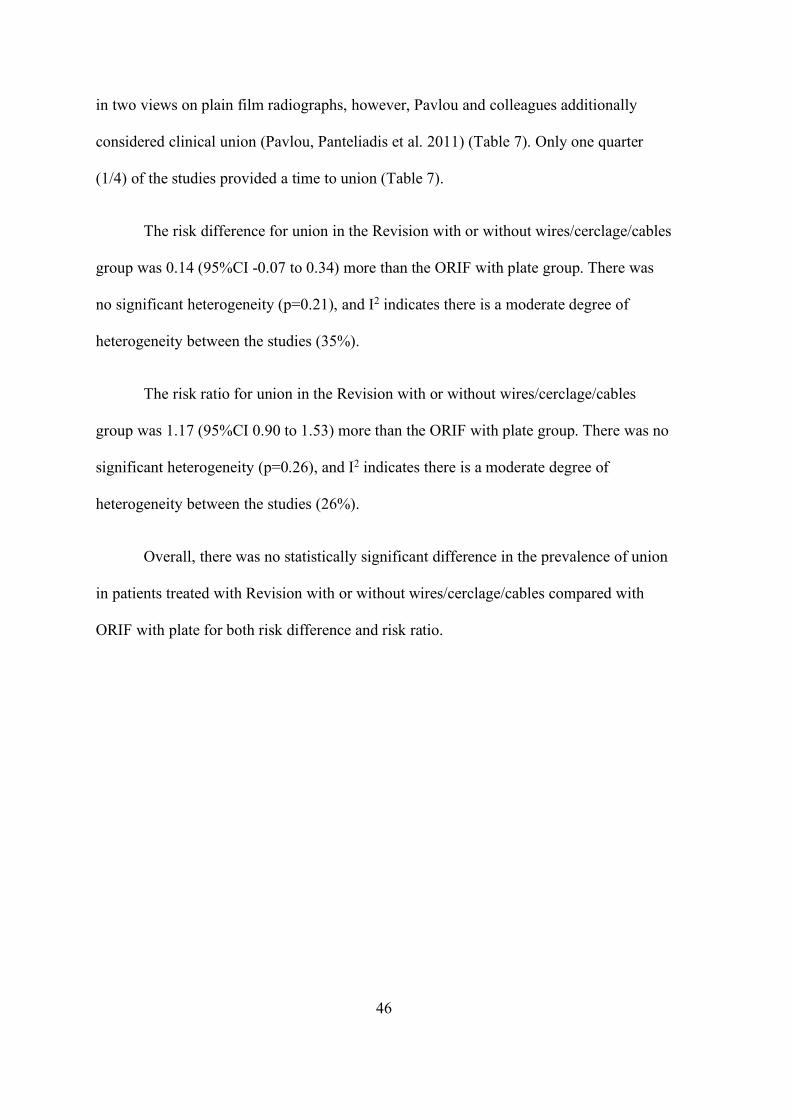
46
in two views on plain film radiographs, however, Pavlou and colleagues additionally
considered clinical union (Pavlou, Panteliadis et al. 2011) (Table 7). Only one quarter
(1/4) of the studies provided a time to union (Table 7).
The risk difference for union in the Revision with or without wires/cerclage/cables
group was 0.14 (95%CI -0.07 to 0.34) more than the ORIF with plate group. There was
no significant heterogeneity (p=0.21), and I2 indicates there is a moderate degree of
heterogeneity between the studies (35%).
The risk ratio for union in the Revision with or without wires/cerclage/cables
group was 1.17 (95%CI 0.90 to 1.53) more than the ORIF with plate group. There was no
significant heterogeneity (p=0.26), and I2 indicates there is a moderate degree of
heterogeneity between the studies (26%).
Overall, there was no statistically significant difference in the prevalence of union
in patients treated with Revision with or without wires/cerclage/cables compared with
ORIF with plate for both risk difference and risk ratio.
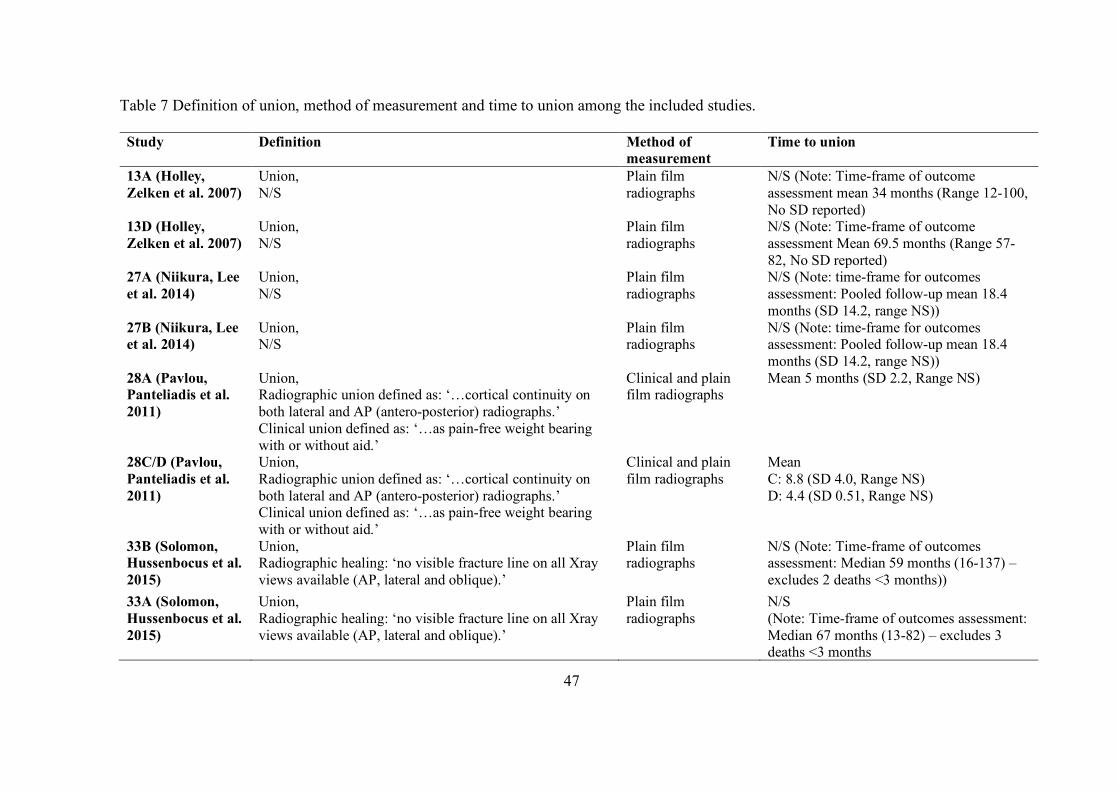
47
Table 7 Definition of union, method of measurement and time to union among the included studies.
Study Definition Method of measurement
Time to union
13A (Holley, Zelken et al. 2007)
Union, N/S
Plain film radiographs
N/S (Note: Time-frame of outcome assessment mean 34 months (Range 12-100, No SD reported)
13D (Holley, Zelken et al. 2007)
Union, N/S
Plain film radiographs
N/S (Note: Time-frame of outcome assessment Mean 69.5 months (Range 57-82, No SD reported)
27A (Niikura, Lee et al. 2014)
Union, N/S
Plain film radiographs
N/S (Note: time-frame for outcomes assessment: Pooled follow-up mean 18.4 months (SD 14.2, range NS))
27B (Niikura, Lee et al. 2014)
Union, N/S
Plain film radiographs
N/S (Note: time-frame for outcomes assessment: Pooled follow-up mean 18.4 months (SD 14.2, range NS))
28A (Pavlou, Panteliadis et al. 2011)
Union, Radiographic union defined as: ‘…cortical continuity on both lateral and AP (antero-posterior) radiographs.’ Clinical union defined as: ‘…as pain-free weight bearing with or without aid.’
Clinical and plain film radiographs
Mean 5 months (SD 2.2, Range NS)
28C/D (Pavlou, Panteliadis et al. 2011)
Union, Radiographic union defined as: ‘…cortical continuity on both lateral and AP (antero-posterior) radiographs.’ Clinical union defined as: ‘…as pain-free weight bearing with or without aid.’
Clinical and plain film radiographs
Mean C: 8.8 (SD 4.0, Range NS) D: 4.4 (SD 0.51, Range NS)
33B (Solomon, Hussenbocus et al. 2015)
Union, Radiographic healing: ‘no visible fracture line on all Xray views available (AP, lateral and oblique).’
Plain film radiographs
N/S (Note: Time-frame of outcomes assessment: Median 59 months (16-137) – excludes 2 deaths <3 months))
33A (Solomon, Hussenbocus et al. 2015)
Union, Radiographic healing: ‘no visible fracture line on all Xray views available (AP, lateral and oblique).’
Plain film radiographs
N/S (Note: Time-frame of outcomes assessment: Median 67 months (13-82) – excludes 3 deaths <3 months
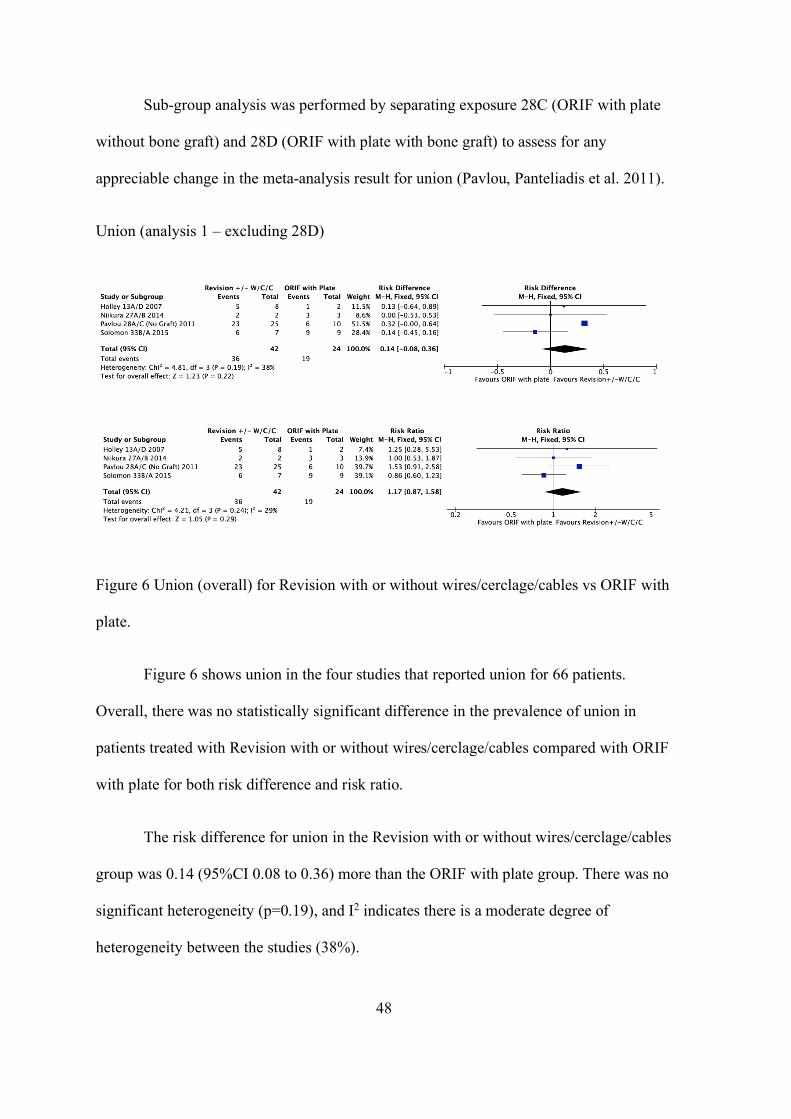
48
Sub-group analysis was performed by separating exposure 28C (ORIF with plate
without bone graft) and 28D (ORIF with plate with bone graft) to assess for any
appreciable change in the meta-analysis result for union (Pavlou, Panteliadis et al. 2011).
Union (analysis 1 – excluding 28D)
Figure 6 Union (overall) for Revision with or without wires/cerclage/cables vs ORIF with
plate.
Figure 6 shows union in the four studies that reported union for 66 patients.
Overall, there was no statistically significant difference in the prevalence of union in
patients treated with Revision with or without wires/cerclage/cables compared with ORIF
with plate for both risk difference and risk ratio.
The risk difference for union in the Revision with or without wires/cerclage/cables
group was 0.14 (95%CI 0.08 to 0.36) more than the ORIF with plate group. There was no
significant heterogeneity (p=0.19), and I2 indicates there is a moderate degree of
heterogeneity between the studies (38%).
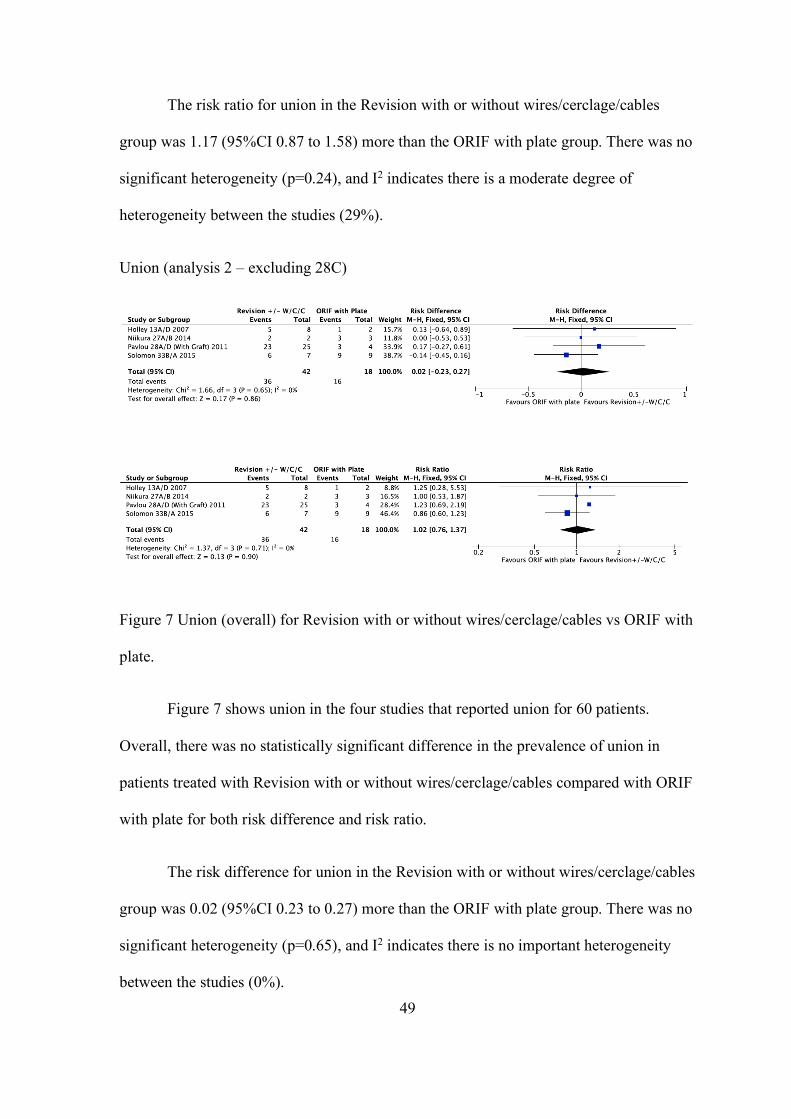
49
The risk ratio for union in the Revision with or without wires/cerclage/cables
group was 1.17 (95%CI 0.87 to 1.58) more than the ORIF with plate group. There was no
significant heterogeneity (p=0.24), and I2 indicates there is a moderate degree of
heterogeneity between the studies (29%).
Union (analysis 2 – excluding 28C)
Figure 7 Union (overall) for Revision with or without wires/cerclage/cables vs ORIF with
plate.
Figure 7 shows union in the four studies that reported union for 60 patients.
Overall, there was no statistically significant difference in the prevalence of union in
patients treated with Revision with or without wires/cerclage/cables compared with ORIF
with plate for both risk difference and risk ratio.
The risk difference for union in the Revision with or without wires/cerclage/cables
group was 0.02 (95%CI 0.23 to 0.27) more than the ORIF with plate group. There was no
significant heterogeneity (p=0.65), and I2 indicates there is no important heterogeneity
between the studies (0%).
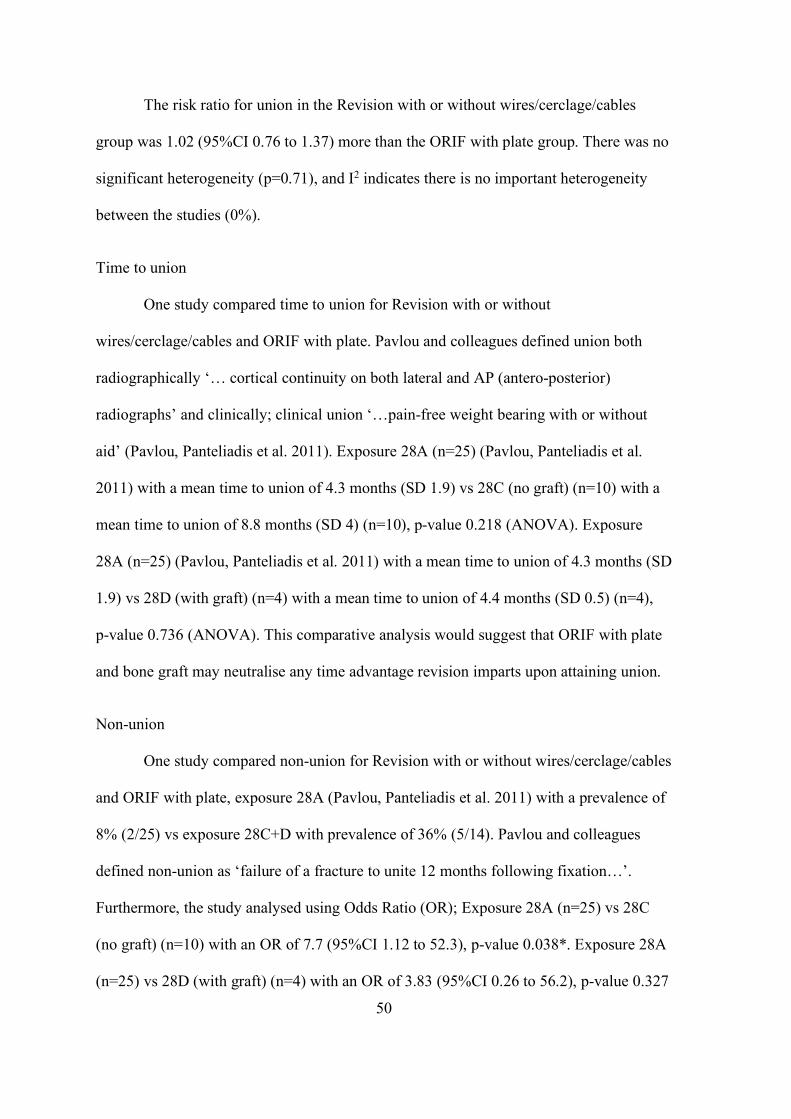
50
The risk ratio for union in the Revision with or without wires/cerclage/cables
group was 1.02 (95%CI 0.76 to 1.37) more than the ORIF with plate group. There was no
significant heterogeneity (p=0.71), and I2 indicates there is no important heterogeneity
between the studies (0%).
Time to union
One study compared time to union for Revision with or without
wires/cerclage/cables and ORIF with plate. Pavlou and colleagues defined union both
radiographically ‘… cortical continuity on both lateral and AP (antero-posterior)
radiographs’ and clinically; clinical union ‘…pain-free weight bearing with or without
aid’ (Pavlou, Panteliadis et al. 2011). Exposure 28A (n=25) (Pavlou, Panteliadis et al.
2011) with a mean time to union of 4.3 months (SD 1.9) vs 28C (no graft) (n=10) with a
mean time to union of 8.8 months (SD 4) (n=10), p-value 0.218 (ANOVA). Exposure
28A (n=25) (Pavlou, Panteliadis et al. 2011) with a mean time to union of 4.3 months (SD
1.9) vs 28D (with graft) (n=4) with a mean time to union of 4.4 months (SD 0.5) (n=4),
p-value 0.736 (ANOVA). This comparative analysis would suggest that ORIF with plate
and bone graft may neutralise any time advantage revision imparts upon attaining union.
Non-union
One study compared non-union for Revision with or without wires/cerclage/cables
and ORIF with plate, exposure 28A (Pavlou, Panteliadis et al. 2011) with a prevalence of
8% (2/25) vs exposure 28C+D with prevalence of 36% (5/14). Pavlou and colleagues
defined non-union as ‘failure of a fracture to unite 12 months following fixation…’.
Furthermore, the study analysed using Odds Ratio (OR); Exposure 28A (n=25) vs 28C
(no graft) (n=10) with an OR of 7.7 (95%CI 1.12 to 52.3), p-value 0.038*. Exposure 28A
(n=25) vs 28D (with graft) (n=4) with an OR of 3.83 (95%CI 0.26 to 56.2), p-value 0.327
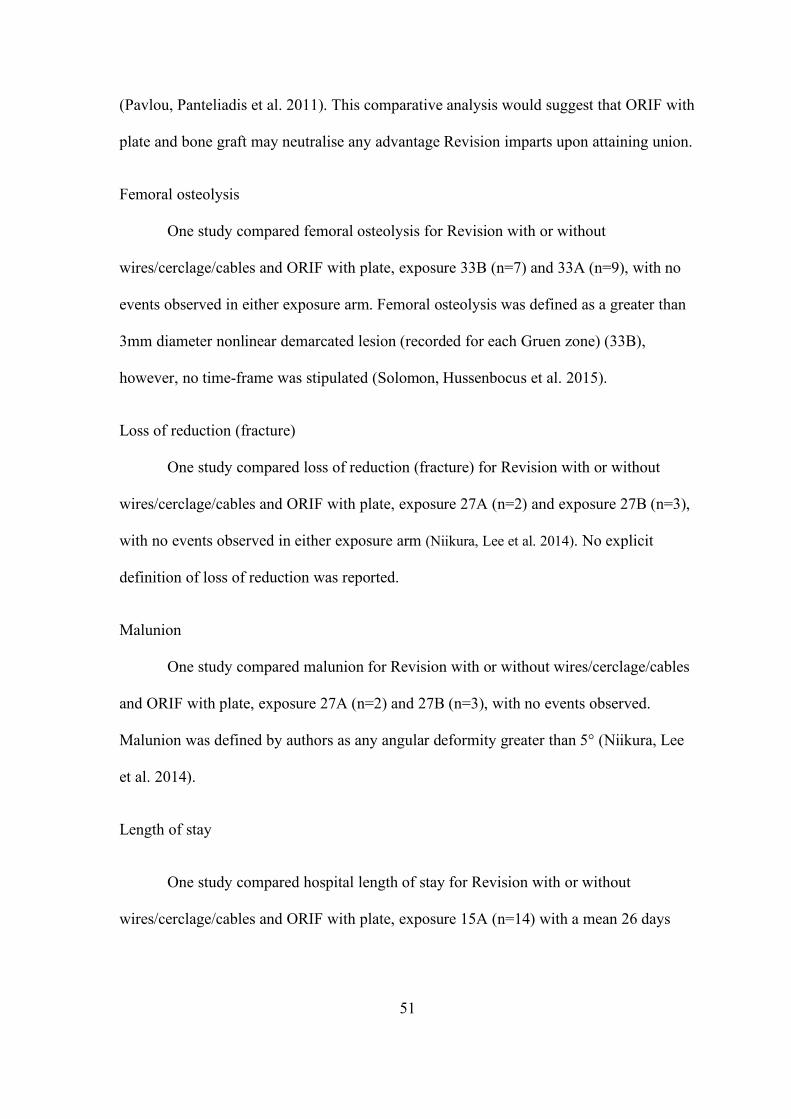
51
(Pavlou, Panteliadis et al. 2011). This comparative analysis would suggest that ORIF with
plate and bone graft may neutralise any advantage Revision imparts upon attaining union.
Femoral osteolysis
One study compared femoral osteolysis for Revision with or without
wires/cerclage/cables and ORIF with plate, exposure 33B (n=7) and 33A (n=9), with no
events observed in either exposure arm. Femoral osteolysis was defined as a greater than
3mm diameter nonlinear demarcated lesion (recorded for each Gruen zone) (33B),
however, no time-frame was stipulated (Solomon, Hussenbocus et al. 2015).
Loss of reduction (fracture)
One study compared loss of reduction (fracture) for Revision with or without
wires/cerclage/cables and ORIF with plate, exposure 27A (n=2) and exposure 27B (n=3),
with no events observed in either exposure arm (Niikura, Lee et al. 2014). No explicit
definition of loss of reduction was reported.
Malunion
One study compared malunion for Revision with or without wires/cerclage/cables
and ORIF with plate, exposure 27A (n=2) and 27B (n=3), with no events observed.
Malunion was defined by authors as any angular deformity greater than 5° (Niikura, Lee
et al. 2014).
Length of stay
One study compared hospital length of stay for Revision with or without
wires/cerclage/cables and ORIF with plate, exposure 15A (n=14) with a mean 26 days
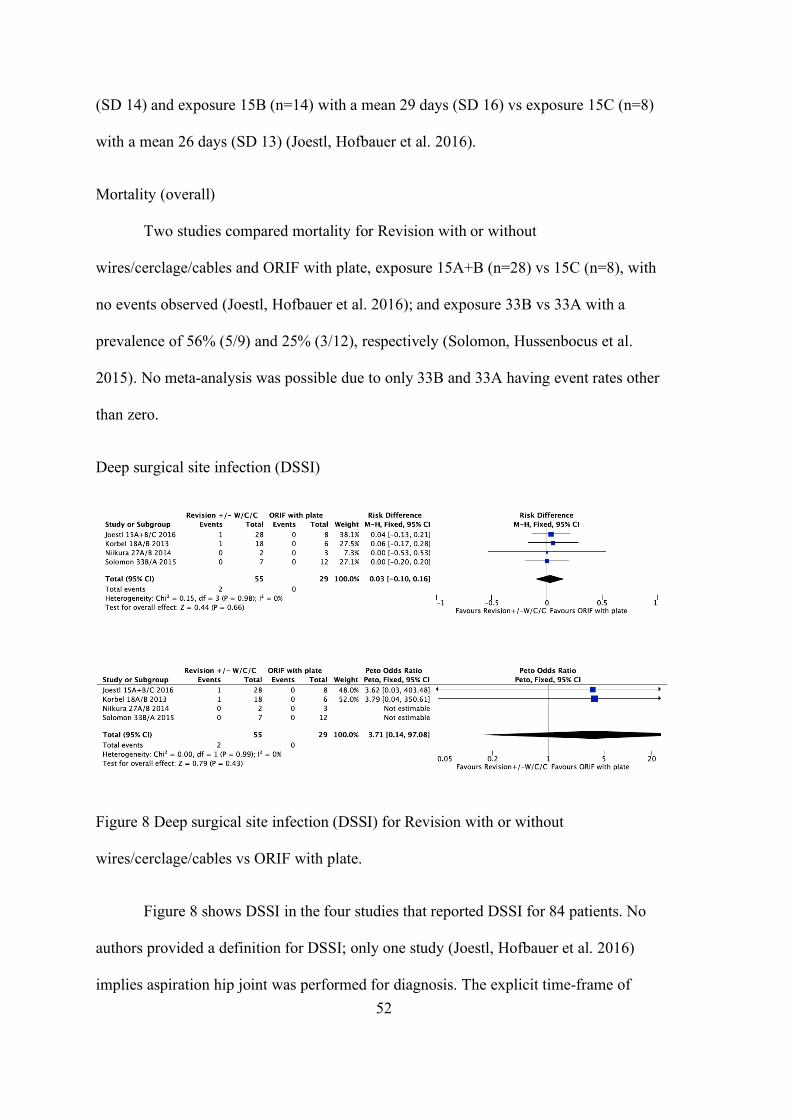
52
(SD 14) and exposure 15B (n=14) with a mean 29 days (SD 16) vs exposure 15C (n=8)
with a mean 26 days (SD 13) (Joestl, Hofbauer et al. 2016).
Mortality (overall)
Two studies compared mortality for Revision with or without
wires/cerclage/cables and ORIF with plate, exposure 15A+B (n=28) vs 15C (n=8), with
no events observed (Joestl, Hofbauer et al. 2016); and exposure 33B vs 33A with a
prevalence of 56% (5/9) and 25% (3/12), respectively (Solomon, Hussenbocus et al.
2015). No meta-analysis was possible due to only 33B and 33A having event rates other
than zero.
Deep surgical site infection (DSSI)
Figure 8 Deep surgical site infection (DSSI) for Revision with or without
wires/cerclage/cables vs ORIF with plate.
Figure 8 shows DSSI in the four studies that reported DSSI for 84 patients. No
authors provided a definition for DSSI; only one study (Joestl, Hofbauer et al. 2016)
implies aspiration hip joint was performed for diagnosis. The explicit time-frame of
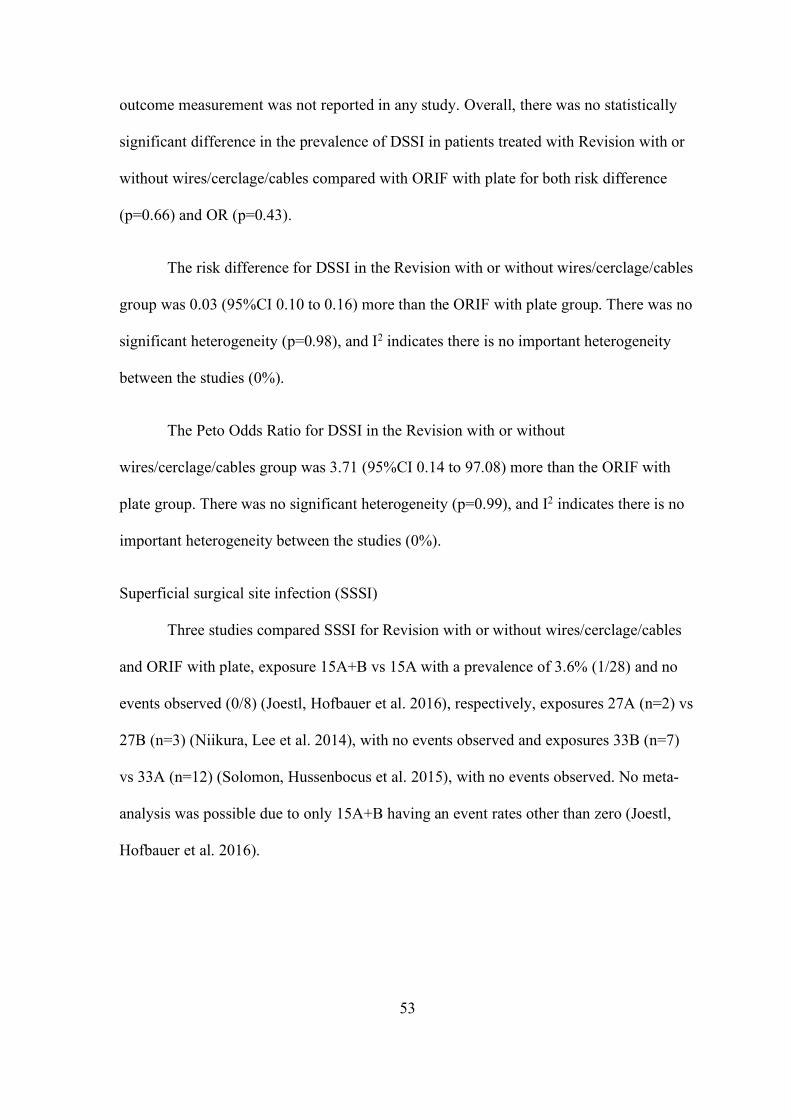
53
outcome measurement was not reported in any study. Overall, there was no statistically
significant difference in the prevalence of DSSI in patients treated with Revision with or
without wires/cerclage/cables compared with ORIF with plate for both risk difference
(p=0.66) and OR (p=0.43).
The risk difference for DSSI in the Revision with or without wires/cerclage/cables
group was 0.03 (95%CI 0.10 to 0.16) more than the ORIF with plate group. There was no
significant heterogeneity (p=0.98), and I2 indicates there is no important heterogeneity
between the studies (0%).
The Peto Odds Ratio for DSSI in the Revision with or without
wires/cerclage/cables group was 3.71 (95%CI 0.14 to 97.08) more than the ORIF with
plate group. There was no significant heterogeneity (p=0.99), and I2 indicates there is no
important heterogeneity between the studies (0%).
Superficial surgical site infection (SSSI)
Three studies compared SSSI for Revision with or without wires/cerclage/cables
and ORIF with plate, exposure 15A+B vs 15A with a prevalence of 3.6% (1/28) and no
events observed (0/8) (Joestl, Hofbauer et al. 2016), respectively, exposures 27A (n=2) vs
27B (n=3) (Niikura, Lee et al. 2014), with no events observed and exposures 33B (n=7)
vs 33A (n=12) (Solomon, Hussenbocus et al. 2015), with no events observed. No meta-
analysis was possible due to only 15A+B having an event rates other than zero (Joestl,
Hofbauer et al. 2016).
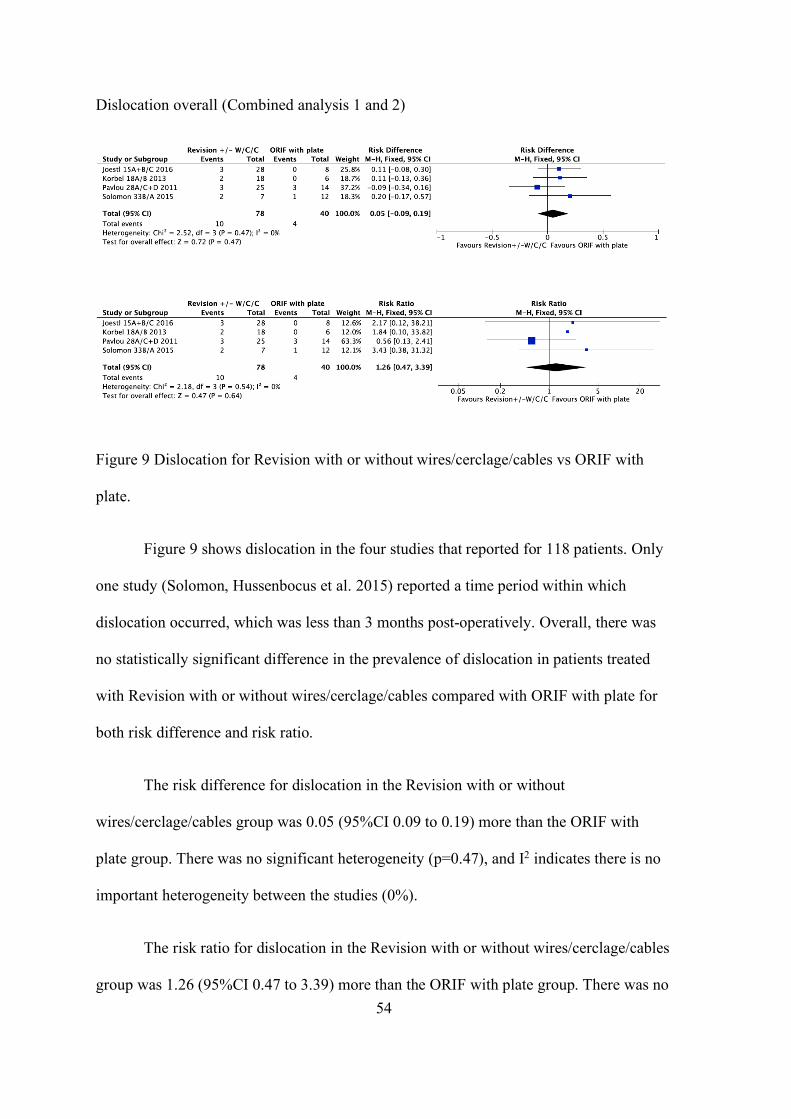
54
Dislocation overall (Combined analysis 1 and 2)
Figure 9 Dislocation for Revision with or without wires/cerclage/cables vs ORIF with
plate.
Figure 9 shows dislocation in the four studies that reported for 118 patients. Only
one study (Solomon, Hussenbocus et al. 2015) reported a time period within which
dislocation occurred, which was less than 3 months post-operatively. Overall, there was
no statistically significant difference in the prevalence of dislocation in patients treated
with Revision with or without wires/cerclage/cables compared with ORIF with plate for
both risk difference and risk ratio.
The risk difference for dislocation in the Revision with or without
wires/cerclage/cables group was 0.05 (95%CI 0.09 to 0.19) more than the ORIF with
plate group. There was no significant heterogeneity (p=0.47), and I2 indicates there is no
important heterogeneity between the studies (0%).
The risk ratio for dislocation in the Revision with or without wires/cerclage/cables
group was 1.26 (95%CI 0.47 to 3.39) more than the ORIF with plate group. There was no
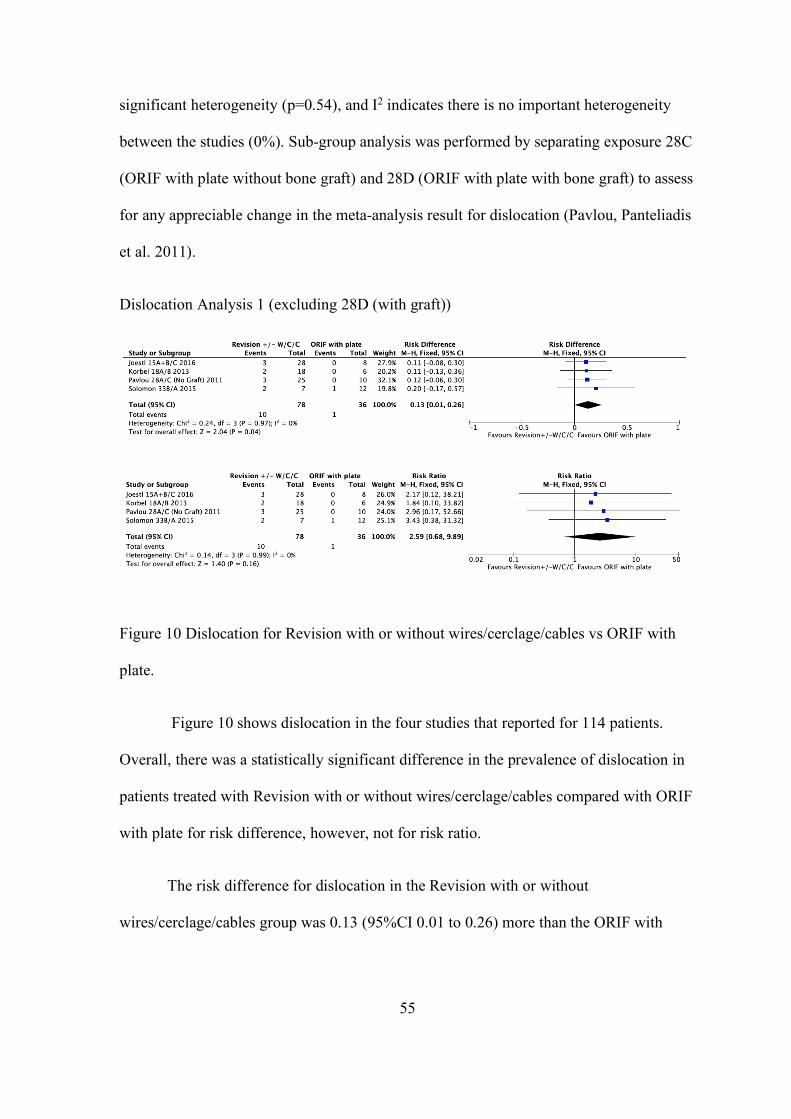
55
significant heterogeneity (p=0.54), and I2 indicates there is no important heterogeneity
between the studies (0%). Sub-group analysis was performed by separating exposure 28C
(ORIF with plate without bone graft) and 28D (ORIF with plate with bone graft) to assess
for any appreciable change in the meta-analysis result for dislocation (Pavlou, Panteliadis
et al. 2011).
Dislocation Analysis 1 (excluding 28D (with graft))
Figure 10 Dislocation for Revision with or without wires/cerclage/cables vs ORIF with
plate.
Figure 10 shows dislocation in the four studies that reported for 114 patients.
Overall, there was a statistically significant difference in the prevalence of dislocation in
patients treated with Revision with or without wires/cerclage/cables compared with ORIF
with plate for risk difference, however, not for risk ratio.
The risk difference for dislocation in the Revision with or without
wires/cerclage/cables group was 0.13 (95%CI 0.01 to 0.26) more than the ORIF with
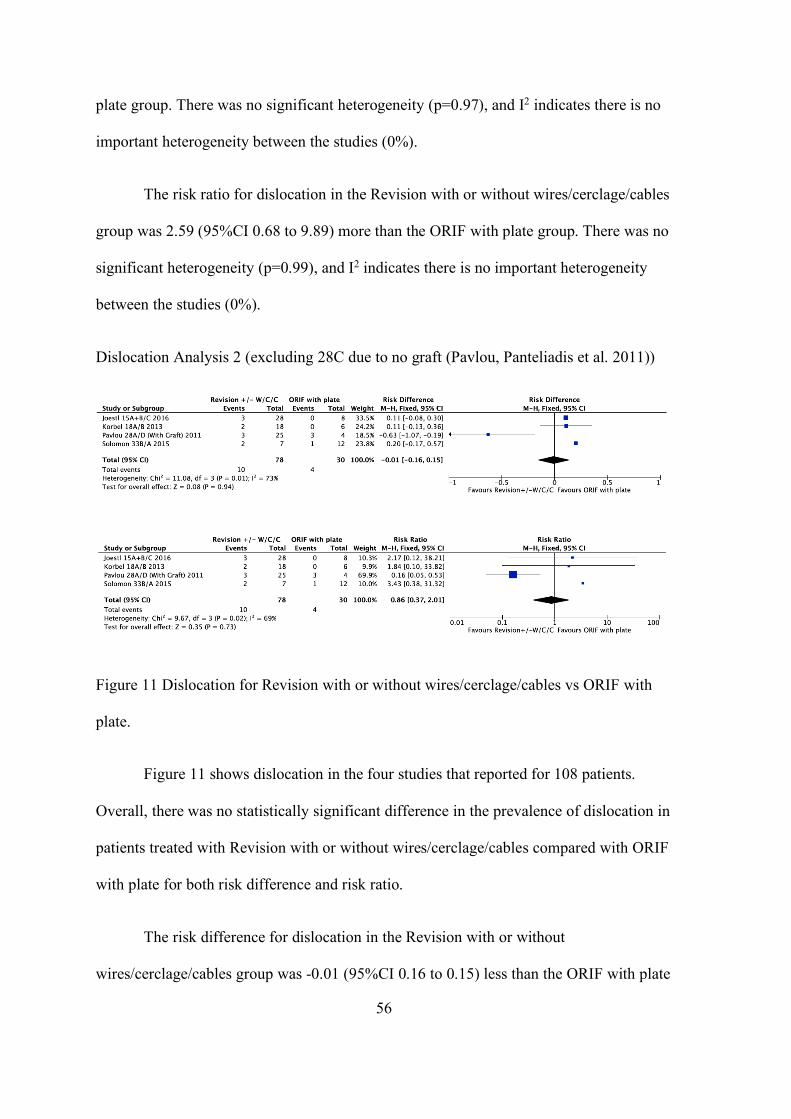
56
plate group. There was no significant heterogeneity (p=0.97), and I2 indicates there is no
important heterogeneity between the studies (0%).
The risk ratio for dislocation in the Revision with or without wires/cerclage/cables
group was 2.59 (95%CI 0.68 to 9.89) more than the ORIF with plate group. There was no
significant heterogeneity (p=0.99), and I2 indicates there is no important heterogeneity
between the studies (0%).
Dislocation Analysis 2 (excluding 28C due to no graft (Pavlou, Panteliadis et al. 2011))
Figure 11 Dislocation for Revision with or without wires/cerclage/cables vs ORIF with
plate.
Figure 11 shows dislocation in the four studies that reported for 108 patients.
Overall, there was no statistically significant difference in the prevalence of dislocation in
patients treated with Revision with or without wires/cerclage/cables compared with ORIF
with plate for both risk difference and risk ratio.
The risk difference for dislocation in the Revision with or without
wires/cerclage/cables group was -0.01 (95%CI 0.16 to 0.15) less than the ORIF with plate
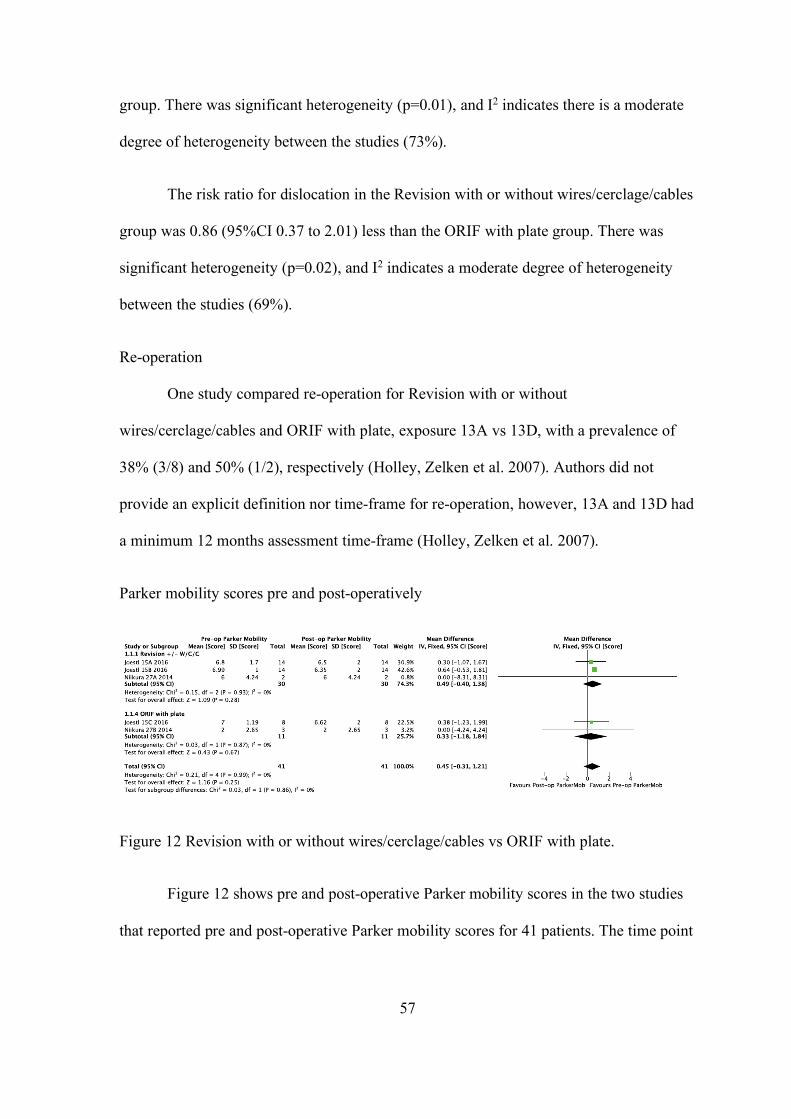
57
group. There was significant heterogeneity (p=0.01), and I2 indicates there is a moderate
degree of heterogeneity between the studies (73%).
The risk ratio for dislocation in the Revision with or without wires/cerclage/cables
group was 0.86 (95%CI 0.37 to 2.01) less than the ORIF with plate group. There was
significant heterogeneity (p=0.02), and I2 indicates a moderate degree of heterogeneity
between the studies (69%).
Re-operation
One study compared re-operation for Revision with or without
wires/cerclage/cables and ORIF with plate, exposure 13A vs 13D, with a prevalence of
38% (3/8) and 50% (1/2), respectively (Holley, Zelken et al. 2007). Authors did not
provide an explicit definition nor time-frame for re-operation, however, 13A and 13D had
a minimum 12 months assessment time-frame (Holley, Zelken et al. 2007).
Parker mobility scores pre and post-operatively
Figure 12 Revision with or without wires/cerclage/cables vs ORIF with plate.
Figure 12 shows pre and post-operative Parker mobility scores in the two studies
that reported pre and post-operative Parker mobility scores for 41 patients. The time point
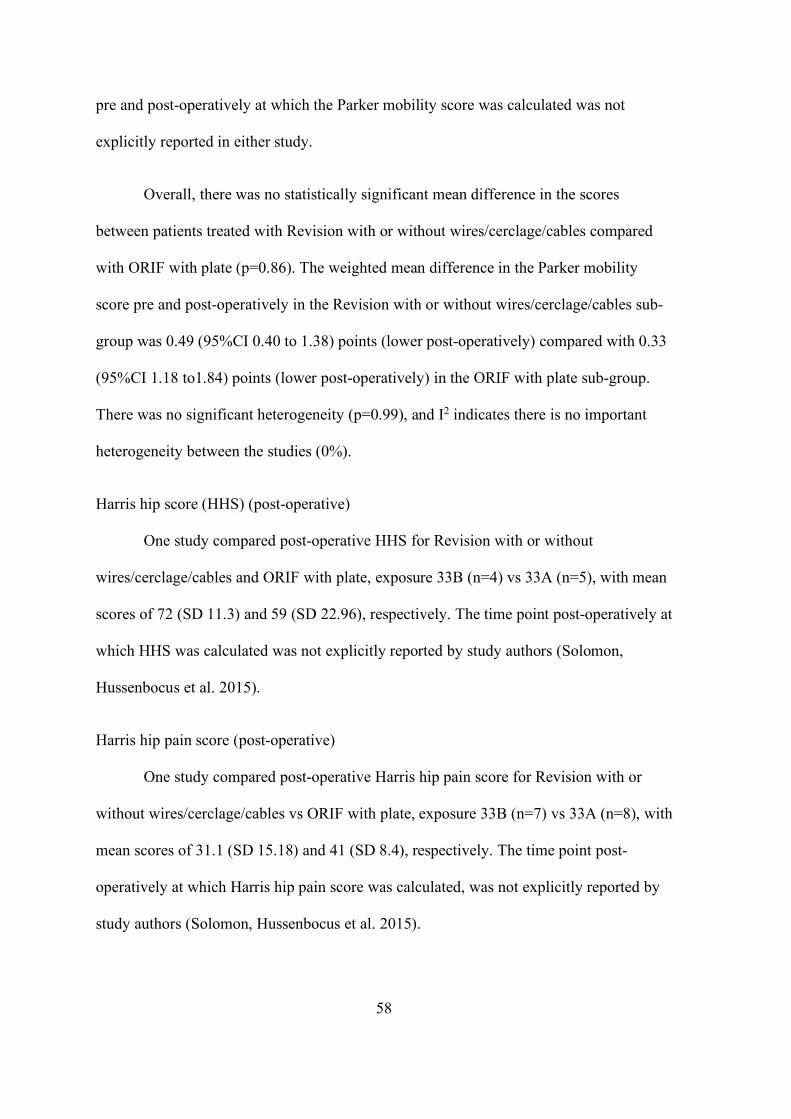
58
pre and post-operatively at which the Parker mobility score was calculated was not
explicitly reported in either study.
Overall, there was no statistically significant mean difference in the scores
between patients treated with Revision with or without wires/cerclage/cables compared
with ORIF with plate (p=0.86). The weighted mean difference in the Parker mobility
score pre and post-operatively in the Revision with or without wires/cerclage/cables sub-
group was 0.49 (95%CI 0.40 to 1.38) points (lower post-operatively) compared with 0.33
(95%CI 1.18 to1.84) points (lower post-operatively) in the ORIF with plate sub-group.
There was no significant heterogeneity (p=0.99), and I2 indicates there is no important
heterogeneity between the studies (0%).
Harris hip score (HHS) (post-operative)
One study compared post-operative HHS for Revision with or without
wires/cerclage/cables and ORIF with plate, exposure 33B (n=4) vs 33A (n=5), with mean
scores of 72 (SD 11.3) and 59 (SD 22.96), respectively. The time point post-operatively at
which HHS was calculated was not explicitly reported by study authors (Solomon,
Hussenbocus et al. 2015).
Harris hip pain score (post-operative)
One study compared post-operative Harris hip pain score for Revision with or
without wires/cerclage/cables vs ORIF with plate, exposure 33B (n=7) vs 33A (n=8), with
mean scores of 31.1 (SD 15.18) and 41 (SD 8.4), respectively. The time point post-
operatively at which Harris hip pain score was calculated, was not explicitly reported by
study authors (Solomon, Hussenbocus et al. 2015).
59
Attainment of pre-fracture mobility status
Figure 13 Attainment of pre-fracture mobility status for Revision with or without
wires/cerclage/cables vs ORIF with plate.
Figure 13 shows attainment of pre-fracture mobility status in the three studies that
reported attainment of pre-fracture mobility status for 56 patients. There was no explicit
reporting by authors of how, or at which time point, post-operatively this assessment was
made (e.g. clinical or self-reported).
Overall, there was no statistically significant difference in the prevalence of
attainment of pre-fracture mobility status in patients treated with Revision with or without
wires/cerclage/cables compared with ORIF with plate for both risk difference and risk
ratio.
The risk difference for attainment of pre-fracture mobility status in the Revision
with or without wires/cerclage/cables group was 0.06 (95%CI 0.21 to 0.34) more than the
ORIF with plate group. There was no significant heterogeneity (p=0.37), and I2 indicates
there is no important heterogeneity between the studies (0%).
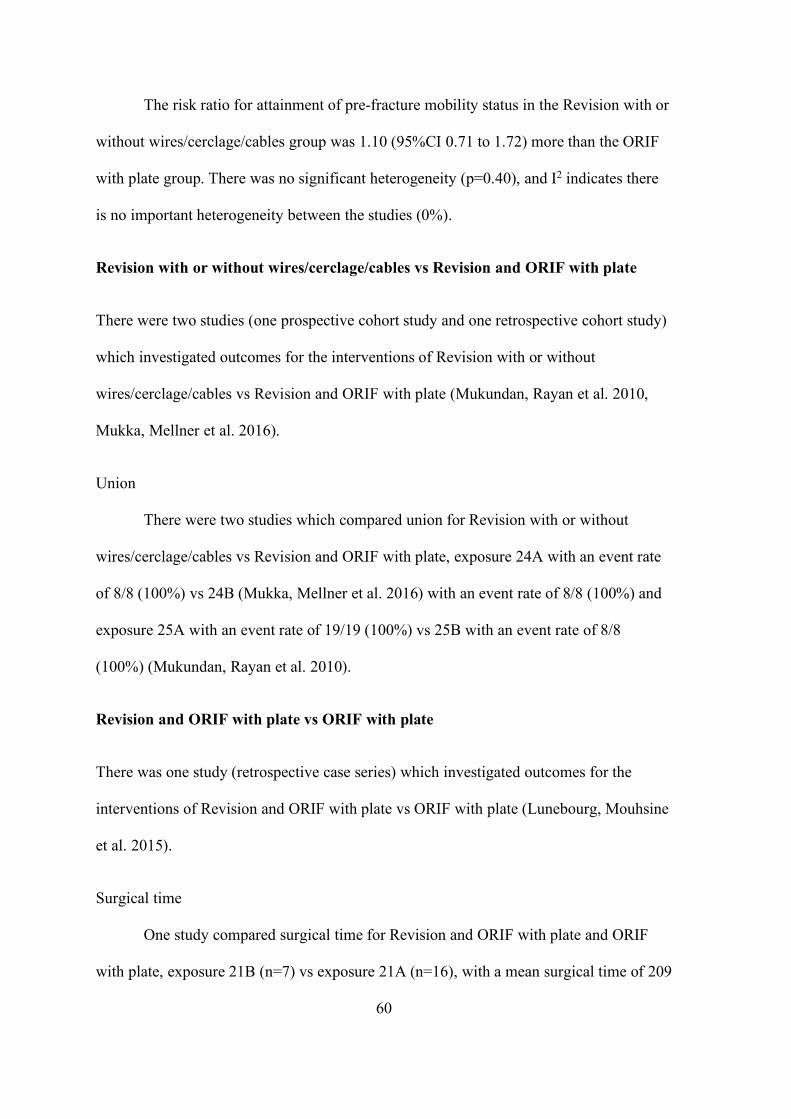
60
The risk ratio for attainment of pre-fracture mobility status in the Revision with or
without wires/cerclage/cables group was 1.10 (95%CI 0.71 to 1.72) more than the ORIF
with plate group. There was no significant heterogeneity (p=0.40), and I2 indicates there
is no important heterogeneity between the studies (0%).
Revision with or without wires/cerclage/cables vs Revision and ORIF with plate
There were two studies (one prospective cohort study and one retrospective cohort study)
which investigated outcomes for the interventions of Revision with or without
wires/cerclage/cables vs Revision and ORIF with plate (Mukundan, Rayan et al. 2010,
Mukka, Mellner et al. 2016).
Union
There were two studies which compared union for Revision with or without
wires/cerclage/cables vs Revision and ORIF with plate, exposure 24A with an event rate
of 8/8 (100%) vs 24B (Mukka, Mellner et al. 2016) with an event rate of 8/8 (100%) and
exposure 25A with an event rate of 19/19 (100%) vs 25B with an event rate of 8/8
(100%) (Mukundan, Rayan et al. 2010).
Revision and ORIF with plate vs ORIF with plate
There was one study (retrospective case series) which investigated outcomes for the
interventions of Revision and ORIF with plate vs ORIF with plate (Lunebourg, Mouhsine
et al. 2015).
Surgical time
One study compared surgical time for Revision and ORIF with plate and ORIF
with plate, exposure 21B (n=7) vs exposure 21A (n=16), with a mean surgical time of 209
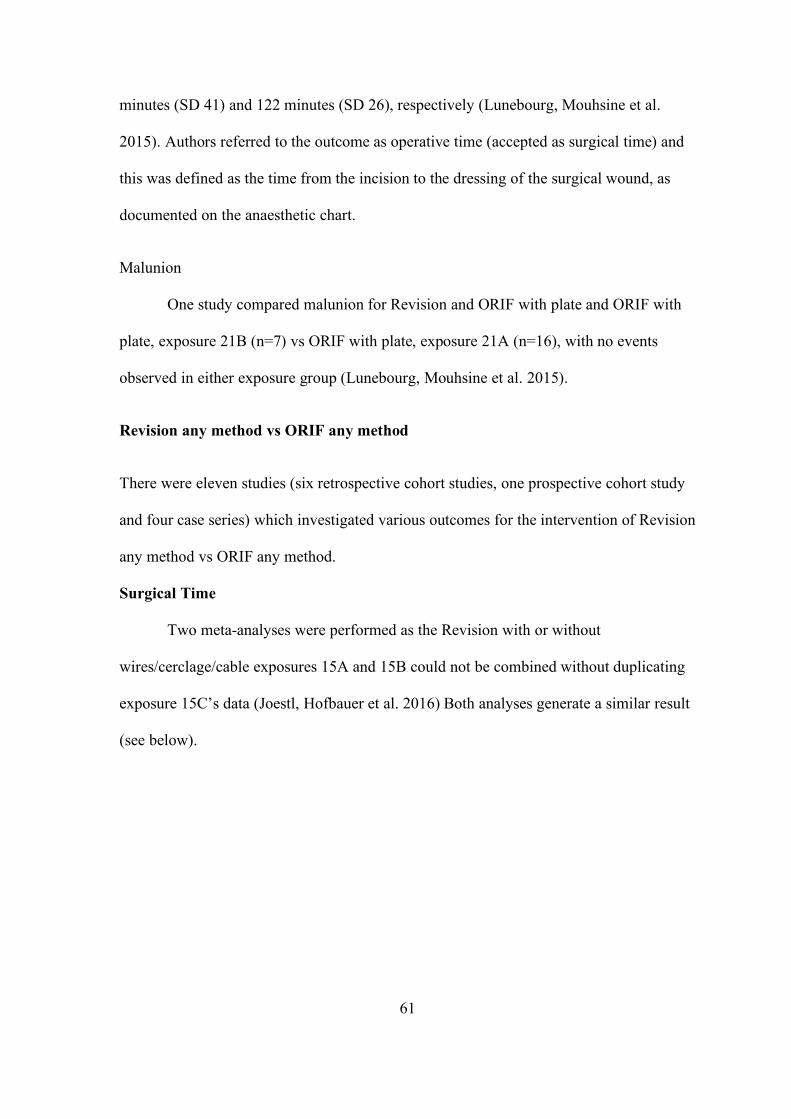
61
minutes (SD 41) and 122 minutes (SD 26), respectively (Lunebourg, Mouhsine et al.
2015). Authors referred to the outcome as operative time (accepted as surgical time) and
this was defined as the time from the incision to the dressing of the surgical wound, as
documented on the anaesthetic chart.
Malunion
One study compared malunion for Revision and ORIF with plate and ORIF with
plate, exposure 21B (n=7) vs ORIF with plate, exposure 21A (n=16), with no events
observed in either exposure group (Lunebourg, Mouhsine et al. 2015).
Revision any method vs ORIF any method
There were eleven studies (six retrospective cohort studies, one prospective cohort study
and four case series) which investigated various outcomes for the intervention of Revision
any method vs ORIF any method.
Surgical Time
Two meta-analyses were performed as the Revision with or without
wires/cerclage/cable exposures 15A and 15B could not be combined without duplicating
exposure 15C’s data (Joestl, Hofbauer et al. 2016) Both analyses generate a similar result
(see below).
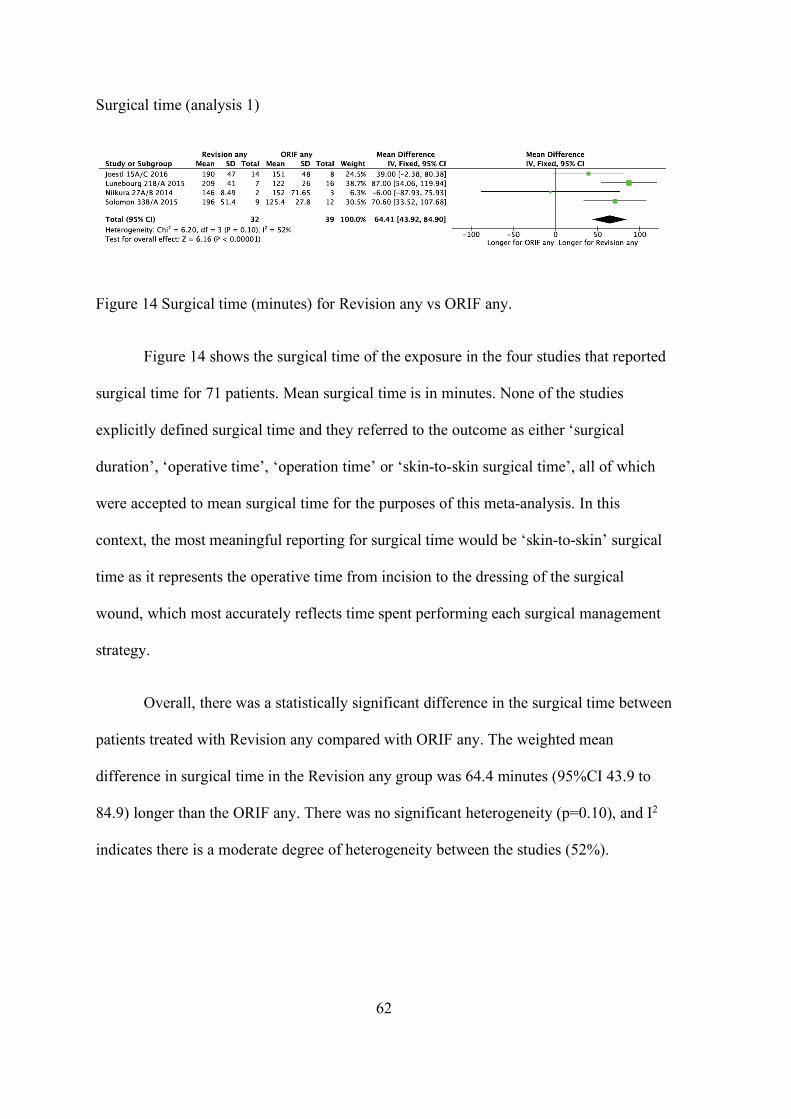
62
Surgical time (analysis 1)
Figure 14 Surgical time (minutes) for Revision any vs ORIF any.
Figure 14 shows the surgical time of the exposure in the four studies that reported
surgical time for 71 patients. Mean surgical time is in minutes. None of the studies
explicitly defined surgical time and they referred to the outcome as either ‘surgical
duration’, ‘operative time’, ‘operation time’ or ‘skin-to-skin surgical time’, all of which
were accepted to mean surgical time for the purposes of this meta-analysis. In this
context, the most meaningful reporting for surgical time would be ‘skin-to-skin’ surgical
time as it represents the operative time from incision to the dressing of the surgical
wound, which most accurately reflects time spent performing each surgical management
strategy.
Overall, there was a statistically significant difference in the surgical time between
patients treated with Revision any compared with ORIF any. The weighted mean
difference in surgical time in the Revision any group was 64.4 minutes (95%CI 43.9 to
84.9) longer than the ORIF any. There was no significant heterogeneity (p=0.10), and I2
indicates there is a moderate degree of heterogeneity between the studies (52%).
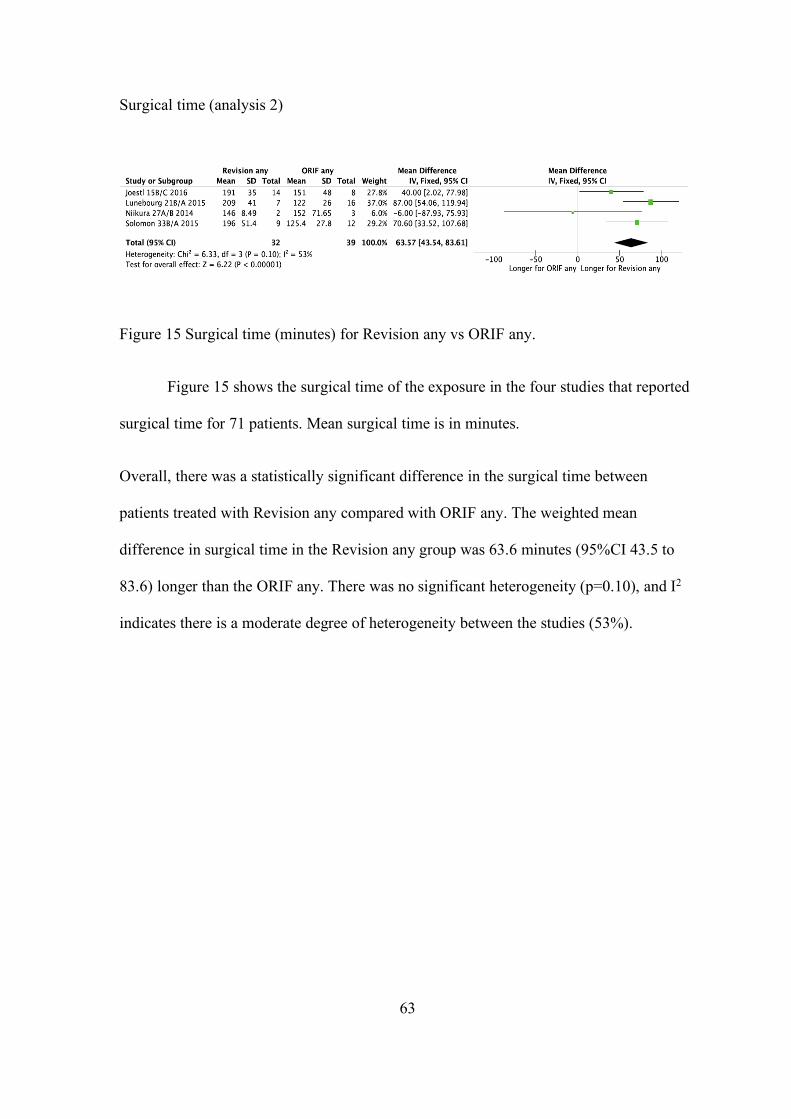
63
Surgical time (analysis 2)
Figure 15 Surgical time (minutes) for Revision any vs ORIF any.
Figure 15 shows the surgical time of the exposure in the four studies that reported
surgical time for 71 patients. Mean surgical time is in minutes.
Overall, there was a statistically significant difference in the surgical time between
patients treated with Revision any compared with ORIF any. The weighted mean
difference in surgical time in the Revision any group was 63.6 minutes (95%CI 43.5 to
83.6) longer than the ORIF any. There was no significant heterogeneity (p=0.10), and I2
indicates there is a moderate degree of heterogeneity between the studies (53%).
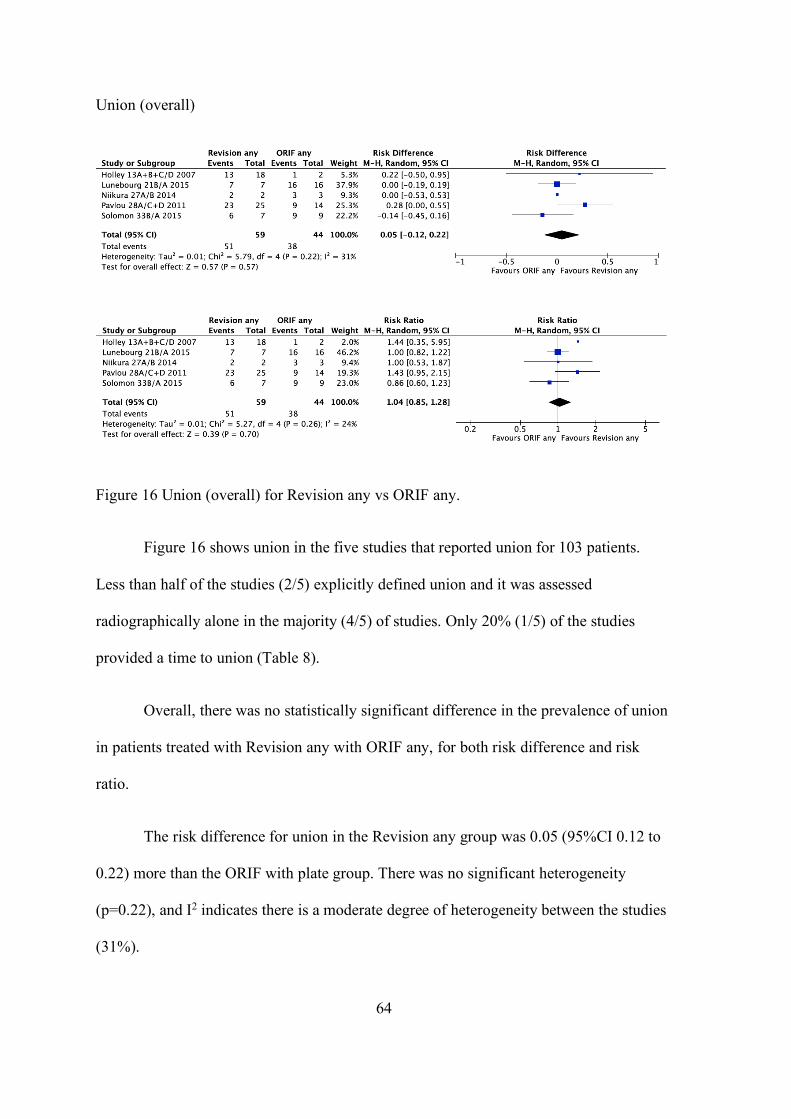
64
Union (overall)
Figure 16 Union (overall) for Revision any vs ORIF any.
Figure 16 shows union in the five studies that reported union for 103 patients.
Less than half of the studies (2/5) explicitly defined union and it was assessed
radiographically alone in the majority (4/5) of studies. Only 20% (1/5) of the studies
provided a time to union (Table 8).
Overall, there was no statistically significant difference in the prevalence of union
in patients treated with Revision any with ORIF any, for both risk difference and risk
ratio.
The risk difference for union in the Revision any group was 0.05 (95%CI 0.12 to
0.22) more than the ORIF with plate group. There was no significant heterogeneity
(p=0.22), and I2 indicates there is a moderate degree of heterogeneity between the studies
(31%).

65
The risk ratio for union in the Revision any group was 1.04 (95%CI 0.85 to 1.28)
more than the ORIF with plate group. There was no significant heterogeneity (p=0.26),
and I2 indicates there is a low degree of heterogeneity between the studies (24%).
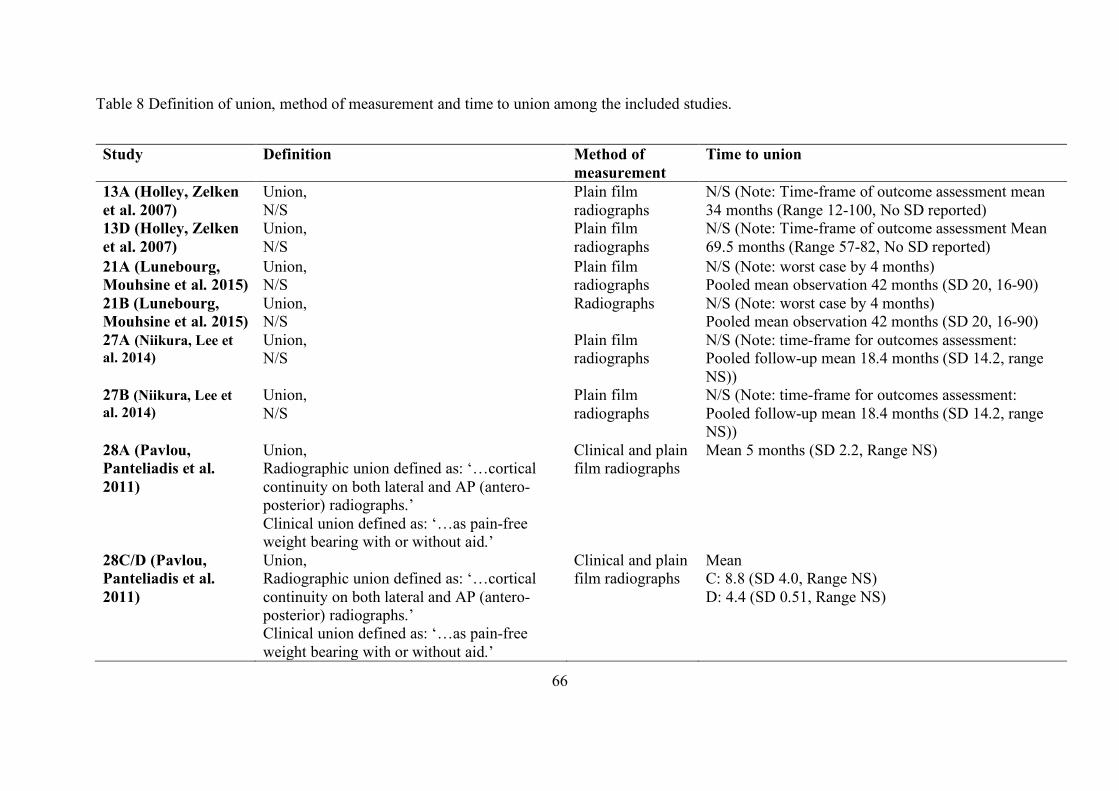
66
Table 8 Definition of union, method of measurement and time to union among the included studies.
Study Definition Method of measurement
Time to union
13A (Holley, Zelken et al. 2007)
Union, N/S
Plain film radiographs
N/S (Note: Time-frame of outcome assessment mean 34 months (Range 12-100, No SD reported)
13D (Holley, Zelken et al. 2007)
Union, N/S
Plain film radiographs
N/S (Note: Time-frame of outcome assessment Mean 69.5 months (Range 57-82, No SD reported)
21A (Lunebourg, Mouhsine et al. 2015)
Union, N/S
Plain film radiographs
N/S (Note: worst case by 4 months) Pooled mean observation 42 months (SD 20, 16-90)
21B (Lunebourg, Mouhsine et al. 2015)
Union, N/S
Radiographs N/S (Note: worst case by 4 months) Pooled mean observation 42 months (SD 20, 16-90)
27A (Niikura, Lee et al. 2014)
Union, N/S
Plain film radiographs
N/S (Note: time-frame for outcomes assessment: Pooled follow-up mean 18.4 months (SD 14.2, range NS))
27B (Niikura, Lee et al. 2014)
Union, N/S
Plain film radiographs
N/S (Note: time-frame for outcomes assessment: Pooled follow-up mean 18.4 months (SD 14.2, range NS))
28A (Pavlou, Panteliadis et al. 2011)
Union, Radiographic union defined as: ‘…cortical continuity on both lateral and AP (antero-posterior) radiographs.’ Clinical union defined as: ‘…as pain-free weight bearing with or without aid.’
Clinical and plain film radiographs
Mean 5 months (SD 2.2, Range NS)
28C/D (Pavlou, Panteliadis et al. 2011)
Union, Radiographic union defined as: ‘…cortical continuity on both lateral and AP (antero-posterior) radiographs.’ Clinical union defined as: ‘…as pain-free weight bearing with or without aid.’
Clinical and plain film radiographs
Mean C: 8.8 (SD 4.0, Range NS) D: 4.4 (SD 0.51, Range NS)
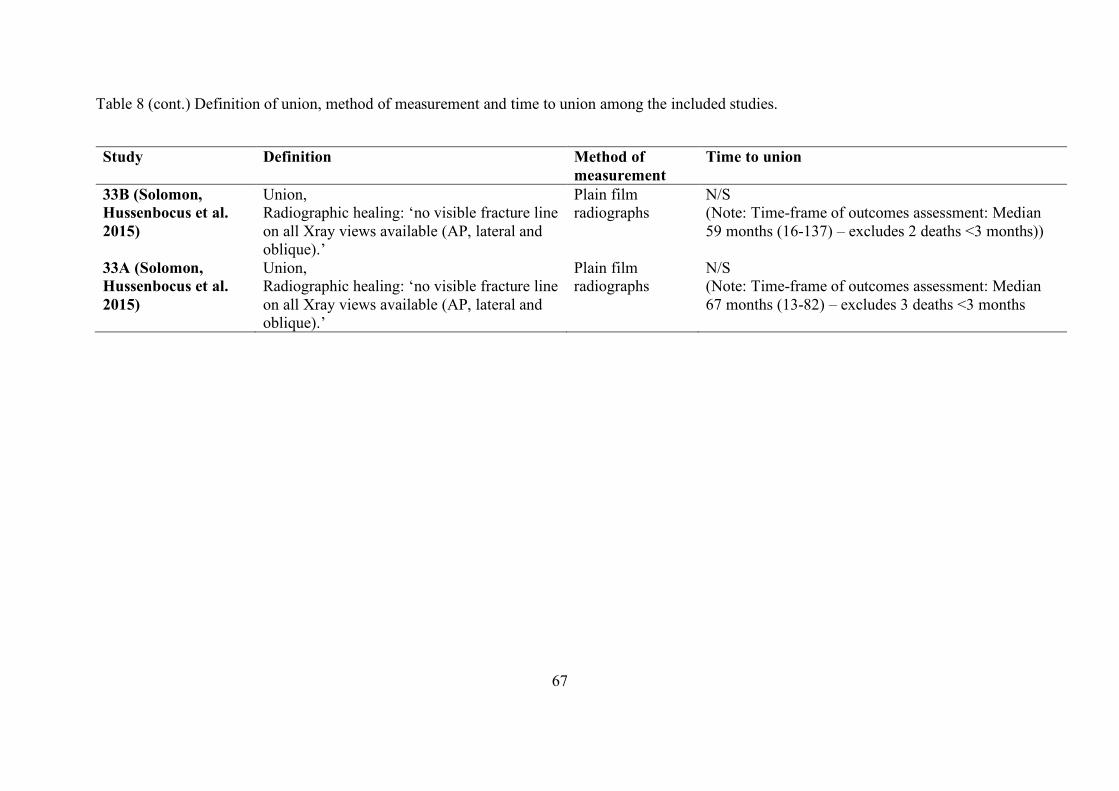
67
Table 8 (cont.) Definition of union, method of measurement and time to union among the included studies.
Study Definition Method of measurement
Time to union
33B (Solomon, Hussenbocus et al. 2015)
Union, Radiographic healing: ‘no visible fracture line on all Xray views available (AP, lateral and oblique).’
Plain film radiographs
N/S (Note: Time-frame of outcomes assessment: Median 59 months (16-137) – excludes 2 deaths <3 months))
33A (Solomon, Hussenbocus et al. 2015)
Union, Radiographic healing: ‘no visible fracture line on all Xray views available (AP, lateral and oblique).’
Plain film radiographs
N/S (Note: Time-frame of outcomes assessment: Median 67 months (13-82) – excludes 3 deaths <3 months
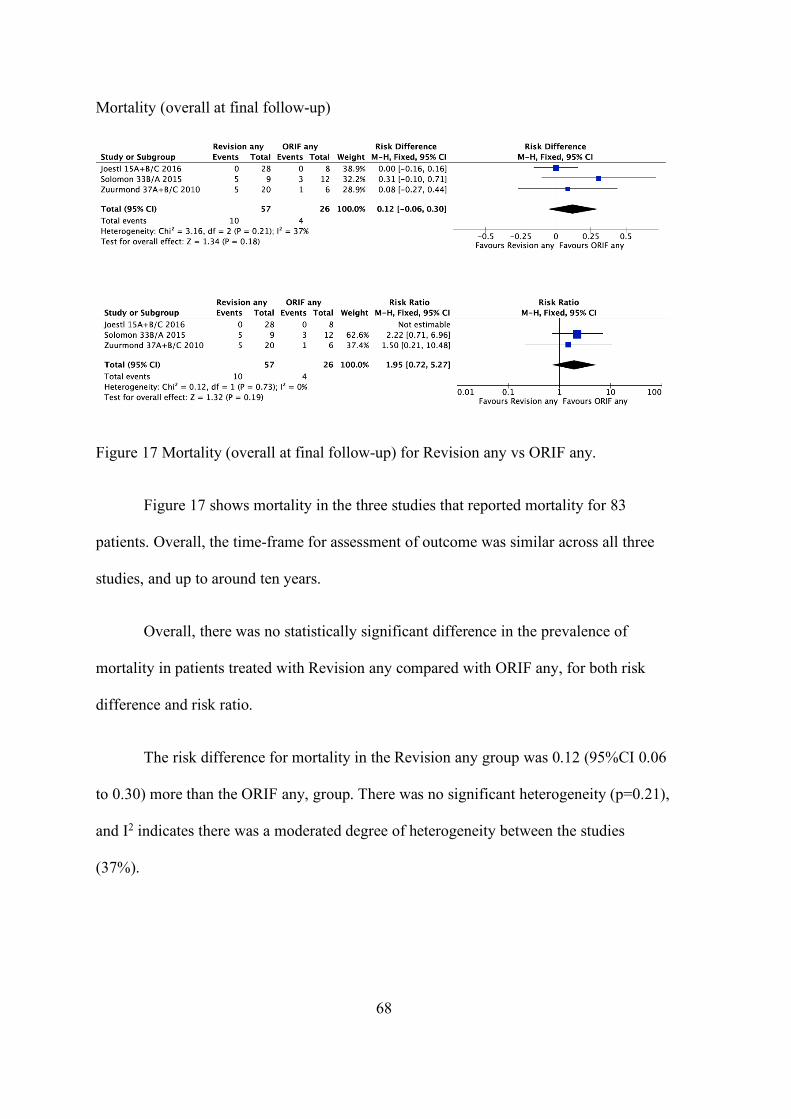
68
Mortality (overall at final follow-up)
Figure 17 Mortality (overall at final follow-up) for Revision any vs ORIF any.
Figure 17 shows mortality in the three studies that reported mortality for 83
patients. Overall, the time-frame for assessment of outcome was similar across all three
studies, and up to around ten years.
Overall, there was no statistically significant difference in the prevalence of
mortality in patients treated with Revision any compared with ORIF any, for both risk
difference and risk ratio.
The risk difference for mortality in the Revision any group was 0.12 (95%CI 0.06
to 0.30) more than the ORIF any, group. There was no significant heterogeneity (p=0.21),
and I2 indicates there was a moderated degree of heterogeneity between the studies
(37%).
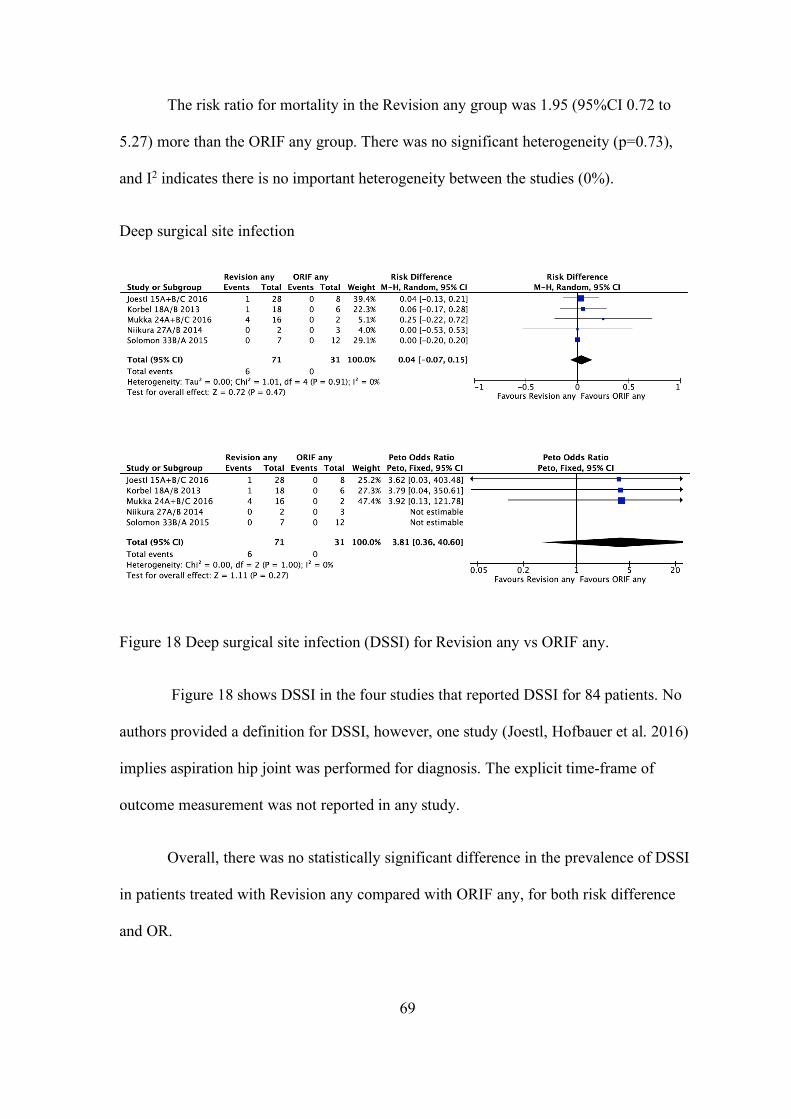
69
The risk ratio for mortality in the Revision any group was 1.95 (95%CI 0.72 to
5.27) more than the ORIF any group. There was no significant heterogeneity (p=0.73),
and I2 indicates there is no important heterogeneity between the studies (0%).
Deep surgical site infection
Figure 18 Deep surgical site infection (DSSI) for Revision any vs ORIF any.
Figure 18 shows DSSI in the four studies that reported DSSI for 84 patients. No
authors provided a definition for DSSI, however, one study (Joestl, Hofbauer et al. 2016)
implies aspiration hip joint was performed for diagnosis. The explicit time-frame of
outcome measurement was not reported in any study.
Overall, there was no statistically significant difference in the prevalence of DSSI
in patients treated with Revision any compared with ORIF any, for both risk difference
and OR.
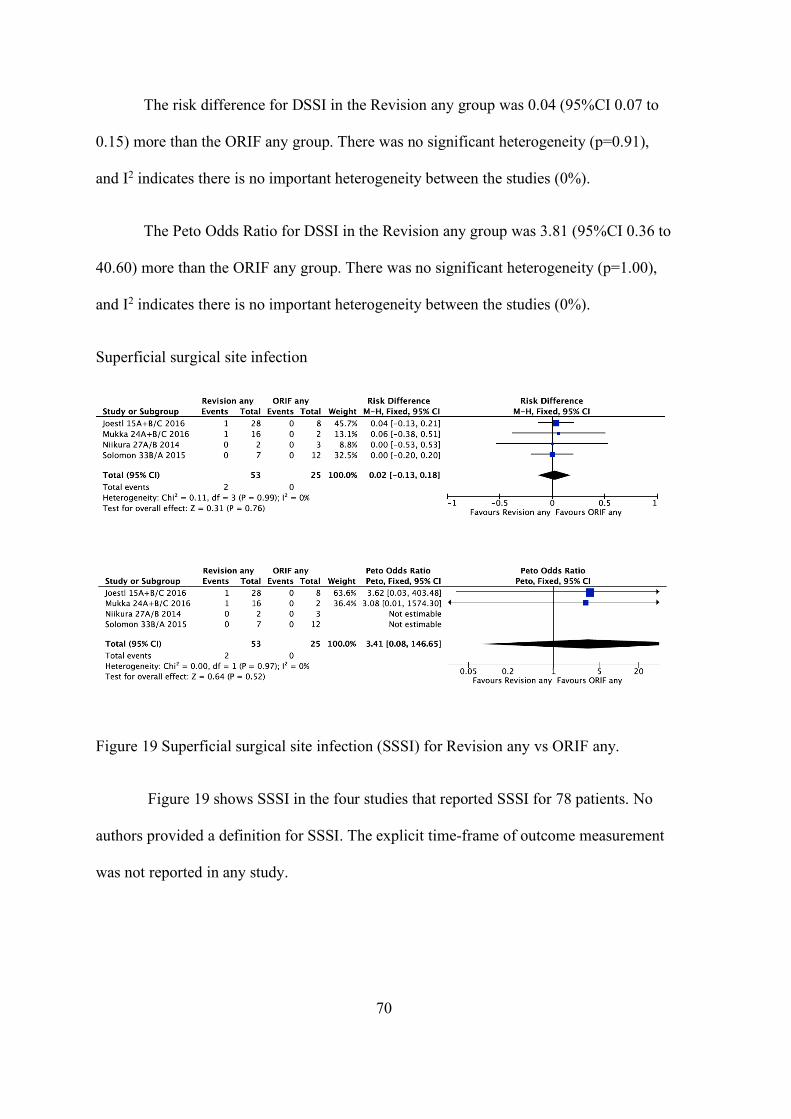
70
The risk difference for DSSI in the Revision any group was 0.04 (95%CI 0.07 to
0.15) more than the ORIF any group. There was no significant heterogeneity (p=0.91),
and I2 indicates there is no important heterogeneity between the studies (0%).
The Peto Odds Ratio for DSSI in the Revision any group was 3.81 (95%CI 0.36 to
40.60) more than the ORIF any group. There was no significant heterogeneity (p=1.00),
and I2 indicates there is no important heterogeneity between the studies (0%).
Superficial surgical site infection
Figure 19 Superficial surgical site infection (SSSI) for Revision any vs ORIF any.
Figure 19 shows SSSI in the four studies that reported SSSI for 78 patients. No
authors provided a definition for SSSI. The explicit time-frame of outcome measurement
was not reported in any study.
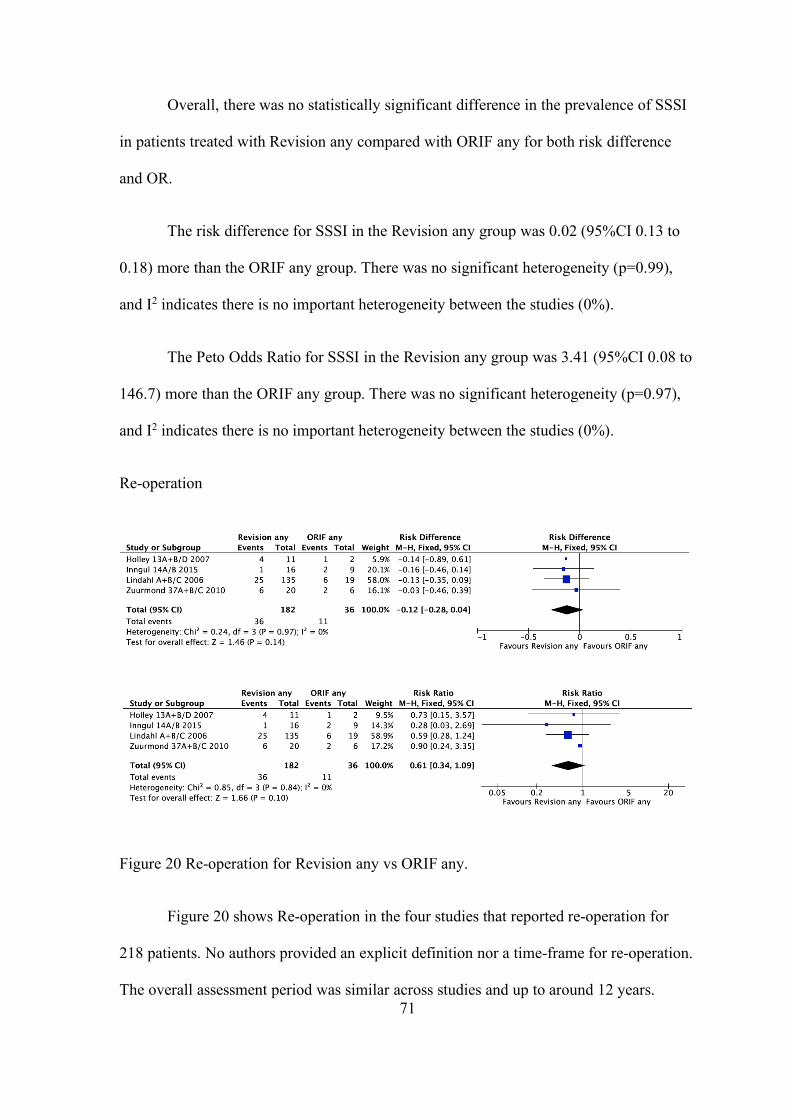
71
Overall, there was no statistically significant difference in the prevalence of SSSI
in patients treated with Revision any compared with ORIF any for both risk difference
and OR.
The risk difference for SSSI in the Revision any group was 0.02 (95%CI 0.13 to
0.18) more than the ORIF any group. There was no significant heterogeneity (p=0.99),
and I2 indicates there is no important heterogeneity between the studies (0%).
The Peto Odds Ratio for SSSI in the Revision any group was 3.41 (95%CI 0.08 to
146.7) more than the ORIF any group. There was no significant heterogeneity (p=0.97),
and I2 indicates there is no important heterogeneity between the studies (0%).
Re-operation
Figure 20 Re-operation for Revision any vs ORIF any.
Figure 20 shows Re-operation in the four studies that reported re-operation for
218 patients. No authors provided an explicit definition nor a time-frame for re-operation.
The overall assessment period was similar across studies and up to around 12 years.
72
Overall, there was no statistically significant difference in the incidence of re-
operation in patients treated with Revision any compared with ORIF any for both risk
difference and risk ratio.
The risk difference for re-operation in the Revision any group was -0.12 (95%CI
0.28 to 0.04) less than the ORIF any group. There was no significant heterogeneity
(p=0.97), and I2 indicates there is no important heterogeneity between the studies (0%).
The risk ratio for union in the Revision any group was 0.61 (95%CI 0.34 to 1.09)
less than the ORIF any group. There was no significant heterogeneity (p=0.84), and I2
indicates there is no important heterogeneity between the studies (0%).
There was a trend towards Revision being protective against re-operation but this was not
statistically significant.
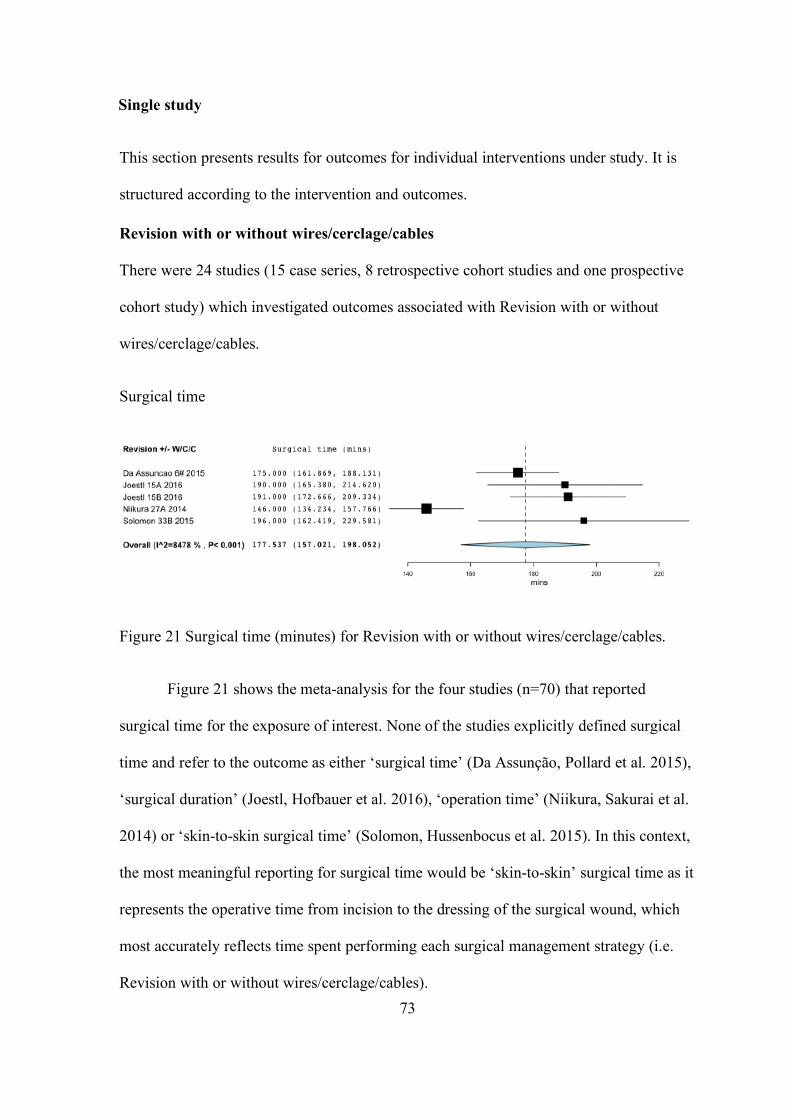
73
Single study
This section presents results for outcomes for individual interventions under study. It is
structured according to the intervention and outcomes.
Revision with or without wires/cerclage/cables
There were 24 studies (15 case series, 8 retrospective cohort studies and one prospective
cohort study) which investigated outcomes associated with Revision with or without
wires/cerclage/cables.
Surgical time
Figure 21 Surgical time (minutes) for Revision with or without wires/cerclage/cables.
Figure 21 shows the meta-analysis for the four studies (n=70) that reported
surgical time for the exposure of interest. None of the studies explicitly defined surgical
time and refer to the outcome as either ‘surgical time’ (Da Assunção, Pollard et al. 2015),
‘surgical duration’ (Joestl, Hofbauer et al. 2016), ‘operation time’ (Niikura, Sakurai et al.
2014) or ‘skin-to-skin surgical time’ (Solomon, Hussenbocus et al. 2015). In this context,
the most meaningful reporting for surgical time would be ‘skin-to-skin’ surgical time as it
represents the operative time from incision to the dressing of the surgical wound, which
most accurately reflects time spent performing each surgical management strategy (i.e.
Revision with or without wires/cerclage/cables).
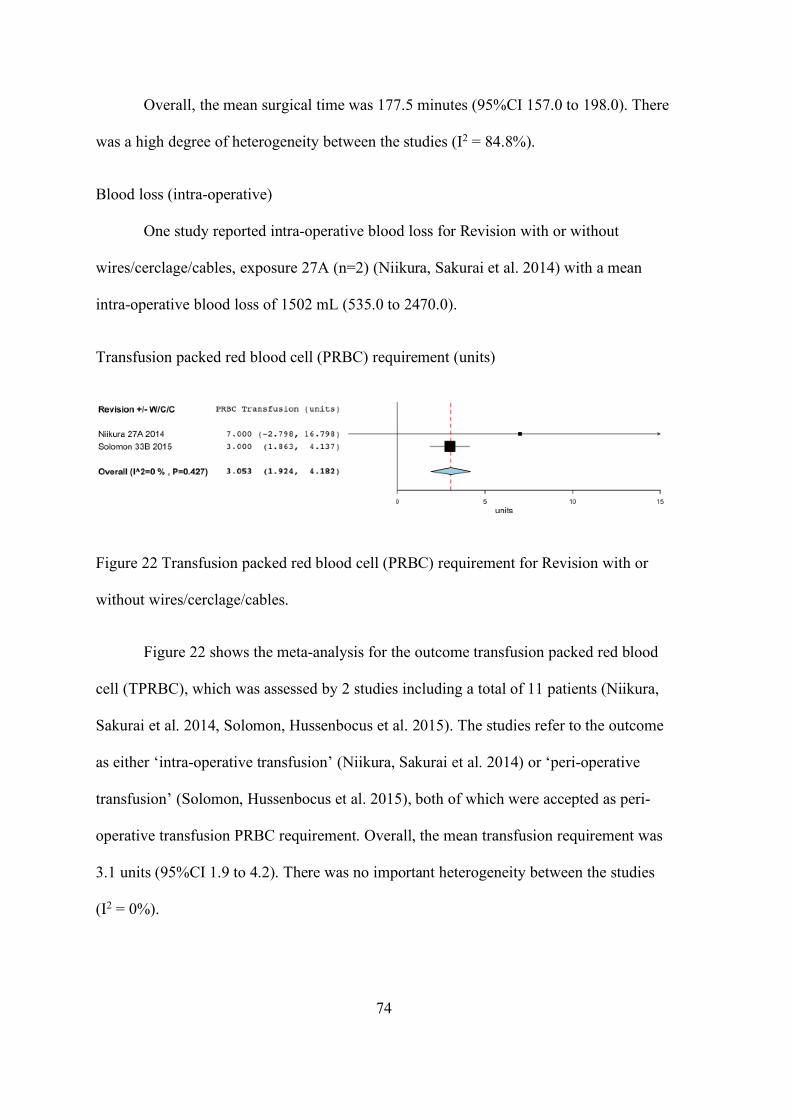
74
Overall, the mean surgical time was 177.5 minutes (95%CI 157.0 to 198.0). There
was a high degree of heterogeneity between the studies (I2 = 84.8%).
Blood loss (intra-operative)
One study reported intra-operative blood loss for Revision with or without
wires/cerclage/cables, exposure 27A (n=2) (Niikura, Sakurai et al. 2014) with a mean
intra-operative blood loss of 1502 mL (535.0 to 2470.0).
Transfusion packed red blood cell (PRBC) requirement (units)
Figure 22 Transfusion packed red blood cell (PRBC) requirement for Revision with or
without wires/cerclage/cables.
Figure 22 shows the meta-analysis for the outcome transfusion packed red blood
cell (TPRBC), which was assessed by 2 studies including a total of 11 patients (Niikura,
Sakurai et al. 2014, Solomon, Hussenbocus et al. 2015). The studies refer to the outcome
as either ‘intra-operative transfusion’ (Niikura, Sakurai et al. 2014) or ‘peri-operative
transfusion’ (Solomon, Hussenbocus et al. 2015), both of which were accepted as peri-
operative transfusion PRBC requirement. Overall, the mean transfusion requirement was
3.1 units (95%CI 1.9 to 4.2). There was no important heterogeneity between the studies
(I2 = 0%).
75
Studies not included in the meta-analysis: Da Assunção and colleagues reported
on transfusion packed red blood cell (PRBC) requirement, however, unfortunately did not
include the standard deviation or range, and hence was excluded from this meta-analysis
(Da Assunção, Pollard et al. 2015).
Transfusion PRBC (1 or more units required within 48 hours of surgery)
One study reported Transfusion PRBC requirement within 48 hours of surgery for
Revision with or without wires/cerclage/cables, exposure 15A+B with a prevalence of
64% (18/28) (Joestl, Hofbauer et al. 2016).
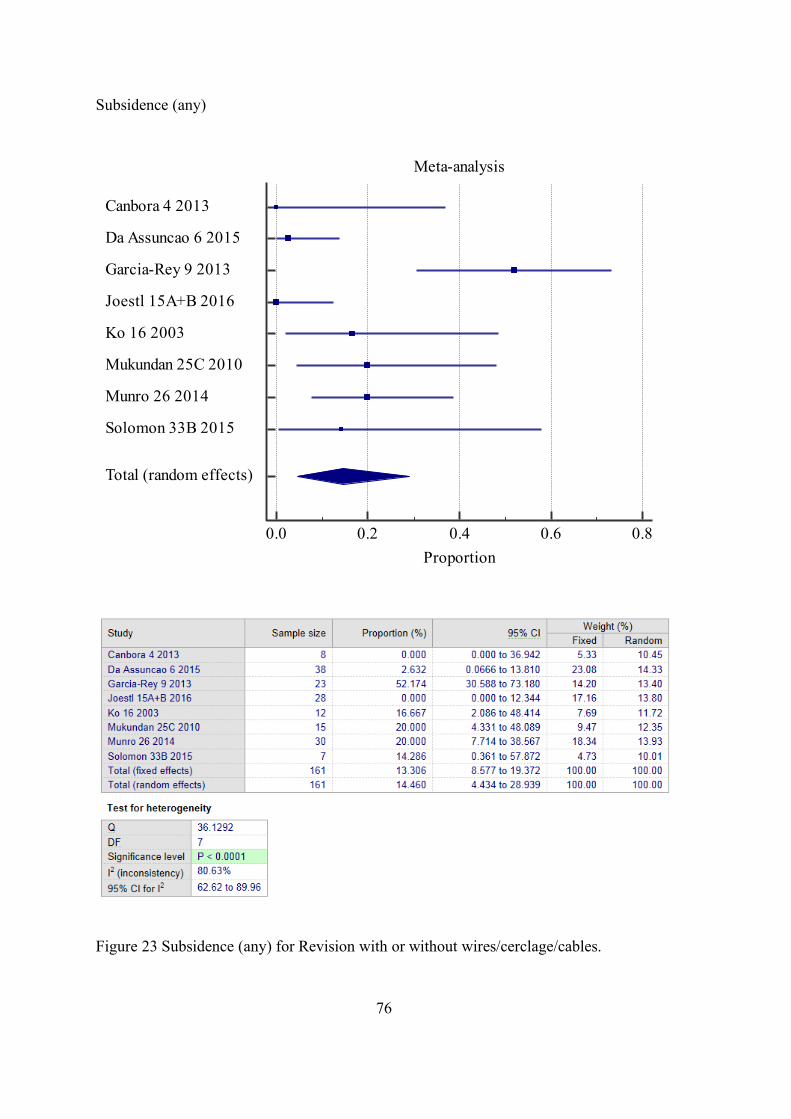
76
Subsidence (any)
Figure 23 Subsidence (any) for Revision with or without wires/cerclage/cables.
Meta-analysis
0.0 0.2 0.4 0.6 0.8Proportion
Canbora 4 2013
Da Assuncao 6 2015
Garcia-Rey 9 2013
Joestl 15A+B 2016
Ko 16 2003
Mukundan 25C 2010
Munro 26 2014
Solomon 33B 2015
Total (random effects)
77
Figure 23 shows the meta-analysis for the eight studies (n=161) that reported
subsidence for the exposure of interest. The terms stem subsidence (7/8 studies) and stem
migration (1/8 studies) were accepted as subsidence for the purposes of this meta-
analysis. Definition of subsidence was provided in almost all studies (7/8 studies),
however, only just over half (5/8 studies) explicitly reported their method for measuring
subsidence (Table 9).
Overall, the prevalence of subsidence was 14.5% (95%CI 4.4 to 28.9). There was
a high degree of heterogeneity between the studies (I2 = 80.6%).
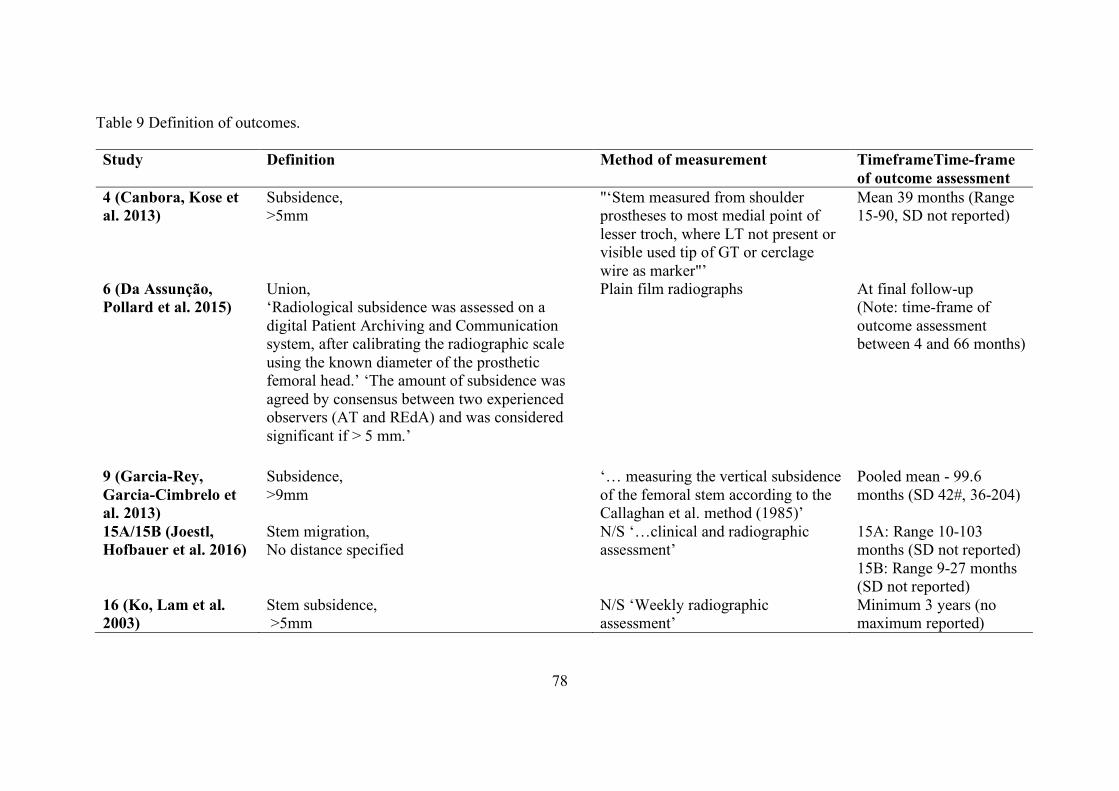
78
Table 9 Definition of outcomes.
Study Definition Method of measurement TimeframeTime-frame of outcome assessment
4 (Canbora, Kose et al. 2013)
Subsidence, >5mm
"‘Stem measured from shoulder prostheses to most medial point of lesser troch, where LT not present or visible used tip of GT or cerclage wire as marker"’
Mean 39 months (Range 15-90, SD not reported)
6 (Da Assunção, Pollard et al. 2015)
Union, ‘Radiological subsidence was assessed on a digital Patient Archiving and Communication system, after calibrating the radiographic scale using the known diameter of the prosthetic femoral head.’ ‘The amount of subsidence was agreed by consensus between two experienced observers (AT and REdA) and was considered significant if > 5 mm.’
Plain film radiographs At final follow-up (Note: time-frame of outcome assessment between 4 and 66 months)
9 (Garcia-Rey, Garcia-Cimbrelo et al. 2013)
Subsidence, >9mm
‘… measuring the vertical subsidence of the femoral stem according to the Callaghan et al. method (1985)’
Pooled mean - 99.6 months (SD 42#, 36-204)
15A/15B (Joestl, Hofbauer et al. 2016)
Stem migration, No distance specified
N/S ‘…clinical and radiographic assessment’
15A: Range 10-103 months (SD not reported) 15B: Range 9-27 months (SD not reported)
16 (Ko, Lam et al. 2003)
Stem subsidence, >5mm
N/S ‘Weekly radiographic assessment’
Minimum 3 years (no maximum reported)
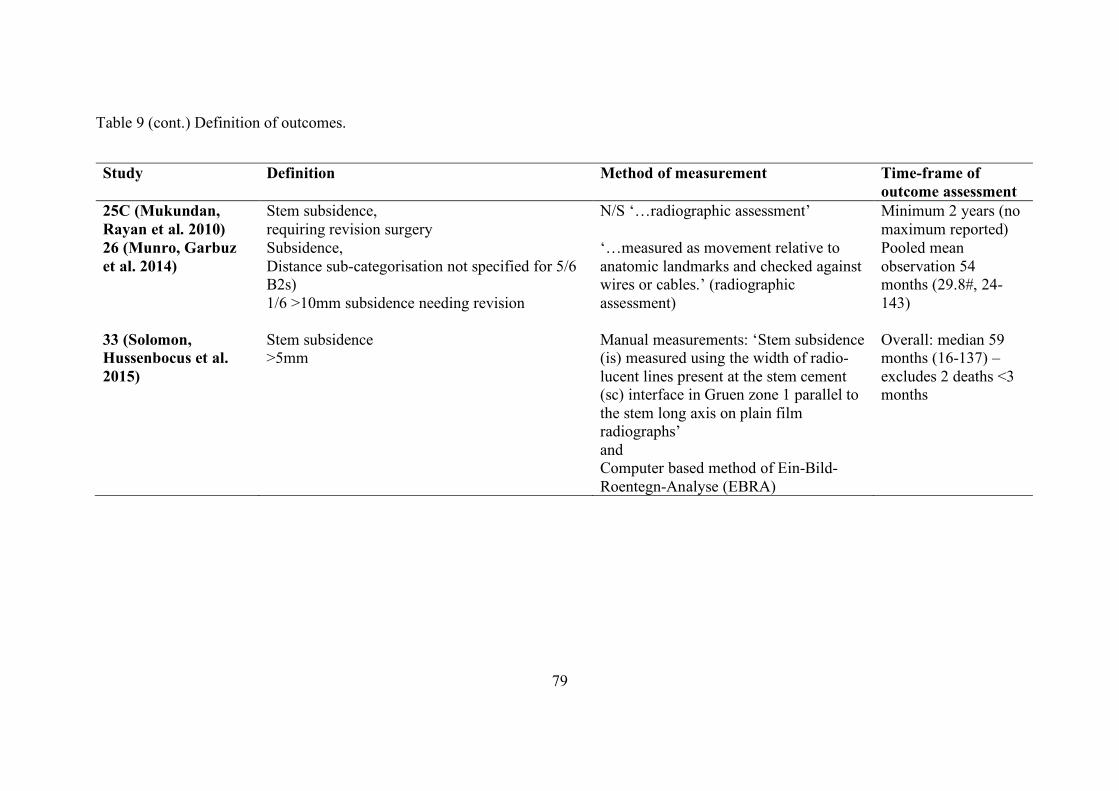
79
Table 9 (cont.) Definition of outcomes.
Study Definition Method of measurement Time-frame of outcome assessment
25C (Mukundan, Rayan et al. 2010)
Stem subsidence, requiring revision surgery
N/S ‘…radiographic assessment’ Minimum 2 years (no maximum reported)
26 (Munro, Garbuz et al. 2014)
Subsidence, Distance sub-categorisation not specified for 5/6 B2s) 1/6 >10mm subsidence needing revision
‘…measured as movement relative to anatomic landmarks and checked against wires or cables.’ (radiographic assessment)
Pooled mean observation 54 months (29.8#, 24-143)
33 (Solomon, Hussenbocus et al. 2015)
Stem subsidence >5mm
Manual measurements: ‘Stem subsidence (is) measured using the width of radio-lucent lines present at the stem cement (sc) interface in Gruen zone 1 parallel to the stem long axis on plain film radiographs’ and Computer based method of Ein-Bild-Roentegn-Analyse (EBRA)
Overall: median 59 months (16-137) – excludes 2 deaths <3 months
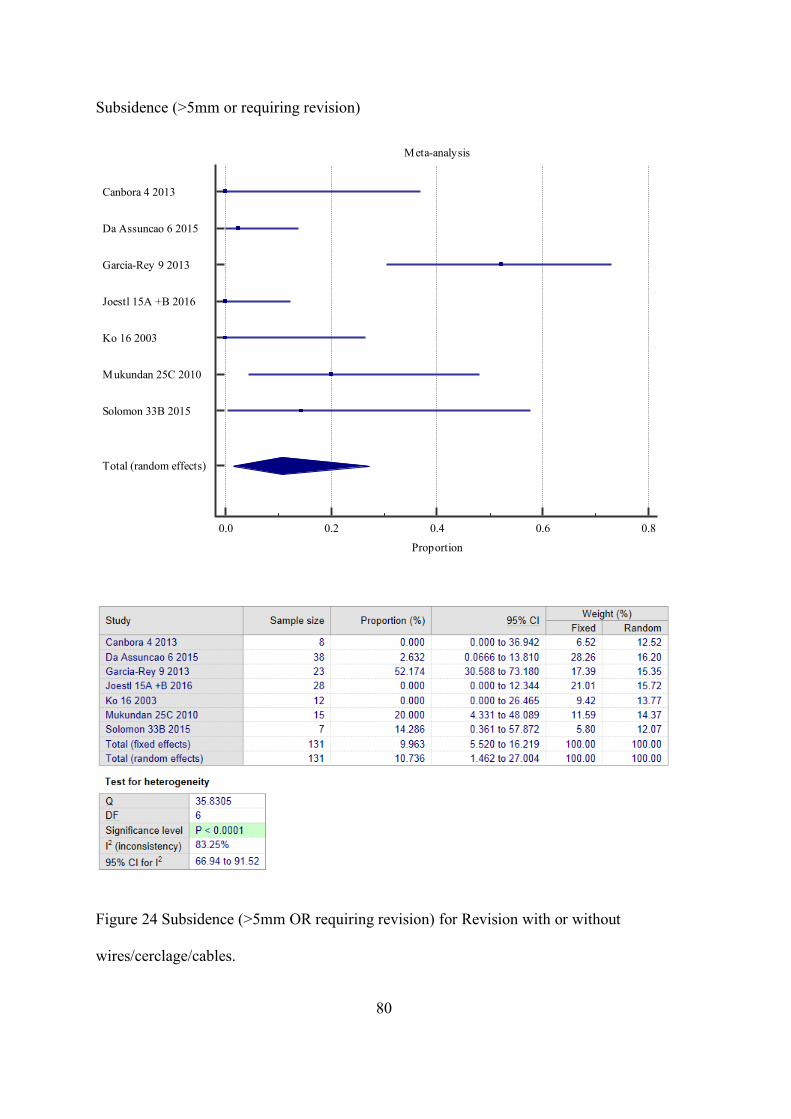
80
Subsidence (>5mm or requiring revision)
Figure 24 Subsidence (>5mm OR requiring revision) for Revision with or without
wires/cerclage/cables.
Meta-analysis
0.0 0.2 0.4 0.6 0.8
Proportion
Canbora 4 2013
Da Assuncao 6 2015
Garcia-Rey 9 2013
Joestl 15A +B 2016
Ko 16 2003
Mukundan 25C 2010
Solomon 33B 2015
Total (random effects)
81
Figure 24 shows the meta-analysis for the seven studies (n=131) that reported
subsidence for the exposure of interest.
Overall, the prevalence of subsidence >5mm or requiring Revision was 10.7%
(95%CI 1.4 to 27.0). There was a high degree of heterogeneity between the studies
(I2 = 83.3%).
Studies not included in the meta-analysis: Munro and colleagues reported on
subsidence, however, unfortunately did not include the distance of subsidence amongst
the B2 PFF patient group, and hence was excluded from this meta-analysis (Munro,
Garbuz et al. 2014).
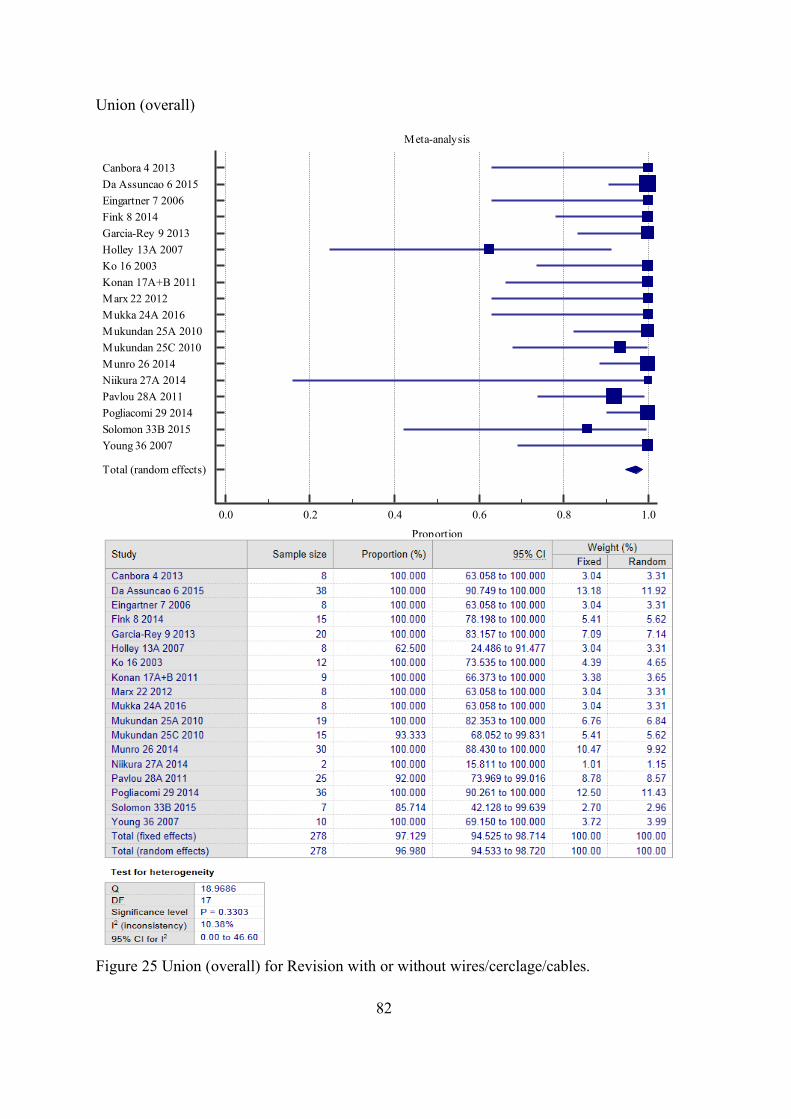
82
Union (overall)
Figure 25 Union (overall) for Revision with or without wires/cerclage/cables.
Meta-analysis
0.0 0.2 0.4 0.6 0.8 1.0
Proportion
Canbora 4 2013Da Assuncao 6 2015Eingartner 7 2006Fink 8 2014Garcia-Rey 9 2013Holley 13A 2007Ko 16 2003Konan 17A+B 2011Marx 22 2012Mukka 24A 2016Mukundan 25A 2010Mukundan 25C 2010Munro 26 2014Niikura 27A 2014Pavlou 28A 2011Pogliacomi 29 2014Solomon 33B 2015Young 36 2007
Total (random effects)
83
Figure 25 shows the meta-analysis for the seventeen studies (n=278) that reported
union (overall) for revision with or without wires/cerclage/cables. Just over half of the
studies (10/18) explicitly defined union and it was generally defined as the presence of a
bridging callus across the main fracture site on a minimum of two or three sides viewed in
two views on plain film radiographs. Some studies (3/18) additionally considered clinical
union, for example, the patient being able to fully weight bear without pain, and lacked
pain on clinical stressing of fracture site (Garcia-Rey, Garcia-Cimbrelo et al. 2013). The
time to union was reported in half of the studies (9/18) (Table 9). Overall, the prevalence
of union was 97.0% (95%CI 94.5 to 98.7). There was a low degree of heterogeneity
between the studies (I2 = 10.4%).
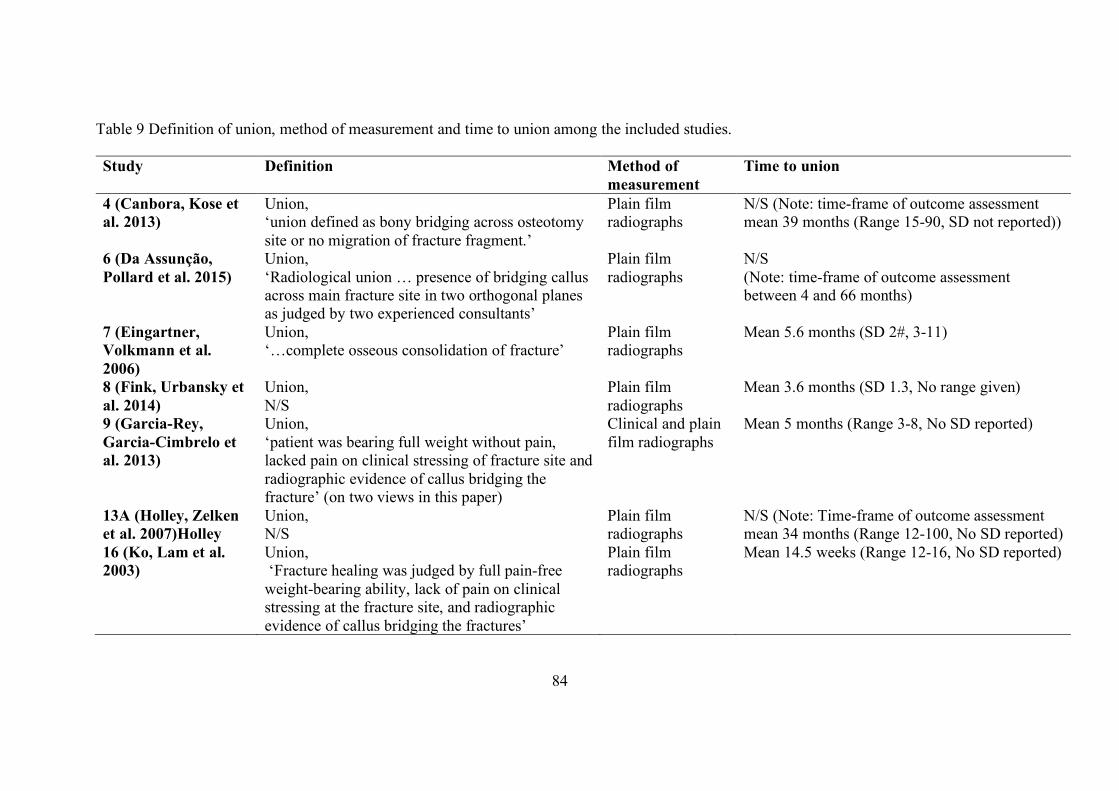
84
Table 9 Definition of union, method of measurement and time to union among the included studies.
Study Definition Method of measurement
Time to union
4 (Canbora, Kose et al. 2013)
Union, ‘union defined as bony bridging across osteotomy site or no migration of fracture fragment.’
Plain film radiographs
N/S (Note: time-frame of outcome assessment mean 39 months (Range 15-90, SD not reported))
6 (Da Assunção, Pollard et al. 2015)
Union, ‘Radiological union … presence of bridging callus across main fracture site in two orthogonal planes as judged by two experienced consultants’
Plain film radiographs
N/S (Note: time-frame of outcome assessment between 4 and 66 months)
7 (Eingartner, Volkmann et al. 2006)
Union, ‘…complete osseous consolidation of fracture’
Plain film radiographs
Mean 5.6 months (SD 2#, 3-11)
8 (Fink, Urbansky et al. 2014)
Union, N/S
Plain film radiographs
Mean 3.6 months (SD 1.3, No range given)
9 (Garcia-Rey, Garcia-Cimbrelo et al. 2013)
Union, ‘patient was bearing full weight without pain, lacked pain on clinical stressing of fracture site and radiographic evidence of callus bridging the fracture’ (on two views in this paper)
Clinical and plain film radiographs
Mean 5 months (Range 3-8, No SD reported)
13A (Holley, Zelken et al. 2007)Holley
Union, N/S
Plain film radiographs
N/S (Note: Time-frame of outcome assessment mean 34 months (Range 12-100, No SD reported)
16 (Ko, Lam et al. 2003)
Union, ‘Fracture healing was judged by full pain-free weight-bearing ability, lack of pain on clinical stressing at the fracture site, and radiographic evidence of callus bridging the fractures’
Plain film radiographs
Mean 14.5 weeks (Range 12-16, No SD reported)
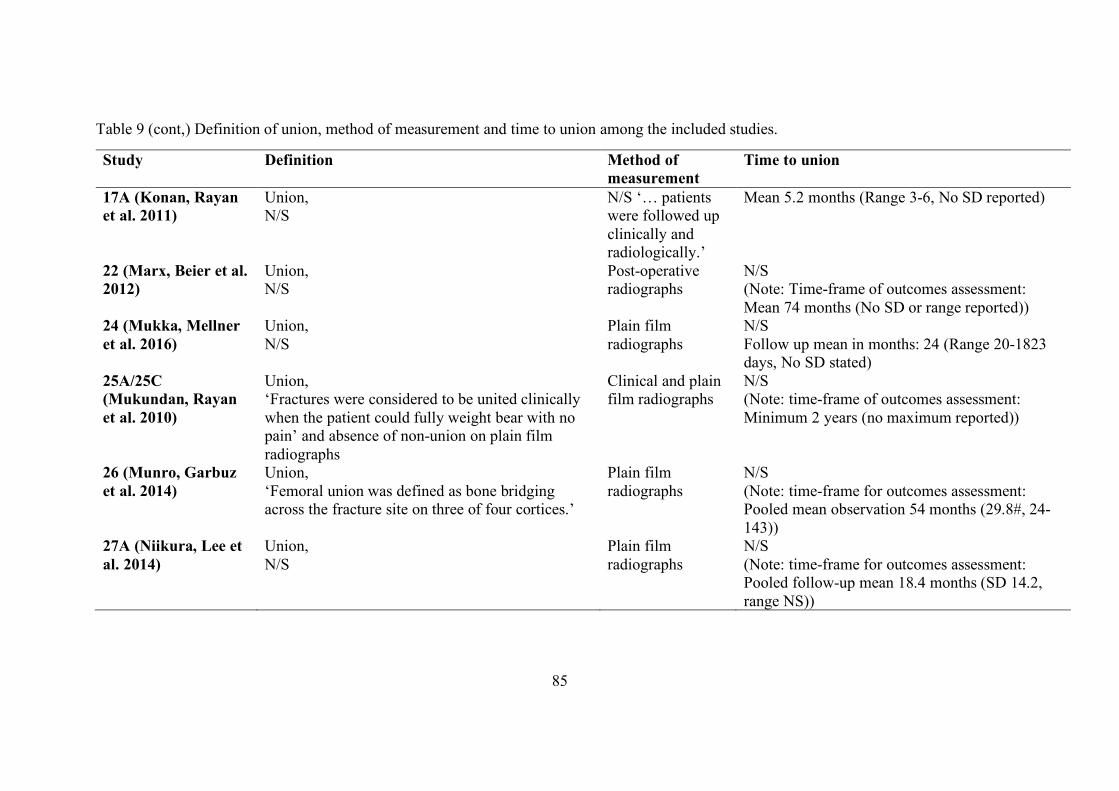
85
Table 9 (cont,) Definition of union, method of measurement and time to union among the included studies.
Study Definition Method of measurement
Time to union
17A (Konan, Rayan et al. 2011)
Union, N/S
N/S ‘… patients were followed up clinically and radiologically.’
Mean 5.2 months (Range 3-6, No SD reported)
22 (Marx, Beier et al. 2012)
Union, N/S
Post-operative radiographs
N/S (Note: Time-frame of outcomes assessment: Mean 74 months (No SD or range reported))
24 (Mukka, Mellner et al. 2016)
Union, N/S
Plain film radiographs
N/S Follow up mean in months: 24 (Range 20-1823 days, No SD stated)
25A/25C (Mukundan, Rayan et al. 2010)
Union, ‘Fractures were considered to be united clinically when the patient could fully weight bear with no pain’ and absence of non-union on plain film radiographs
Clinical and plain film radiographs
N/S (Note: time-frame of outcomes assessment: Minimum 2 years (no maximum reported))
26 (Munro, Garbuz et al. 2014)
Union, ‘Femoral union was defined as bone bridging across the fracture site on three of four cortices.’
Plain film radiographs
N/S (Note: time-frame for outcomes assessment: Pooled mean observation 54 months (29.8#, 24-143))
27A (Niikura, Lee et al. 2014)
Union, N/S
Plain film radiographs
N/S (Note: time-frame for outcomes assessment: Pooled follow-up mean 18.4 months (SD 14.2, range NS))
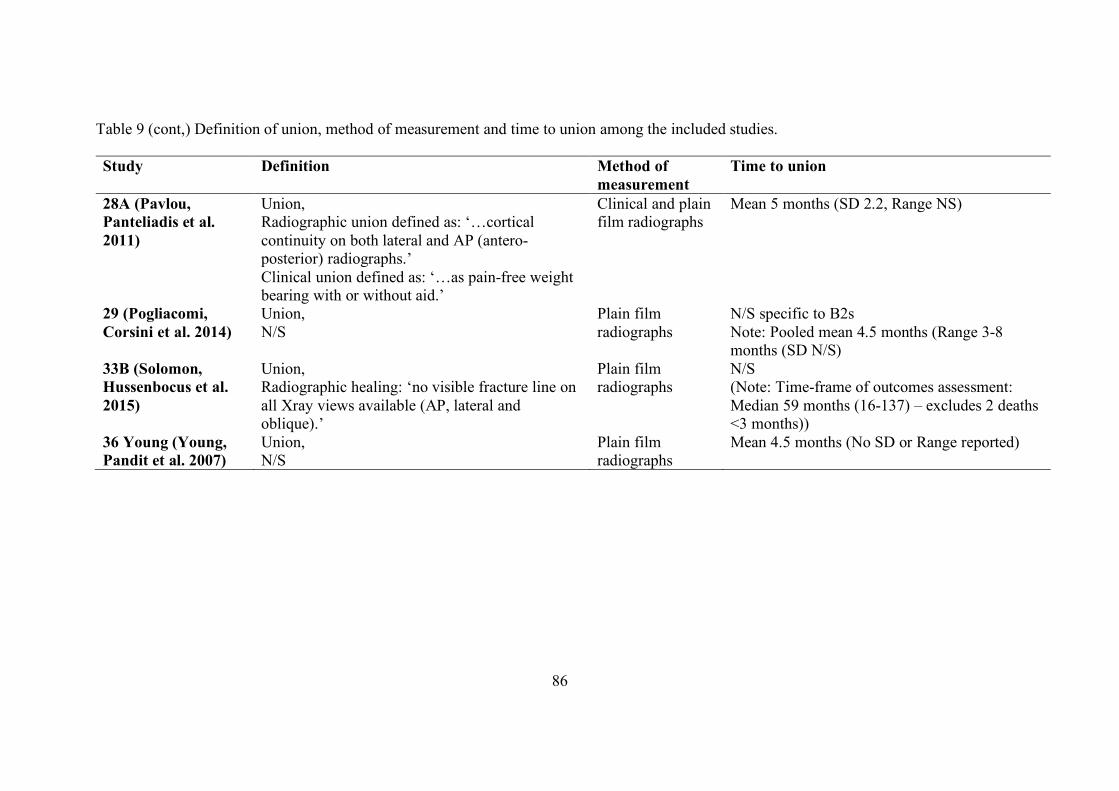
86
Table 9 (cont,) Definition of union, method of measurement and time to union among the included studies.
Study Definition Method of measurement
Time to union
28A (Pavlou, Panteliadis et al. 2011)
Union, Radiographic union defined as: ‘…cortical continuity on both lateral and AP (antero-posterior) radiographs.’ Clinical union defined as: ‘…as pain-free weight bearing with or without aid.’
Clinical and plain film radiographs
Mean 5 months (SD 2.2, Range NS)
29 (Pogliacomi, Corsini et al. 2014)
Union, N/S
Plain film radiographs
N/S specific to B2s Note: Pooled mean 4.5 months (Range 3-8 months (SD N/S)
33B (Solomon, Hussenbocus et al. 2015)
Union, Radiographic healing: ‘no visible fracture line on all Xray views available (AP, lateral and oblique).’
Plain film radiographs
N/S (Note: Time-frame of outcomes assessment: Median 59 months (16-137) – excludes 2 deaths <3 months))
36 Young (Young, Pandit et al. 2007)
Union, N/S
Plain film radiographs
Mean 4.5 months (No SD or Range reported)
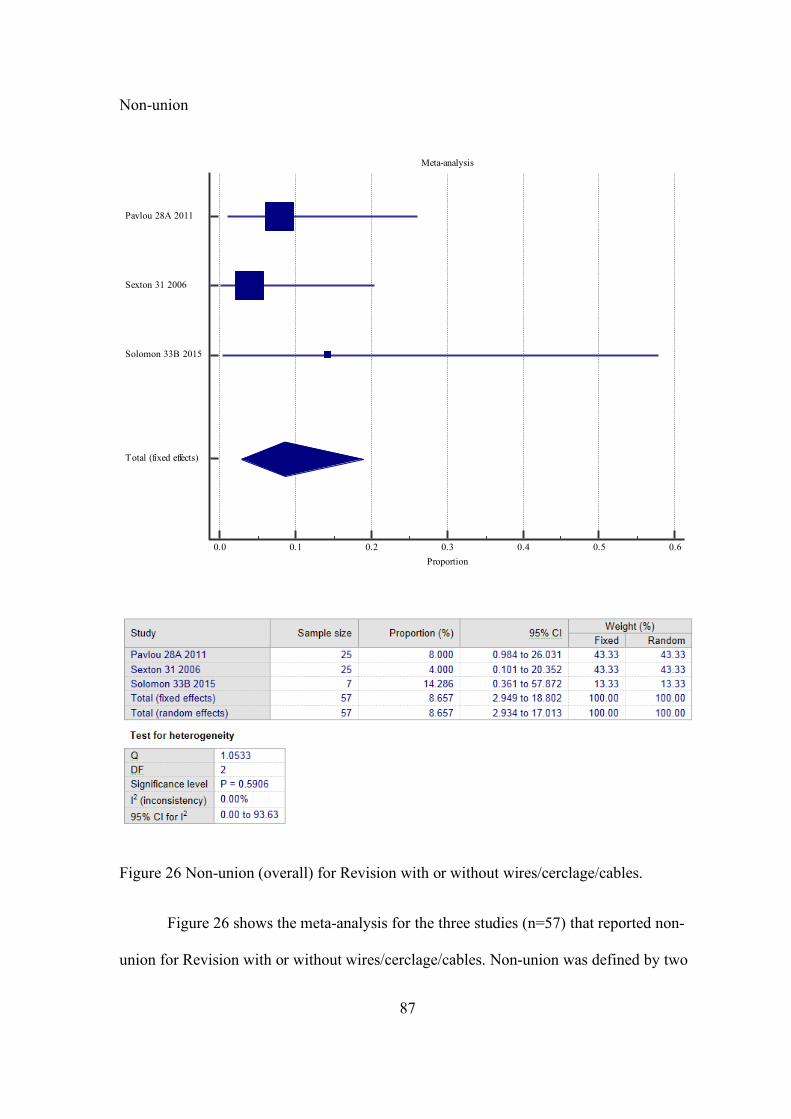
87
Non-union
Figure 26 Non-union (overall) for Revision with or without wires/cerclage/cables.
Figure 26 shows the meta-analysis for the three studies (n=57) that reported non-
union for Revision with or without wires/cerclage/cables. Non-union was defined by two
Meta-analysis
0.0 0.1 0.2 0.3 0.4 0.5 0.6Proportion
Pavlou 28A 2011
Sexton 31 2006
Solomon 33B 2015
Total (fixed effects)
88
studies (Sexton, Stossel et al. 2006, Pavlou, Panteliadis et al. 2011) as failure to unite by
12 months post-operatively, it was not explicitly defined in the third study, however, it
was interpreted as failure to unite (Pavlou, Panteliadis et al. 2011). Overall, the
prevalence of non-union was 8.7% (95%CI 2.9 to 17.0). There was no important
heterogeneity between the studies (I2 = 0%).
Osseointegration (ingrowth fixation stem)
Three studies reported osseointegration for Revision with or without
wires/cerclage/cables, exposure 9, 16 and 29, with a prevalence of 100% (20/20), 100%
(12/12) and 100% (36/36), respectively. Importantly, only one study (Garcia-Rey,
Garcia-Cimbrelo et al. 2013) provided an explicit definition; ‘…Femoral component
fixation radiographic ingrowth, fibrous stable, or unstable according to criteria for porous
prosthesis as described by (Engh, Glassman et al. 1990).
Femoral osteolysis
One study reported femoral osteolysis for Revision with or without
wires/cerclage/cables, exposure 33B, with a prevalence of 0% (0/7). Femoral osteolysis
was defined as a greater than 3mm diameter nonlinear demarcated lesion (recorded for
each Gruen zone), however, no time-frame was stipulated (Solomon, Hussenbocus et al.
2015).
Malrotation
One study reported malrotation for Revision with or without
wires/cerclage/cables, exposure 16 (Ko, Lam et al. 2003), with a prevalence of 0% (0/12).
No explicit definition of malrotation was reported.
89
Loss of reduction (fracture)
One study reported loss of reduction (fracture) for Revision with or without
wires/cerclage/cables, exposure 27A (Niikura, Sakurai et al. 2014), with a prevalence of
0% (0/2). No explicit definition of loss of reduction was reported.
Heterotopic ossification
Two studies reported heterotopic ossification for Revision with or without
wires/cerclage/cables, exposure 16 (Ko, Lam et al. 2003) and 36 (Spina, Rocca et al.
2014), with a prevalence of 0% (0/12) and 10% (1/10), respectively. No explicit
definition or time-frame for heterotopic ossification was reported.
Malunion
Two studies reported malunion for Revision with or without
wires/cerclage/cables, exposure 27A (Niikura, Sakurai et al. 2014) and 31 (Sexton,
Stossel et al. 2006), with event rates of 0/2 (0%) and 0/25 (0%), respectively. Malunion
was defined radiologically by Niikura and colleagues ‘…as angular deformity greater
than 5°.’ (Niikura, Sakurai et al. 2014).
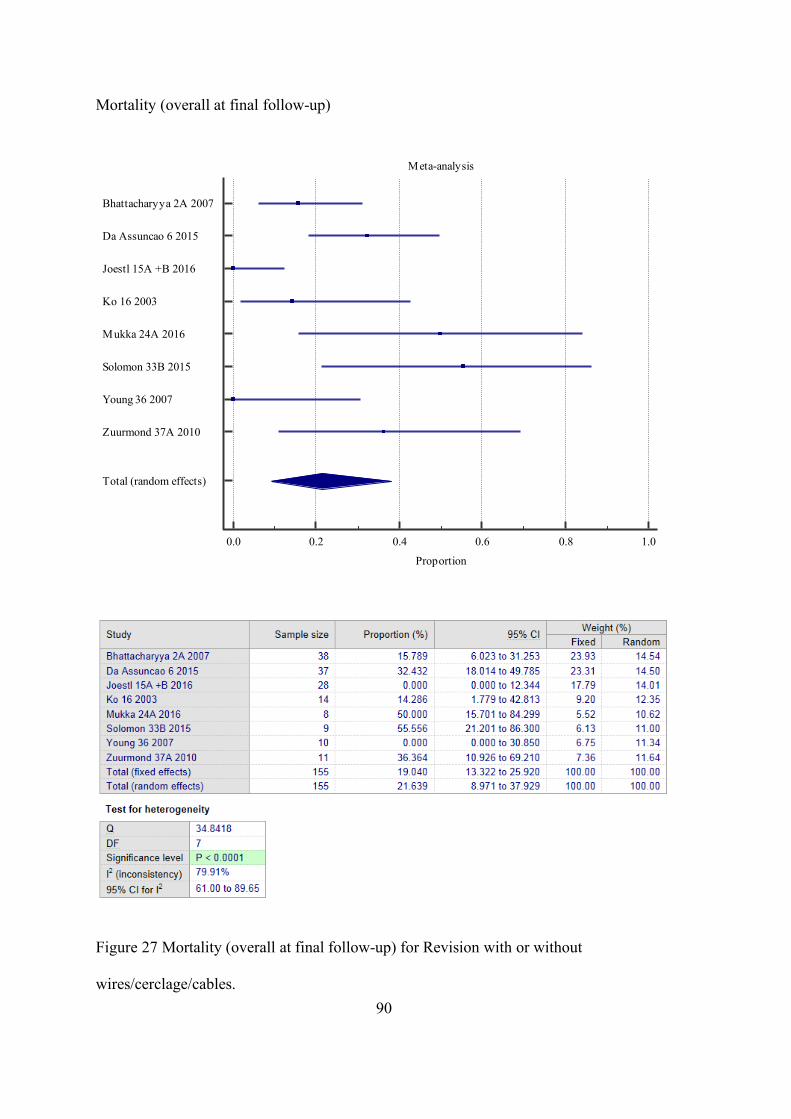
90
Mortality (overall at final follow-up)
Figure 27 Mortality (overall at final follow-up) for Revision with or without
wires/cerclage/cables.
Meta-analysis
0.0 0.2 0.4 0.6 0.8 1.0
Proportion
Bhattacharyya 2A 2007
Da Assuncao 6 2015
Joestl 15A +B 2016
Ko 16 2003
Mukka 24A 2016
Solomon 33B 2015
Young 36 2007
Zuurmond 37A 2010
Total (random effects)
91
Figure 27 shows the meta-analysis for the eight studies (n=155) that reported
mortality (overall) for the exposure of interest. Around 90% (7/8) of the studies provided
a time period for mortality, which was similar across studies, and up to around 5 years.
Overall, the prevalence of mortality was 21.6% (95%CI 9.0 to 38.0) and results from the
meta-analysis indicated a high degree of heterogeneity between the studies (I2 = 79.9%).
In studies where patients were excluded based on mortality, either directly, e.g. mortality
within three months post-operatively OR in-directly, e.g. where minimum follow-up
periods were applied to exclusion criteria, and the reason for not reaching this time period
was mortality, the patients were included in the meta-analysis. Note: raw data was
requested and used for Ko and colleagues, Mukka and colleagues and Solomon and
colleagues for this outcome (Ko, Lam et al. 2003, Solomon, Hussenbocus et al. 2015,
Mukka, Mellner et al. 2016).
Intra-operative mortality
One study reported intra-operative mortality for Revision with or without
wires/cerclage/cables, exposure 27A (n=2) (Niikura, Sakurai et al. 2014) with no events
observed.
Multi-organ failure
One study reported multi-organ failure for Revision with or without
wires/cerclage/cables, exposure 6 (Da Assunção, Pollard et al. 2015), with a prevalence of
2.7% (1/37). No explicit definition of multi-organ failure was reported.

92
Pressure ulcer (heel)
One study reported pressure ulcer for Revision with or without
wires/cerclage/cables, exposure 6 (Da Assunção, Pollard et al. 2015), with a prevalence of
2.7% (1/37). No explicit definition of the pressure ulcer, aside from location was
reported.
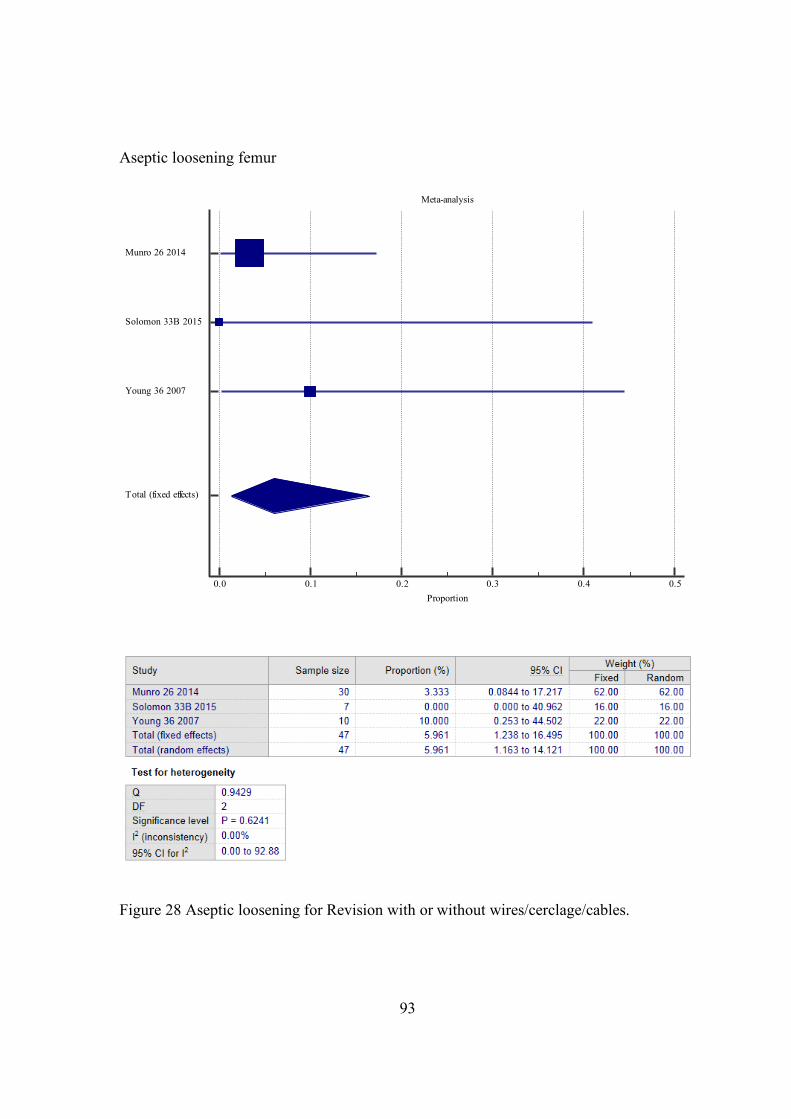
93
Aseptic loosening femur
Figure 28 Aseptic loosening for Revision with or without wires/cerclage/cables.
Meta-analysis
0.0 0.1 0.2 0.3 0.4 0.5Proportion
Munro 26 2014
Solomon 33B 2015
Young 36 2007
Total (fixed effects)
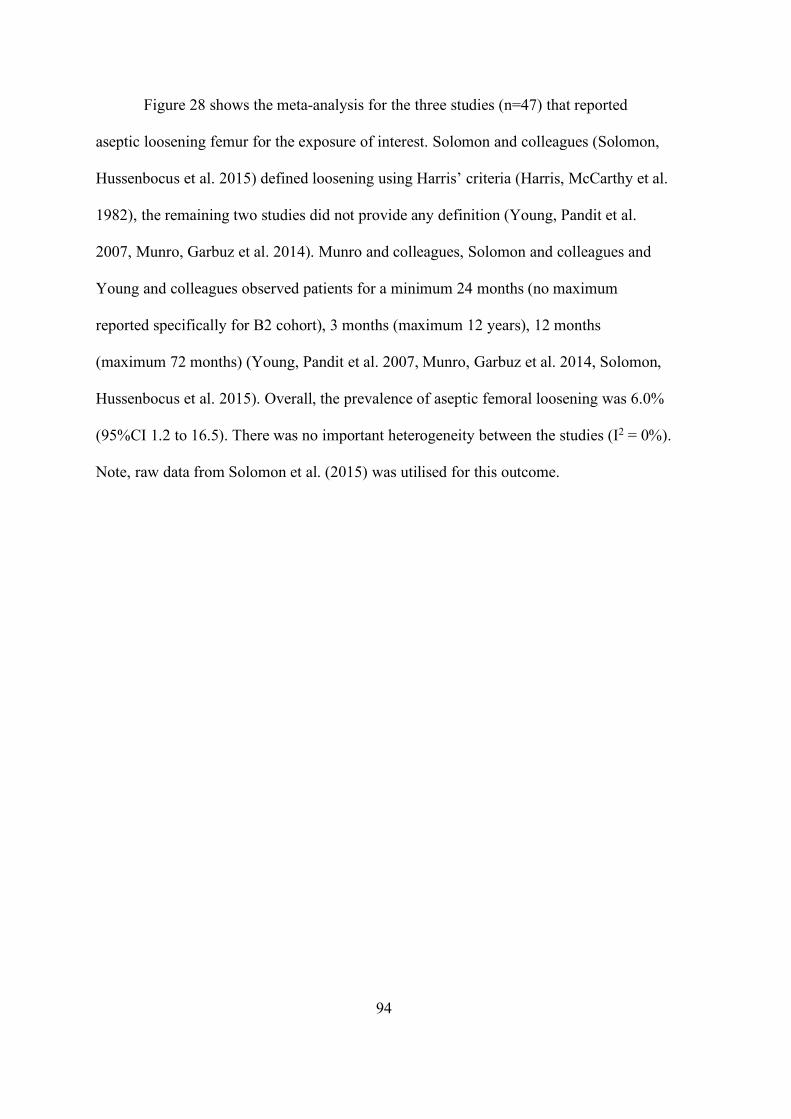
94
Figure 28 shows the meta-analysis for the three studies (n=47) that reported
aseptic loosening femur for the exposure of interest. Solomon and colleagues (Solomon,
Hussenbocus et al. 2015) defined loosening using Harris’ criteria (Harris, McCarthy et al.
1982), the remaining two studies did not provide any definition (Young, Pandit et al.
2007, Munro, Garbuz et al. 2014). Munro and colleagues, Solomon and colleagues and
Young and colleagues observed patients for a minimum 24 months (no maximum
reported specifically for B2 cohort), 3 months (maximum 12 years), 12 months
(maximum 72 months) (Young, Pandit et al. 2007, Munro, Garbuz et al. 2014, Solomon,
Hussenbocus et al. 2015). Overall, the prevalence of aseptic femoral loosening was 6.0%
(95%CI 1.2 to 16.5). There was no important heterogeneity between the studies (I2 = 0%).
Note, raw data from Solomon et al. (2015) was utilised for this outcome.
95
Peri-prosthetic femoral fracture post-operatively
Figure 29 Peri-prosthetic femoral fracture (post-operatively) for Revision with or without
wires/cerclage/cables.
Meta-analysis
0.0 0.1 0.2 0.3 0.4Proportion
Da Assuncao 6 2015
Grammatopoulos 10 2011
Inngul 14A 2015
Ko 16 2003
Sexton 31 2006
Total (random effects)
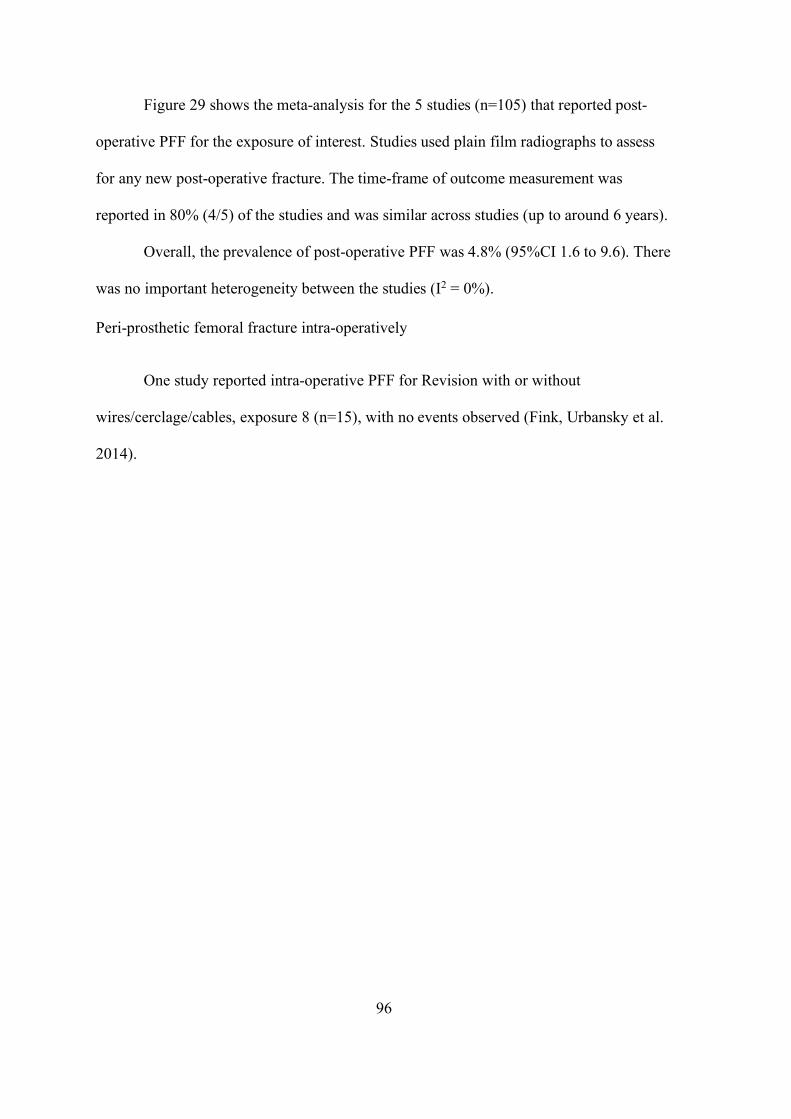
96
Figure 29 shows the meta-analysis for the 5 studies (n=105) that reported post-
operative PFF for the exposure of interest. Studies used plain film radiographs to assess
for any new post-operative fracture. The time-frame of outcome measurement was
reported in 80% (4/5) of the studies and was similar across studies (up to around 6 years).
Overall, the prevalence of post-operative PFF was 4.8% (95%CI 1.6 to 9.6). There
was no important heterogeneity between the studies (I2 = 0%).
Peri-prosthetic femoral fracture intra-operatively
One study reported intra-operative PFF for Revision with or without
wires/cerclage/cables, exposure 8 (n=15), with no events observed (Fink, Urbansky et al.
2014).
97
Deep surgical site infection (DSSI)
Figure 30 Deep surgical site infection (DSSI) for Revision with or without
wires/cerclage/cables.
Meta-analysis
0.0 0.2 0.4 0.6 0.8 1.0
Proportion
Da Assuncao 6 2015
Joestl 15A +B 2016
Korbel 18A 2013
Mukka 24A 2016
Mukundan 25C 2010
Niikura 27A 2014
Pogliacomi 29 2014
Solomon 33B 2015
Total (random effects)
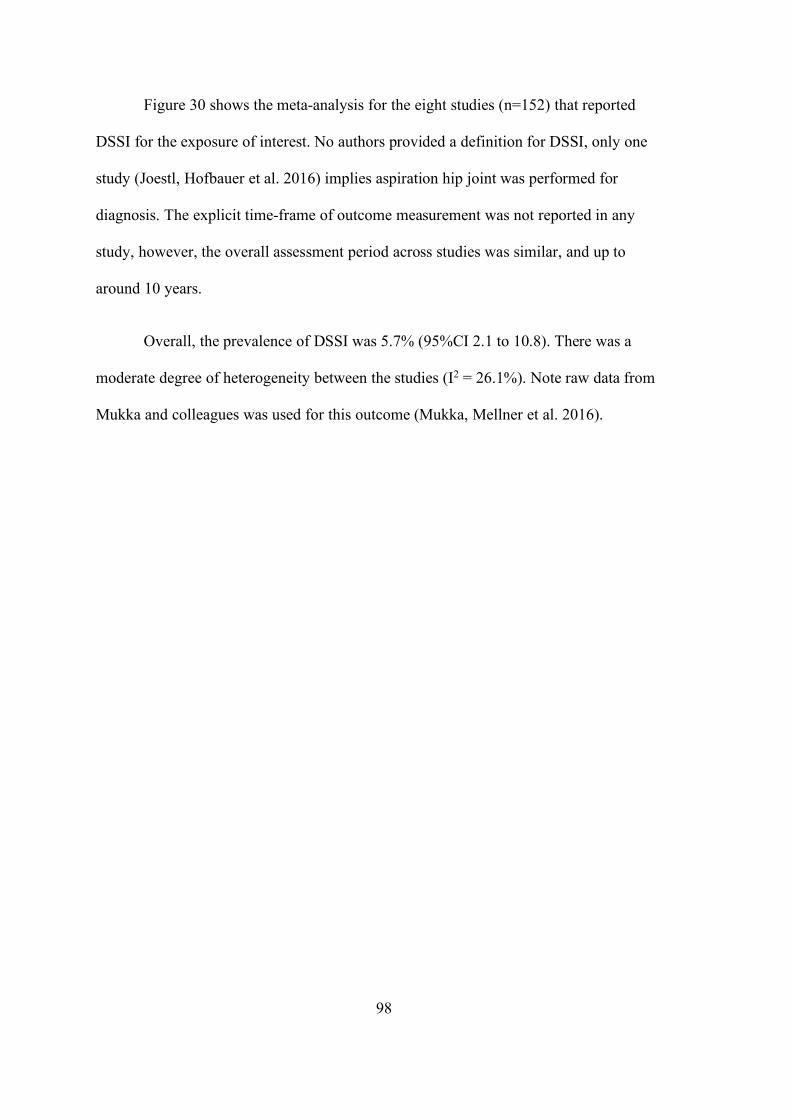
98
Figure 30 shows the meta-analysis for the eight studies (n=152) that reported
DSSI for the exposure of interest. No authors provided a definition for DSSI, only one
study (Joestl, Hofbauer et al. 2016) implies aspiration hip joint was performed for
diagnosis. The explicit time-frame of outcome measurement was not reported in any
study, however, the overall assessment period across studies was similar, and up to
around 10 years.
Overall, the prevalence of DSSI was 5.7% (95%CI 2.1 to 10.8). There was a
moderate degree of heterogeneity between the studies (I2 = 26.1%). Note raw data from
Mukka and colleagues was used for this outcome (Mukka, Mellner et al. 2016).
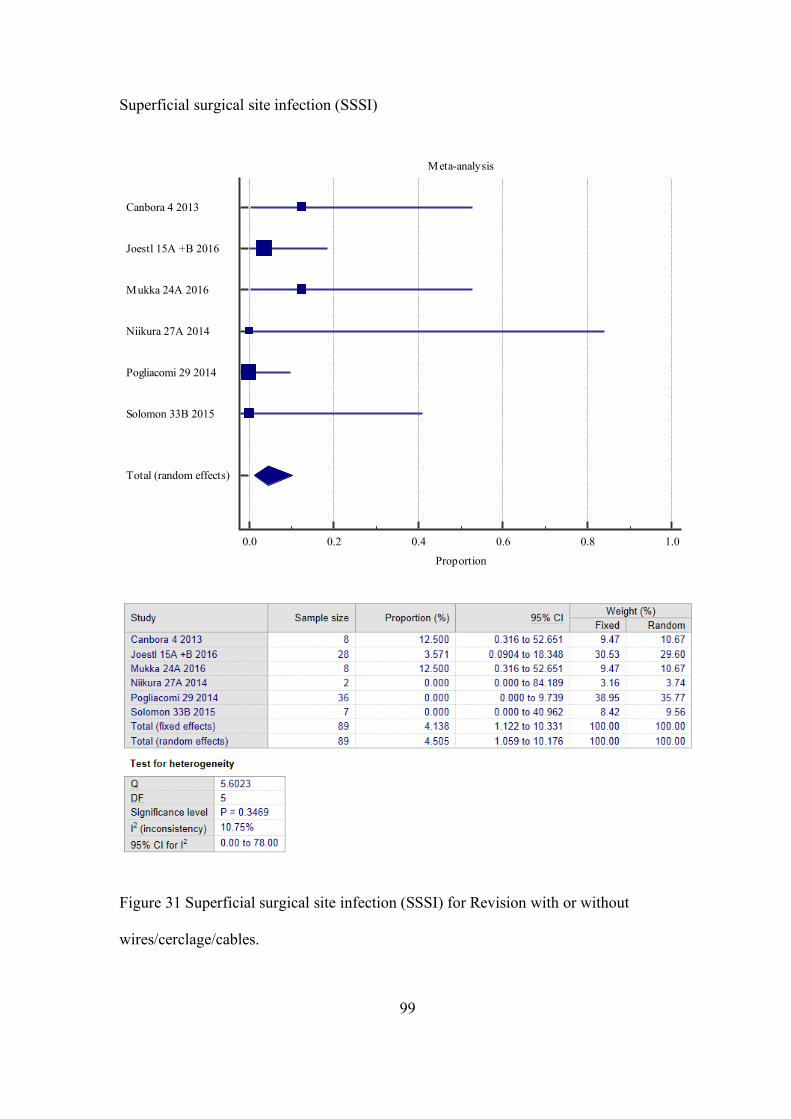
99
Superficial surgical site infection (SSSI)
Figure 31 Superficial surgical site infection (SSSI) for Revision with or without
wires/cerclage/cables.
Meta-analysis
0.0 0.2 0.4 0.6 0.8 1.0
Proportion
Canbora 4 2013
Joestl 15A +B 2016
Mukka 24A 2016
Niikura 27A 2014
Pogliacomi 29 2014
Solomon 33B 2015
Total (random effects)
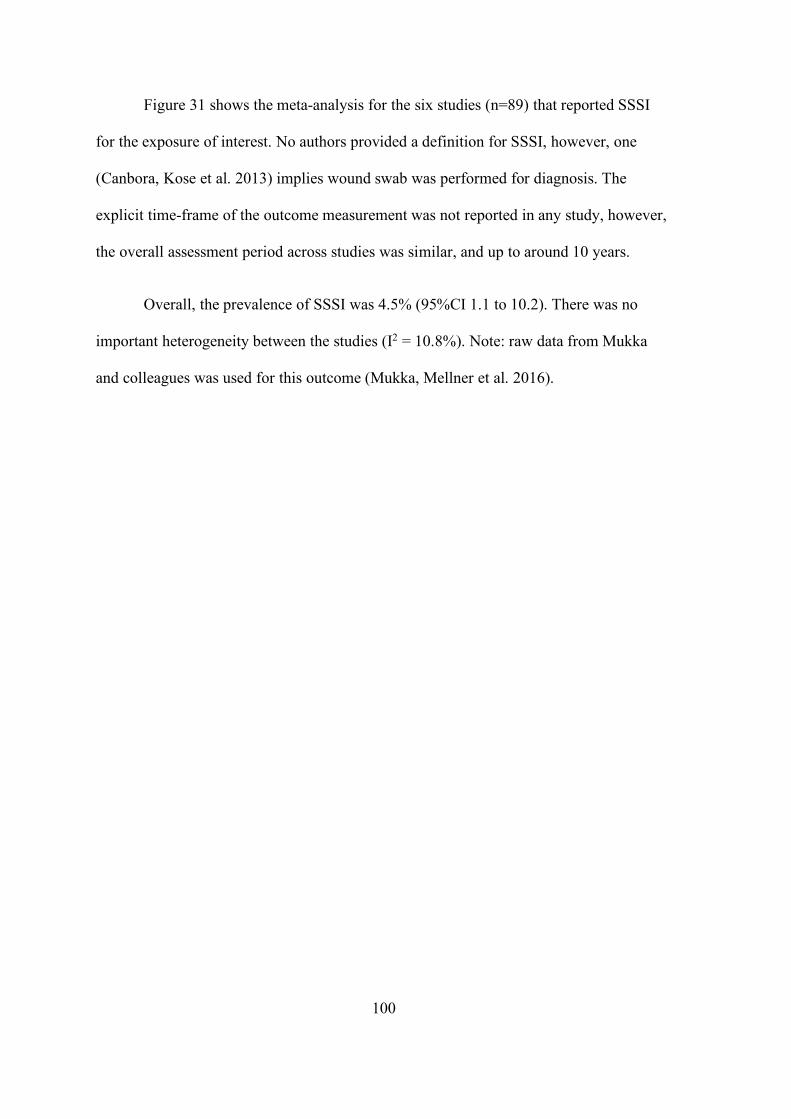
100
Figure 31 shows the meta-analysis for the six studies (n=89) that reported SSSI
for the exposure of interest. No authors provided a definition for SSSI, however, one
(Canbora, Kose et al. 2013) implies wound swab was performed for diagnosis. The
explicit time-frame of the outcome measurement was not reported in any study, however,
the overall assessment period across studies was similar, and up to around 10 years.
Overall, the prevalence of SSSI was 4.5% (95%CI 1.1 to 10.2). There was no
important heterogeneity between the studies (I2 = 10.8%). Note: raw data from Mukka
and colleagues was used for this outcome (Mukka, Mellner et al. 2016).
101
Dislocation
Figure 32 Dislocation (any) for Revision with or without wires/cerclage/cables.
Meta-analysis
0.0 0.2 0.4 0.6 0.8 1.0
Proportion
Canbora 4 2013
Da Assuncao 6 2015
Garcia-Rey 9 2013
Grammatopoulos 10 2011
Joestl 15A +B 2016
Ko 16 2003
Korbel 18A 2013
Mukundan 25A +C 2010
Pavlou 28A 2011
Solomon 33B 2015
Young 36 2007
Total (random effects)
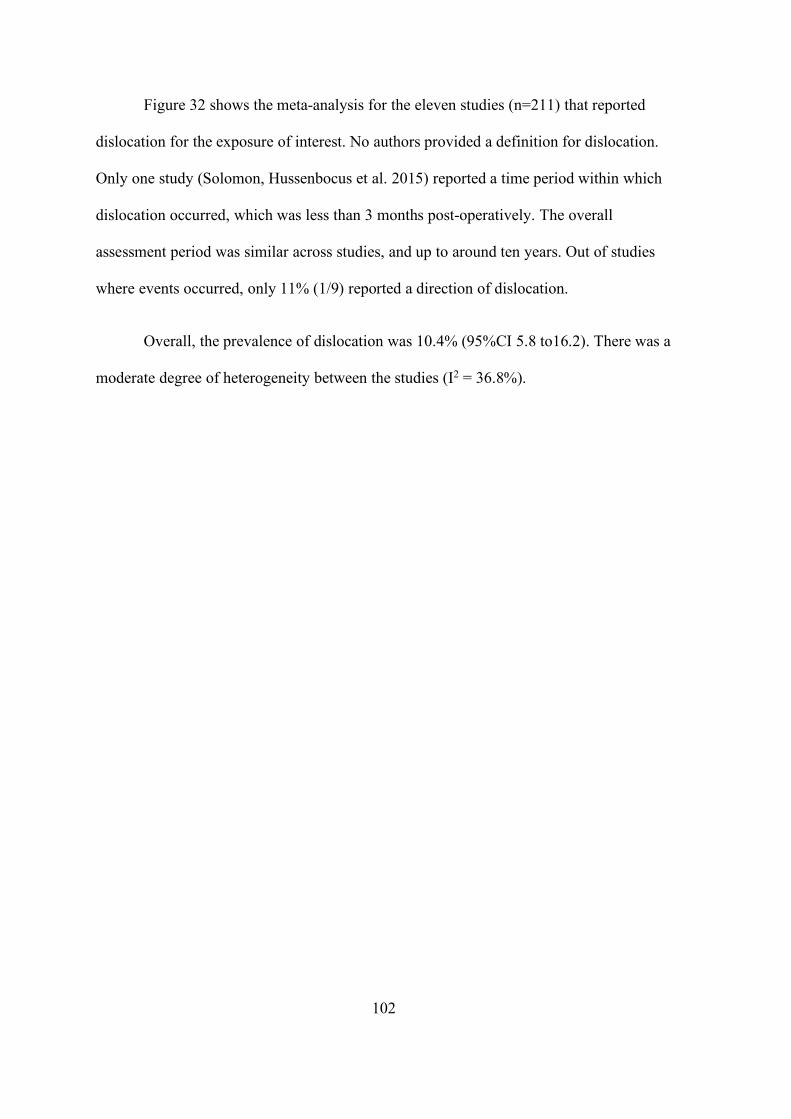
102
Figure 32 shows the meta-analysis for the eleven studies (n=211) that reported
dislocation for the exposure of interest. No authors provided a definition for dislocation.
Only one study (Solomon, Hussenbocus et al. 2015) reported a time period within which
dislocation occurred, which was less than 3 months post-operatively. The overall
assessment period was similar across studies, and up to around ten years. Out of studies
where events occurred, only 11% (1/9) reported a direction of dislocation.
Overall, the prevalence of dislocation was 10.4% (95%CI 5.8 to16.2). There was a
moderate degree of heterogeneity between the studies (I2 = 36.8%).
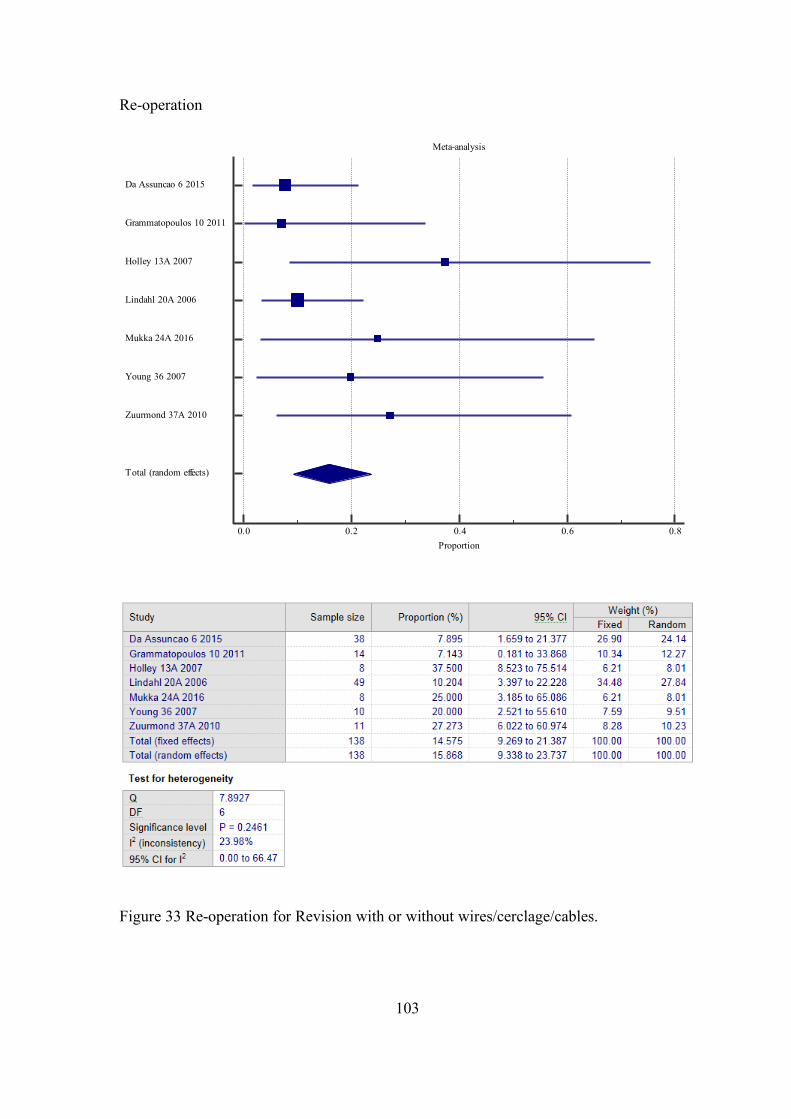
103
Re-operation
Figure 33 Re-operation for Revision with or without wires/cerclage/cables.
Meta-analysis
0.0 0.2 0.4 0.6 0.8Proportion
Da Assuncao 6 2015
Grammatopoulos 10 2011
Holley 13A 2007
Lindahl 20A 2006
Mukka 24A 2016
Young 36 2007
Zuurmond 37A 2010
Total (random effects)

104
Figure 33 shows the meta-analysis for the seven studies (n=138) that reported re-
operation for the exposure of interest. No authors provided an explicit definition or a
time-frame for re-operation. The overall assessment period was similar across studies,
and up to around twelve years.
Overall, the prevalence of re-operation was 15.9% (95%CI 9.3 to 23.7). There was
a low degree of heterogeneity between the studies (I2 = 24.0%).
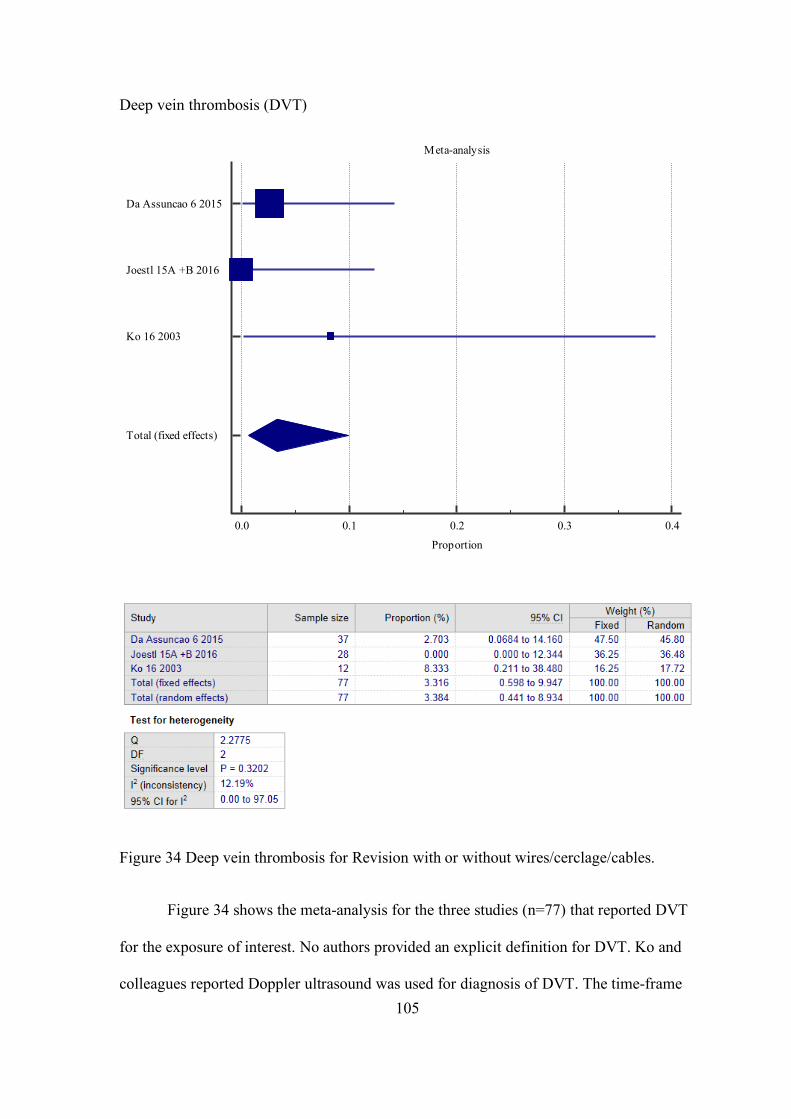
105
Deep vein thrombosis (DVT)
Figure 34 Deep vein thrombosis for Revision with or without wires/cerclage/cables.
Figure 34 shows the meta-analysis for the three studies (n=77) that reported DVT
for the exposure of interest. No authors provided an explicit definition for DVT. Ko and
colleagues reported Doppler ultrasound was used for diagnosis of DVT. The time-frame
Meta-analysis
0.0 0.1 0.2 0.3 0.4
Proportion
Da Assuncao 6 2015
Joestl 15A +B 2016
Ko 16 2003
Total (fixed effects)
106
of detection was reported by Ko and colleagues only, 3 weeks post-operatively (Ko, Lam
et al. 2003). The overall assessment period was similar across studies, and up to around
nine years.
Overall, the prevalence of DVT was 3.3% (95%CI 0.6 to 10.0). There was a low
degree of heterogeneity between the studies (I2 = 12.2%).
Pulmonary embolism (PE)
One study reported PE for Revision with or without wires/cerclage/cables,
exposure 15A+B (n=28), with no events observed. No explicit definition of PE was
reported (Joestl, Hofbauer et al. 2016).
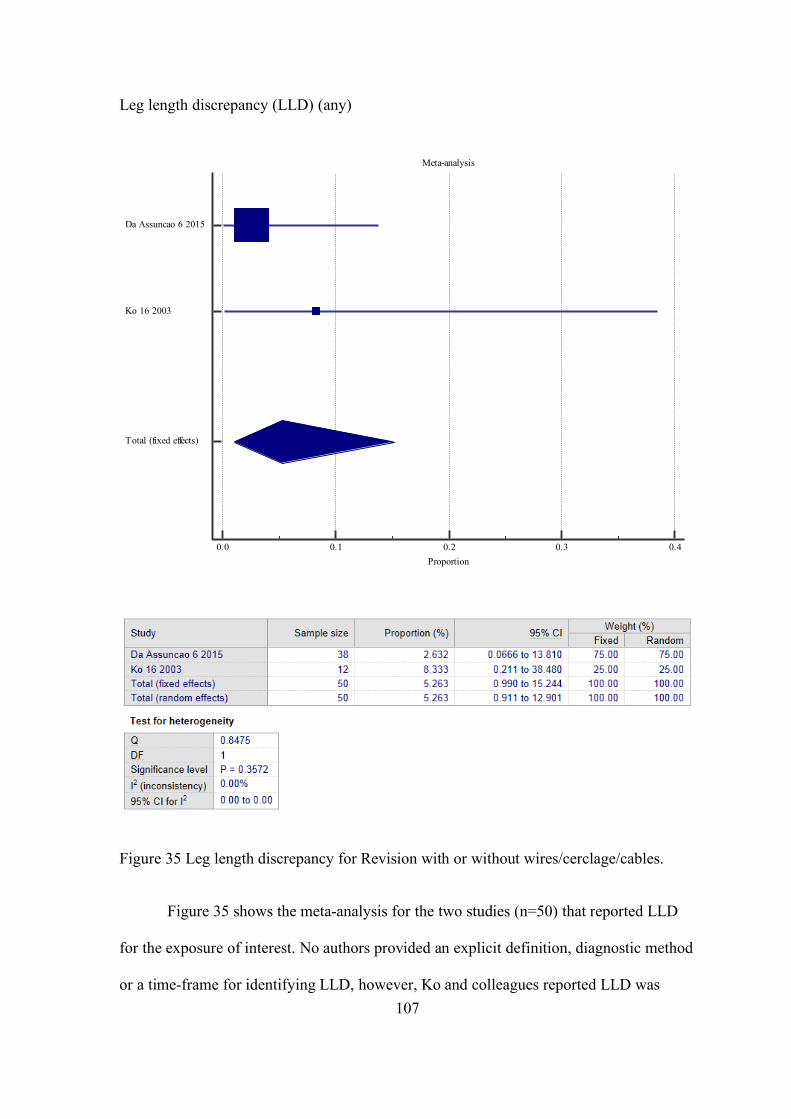
107
Leg length discrepancy (LLD) (any)
Figure 35 Leg length discrepancy for Revision with or without wires/cerclage/cables.
Figure 35 shows the meta-analysis for the two studies (n=50) that reported LLD
for the exposure of interest. No authors provided an explicit definition, diagnostic method
or a time-frame for identifying LLD, however, Ko and colleagues reported LLD was
Meta-analysis
0.0 0.1 0.2 0.3 0.4Proportion
Da Assuncao 6 2015
Ko 16 2003
Total (fixed effects)
108
significant if there was a 2cm or greater discrepancy (Ko, Lam et al. 2003). The overall
assessment period was similar across studies, and up to around five years.
Overall, the prevalence of LLD was 5.3% (95%CI 1.0 to 15.2). There was no
important heterogeneity between the studies (I2 = 0%).
Thigh pain
Two studies reported thigh pain for Revision with or without
wires/cerclage/cables, exposure 6 (Da Assunção, Pollard et al. 2015) and 16 (Ko, Lam
et al. 2003) with event rates of 1/38 (2.6%) and 0/12 (0%), respectively. Authors did not
provide a clear definition for this outcome.
Neurovascular injury
Two studies reported neurovascular injury for Revision with or without
wires/cerclage/cables, exposure 15A+B (Joestl, Hofbauer et al. 2016) and 18A (Korbel,
Sponer et al. 2013), with event rates of 0/28 (0%) and 2/18 (11%) (both of which were
femoral nerve palsies which resolved by 3 months post-operatively), respectively.
Revision femoral component
Two studies reported a Revision femoral component for Revision with or without
wires/cerclage/cables, exposure 16 (n=12) (Ko, Lam et al. 2003) and 36 (Young, Pandit
et al. 2007) (n=10), with no events observed in either study.
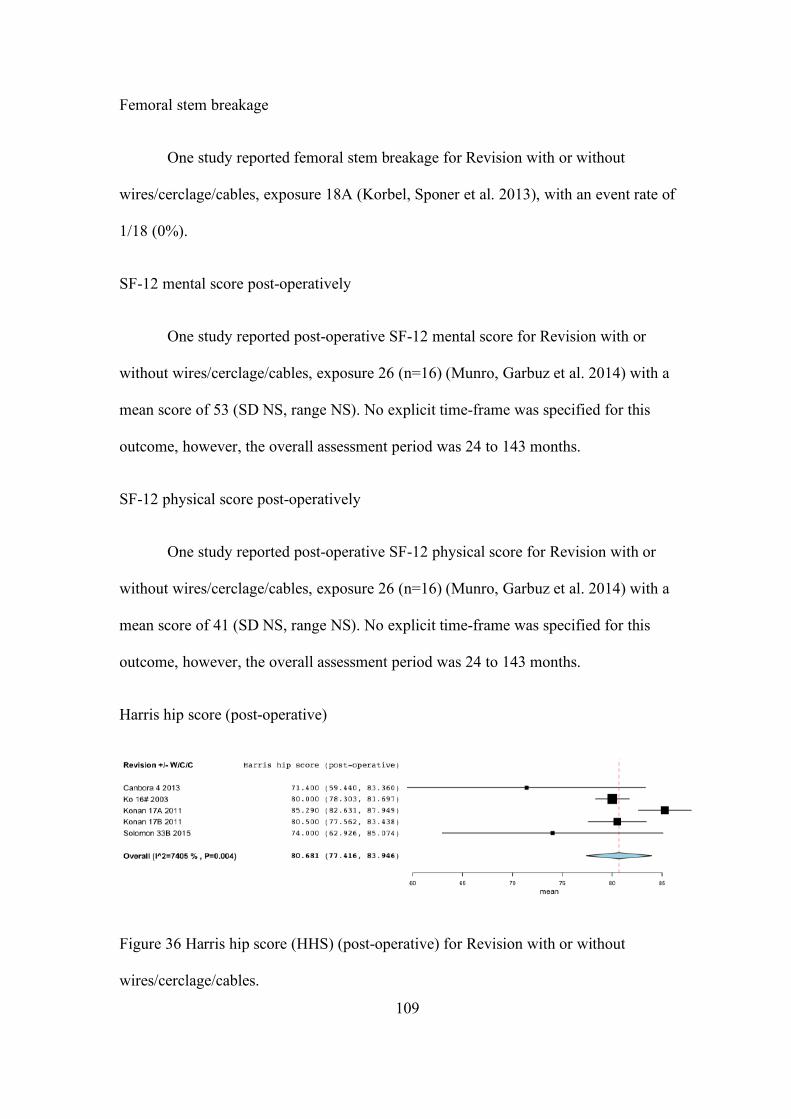
109
Femoral stem breakage
One study reported femoral stem breakage for Revision with or without
wires/cerclage/cables, exposure 18A (Korbel, Sponer et al. 2013), with an event rate of
1/18 (0%).
SF-12 mental score post-operatively
One study reported post-operative SF-12 mental score for Revision with or
without wires/cerclage/cables, exposure 26 (n=16) (Munro, Garbuz et al. 2014) with a
mean score of 53 (SD NS, range NS). No explicit time-frame was specified for this
outcome, however, the overall assessment period was 24 to 143 months.
SF-12 physical score post-operatively
One study reported post-operative SF-12 physical score for Revision with or
without wires/cerclage/cables, exposure 26 (n=16) (Munro, Garbuz et al. 2014) with a
mean score of 41 (SD NS, range NS). No explicit time-frame was specified for this
outcome, however, the overall assessment period was 24 to 143 months.
Harris hip score (post-operative)
Figure 36 Harris hip score (HHS) (post-operative) for Revision with or without
wires/cerclage/cables.
110
Figure 36 shows the meta-analysis for the five studies (n=41) that reported post-
operative HHS for the exposure of interest. The time point post-operatively at which HHS
was calculated was not explicitly reported in any study, however, Canbora and colleagues
state this was conducted at final follow-up, mean 5 months (15-90, no SD reported)
(Canbora, Kose et al. 2013). The overall assessment period across studies ranged from
15 to 137 months.
Overall, the mean HHS was 80.7 (95%CI 77.4 to 83.9). There was a moderate degree of
heterogeneity between the studies (I2 = 74.1%).
Studies not included in the meta-analysis: Young and colleagues reported HHS post-
operatively and found a mean of 69.1, however, unfortunately, did not include the
standard deviation or range, hence the study was excluded from this meta-analysis
(Young, Pandit et al. 2007).
Harris hip pain score (post-operative)
One study reported post-operative Harris hip pain score for Revision with or
without wires/cerclage/cables, exposure 33B* (n=7), with a mean score of 31.1 (SD
15.18) (Solomon, Hussenbocus et al. 2015).
Barthel ADLs index (post-operative)
One study reported post-operative Barthel ADLs index for Revision with or
without wires/cerclage/cables, exposure 4 (n=8) (Canbora, Kose et al. 2013), with a mean
score of 73.75 (SD 25.31) at mean follow-up of 39 months (Range 15-19, No SD
reported).
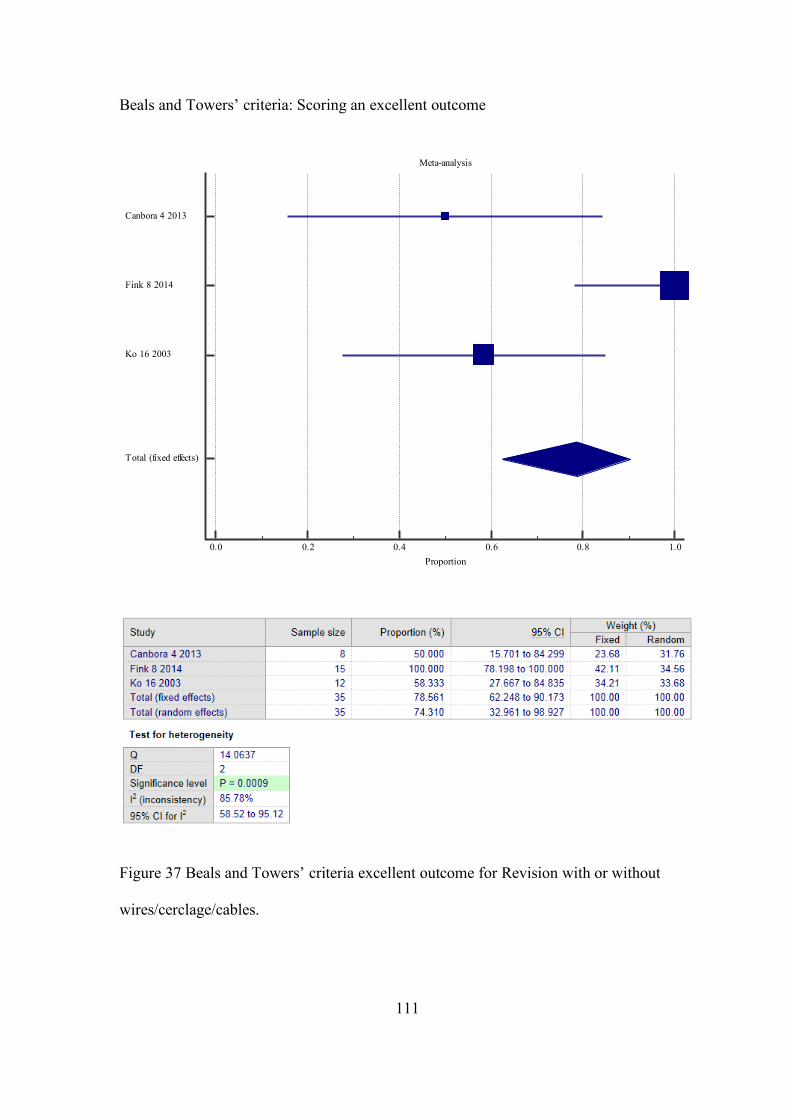
111
Beals and Towers’ criteria: Scoring an excellent outcome
Figure 37 Beals and Towers’ criteria excellent outcome for Revision with or without
wires/cerclage/cables.
Meta-analysis
0.0 0.2 0.4 0.6 0.8 1.0Proportion
Canbora 4 2013
Fink 8 2014
Ko 16 2003
Total (fixed effects)
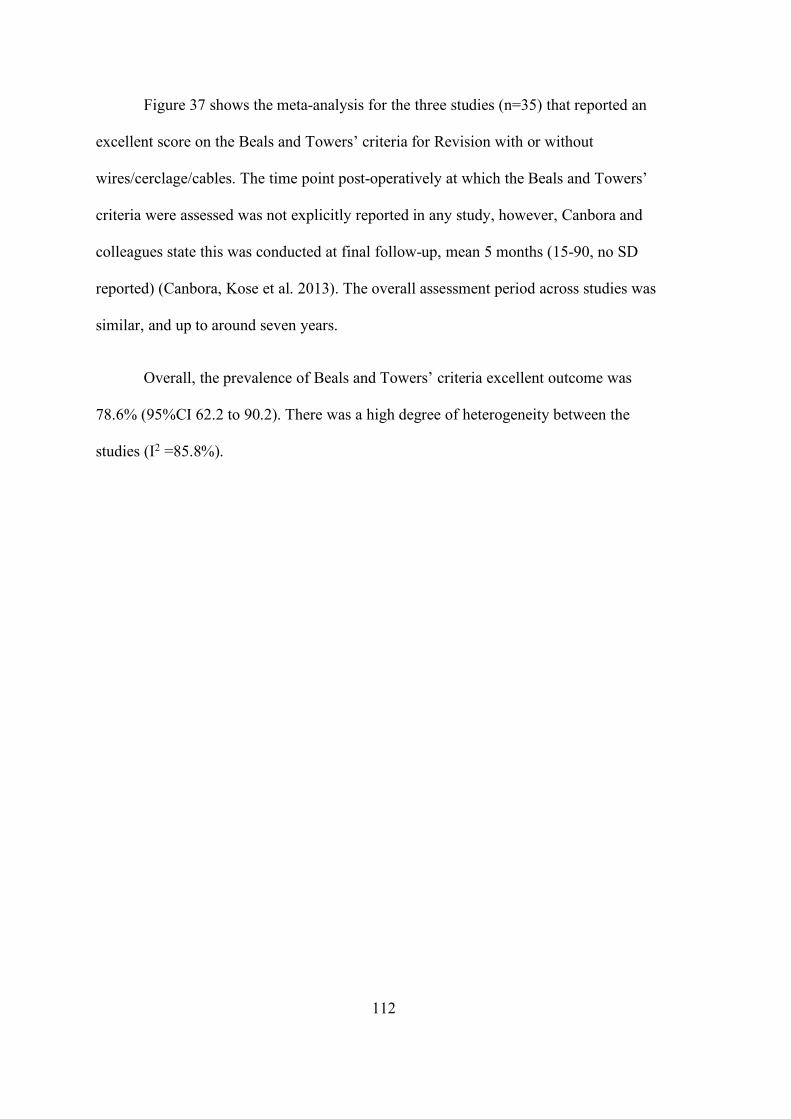
112
Figure 37 shows the meta-analysis for the three studies (n=35) that reported an
excellent score on the Beals and Towers’ criteria for Revision with or without
wires/cerclage/cables. The time point post-operatively at which the Beals and Towers’
criteria were assessed was not explicitly reported in any study, however, Canbora and
colleagues state this was conducted at final follow-up, mean 5 months (15-90, no SD
reported) (Canbora, Kose et al. 2013). The overall assessment period across studies was
similar, and up to around seven years.
Overall, the prevalence of Beals and Towers’ criteria excellent outcome was
78.6% (95%CI 62.2 to 90.2). There was a high degree of heterogeneity between the
studies (I2 =85.8%).
113
Beals and Towers’ criteria good outcome
Figure 38 Beals and Towers’ criteria good outcome for Revision with or without
wires/cerclage/cables.
Meta-analysis
0.0 0.1 0.2 0.3 0.4 0.5 0.6 0.7
Proportion
Canbora 4 2013
Fink 8 2014
Ko 16 2003
Total (fixed effects)
114
Figure 38 shows the meta-analysis for the three studies (n=35) that reported Beals
and Towers’ criteria for the exposure of interest. The time point post-operatively at which
the Beals and Towers’ criteria were assessed was not explicitly reported in any study,
however, Canbora and colleagues state this was conducted at final follow-up, mean 5
months (15-90, no SD reported) (Canbora, Kose et al. 2013). The overall assessment
period across studies was similar, and up to around seven years.
Overall, the prevalence of Beals and Towers’ criteria good outcome was 13.1%
(95%CI 4.4 to 28.0). There was a moderate degree of heterogeneity between the studies
(I2 = 69.7%).
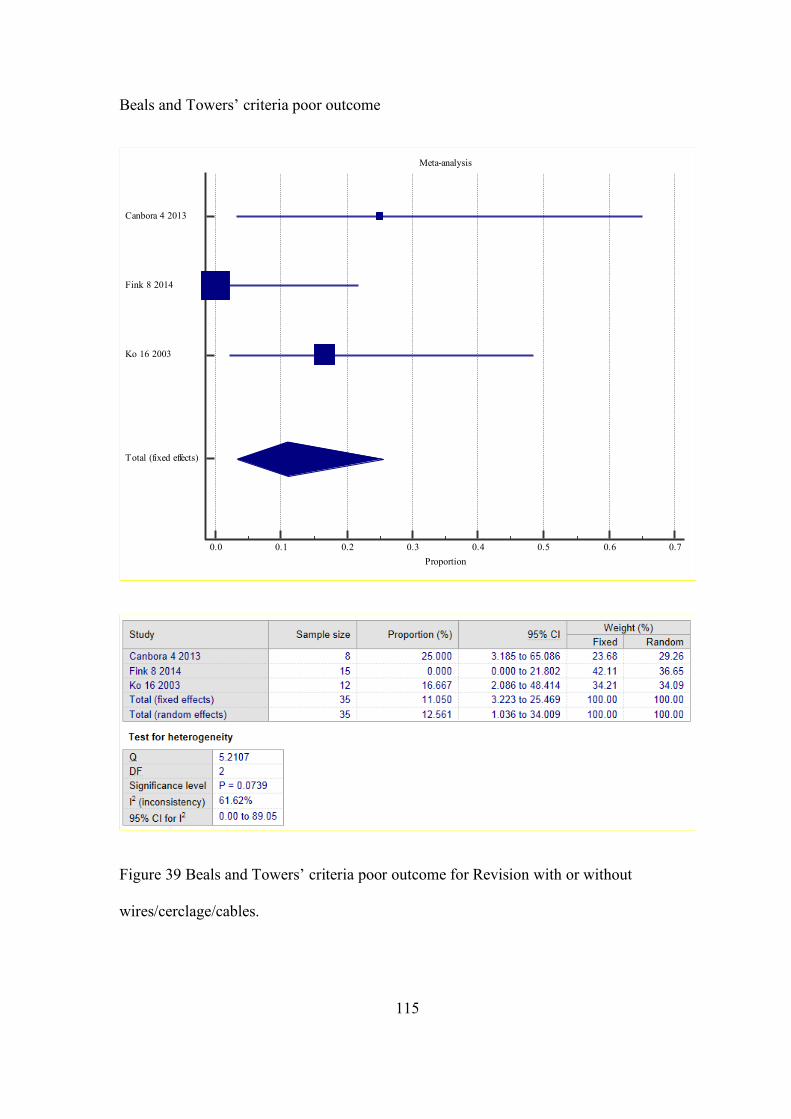
115
Beals and Towers’ criteria poor outcome
Figure 39 Beals and Towers’ criteria poor outcome for Revision with or without
wires/cerclage/cables.
Meta-analysis
0.0 0.1 0.2 0.3 0.4 0.5 0.6 0.7Proportion
Canbora 4 2013
Fink 8 2014
Ko 16 2003
Total (fixed effects)
116
Figure 39 shows the meta-analysis for the three studies (n=35) that reported Beals
and Towers’ criteria for the exposure of interest. The time point post-operatively at which
the Beals and Towers’ criteria were assessed was not explicitly reported in any study,
however, Canbora and colleagues state this was conducted at final follow-up, mean 5
months (15-90, no SD reported) (Canbora, Kose et al. 2013). The overall assessment
period across studies was similar, and up to around seven years.
Overall, the prevalence of Beals and Towers’ criteria poor outcome was 11.1%
(95%CI 3.2 to 25.5). There was a moderate degree of heterogeneity between the studies
(I2 = 62.0%).
Parker mobility score (post-operative)
Three studies reported post-operative Parker mobility score for Revision with or
without wires/cerclage/cables, exposure 15A (n=14), 15B (n=14) (Joestl, Hofbauer et al.
2016) and 27A (n=2) (Niikura, Lee et al. 2014) with mean scores of 6.5 (SD 2, Range
NS), 6.4 (SD 2, Range NS) and 6 (SD 4.2, Range NS), respectively. Note, for reference,
mean pre-operative Parker mobility score for exposure 15A (n=14), 15B (n=14) (Joestl,
Hofbauer et al. 2016) and 27A (n=2) were 6.8 (SD 1.7, Range NS), 6.99 (SD 1, Range
NS) and 6 (SD 4.2, Range NS), respectively.
Modified Charnley-D’Aubigne score excellent, good and poor outcome
One study reported post-operative Modified Charnley-D’Aubigne score excellent
outcome for Revision with or without wires/cerclage/cables, exposure 25A+C, with a
prevalence of 59% (20/34) (Mukundan, Rayan et al. 2010). The time point post-
operatively at which the Modified Charnley-D’Aubigne score was assessed was not
117
explicitly reported. One study reported post-operative Modified Charnley-D’Aubigne
score good outcome for Revision with or without wires/cerclage/cables, exposure 25A+C,
with a prevalence of 24% (8/34) (Mukka, Mellner et al. 2016). The time point post-
operatively at which the Modified Charnley-D’Aubigne score was assessed was not
explicitly reported. One study reported post-operative Modified Charnley-D’Aubigne
score poor outcome for Revision with or without wires/cerclage/cables, exposure 25A+C,
with prevalence of 18% (6/34) (Mukundan, Rayan et al. 2010). The time point post-
operatively at which the Modified Charnley-D’Aubigne score was assessed was not
explicitly reported (Mukundan, Rayan et al. 2010).
Oxford hip score (post-operative)
Four studies reported on Oxford hip score assessed post-operatively (Young,
Pandit et al. 2007, Zuurmond, van Wijhe et al. 2010, Munro, Garbuz et al. 2014, Da
Assunção, Pollard et al. 2015). However, the scores were inversely proportional and
measured in different scales, hence meta-analysis was not possible. Da Assunção and
colleagues found a mean Oxford hip score of 35.0 (95%CI 31.4; 38.4), where the
assessment scale was from 0 to 48, with higher scores indicating better function
(Da Assunção, Pollard et al. 2015). On the other hand, Zuurmond et al., found a mean of
28.0 (95%CI 23.0; 33.0), with higher scores indicating impaired function (Zuurmond, van
Wijhe et al. 2010). The scale range was not reported.
Munro and colleagues (Munro, Garbuz et al. 2014) and Young and colleagues
(Young, Pandit et al. 2007) both reported OHS post-operatively (with mean scores of 74
(n=16) and 32 (n=7), respectively), however, unfortunately did not include the standard
deviation or range, hence meta-analysis was not possible.
118
WOMAC global score (post-operative)
One study reported post-operative WOMAC global score for Revision with or
without wires/cerclage/cables, exposure 26 (n=16) (Munro, Garbuz et al. 2014), with a
mean score of 76 (SD NS, range NS). The time point post-operatively at which the
WOMAC global score was assessed was not reported by study authors.
WOMAC pain score (post-operative)
One study reported post-operative WOMAC pain score for Revision with or
without wires/cerclage/cables, exposure 26 (n=16) (Munro, Garbuz et al. 2014), with a
mean score of 80 (SD NS, range NS). The time point post-operatively at which the
WOMAC pain score was assessed was not reported by study authors.
WOMAC function score (post-operative)
One study reported post-operative WOMAC function score for Revision with or
without wires/cerclage/cables, exposure 26 (n=16) (Munro, Garbuz et al. 2014), with a
mean score of 75 (SD NS, range NS). The time point post-operatively at which the
WOMAC function score was assessed was not reported by study authors.
WOMAC stiffness score (post-operative)
One study reported post-operative WOMAC stiffness score for Revision with or
without wires/cerclage/cables, exposure 26 (n=16) (Munro, Garbuz et al. 2014), with a
mean score of 70 (SD NS, range NS). The time point post-operatively at which the
WOMAC stiffness score was assessed was not reported by study authors.
UCLA activity score (post-operative)
119
One study reported post-operative UCLA activity score for Revision with or
without wires/cerclage/cables, exposure 26 (n=16) (Munro, Garbuz et al. 2014), with a
mean score of 4 (SD NS, range NS). The time point post-operatively at which the UCLA
activity score was assessed was not reported by study authors.
Satisfaction score overall (self-reported, scale 0 (completely unsatisfied) –100
(completely satisfied).
One study reported post-operative Satisfaction score overall for Revision with or
without wires/cerclage/cables, exposure 26 (n=16) (Munro, Garbuz et al. 2014), with a
mean score of 96 (SD NS, range NS). The time point post-operatively at which the
Satisfaction score (overall) was assessed was not reported by study authors.
Satisfaction score pain (self-reported, scale 0-100)
One study reported post-operative Satisfaction score pain for Revision with or
without wires/cerclage/cables, exposure 26 (n=16) (Munro, Garbuz et al. 2014), with a
mean score of 98 (SD NS, range NS). The time point post-operatively at which the
Satisfaction score for pain (self-reported) was assessed was not reported by study authors.
Satisfaction score function (self-reported, scale 0-100)
One study reported post-operative Satisfaction score function for Revision with or
without wires/cerclage/cables, exposure 26 (n=16) (Munro, Garbuz et al. 2014), with a
mean score of 90 (SD NS, range NS). The time point post-operatively at which the
Satisfaction score for function (self-reported) was assessed was not reported by study
authors.
120
Satisfaction score recreation (self-reported, scale 0-100)
One study reported post-operative Satisfaction score recreation for Revision with
or without wires/cerclage/cables, exposure 26 (n=16) (Munro, Garbuz et al. 2014), with a
mean score of 86 (SD NS, range NS). The time point post-operatively at which the
Satisfaction score for recreation (self-reported) was assessed was not reported by study
authors.
Ambulatory status (post-operatively)
One study reported post-operative ambulatory status for Revision with or without
wires/cerclage/cables, exposure 27A (Niikura, Lee et al. 2014), with 1/2 (50%) mobilising
with walker and 1/2 (50%) mobilising without aids. This assessment was made at final
follow-up which occurred at mean 18.4 months (SD14.2).
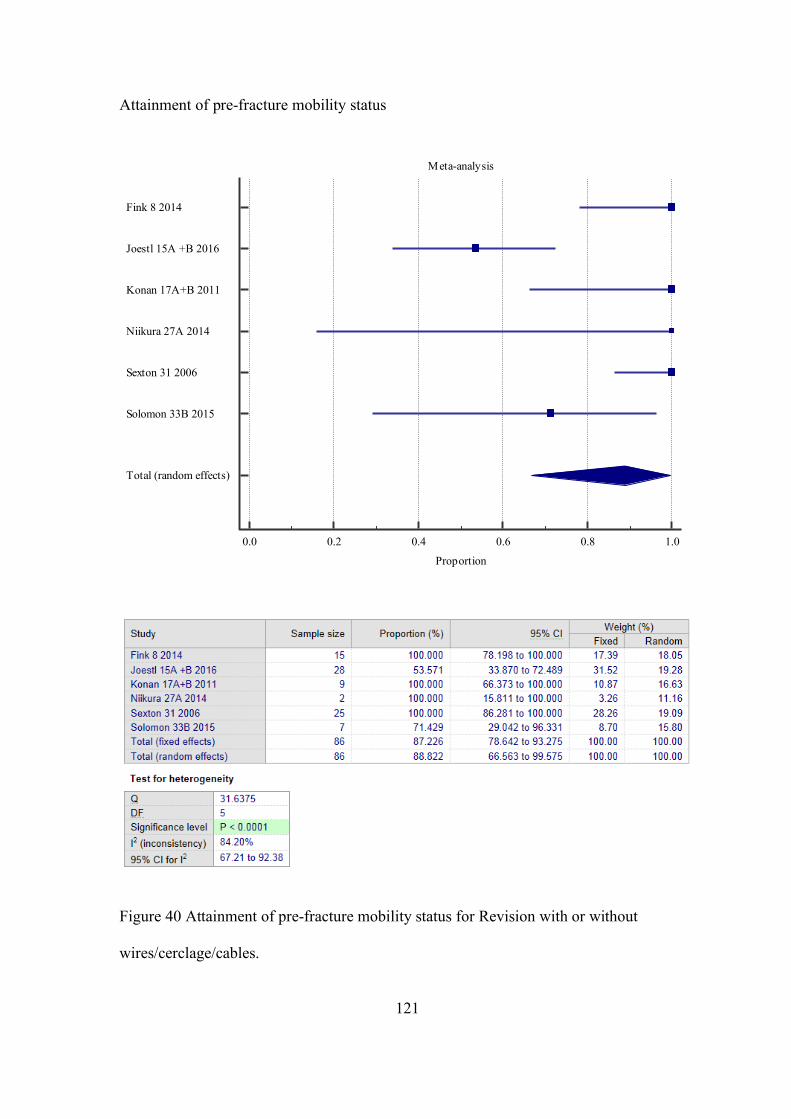
121
Attainment of pre-fracture mobility status
Figure 40 Attainment of pre-fracture mobility status for Revision with or without
wires/cerclage/cables.
Meta-analysis
0.0 0.2 0.4 0.6 0.8 1.0
Proportion
Fink 8 2014
Joestl 15A +B 2016
Konan 17A+B 2011
Niikura 27A 2014
Sexton 31 2006
Solomon 33B 2015
Total (random effects)
122
Figure 40 shows the meta-analysis for the six studies (n=86) that reported
attainment of pre-fracture mobility status for the exposure of interest. The time point post-
operatively at which mobility status was assessed was only reported by Sexton and
colleagues, which was 18 months post-operatively (Sexton, Stossel et al. 2006). There
was no explicit reporting of how this assessment was made by authors (e.g. clinical or
self-reported). The overall assessment period across studies was similar, and up to around
nine years.
Overall, the prevalence of attainment pre-fracture mobility status was 88.8%
(95%CI 66.6 to 99.6). There was a high degree of heterogeneity between the studies
(I2 = 84.2%).
Attainment of pre-fracture social status
One study reported attainment of pre-fracture social status for Revision with or
without wires/cerclage/cables, exposure 27A (Niikura, Lee et al. 2014), with an event rate
of 2/2 (100%) both patients living independently at home. The time point post-operatively
at which the social status assessment was made was not reported by study authors.
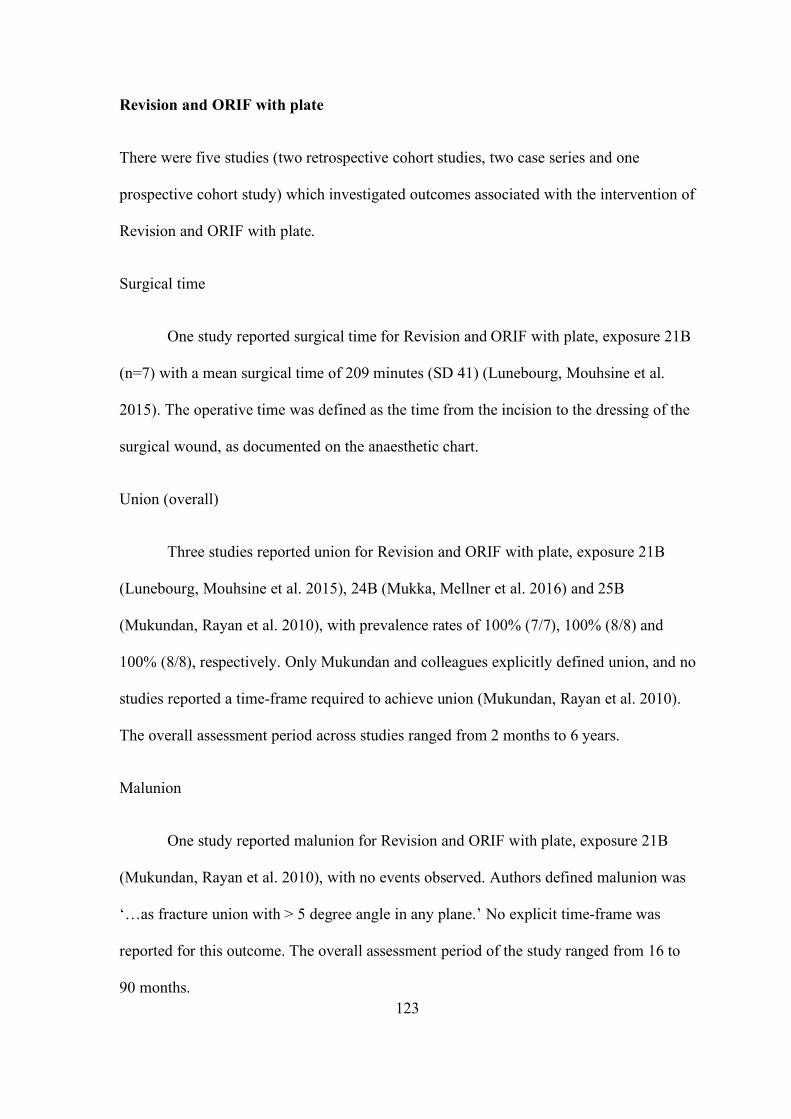
123
Revision and ORIF with plate
There were five studies (two retrospective cohort studies, two case series and one
prospective cohort study) which investigated outcomes associated with the intervention of
Revision and ORIF with plate.
Surgical time
One study reported surgical time for Revision and ORIF with plate, exposure 21B
(n=7) with a mean surgical time of 209 minutes (SD 41) (Lunebourg, Mouhsine et al.
2015). The operative time was defined as the time from the incision to the dressing of the
surgical wound, as documented on the anaesthetic chart.
Union (overall)
Three studies reported union for Revision and ORIF with plate, exposure 21B
(Lunebourg, Mouhsine et al. 2015), 24B (Mukka, Mellner et al. 2016) and 25B
(Mukundan, Rayan et al. 2010), with prevalence rates of 100% (7/7), 100% (8/8) and
100% (8/8), respectively. Only Mukundan and colleagues explicitly defined union, and no
studies reported a time-frame required to achieve union (Mukundan, Rayan et al. 2010).
The overall assessment period across studies ranged from 2 months to 6 years.
Malunion
One study reported malunion for Revision and ORIF with plate, exposure 21B
(Mukundan, Rayan et al. 2010), with no events observed. Authors defined malunion was
‘…as fracture union with > 5 degree angle in any plane.’ No explicit time-frame was
reported for this outcome. The overall assessment period of the study ranged from 16 to
90 months.
124
Length of stay
Figure 41 Length of stay for Revision and ORIF with plate.
Figure 41 shows the meta-analysis for the three studies (n=59) that reported length
of stay for the exposure of interest. Joestl and colleagues specified ‘hospital’ length of
stay, however, Da Assunção and colleagues did not provide an explicit definition of
length of stay (e.g. primary hospital where surgery was performed, or combined with
step-down or transitional care facility) (Da Assunção, Pollard et al. 2015, Joestl, Hofbauer
et al. 2016).
Overall, the mean length of stay was 24 days (95%CI 21 to 28). There was no
important heterogeneity between the studies (I2 = 0%).
Mortality (at one year)
One study reported mortality for Revision and ORIF with plate, exposure 24B
(Mukka, Mellner et al. 2016), with prevalence at one year of 25% (2/8).
Aseptic loosening femur
One study reported aseptic loosening femur for Revision and ORIF with plate,
exposure 21B (n=7) (Lunebourg, Mouhsine et al. 2015), with no events observed.
Although no explicit definition was provided by the authors, they do state radiographs
125
were performed at 6 weeks, 3 months, 1 year then as clinically indicated to assess for
aseptic loosening.
Deep surgical site infection (DSSI)
One study reported DSSI for Revision and ORIF with plate, exposure 24B
(Mukka, Mellner et al. 2016), with a prevalence of 25% (2/8). Authors did not provide a
definition for DSSI.
Superficial surgical site infection (SSSI)
One study reported SSSI for Revision and ORIF with plate, exposure 24B (n=8)
(Mukka, Mellner et al. 2016), with no events observed. Authors did not provide a
definition for SSSI.
Re-operation
One study reported Re-operation for Revision and ORIF with plate, exposure 24B
(Mukka, Mellner et al. 2016), with a prevalence of 25% (2/8). Authors did not provide an
explicit definition nor a time-frame for re-operation.
Studies not included in the meta-analysis: (Lunebourg, Mouhsine et al. 2015).
Reported on re-operation (by way of Revision) for Vancouver B2 PFF in their cohorts,
however, unfortunately, only explicitly specified the exposure (either 21A ORIF with
plate or 21B Revision + ORIF with plate) in one out of two revision cases and hence
could not be included in our meta-analysis without introducing some uncertainty.
126
Modified Charnley-D’Aubigne score excellent outcome
One study reported post-operative Modified Charnley-D’Aubigne score excellent
outcome for Revision and ORIF with plate, exposure 25B (Mukundan, Rayan et al.
2010), with a prevalence of 63% (5/8). The time point post-operatively at which the
Modified Charnley-D’Aubigne score was assessed was not explicitly reported.
Modified Charnley-D’Aubigne score good outcome
One study reported post-operative Modified Charnley-D’Aubigne score good
outcome for Revision and ORIF with plate, exposure 25B (Mukundan, Rayan et al.
2010), with a prevalence of 38 (3/8). The time point post-operatively at which the
Modified Charnley-D’Aubigne score was assessed was not explicitly reported.
127
Revision and cortical strut allograft(s)
There were three studies (all case series) which reported on outcomes for the intervention
of Revision and cortical strut allograft(s).
Surgical time
One study reported surgical time (referred to as ‘procedure time’ by authors) for
Revision and cortical strut allograft, exposure 32 (n=7) (Sledge and Abiri 2002), with a
mean surgical time of 215 minutes (SD and Range NS). No definition of outcome was
provided by the authors.
Transfusion packed red blood cell (PRBC) requirement (units)
One study reported transfusion PRBC for Revision and cortical strut allograft,
exposure 32 (n=7) (Sledge and Abiri 2002), with a mean transfusion PRBC of 2 units
(no SD reported).
Subsidence (any)
One study reported subsidence (any) for Revision and cortical strut allograft,
exposure 32 (Sledge and Abiri 2002), with a prevalence of 64% (2/7) (2mm and 5mm
subsidence). Authors did not provide a definition, method of measuring, nor a time-frame
of assessment for subsidence.
Subsidence (>5mm or requiring revision)
One study reported subsidence (>5mm or requiring revision) for Revision and
cortical strut allograft, exposure 32 (n=7) (Sledge and Abiri 2002), with no events
128
observed. Authors did not provide a definition, method of measuring nor a time-frame of
assessment for subsidence.
Union (fracture)
Two studies reported union for Revision and cortical strut allograft(s), exposure
13C (Holley, Zelken et al. 2007) and 35 (Wu, Yan et al. 2009), with a prevalence of 86%
(6/7) and 100% (5/5), respectively. Wu and colleagues reported a mean time to union of
5.6 months (Range 3-9, SD NS), however, Holley and colleagues did not specify a time-
frame (Holley, Zelken et al. 2007, Wu, Yan et al. 2009).
Length of stay (LOS)
One study reported hospital LOS for Revision and cortical strut allograft,
exposure 32 (n=7) (Sledge and Abiri 2002), with a mean LOS time of 6 days (SD and
Range NS).
Cortical strut ingrowth
Two studies reported cortical strut ingrowth for Revision and cortical strut
allograft(s), exposure 32 (Sledge and Abiri 2002) and 35 (Wu, Yan et al. 2009), with a
prevalence of 100% (7/7) and 100% (5/5), respectively. Sledge and colleagues refers to
this as spot welding at strut host junction on plain film radiograph and Wu and colleagues
as ‘trabecular bridging between any part of the graft and host bone’ (on radiograph). Wu
and colleagues report a mean time to achieve cortical strut ingrowth of 11.5 months
(SD: 2.4, range: 7;18) (Wu, Yan et al. 2009).
129
Aseptic loosening femur
One study reported aseptic loosening femur for Revision and cortical strut
allograft, exposure 32 (n=7) (Sledge and Abiri 2002), with no events observed. No
explicit definition or a time-frame of assessment of aseptic loosening femur was reported
by authors.
Peri-prosthetic fracture (post-operatively)
One study reported PFF post-operatively for Revision and cortical strut allograft,
exposure 32 (n=7) (Sledge and Abiri 2002), with no events observed. Authors imply the
use of plain film radiographs to identify PFF post-operatively, however, the timing of this
assessment is not clear.
Pulmonary embolism (PE)
One study reported PE for Revision and cortical strut allograft, exposure 13C
(Holley, Zelken et al. 2007), with an event prevalence of 14% (1/7). Authors refer to the
PE as ‘non-fatal’, however, do not provide the method of diagnosis nor a time-frame of
assessment. The overall assessment period for the study was a mean 65.9 months (Range
24-111, No SD reported).
Harris hip score (post-operative)
Two studies reported post-operative Harris hip score for Revision and cortical
strut allograft, exposure 32 (n=7) (Sledge and Abiri 2002) and 35 (n=5) (Wu, Yan et al.
2009), with mean scores of 83 (SD NS, range NS) and 70 (SD 9.3), respectively. The
time point post-operatively at which HHS was calculated was reportedly at final follow-
130
up in Wu and colleagues, however, not specified by Sledge and colleagues. The overall
assessment period across studies was similar and up to around seven years.
Satisfaction score (post-operative) (self-reported visual analogue scale 0 (no pain) – 100
(intolerable pain)
One study reported post-operative satisfaction score for Revision and cortical strut
allograft, exposure 35 (n=5) (Wu, Yan et al. 2009), with a mean score of 18.4 (Range 11-
25, SD NS). Authors do not specify a time-frame of assessment.
Attainment of pre-fracture mobility status
One study reported attainment pre-fracture mobility status for Revision and
cortical strut allograft, exposure 32 (Sledge and Abiri 2002), with an event rate of 86%
(6/7). Authors do not specify how this is concluded, nor a time-frame of assessment.
Revision mixed methods/unspecified
There were eleven studies (eight retrospective case series and three retrospective cohort
studies) which investigated various outcomes for the intervention of Revision mixed
methods/unspecified.
Subsidence (any)
Two studies reported subsidence for Revision mixed methods/unspecified,
exposure 5 (Corten, Macdonald et al. 2012) and exposure 30 (Rayan, Konan et al. 2010),
with a prevalence of 3.2% (1/31 – 5mm, stable at up to 4 years observation) and 0%
(0/14), respectively. Neither studies explicitly defined subsidence.

131
Subsidence (>5mm or requiring revision)
Two studies reported subsidence (>5mm or requiring revision) for Revision mixed
methods/unspecified, exposure 5 (n=31) (Corten, Macdonald et al. 2012) and exposure 30
(n=14) (Rayan, Konan et al. 2010), with no events observed in both studies. Neither
studies explicitly defined subsidence.
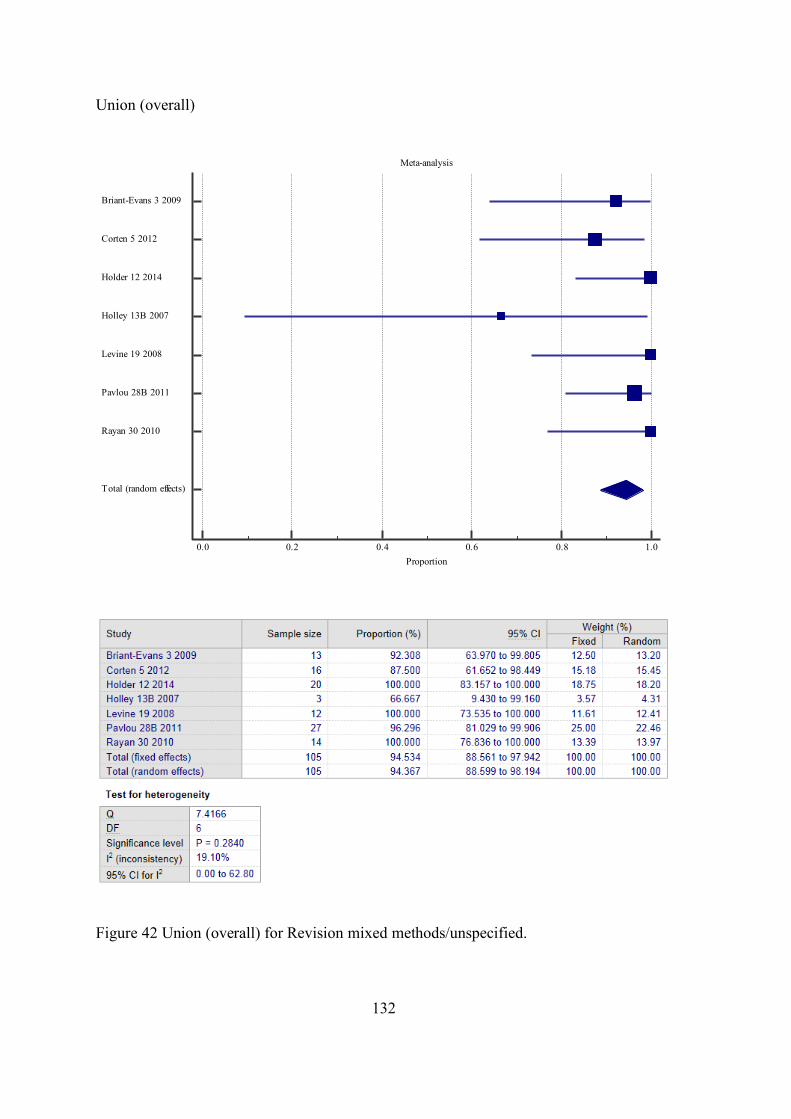
132
Union (overall)
Figure 42 Union (overall) for Revision mixed methods/unspecified.
Meta-analysis
0.0 0.2 0.4 0.6 0.8 1.0Proportion
Briant-Evans 3 2009
Corten 5 2012
Holder 12 2014
Holley 13B 2007
Levine 19 2008
Pavlou 28B 2011
Rayan 30 2010
Total (random effects)

133
Figure 42 shows the meta-analysis for the seven studies (n=105) that reported
union for exposure of interest. Just over half of the studies (4/7) explicitly defined union
and the same proportion considered clinical as well as radiographic union. The time to
union was only explicitly reported in around a quarter of studies (Table 10). Overall, the
prevalence of union was 94.4% (95%CI 88.6 to 98.2). There was a low degree of
heterogeneity between the studies (I2 = 19.1%).
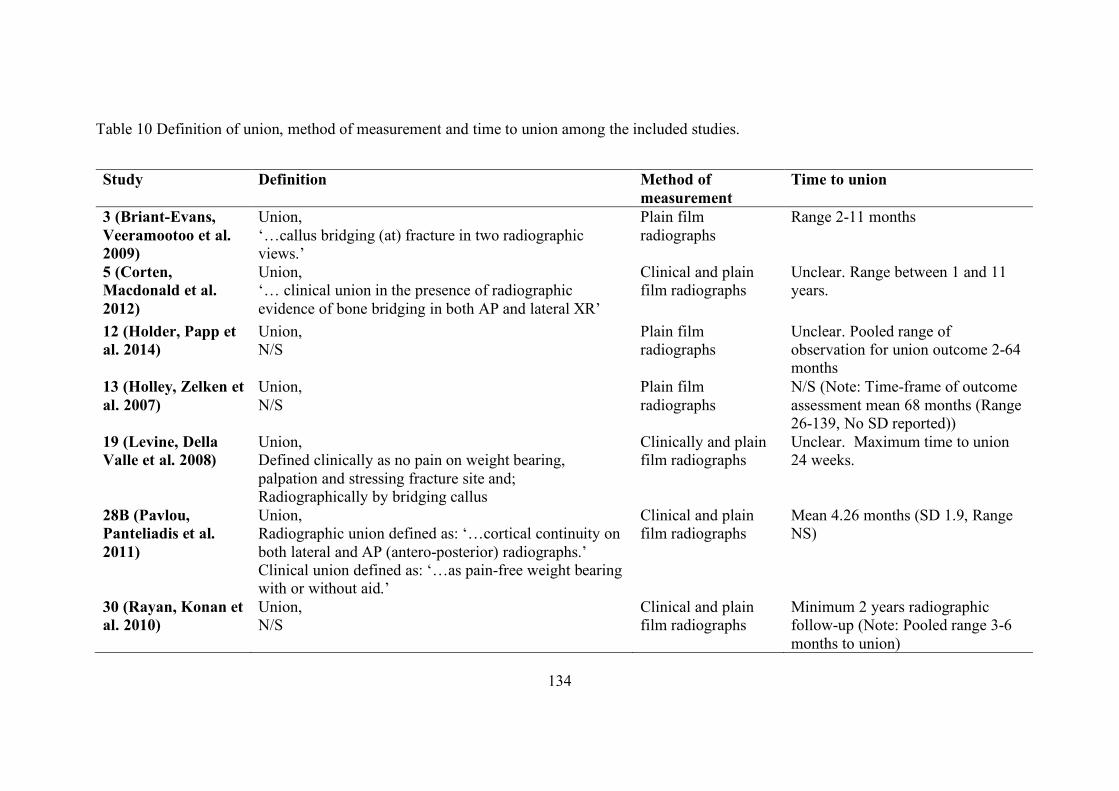
134
Table 10 Definition of union, method of measurement and time to union among the included studies.
Study Definition Method of measurement
Time to union
3 (Briant-Evans, Veeramootoo et al. 2009)
Union, ‘…callus bridging (at) fracture in two radiographic views.’
Plain film radiographs
Range 2-11 months
5 (Corten, Macdonald et al. 2012)
Union, ‘… clinical union in the presence of radiographic evidence of bone bridging in both AP and lateral XR’
Clinical and plain film radiographs
Unclear. Range between 1 and 11 years.
12 (Holder, Papp et al. 2014)
Union, N/S
Plain film radiographs
Unclear. Pooled range of observation for union outcome 2-64 months
13 (Holley, Zelken et al. 2007)
Union, N/S
Plain film radiographs
N/S (Note: Time-frame of outcome assessment mean 68 months (Range 26-139, No SD reported))
19 (Levine, Della Valle et al. 2008)
Union, Defined clinically as no pain on weight bearing, palpation and stressing fracture site and; Radiographically by bridging callus
Clinically and plain film radiographs
Unclear. Maximum time to union 24 weeks.
28B (Pavlou, Panteliadis et al. 2011)
Union, Radiographic union defined as: ‘…cortical continuity on both lateral and AP (antero-posterior) radiographs.’ Clinical union defined as: ‘…as pain-free weight bearing with or without aid.’
Clinical and plain film radiographs
Mean 4.26 months (SD 1.9, Range NS)
30 (Rayan, Konan et al. 2010)
Union, N/S
Clinical and plain film radiographs
Minimum 2 years radiographic follow-up (Note: Pooled range 3-6 months to union)
135
Malunion
One study reported malunion for Revision mixed methods/unspecified, exposure
30 (n=14) (Rayan, Konan et al. 2010), with no events observed. No definition of
malunion was provided by the authors.
Cortical strut ingrowth
One study reported cortical strut ingrowth for Revision mixed
methods/unspecified, exposure 5 (Corten, Macdonald et al. 2012), with a prevalence of
100% (14/14). Method of assessment by authors; ‘Ingrowth of the cortical onlay struts
was evaluated according to the criteria for incorporation described by Emerson et al.
(1992)’.
Union Extended trochanteric osteotomy (ETO)
One study reported union ETO for Revision mixed methods/unspecified, exposure
19 (Levine, Della Valle et al. 2008), with a prevalence of 100% (12/12) at mean 13.1
weeks (no SD or range reported). No definition of union ETO was provided by the
authors.
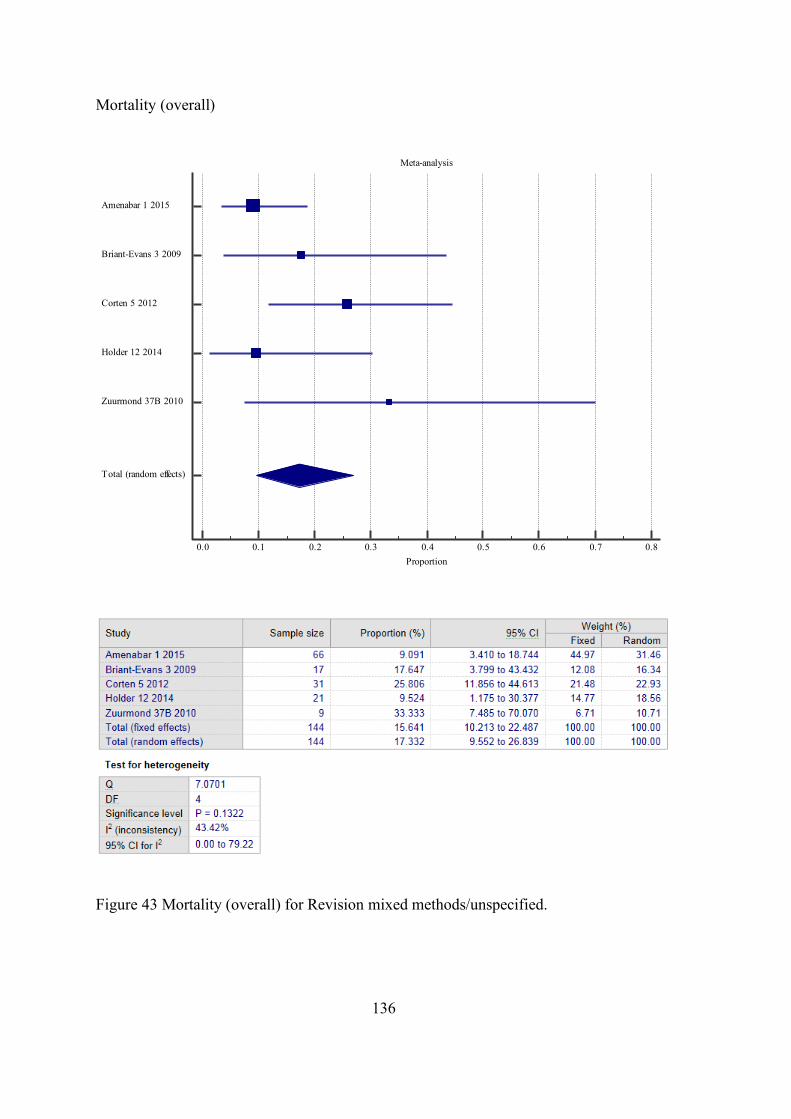
136
Mortality (overall)
Figure 43 Mortality (overall) for Revision mixed methods/unspecified.
Meta-analysis
0.0 0.1 0.2 0.3 0.4 0.5 0.6 0.7 0.8Proportion
Amenabar 1 2015
Briant-Evans 3 2009
Corten 5 2012
Holder 12 2014
Zuurmond 37B 2010
Total (random effects)
137
Figure 43 shows the meta-analysis for the five studies (n=144) that reported
mortality (overall) for the exposure of interest. 80% (4/5) of the studies provided a time
period for mortality, including mortality within 3 months (Holder, Papp et al. 2014),
6 months (Corten, Macdonald et al. 2012), 2 years (Amenabar, Rahman et al. 2015) and
‘at end of study’ (Briant-Evans, Veeramootoo et al. 2009), which could be between
3 months up to 9 years.
Overall, the prevalence of mortality was 17.3% (95%CI 9.6 to 26.8). There was a
moderate degree of heterogeneity between the studies (I2 = 43.4%). In studies where
patients were excluded based on mortality, either directly, e.g. mortality within three
months post-operatively OR in-directly, e.g. where minimum follow-up periods were
applied to exclusion criteria and reason for not reaching this time period was mortality,
the patients were included in the meta-analysis.
Failure (any complication requiring Revision surgery)
One study reported failure for Revision mixed methods/unspecified, exposure 1,
(Amenabar, Rahman et al. 2015) with a prevalence of 9.2% (7/76). Authors defined
failure ‘…as those stems that required Revision surgery and replacement for any reason
(including infection).’ They did not provide an explicit time-frame for these ‘failures’
between 1.5 and 29.8 months post-operatively.
Aseptic loosening femur
One study reported aseptic loosening femur for Revision mixed
methods/unspecified, exposure 1 (Amenabar, Rahman et al. 2015), with a prevalence of
6.6% (5/76). No definition of aseptic loosening femur was described by the authors. The
time-frame for identification was reported between 1.5 and 29.8 months post-operatively.
138
Peri-prosthetic fracture (post-operatively)
Two studies reported PFF post-operatively for Revision mixed
methods/unspecified, exposure 1 (Amenabar, Rahman et al. 2015) and 5, with prevalence
rates of 2.6% (2/76) and 3.2% (1/31), respectively. Authors imply the use of plain film
radiographs to identify PFF post-operatively, however, the timing of this assessment is
not clear.
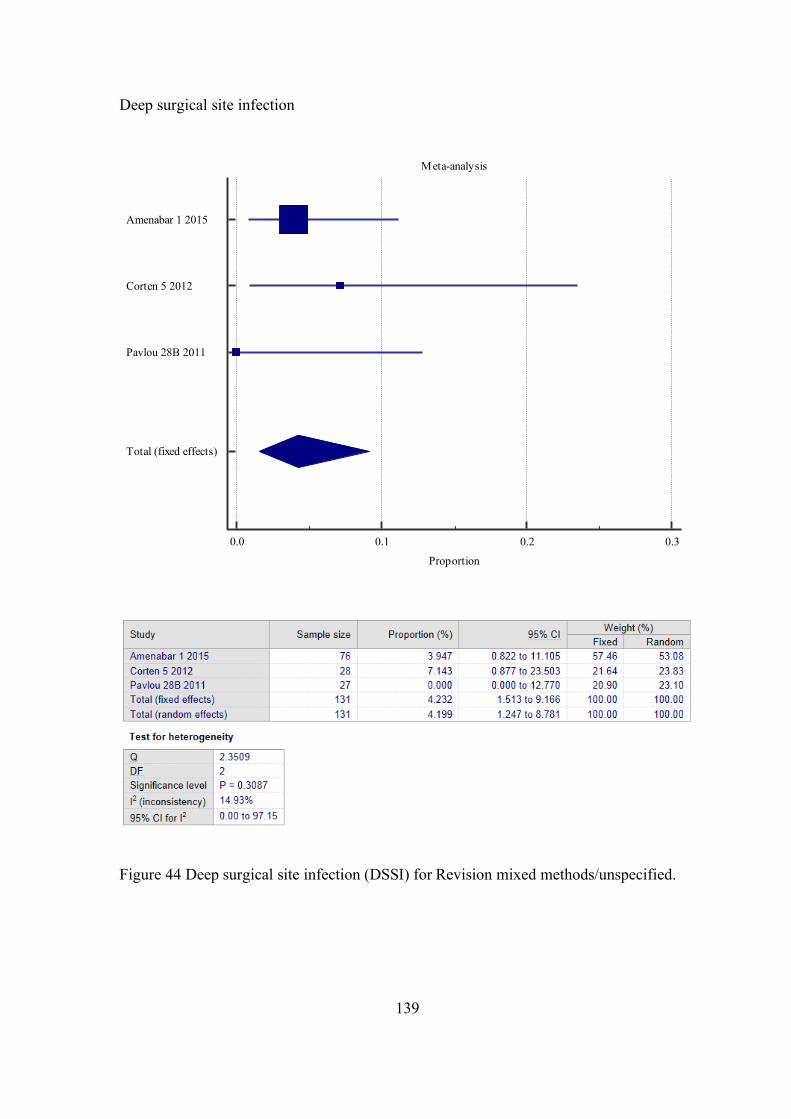
139
Deep surgical site infection
Figure 44 Deep surgical site infection (DSSI) for Revision mixed methods/unspecified.
Meta-analysis
0.0 0.1 0.2 0.3
Proportion
Amenabar 1 2015
Corten 5 2012
Pavlou 28B 2011
Total (fixed effects)
140
Figure 44 shows the meta-analysis for the three studies (n=131) that reported
DSSI for the exposure of interest. No authors provided a definition for DSSI. The explicit
time-frame of outcome measurement was not reported in any study.
Overall, the prevalence of DSSI was 4.2% (95%CI 1.5 to 9.2). There was a mild
degree of heterogeneity between the studies (I2 = 14.9%).
Superficial surgical site infection
One study reported SSSI for Revision mixed methods/unspecified, exposure 28B
(n=27) (Pavlou, Panteliadis et al. 2011), with no events observed. Authors did not provide
a definition, nor a time-frame of assessment for SSSI, however, patients were assessed
until union or 12 months, whichever occurred first.
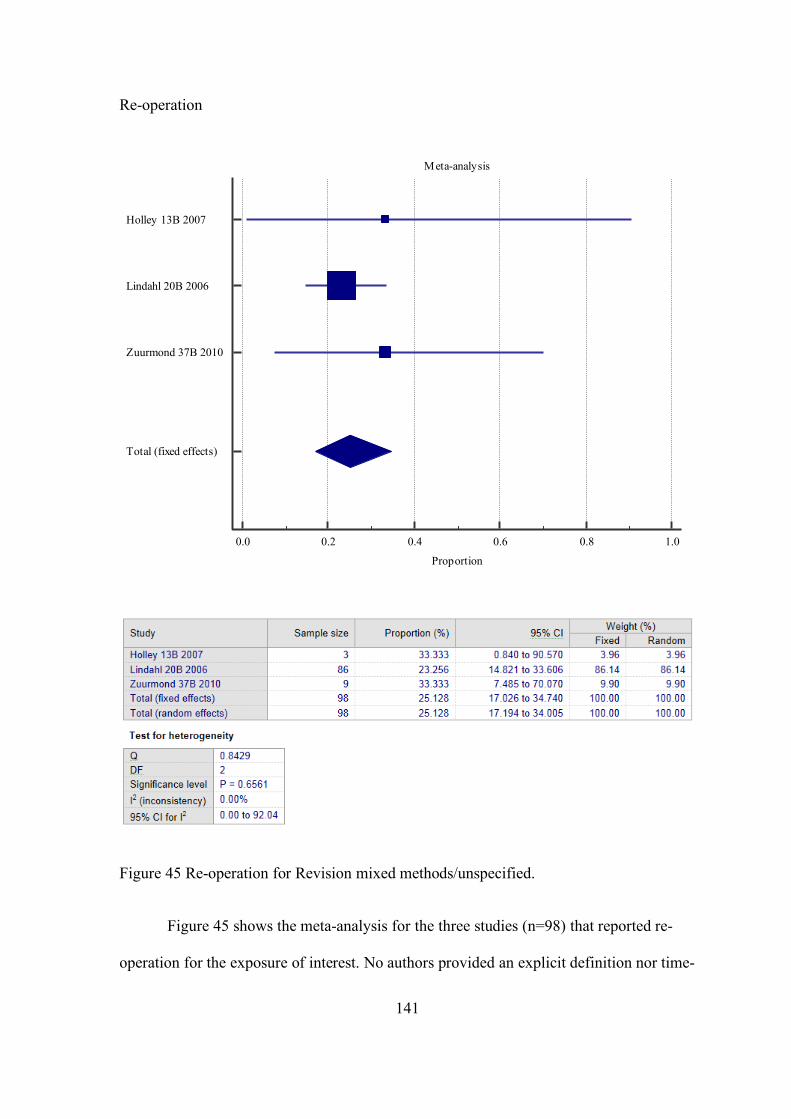
141
Re-operation
Figure 45 Re-operation for Revision mixed methods/unspecified.
Figure 45 shows the meta-analysis for the three studies (n=98) that reported re-
operation for the exposure of interest. No authors provided an explicit definition nor time-
Meta-analysis
0.0 0.2 0.4 0.6 0.8 1.0
Proportion
Holley 13B 2007
Lindahl 20B 2006
Zuurmond 37B 2010
Total (fixed effects)
142
frame for re-operation. The overall assessment period across studies was similar, and up
to around twelve years.
Overall, the prevalence of re-operation was 25.1% (95%CI 17.0 to 34.7). There
was no important heterogeneity between the studies (I2 = 0%).
Neurovascular injury
One study reported neurovascular injury for Revision mixed methods/unspecified,
exposure 30 (Rayan, Konan et al. 2010), with a prevalence of 0.7% (1/14), a sciatic nerve
palsy which completely recovered over an unspecified time period.
SF-12 mental score post-operatively (at time of last follow-up)
One study reported post-operative SF-12 mental score for Revision mixed
methods/unspecified, exposure 1 (n=76) (Amenabar, Rahman et al. 2015) with a mean
score of 55.1 (SD 8.1). Aside from stating score was assessed at final follow-up, explicit
time-frame was specified for this outcome. The overall assessment period across studies
was similar, and up to around 14 years.
SF-12 physical score post-operatively
One study reported post-operative SF-12 physical score for Revision mixed
methods/unspecified, exposure 1 (n=76) (Amenabar, Rahman et al. 2015) with a mean
score of 37.4 (SD 9.4). Aside from stating that the score was assessed at final follow-up,
an explicit time-frame was specified for this outcome. The overall assessment period
across studies was similar, and up to around 14 years.
143
Harris hip score (post-operative)
Two studies reported post-operative Harris hip score for Revision mixed
methods/unspecified, exposure 5 (n=31) (Corten, Macdonald et al. 2012) and 23 (n=6),
with mean scores of 77.5 (SD NS, range NS) and 73 (SD 3.2), respectively. The time
point post-operatively at which HHS was calculated was not explicitly reported in any
study, however, the earliest assessment was performed 10 months and 1 year post-
operatively for Corten et al. (Corten, Macdonald et al. 2012) and Moreta et al. (Moreta,
Aguirre et al. 2015), respectively.
WOMAC pain score (post-operative)
One study reported post-operative WOMAC pain score for Revision mixed
methods/unspecified, exposure 5 (n is unclear) (Corten, Macdonald et al. 2012), with a
mean score of 3 (SD NS, range NS). The time point post-operatively for the WOMAC
pain score was at a minimum one year.
WOMAC function score (post-operative)
One study reported post-operative WOMAC function score for Revision mixed
methods/unspecified, exposure 5 (n is unclear) (Corten, Macdonald et al. 2012), with a
mean score of 13 (SD NS, range NS). The time point post-operatively for the WOMAC
function score was at a minimum one year.
WOMAC stiffness score (post-operative)
One study reported post-operative WOMAC stiffness score for Revision mixed
methods/unspecified, exposure 5 (n is unclear) (Corten, Macdonald et al. 2012), with a
144
mean score of 2 (SD NS, range NS). The time point post-operatively for the WOMAC
function score was at a minimum one year.
Attainment of pre-fracture mobility status
Two studies reported attainment of pre-fracture mobility status for Revision mixed
methods/unspecified, exposure 5 and 23, with a prevalence of 50% (8/16) and 42%
(6/14), respectively. Corten and colleagues (Corten, Macdonald et al. 2012) did not
explicitly report how this was measured or concluded; however, they imply functional
assessments were made at the earliest 1 year post-operatively. Moreta and colleagues
(Moreta, Aguirre et al. 2015), assessed this based on follow-up clinical review or phone
interview using categories of mobility. It is unclear whether or not this pre and post-
operative assessment is self-reported, clinician assessed or a combination.
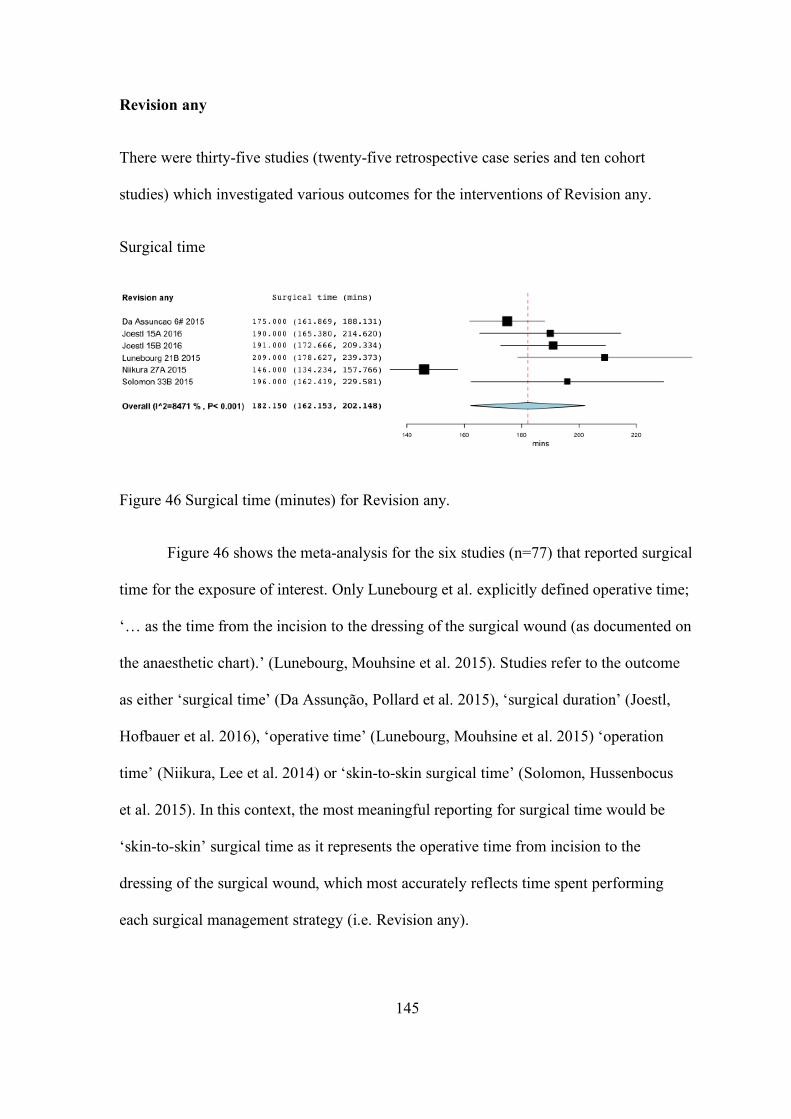
145
Revision any
There were thirty-five studies (twenty-five retrospective case series and ten cohort
studies) which investigated various outcomes for the interventions of Revision any.
Surgical time
Figure 46 Surgical time (minutes) for Revision any.
Figure 46 shows the meta-analysis for the six studies (n=77) that reported surgical
time for the exposure of interest. Only Lunebourg et al. explicitly defined operative time;
‘… as the time from the incision to the dressing of the surgical wound (as documented on
the anaesthetic chart).’ (Lunebourg, Mouhsine et al. 2015). Studies refer to the outcome
as either ‘surgical time’ (Da Assunção, Pollard et al. 2015), ‘surgical duration’ (Joestl,
Hofbauer et al. 2016), ‘operative time’ (Lunebourg, Mouhsine et al. 2015) ‘operation
time’ (Niikura, Lee et al. 2014) or ‘skin-to-skin surgical time’ (Solomon, Hussenbocus
et al. 2015). In this context, the most meaningful reporting for surgical time would be
‘skin-to-skin’ surgical time as it represents the operative time from incision to the
dressing of the surgical wound, which most accurately reflects time spent performing
each surgical management strategy (i.e. Revision any).

146
Overall, the mean surgical time was 182.2 minutes (95%CI 162.2 to 202.1). There
was a high degree of heterogeneity between the studies (I2 = 84.7%).
Studies not included in the meta-analysis: Sledge 32 and colleagues reported on
surgical time (mean surgical time 215 minutes), however, unfortunately did not include
the standard deviation or range, hence this was excluded from the meta-analysis (Sledge
and Abiri 2002).
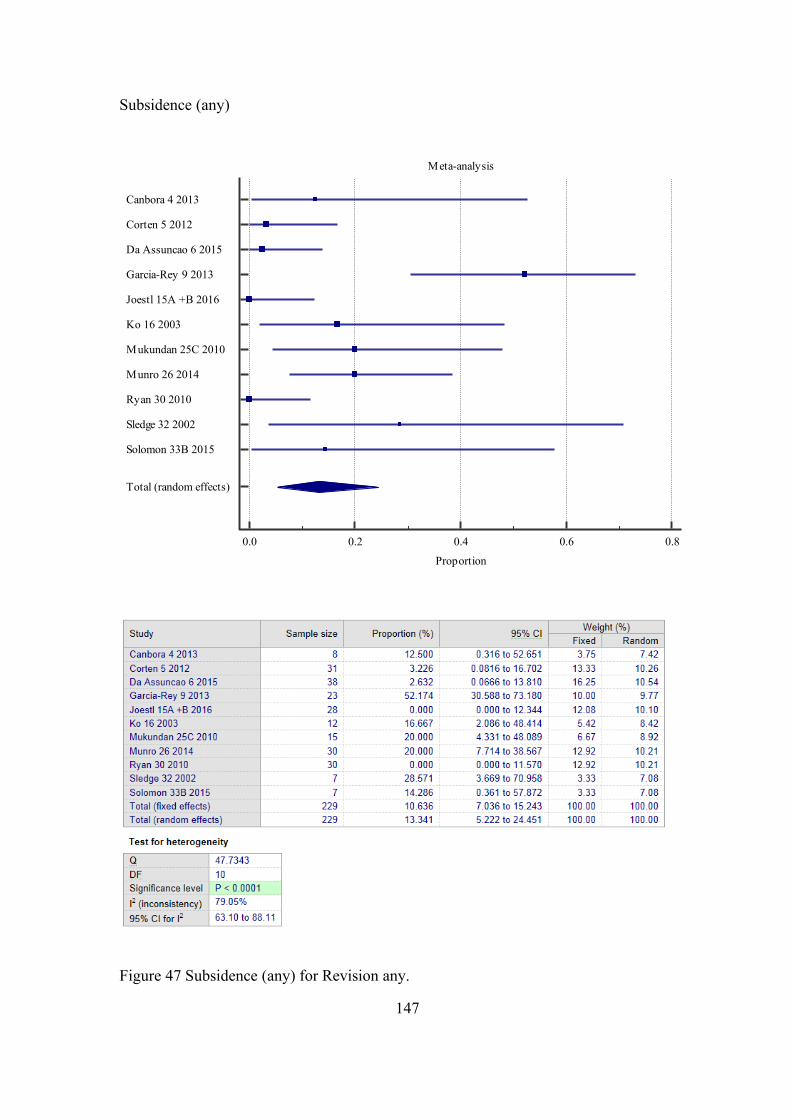
147
Subsidence (any)
Figure 47 Subsidence (any) for Revision any.
Meta-analysis
0.0 0.2 0.4 0.6 0.8
Proportion
Canbora 4 2013
Corten 5 2012
Da Assuncao 6 2015
Garcia-Rey 9 2013
Joestl 15A +B 2016
Ko 16 2003
Mukundan 25C 2010
Munro 26 2014
Ryan 30 2010
Sledge 32 2002
Solomon 33B 2015
Total (random effects)

148
Figure 47 shows the meta-analysis for the eleven studies (n=229) that reported
subsidence for the exposure of interest. The terms stem subsidence (10/11 studies) and
stem migration (1/11 studies) were accepted as subsidence for the purposes of this meta-
analysis. Definition of subsidence was provided in the majority of studies (7/11 studies),
however, only just under half (5/11 studies) explicitly reported their method for
measuring subsidence.
Overall, the prevalence of subsidence was 13.3% (95%CI 5.2 to 24.5). There was
a high degree of heterogeneity between the studies (I2 = 79.1%).
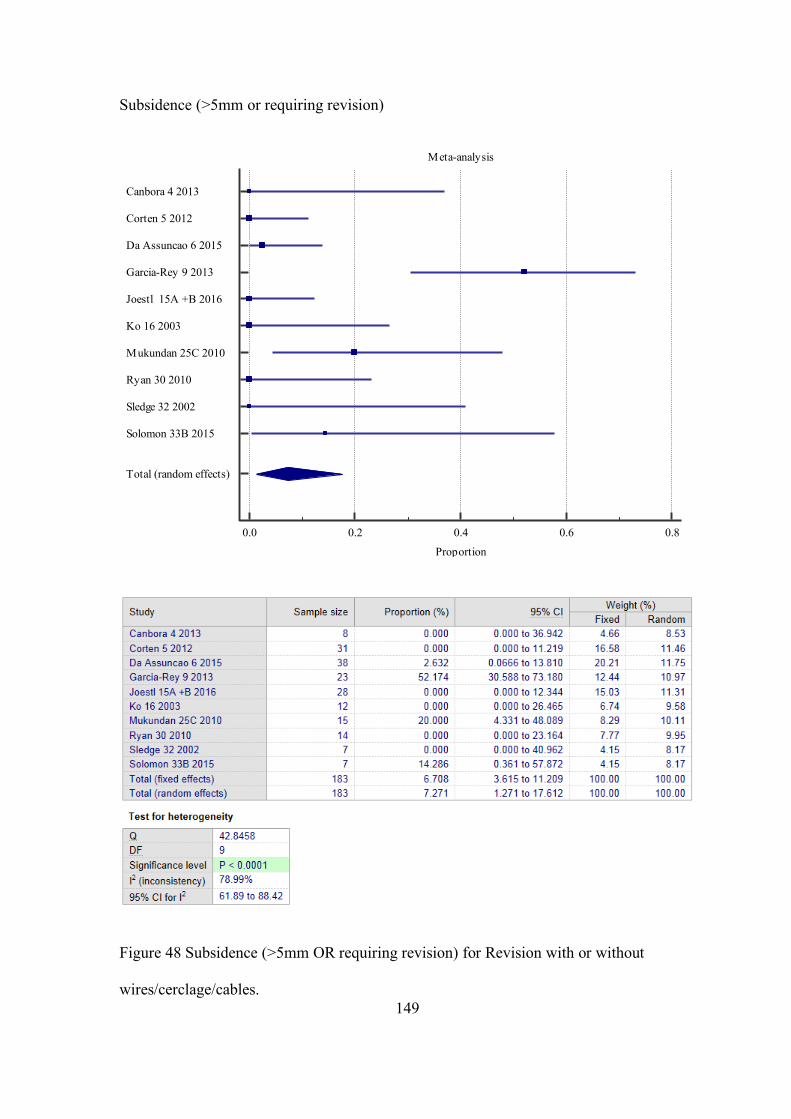
149
Subsidence (>5mm or requiring revision)
Figure 48 Subsidence (>5mm OR requiring revision) for Revision with or without
wires/cerclage/cables.
Meta-analysis
0.0 0.2 0.4 0.6 0.8
Proportion
Canbora 4 2013
Corten 5 2012
Da Assuncao 6 2015
Garcia-Rey 9 2013
Joestl 15A +B 2016
Ko 16 2003
Mukundan 25C 2010
Ryan 30 2010
Sledge 32 2002
Solomon 33B 2015
Total (random effects)
150
Figure 48 shows the meta-analysis for the ten studies (n=183) that reported
subsidence (>5mm or revision) for the exposure of interest. Overall, the prevalence of
subsidence >5mm or requiring Revision was 7.3% (95%CI 1.3 to 17.6). There was a high
degree of heterogeneity between the studies (I2 = 79.0%).
Studies not included in the meta-analysis: Munro and colleagues reported on
subsidence, however, unfortunately did not include the distance of subsidence amongst
the B2 PFF patient group, hence this was excluded from the meta-analysis (Munro,
Garbuz et al. 2014).
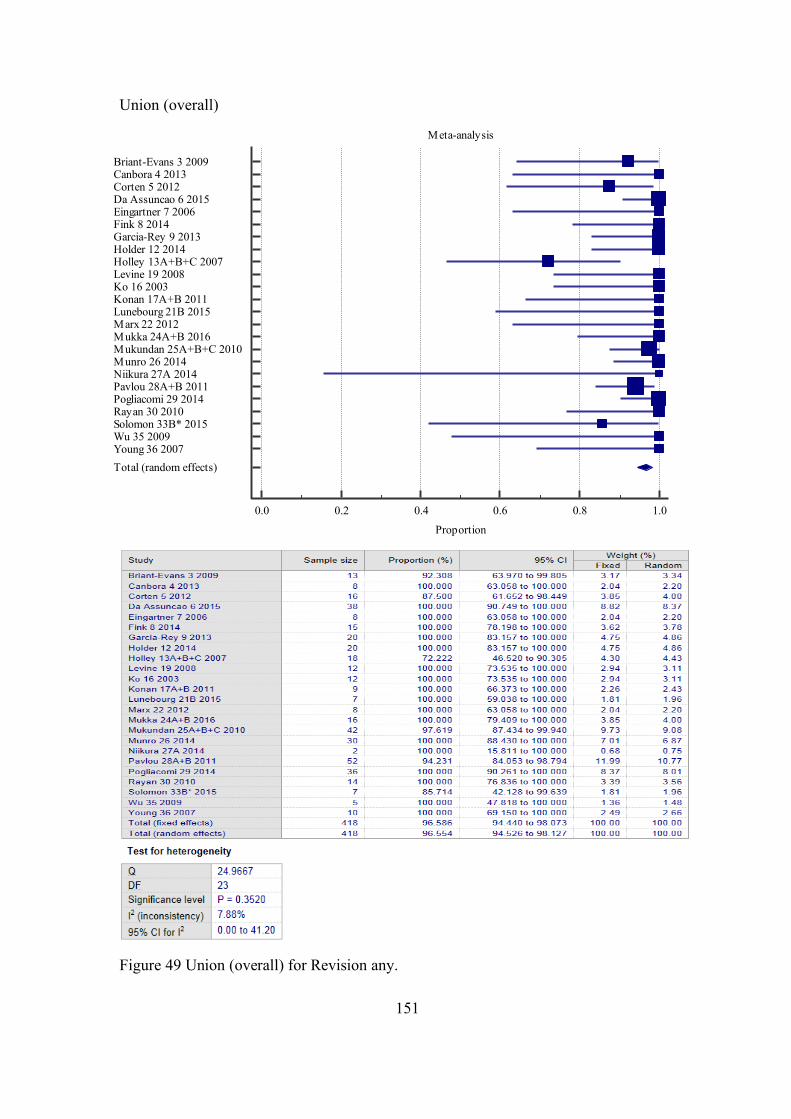
151
Union (overall)
Figure 49 Union (overall) for Revision any.
Meta-analysis
0.0 0.2 0.4 0.6 0.8 1.0
Proportion
Briant-Evans 3 2009Canbora 4 2013Corten 5 2012Da Assuncao 6 2015Eingartner 7 2006Fink 8 2014Garcia-Rey 9 2013Holder 12 2014Holley 13A+B+C 2007Levine 19 2008Ko 16 2003Konan 17A+B 2011Lunebourg 21B 2015Marx 22 2012Mukka 24A+B 2016Mukundan 25A+B+C 2010Munro 26 2014Niikura 27A 2014Pavlou 28A+B 2011Pogliacomi 29 2014Rayan 30 2010Solomon 33B* 2015Wu 35 2009Young 36 2007Total (random effects)
152
Figure 49 shows the meta-analysis for the twenty-four studies (n=418) that
reported union (overall) for the exposure of interest. Half of the studies (12/24) explicitly
defined union and these were generally defined as the presence of a bridging callus across
the main fracture site on a minimum of two or three sides viewed in two views on plain
film radiographs. Some studies (6/24) additionally considered clinical union, for example,
i.e. the patient being able to fully weight bear without pain and lacked pain on clinical
stressing of fracture site (Garcia-Rey, Garcia-Cimbrelo et al. 2013). Only one-third of
studies reported a time to union. The overall assessment period across studies was similar,
and up to around eleven years.
Overall, the prevalence of union was 96.6% (95%CI 94.4 to 98.1). There was a
mild degree of heterogeneity between the studies (I2 = 7.9%).
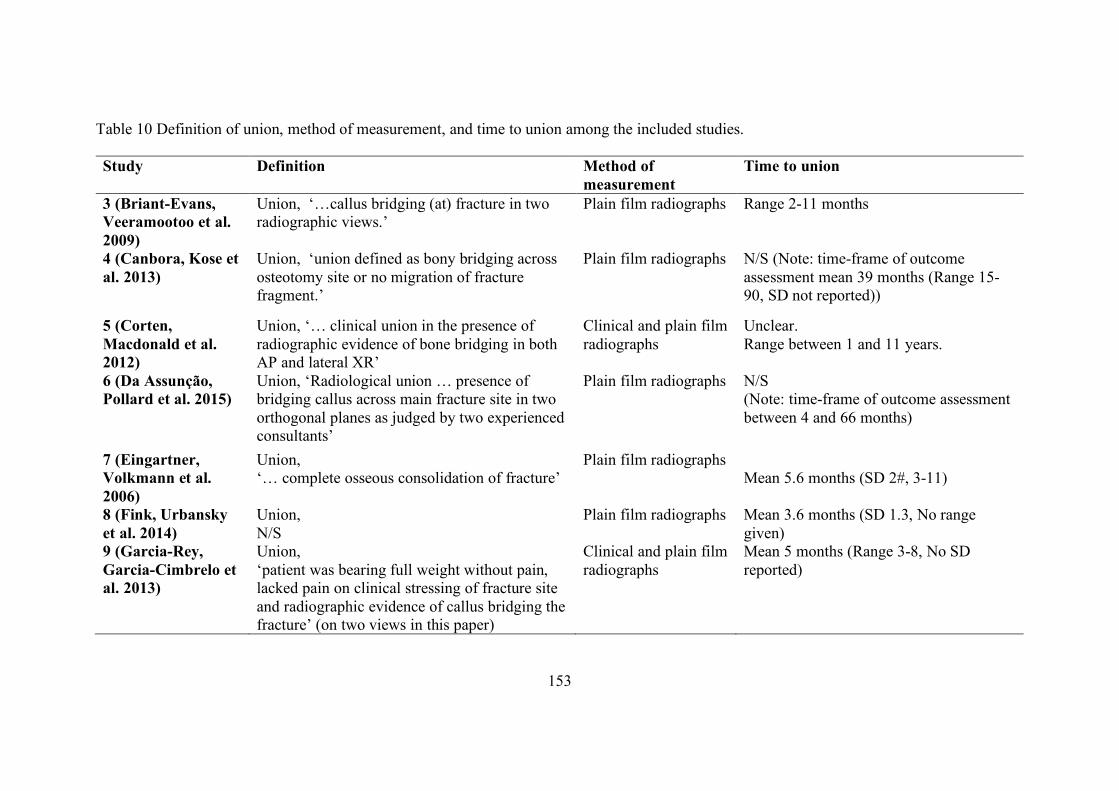
153
Table 10 Definition of union, method of measurement, and time to union among the included studies.
Study Definition Method of measurement
Time to union
3 (Briant-Evans, Veeramootoo et al. 2009)
Union, ‘…callus bridging (at) fracture in two radiographic views.’
Plain film radiographs Range 2-11 months
4 (Canbora, Kose et al. 2013)
Union, ‘union defined as bony bridging across osteotomy site or no migration of fracture fragment.’
Plain film radiographs N/S (Note: time-frame of outcome assessment mean 39 months (Range 15-90, SD not reported))
5 (Corten, Macdonald et al. 2012)
Union, ‘… clinical union in the presence of radiographic evidence of bone bridging in both AP and lateral XR’
Clinical and plain film radiographs
Unclear. Range between 1 and 11 years.
6 (Da Assunção, Pollard et al. 2015)
Union, ‘Radiological union … presence of bridging callus across main fracture site in two orthogonal planes as judged by two experienced consultants’
Plain film radiographs N/S (Note: time-frame of outcome assessment between 4 and 66 months)
7 (Eingartner, Volkmann et al. 2006)
Union, ‘… complete osseous consolidation of fracture’
Plain film radiographs Mean 5.6 months (SD 2#, 3-11)
8 (Fink, Urbansky et al. 2014)
Union, N/S
Plain film radiographs Mean 3.6 months (SD 1.3, No range given)
9 (Garcia-Rey, Garcia-Cimbrelo et al. 2013)
Union, ‘patient was bearing full weight without pain, lacked pain on clinical stressing of fracture site and radiographic evidence of callus bridging the fracture’ (on two views in this paper)
Clinical and plain film radiographs
Mean 5 months (Range 3-8, No SD reported)
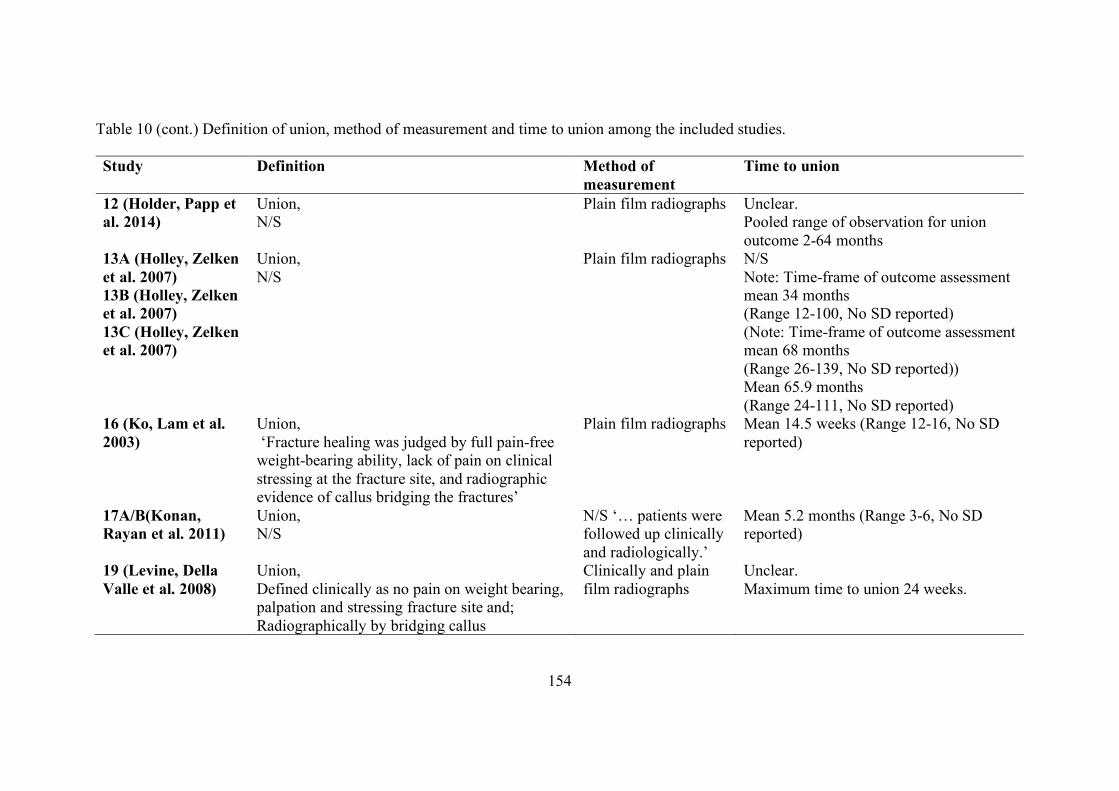
154
Table 10 (cont.) Definition of union, method of measurement and time to union among the included studies.
Study Definition Method of measurement
Time to union
12 (Holder, Papp et al. 2014)
Union, N/S
Plain film radiographs Unclear. Pooled range of observation for union outcome 2-64 months
13A (Holley, Zelken et al. 2007) 13B (Holley, Zelken et al. 2007) 13C (Holley, Zelken et al. 2007)
Union, N/S
Plain film radiographs N/S Note: Time-frame of outcome assessment mean 34 months (Range 12-100, No SD reported) (Note: Time-frame of outcome assessment mean 68 months (Range 26-139, No SD reported)) Mean 65.9 months (Range 24-111, No SD reported)
16 (Ko, Lam et al. 2003)
Union, ‘Fracture healing was judged by full pain-free weight-bearing ability, lack of pain on clinical stressing at the fracture site, and radiographic evidence of callus bridging the fractures’
Plain film radiographs Mean 14.5 weeks (Range 12-16, No SD reported)
17A/B(Konan, Rayan et al. 2011)
Union, N/S
N/S ‘… patients were followed up clinically and radiologically.’
Mean 5.2 months (Range 3-6, No SD reported)
19 (Levine, Della Valle et al. 2008)
Union, Defined clinically as no pain on weight bearing, palpation and stressing fracture site and; Radiographically by bridging callus
Clinically and plain film radiographs
Unclear. Maximum time to union 24 weeks.
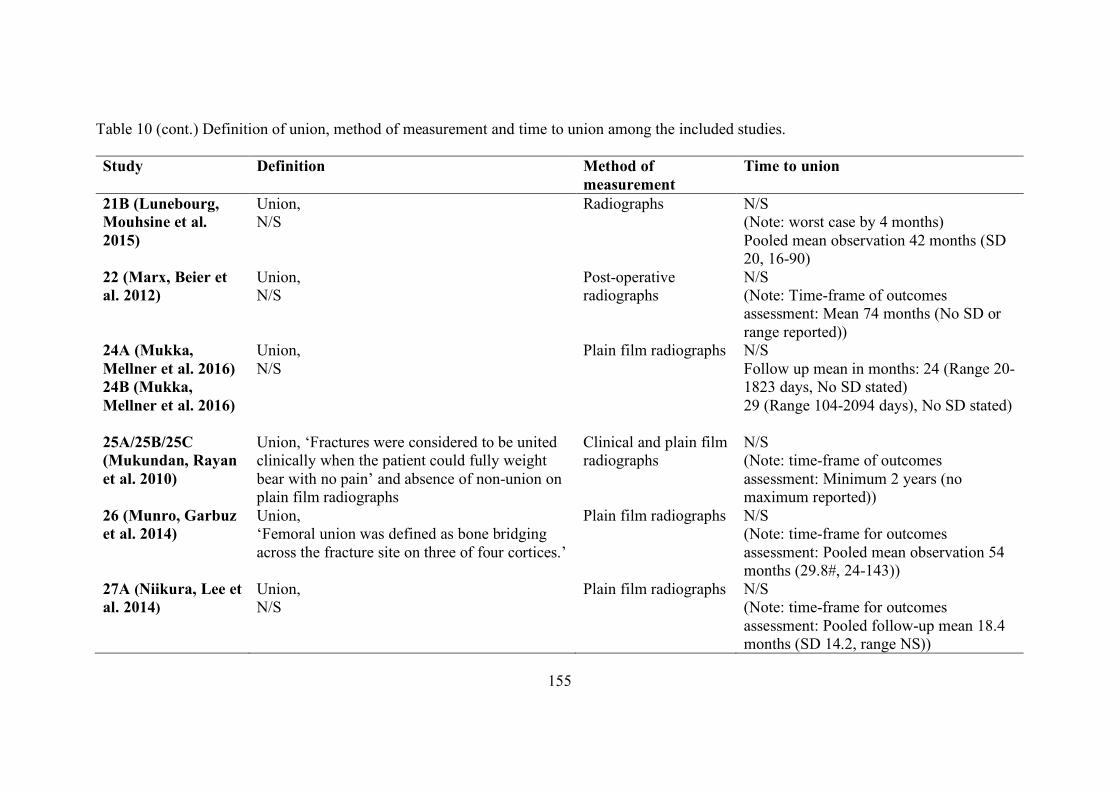
155
Table 10 (cont.) Definition of union, method of measurement and time to union among the included studies.
Study Definition Method of measurement
Time to union
21B (Lunebourg, Mouhsine et al. 2015)
Union, N/S
Radiographs N/S (Note: worst case by 4 months) Pooled mean observation 42 months (SD 20, 16-90)
22 (Marx, Beier et al. 2012)
Union, N/S
Post-operative radiographs
N/S (Note: Time-frame of outcomes assessment: Mean 74 months (No SD or range reported))
24A (Mukka, Mellner et al. 2016) 24B (Mukka, Mellner et al. 2016)
Union, N/S
Plain film radiographs N/S Follow up mean in months: 24 (Range 20-1823 days, No SD stated) 29 (Range 104-2094 days), No SD stated)
25A/25B/25C (Mukundan, Rayan et al. 2010)
Union, ‘Fractures were considered to be united clinically when the patient could fully weight bear with no pain’ and absence of non-union on plain film radiographs
Clinical and plain film radiographs
N/S (Note: time-frame of outcomes assessment: Minimum 2 years (no maximum reported))
26 (Munro, Garbuz et al. 2014)
Union, ‘Femoral union was defined as bone bridging across the fracture site on three of four cortices.’
Plain film radiographs N/S (Note: time-frame for outcomes assessment: Pooled mean observation 54 months (29.8#, 24-143))
27A (Niikura, Lee et al. 2014)
Union, N/S
Plain film radiographs N/S (Note: time-frame for outcomes assessment: Pooled follow-up mean 18.4 months (SD 14.2, range NS))
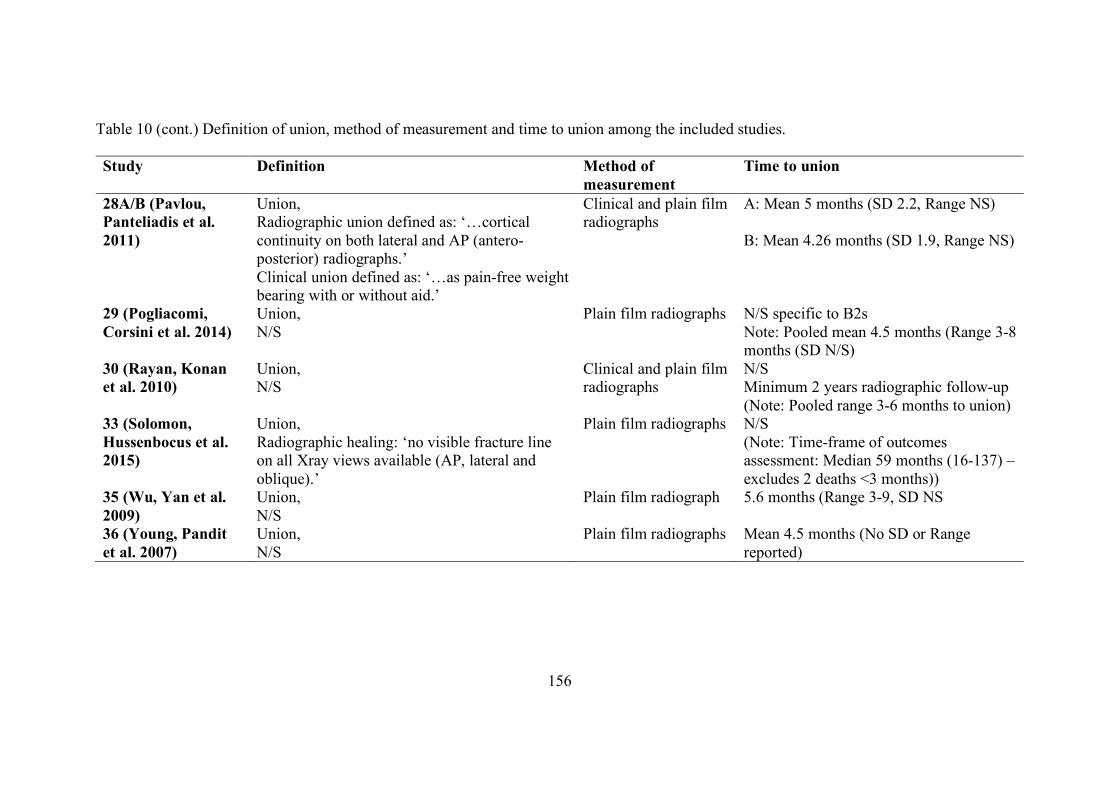
156
Table 10 (cont.) Definition of union, method of measurement and time to union among the included studies.
Study Definition Method of measurement
Time to union
28A/B (Pavlou, Panteliadis et al. 2011)
Union, Radiographic union defined as: ‘…cortical continuity on both lateral and AP (antero-posterior) radiographs.’ Clinical union defined as: ‘…as pain-free weight bearing with or without aid.’
Clinical and plain film radiographs
A: Mean 5 months (SD 2.2, Range NS) B: Mean 4.26 months (SD 1.9, Range NS)
29 (Pogliacomi, Corsini et al. 2014)
Union, N/S
Plain film radiographs N/S specific to B2s Note: Pooled mean 4.5 months (Range 3-8 months (SD N/S)
30 (Rayan, Konan et al. 2010)
Union, N/S
Clinical and plain film radiographs
N/S Minimum 2 years radiographic follow-up (Note: Pooled range 3-6 months to union)
33 (Solomon, Hussenbocus et al. 2015)
Union, Radiographic healing: ‘no visible fracture line on all Xray views available (AP, lateral and oblique).’
Plain film radiographs N/S (Note: Time-frame of outcomes assessment: Median 59 months (16-137) – excludes 2 deaths <3 months))
35 (Wu, Yan et al. 2009)
Union, N/S
Plain film radiograph 5.6 months (Range 3-9, SD NS
36 (Young, Pandit et al. 2007)
Union, N/S
Plain film radiographs Mean 4.5 months (No SD or Range reported)
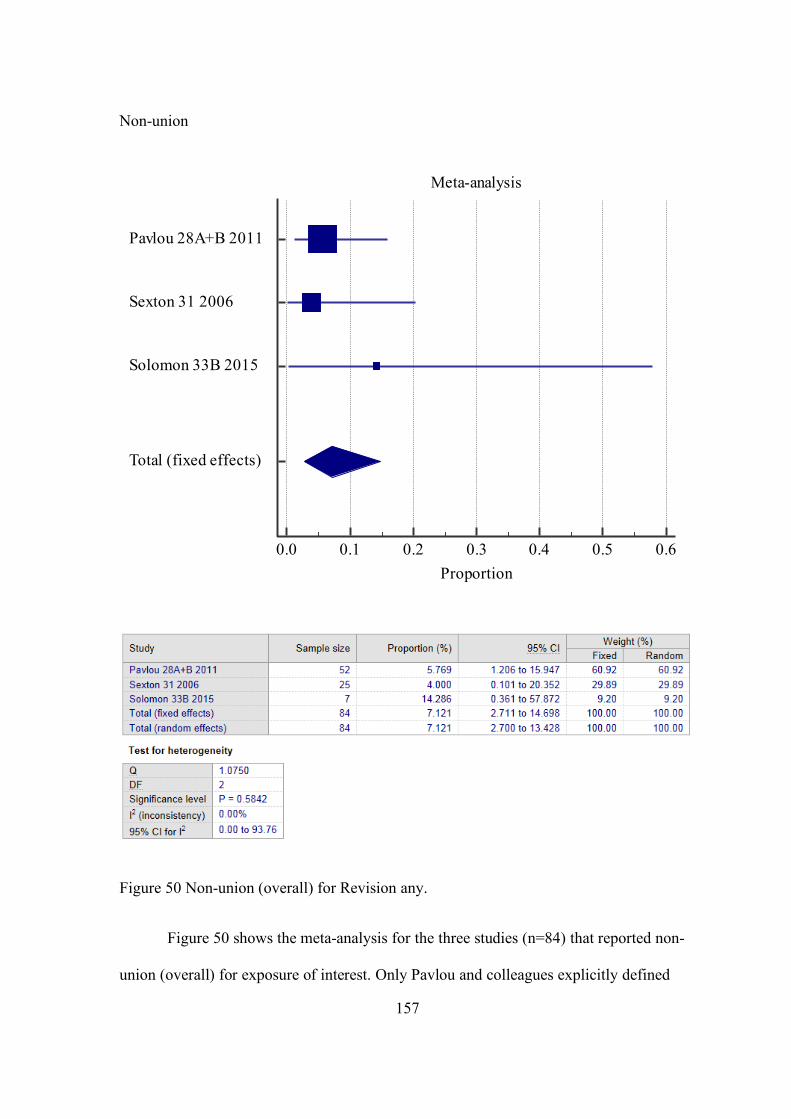
157
Non-union
Figure 50 Non-union (overall) for Revision any.
Figure 50 shows the meta-analysis for the three studies (n=84) that reported non-
union (overall) for exposure of interest. Only Pavlou and colleagues explicitly defined
Meta-analysis
0.0 0.1 0.2 0.3 0.4 0.5 0.6Proportion
Pavlou 28A+B 2011
Sexton 31 2006
Solomon 33B 2015
Total (fixed effects)

158
non-union, being ‘Failure of a fracture to unite 12 months following fixation …’ (Pavlou,
Panteliadis et al. 2011). Overall, the prevalence of non-union was 7.1% (95%CI 2.7 to
14.7). There was no important heterogeneity between the studies (I2 = 0%).
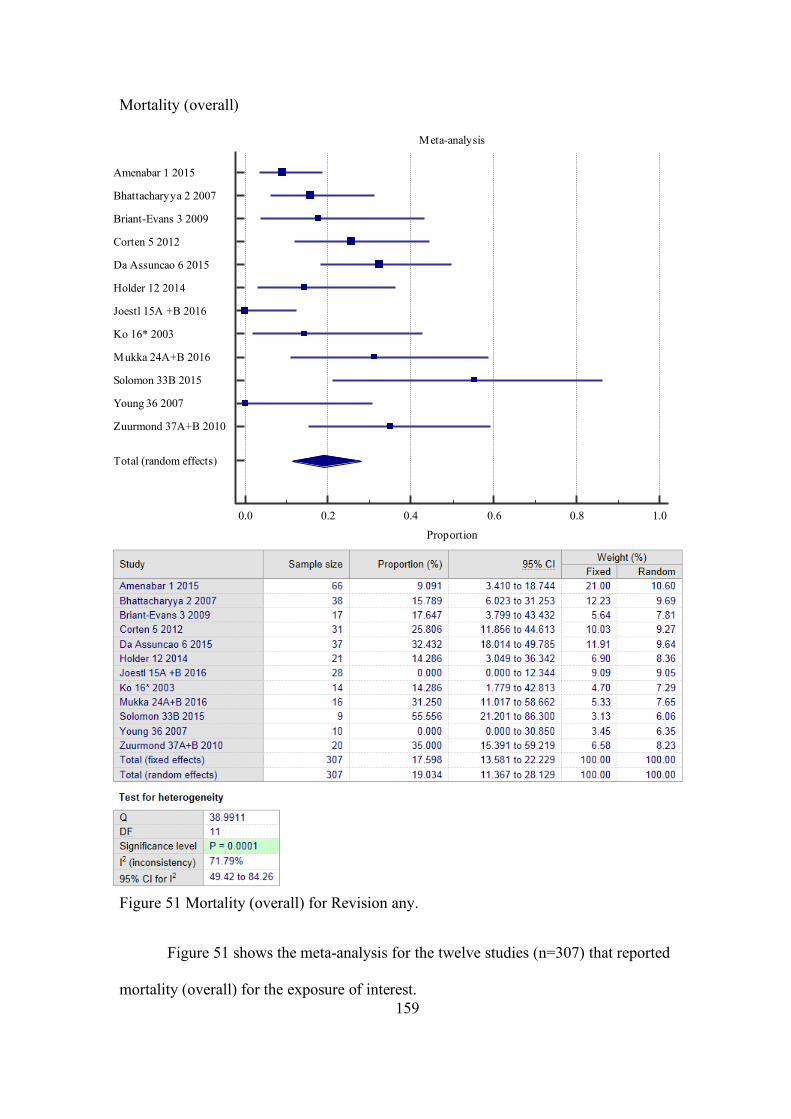
159
Mortality (overall)
Figure 51 Mortality (overall) for Revision any.
Figure 51 shows the meta-analysis for the twelve studies (n=307) that reported
mortality (overall) for the exposure of interest.
Meta-analysis
0.0 0.2 0.4 0.6 0.8 1.0
Proportion
Amenabar 1 2015
Bhattacharyya 2 2007
Briant-Evans 3 2009
Corten 5 2012
Da Assuncao 6 2015
Holder 12 2014
Joestl 15A +B 2016
Ko 16* 2003
Mukka 24A+B 2016
Solomon 33B 2015
Young 36 2007
Zuurmond 37A+B 2010
Total (random effects)
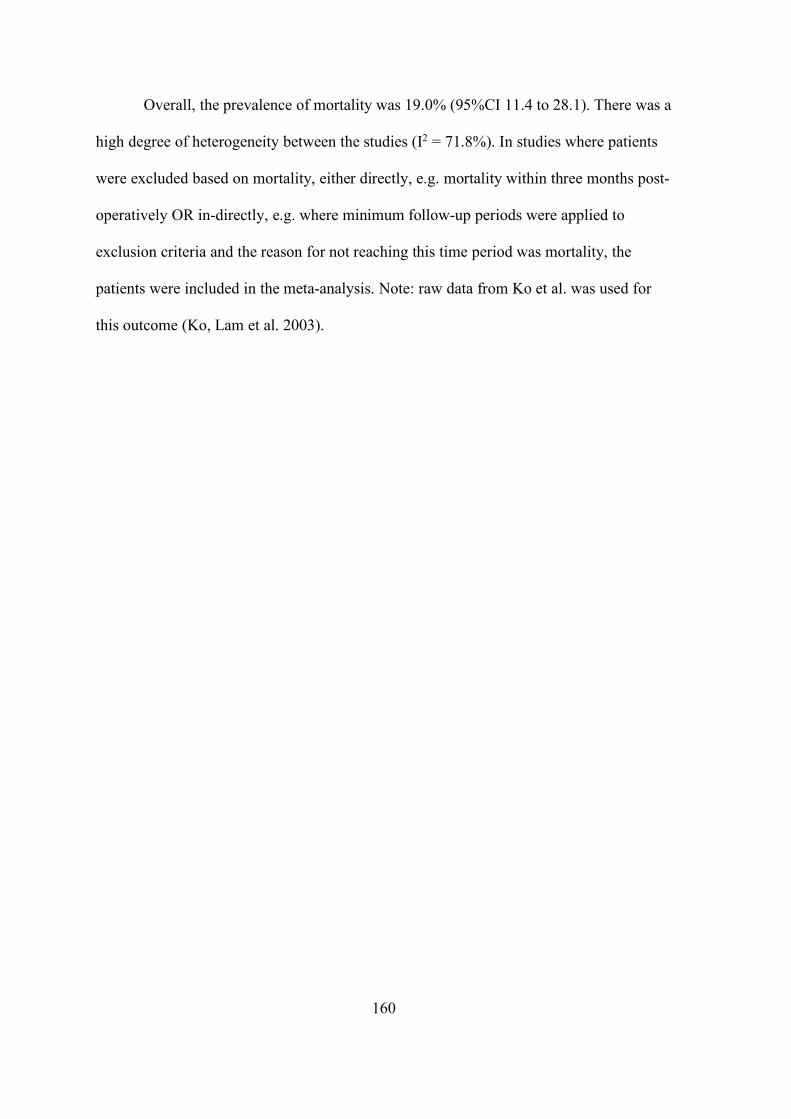
160
Overall, the prevalence of mortality was 19.0% (95%CI 11.4 to 28.1). There was a
high degree of heterogeneity between the studies (I2 = 71.8%). In studies where patients
were excluded based on mortality, either directly, e.g. mortality within three months post-
operatively OR in-directly, e.g. where minimum follow-up periods were applied to
exclusion criteria and the reason for not reaching this time period was mortality, the
patients were included in the meta-analysis. Note: raw data from Ko et al. was used for
this outcome (Ko, Lam et al. 2003).
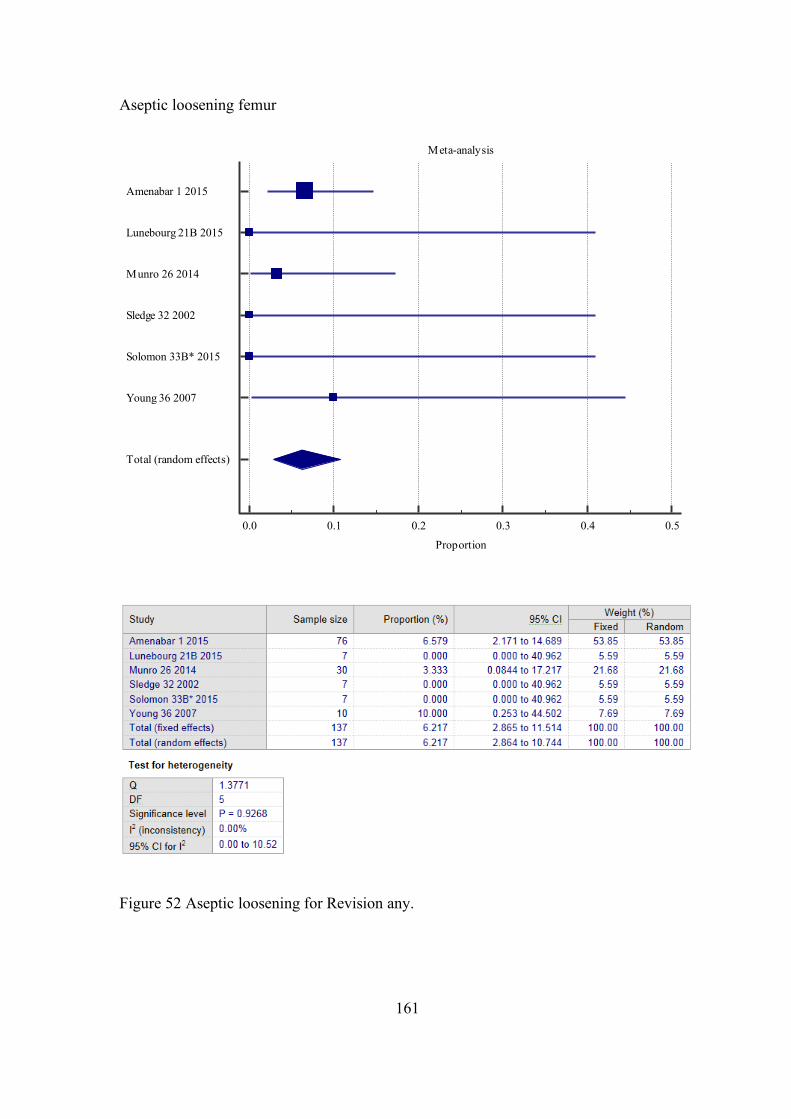
161
Aseptic loosening femur
Figure 52 Aseptic loosening for Revision any.
Meta-analysis
0.0 0.1 0.2 0.3 0.4 0.5
Proportion
Amenabar 1 2015
Lunebourg 21B 2015
Munro 26 2014
Sledge 32 2002
Solomon 33B* 2015
Young 36 2007
Total (random effects)
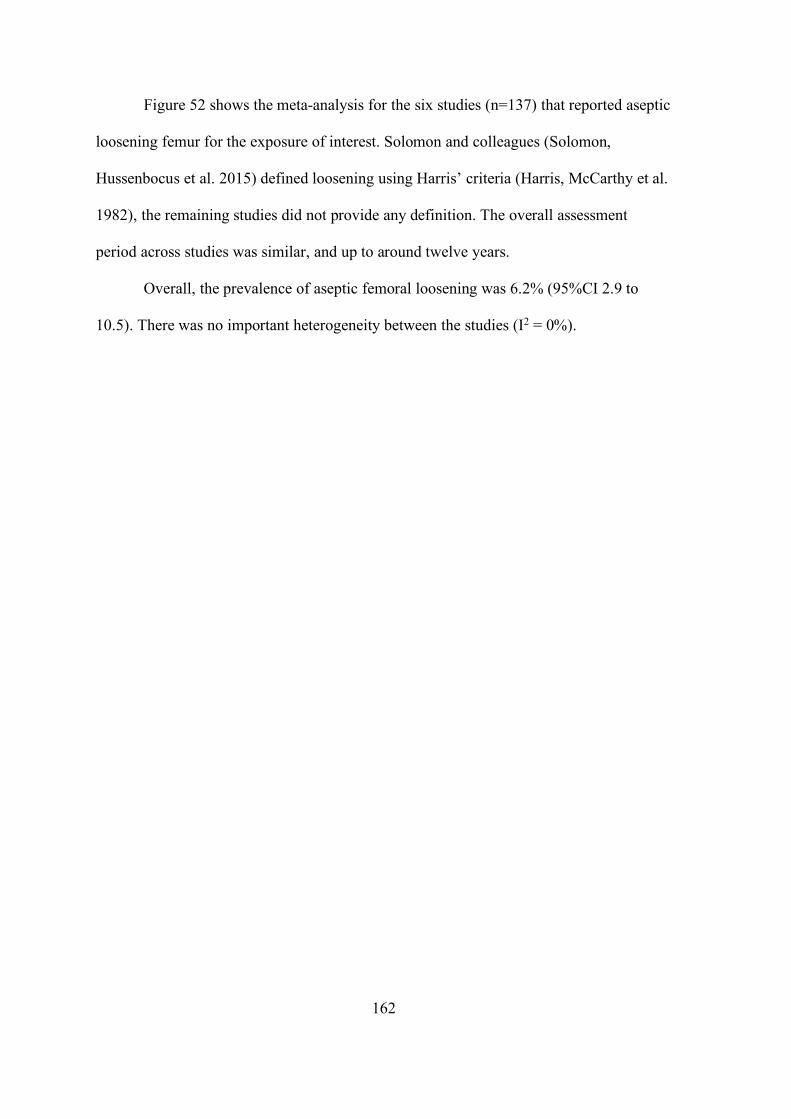
162
Figure 52 shows the meta-analysis for the six studies (n=137) that reported aseptic
loosening femur for the exposure of interest. Solomon and colleagues (Solomon,
Hussenbocus et al. 2015) defined loosening using Harris’ criteria (Harris, McCarthy et al.
1982), the remaining studies did not provide any definition. The overall assessment
period across studies was similar, and up to around twelve years.
Overall, the prevalence of aseptic femoral loosening was 6.2% (95%CI 2.9 to
10.5). There was no important heterogeneity between the studies (I2 = 0%).
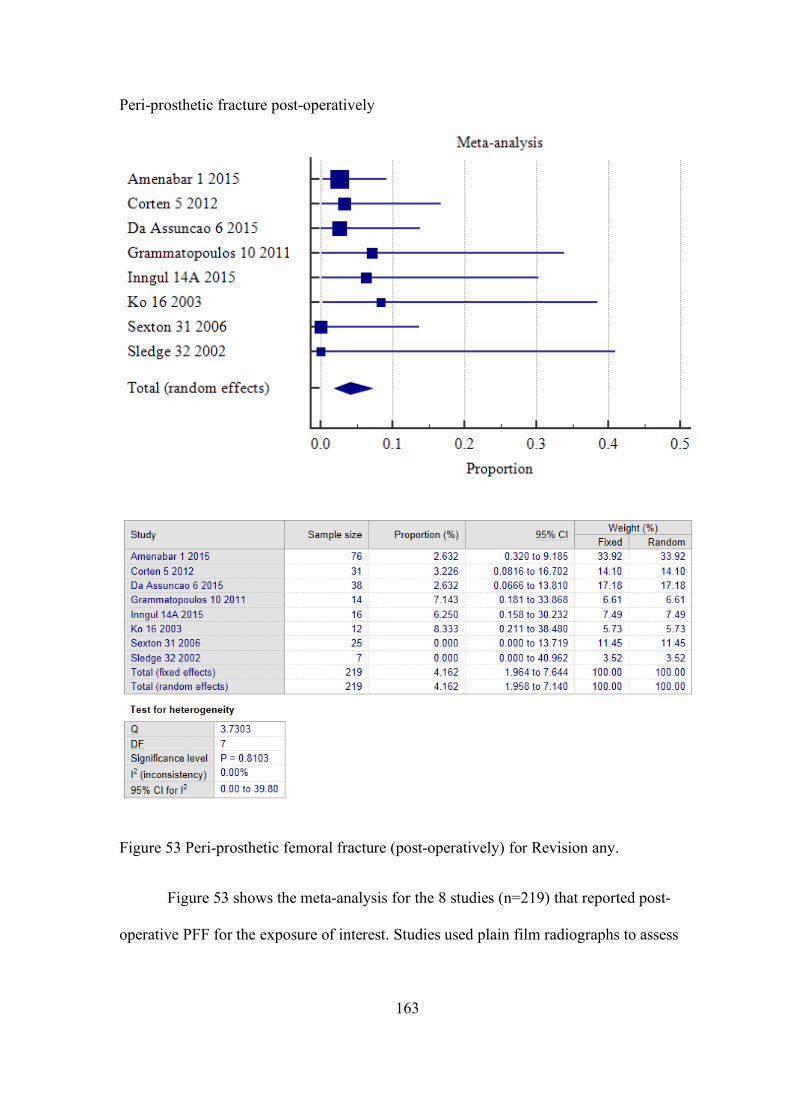
163
Peri-prosthetic fracture post-operatively
Figure 53 Peri-prosthetic femoral fracture (post-operatively) for Revision any.
Figure 53 shows the meta-analysis for the 8 studies (n=219) that reported post-
operative PFF for the exposure of interest. Studies used plain film radiographs to assess

164
for any new post-operative fracture. The overall assessment period across studies ranged
from 0 to 167 months.
Overall, the prevalence of post-operative PFF was 4.2% (95%CI 2.0 to 7.1). There was no
important heterogeneity between the studies (I2 = 0%).
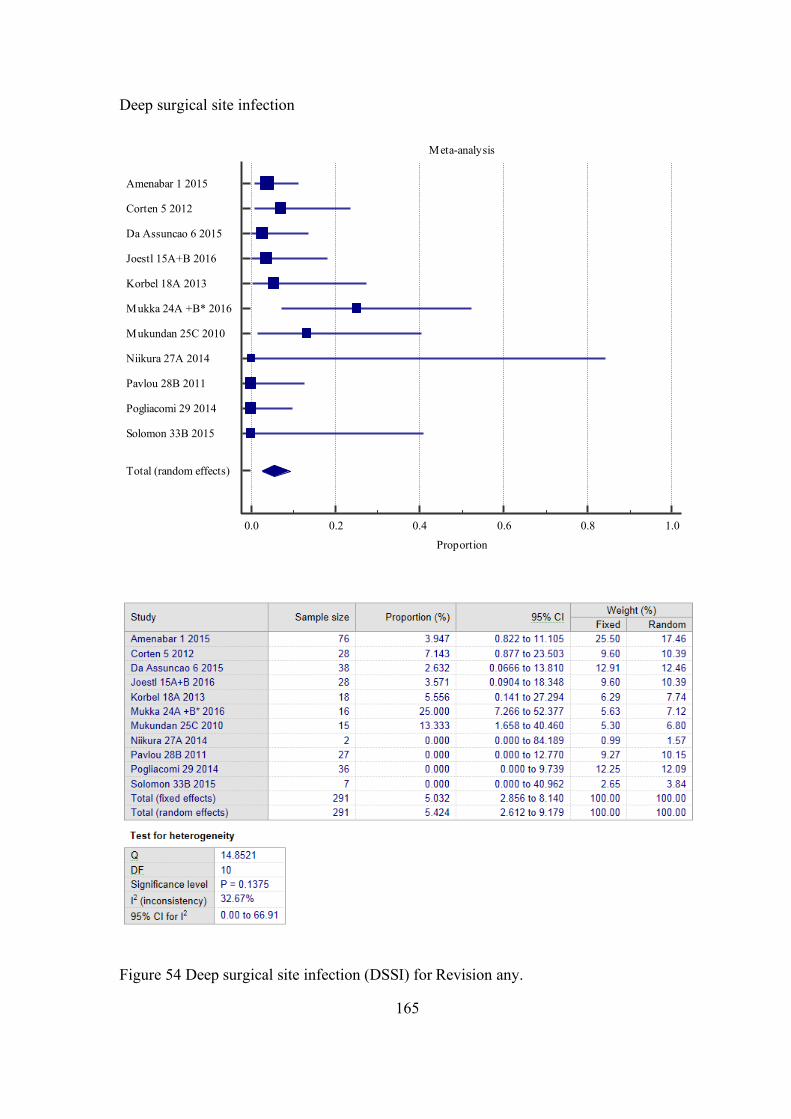
165
Deep surgical site infection
Figure 54 Deep surgical site infection (DSSI) for Revision any.
Meta-analysis
0.0 0.2 0.4 0.6 0.8 1.0
Proportion
Amenabar 1 2015
Corten 5 2012
Da Assuncao 6 2015
Joestl 15A+B 2016
Korbel 18A 2013
Mukka 24A +B* 2016
Mukundan 25C 2010
Niikura 27A 2014
Pavlou 28B 2011
Pogliacomi 29 2014
Solomon 33B 2015
Total (random effects)
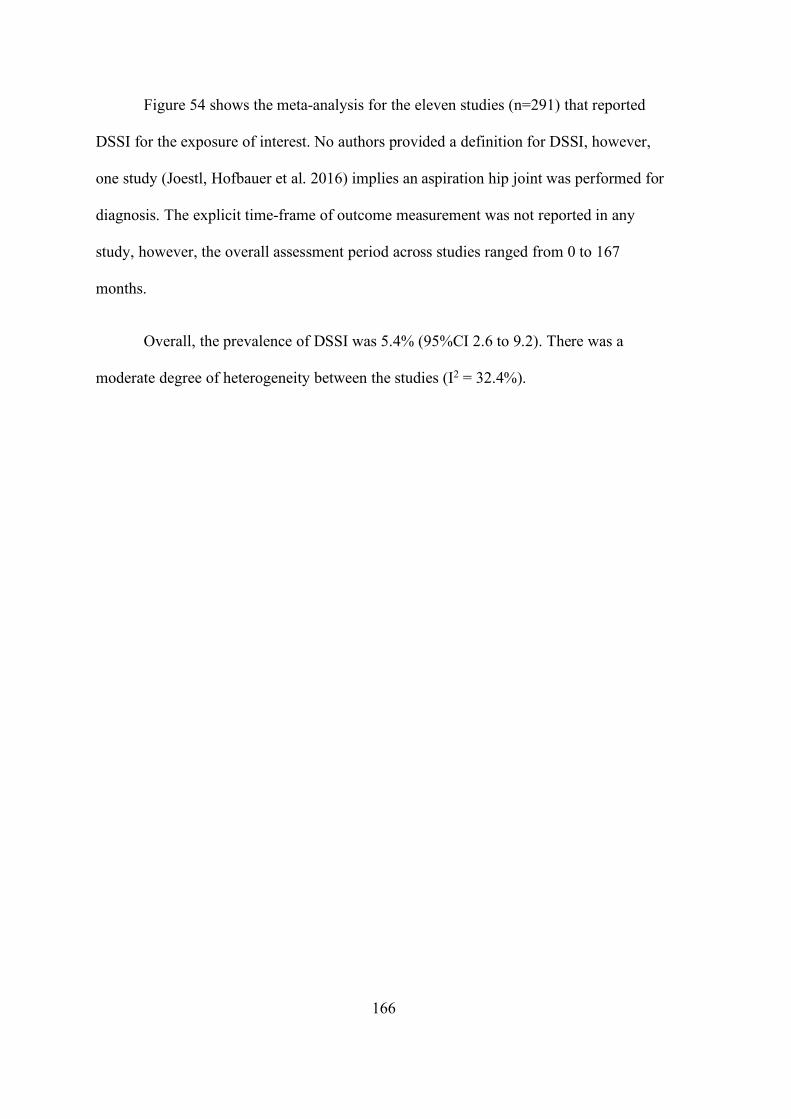
166
Figure 54 shows the meta-analysis for the eleven studies (n=291) that reported
DSSI for the exposure of interest. No authors provided a definition for DSSI, however,
one study (Joestl, Hofbauer et al. 2016) implies an aspiration hip joint was performed for
diagnosis. The explicit time-frame of outcome measurement was not reported in any
study, however, the overall assessment period across studies ranged from 0 to 167
months.
Overall, the prevalence of DSSI was 5.4% (95%CI 2.6 to 9.2). There was a
moderate degree of heterogeneity between the studies (I2 = 32.4%).
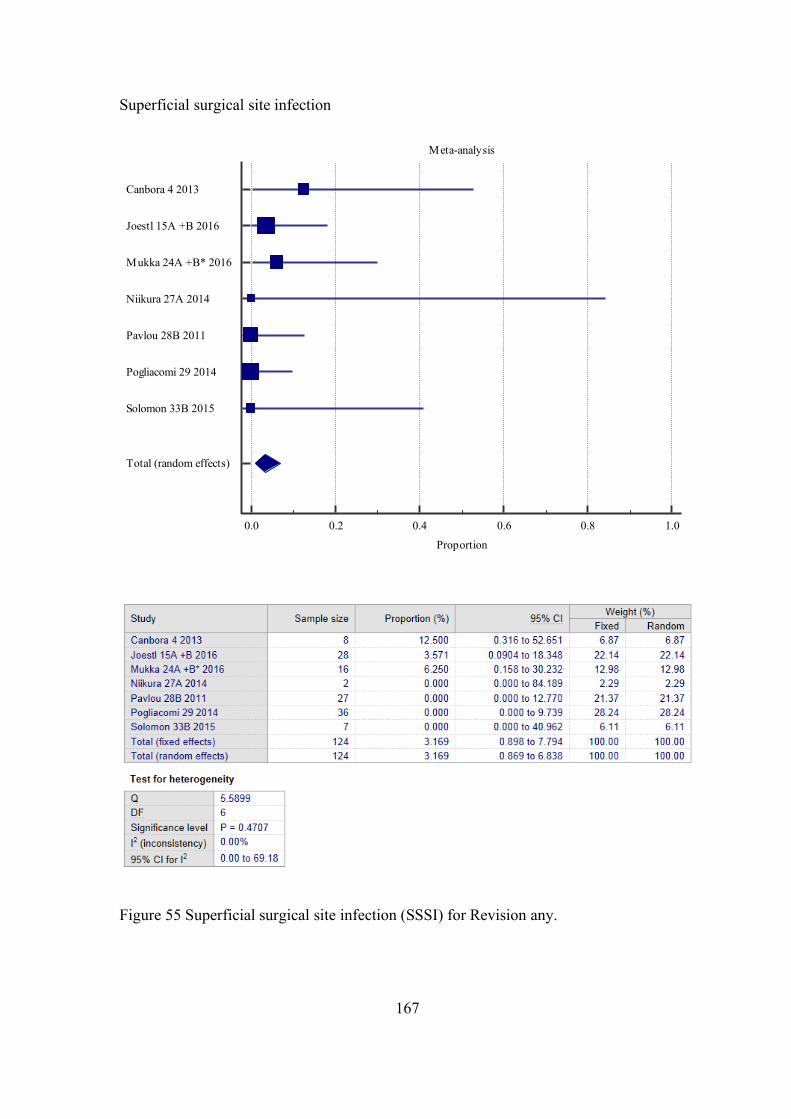
167
Superficial surgical site infection
Figure 55 Superficial surgical site infection (SSSI) for Revision any.
Meta-analysis
0.0 0.2 0.4 0.6 0.8 1.0
Proportion
Canbora 4 2013
Joestl 15A +B 2016
Mukka 24A +B* 2016
Niikura 27A 2014
Pavlou 28B 2011
Pogliacomi 29 2014
Solomon 33B 2015
Total (random effects)

168
Figure 55 shows the meta-analysis for the seven studies (n=124) that reported
SSSI for the exposure of interest. No authors provided a definition for SSSI, however,
one (Canbora, Kose et al. 2013) implies a wound swab was performed for diagnosis. The
explicit time-frame of outcome measurement was not reported in any study, however, the
overall assessment period across studies ranged from 3 months to 11 years.
Overall, the prevalence of SSSI was 3.2% (95%CI 0.9 to 7.8). There was no
important heterogeneity between the studies (I2 = 0%). Note: raw data from Mukka
24A+B (Mukka, Mellner et al. 2016) was used for this outcome.
169
Dislocation
Figure 56 Dislocation for Revision any.
Meta-analysis
0.0 0.2 0.4 0.6 0.8
Proportion
Amenabar 1 2015
Canbora 4 2013
Da Assuncao 6 2015
Garcia-Rey 9 2013
Grammatopoulos 10 2011
Joestl 15A +B 2016
Ko 16 2003
Korbel 18A 2013
Mukundan 225A+B+C 2010
Pavlou 28A 2011
Solomon 33B 2015
Young 36 2007
Total (random effects)
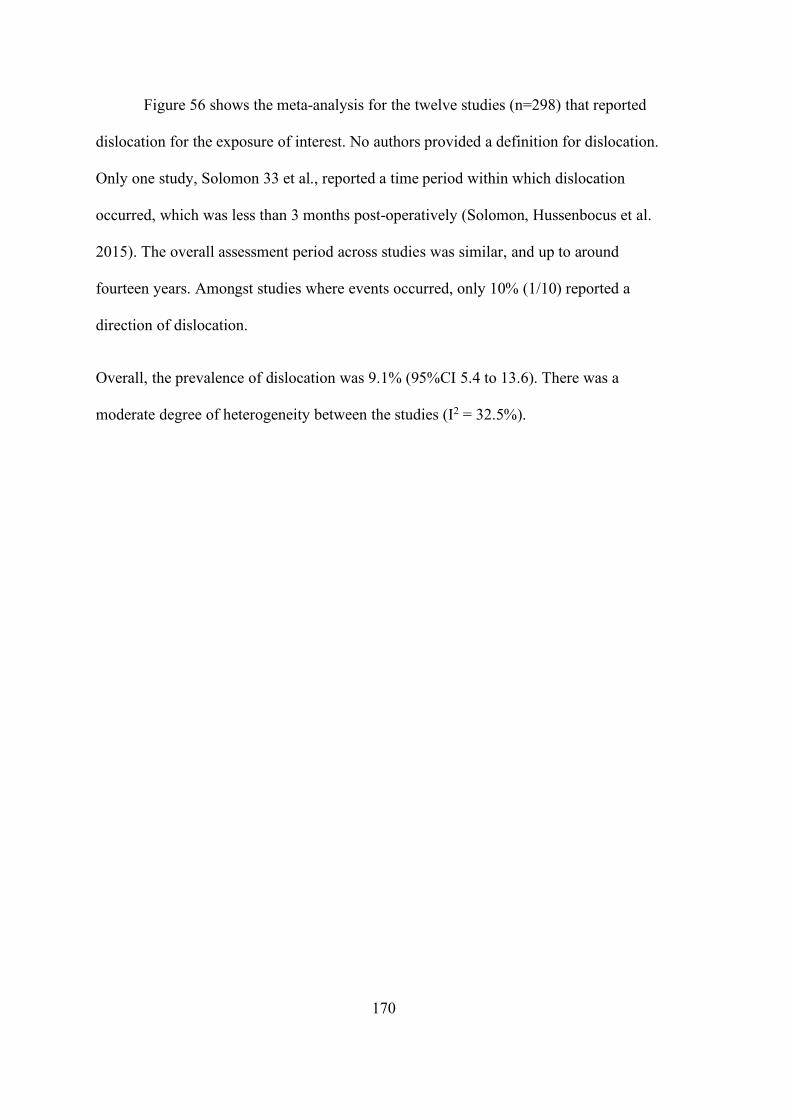
170
Figure 56 shows the meta-analysis for the twelve studies (n=298) that reported
dislocation for the exposure of interest. No authors provided a definition for dislocation.
Only one study, Solomon 33 et al., reported a time period within which dislocation
occurred, which was less than 3 months post-operatively (Solomon, Hussenbocus et al.
2015). The overall assessment period across studies was similar, and up to around
fourteen years. Amongst studies where events occurred, only 10% (1/10) reported a
direction of dislocation.
Overall, the prevalence of dislocation was 9.1% (95%CI 5.4 to 13.6). There was a
moderate degree of heterogeneity between the studies (I2 = 32.5%).
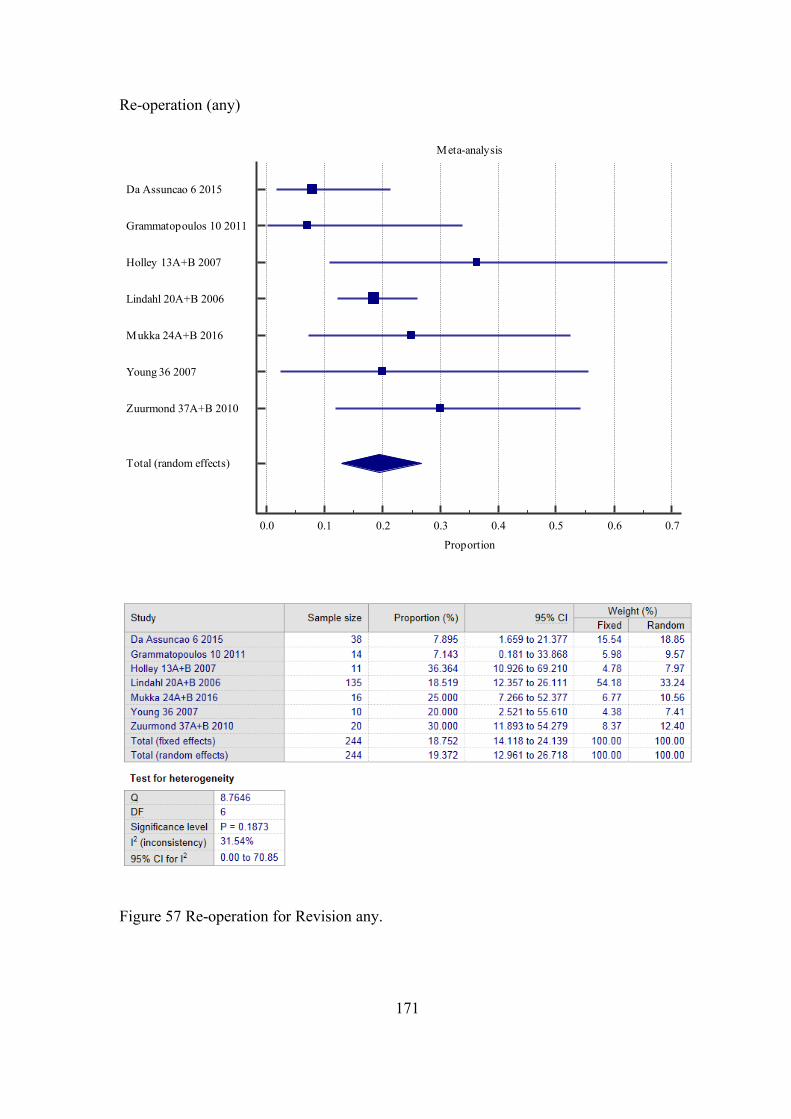
171
Re-operation (any)
Figure 57 Re-operation for Revision any.
Meta-analysis
0.0 0.1 0.2 0.3 0.4 0.5 0.6 0.7
Proportion
Da Assuncao 6 2015
Grammatopoulos 10 2011
Holley 13A+B 2007
Lindahl 20A+B 2006
Mukka 24A+B 2016
Young 36 2007
Zuurmond 37A+B 2010
Total (random effects)

172
Figure 57 shows the meta-analysis for the seven studies (n=244) that reported re-
operation for the exposure of interest. No authors provided an explicit definition nor a
time-frame for re-operation. The overall assessment period across studies was similar,
and up to around twelve years.
Overall, the prevalence of Re-operation was 19.4% (95%CI 13.0 to 26.7). There
was a low degree of heterogeneity between the studies (I2 = 31.5%).
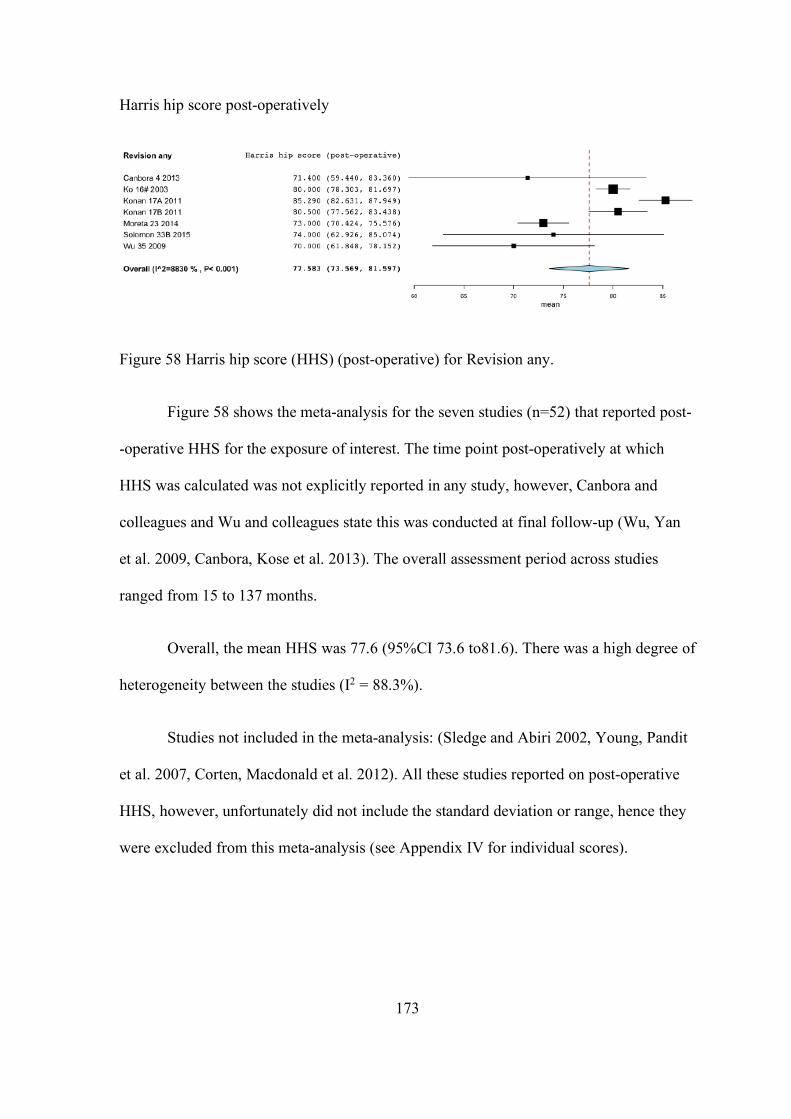
173
Harris hip score post-operatively
Figure 58 Harris hip score (HHS) (post-operative) for Revision any.
Figure 58 shows the meta-analysis for the seven studies (n=52) that reported post-
-operative HHS for the exposure of interest. The time point post-operatively at which
HHS was calculated was not explicitly reported in any study, however, Canbora and
colleagues and Wu and colleagues state this was conducted at final follow-up (Wu, Yan
et al. 2009, Canbora, Kose et al. 2013). The overall assessment period across studies
ranged from 15 to 137 months.
Overall, the mean HHS was 77.6 (95%CI 73.6 to81.6). There was a high degree of
heterogeneity between the studies (I2 = 88.3%).
Studies not included in the meta-analysis: (Sledge and Abiri 2002, Young, Pandit
et al. 2007, Corten, Macdonald et al. 2012). All these studies reported on post-operative
HHS, however, unfortunately did not include the standard deviation or range, hence they
were excluded from this meta-analysis (see Appendix IV for individual scores).
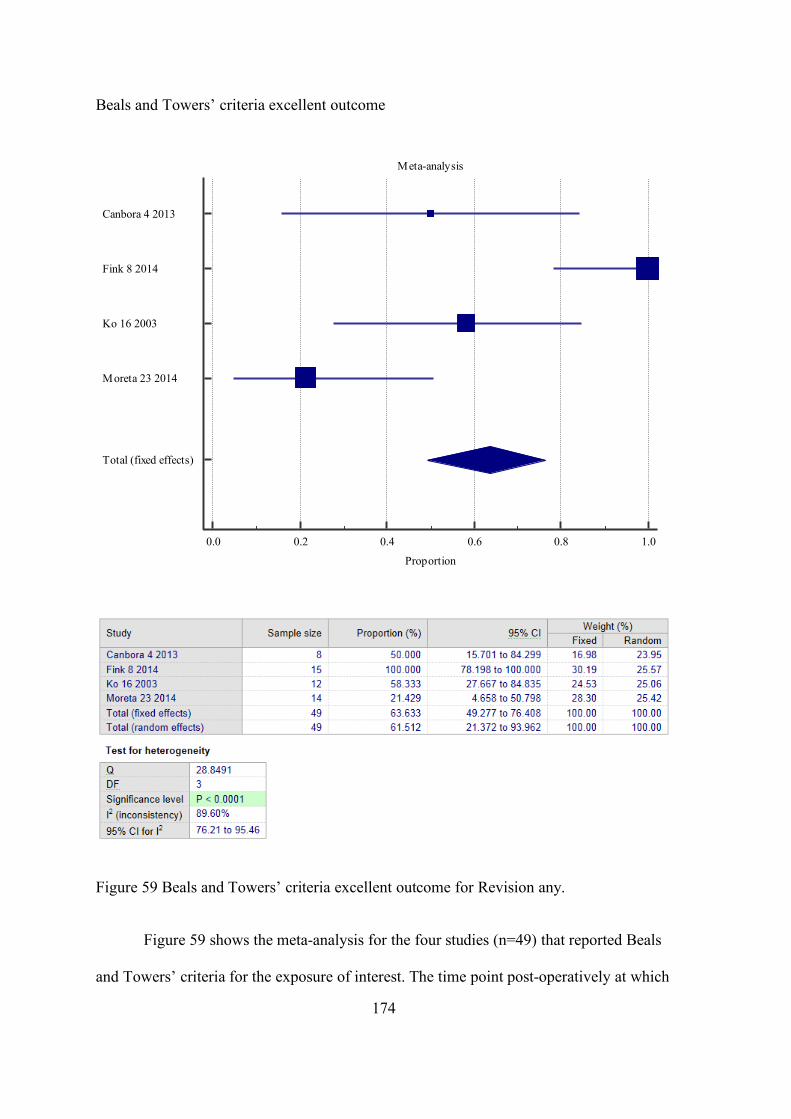
174
Beals and Towers’ criteria excellent outcome
Figure 59 Beals and Towers’ criteria excellent outcome for Revision any.
Figure 59 shows the meta-analysis for the four studies (n=49) that reported Beals
and Towers’ criteria for the exposure of interest. The time point post-operatively at which
Meta-analysis
0.0 0.2 0.4 0.6 0.8 1.0
Proportion
Canbora 4 2013
Fink 8 2014
Ko 16 2003
Moreta 23 2014
Total (fixed effects)
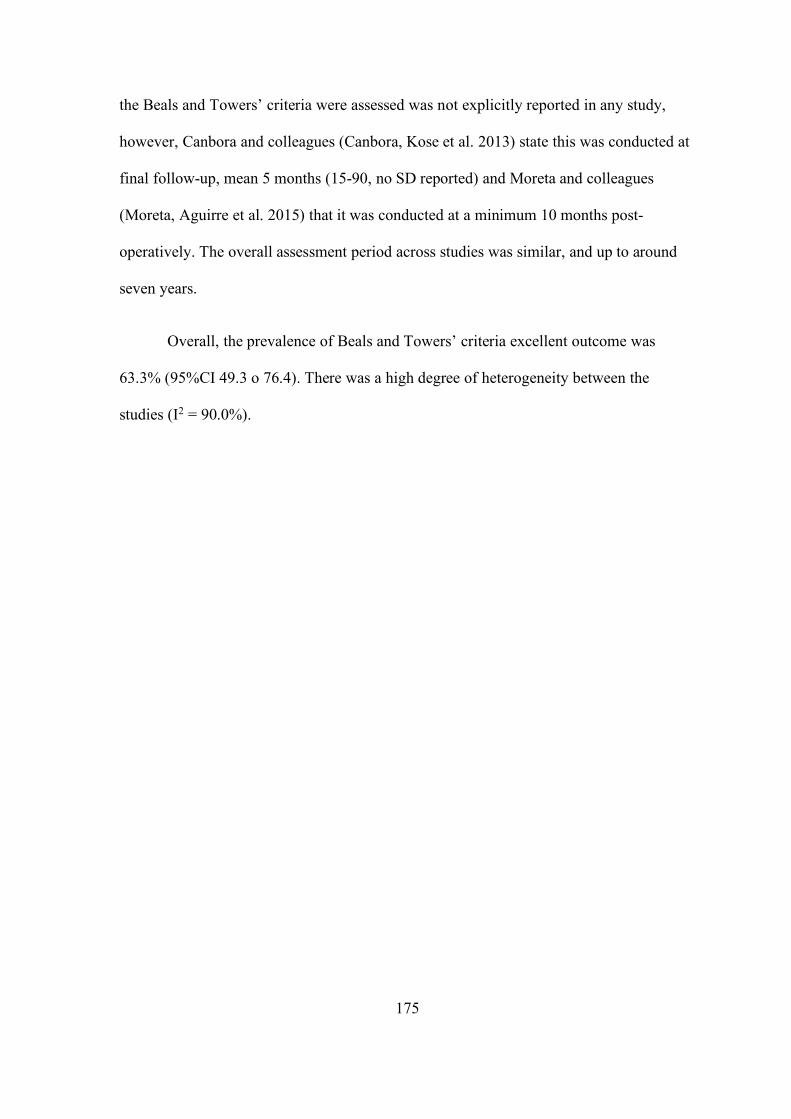
175
the Beals and Towers’ criteria were assessed was not explicitly reported in any study,
however, Canbora and colleagues (Canbora, Kose et al. 2013) state this was conducted at
final follow-up, mean 5 months (15-90, no SD reported) and Moreta and colleagues
(Moreta, Aguirre et al. 2015) that it was conducted at a minimum 10 months post-
operatively. The overall assessment period across studies was similar, and up to around
seven years.
Overall, the prevalence of Beals and Towers’ criteria excellent outcome was
63.3% (95%CI 49.3 o 76.4). There was a high degree of heterogeneity between the
studies (I2 = 90.0%).
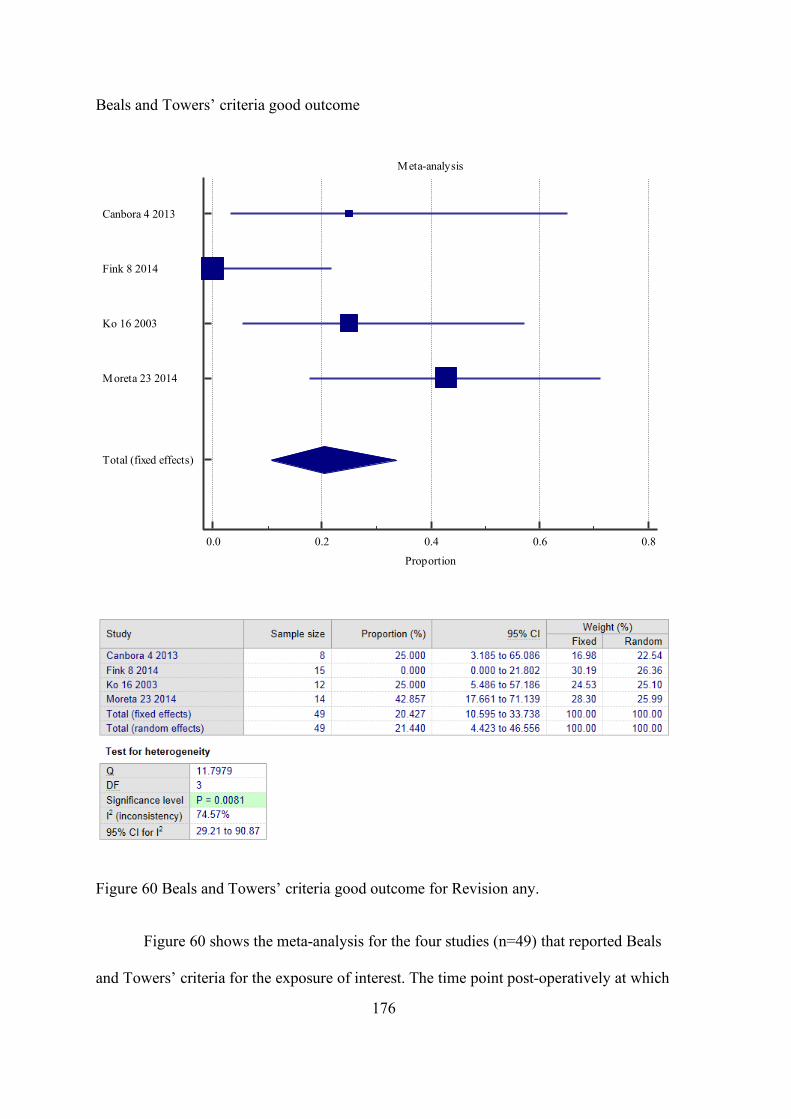
176
Beals and Towers’ criteria good outcome
Figure 60 Beals and Towers’ criteria good outcome for Revision any.
Figure 60 shows the meta-analysis for the four studies (n=49) that reported Beals
and Towers’ criteria for the exposure of interest. The time point post-operatively at which
Meta-analysis
0.0 0.2 0.4 0.6 0.8
Proportion
Canbora 4 2013
Fink 8 2014
Ko 16 2003
Moreta 23 2014
Total (fixed effects)
177
the Beals and Towers’ criteria were assessed was not explicitly reported in any study,
however, Canbora and colleagues (Canbora, Kose et al. 2013) states this was conducted at
final follow-up, mean 5 months (15-90, no SD reported) and Moreta and colleagues
(Moreta, Aguirre et al. 2015) that it was conducted at minimum 10 months post-
operatively. The overall assessment period across studies was similar, and up to around
seven years.
Overall, the prevalence of Beals and Towers’ criteria good outcome was 20.4%
(95%CI 10.6 to 33.7). There was a moderate degree of heterogeneity between the studies
(I2 = 74.6%).

178
Beals and Towers’ criteria poor outcome
Figure 61 Beals and Towers’ criteria poor outcome for Revision any.
Figure 61 shows the meta-analysis for the four studies (n=49) that reported Beals
and Towers’ criteria for the exposure of interest. The time point post-operatively at which
Meta-analysis
0.0 0.1 0.2 0.3 0.4 0.5 0.6 0.7
Proportion
Canbora 4 2013
Fink 8 2014
Ko 16 2003
Moreta 23 2014
Total (fixed effects)
179
the Beals and Towers’ criteria were assessed was not explicitly reported in any study,
however, Canbora and colleagues (Canbora, Kose et al. 2013) state this was conducted at
final follow-up, mean 5 months (15-90, no SD reported) and Moreta and colleagues
(Moreta, Aguirre et al. 2015) that it was conducted at minimum 10 months post-
operatively. The overall assessment period across studies was similar, and up to around
seven years.
Overall, the prevalence of Beals and Towers’ criteria poor outcome was 17.1%
(95%CI 8.2 to 30.0). There was a moderate degree of heterogeneity between the studies
(I2 = 68.0%).
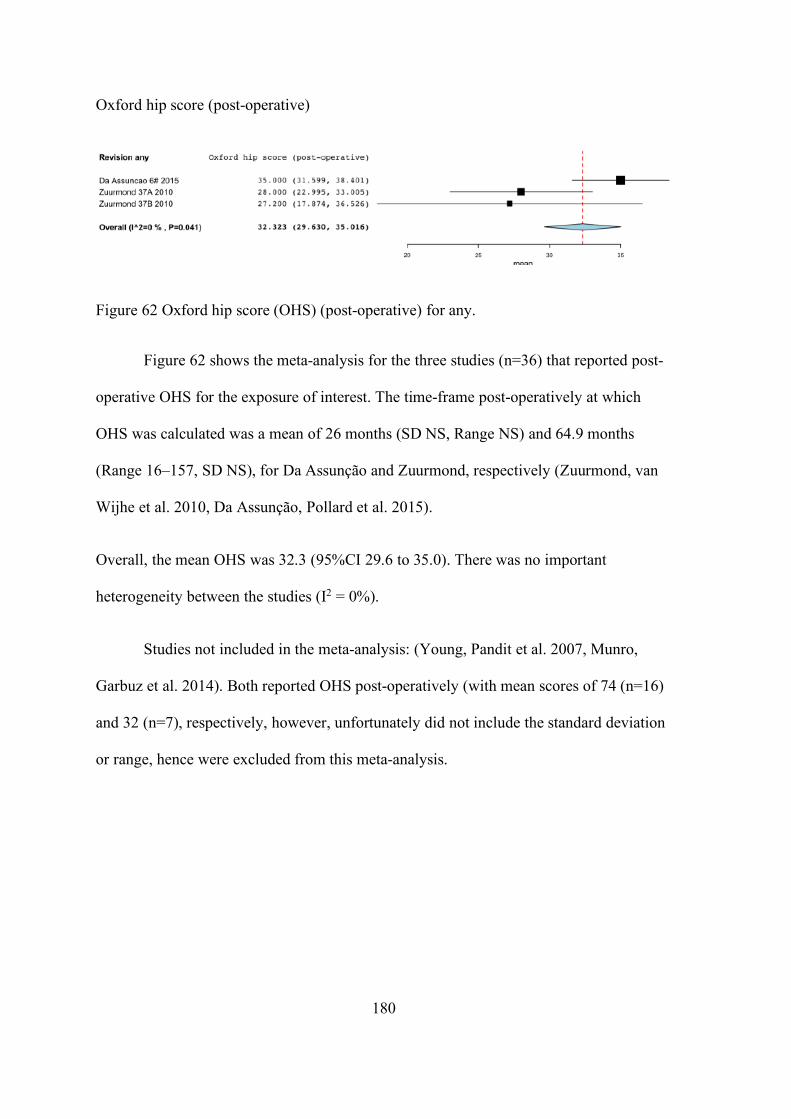
180
Oxford hip score (post-operative)
Figure 62 Oxford hip score (OHS) (post-operative) for any.
Figure 62 shows the meta-analysis for the three studies (n=36) that reported post-
operative OHS for the exposure of interest. The time-frame post-operatively at which
OHS was calculated was a mean of 26 months (SD NS, Range NS) and 64.9 months
(Range 16–157, SD NS), for Da Assunção and Zuurmond, respectively (Zuurmond, van
Wijhe et al. 2010, Da Assunção, Pollard et al. 2015).
Overall, the mean OHS was 32.3 (95%CI 29.6 to 35.0). There was no important
heterogeneity between the studies (I2 = 0%).
Studies not included in the meta-analysis: (Young, Pandit et al. 2007, Munro,
Garbuz et al. 2014). Both reported OHS post-operatively (with mean scores of 74 (n=16)
and 32 (n=7), respectively, however, unfortunately did not include the standard deviation
or range, hence were excluded from this meta-analysis.
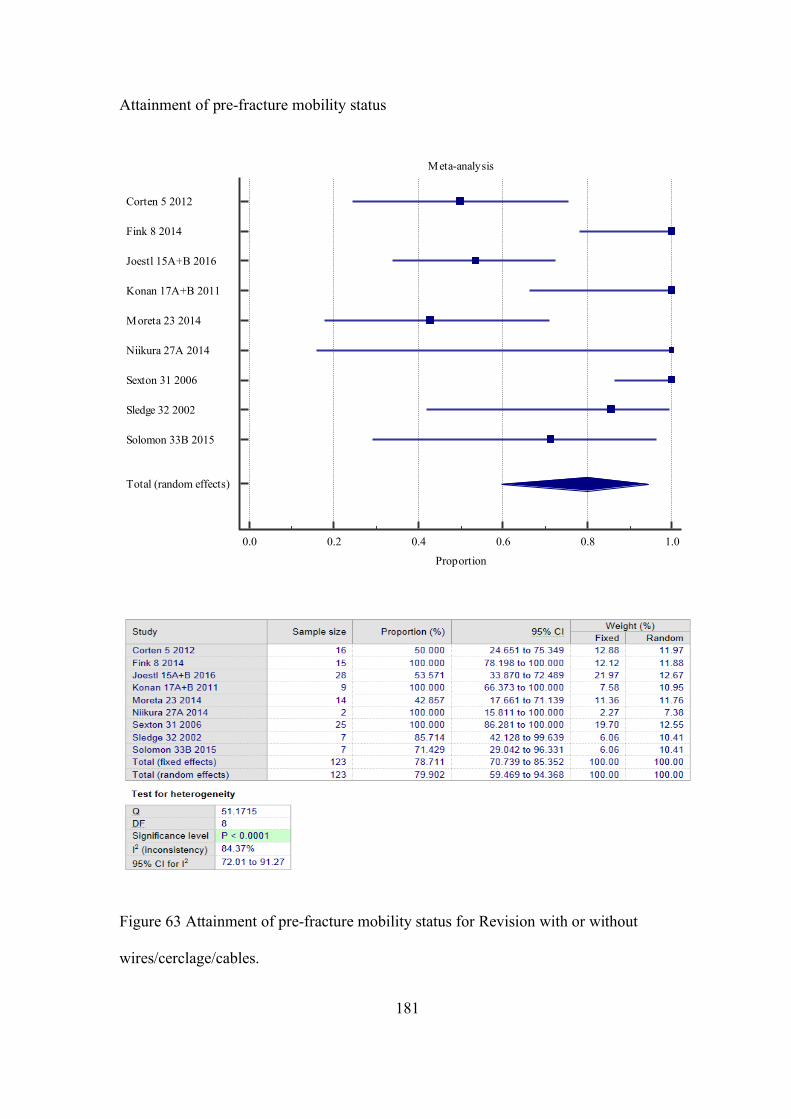
181
Attainment of pre-fracture mobility status
Figure 63 Attainment of pre-fracture mobility status for Revision with or without
wires/cerclage/cables.
Meta-analysis
0.0 0.2 0.4 0.6 0.8 1.0
Proportion
Corten 5 2012
Fink 8 2014
Joestl 15A+B 2016
Konan 17A+B 2011
Moreta 23 2014
Niikura 27A 2014
Sexton 31 2006
Sledge 32 2002
Solomon 33B 2015
Total (random effects)
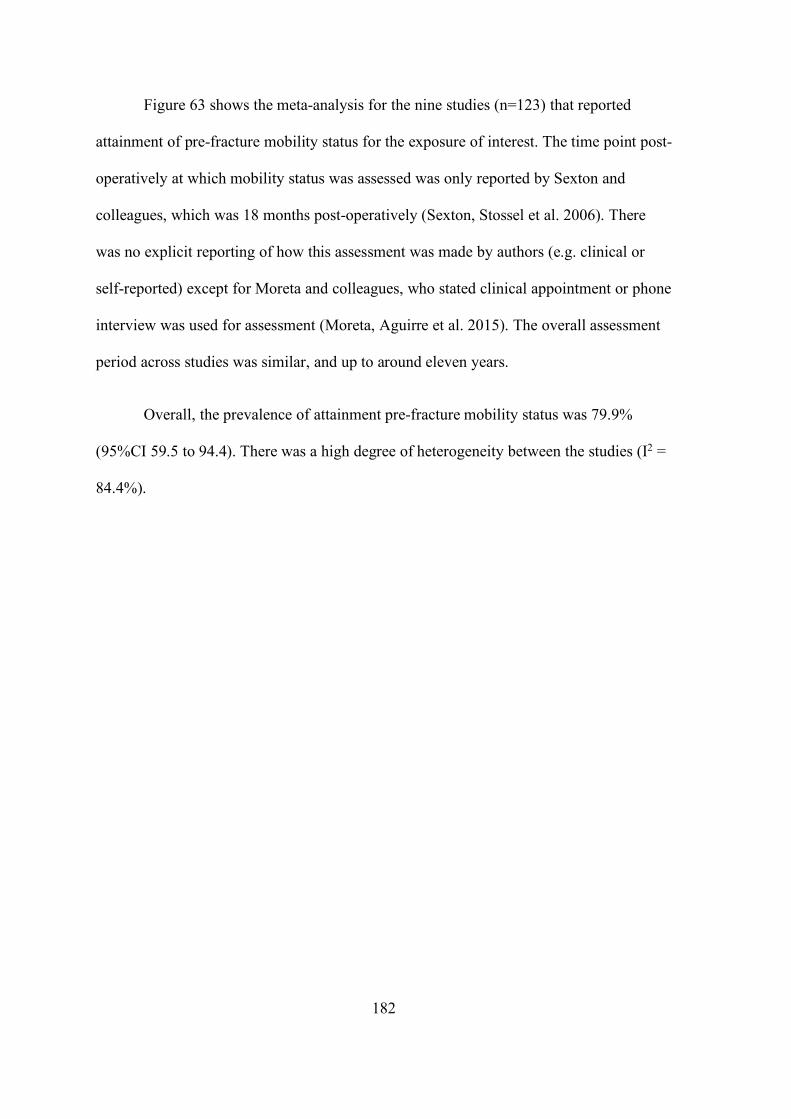
182
Figure 63 shows the meta-analysis for the nine studies (n=123) that reported
attainment of pre-fracture mobility status for the exposure of interest. The time point post-
operatively at which mobility status was assessed was only reported by Sexton and
colleagues, which was 18 months post-operatively (Sexton, Stossel et al. 2006). There
was no explicit reporting of how this assessment was made by authors (e.g. clinical or
self-reported) except for Moreta and colleagues, who stated clinical appointment or phone
interview was used for assessment (Moreta, Aguirre et al. 2015). The overall assessment
period across studies was similar, and up to around eleven years.
Overall, the prevalence of attainment pre-fracture mobility status was 79.9%
(95%CI 59.5 to 94.4). There was a high degree of heterogeneity between the studies (I2 =
84.4%).
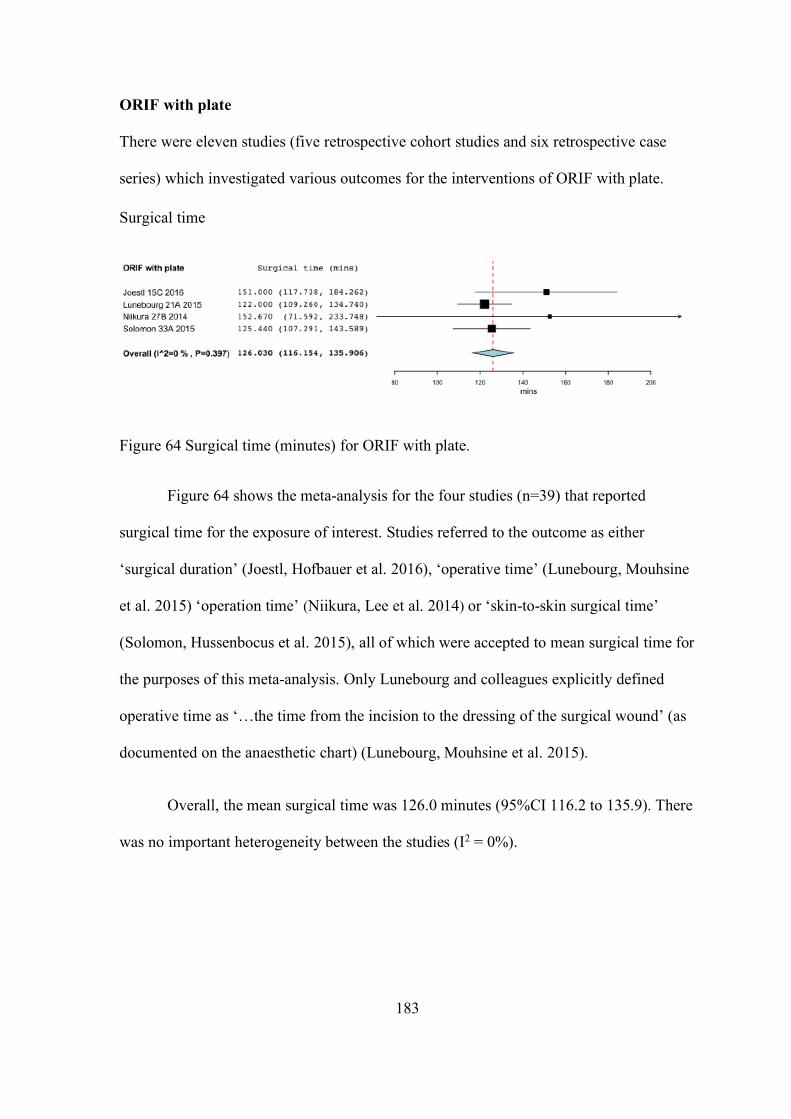
183
ORIF with plate
There were eleven studies (five retrospective cohort studies and six retrospective case
series) which investigated various outcomes for the interventions of ORIF with plate.
Surgical time
Figure 64 Surgical time (minutes) for ORIF with plate.
Figure 64 shows the meta-analysis for the four studies (n=39) that reported
surgical time for the exposure of interest. Studies referred to the outcome as either
‘surgical duration’ (Joestl, Hofbauer et al. 2016), ‘operative time’ (Lunebourg, Mouhsine
et al. 2015) ‘operation time’ (Niikura, Lee et al. 2014) or ‘skin-to-skin surgical time’
(Solomon, Hussenbocus et al. 2015), all of which were accepted to mean surgical time for
the purposes of this meta-analysis. Only Lunebourg and colleagues explicitly defined
operative time as ‘…the time from the incision to the dressing of the surgical wound’ (as
documented on the anaesthetic chart) (Lunebourg, Mouhsine et al. 2015).
Overall, the mean surgical time was 126.0 minutes (95%CI 116.2 to 135.9). There
was no important heterogeneity between the studies (I2 = 0%).
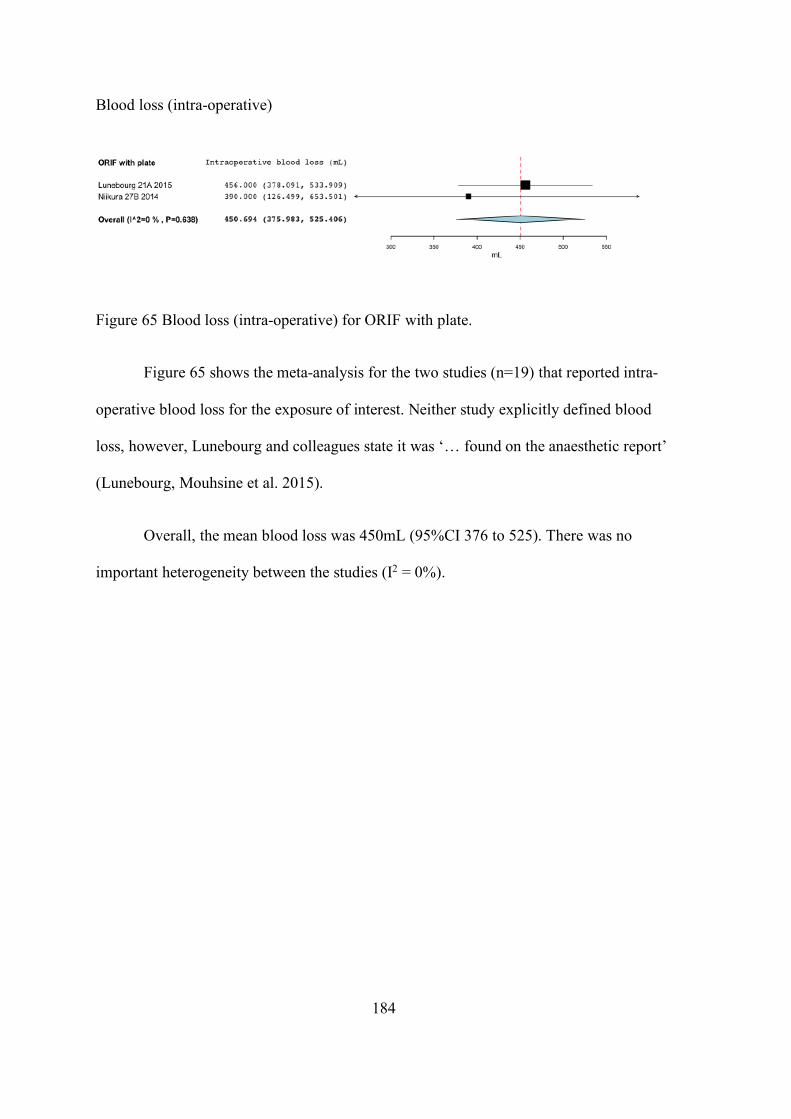
184
Blood loss (intra-operative)
Figure 65 Blood loss (intra-operative) for ORIF with plate.
Figure 65 shows the meta-analysis for the two studies (n=19) that reported intra-
operative blood loss for the exposure of interest. Neither study explicitly defined blood
loss, however, Lunebourg and colleagues state it was ‘… found on the anaesthetic report’
(Lunebourg, Mouhsine et al. 2015).
Overall, the mean blood loss was 450mL (95%CI 376 to 525). There was no
important heterogeneity between the studies (I2 = 0%).
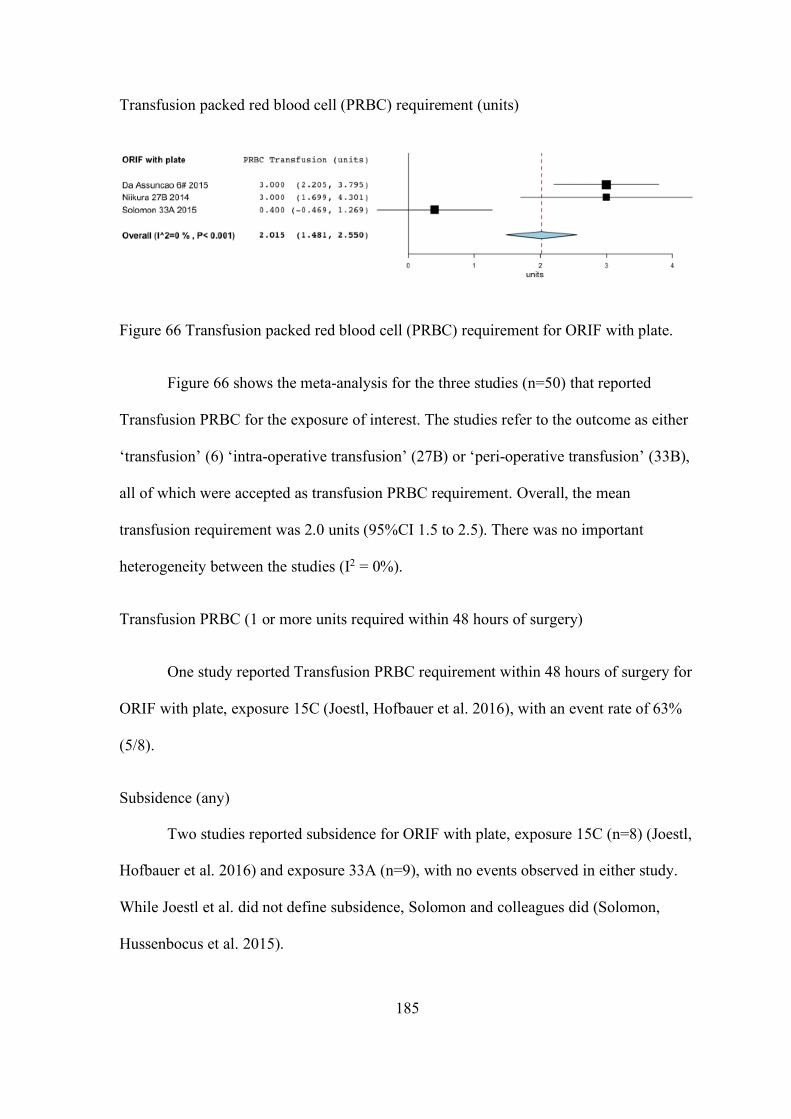
185
Transfusion packed red blood cell (PRBC) requirement (units)
Figure 66 Transfusion packed red blood cell (PRBC) requirement for ORIF with plate.
Figure 66 shows the meta-analysis for the three studies (n=50) that reported
Transfusion PRBC for the exposure of interest. The studies refer to the outcome as either
‘transfusion’ (6) ‘intra-operative transfusion’ (27B) or ‘peri-operative transfusion’ (33B),
all of which were accepted as transfusion PRBC requirement. Overall, the mean
transfusion requirement was 2.0 units (95%CI 1.5 to 2.5). There was no important
heterogeneity between the studies (I2 = 0%).
Transfusion PRBC (1 or more units required within 48 hours of surgery)
One study reported Transfusion PRBC requirement within 48 hours of surgery for
ORIF with plate, exposure 15C (Joestl, Hofbauer et al. 2016), with an event rate of 63%
(5/8).
Subsidence (any)
Two studies reported subsidence for ORIF with plate, exposure 15C (n=8) (Joestl,
Hofbauer et al. 2016) and exposure 33A (n=9), with no events observed in either study.
While Joestl et al. did not define subsidence, Solomon and colleagues did (Solomon,
Hussenbocus et al. 2015).
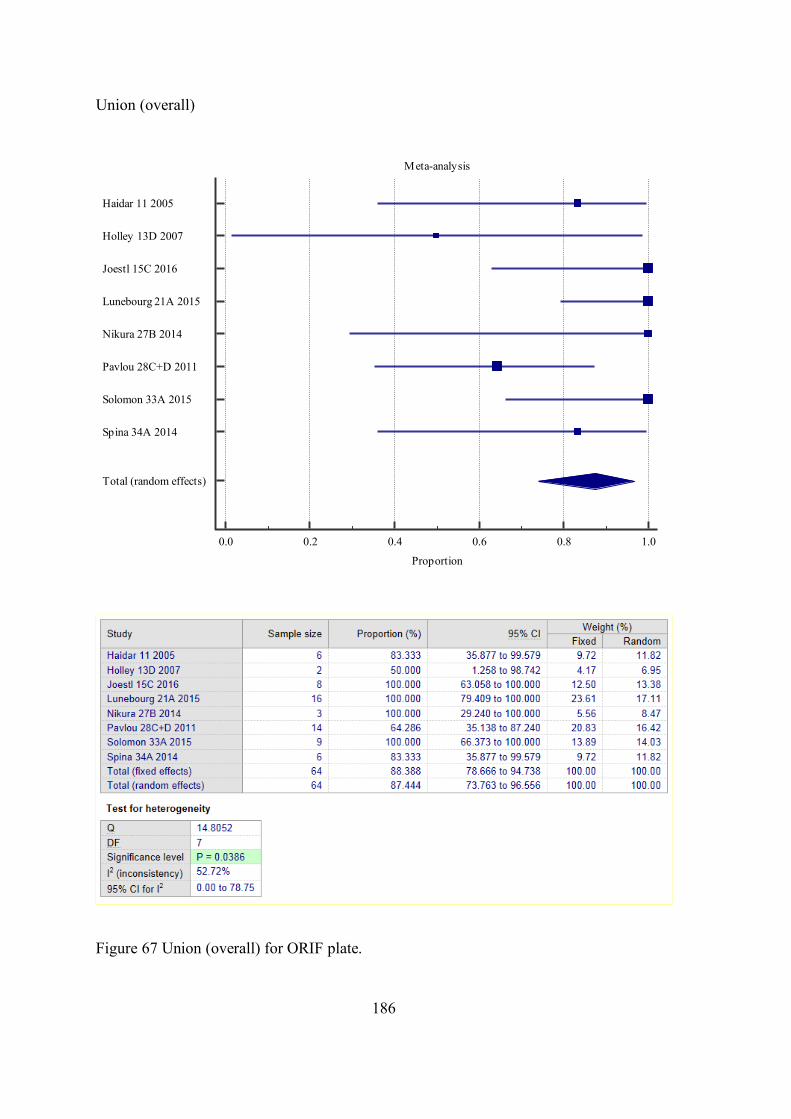
186
Union (overall)
Figure 67 Union (overall) for ORIF plate.
Meta-analysis
0.0 0.2 0.4 0.6 0.8 1.0
Proportion
Haidar 11 2005
Holley 13D 2007
Joestl 15C 2016
Lunebourg 21A 2015
Nikura 27B 2014
Pavlou 28C+D 2011
Solomon 33A 2015
Spina 34A 2014
Total (random effects)
187
Figure 67 shows the meta-analysis for the nine studies (n=64) that reported union
(overall) for exposure of interest. 3/8 (37.5%) studies explicitly defined union (Table 11)
and the same proportion additionally considered clinical union. One-quarter (2/8) of
studies reported a time to union. The overall assessment period across studies was similar,
and up to around eleven years.
Overall, the prevalence of union was 87.4% (95%CI 73.8 to 96.6). There was a
moderate degree of heterogeneity between the studies (I2 = 52.7%).
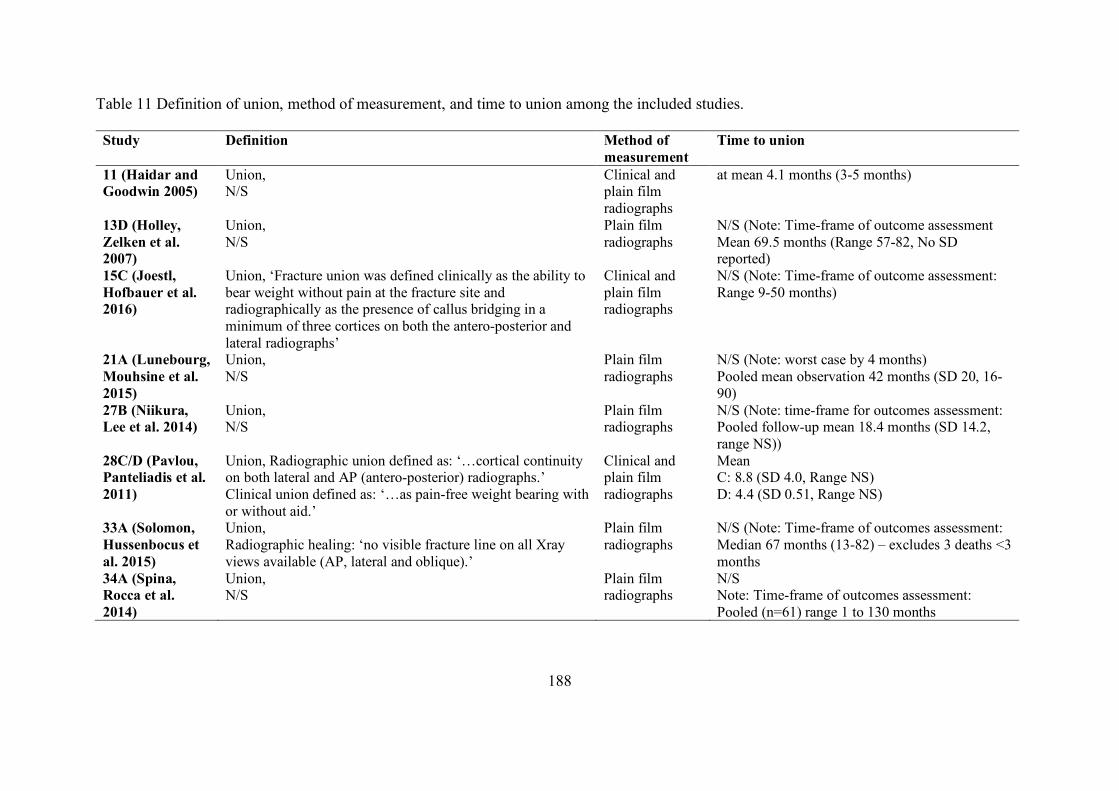
188
Table 11 Definition of union, method of measurement, and time to union among the included studies.
Study Definition Method of measurement
Time to union
11 (Haidar and Goodwin 2005)
Union, N/S
Clinical and plain film radiographs
at mean 4.1 months (3-5 months)
13D (Holley, Zelken et al. 2007)
Union, N/S
Plain film radiographs
N/S (Note: Time-frame of outcome assessment Mean 69.5 months (Range 57-82, No SD reported)
15C (Joestl, Hofbauer et al. 2016)
Union, ‘Fracture union was defined clinically as the ability to bear weight without pain at the fracture site and radiographically as the presence of callus bridging in a minimum of three cortices on both the antero-posterior and lateral radiographs’
Clinical and plain film radiographs
N/S (Note: Time-frame of outcome assessment: Range 9-50 months)
21A (Lunebourg, Mouhsine et al. 2015)
Union, N/S
Plain film radiographs
N/S (Note: worst case by 4 months) Pooled mean observation 42 months (SD 20, 16-90)
27B (Niikura, Lee et al. 2014)
Union, N/S
Plain film radiographs
N/S (Note: time-frame for outcomes assessment: Pooled follow-up mean 18.4 months (SD 14.2, range NS))
28C/D (Pavlou, Panteliadis et al. 2011)
Union, Radiographic union defined as: ‘…cortical continuity on both lateral and AP (antero-posterior) radiographs.’ Clinical union defined as: ‘…as pain-free weight bearing with or without aid.’
Clinical and plain film radiographs
Mean C: 8.8 (SD 4.0, Range NS) D: 4.4 (SD 0.51, Range NS)
33A (Solomon, Hussenbocus et al. 2015)
Union, Radiographic healing: ‘no visible fracture line on all Xray views available (AP, lateral and oblique).’
Plain film radiographs
N/S (Note: Time-frame of outcomes assessment: Median 67 months (13-82) – excludes 3 deaths <3 months
34A (Spina, Rocca et al. 2014)
Union, N/S
Plain film radiographs
N/S Note: Time-frame of outcomes assessment: Pooled (n=61) range 1 to 130 months
189
Non-union
One study reported non-union for ORIF with plate, exposure 28C and 28D, with a
prevalence of 40% (4/10) and 25% (1/4), respectively. Pavlou and colleagues defined
non-union as ‘Failure of a fracture to unite 12 months following fixation…’ (Pavlou,
Panteliadis et al. 2011).
Femoral osteolysis
One study reported femoral osteolysis for ORIF with plate, exposure 33A (n=9)
(Solomon, Hussenbocus et al. 2015), with no events observed. Femoral osteolysis was
defined as: a greater than 3mm diameter nonlinear demarcated lesion (recorded for each
Gruen zone) (Solomon, Hussenbocus et al. 2015), however, no time-frame was stipulated.
The overall assessment period across studies was similar, and up to around seven years.
Loss of reduction (fracture)
One study reported loss of reduction (fracture) for ORIF with plate, exposure 27B
(n=3) (Niikura, Lee et al. 2014), with no events observed. No explicit definition of loss of
reduction was reported.
Malunion
Two studies reported malunion for ORIF with plate, exposure 21A (Lunebourg,
Mouhsine et al. 2015) and 27B (Niikura, Lee et al. 2014), with event rates of 0/16 (0%) and
0/3 (0%), respectively. Malunion was defined by both authors as any angular deformity
greater than 5° (in any plane).

190
Length of stay
One study reported length of stay for ORIF with plate, exposure 15C (n=8),
(Joestl, Hofbauer et al. 2016) with a mean length of stay 26 days (SD 13). Joestl et al.
specifies ‘hospital’ length of stay.
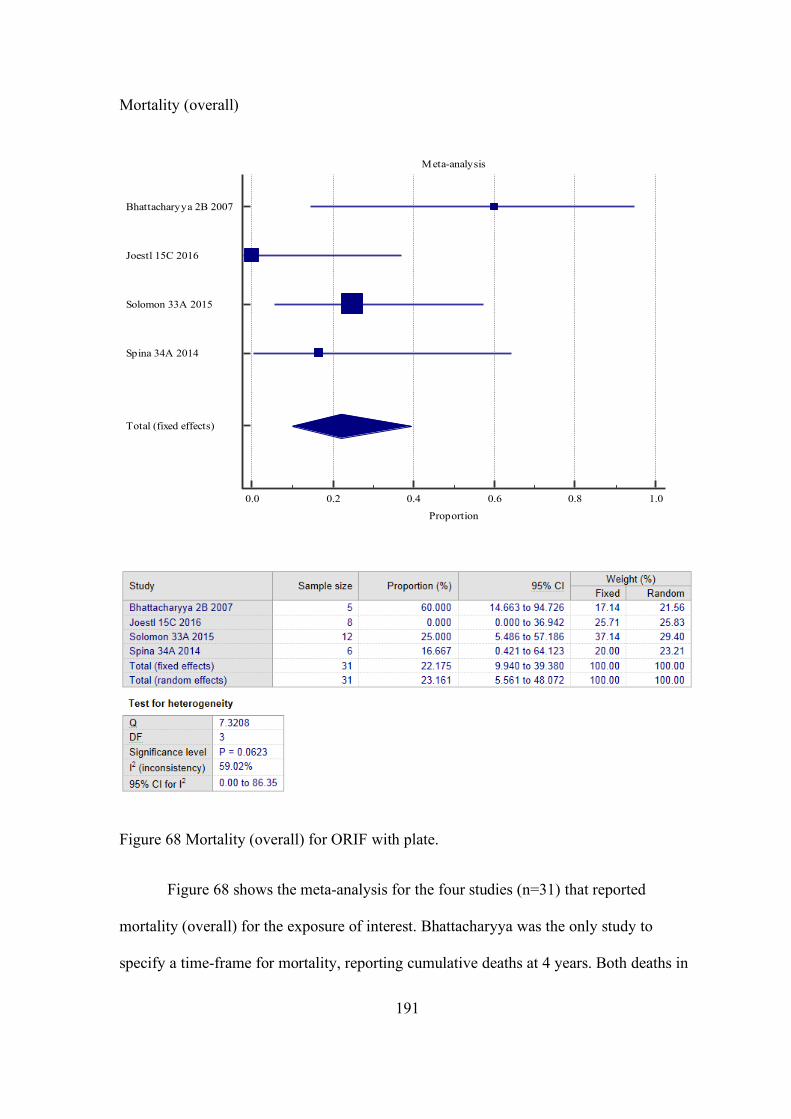
191
Mortality (overall)
Figure 68 Mortality (overall) for ORIF with plate.
Figure 68 shows the meta-analysis for the four studies (n=31) that reported
mortality (overall) for the exposure of interest. Bhattacharyya was the only study to
specify a time-frame for mortality, reporting cumulative deaths at 4 years. Both deaths in
Meta-analysis
0.0 0.2 0.4 0.6 0.8 1.0
Proportion
Bhattacharyya 2B 2007
Joestl 15C 2016
Solomon 33A 2015
Spina 34A 2014
Total (fixed effects)
192
the 33A Solomon study occurred within three months post-operatively (Solomon,
Hussenbocus et al. 2015). The overall assessment period across the remaining studies was
9-50 months (Joestl, Hofbauer et al. 2016) and 1-130 months (Spina, Rocca et al. 2014).
Overall, the prevalence of mortality was 22.2% (95%CI 9.9 to 39.4). There was a
moderate degree of heterogeneity between the studies (I2 = 59.0%). In studies where
patients were excluded based on mortality, either directly, e.g. mortality within three
months post-operatively OR in-directly, e.g. where minimum follow-up periods were
applied to exclusion criteria and reason for not reaching this time period was mortality,
the patients were included in the meta-analysis.
Intra-operative mortality
One study reported intra-operative mortality for ORIF with plate, exposure 27B
(n=3) (Niikura, Lee et al. 2014), with no events observed.
Aseptic loosening femur
One study reported aseptic loosening femur for ORIF with plate, exposure 33A
(n=9), with no events observed (Solomon, Hussenbocus et al. 2015). The term femoral
loosening was used by Solomon and colleagues defined it using Harris’ criteria (Harris,
McCarthy et al. 1982), however, no time-frame was stipulated (Solomon, Hussenbocus et
al. 2015). The overall assessment period was up to around seven years (excluding deaths
within 3 months).
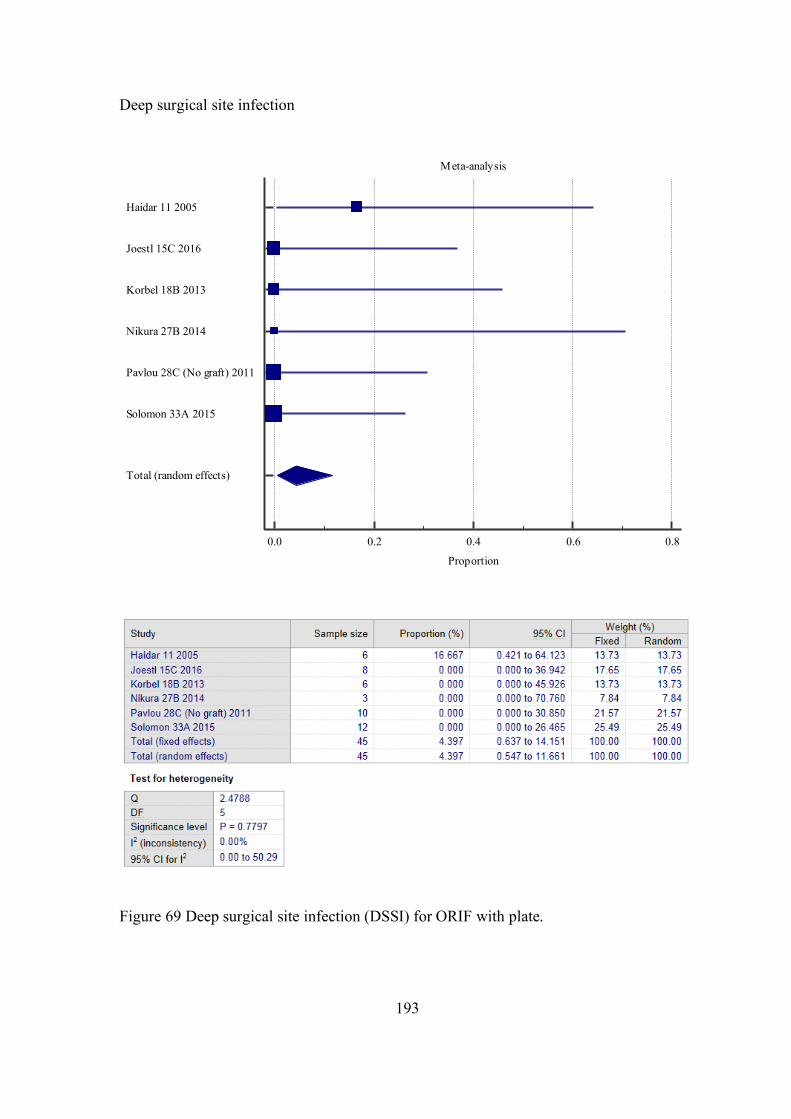
193
Deep surgical site infection
Figure 69 Deep surgical site infection (DSSI) for ORIF with plate.
Meta-analysis
0.0 0.2 0.4 0.6 0.8
Proportion
Haidar 11 2005
Joestl 15C 2016
Korbel 18B 2013
Nikura 27B 2014
Pavlou 28C (No graft) 2011
Solomon 33A 2015
Total (random effects)
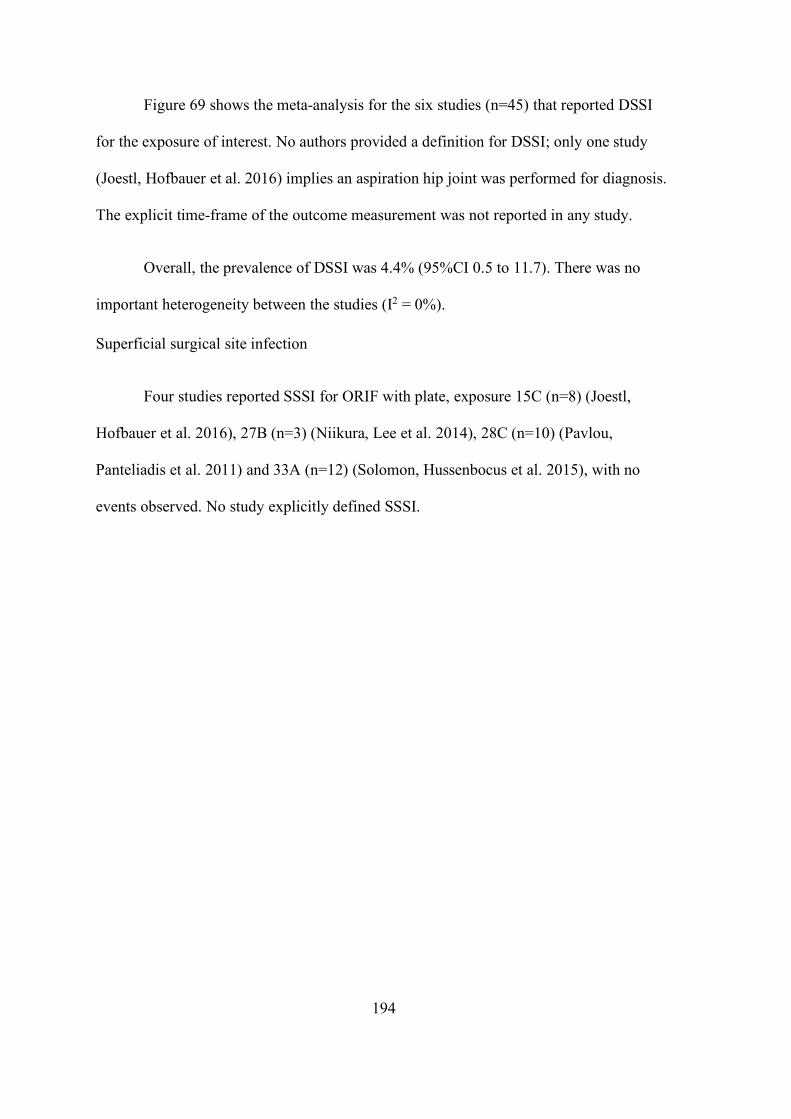
194
Figure 69 shows the meta-analysis for the six studies (n=45) that reported DSSI
for the exposure of interest. No authors provided a definition for DSSI; only one study
(Joestl, Hofbauer et al. 2016) implies an aspiration hip joint was performed for diagnosis.
The explicit time-frame of the outcome measurement was not reported in any study.
Overall, the prevalence of DSSI was 4.4% (95%CI 0.5 to 11.7). There was no
important heterogeneity between the studies (I2 = 0%).
Superficial surgical site infection
Four studies reported SSSI for ORIF with plate, exposure 15C (n=8) (Joestl,
Hofbauer et al. 2016), 27B (n=3) (Niikura, Lee et al. 2014), 28C (n=10) (Pavlou,
Panteliadis et al. 2011) and 33A (n=12) (Solomon, Hussenbocus et al. 2015), with no
events observed. No study explicitly defined SSSI.
195
Dislocation overall (combined analysis)
Figure 70 Dislocation for ORIF with plate (combined)
Figure 70 shows the meta-analysis for the four studies (n=37) that reported
dislocation for the exposure of interest. No authors provided a definition or direction of
Meta-analysis
0.0 0.1 0.2 0.3 0.4 0.5 0.6
Proportion
Joestl 15C 2016
Korbel 18B 2013
Pavlou 28C+D 2011
Solomon 33A 2015
Total (fixed effects)
196
dislocation. Only one study (Solomon, Hussenbocus et al. 2015) reported a time period
within which a dislocation occurred, which was less than 3 months post-operatively.
Overall, the prevalence of dislocation was 11.8% (95%CI 3.8 to 25.7). There was
a low degree of heterogeneity between the studies (I2 = 9.9%).
Subgroup analysis (analysis 2) was performed by separating exposure 28C (ORIF
with plate without bone graft) and 28D (ORIF with plate with bone graft) to assess for
any appreciable change in the meta-analysis result for dislocation (Pavlou, Panteliadis
et al. 2011).
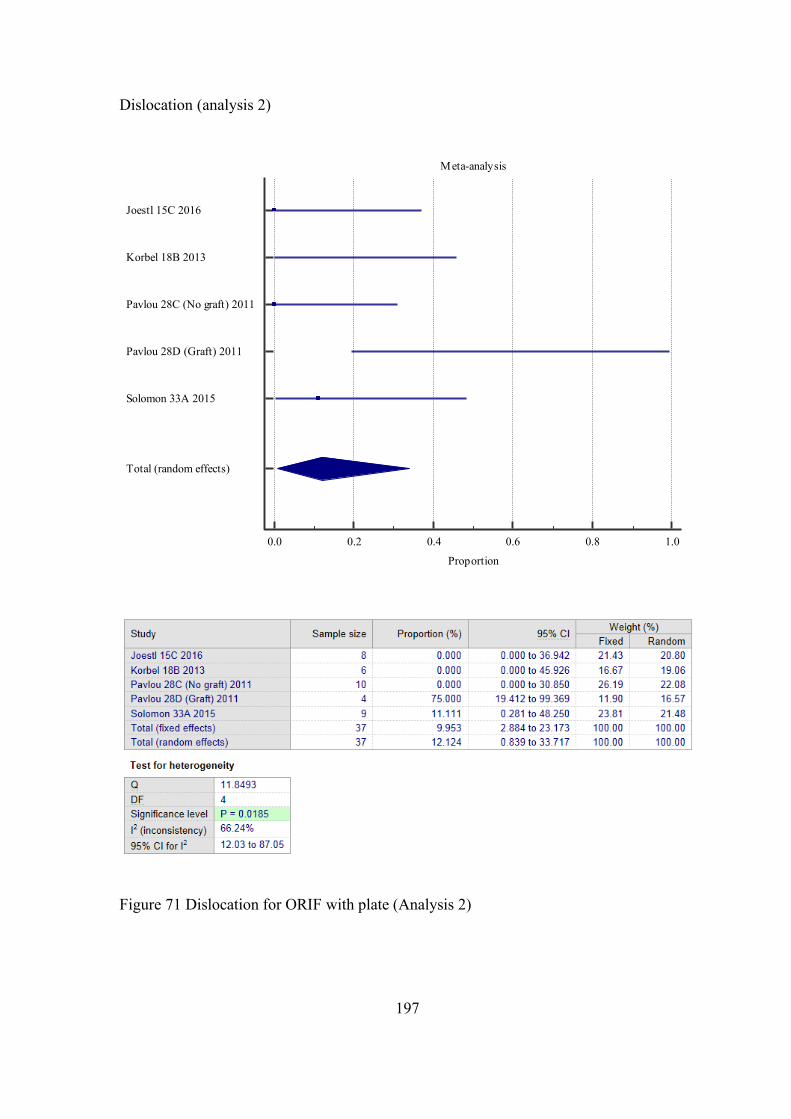
197
Dislocation (analysis 2)
Figure 71 Dislocation for ORIF with plate (Analysis 2)
Meta-analysis
0.0 0.2 0.4 0.6 0.8 1.0
Proportion
Joestl 15C 2016
Korbel 18B 2013
Pavlou 28C (No graft) 2011
Pavlou 28D (Graft) 2011
Solomon 33A 2015
Total (random effects)
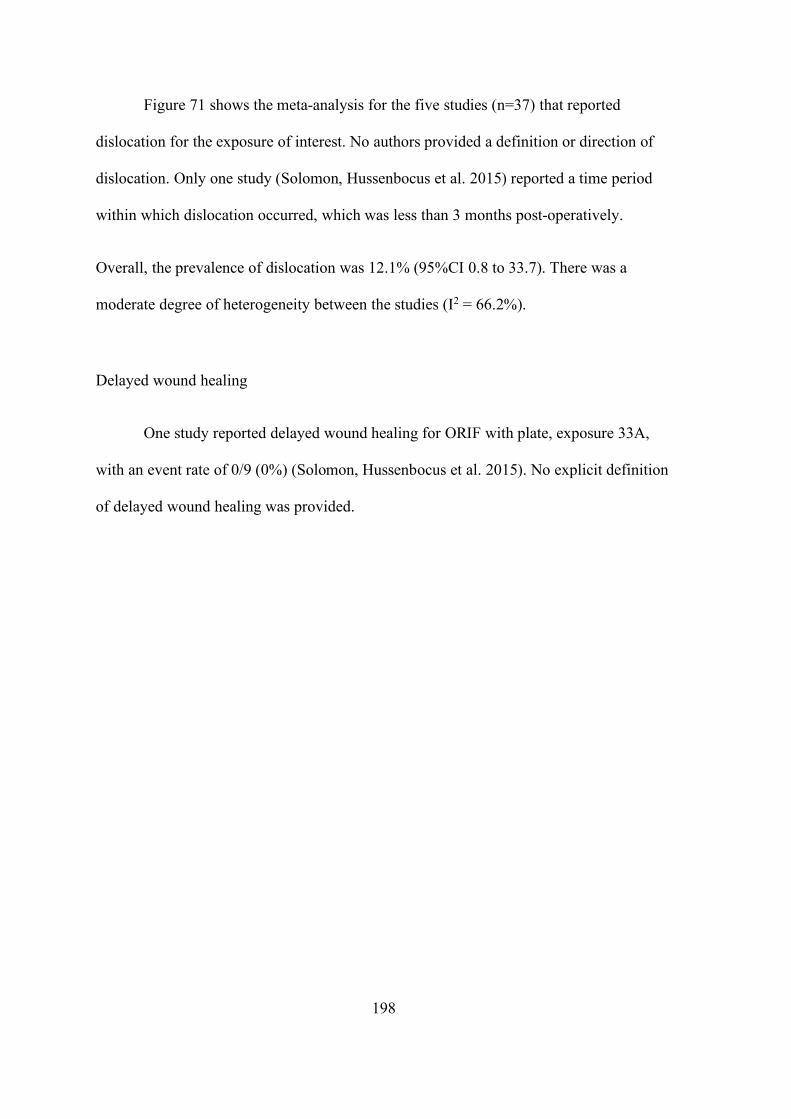
198
Figure 71 shows the meta-analysis for the five studies (n=37) that reported
dislocation for the exposure of interest. No authors provided a definition or direction of
dislocation. Only one study (Solomon, Hussenbocus et al. 2015) reported a time period
within which dislocation occurred, which was less than 3 months post-operatively.
Overall, the prevalence of dislocation was 12.1% (95%CI 0.8 to 33.7). There was a
moderate degree of heterogeneity between the studies (I2 = 66.2%).
Delayed wound healing
One study reported delayed wound healing for ORIF with plate, exposure 33A,
with an event rate of 0/9 (0%) (Solomon, Hussenbocus et al. 2015). No explicit definition
of delayed wound healing was provided.
199
Re-operation
Figure 72 Re-operation for ORIF with plate.
Figure 72 shows the meta-analysis for the three studies (n=14) that reported re-
operation for the exposure of interest. No authors provided an explicit definition nor a
Meta-analysis
0.0 0.2 0.4 0.6 0.8 1.0
Proportion
Haidar 11 2005
Holley 13D 2007
Spina 34A 2014
Total (fixed effects)
200
time-frame for re-operation. The overall assessment period across studies was similar,
and up to around eleven years.
Overall, the prevalence of Re-operation was 38.0% (95%CI 16.2 to 64.2). There
was no important heterogeneity between the studies (I2 = 0%).
Studies not included in the meta-analysis: (Lunebourg, Mouhsine et al. 2015).
Lunebourg and colleagues reported on re-operation (by way of Revision) for Vancouver
B2 PFF in their cohorts, however, unfortunately, only explicitly specified the exposure
(either 21A ORIF with plate OR 21B Revision + ORIF with plate) in one out of two
Revision cases and hence could not be included in our meta-analysis without introducing
some uncertainty (Lunebourg, Mouhsine et al. 2015).
Deep vein thrombosis (DVT)
Two studies reported DVT for ORIF with plate, exposure 11 (Haidar and
Goodwin 2005) and 15C (n=8) (Joestl, Hofbauer et al. 2016), with a prevalence of 17%
(1/6) and no observed events, respectively. No authors provided an explicit definition for
DVT.
Pulmonary embolism (PE)
One study reported PE for ORIF with plate, exposure 15C (n=8) (Joestl, Hofbauer
et al. 2016), with no events observed. No explicit definition of PE was provided.
Leg length discrepancy (LLD) (2cm or more)
One study reported LLD for ORIF with plate, exposure 11 (Haidar and Goodwin
2005), with an incidence of 17% (1/6). Outcome was referred to as ‘limb shortening’ by
201
authors, however, no explicit definition, diagnostic method, nor a time-frame for
identifying LLD was provided.
Neurovascular injury
One study reported Neurovascular injury for ORIF with plate, exposure 15C (n=8)
(Joestl, Hofbauer et al. 2016), with no events observed. No explicit definition of
neurovascular injury was provided.
Plate breakage
Two studies reported plate breakage for ORIF with plate, exposure 15C (n=8)
(Joestl, Hofbauer et al. 2016) and 18B (n=6) (Korbel, Sponer et al. 2013), with no
observed events and a prevalence of 3/6 (50%), respectively.
Harris hip score post-operatively
One study reported post-operative Harris hip score for ORIF with plate, exposure
33A* (n=5) (Solomon, Hussenbocus et al. 2015), with a mean score of 59 (SD 22.96).
The time point post-operatively at which HHS was calculated was not explicitly reported.
Harris hip pain score (post-operative)
One study reported post-operative Harris hip pain score for ORIF with plate,
exposure 33A* (n=8) (Solomon, Hussenbocus et al. 2015), with a mean score of 41 (SD
8.4). The time point post-operatively at which HHS was calculated was not explicitly
reported.
Beals and Towers’ criteria excellent outcome
One study reported Beals and Towers’ criteria excellent outcome for ORIF with
plate, exposure 34A, with a prevalence of 50% (3/6) (Spina, Rocca et al. 2014). The time
202
point post-operatively at which the Beals and Towers’ criteria were assessed was not
explicitly reported.
Beals and Towers’ criteria good outcome
One study reported Beals and Towers’ criteria good outcome for ORIF with plate,
exposure 34A (Spina, Rocca et al. 2014), with a prevalence of 16.7% (1.6). The time
point post-operatively at which the Beals and Towers’ criteria were assessed was not
explicitly reported.
Beals and Towers’ criteria poor outcome
One study reported Beals and Towers’ criteria excellent outcome for ORIF with
plate, exposure 34A (Spina, Rocca et al. 2014), with a prevalence of 33% (2/6). The time
point post-operatively at which the Beals and Towers’ criteria were assessed was not
explicitly reported.
Parker mobility score (post-operative)
Two studies reported post-operative Parker mobility score for ORIF with plate,
exposure 15C (n=8) (Joestl, Hofbauer et al. 2016) and 27B (n=3) (Niikura, Lee et al.
2014) with mean scores of 6.6 (SD 2) and 2 (SD 2.7), respectively. Note, for reference,
mean pre-operative Parker mobility score for exposure 15C (n=8) (Joestl, Hofbauer et al.
2016) and 27B (n=3) were 7 (SD 1.2) and 2 (SD 2.7), respectively.
Ambulatory status (post-operative)
Two studies reported post-operative ambulatory status for ORIF with plate,
exposure 27B (Niikura, Lee et al. 2014), with 66% (2/3) non-ambulatory and 33% (1/3)

203
mobilising with crutch, and exposure 34A with 40% (2/5) mobilising without aids (Spina,
Rocca et al. 2014).
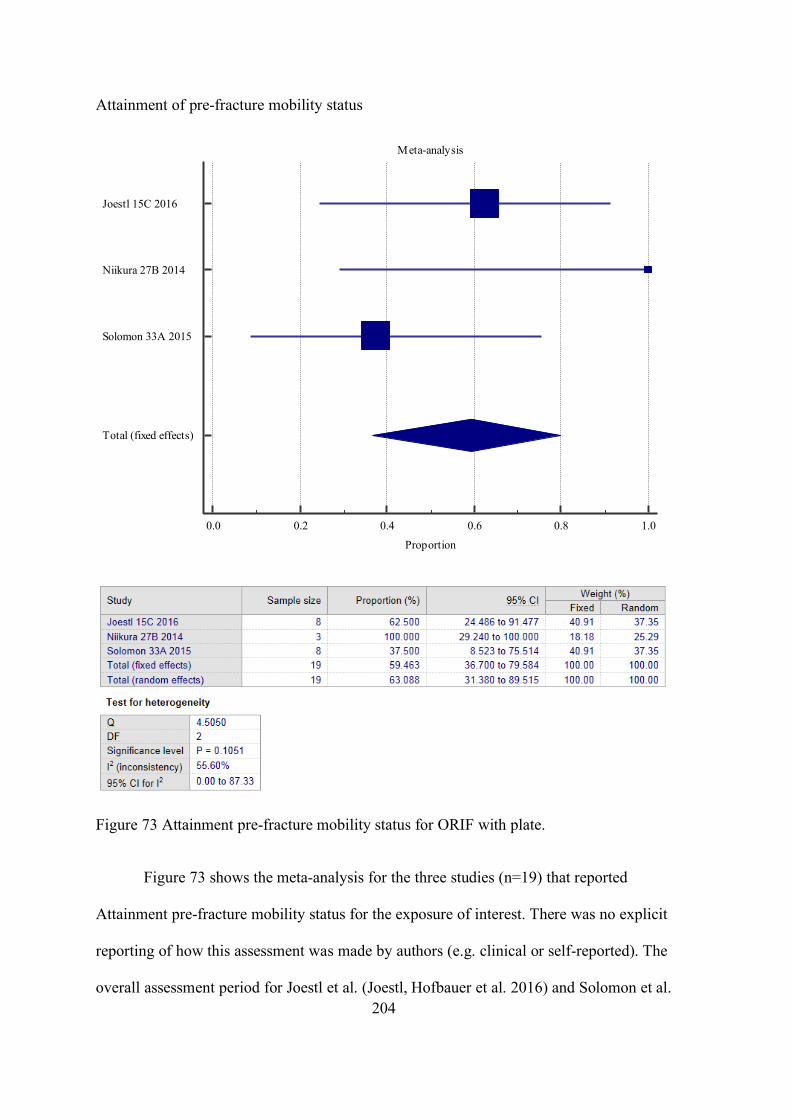
204
Attainment of pre-fracture mobility status
Figure 73 Attainment pre-fracture mobility status for ORIF with plate.
Figure 73 shows the meta-analysis for the three studies (n=19) that reported
Attainment pre-fracture mobility status for the exposure of interest. There was no explicit
reporting of how this assessment was made by authors (e.g. clinical or self-reported). The
overall assessment period for Joestl et al. (Joestl, Hofbauer et al. 2016) and Solomon et al.
Meta-analysis
0.0 0.2 0.4 0.6 0.8 1.0
Proportion
Joestl 15C 2016
Niikura 27B 2014
Solomon 33A 2015
Total (fixed effects)
205
(Solomon, Hussenbocus et al. 2015) studies ranged from 9 to 82 months Niikura and
colleagues (Niikura, Lee et al. 2014) study reported a pooled mean follow-up time of 18.4
months (no range provided).
Overall, the prevalence of Attainment pre-fracture mobility status was 59.5%
(95%CI 36.7 to 79.6). There was a moderate degree of heterogeneity between the studies
(I2 = 55.6%).
Attainment of pre-fracture social status
One study reported attainment of pre-fracture social status for ORIF with plate,
exposure 27B (Niikura, Lee et al. 2014), with a prevalence of 100% (3/3), one patient
returning home independently, one patient returning home with caregiver and one patient
returning to nursing home.
Pain free (self-assessment)
One study reported pain free (self-assessment) status for ORIF with plate,
exposure 32A, with an event rate of 4/6 (66%) (Sledge and Abiri 2002). The time point
post-operatively at which the outcome was assessed was not reported by study authors.
Quality of Life (self-assessment) post-operatively (1 (poor) – 10 (excellent))
One study reported perceived post-operative quality of life, exposure 34A (n=6)
(Spina, Rocca et al. 2014), with a mean score of 6 (SD NS, range NS). Note: pre-
operative mean score was 8 (SD NS, range NS). The time point post-operatively at which
the outcome was assessed was not reported by study authors.
206
ORIF with wires/cerclage/cables
There were two cohort studies which investigated various outcomes for the interventions
of ORIF with wires/cerclage/cables.
Union
Two studies reported union for ORIF with wires/cerclage/cables, exposure 24C
(Mukka, Mellner et al. 2016) and 34B (Spina, Rocca et al. 2014), with a prevalence of
100% (2/2) and no events observed, respectively. Neither study defined union, nor
provided a time-frame for its observation.
Mortality (overall)
One study reported mortality for ORIF with wires/cerclage/cables, exposure 24C
(Mukka, Mellner et al. 2016) (n=2) with no events observed.
Deep surgical site infection
One study reported DSSI for ORIF with wires/cerclage/cables, exposure 24C
(Mukka, Mellner et al. 2016) (n=2) with no events observed.
Re-operation
Two studies reported re-operation for ORIF with wires/cerclage/cables, exposure
24C (n=2) (Mukka, Mellner et al. 2016) and 34B (n=1) (Spina, Rocca et al. 2014), with
no events observed in either study.
Beals and Towers’ criteria excellent outcome
One study reported Beals and Towers’ criteria excellent outcome for ORIF with
wires/cerclage/cables, exposure 34B (Spina, Rocca et al. 2014), with a prevalence of 0%
207
(0/1). The time point post-operatively at which the Beals and Towers’ criteria were
assessed was not explicitly reported.
Beals and Towers’ criteria good outcome
One study reported Beals and Towers’ criteria good outcome for ORIF with
wires/cerclage/cables, exposure 34B (Spina, Rocca et al. 2014), with a prevalence of 0%
(0/1). The time point post-operatively at which the Beals and Towers’ criteria were
assessed was not explicitly reported.
Beals and Towers’ criteria poor outcome
One study reported Beals and Towers’ criteria excellent outcome for ORIF with
wires/cerclage/cables, exposure 34B (Spina, Rocca et al. 2014), with a prevalence of
100% (1/1). The time point post-operatively at which the Beals and Towers’ criteria were
assessed was not explicitly reported.
Ambulatory status (post-operative)
One study reported post-operative ambulatory status for ORIF with
wires/cerclage/cables, exposure 34B (Spina, Rocca et al. 2014) with a prevalence of 0%
(0/1) mobilising without aids. The time point post-operatively at which the outcome was
assessed was not reported by study authors.
Pain free (self-assessment)
One study reported pain free (self-assessment) status for ORIF with
wires/cerclage/cables, exposure 32B (n=1), with no events observed (Sledge and Abiri
2002). The time point post-operatively at which the outcome was assessed was not
reported by study authors.
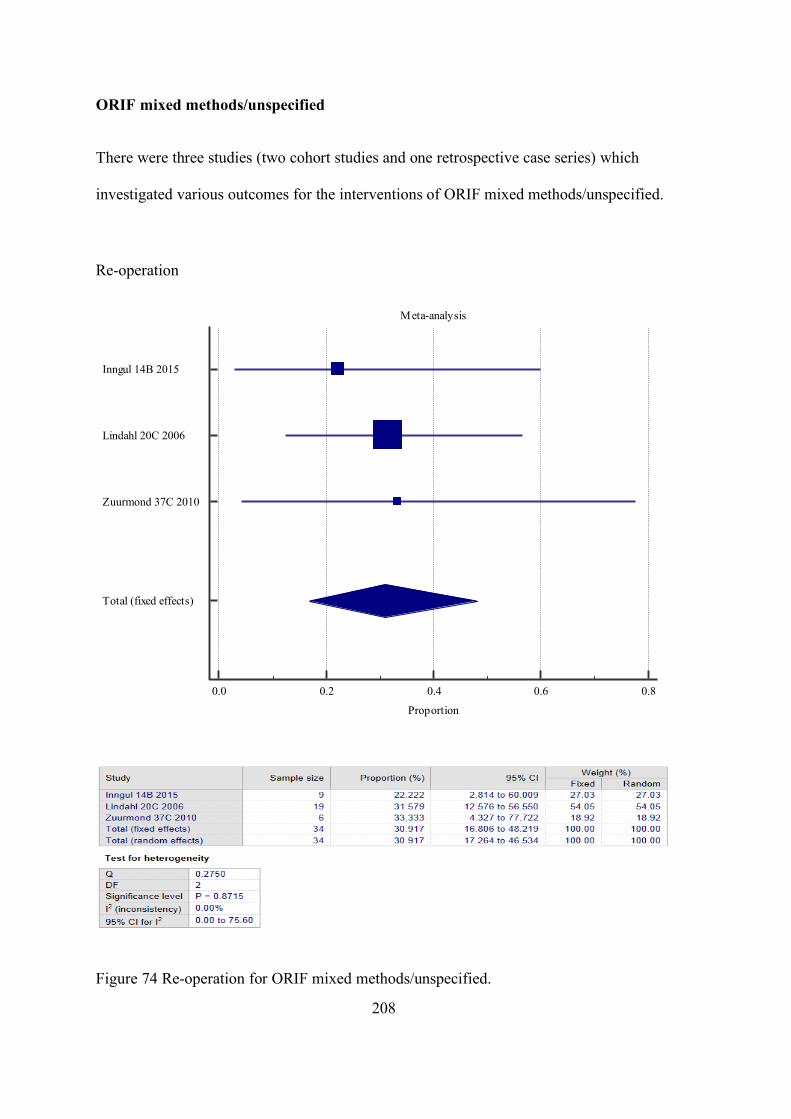
208
ORIF mixed methods/unspecified
There were three studies (two cohort studies and one retrospective case series) which
investigated various outcomes for the interventions of ORIF mixed methods/unspecified.
Re-operation
Figure 74 Re-operation for ORIF mixed methods/unspecified.
Meta-analysis
0.0 0.2 0.4 0.6 0.8
Proportion
Inngul 14B 2015
Lindahl 20C 2006
Zuurmond 37C 2010
Total (fixed effects)
209
Figure 74 shows the meta-analysis for the three studies (n=34) that reported re-
operation for the exposure of interest. No authors provided an explicit definition or a
time-frame for re-operation.
Overall, the prevalence of re-operation was 30.9% (95%CI 16.8 to 48.2). There
was no important heterogeneity between the studies (I2 = 0%).
Oxford hip score (post-operatively)
One study reported mortality for ORIF mixed methods/unspecified, exposure 37C
(n=6), with a mean of 23.8 (SD 7.9) (Zuurmond, van Wijhe et al. 2010). The overall
assessment period across studies was similar, and up to around thirteen years.
ORIF any
There were thirteen studies (seven cohort studies and six retrospective case series) which
investigated various outcomes for the interventions of ORIF mixed methods/unspecified.
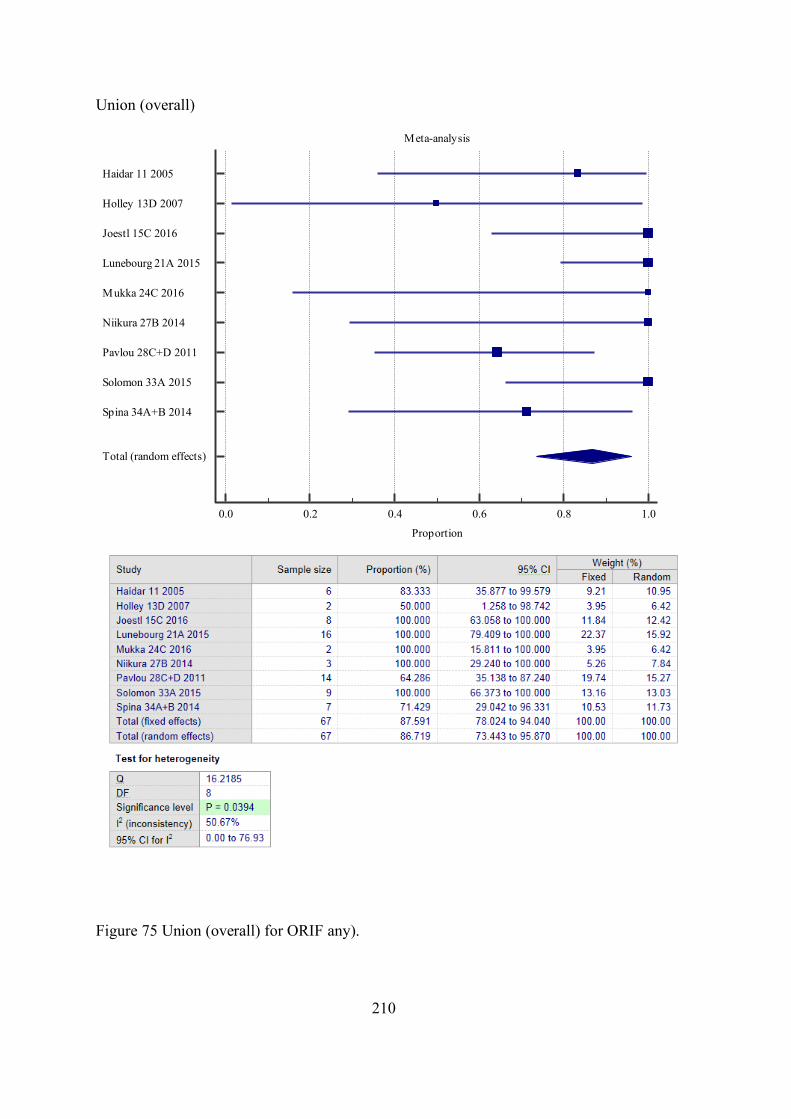
210
Union (overall)
Figure 75 Union (overall) for ORIF any).
Meta-analysis
0.0 0.2 0.4 0.6 0.8 1.0
Proportion
Haidar 11 2005
Holley 13D 2007
Joestl 15C 2016
Lunebourg 21A 2015
Mukka 24C 2016
Niikura 27B 2014
Pavlou 28C+D 2011
Solomon 33A 2015
Spina 34A+B 2014
Total (random effects)
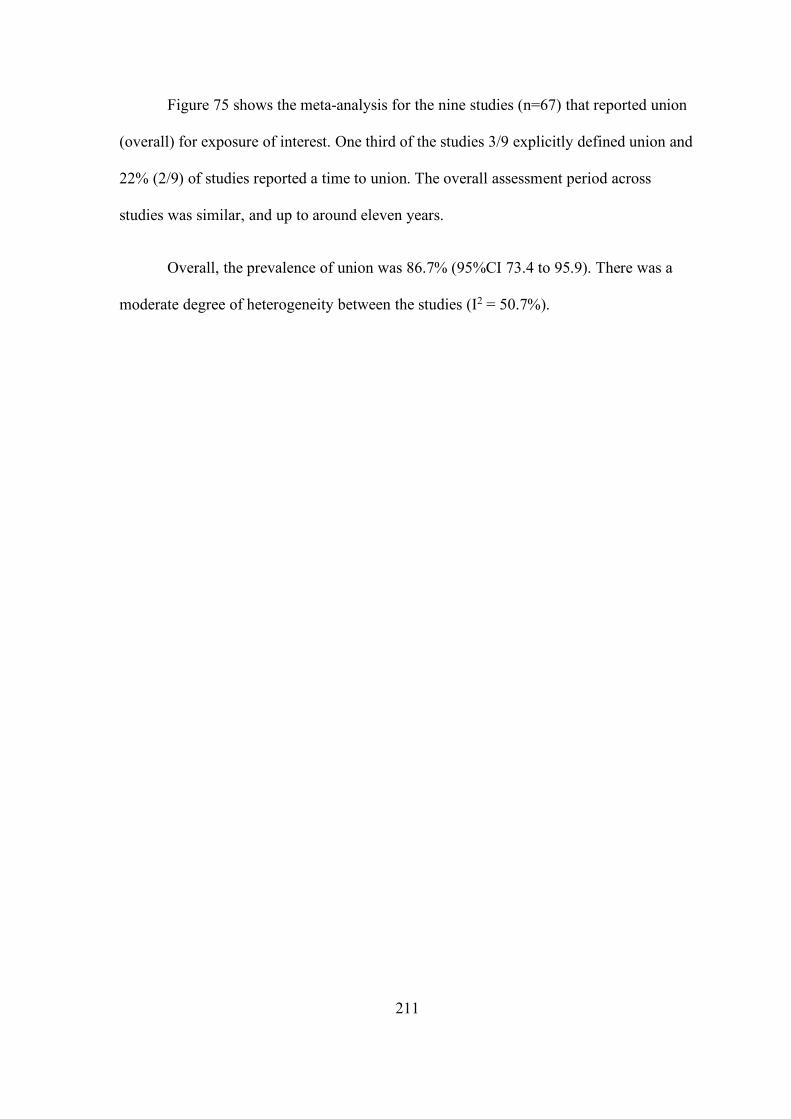
211
Figure 75 shows the meta-analysis for the nine studies (n=67) that reported union
(overall) for exposure of interest. One third of the studies 3/9 explicitly defined union and
22% (2/9) of studies reported a time to union. The overall assessment period across
studies was similar, and up to around eleven years.
Overall, the prevalence of union was 86.7% (95%CI 73.4 to 95.9). There was a
moderate degree of heterogeneity between the studies (I2 = 50.7%).
212
Deep surgical site infection
Figure 76 Deep surgical site infection (DSSI) for ORIF any.
Meta-analysis
0.0 0.2 0.4 0.6 0.8 1.0
Proportion
Haidar 11 2005
Joestl 15C 2016
Korbel 18B 2013
Mukka 24C* 2016
Niikura 27B 2014
Pavlou 28C (No graft) 2011
Solomon 33A 2015
Total (random effects)
213
Figure 76 shows the meta-analysis for the seven studies (n=47) that reported DSSI
for the exposure of interest. No authors provided a definition for DSSI, only one study
(Joestl, Hofbauer et al. 2016) implies an aspiration hip joint was performed for diagnosis.
The explicit time-frame of outcome measurement was not reported in any study.
Overall, the prevalence of DSSI was 4.6% (95%CI 0.7 to 11.8). There was no
important heterogeneity between the studies (I2 = 0%).
Superficial surgical site infection
Five studies reported SSSI for ORIF with plate, exposure 15C (n=8) (Joestl,
Hofbauer et al. 2016), 24C (n=2) (Mukka, Mellner et al. 2016), 27B (n=3) (Niikura, Lee
et al. 2014), 28C (n=10) (Pavlou, Panteliadis et al. 2011) and 33A (n=12) (Solomon,
Hussenbocus et al. 2015), with no events observed. No authors provided an explicit
definition for SSSI.
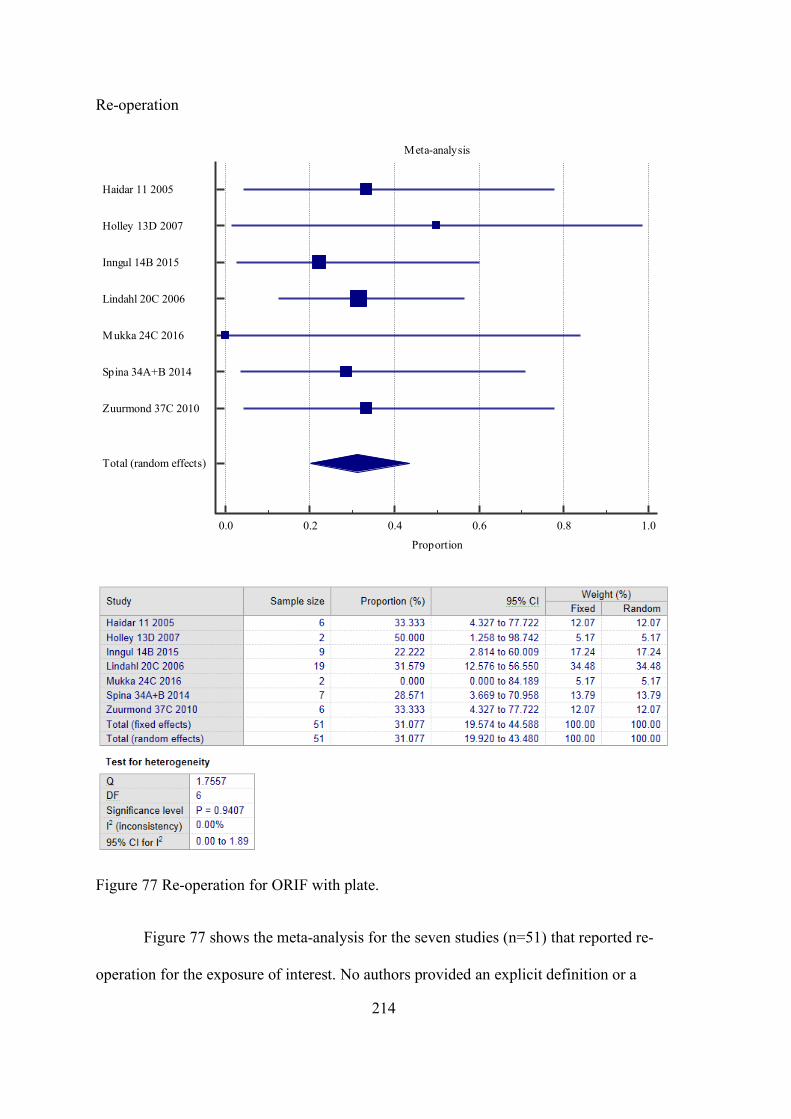
214
Re-operation
Figure 77 Re-operation for ORIF with plate.
Figure 77 shows the meta-analysis for the seven studies (n=51) that reported re-
operation for the exposure of interest. No authors provided an explicit definition or a
Meta-analysis
0.0 0.2 0.4 0.6 0.8 1.0
Proportion
Haidar 11 2005
Holley 13D 2007
Inngul 14B 2015
Lindahl 20C 2006
Mukka 24C 2016
Spina 34A+B 2014
Zuurmond 37C 2010
Total (random effects)

215
time-frame for re-operation. The overall assessment period across studies was similar,
and up to around eleven years.
Overall, the prevalence of re-operation was 31.1% (95%CI 19.9 to 43.5). There
was no important heterogeneity between the studies (I2 = 0%).
216
Non-operative
Only one case series evaluated non-operative intervention.
Union
One study reported union for non-operative intervention, exposure 27C (Niikura,
Lee et al. 2014), with a prevalence of 100% (1/1). Union was not defined nor a time-
frame of assessment given by authors.
Ambulatory status (post-injury)
One study reported post-operative ambulatory status for non-operative
intervention, exposure 27C (Niikura, Lee et al. 2014), with 100% (1/1) mobilising with
cane. The explicit time-frame of the outcome measurement was not reported in any study.
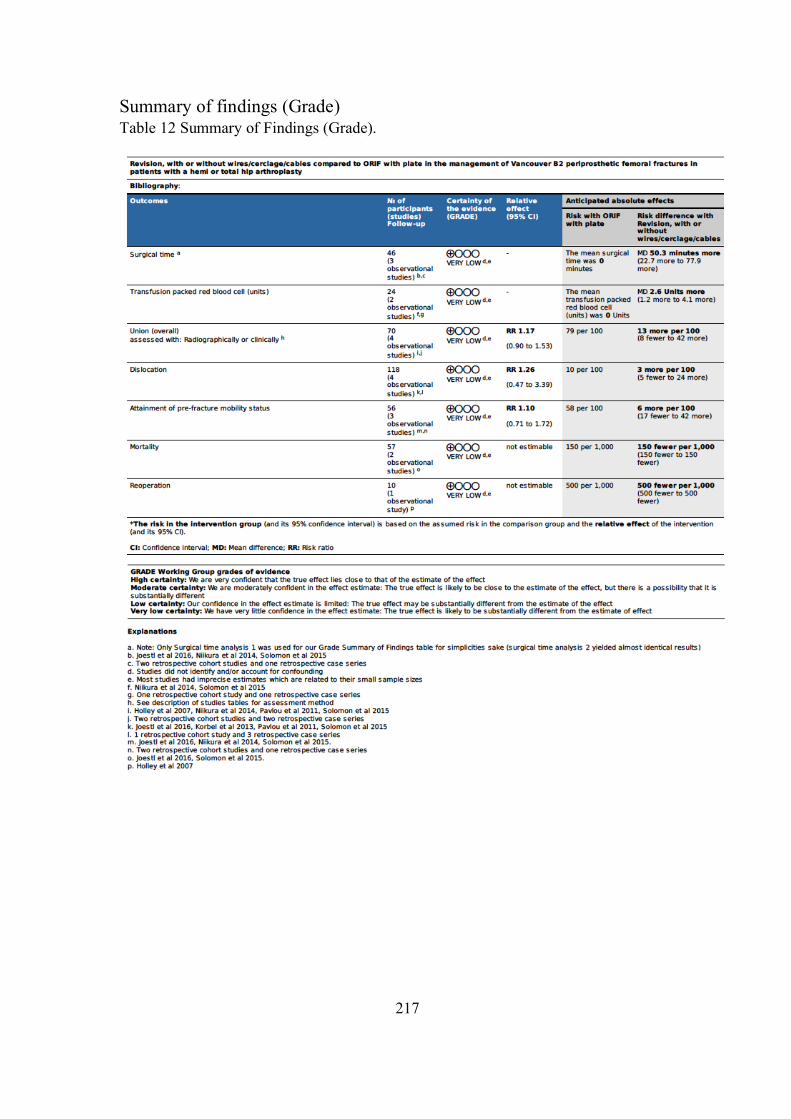
217
Summary of findings (Grade) Table 12 Summary of Findings (Grade).
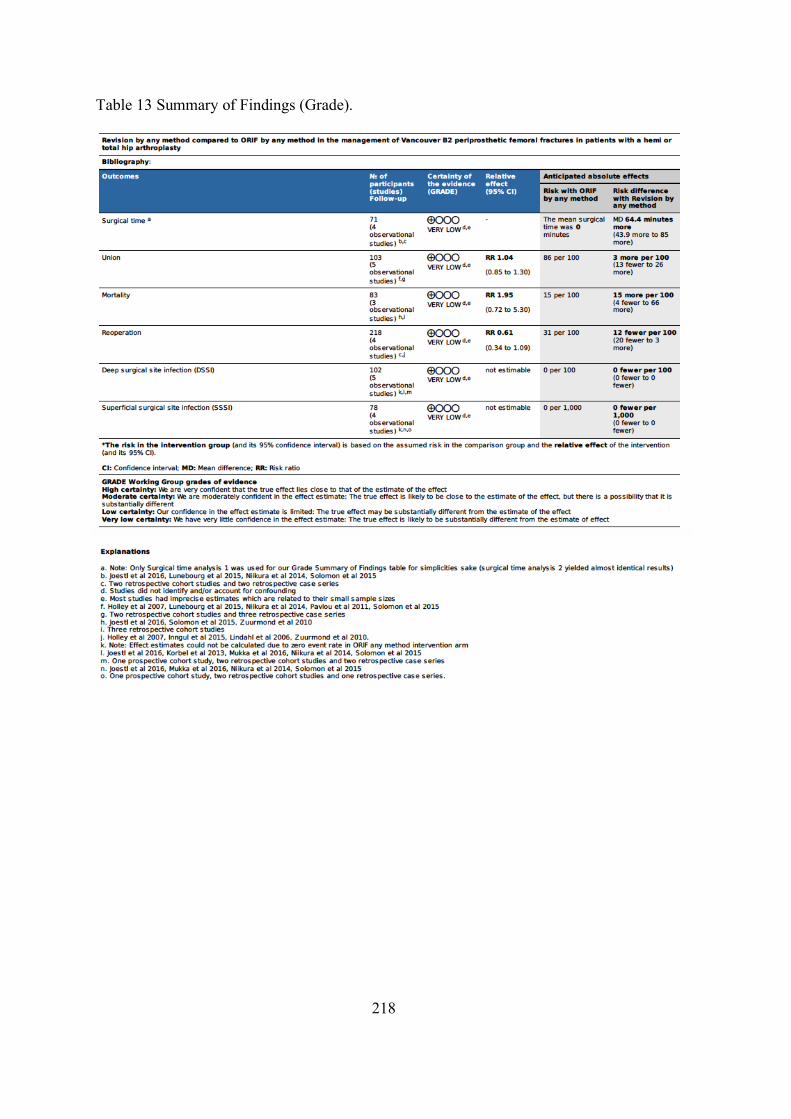
218
Table 13 Summary of Findings (Grade).

219
Chapter 4 – Discussion and final considerations

221
Summary of findings
Overall, no management strategies have been shown to be consistently superior
for the outcomes included in this systematic review. Comparative meta-analysis revealed
small differences between management strategies across different outcomes. While the
surgical time was shorter and the transfusion requirement was less for ORIF with plate vs
Revision +/- wires, cerclage and cables, pre and post-operative Parker mobility scores,
subsidence, union, mortality, dislocation and infection rates were similar. Regarding
Revision via any method vs ORIF any method, union, malunion and infection rates were
similar, however, mortality rates were lower for ORIF and re-operation rates were lower
for Revision. The section below presents a detailed discussion about the clinical
significance of the main findings of this systematic review and meta-analysis according to
outcomes.
Mortality
Single study meta-analysis performed for Revision with or without
wires/cerclage/cables (studies=8 patients=155), Revision any method (studies=12
patients=307), ORIF with plate (studies=4 patients=31) revealed a prevalence of mortality
of 21.6% (95%CI 9.0 to 38.0), 19.0% (95%CI 11.4 to 28.1) and 22.2% (95%CI 9.9 to
39.4), respectively. It should be noted that the observational time-frame ranged from 6
months to 6 years, 3 months to 9 years and 0 months to 10 years, for Revision with or
without wires/cerclage/cables, Revision any method and ORIF with plate, respectively.
Comparative meta-analysis for three studies (Joestl, Hofbauer et al. 2016,
Solomon, Hussenbocus et al. 2015, Zuurmond, van Wijhe et al. 2010) including 83
patients revealed a 12% increase in the prevalence of mortality for Revision any method
222
compared with ORIF any method. These results were not statistically significant. It
should be noted that the time-frame for mortality varied between studies and between the
exposures within the same study, however, there was no significant trend observed (see
Appendix IV for further details).
Although mortality is a critically important outcome, in light of our findings it
should not influence the decision-making when choosing between ORIF with plate and
Revision any method.
Re-operation
Single study meta-analysis performed for Revision with or without
wires/cerclage/cables (studies=7 patients=38), Revision any method (studies=7
patients=244), ORIF with plate (studies=3 patients=14) and ORIF any method (studies=7,
patients=51) revealed a prevalence of re-operation of 15.9% (95%CI 9.3 to 23.7), 19.4%
(95%CI 13.0 to 27.2), 38.0% (95%CI 15.2 to 64.2) and 31.1% (95%CI 19.9 to 43.5),
respectively. It should be noted that the observational time-frame ranged from 3 months
to 12 years and 1 month to 11 years, Revision any method and ORIF any method,
respectively.
Comparative meta-analysis for four studies (Lindahl, Garellick et al. 2006, Holley,
Zelken et al. 2007, Zuurmond, van Wijhe et al. 2010, Inngul and Enocson 2015)
including 218 patients revealed a 12% lower prevalence for re-operation for Revision any
method compared with ORIF any method. It should be noted that the time-frame for re-
operation assessment varied between studies and between the exposures within the same
study, however, there was no significant trend observed (see Appendix IV for further
details).
223
Although there was no statistically significant difference in the prevalence of re-
operation between the exposures, our findings suggest a trend towards Revision any
method being protective against re-operation when compared to ORIF any method. A
previous systematic review on this topic reported that there was no difference between
ORIF any method and Revision any method (Khan, Grindlay et al. 2017). Nevertheless,
our meta-analysis for re-operation only included two out of the four studies included by
the previous systematic review. Interestingly, this review included the study by Solomon
et al., in their meta-analysis for the outcome of re-operation and we did not (Solomon,
Hussenbocus et al. 2015). Despite this, we could not identify reporting of re-operation in
Solomon’s study publication, and also upon review of their de-identified raw data.
Therefore, we are not able to confirm whether this outcome was assessed in the above-
mentioned study. Solomon did however report that closed reduction was performed to
manage patients with post-operative hip dislocations, but no further details were provided
regarding whether this was performed in the operating theatre or in the emergency
department. In addition, the previous systematic review included the study by Lunebourg
and colleagues for the re-operation meta-analysis, which was not included in our meta-
analysis. Lunebourg and colleagues reported two re-operations (referred to as Revision
surgery by authors) for the Vancouver B2 PFF cohort (n=23), however, only one of these
re-operations was explicitly stated to have undergone internal fixation (ORIF any
equivalent) at the time of original management for PFF (Lunebourg, Mouhsine et al.
2015). The remaining Vancouver B2 PFF case undergoing re-operation was not explicitly
declared by authors to belong to either the ORIF with plate plus revision (Revision any
method equivalent) or the ORIF with plate alone exposure group (ORIF any equivalent).
As such, we could not justify the inclusion of this study in the meta-analysis for the
outcome of re-operation. Finally, we included two studies which were not included by
224
Khan and colleagues (Lindahl, Garellick et al. 2006, Holley, Zelken et al. 2007). It is
possible that these two studies did not meet the inclusion criteria of the previous
systematic review. Nevertheless, the study by Lindahl et al., 2006 accounted alone for
over half of the total weight in our meta-analysis for this outcome (Lindahl, Garellick
et al. 2006). Despite the differences between the two meta-analyses, both of them showed
similar results, with a non-statistically significant trend towards Revision any method
being protective for re-operation compared to ORIF any method.
Union
Single study meta-analysis performed for Revision with or without
wires/cerclage/cables (studies=17 patients=278), Revision any method (studies=24
patients=418), ORIF with plate (studies=9 patients=64) and ORIF any method (studies=9,
patients=67) revealed a prevalence of union of 97.0% (95%CI 94.5 to 98.7), 96.6%
(95%CI 94.5 to 98.1), 87.4% (95%CI 73.8 to 96.6) and 86.7% (95%CI 73.4 to 95.9),
respectively.
Comparative meta-analysis for four studies (Holley, Zelken et al. 2007, Pavlou,
Panteliadis et al. 2011, Niikura, Lee et al. 2014, Solomon, Hussenbocus et al. 2015) (13,
27, 28, 33) including 70 patients revealed a 14% increase in the prevalence of union for
Revision with or without wires/cerclage/cables compared with ORIF with plate. In
addition, comparative meta-analysis including five studies (Holley, Zelken et al. 2007,
Pavlou, Panteliadis et al. 2011, Niikura, Lee et al. 2014, Solomon, Hussenbocus et al.
2015) on 103 patients comparing Revision any method vs ORIF any method revealed a
3% increase in the prevalence of union reported for Revision any method. All of these
results were not statistically significant.
225
Stratified analyses were conducted for the presence/absence of bone graft as an
adjunct to ORIF with plate (28C/28D) (Pavlou, Panteliadis et al. 2011). The analyses
yielded similar results, with no statistically significant difference between union rates,
however, there was a modest trend toward higher union rates with Revision with or
without wires/cerclage/cables. However, they suggested that the addition of bone graft to
ORIF with plate intervention may neutralise this difference almost completely.
Overall, less than half of the studies explicitly defined union, with radiographic
assessment being the diagnostic method of choice in the majority of studies. Furthermore,
less than a quarter of studies provided a time to union. This reflects a global deficiency in
the quality of outcome definition and reporting, which reduces the overall methodological
quality of the included studies. Within the limitations of this systematic review, our
findings suggest that no surgical management strategy is superior with regards to
promoting union. Therefore, this outcome should not influence the decision-making when
choosing between ORIF and Revision or any of its subcategories. However, bone graft
augmentation of ORIF with plate should be investigated further, as it has shown to
slightly increase union rates in one comparative study.
Dislocation
Single study meta-analysis performed for Revision with or without
wires/cerclage/cables (studies=11 patients=214), Revision any method (studies=12
patients=298) and ORIF with plate (studies=4 patients=37) revealed a prevalence of
dislocation of 10.4% (95%CI 5.8 to 16.2), 9.1% (95%CI 5.4 to 13.6) and 11.8% (95%CI
3.8 to 25.7), respectively.
226
Comparative meta-analysis for four studies (Pavlou, Panteliadis et al. 2011,
Korbel, Sponer et al. 2013, Solomon, Hussenbocus et al. 2015, Joestl, Hofbauer et al.
2016) including 118 patients revealed that the prevalence of dislocation was 5% higher
for Revision with or without wires/cerclage/cables, in comparison with ORIF with plate.
Nevertheless, this result was not statistically significant.
Stratified analyses were conducted for the presence/absence of bone graft as an
adjunct to ORIF with plate (28C/28D) (Pavlou, Panteliadis et al. 2011) to assess for any
appreciable change in meta-analysis results for dislocation. The analyses yielded similar
results with no statistically significant difference in the prevalence of dislocation between
the two surgical approaches. Nevertheless, only 4 out of 118 patients included in the
meta-analysis received bone graft, and further research should be conducted in order to
investigate the potential protective role of ORIF with plate and bone graft with regards to
dislocation.
In light of current results, similar to the outcome of union, our findings suggest
that no surgical management strategy is superior with regards to preventing dislocation.
Therefore, this outcome should not influence the decision-making when choosing
between ORIF with plate and Revision with or without wires/cerclage/cables.
Surgical time
Single study meta-analysis performed for Revision with or without
wires/cerclage/cables (studies=4 patients=70), Revision any method (studies=5
patients=77) and ORIF with plate (studies=4 patients=39) revealed a mean surgical time
of 177.5 (95%CI 157.0 to 198.0), 182.2 (95%CI 162.2 to 202.1) and 126.0 (95%CI 116.2
to 135.9) minutes, respectively.
227
Comparative meta-analysis for three studies (Niikura, Lee et al. 2014, Solomon,
Hussenbocus et al. 2015, Joestl, Hofbauer et al. 2016) including 46 patients revealed that
surgical time was 50 minutes longer for Revision with or without wires/cerclage/cables,
in comparison with ORIF with plate. In addition, comparative meta-analysis including
four studies (Niikura, Lee et al. 2014, Lunebourg, Mouhsine et al. 2015, Solomon,
Hussenbocus et al. 2015, Joestl, Hofbauer et al. 2016) on 71 patients comparing Revision
any method vs ORIF any method revealed a mean difference of around one hour, with a
longer duration reported for Revision any method. All of these results were statistically
significant. None of the studies explicitly defined surgical time and refer to the outcome
as either ‘surgical duration’ (Joestl, Hofbauer et al. 2016), ‘operation time’ (Niikura, Lee
et al. 2014) or ‘skin-to-skin surgical time’ (Solomon, Hussenbocus et al. 2015), all of
which were accepted to mean surgical time for the purposes of this meta-analysis. In this
context, the most meaningful reporting for surgical time would be ‘skin-to-skin’ surgical
time as it represents the operative time from incision to the dressing of the surgical
wound, which most accurately reflects time spent performing each surgical management
strategy (i.e. Revision with or without wires/cerclage/cables). The clinical and practical
implications of an additional 50-minute surgical time are significant, with prolonged
anaesthetic exposure for the patient and greater economic burden on the health system.
Therefore, ORIF with plate represents a more efficient management strategy and may
impart a harm and cost minimisation when compared to Revision with or without
wires/cerclage/cables. The same holds true for ORIF any method vs Revision any
method.
228
Transfusion PRBC
Single study meta-analysis performed for Revision with or without
wires/cerclage/cables (studies=2 patients=11), ORIF with plate (studies=3 patients=50)
revealed a mean of 3.1 (95%CI 1.9 to 4.2) and 2.0 (95%CI 1.5 to 2.5) units PRBC,
respectively.
Comparative meta-analysis for two studies (Niikura, Lee et al. 2014, Solomon,
Hussenbocus et al. 2015) including 24 patients revealed greater transfusion requirement
for Revision with or without wires/cerclage/cables of 2.6 units PRBC, in comparison with
ORIF with plate. Although these results were statistically significant, the sample size was
small, even after combining the two studies. Therefore, these results should be interpreted
with caution, and further research is required to confirm these findings. Nevertheless, an
additional two and a half units PRBC transfusion requirement per patient is of clinical
importance, given the risks of transfusion to the patient and the cost involved with its
provision. In this sense, ORIF with plate would represent a risk minimisation to the
patient and would reduce the overall cost of the surgery.
Attainment of pre-fracture mobility status
Single study meta-analysis performed for Revision with or without
wires/cerclage/cables (studies=6 patients=86), Revision any method (studies=9
patients=123) and ORIF with plate (studies=3, patients=19), revealed a prevalence of
attainment of pre-fracture mobility status of 88.8% (95%CI 66.6 to 99.6), 79.9% (95%CI
59.4 to 94.4) and 59.5% (95%CI 36.7 to 79.6), respectively.
Comparative meta-analysis for three studies (Niikura, Lee et al. 2014, Solomon,
Hussenbocus et al. 2015, Joestl, Hofbauer et al. 2016) including 56 patients revealed a 6%
229
increase in the prevalence of attainment of pre-fracture mobility status for Revision with
or without wires/cerclage/cables compared with ORIF with plate. This result was not
statistically significant.
It should be noted that there was no explicit reporting by authors of how or at
which time point post-operatively this assessment was made (e.g. clinical or self-
reported). Future studies should include this and other patient-reported measures when
evaluating surgical management strategies for Vancouver B2 PPF.
Parker mobility scores pre and post-operatively
Comparative meta-analysis for two studies (Niikura, Lee et al. 2014, Joestl,
Hofbauer et al. 2016) including 41 patients revealed no statistically significant difference
in the difference in Parker mobility score pre and post-operatively for Revision with or
without wires/cerclage/cables compared with ORIF with plate. Both sub-groups revealed
patients had modestly lower scores post-operatively with 0.49 (95%CI 0.40 to 1.38)
points (lower post-operatively) for Revision with or without wires/cerclage/cables sub-
group compared with 0.33 (95%CI 1.18 to 1.84) points (lower post-operatively) in the
ORIF with plate sub-group.
230
Limitations of the systematic review
Quality of the evidence
Overall the methodological quality of the included studies was low and this is
consistent with the field of orthopaedics research in general (Fayaz, Haas et al. 2013). In
addition, the majority of studies lack the appropriate level of evidence, adequate sample
sizes and often do not present a clear and systematic definition of exposures and
outcomes. Furthermore, the studies lack sophisticated statistical techniques to handle
confounding bias on most occasions. Despite these limitations, the current systematic
review presents results based on the best available evidence on the effectiveness of
surgical management strategies for Vancouver B2 PFF. The main methodological issues
of the included studies in the current systematic review are reported below:
Definition of the population and exposure
Grouping patients into one single cohort based purely on their fracture
classification as Vancouver B2 is useful to assess management strategies. However, there
are variations within this type of fracture that may contribute to prognosis and response to
treatment that should be considered in the evaluation of the surgical management
strategy. These factors are related to the patients themselves, the implants used in the
surgery, the performance of the surgical intervention itself and the after-care regime.
Patient factors would include the indication for the index procedure (e.g. hip hemi-
arthroplasty for a fractured neck of the femur vs primary total hip replacement for hip
osteoarthritis) and age. Index procedure details, including arthroplasty construct (THA vs
HA), femoral stem geometry and fixation principle (e.g. cemented vs uncemented
systems) are important considerations in planning for subsequent management in the
event of a PFF. The experiential level of the surgeon performing the intervention may
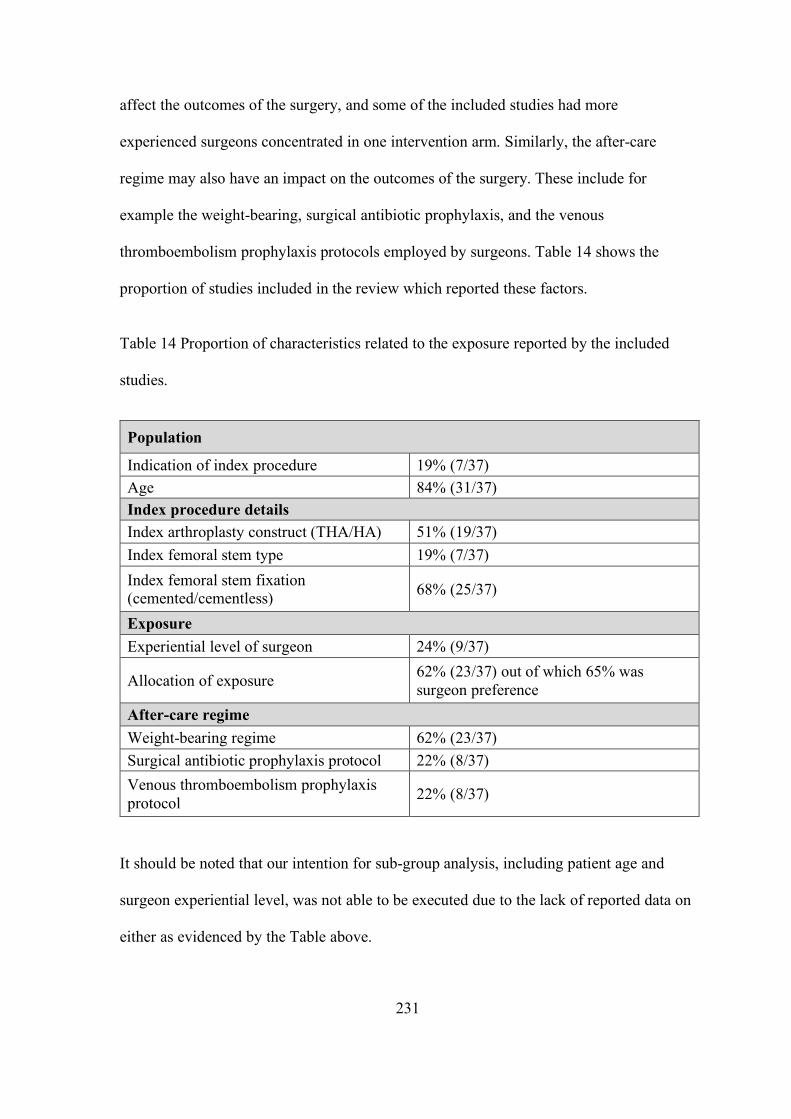
231
affect the outcomes of the surgery, and some of the included studies had more
experienced surgeons concentrated in one intervention arm. Similarly, the after-care
regime may also have an impact on the outcomes of the surgery. These include for
example the weight-bearing, surgical antibiotic prophylaxis, and the venous
thromboembolism prophylaxis protocols employed by surgeons. Table 14 shows the
proportion of studies included in the review which reported these factors.
Table 14 Proportion of characteristics related to the exposure reported by the included
studies.
Population
Indication of index procedure 19% (7/37) Age 84% (31/37) Index procedure details Index arthroplasty construct (THA/HA) 51% (19/37) Index femoral stem type 19% (7/37) Index femoral stem fixation (cemented/cementless) 68% (25/37)
Exposure Experiential level of surgeon 24% (9/37)
Allocation of exposure 62% (23/37) out of which 65% was surgeon preference
After-care regime Weight-bearing regime 62% (23/37) Surgical antibiotic prophylaxis protocol 22% (8/37) Venous thromboembolism prophylaxis protocol 22% (8/37)
It should be noted that our intention for sub-group analysis, including patient age and
surgeon experiential level, was not able to be executed due to the lack of reported data on
either as evidenced by the Table above.
232
Definition of the outcomes
The explicit definition of outcome measures, their method and time-frame of
measurement is important in orthopaedic research in order to effectively inform surgical
decision-making and patient information on expected risks and benefits of proposed
interventions (which may be non-operative or operative) along with their probable time-
frames. The absence of strict definitions or criterion for an outcome measure makes
interpretation of intra-study comparisons challenging as there may be multiple patients
within a cohort exhibiting a similar clinical picture whom are inconsistently allocated to
an outcome because of disparities between the assessor’s (surgeon’s) definition and its
application to the clinical scenario. This potential for intra-assessor variability is further
complicated by the fact that commonly multiple surgeons will participate in providing
orthopaedic care within a given unit and unanimous opinion is variably observed which
will lead to inter-assessor variability.
Furthermore, the method of measurement will impact on outcome assessment in
terms of accuracy and precision of outcome detection. Additionally, the time-frame for its
identification is vital in informing practice and counselling patients. Using an example
from our study, the single study meta-analysis for Revision with or without
wires/cerclage/cables for union outcome; 56% (10/18) studies provided a definition for
union, however, although these definitions generally included radiographic assessment of
cortical bridging usually 2 or 3 out of four times to satisfy a diagnosis of union, none of
these definitions were exactly the same. 100% (18/18) reported a method of detection by
way of a plain film radiograph with a further 17% (3/18) additionally considering clinical
examination to support a diagnosis of union. Additionally, the time to union was only
reported in half (9/18) of the studies.
233
In the case of complications, beyond the detection method and time-frame, the
reporting of their management outcomes is also important to consider. In the case of
prosthetic hip dislocation, it is relatively simple with a continuum between complete joint
congruency, subluxation, where some articular contact is present, and dislocation, where
no articular contact is observed. This may be identified clinically with a patient exhibiting
a shortened and externally or internally rotated lower limb (depending on direction of
dislocation) and inability to weight bear and can be further correlated with a plain film
radiograph. In our single study meta-analysis of Revision with or without
wires/cerclage/cables for dislocation outcome, 0% (0/11) study authors provided a
definition or direction of dislocation. Dislocations are seldom left without treatment as the
patient would be rendered unable to mobilise on that limb. In terms of the implication of a
dislocation, if medical staff perform a reduction manoeuvre under sedation or anaesthesia
to restore the normal joint enlocation this may or may not be considered as a re-operation
depending on whether or not this was performed in the Emergency Department
resuscitation room or in the operating theatre. As discussed above, Solomon et al.
reported multiple dislocations and closed reductions being performed; however, none of
these were reported as re-operations. If these dislocations were interpreted as re-
operations, this would read as a re-operation rate (for dislocation) of 11% (1/9) for
exposure 33A ORIF with plate and 29% (2/7) for 33B Revision with or without
wires/cerclage/cables (Niikura, Lee et al. 2014, Solomon, Hussenbocus et al. 2015). This
may change our view on either intervention depending on its size of effect and clinical
relevance. Regardless of whether or not the dislocation event results in reporting as ‘re-
operation’, an unstable joint articulation will impart much morbidity upon the patient with
recurrent dislocations resulting in repeated hospital presentation and possible requirement
for Revision surgery to improve arthroplasty construct to improve stability. It is clear that
234
depending on a studies definition of re-operation, important data may or may not be
reported which would likely impact on the surgeon’s decision-making and provision of
expected outcomes to patients.
Beyond the detection method and time-frame, the concept of a threshold for an
outcome being considered a reality is important to consider. Relevant to dislocation,
subsidence of the femoral stem is a commonly reported outcome which may lead to
altered stability of a hip arthroplasty construct by way of a stem migrating within the
femoral canal and altering the dynamic at the prosthetic head and acetabular interface.
The amount of subsidence which surgeons tolerate prior to labelling as such, varied
amongst studies, however, generally 5mm or less was accepted to be within acceptable
limits. For this reason we performed two single study meta-analyses for Subsidence for
Revision with or without wires/cerclage/cables which included; Subsidence (any) where
any subsidence was considered to represent its existence regardless of distance and
Subsidence greater than 5mm or requiring Revision surgery, (with the latter thought to be
somewhat more meaningful from a clinical perspective), for if 5mm or less subsidence is
identified in a patient it would be unlikely to cause clinically detectable symptoms and
ultimately, if any degree of subsidence is tolerated by the patient without causing
symptoms or complications necessitating revision, it is likely to be clinically unimportant.
For subsidence in any meta-analysis, a definition of subsidence was provided in 88%
(7/8) studies, however, only 63% (5/8) explicitly reported their measurement method.
This uncertainty impacts not only our single study meta-analyses but our
comparative meta-analyses. An example is our meta-analyses of Re-operation for
Revision any method vs ORIF any method where 0% (0/4) study authors provided an
explicit definition for re-operation. Additionally, they did not provide an explicit time-
235
frame within which re-operation was observed, with the only guidance being the overall
time-frame for outcome assessment published by authors.
Furthermore, when considering comparisons between studies such as our
comparative analysis section, an important limitation is the variable time-frames of
outcome assessment. Upon review of these time-frames for outcomes assessed, most
study ranges did not vary considerably (see Appendix IV for further details). In addition,
all studies reported outcomes for clinically relevant observational time periods. For
example, for the outcome of union, the critical period of evaluation is within the first year
post-surgery, as union is generally achieved within 9 to 12 months after surgery.
Study protocols must establish strict definitions for outcome measures and their
detection method and time-frame of assessment to ensure results are consistent and
interpretable clinically. Beyond this, inter-study comparisons rely on these protocols in
being explicit to ensure that outcomes observed are indeed comparable. Indeed, practice
varies across units, health networks, states and nations. Herein lies a limitation to our
meta-analyses.
Potential confounding bias
The included studies did not take age into account in their analysis, and this could
be a potential source of confounding bias. Age is associated with both the assignment of
surgical management strategy (older patients are more likely to receive ORIF with plate
than Revision) and with the outcomes of transfusion, with older individuals being more
likely to need transfusion; union, with older patients is less likely to progress to union due
236
to biological deficiencies; mortality, with older patients more likely to die, and re-
operation, where a surgeon’s inclination to offer re-operation after a Vancouver B2 PFF
management strategy fails, may be less likely if the patient originally underwent ORIF as
opposed to Revision.
There is also a potential of bias associated with the review process, such as the
inclusion of studies published in English only. In addition, the title and abstract screening
was performed by one reviewer only. Therefore, it is possible that some studies were
missed in this process.
237
Strengths of the systematic review
This systematic review was born out of the absence of high quality, randomised
controlled studies in the published literature to advise management of Vancouver B2
PFFs, which is an ever-more prevalent orthopaedic diagnosis. Regardless of the low
quality of studies included, it represents the best available body of evidence to advise
practice. It is the only systematic review on the topic which was guided by a published
systematic review protocol (Ianunzio, Munn et al. 2017) and that included searching grey
literature databases (in addition to published literature). Our systematic review’s rigour
and comprehensiveness is highlighted by drawing comparisons with the recently
published systematic review by Khan and colleagues, whereby our study encompasses 37
studies including 926 patient fracture cases, representing over 250% greater content than
that of Khan and colleagues (Khan, Grindlay et al. 2017).
238
Concluding statement
Overall, no management strategies have been shown to be consistently superior for the
outcomes included in this systematic review and meta-analyses. This best body of
evidence does not provide support for one intervention method over another except to say
that;
• Revision with or without wires/cerclage/cables compared with ORIF with plate
o ORIF with plate exposes patients to shorter surgical times and lower
transfusion requirements
o Outcomes of union, dislocation, attainment of pre-fracture mobility status
and Parker mobility score should not be used to advise surgical
management decision-making
• ORIF any method compared with Revision any method
o ORIF any method exposes patients to shorter surgical times
o A non-statistically significant trend towards Revision any method being
protective against re-operation exists and requires further investigation.
• Outcomes of mortality and union should not be used to advise surgical
management decision-making.

239
Future Directions
Future studies require larger, prospective, preferably randomised studies with
more precise reporting of population and exposure, outcome definitions and observational
time-frames, along with acknowledgement and control of age as a potential confounder.


241

243
References
Abdel, M. P., U. Cottino and T. M. Mabry (2015). ‘Management of periprosthetic femoral fractures following total hip arthroplasty: a review.’ Int Orthop 39(10): 2005-2010. Abdel, M. P., M. T. Houdek, C. D. Watts, D. G. Lewallen and D. J. Berry (2016). ‘Epidemiology of periprosthetic femoral fractures in 5417 revision total hip arthroplasties: a 40-year experience.’ Bone Joint J 98-b(4): 468-474. Albrektsson, T., P. I. Branemark, H. A. Hansson and J. Lindstrom (1981). ‘Osseointegrated titanium implants. Requirements for ensuring a long-lasting, direct bone-to-implant anchorage in man.’ Acta Orthop Scand 52(2): 155-170. Amenabar, T., W. A. Rahman, V. V. Avhad, R. Vera, A. E. Gross and P. R. Kuzyk (2015). ‘Vancouver type B2 and B3 periprosthetic fractures treated with revision total hip arthroplasty.’ Int Orthop 39(10): 1927-1932. Australian Orthopaedic Association (2017). ‘National Joint Replacement Registry Hip, Knee and Shoulder Arthroplasty Annual Report 2017.’. Berend, M. E., A. Smith, J. B. Meding, M. A. Ritter, T. Lynch and K. Davis (2006). ‘Long-term outcome and risk factors of proximal femoral fracture in uncemented and cemented total hip arthroplasty in 2551 hips.’ J Arthroplasty 21(6 Suppl 2): 53-59. Berry, D. J. (1999). ‘Epidemiology: hip and knee.’ Orthop Clin North Am 30(2): 183-190. Bhattacharyya, T., D. Chang, J. B. Meigs, D. M. Estok, 2nd and H. Malchau (2007). ‘Mortality after periprosthetic fracture of the femur.’ J Bone Joint Surg Am 89(12): 2658-2662. Brady, O. H., D. S. Garbuz, B. A. Masri and C. P. Duncan (1999). ‘Classification of the hip.’ Orthop Clin North Am 30(2): 215-220. Brady, O. H., D. S. Garbuz, B. A. Masri and C. P. Duncan (2000). ‘The reliability and validity of the Vancouver classification of femoral fractures after hip replacement.’ J Arthroplasty 15(1): 59-62. Briant-Evans, T. W., D. Veeramootoo, E. Tsiridis and M. J. Hubble (2009). ‘Cement-in-cement stem revision for Vancouver type B periprosthetic femoral fractures after total hip arthroplasty. A 3-year follow-up of 23 cases.’ Acta Orthop 80(5): 548-552. Canbora, K., O. Kose, A. Polat, F. Aykanat and M. Gorgec (2013). ‘Management of Vancouver type B2 and B3 femoral periprosthetic fractures using an uncemented extensively porous-coated long femoral stem prosthesis.’ Eur J Orthop Surg Traumatol 23(5): 545-552.
244
Carli, A. V., J. J. Negus and F. S. Haddad (2017). ‘Periprosthetic femoral fractures and trying to avoid them: what is the contribution of femoral component design to the increased risk of periprosthetic femoral fracture?’ Bone Joint J 99-b (1 Supple A): 50-59. Corten, K., S. J. Macdonald, R. W. McCalden, R. B. Bourne and D. D. Naudie (2012). ‘Results of cemented femoral revisions for periprosthetic femoral fractures in the elderly.’ J Arthroplasty 27(2): 220-225. Da Assunção, R. E., T. C. B. Pollard, A. Hrycaiczuk, J. Curry, S. Glyn-Jones and A. Taylor (2015). ‘Revision arthroplasty for periprosthetic femoral fracture using an uncemented modular tapered conical stem.’ Bone and Joint Journal 97-B(8): 1031-1037. Dawson, J., R. Fitzpatrick, A. Carr and D. Murray (1996). ‘Questionnaire on the perceptions of patients about total hip replacement.’ J Bone Joint Surg Br 78(2): 185-190. Dehghan, N., M. D. McKee, A. Nauth, B. Ristevski and E. H. Schemitsch (2014). ‘Surgical fixation of Vancouver type B1 periprosthetic femur fractures: a systematic review.’ J Orthop Trauma 28(12): 721-727. Eingartner, C., R. Volkmann, U. Ochs, D. Egetemeyr and K. Weise (2006). ‘Intramedullary stabilization of periprosthetic fractures of the femur taking special account of bone defects.’ Oper Orthop Traumatol 18(4): 341-363. Engh, C. A., A. H. Glassman and K. E. Suthers (1990). ‘The case for porous-coated hip implants. The femoral side.’ Clin Orthop Relat Res(261): 63-81. Fayaz, H. C., N. Haas, J. Kellam, S. Bavonratanavech, J. Parvizi, G. Dyer, T. Pohlemann, J. Jerosch, K.-J. Prommersberger, H. C. Pape, M. Smith, M. Vrahas, C. Perka, K. Siebenrock, B. Elhassan, C. Moran and J. B. Jupiter (2013). ‘Improvement of research quality in the fields of orthopaedics and trauma—a global perspective.’ International Orthopaedics 37(7): 1205-1212. Fink, B. (2014). ‘Revision arthroplasty in periprosthetic fractures of the proximal femur.’ Oper Orthop Traumatol 26(5): 455-468. Fink, B., K. Urbansky and P. Schuster (2014). ‘Mid term results with the curved modular tapered, fluted titanium Revitan stem in revision hip replacement.’ Bone and Joint Journal 96 B(7): 889-895. Garcia-Rey, E., E. Garcia-Cimbrelo, A. Cruz-Pardos and R. Madero (2013). ‘Increase of cortical bone after a cementless long stem in periprosthetic fractures.’ Clin Orthop Relat Res 471(12): 3912-3921. Grammatopoulos, G., H. Pandit, G. Kambouroglou, M. Deakin, R. Gundle, P. McLardy-Smith, A. Taylor and D. Murray (2011). ‘A unique peri-prosthetic fracture pattern in well fixed femoral stems with polished, tapered, collarless design of total hip replacement.’ Injury 42(11): 1271-1276.
245
Greidanus, N. V., P. A. Mitchell, B. A. Masri, D. S. Garbuz and C. P. Duncan (2003). ‘Principles of management and results of treating the fractured femur during and after total hip arthroplasty.’ Instr Course Lect 52: 309-322. Haidar, S. G. and M. I. Goodwin (2005). ‘Dynamic compression plate fixation for post-operative fractures around the tip of a hip prosthesis.’ Injury 36(3): 417-423. Harris, W. H. (1969). ‘Traumatic arthritis of the hip after dislocation and acetabular fractures: treatment by mold arthroplasty. An end-result study using a new method of result evaluation.’ J Bone Joint Surg Am 51(4): 737-755. Harris, W. H., J. C. McCarthy, Jr. and D. A. O'Neill (1982). ‘Femoral component loosening using contemporary techniques of femoral cement fixation.’ J Bone Joint Surg Am 64(7): 1063-1067. Higgins, J. P. and S. Green (2013). ‘Cochrane Handbook for Systematic Reviews of Interventions Version 5.1.0 [Internet]. The Cochrane Collaboration; Available from: http://handbook.cochrane.org/.’ Higgins, J. P. T., S. G. Thompson, J. J. Deeks and D. G. Altman (2003). ‘Measuring inconsistency in meta-analyses.’ BMJ : British Medical Journal 327(7414): 557-560. Holder, N., S. Papp, W. Gofton and P. E. Beaule (2014). ‘Outcomes following surgical treatment of periprosthetic femur fractures: a single centre series.’ Can J Surg 57(3): 209-213. Holley, K., J. Zelken, D. Padgett, G. Chimento, A. Yun and R. Buly (2007). ‘Periprosthetic fractures of the femur after hip arthroplasty: an analysis of 99 patients.’ HSS J 3(2): 190-197. Ianunzio, J. R., Z. Munn, D. Mandziak, M. Stephenson and M. E. Cain (2017). ‘Effectiveness of operative interventions in individuals with a hemi or total hip arthroplasty who sustain a Vancouver B2 peri-prosthetic femoral fracture: a systematic review protocol.’ International Journal of Evidence-Based Healthcare 14(4): 198-199. Hozo S. D., B. Djulbegovic and I Hozo (2005) 'Estimating the mean and variance from the median, range, and the size of a sample.' BMC Medical Research Methodology 5:13 Inngul, C. and A. Enocson (2015). ‘Postoperative periprosthetic fractures in patients with an Exeter stem due to a femoral neck fracture: cumulative incidence and surgical outcome.’ Int Orthop 39(9): 1683-1688. Joestl, J., M. Hofbauer, N. Lang, T. Tiefenboeck and S. Hajdu (2016). ‘Locking compression plate versus revision-prosthesis for Vancouver type B2 periprosthetic femoral fractures after total hip arthroplasty.’ Injury 47(4): 939-943. Jones, C. A., L. A. Beaupre, D. W. Johnston and M. E. Suarez-Almazor (2005). ‘Total joint arthroplasties: current concepts of patient outcomes after surgery.’ Clin Geriatr Med 21(3): 527-541, vi.
246
Kaab, M. J., U. Stockle, M. Schutz, J. Stefansky, C. Perka and N. P. Haas (2006). ‘Stabilisation of periprosthetic fractures with angular stable internal fixation: a report of 13 cases.’ Arch Orthop Trauma Surg 126(2): 105-110. Kavanagh, B. F. (1992). ‘Femoral fractures associated with total hip arthroplasty.’ Orthop Clin North Am 23(2): 249-257. Khan, T., D. Grindlay, B. J. Ollivere, B. E. Scammell, A. R. Manktelow and R. G. Pearson (2017). ‘A systematic review of Vancouver B2 and B3 periprosthetic femoral fractures.’ Bone Joint J 99-b(4 Supple B): 17-25. Khanuja, H. S., J. J. Vakil, M. S. Goddard and M. A. Mont (2011). ‘Cementless femoral fixation in total hip arthroplasty.’ J Bone Joint Surg Am 93(5): 500-509. Ko, P. S., J. J. Lam, M. K. Tio, O. B. Lee and F. K. Ip (2003). ‘Distal fixation with Wagner revision stem in treating Vancouver type B2 periprosthetic femur fractures in geriatric patients.’ J Arthroplasty 18(4): 446-452. Konan, S., F. Rayan, A. R. J. Manketelow and F. S. Haddad (2011). ‘The Use of Interlocking Prostheses for Both Temporary and Definitive Management of Infected Periprosthetic Femoral Fractures.’ Journal of Arthroplasty 26(8): 1332-1337. Korbel, M., P. Sponer, T. Kucera, E. Prochazka and T. Procek (2013). ‘Results of treatment of periprosthetic femoral fractures after total hip arthroplasty.’ Acta Medica (Hradec Kralove) 56(2): 67-72. Levine, B. R., C. J. Della Valle, P. Lewis, R. A. Berger, S. M. Sporer and W. Paprosky (2008). ‘Extended Trochanteric Osteotomy for the Treatment of Vancouver B2/B3 Periprosthetic Fractures of the Femur.’ Journal of Arthroplasty 23(4): 527-533. Lindahl, H. (2007). ‘Epidemiology of periprosthetic femur fracture around a total hip arthroplasty.’ Injury 38(6): 651-654. Lindahl, H., G. Garellick, H. Regner, P. Herberts and H. Malchau (2006). ‘Three hundred and twenty-one periprosthetic femoral fractures.’ J Bone Joint Surg Am 88(6): 1215-1222. Lindahl, H., G. Garellick, H. Regnér, P. Herberts and H. Malchau (2006). ‘Three hundred and twenty-one periprosthetic femoral fractures.’ Journal of Bone and Joint Surgery - Series A 88(6): 1215-1222. Lunebourg, A., E. Mouhsine, S. Cherix, M. Ollivier, F. Chevalley and M. Wettstein (2015). ‘Treatment of type B periprosthetic femur fractures with curved non-locking plate with eccentric holes: Retrospective study of 43 patients with minimum 1-year follow-up.’ Orthop Traumatol Surg Res 101(3): 277-282.
247
Marx, A., A. Beier, L. Jung, C. H. Lohmann and A. M. Halder (2012). ‘Peri-prosthetic femoral fractures treated with the uncemented Wagner revision stem.’ Hip Int 22(3): 286-291. Masri, B. A., R. M. Meek and C. P. Duncan (2004). ‘Periprosthetic fractures evaluation and treatment.’ Clin Orthop Relat Res (420): 80-95. McGraw, I. W., S. C. Spence, E. J. Baird, S. M. Eckhardt and G. E. Ayana (2013). ‘Incidence of periprosthetic fractures after hip hemiarthroplasty: Are uncemented prostheses unsafe?’ Injury 44(12): 1945-1948. Moher, D., A. Liberati, J. Tetzlaff and D. G. Altman (2009). ‘Preferred reporting items for systematic reviews and meta-analyses: the PRISMA statement.’ PLoS Med 6(7): e1000097. Moreta, J., U. Aguirre, O. S. de Ugarte, I. Jauregui and J. L. Mozos (2015). ‘Functional and radiological outcome of periprosthetic femoral fractures after hip arthroplasty.’ Injury 46(2): 292-298. Mukka, S., C. Mellner, B. Knutsson, A. Sayed-Noor and O. Skoldenberg (2016). ‘Substantially higher prevalence of postoperative peri-prosthetic fractures in octogenarians with hip fractures operated with a cemented, polished tapered stem rather than an anatomic stem.’ Acta Orthop 87(3): 257-261. Mukundan, C., F. Rayan, E. Kheir and D. Macdonald (2010). ‘Management of late periprosthetic femur fractures: a retrospective cohort of 72 patients.’ Int Orthop 34(4): 485-489. Munro, J. T., D. S. Garbuz, B. A. Masri and C. P. Duncan (2014). ‘Tapered fluted titanium stems in the management of Vancouver B2 and B3 periprosthetic femoral fractures.’ Clin Orthop Relat Res 472(2): 590-598. Murad, M. H. and V. M. Montori (2013). ‘Synthesizing evidence: shifting the focus from individual studies to the body of evidence.’ Jama 309(21): 2217-2218. Mustafa, R. A., N. Santesso, J. Brozek, E. A. Akl, S. D. Walter, G. Norman, M. Kulasegaram, R. Christensen, G. H. Guyatt, Y. Falck-Ytter, S. Chang, M. H. Murad, G. E. Vist, T. Lasserson, G. Gartlehner, V. Shukla, X. Sun, C. Whittington, P. N. Post, E. Lang, K. Thaler, I. Kunnamo, H. Alenius, J. J. Meerpohl, A. C. Alba, I. F. Nevis, S. Gentles, M. C. Ethier, A. Carrasco-Labra, R. Khatib, G. Nesrallah, J. Kroft, A. Selk, R. Brignardello-Petersen and H. J. Schunemann (2013). ‘The GRADE approach is reproducible in assessing the quality of evidence of quantitative evidence syntheses.’ J Clin Epidemiol 66(7): 736-742; quiz 742 e731-735. National Joint Registry (GB) ‘National Joint Registry 12th Annual Report 2015. For England, Wales, Northern Ireland and the Isle of Man. Hertfordshire (GB): National Joint Registry; 2015. 181 p. Report No. 1.’.
248
Niikura, T., S. Y. Lee, Y. Sakai, K. Nishida, R. Kuroda and M. Kurosaka (2014). ‘Treatment results of a periprosthetic femoral fracture case series: treatment method for Vancouver type b2 fractures can be customized.’ Clin Orthop Surg 6(2): 138-145. Niikura, T., A. Sakurai, K. Oe, N. Shibanuma, M. Tsunoda, A. Maruo, E. Shoda, S. Y. Lee, Y. Sakai and M. Kurosaka (2014). ‘Clinical and radiological results of locking plate fixation for periprosthetic femoral fractures around hip arthroplasties: a retrospective multi-center study.’ J Orthop Sci 19(6): 984-990. Oxman, A. D., D. J. Cook and G. H. Guyatt (1994). ‘Users' guides to the medical literature. VI. How to use an overview. Evidence-Based Medicine Working Group.’ Jama 272(17): 1367-1371. Parker, M. J. and C. R. Palmer (1993). ‘A new mobility score for predicting mortality after hip fracture.’ J Bone Joint Surg Br 75(5): 797-798. Pavlou, G., P. Panteliadis, D. Macdonald, J. A. Timperley, G. Gie, G. Bancroft and E. Tsiridis (2011). ‘A review of 202 periprosthetic fractures--stem revision and allograft improves outcome for type B fractures.’ Hip Int 21(1): 21-29. Phillips, J. R., C. Boulton, C. G. Morac and A. R. Manktelov (2011). ‘What is the financial cost of treating periprosthetic hip fractures?’ Injury 42(2): 146-149. Phillips, J. R., C. G. Moran and A. R. Manktelow (2013). ‘Periprosthetic fractures around hip hemiarthroplasty performed for hip fracture.’ Injury 44(6): 757-762. Pivec, R., K. Issa, B. H. Kapadia, J. J. Cherian, A. V. Maheshwari, P. M. Bonutti and M. A. Mont (2015). ‘Incidence and future projections of periprosthetic femoral fracture following primary total hip arthroplasty: An analysis of international registry data.’ Journal of Long-Term Effects of Medical Implants 25(4): 269-275. Pogliacomi, F., T. Corsini, M. Zanelli, A. Ditta, M. Pompili, A. Pedrazzini and F. Ceccarelli (2014). ‘Results after revision of the stem in periprosthetic fractures of the hip.’ Acta Biomedica 85(2): 152-160. Rayan, F., S. Konan and F. S. Haddad (2010). ‘Uncemented revision hip arthroplasty in B2 and B3 periprosthetic femoral fractures - A prospective analysis.’ HIP International 20(1): 38-42. Scheerlinck, T. and P. P. Casteleyn (2006). ‘The design features of cemented femoral hip implants.’ J Bone Joint Surg Br 88(11): 1409-1418. Schunemann, H., J. Brozek, G. Guyatt and A. Oxman ‘GRADE handbook for grading quality of evidence and strength of recommendation [Internet]. The GRADE Working Group; 2013 [cited 2016 April 16]. Available from: http://gdt.guidelinedevelopment.org/central_prod/_design/client/handbook/handbook.html.’
249
Sexton, S. A., C. A. Stossel and F. S. Haddad (2006). ‘The Kent hip prosthesis: an evaluation of 145 prostheses after a mean of 5.1 years.’ J Bone Joint Surg Br 88(3): 310-314. Shields, E., C. Behrend, J. Bair, P. Cram and S. Kates (2014). ‘Mortality and Financial Burden of Periprosthetic Fractures of the Femur.’ Geriatric Orthopaedic Surgery and Rehabilitation 5(4): 147-153. Sledge, J. B., 3rd and A. Abiri (2002). ‘An algorithm for the treatment of Vancouver type B2 periprosthetic proximal femoral fractures.’ J Arthroplasty 17(7): 887-892. Solomon, L. B., S. M. Hussenbocus, T. A. Carbone, S. A. Callary and D. W. Howie (2015). ‘Is internal fixation alone advantageous in selected B2 periprosthetic fractures?’ ANZ J Surg 85(3): 169-173. Spina, M., G. Rocca, A. Canella and A. Scalvi (2014). ‘Causes of failure in periprosthetic fractures of the hip at 1- to 14-year follow-up.’ Injury 45 Suppl 6: S85-92. Swingler, G. H., J. Volmink and J. P. Ioannidis (2003). ‘Number of published systematic reviews and global burden of disease: database analysis.’ BMJ 327(7423): 1083-1084. The American joint replacement registry (2017). Fourth American Joint Replacement Registry Annual Report on Hip and Knee arthroplasty 2017. Tufanaru, C., Z. Munn, M. Stephenson and E. Aromataris (2015). ‘Fixed or random effects meta-analysis? Common methodological issues in systematic reviews of effectiveness.’ Int J Evid Based Health 13(3): 196-207. Wasko, M. K. and R. Kaminski (2015). ‘Custom-Made Antibiotic Cement Nails in Orthopaedic Trauma: Review of Outcomes, New Approaches, and Perspectives.’ BioMed Research International 2015: 1-12. Wu, H. B., S. G. Yan, L. D. Wu, R. X. He, X. H. Wang and X. S. Dai (2009). ‘Combined use of extensively porous coated femoral components with onlay cortical strut allografts in revision of Vancouver B2 and B3 periprosthetic femoral fractures.’ Chin Med J (Engl) 122(21): 2612-2615. Young, S. W., S. Pandit, J. T. Munro and R. P. Pitto (2007). ‘Periprosthetic femoral fractures after total hip arthroplasty.’ ANZ J Surg 77(6): 424-428. Young, S. W., C. G. Walker and R. P. Pitto (2008). ‘Functional outcome of femoral peri prosthetic fracture and revision hip arthroplasty: a matched-pair study from the New Zealand Registry.’ Acta Orthop 79(4): 483-488. Zahiri, C. A., T. P. Schmalzried, E. S. Szuszczewicz and H. C. Amstutz (1998). ‘Assessing activity in joint replacement patients.’ J Arthroplasty 13(8): 890-895.

250
Zuurmond, R. G., W. van Wijhe, J. J. van Raay and S. K. Bulstra (2010). ‘High incidence of complications and poor clinical outcome in the operative treatment of periprosthetic femoral fractures: An analysis of 71 cases.’ Injury 41(6):629-633.

251
Appendices

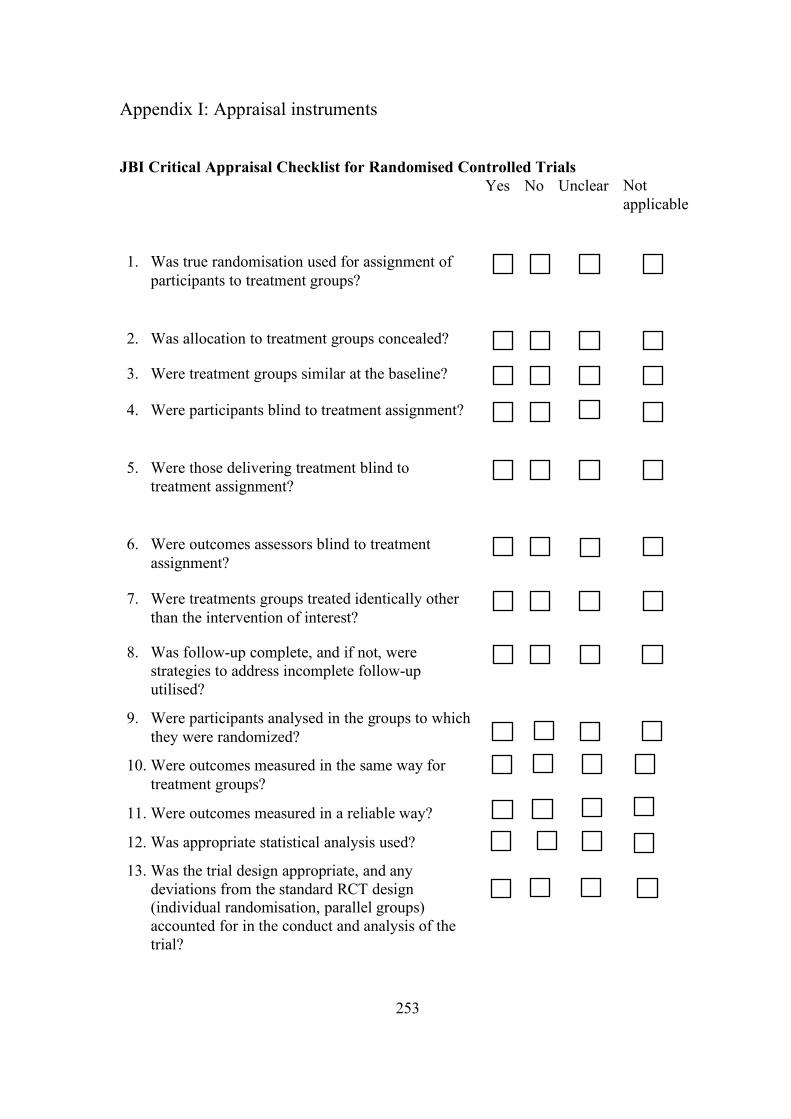
253
Appendix I: Appraisal instruments
JBI Critical Appraisal Checklist for Randomised Controlled Trials
Yes No Unclear Not applicable
1. Was true randomisation used for assignment of participants to treatment groups?
2. Was allocation to treatment groups concealed?
3. Were treatment groups similar at the baseline?
4. Were participants blind to treatment assignment?
5. Were those delivering treatment blind to treatment assignment?
6. Were outcomes assessors blind to treatment assignment?
7. Were treatments groups treated identically other than the intervention of interest?
8. Was follow-up complete, and if not, were strategies to address incomplete follow-up utilised?
9. Were participants analysed in the groups to which they were randomized?
10. Were outcomes measured in the same way for treatment groups?
11. Were outcomes measured in a reliable way?
12. Was appropriate statistical analysis used?
13. Was the trial design appropriate, and any deviations from the standard RCT design (individual randomisation, parallel groups) accounted for in the conduct and analysis of the trial?

254
JBI Critical Appraisal Checklist for Quasi-Experimental
Yes No Unclear Not applicable
1. Is it clear in the study what is the ‘cause’ and what is the ‘effect’ (i.e. there is no confusion about which variable comes first)?
2. Were the participants included in any comparisons similar?
3. Were the participants included in any comparisons receiving similar treatment/care, other than the exposure or intervention of interest?
4. Was there a control group?
5. Were there multiple measurements of the outcome/conditions both pre and post the intervention/exposure?
6. Was follow-up complete, and if not, was follow-up adequately reported and strategies to deal with loss to follow-up employed?
7. Were the outcomes of participants included in any comparisons measured in the same way?
8. Were outcomes measured in a reliable way?
9. Was appropriate statistical analysis used?

255
JBI Critical Appraisal Checklist for Cohort Studies Yes No Unclear Not
applicable
1. Were the two groups similar and recruited from the same population?
2. Were the exposures measured similarly to assign people to both exposed and unexposed groups?
3. Was the exposure measured in a valid and reliable way?
4. Were confounding factors identified?
5. Were strategies to deal with confounding factors stated?
6. Were the groups/participants free of the outcome at the start of the study (or at the moment of exposure)?
7. Were the outcomes measured in a valid and reliable way?
8. Was the follow-up time reported and sufficient to belong enough for outcomes to occur?
9. Was follow-up complete, and if not, were the reasons to loss to follow-up described and explored?
10. Were strategies to address incomplete follow-up utilised?
11. Was appropriate statistical analysis used?
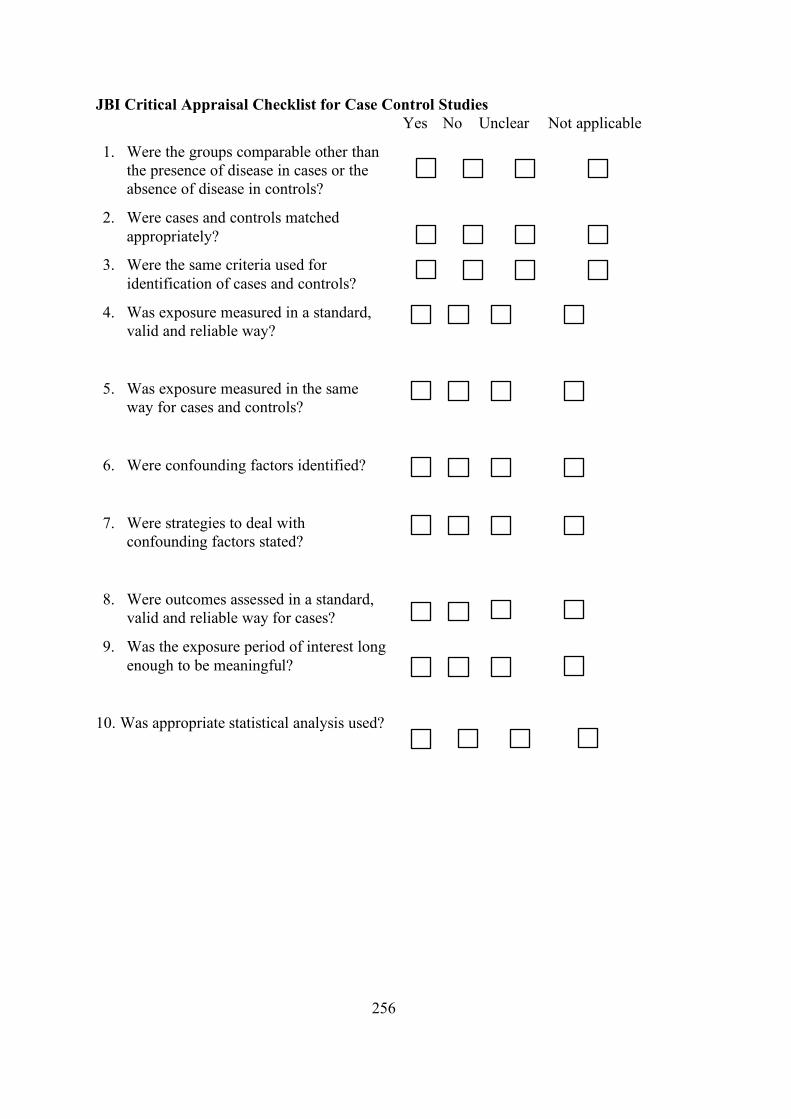
256
JBI Critical Appraisal Checklist for Case Control Studies Yes No Unclear Not applicable
1. Were the groups comparable other than the presence of disease in cases or the absence of disease in controls?
2. Were cases and controls matched appropriately?
3. Were the same criteria used for identification of cases and controls?
4. Was exposure measured in a standard, valid and reliable way?
5. Was exposure measured in the same way for cases and controls?
6. Were confounding factors identified?
7. Were strategies to deal with confounding factors stated?
8. Were outcomes assessed in a standard, valid and reliable way for cases?
9. Was the exposure period of interest long enough to be meaningful?
10. Was appropriate statistical analysis used?

257
JBI Critical Appraisal Checklist for Analytical Cross Sectional Studies Yes No Unclear Not
applicable
1. Were the criteria for inclusion in the sample clearly defined?
2. Were the study subjects and the setting described in detail?
3. Was the exposure measured in a valid and reliable way?
4. Were objective, standard criteria used for measurement of the condition?
5. Were confounding factors identified?
6. Were strategies to deal with confounding factors stated?
7. Were the outcomes measured in a valid and reliable way?
8. Was appropriate statistical analysis used?
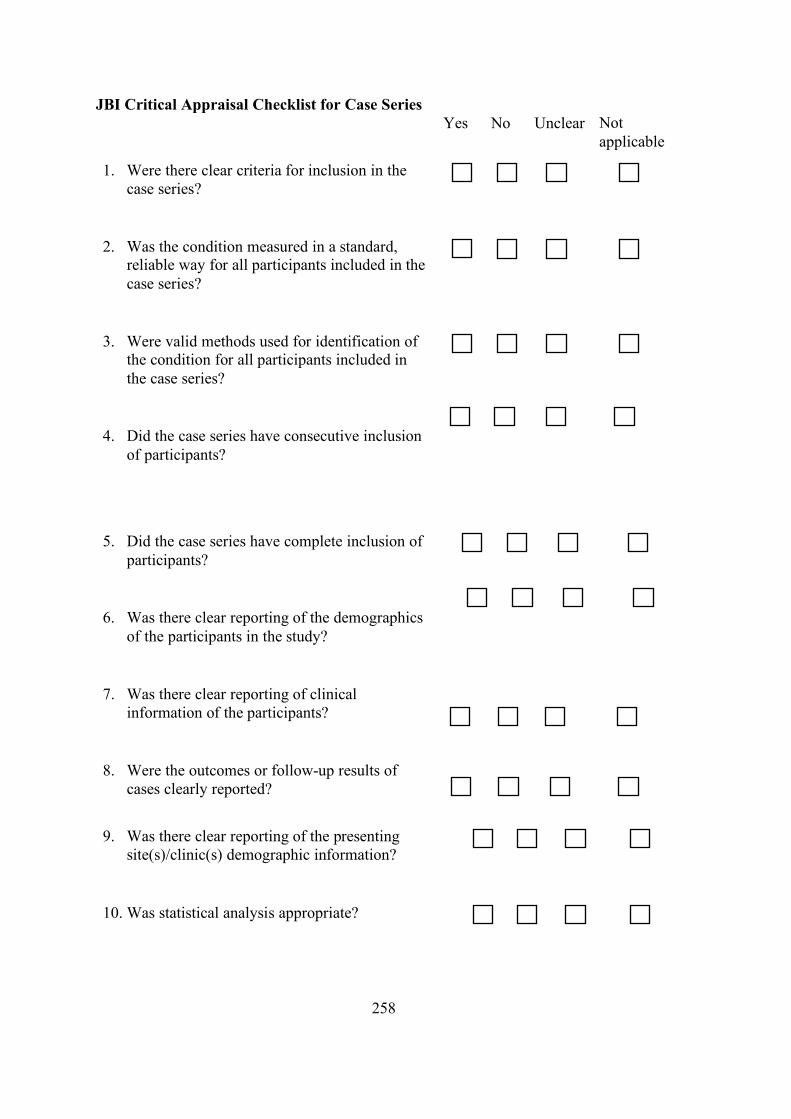
258
JBI Critical Appraisal Checklist for Case Series Yes No Unclear Not
applicable
1. Were there clear criteria for inclusion in the case series?
2. Was the condition measured in a standard, reliable way for all participants included in the case series?
3. Were valid methods used for identification of the condition for all participants included in the case series?
4. Did the case series have consecutive inclusion of participants?
5. Did the case series have complete inclusion of participants?
6. Was there clear reporting of the demographics of the participants in the study?
7. Was there clear reporting of clinical information of the participants?
8. Were the outcomes or follow-up results of cases clearly reported?
9. Was there clear reporting of the presenting
site(s)/clinic(s) demographic information?
10. Was statistical analysis appropriate?
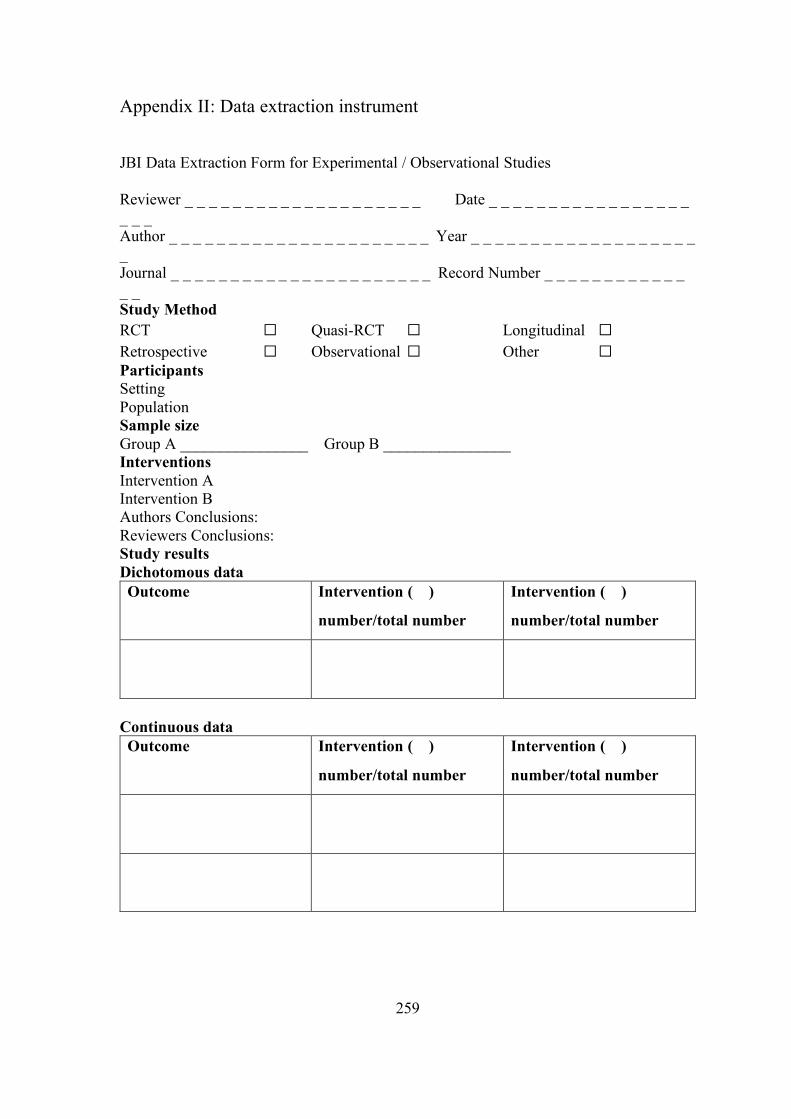
259
Appendix II: Data extraction instrument
JBI Data Extraction Form for Experimental / Observational Studies Reviewer _ _ _ _ _ _ _ _ _ _ _ _ _ _ _ _ _ _ _ _ Date _ _ _ _ _ _ _ _ _ _ _ _ _ _ _ _ _ _ _ _ Author _ _ _ _ _ _ _ _ _ _ _ _ _ _ _ _ _ _ _ _ _ _ Year _ _ _ _ _ _ _ _ _ _ _ _ _ _ _ _ _ _ _ _ Journal _ _ _ _ _ _ _ _ _ _ _ _ _ _ _ _ _ _ _ _ _ _ Record Number _ _ _ _ _ _ _ _ _ _ _ _ _ _ Study Method RCT ☐ Quasi-RCT ☐ Longitudinal ☐ Retrospective ☐ Observational ☐ Other ☐ Participants Setting Population Sample size Group A ________________ Group B ________________ Interventions Intervention A Intervention B Authors Conclusions: Reviewers Conclusions: Study results Dichotomous data Outcome Intervention ( )
number/total number
Intervention ( )
number/total number
Continuous data Outcome Intervention ( )
number/total number
Intervention ( )
number/total number
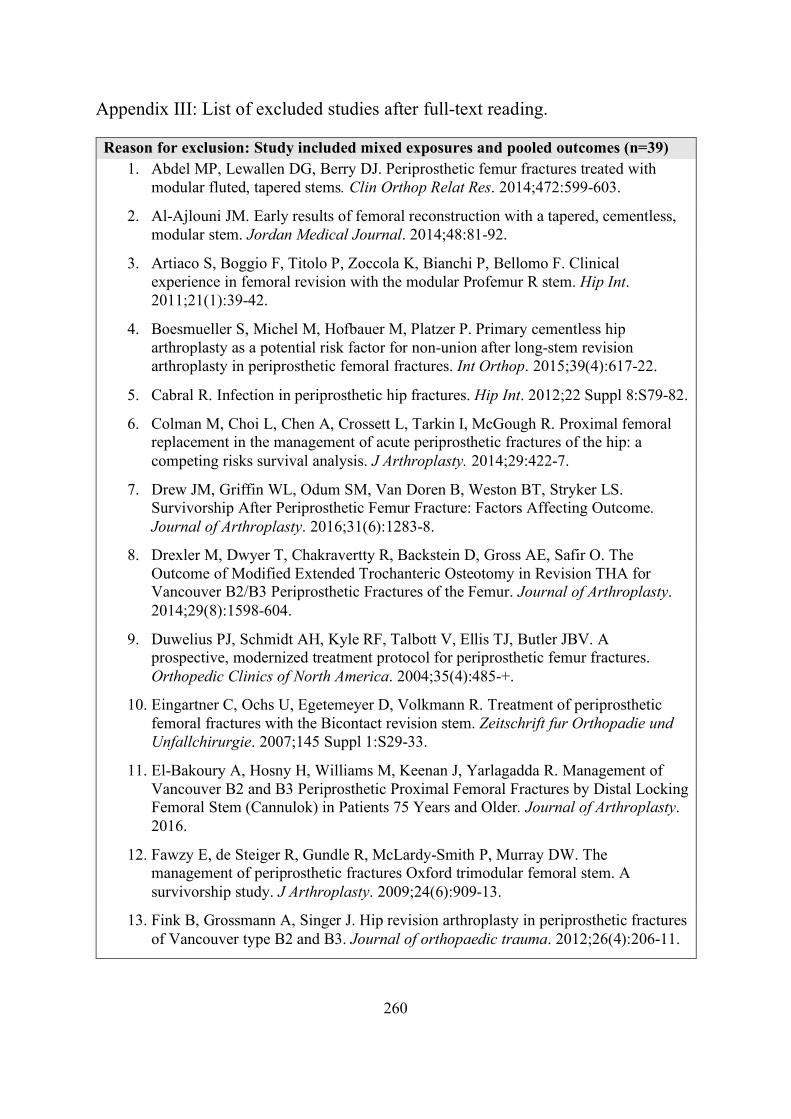
260
Appendix III: List of excluded studies after full-text reading. Reason for exclusion: Study included mixed exposures and pooled outcomes (n=39)
1. Abdel MP, Lewallen DG, Berry DJ. Periprosthetic femur fractures treated with modular fluted, tapered stems. Clin Orthop Relat Res. 2014;472:599-603.
2. Al-Ajlouni JM. Early results of femoral reconstruction with a tapered, cementless, modular stem. Jordan Medical Journal. 2014;48:81-92.
3. Artiaco S, Boggio F, Titolo P, Zoccola K, Bianchi P, Bellomo F. Clinical experience in femoral revision with the modular Profemur R stem. Hip Int. 2011;21(1):39-42.
4. Boesmueller S, Michel M, Hofbauer M, Platzer P. Primary cementless hip arthroplasty as a potential risk factor for non-union after long-stem revision arthroplasty in periprosthetic femoral fractures. Int Orthop. 2015;39(4):617-22.
5. Cabral R. Infection in periprosthetic hip fractures. Hip Int. 2012;22 Suppl 8:S79-82.
6. Colman M, Choi L, Chen A, Crossett L, Tarkin I, McGough R. Proximal femoral replacement in the management of acute periprosthetic fractures of the hip: a competing risks survival analysis. J Arthroplasty. 2014;29:422-7.
7. Drew JM, Griffin WL, Odum SM, Van Doren B, Weston BT, Stryker LS. Survivorship After Periprosthetic Femur Fracture: Factors Affecting Outcome. Journal of Arthroplasty. 2016;31(6):1283-8.
8. Drexler M, Dwyer T, Chakravertty R, Backstein D, Gross AE, Safir O. The Outcome of Modified Extended Trochanteric Osteotomy in Revision THA for Vancouver B2/B3 Periprosthetic Fractures of the Femur. Journal of Arthroplasty. 2014;29(8):1598-604.
9. Duwelius PJ, Schmidt AH, Kyle RF, Talbott V, Ellis TJ, Butler JBV. A prospective, modernized treatment protocol for periprosthetic femur fractures. Orthopedic Clinics of North America. 2004;35(4):485-+.
10. Eingartner C, Ochs U, Egetemeyer D, Volkmann R. Treatment of periprosthetic femoral fractures with the Bicontact revision stem. Zeitschrift fur Orthopadie und Unfallchirurgie. 2007;145 Suppl 1:S29-33.
11. El-Bakoury A, Hosny H, Williams M, Keenan J, Yarlagadda R. Management of Vancouver B2 and B3 Periprosthetic Proximal Femoral Fractures by Distal Locking Femoral Stem (Cannulok) in Patients 75 Years and Older. Journal of Arthroplasty. 2016.
12. Fawzy E, de Steiger R, Gundle R, McLardy-Smith P, Murray DW. The management of periprosthetic fractures Oxford trimodular femoral stem. A survivorship study. J Arthroplasty. 2009;24(6):909-13.
13. Fink B, Grossmann A, Singer J. Hip revision arthroplasty in periprosthetic fractures of Vancouver type B2 and B3. Journal of orthopaedic trauma. 2012;26(4):206-11.
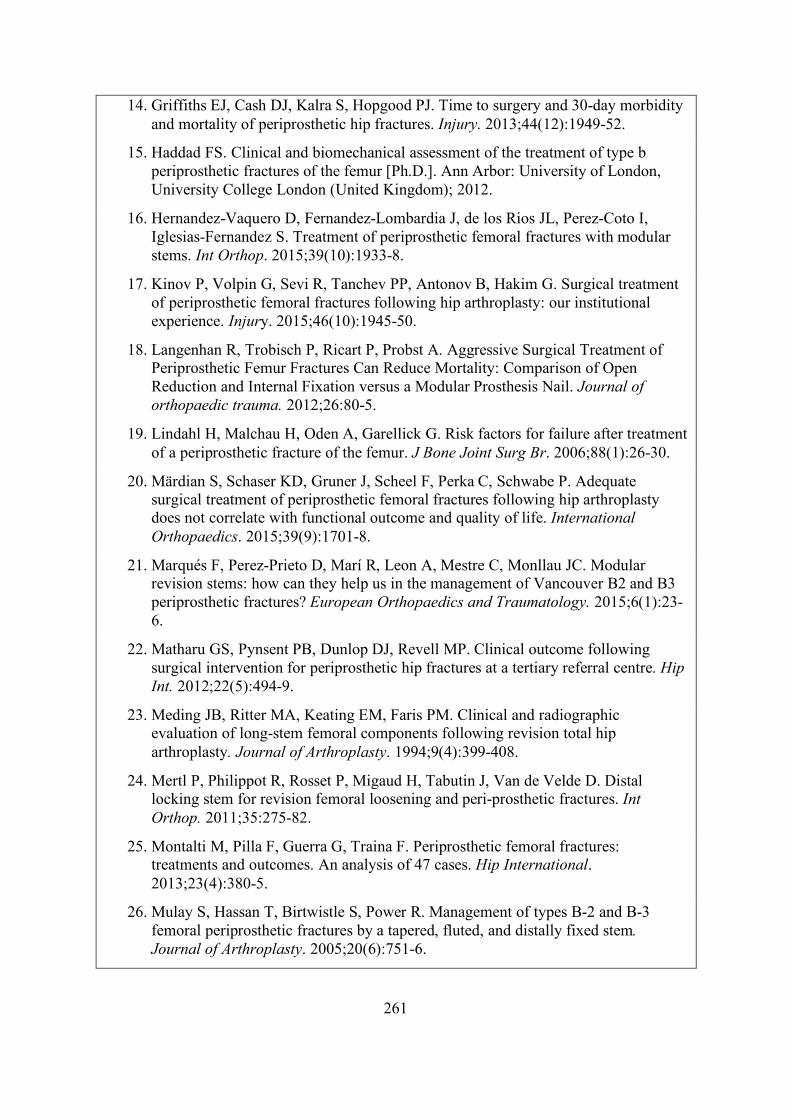
261
14. Griffiths EJ, Cash DJ, Kalra S, Hopgood PJ. Time to surgery and 30-day morbidity and mortality of periprosthetic hip fractures. Injury. 2013;44(12):1949-52.
15. Haddad FS. Clinical and biomechanical assessment of the treatment of type b periprosthetic fractures of the femur [Ph.D.]. Ann Arbor: University of London, University College London (United Kingdom); 2012.
16. Hernandez-Vaquero D, Fernandez-Lombardia J, de los Rios JL, Perez-Coto I, Iglesias-Fernandez S. Treatment of periprosthetic femoral fractures with modular stems. Int Orthop. 2015;39(10):1933-8.
17. Kinov P, Volpin G, Sevi R, Tanchev PP, Antonov B, Hakim G. Surgical treatment of periprosthetic femoral fractures following hip arthroplasty: our institutional experience. Injury. 2015;46(10):1945-50.
18. Langenhan R, Trobisch P, Ricart P, Probst A. Aggressive Surgical Treatment of Periprosthetic Femur Fractures Can Reduce Mortality: Comparison of Open Reduction and Internal Fixation versus a Modular Prosthesis Nail. Journal of orthopaedic trauma. 2012;26:80-5.
19. Lindahl H, Malchau H, Oden A, Garellick G. Risk factors for failure after treatment of a periprosthetic fracture of the femur. J Bone Joint Surg Br. 2006;88(1):26-30.
20. Märdian S, Schaser KD, Gruner J, Scheel F, Perka C, Schwabe P. Adequate surgical treatment of periprosthetic femoral fractures following hip arthroplasty does not correlate with functional outcome and quality of life. International Orthopaedics. 2015;39(9):1701-8.
21. Marqués F, Perez-Prieto D, Marí R, Leon A, Mestre C, Monllau JC. Modular revision stems: how can they help us in the management of Vancouver B2 and B3 periprosthetic fractures? European Orthopaedics and Traumatology. 2015;6(1):23-6.
22. Matharu GS, Pynsent PB, Dunlop DJ, Revell MP. Clinical outcome following surgical intervention for periprosthetic hip fractures at a tertiary referral centre. Hip Int. 2012;22(5):494-9.
23. Meding JB, Ritter MA, Keating EM, Faris PM. Clinical and radiographic evaluation of long-stem femoral components following revision total hip arthroplasty. Journal of Arthroplasty. 1994;9(4):399-408.
24. Mertl P, Philippot R, Rosset P, Migaud H, Tabutin J, Van de Velde D. Distal locking stem for revision femoral loosening and peri-prosthetic fractures. Int Orthop. 2011;35:275-82.
25. Montalti M, Pilla F, Guerra G, Traina F. Periprosthetic femoral fractures: treatments and outcomes. An analysis of 47 cases. Hip International. 2013;23(4):380-5.
26. Mulay S, Hassan T, Birtwistle S, Power R. Management of types B-2 and B-3 femoral periprosthetic fractures by a tapered, fluted, and distally fixed stem. Journal of Arthroplasty. 2005;20(6):751-6.
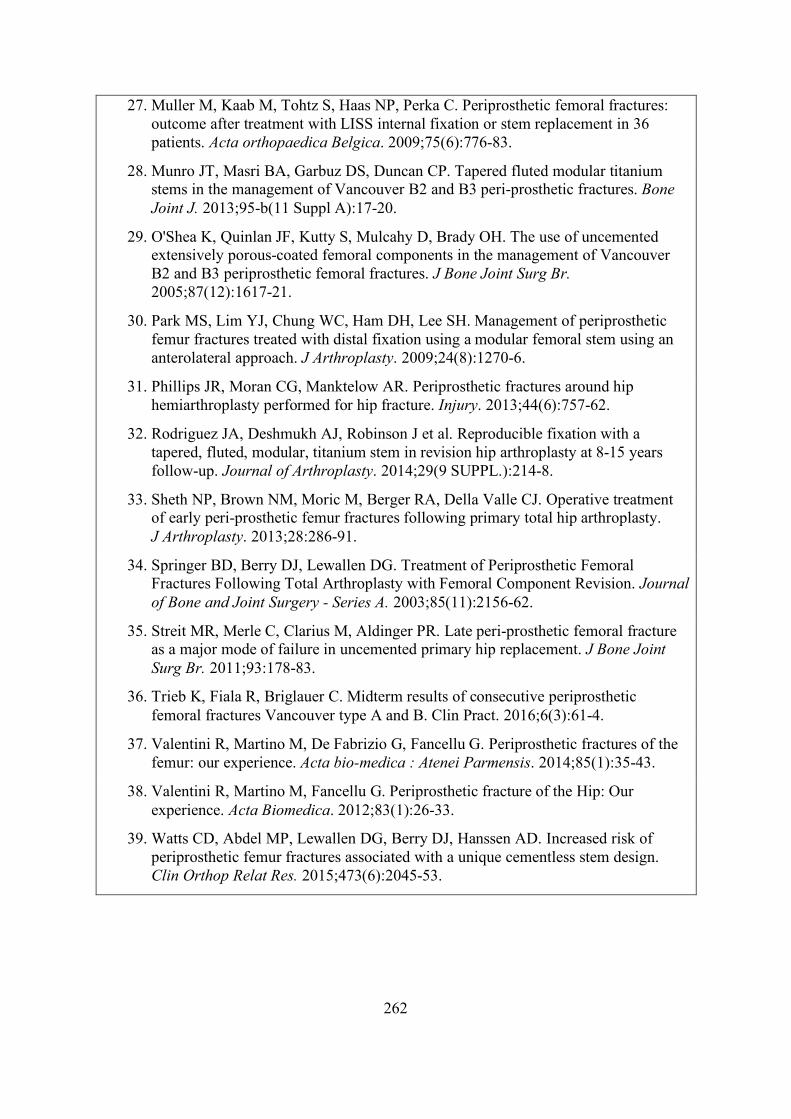
262
27. Muller M, Kaab M, Tohtz S, Haas NP, Perka C. Periprosthetic femoral fractures: outcome after treatment with LISS internal fixation or stem replacement in 36 patients. Acta orthopaedica Belgica. 2009;75(6):776-83.
28. Munro JT, Masri BA, Garbuz DS, Duncan CP. Tapered fluted modular titanium stems in the management of Vancouver B2 and B3 peri-prosthetic fractures. Bone Joint J. 2013;95-b(11 Suppl A):17-20.
29. O'Shea K, Quinlan JF, Kutty S, Mulcahy D, Brady OH. The use of uncemented extensively porous-coated femoral components in the management of Vancouver B2 and B3 periprosthetic femoral fractures. J Bone Joint Surg Br. 2005;87(12):1617-21.
30. Park MS, Lim YJ, Chung WC, Ham DH, Lee SH. Management of periprosthetic femur fractures treated with distal fixation using a modular femoral stem using an anterolateral approach. J Arthroplasty. 2009;24(8):1270-6.
31. Phillips JR, Moran CG, Manktelow AR. Periprosthetic fractures around hip hemiarthroplasty performed for hip fracture. Injury. 2013;44(6):757-62.
32. Rodriguez JA, Deshmukh AJ, Robinson J et al. Reproducible fixation with a tapered, fluted, modular, titanium stem in revision hip arthroplasty at 8-15 years follow-up. Journal of Arthroplasty. 2014;29(9 SUPPL.):214-8.
33. Sheth NP, Brown NM, Moric M, Berger RA, Della Valle CJ. Operative treatment of early peri-prosthetic femur fractures following primary total hip arthroplasty. J Arthroplasty. 2013;28:286-91.
34. Springer BD, Berry DJ, Lewallen DG. Treatment of Periprosthetic Femoral Fractures Following Total Arthroplasty with Femoral Component Revision. Journal of Bone and Joint Surgery - Series A. 2003;85(11):2156-62.
35. Streit MR, Merle C, Clarius M, Aldinger PR. Late peri-prosthetic femoral fracture as a major mode of failure in uncemented primary hip replacement. J Bone Joint Surg Br. 2011;93:178-83.
36. Trieb K, Fiala R, Briglauer C. Midterm results of consecutive periprosthetic femoral fractures Vancouver type A and B. Clin Pract. 2016;6(3):61-4.
37. Valentini R, Martino M, De Fabrizio G, Fancellu G. Periprosthetic fractures of the femur: our experience. Acta bio-medica : Atenei Parmensis. 2014;85(1):35-43.
38. Valentini R, Martino M, Fancellu G. Periprosthetic fracture of the Hip: Our experience. Acta Biomedica. 2012;83(1):26-33.
39. Watts CD, Abdel MP, Lewallen DG, Berry DJ, Hanssen AD. Increased risk of periprosthetic femur fractures associated with a unique cementless stem design. Clin Orthop Relat Res. 2015;473(6):2045-53.
263
Reason for exclusion: Study did include B2 (n=33) 1. Abhaykumar S, Elliott DS. Percutaneous plate fixation for periprosthetic femoral
fractures - a preliminary report. Injury-Int J Care Inj. 2000;31(8):627-30.
2. Amanatullah DF, Howard JL, Siman H, Trousdale RT, Mabry TM, Berry DJ. Revision total hip arthroplasty in patients with extensive proximal femoral bone loss using a fluted tapered modular femoral component. Bone Joint J. 2015;97-b(3):312-7.
3. Anakwe RE, Aitken SA, Khan LA. Osteoporotic periprosthetic fractures of the femur in elderly patients: outcome after fixation with the LISS plate. Injury. 2008;39(10):1191-7.
4. Antoci V, Appleton P, Rodriguez E. Fixation of fractures around unstable hip implants. Techniques in Orthopaedics. 2014;29(4):200-9.
5. Barden B, Ding Y, Fitzek JG, Loer F. Strut allografts for failed treatment of periprosthetic femoral fractures - Good outcome in 13 patients. Acta orthopaedica Scandinavica. 2003;74:146-53.
6. Barlow BT, Boles JW, Lee YY, Ortiz PA, Westrich GH. Short-Term Outcomes and Complications After Rejuvenate Modular Total Hip Arthroplasty Revision. Journal of Arthroplasty. 2016;31(4):857-62.
7. Bedair H, Tetrault M, Choi HR et al. A comparison of modular tapered versus modular cylindrical stems for complex femoral revisions. Journal of Arthroplasty. 2013;28(8 SUPPL):71-3.
8. Behairy Y, Meldrum RD, Harris WH. Hybrid revision total hip arthroplasty: A 7-year follow-up study. Journal of Arthroplasty. 2001;16(7):829-37.
9. Berstock JR, Whitehouse MR, Piper DC, Eastaugh-Waring SJ, Blom AW. A 5-8 year retrospective follow-up of the C-Stem AMT femoral component: Patient reported outcomes and survivorship analysis. Journal of Arthroplasty. 2014;29(9):1753-7.
10. Boesmueller S, Baumbach SF, Hofbauer M, Wozasek GE. Plate failure following plate osteosynthesis in periprosthetic femoral fractures. Wiener klinische Wochenschrift. 2015;127(19-20):770-8.
11. Crawford SA, Siney PD, Wroblewski BM. Revision of failed total hip arthroplasty with a proximal femoral modular cemented stem. J Bone Joint Surg-Br Vol. 2000;82B(5):684-8.
12. Ebraheim NA, Sochacki KR, Liu XC, Hirschfeld AG, Liu JY. Locking Plate Fixation of Periprosthetic Femur Fractures with and without Cerclage Wires. Orthopaedic surgery. 2013;5(3):183-7.
13. Evola FR, Evola G, Graceffa A et al. Performance of the CLS Spotorno uncemented stem in the third decade after implantation. Bone and Joint Journal. 2014;96 B(4):455-61.
264
14. Farfalli GL, Buttaro MA, Piccaluga F. Femoral fractures in revision hip surgeries with impacted bone allograft. Clin Orthop Relat Res. 2007;462:130-6.
15. Fulkerson E, Tejwani N, Stuchin S, Egol K. Management of periprosthetic femur fractures with a first generation locking plate. Injury. 2007;38(8):965-72.
16. Funovics PT, Vécsei V, Wozasek GE. Mid- to long-term clinical findings in nailing of distal femoral fractures. Journal of surgical orthopaedic advances. 2003;12(4):218-24.
17. Gogus A, Ozturk C, Tezer M, Camurdan K, Hamzaoglu A. ‘Sandwich technique’ in the surgical treatment of primary complex fractures of the femur and humerus. International Orthopaedics. 2007;31(1):87-92.
18. Goodman SB, Oh K, Imrie S, Hwang K, Shegog M. Revision total hip arthroplasty in juvenile chronic arthritis: 17 revisions in 11 patients followed for 4-12 years. Acta Orthopaedica. 2006;77:242-50.
19. Goosen JHM, Castelein RM, Runne WC, Dartee DA, Verheyen CCP. Long-term results of a soft interface- (Proplast-) coated femoral stem. Acta Orthopaedica. 2006;77(4):585-90.
20. Grammatopoulos G, Alvand A, Martin H, Whitwell D, Taylor A, Gibbons C. Five-year outcome of proximal femoral endoprosthetic arthroplasty for non-tumour indications. Bone & Joint Journal. 2016;98B(11):1463-70.
21. Grossmann A, Fink B. Modified transfemoral approach to revision arthroplasty with uncemented modular revision stems. Operative Orthopadie und Traumatologie. 2007;19(1):32-55.
22. Jayakumar P, Malik AK, Islam SU, Haddad FS. Revision hip arthroplasty using an extensively porous coated stem: medium term results. Hip International. 2011;21:129-35.
23. Kaab MJ, Stockle U, Schutz M, Stefansky J, Perka C, Haas NP. Stabilisation of periprosthetic fractures with angular stable internal fixation: a report of 13 cases. Arch Orthop Trauma Surg. 2006;126:105-10.
24. Kwong LM, Miller AJ, Lubinus P. A modular distal fixation option for proximal bone loss in revision total hip arthroplasty: A 2- to 6-year follow-up study. Journal of Arthroplasty. 2003;18(3 SUPPL. 1):94-7.
25. Mamczak CN, Gardner MJ, Bolhofner B, Borrelli J, Streubel PN, Ricci WM. Interprosthetic femoral fractures. Journal of orthopaedic trauma. 2010;24(12):740-4.
26. Muller FJ, Galler M, Fuchtmeier B. Clinical and radiological results of patients treated with orthogonal double plating for periprosthetic femoral fractures. Int Orthop. 2014;38(12):2469-72.
27. O'Toole RV, Gobezie R, Hwang R et al. Low complication rate of LISS for femur fractures adjacent to stable hip or knee arthroplasty. Clinical Orthopaedics and Related Research. 2006(450):203-10.
265
28. Parvizi J, Tarity TD, Slenker N et al. Proximal femoral replacement in patients with non-neoplastic conditions. Journal of Bone and Joint Surgery - Series A. 2007;89(5):1036-43.
29. Patel AA, Ricci WM, McDonald DJ, Borrelli J, Clohisy JC. Treatment of periprosthetic femoral shaft nonunion. J Arthroplasty. 2006;21(3):435-42.
30. Raut S, Parker MJ. Medium to long term follow up of a consecutive series of 604 Exeter Trauma Stem Hemiarthroplasties (ETS) for the treatment of displaced intracapsular femoral neck fractures. Injury. 2016.
31. Reikerås O, Gunderson RB. Excellent results with femoral revision surgery using an extensively hydroxyapatite-coated stem: 59 patients followed for 10-16 years. Acta Orthopaedica. 2006;77(1):98-103.
32. Robinson JD, Leighton RK, Trask K, Bogdan Y, Tornetta P. Periprosthetic Atypical Femoral Fractures in Patients on Long-term Bisphosphonates: A Multicenter Retrospective Review. Journal of orthopaedic trauma. 2016;30(4):170-6.
33. Ruchholtz S, El-Zayat B, Kreslo D et al. Less invasive polyaxial locking plate fixation in periprosthetic and peri-implant fractures of the femur–a prospective study of 41 patients. Injury. 2013;44:239-48.
Reason for exclusion: Study included less than 5 B2 (n=22) 1. Abendschein W. Periprosthetic femur fractures--a growing epidemic. American
journal of orthopedics (Belle Mead, NJ). 2003;32(9 Suppl):34-6.
2. Baker D, Kadambande SS, Alderman PM. Carbon fibre plates in the treatment of femoral periprosthetic fractures. Injury. 2004;35(6):596-8.
3. Chomrikh L, Gebuhr P, Bierling R, Lind U, Zwart HJ. Age-dependent fracture risk in hip revisions with radial impaction grafting technique: a 5-10 year medium-term follow-up study. J Arthroplasty. 2014;29:443-7.
4. Clement ND, MacDonald D, Ahmed I, Patton JT, Howie CR. Total femoral replacement for salvage of periprosthetic fractures. Orthopedics. 2014;37(9):e789-95.
5. Ebraheim N, Carroll T, Moral MZ, Lea J, Hirschfeld A, Liu JY. Interprosthetic femoral fractures treated with locking plate. International Orthopaedics. 2014;38(10):2183-9.
6. Erhardt JB, Grob K, Roderer G, Hoffmann A, Forster TN, Kuster MS. Treatment of periprosthetic femur fractures with the non-contact bridging plate: a new angular stable implant. Arch Orthop Trauma Surg. 2008;128(4):409-16.
7. Flecher X, Blanc G, Sainsous B, Parratte S, Argenson JN. A customised collared polished stem may reduce the complication rate of impaction grafting in revision hip surgery: a 12-year follow-up study. J Bone Joint Surg Br. 2012;94(5):609-14.
266
8. Font-Vizcarra L, Fernandez-Valencia JA, Gallart X, Segur JM, Prat S, Riba J. Cortical strut allograft as an adjunct to plate fixation for periprosthetic fractures of the femur. Hip International. 2010;20(1):43-9.
9. Hou Z, Moore B, Bowen TR et al. Treatment of interprosthetic fractures of the femur. The Journal of trauma. 2011;71(6):1715-9.
10. Kobbe P, Klemm R, Reilmann H, Hockertz TJ. Less invasive stabilisation system (LISS) for the treatment of periprosthetic femoral fractures: a 3-year follow-up. Injury. 2008;39(4):472-9.
11. Kumar V, Kanabar P, Owen PJ, Rushton N. Less invasive stabilization system for the management of periprosthetic femoral fractures around hip arthroplasty. J Arthroplasty. 2008;23(3):446-50.
12. Lundh F, Sayed-Noor AS, Brosjo O, Bauer H. Megaprosthetic reconstruction for periprosthetic or highly comminuted fractures of the hip and knee. European journal of orthopaedic surgery & traumatology : orthopedie traumatologie. 2014;24(4):553-7.
13. Mathew PG, Sponer P, Kucera T, Grinac M, Knizek J. Total HIP arthroplasty in patients with Parkinson's disease. Acta medica (Hradec Kralove). 2013;56(3):110-6.
14. Niikura T, Sakurai A, Oe K et al. Clinical and radiological results of locking plate fixation for periprosthetic femoral fractures around hip arthroplasties: a retrospective multi-center study. Journal of orthopaedic science : official journal of the Japanese Orthopaedic Association. 2014;19(6):984-90.
15. Park SK, Kim YG, Kim SY. Treatment of periprosthetic femoral fractures in hip arthroplasty. Clinics in orthopedic surgery. 2011;3:101-6.
16. Pospula W, Abu Noor T. Periprosthetic fractures of the femur after hip and knee replacement. Analysis of treatment results in Al Razi Hospital. Medical principles and practice: international journal of the Kuwait University, Health Science Centre. 2009;18(3):198-203.
17. Restrepo C, Mashadi M, Parvizi J, Austin MS, Hozack WJ. Modular femoral stems for revision total hip arthroplasty. Clinical Orthopaedics and Related Research. 2011;469:476-82.
18. Ricci WM, Borrelli J, Jr. Operative management of periprosthetic femur fractures in the elderly using biological fracture reduction and fixation techniques. Injury. 2007;38 Suppl 3:S53-8.
19. Savin L, Barharosie C, Botez P. Periprosthetic femoral fractures--evaluation of risk factors. Revista medico-chirurgicala a Societatii de Medici si Naturalisti din Iasi. 2012;116(3):846-52.
20. Venu KM, Koka R, Garikipati R, Shenava Y, Madhu TS. Dall-Miles cable and plate fixation for the treatment of peri-prosthetic femoral fractures-analysis of results in 13 cases. Injury. 2001;32(5):395-400.
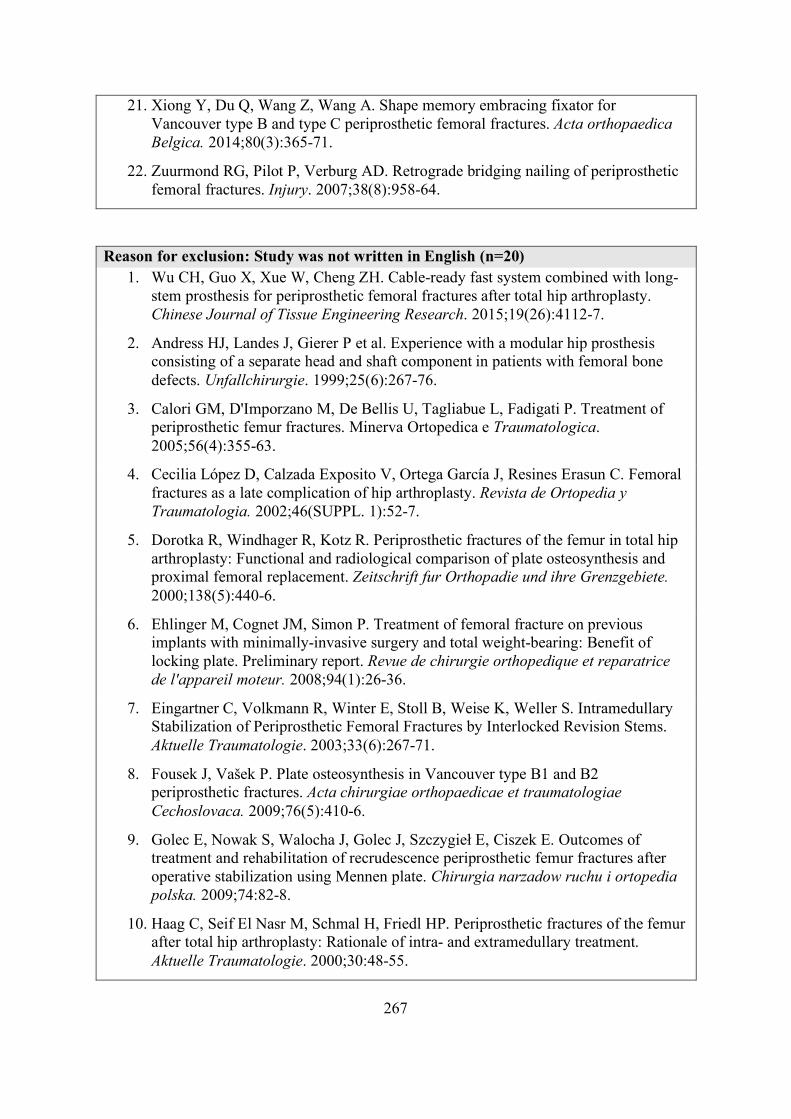
267
21. Xiong Y, Du Q, Wang Z, Wang A. Shape memory embracing fixator for Vancouver type B and type C periprosthetic femoral fractures. Acta orthopaedica Belgica. 2014;80(3):365-71.
22. Zuurmond RG, Pilot P, Verburg AD. Retrograde bridging nailing of periprosthetic femoral fractures. Injury. 2007;38(8):958-64.
Reason for exclusion: Study was not written in English (n=20) 1. Wu CH, Guo X, Xue W, Cheng ZH. Cable-ready fast system combined with long-
stem prosthesis for periprosthetic femoral fractures after total hip arthroplasty. Chinese Journal of Tissue Engineering Research. 2015;19(26):4112-7.
2. Andress HJ, Landes J, Gierer P et al. Experience with a modular hip prosthesis consisting of a separate head and shaft component in patients with femoral bone defects. Unfallchirurgie. 1999;25(6):267-76.
3. Calori GM, D'Imporzano M, De Bellis U, Tagliabue L, Fadigati P. Treatment of periprosthetic femur fractures. Minerva Ortopedica e Traumatologica. 2005;56(4):355-63.
4. Cecilia López D, Calzada Exposito V, Ortega García J, Resines Erasun C. Femoral fractures as a late complication of hip arthroplasty. Revista de Ortopedia y Traumatologia. 2002;46(SUPPL. 1):52-7.
5. Dorotka R, Windhager R, Kotz R. Periprosthetic fractures of the femur in total hip arthroplasty: Functional and radiological comparison of plate osteosynthesis and proximal femoral replacement. Zeitschrift fur Orthopadie und ihre Grenzgebiete. 2000;138(5):440-6.
6. Ehlinger M, Cognet JM, Simon P. Treatment of femoral fracture on previous implants with minimally-invasive surgery and total weight-bearing: Benefit of locking plate. Preliminary report. Revue de chirurgie orthopedique et reparatrice de l'appareil moteur. 2008;94(1):26-36.
7. Eingartner C, Volkmann R, Winter E, Stoll B, Weise K, Weller S. Intramedullary Stabilization of Periprosthetic Femoral Fractures by Interlocked Revision Stems. Aktuelle Traumatologie. 2003;33(6):267-71.
8. Fousek J, Vašek P. Plate osteosynthesis in Vancouver type B1 and B2 periprosthetic fractures. Acta chirurgiae orthopaedicae et traumatologiae Cechoslovaca. 2009;76(5):410-6.
9. Golec E, Nowak S, Walocha J, Golec J, Szczygieł E, Ciszek E. Outcomes of treatment and rehabilitation of recrudescence periprosthetic femur fractures after operative stabilization using Mennen plate. Chirurgia narzadow ruchu i ortopedia polska. 2009;74:82-8.
10. Haag C, Seif El Nasr M, Schmal H, Friedl HP. Periprosthetic fractures of the femur after total hip arthroplasty: Rationale of intra- and extramedullary treatment. Aktuelle Traumatologie. 2000;30:48-55.
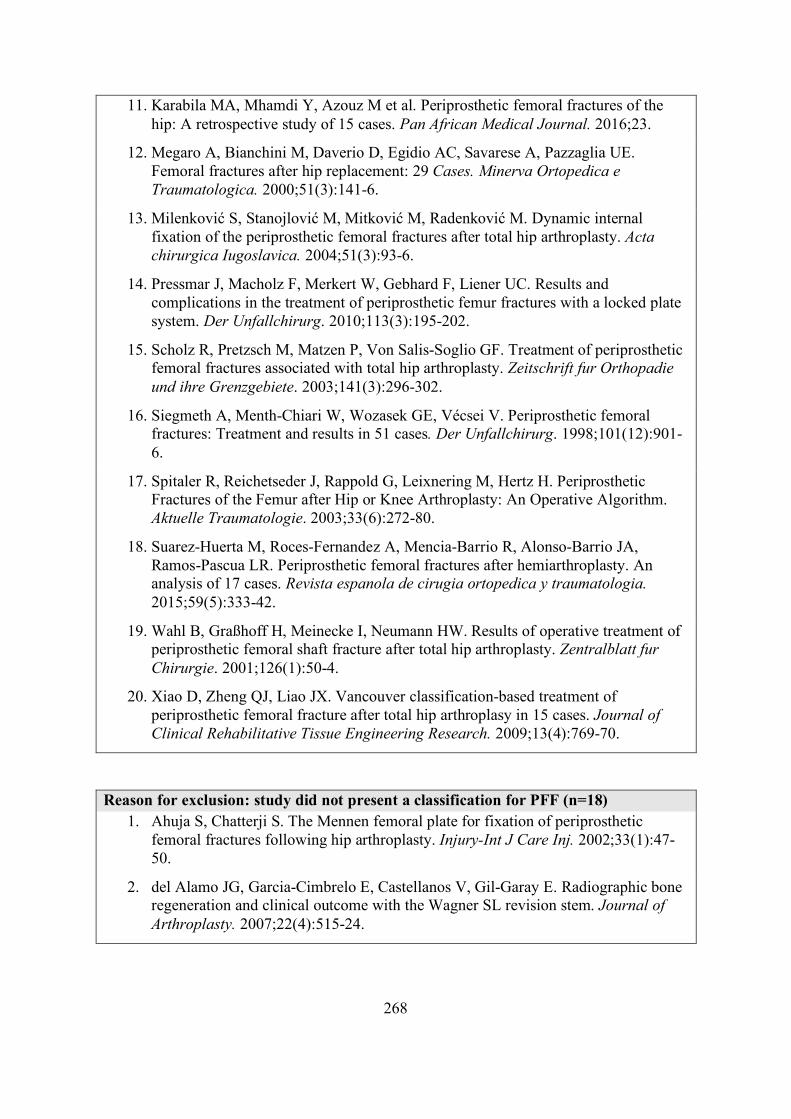
268
11. Karabila MA, Mhamdi Y, Azouz M et al. Periprosthetic femoral fractures of the hip: A retrospective study of 15 cases. Pan African Medical Journal. 2016;23.
12. Megaro A, Bianchini M, Daverio D, Egidio AC, Savarese A, Pazzaglia UE. Femoral fractures after hip replacement: 29 Cases. Minerva Ortopedica e Traumatologica. 2000;51(3):141-6.
13. Milenković S, Stanojlović M, Mitković M, Radenković M. Dynamic internal fixation of the periprosthetic femoral fractures after total hip arthroplasty. Acta chirurgica Iugoslavica. 2004;51(3):93-6.
14. Pressmar J, Macholz F, Merkert W, Gebhard F, Liener UC. Results and complications in the treatment of periprosthetic femur fractures with a locked plate system. Der Unfallchirurg. 2010;113(3):195-202.
15. Scholz R, Pretzsch M, Matzen P, Von Salis-Soglio GF. Treatment of periprosthetic femoral fractures associated with total hip arthroplasty. Zeitschrift fur Orthopadie und ihre Grenzgebiete. 2003;141(3):296-302.
16. Siegmeth A, Menth-Chiari W, Wozasek GE, Vécsei V. Periprosthetic femoral fractures: Treatment and results in 51 cases. Der Unfallchirurg. 1998;101(12):901-6.
17. Spitaler R, Reichetseder J, Rappold G, Leixnering M, Hertz H. Periprosthetic Fractures of the Femur after Hip or Knee Arthroplasty: An Operative Algorithm. Aktuelle Traumatologie. 2003;33(6):272-80.
18. Suarez-Huerta M, Roces-Fernandez A, Mencia-Barrio R, Alonso-Barrio JA, Ramos-Pascua LR. Periprosthetic femoral fractures after hemiarthroplasty. An analysis of 17 cases. Revista espanola de cirugia ortopedica y traumatologia. 2015;59(5):333-42.
19. Wahl B, Graßhoff H, Meinecke I, Neumann HW. Results of operative treatment of periprosthetic femoral shaft fracture after total hip arthroplasty. Zentralblatt fur Chirurgie. 2001;126(1):50-4.
20. Xiao D, Zheng QJ, Liao JX. Vancouver classification-based treatment of periprosthetic femoral fracture after total hip arthroplasy in 15 cases. Journal of Clinical Rehabilitative Tissue Engineering Research. 2009;13(4):769-70.
Reason for exclusion: study did not present a classification for PFF (n=18) 1. Ahuja S, Chatterji S. The Mennen femoral plate for fixation of periprosthetic
femoral fractures following hip arthroplasty. Injury-Int J Care Inj. 2002;33(1):47-50.
2. del Alamo JG, Garcia-Cimbrelo E, Castellanos V, Gil-Garay E. Radiographic bone regeneration and clinical outcome with the Wagner SL revision stem. Journal of Arthroplasty. 2007;22(4):515-24.
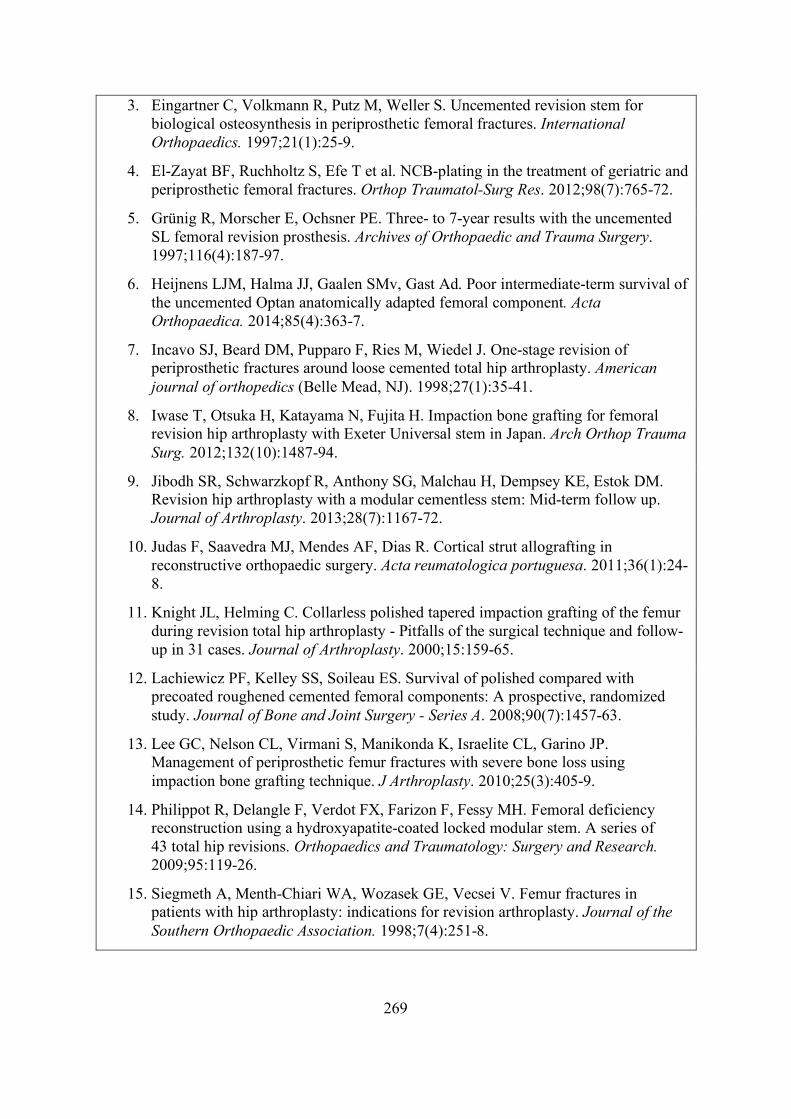
269
3. Eingartner C, Volkmann R, Putz M, Weller S. Uncemented revision stem for biological osteosynthesis in periprosthetic femoral fractures. International Orthopaedics. 1997;21(1):25-9.
4. El-Zayat BF, Ruchholtz S, Efe T et al. NCB-plating in the treatment of geriatric and periprosthetic femoral fractures. Orthop Traumatol-Surg Res. 2012;98(7):765-72.
5. Grünig R, Morscher E, Ochsner PE. Three- to 7-year results with the uncemented SL femoral revision prosthesis. Archives of Orthopaedic and Trauma Surgery. 1997;116(4):187-97.
6. Heijnens LJM, Halma JJ, Gaalen SMv, Gast Ad. Poor intermediate-term survival of the uncemented Optan anatomically adapted femoral component. Acta Orthopaedica. 2014;85(4):363-7.
7. Incavo SJ, Beard DM, Pupparo F, Ries M, Wiedel J. One-stage revision of periprosthetic fractures around loose cemented total hip arthroplasty. American journal of orthopedics (Belle Mead, NJ). 1998;27(1):35-41.
8. Iwase T, Otsuka H, Katayama N, Fujita H. Impaction bone grafting for femoral revision hip arthroplasty with Exeter Universal stem in Japan. Arch Orthop Trauma Surg. 2012;132(10):1487-94.
9. Jibodh SR, Schwarzkopf R, Anthony SG, Malchau H, Dempsey KE, Estok DM. Revision hip arthroplasty with a modular cementless stem: Mid-term follow up. Journal of Arthroplasty. 2013;28(7):1167-72.
10. Judas F, Saavedra MJ, Mendes AF, Dias R. Cortical strut allografting in reconstructive orthopaedic surgery. Acta reumatologica portuguesa. 2011;36(1):24-8.
11. Knight JL, Helming C. Collarless polished tapered impaction grafting of the femur during revision total hip arthroplasty - Pitfalls of the surgical technique and follow-up in 31 cases. Journal of Arthroplasty. 2000;15:159-65.
12. Lachiewicz PF, Kelley SS, Soileau ES. Survival of polished compared with precoated roughened cemented femoral components: A prospective, randomized study. Journal of Bone and Joint Surgery - Series A. 2008;90(7):1457-63.
13. Lee GC, Nelson CL, Virmani S, Manikonda K, Israelite CL, Garino JP. Management of periprosthetic femur fractures with severe bone loss using impaction bone grafting technique. J Arthroplasty. 2010;25(3):405-9.
14. Philippot R, Delangle F, Verdot FX, Farizon F, Fessy MH. Femoral deficiency reconstruction using a hydroxyapatite-coated locked modular stem. A series of 43 total hip revisions. Orthopaedics and Traumatology: Surgery and Research. 2009;95:119-26.
15. Siegmeth A, Menth-Chiari WA, Wozasek GE, Vecsei V. Femur fractures in patients with hip arthroplasty: indications for revision arthroplasty. Journal of the Southern Orthopaedic Association. 1998;7(4):251-8.
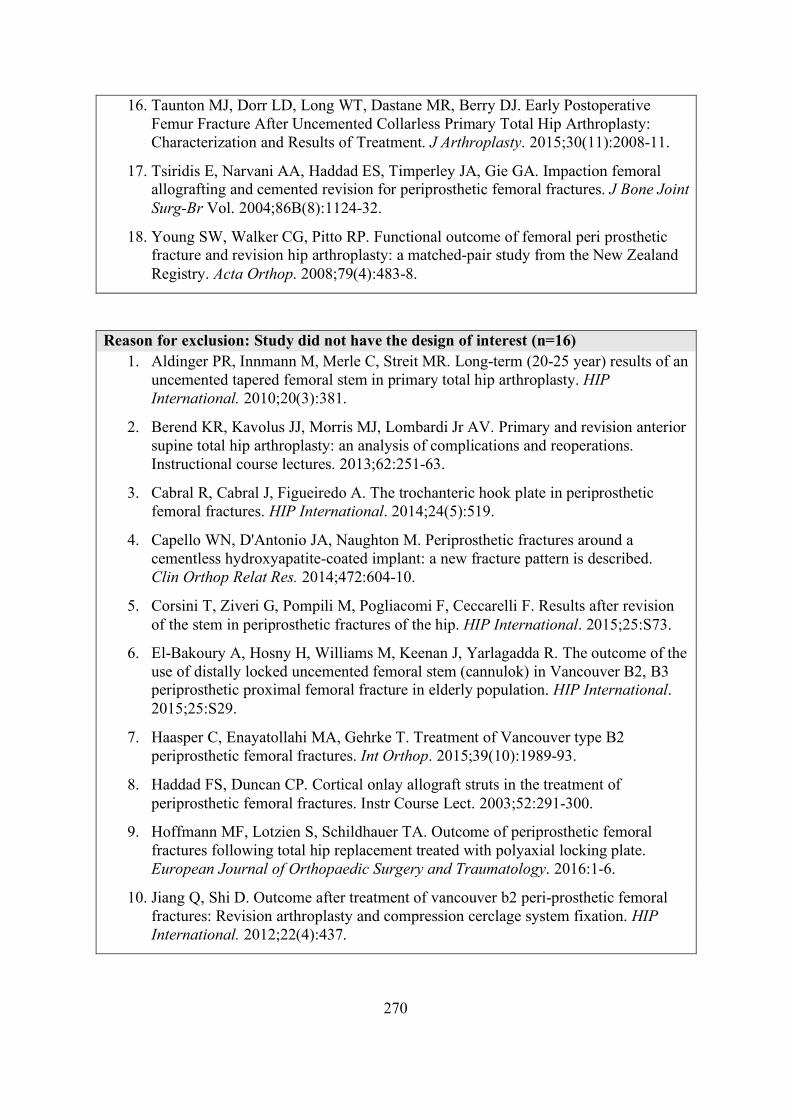
270
16. Taunton MJ, Dorr LD, Long WT, Dastane MR, Berry DJ. Early Postoperative Femur Fracture After Uncemented Collarless Primary Total Hip Arthroplasty: Characterization and Results of Treatment. J Arthroplasty. 2015;30(11):2008-11.
17. Tsiridis E, Narvani AA, Haddad ES, Timperley JA, Gie GA. Impaction femoral allografting and cemented revision for periprosthetic femoral fractures. J Bone Joint Surg-Br Vol. 2004;86B(8):1124-32.
18. Young SW, Walker CG, Pitto RP. Functional outcome of femoral peri prosthetic fracture and revision hip arthroplasty: a matched-pair study from the New Zealand Registry. Acta Orthop. 2008;79(4):483-8.
Reason for exclusion: Study did not have the design of interest (n=16) 1. Aldinger PR, Innmann M, Merle C, Streit MR. Long-term (20-25 year) results of an
uncemented tapered femoral stem in primary total hip arthroplasty. HIP International. 2010;20(3):381.
2. Berend KR, Kavolus JJ, Morris MJ, Lombardi Jr AV. Primary and revision anterior supine total hip arthroplasty: an analysis of complications and reoperations. Instructional course lectures. 2013;62:251-63.
3. Cabral R, Cabral J, Figueiredo A. The trochanteric hook plate in periprosthetic femoral fractures. HIP International. 2014;24(5):519.
4. Capello WN, D'Antonio JA, Naughton M. Periprosthetic fractures around a cementless hydroxyapatite-coated implant: a new fracture pattern is described. Clin Orthop Relat Res. 2014;472:604-10.
5. Corsini T, Ziveri G, Pompili M, Pogliacomi F, Ceccarelli F. Results after revision of the stem in periprosthetic fractures of the hip. HIP International. 2015;25:S73.
6. El-Bakoury A, Hosny H, Williams M, Keenan J, Yarlagadda R. The outcome of the use of distally locked uncemented femoral stem (cannulok) in Vancouver B2, B3 periprosthetic proximal femoral fracture in elderly population. HIP International. 2015;25:S29.
7. Haasper C, Enayatollahi MA, Gehrke T. Treatment of Vancouver type B2 periprosthetic femoral fractures. Int Orthop. 2015;39(10):1989-93.
8. Haddad FS, Duncan CP. Cortical onlay allograft struts in the treatment of periprosthetic femoral fractures. Instr Course Lect. 2003;52:291-300.
9. Hoffmann MF, Lotzien S, Schildhauer TA. Outcome of periprosthetic femoral fractures following total hip replacement treated with polyaxial locking plate. European Journal of Orthopaedic Surgery and Traumatology. 2016:1-6.
10. Jiang Q, Shi D. Outcome after treatment of vancouver b2 peri-prosthetic femoral fractures: Revision arthroplasty and compression cerclage system fixation. HIP International. 2012;22(4):437.
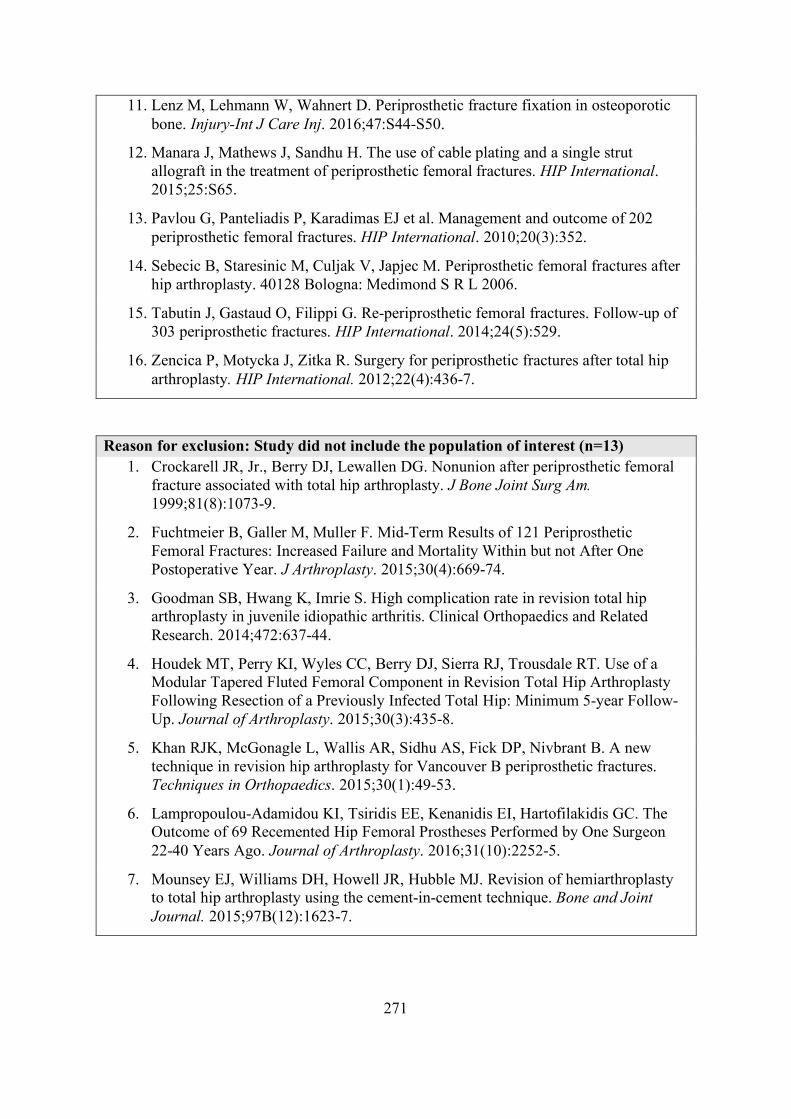
271
11. Lenz M, Lehmann W, Wahnert D. Periprosthetic fracture fixation in osteoporotic bone. Injury-Int J Care Inj. 2016;47:S44-S50.
12. Manara J, Mathews J, Sandhu H. The use of cable plating and a single strut allograft in the treatment of periprosthetic femoral fractures. HIP International. 2015;25:S65.
13. Pavlou G, Panteliadis P, Karadimas EJ et al. Management and outcome of 202 periprosthetic femoral fractures. HIP International. 2010;20(3):352.
14. Sebecic B, Staresinic M, Culjak V, Japjec M. Periprosthetic femoral fractures after hip arthroplasty. 40128 Bologna: Medimond S R L 2006.
15. Tabutin J, Gastaud O, Filippi G. Re-periprosthetic femoral fractures. Follow-up of 303 periprosthetic fractures. HIP International. 2014;24(5):529.
16. Zencica P, Motycka J, Zitka R. Surgery for periprosthetic fractures after total hip arthroplasty. HIP International. 2012;22(4):436-7.
Reason for exclusion: Study did not include the population of interest (n=13) 1. Crockarell JR, Jr., Berry DJ, Lewallen DG. Nonunion after periprosthetic femoral
fracture associated with total hip arthroplasty. J Bone Joint Surg Am. 1999;81(8):1073-9.
2. Fuchtmeier B, Galler M, Muller F. Mid-Term Results of 121 Periprosthetic Femoral Fractures: Increased Failure and Mortality Within but not After One Postoperative Year. J Arthroplasty. 2015;30(4):669-74.
3. Goodman SB, Hwang K, Imrie S. High complication rate in revision total hip arthroplasty in juvenile idiopathic arthritis. Clinical Orthopaedics and Related Research. 2014;472:637-44.
4. Houdek MT, Perry KI, Wyles CC, Berry DJ, Sierra RJ, Trousdale RT. Use of a Modular Tapered Fluted Femoral Component in Revision Total Hip Arthroplasty Following Resection of a Previously Infected Total Hip: Minimum 5-year Follow-Up. Journal of Arthroplasty. 2015;30(3):435-8.
5. Khan RJK, McGonagle L, Wallis AR, Sidhu AS, Fick DP, Nivbrant B. A new technique in revision hip arthroplasty for Vancouver B periprosthetic fractures. Techniques in Orthopaedics. 2015;30(1):49-53.
6. Lampropoulou-Adamidou KI, Tsiridis EE, Kenanidis EI, Hartofilakidis GC. The Outcome of 69 Recemented Hip Femoral Prostheses Performed by One Surgeon 22-40 Years Ago. Journal of Arthroplasty. 2016;31(10):2252-5.
7. Mounsey EJ, Williams DH, Howell JR, Hubble MJ. Revision of hemiarthroplasty to total hip arthroplasty using the cement-in-cement technique. Bone and Joint Journal. 2015;97B(12):1623-7.
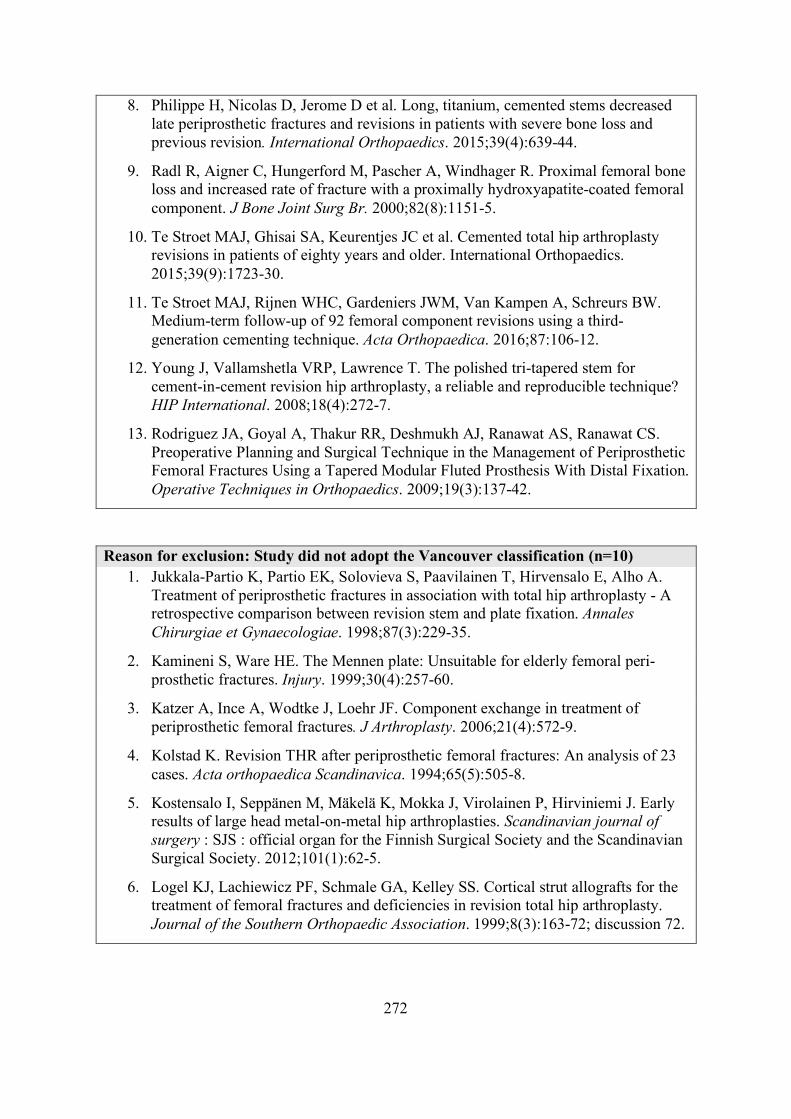
272
8. Philippe H, Nicolas D, Jerome D et al. Long, titanium, cemented stems decreased late periprosthetic fractures and revisions in patients with severe bone loss and previous revision. International Orthopaedics. 2015;39(4):639-44.
9. Radl R, Aigner C, Hungerford M, Pascher A, Windhager R. Proximal femoral bone loss and increased rate of fracture with a proximally hydroxyapatite-coated femoral component. J Bone Joint Surg Br. 2000;82(8):1151-5.
10. Te Stroet MAJ, Ghisai SA, Keurentjes JC et al. Cemented total hip arthroplasty revisions in patients of eighty years and older. International Orthopaedics. 2015;39(9):1723-30.
11. Te Stroet MAJ, Rijnen WHC, Gardeniers JWM, Van Kampen A, Schreurs BW. Medium-term follow-up of 92 femoral component revisions using a third-generation cementing technique. Acta Orthopaedica. 2016;87:106-12.
12. Young J, Vallamshetla VRP, Lawrence T. The polished tri-tapered stem for cement-in-cement revision hip arthroplasty, a reliable and reproducible technique? HIP International. 2008;18(4):272-7.
13. Rodriguez JA, Goyal A, Thakur RR, Deshmukh AJ, Ranawat AS, Ranawat CS. Preoperative Planning and Surgical Technique in the Management of Periprosthetic Femoral Fractures Using a Tapered Modular Fluted Prosthesis With Distal Fixation. Operative Techniques in Orthopaedics. 2009;19(3):137-42.
Reason for exclusion: Study did not adopt the Vancouver classification (n=10) 1. Jukkala-Partio K, Partio EK, Solovieva S, Paavilainen T, Hirvensalo E, Alho A.
Treatment of periprosthetic fractures in association with total hip arthroplasty - A retrospective comparison between revision stem and plate fixation. Annales Chirurgiae et Gynaecologiae. 1998;87(3):229-35.
2. Kamineni S, Ware HE. The Mennen plate: Unsuitable for elderly femoral peri-prosthetic fractures. Injury. 1999;30(4):257-60.
3. Katzer A, Ince A, Wodtke J, Loehr JF. Component exchange in treatment of periprosthetic femoral fractures. J Arthroplasty. 2006;21(4):572-9.
4. Kolstad K. Revision THR after periprosthetic femoral fractures: An analysis of 23 cases. Acta orthopaedica Scandinavica. 1994;65(5):505-8.
5. Kostensalo I, Seppänen M, Mäkelä K, Mokka J, Virolainen P, Hirviniemi J. Early results of large head metal-on-metal hip arthroplasties. Scandinavian journal of surgery : SJS : official organ for the Finnish Surgical Society and the Scandinavian Surgical Society. 2012;101(1):62-5.
6. Logel KJ, Lachiewicz PF, Schmale GA, Kelley SS. Cortical strut allografts for the treatment of femoral fractures and deficiencies in revision total hip arthroplasty. Journal of the Southern Orthopaedic Association. 1999;8(3):163-72; discussion 72.
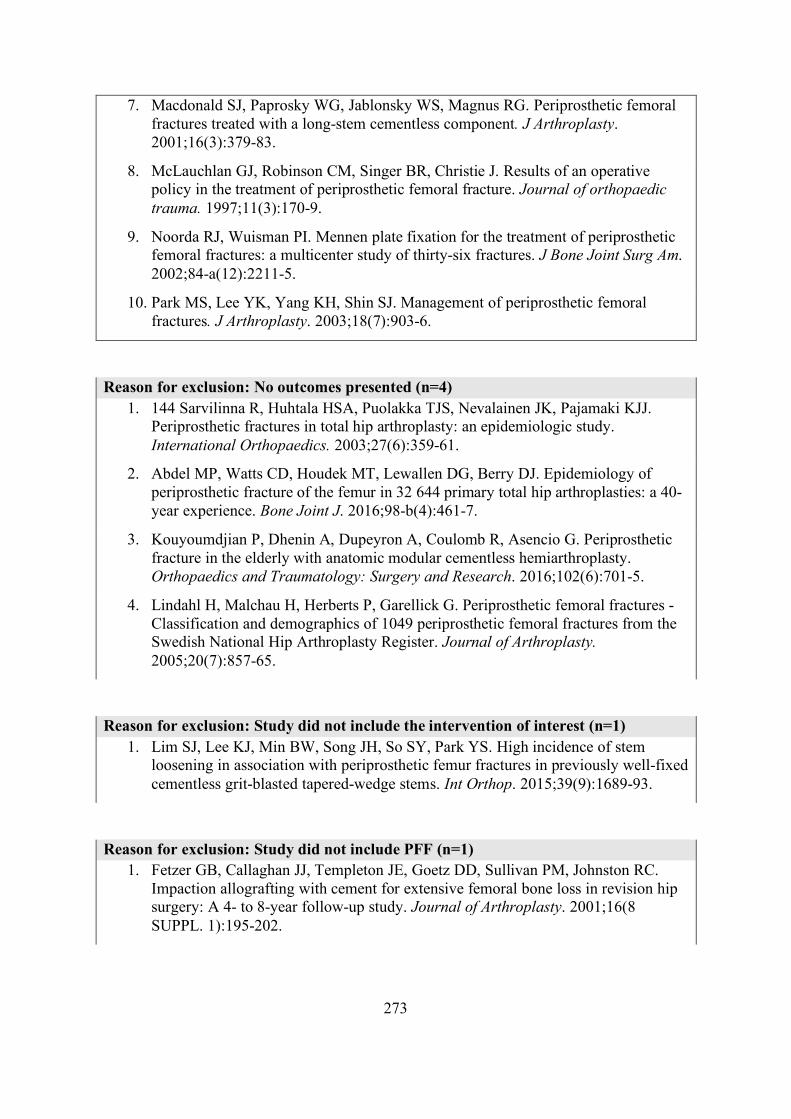
273
7. Macdonald SJ, Paprosky WG, Jablonsky WS, Magnus RG. Periprosthetic femoral fractures treated with a long-stem cementless component. J Arthroplasty. 2001;16(3):379-83.
8. McLauchlan GJ, Robinson CM, Singer BR, Christie J. Results of an operative policy in the treatment of periprosthetic femoral fracture. Journal of orthopaedic trauma. 1997;11(3):170-9.
9. Noorda RJ, Wuisman PI. Mennen plate fixation for the treatment of periprosthetic femoral fractures: a multicenter study of thirty-six fractures. J Bone Joint Surg Am. 2002;84-a(12):2211-5.
10. Park MS, Lee YK, Yang KH, Shin SJ. Management of periprosthetic femoral fractures. J Arthroplasty. 2003;18(7):903-6.
Reason for exclusion: No outcomes presented (n=4) 1. 144 Sarvilinna R, Huhtala HSA, Puolakka TJS, Nevalainen JK, Pajamaki KJJ.
Periprosthetic fractures in total hip arthroplasty: an epidemiologic study. International Orthopaedics. 2003;27(6):359-61.
2. Abdel MP, Watts CD, Houdek MT, Lewallen DG, Berry DJ. Epidemiology of periprosthetic fracture of the femur in 32 644 primary total hip arthroplasties: a 40-year experience. Bone Joint J. 2016;98-b(4):461-7.
3. Kouyoumdjian P, Dhenin A, Dupeyron A, Coulomb R, Asencio G. Periprosthetic fracture in the elderly with anatomic modular cementless hemiarthroplasty. Orthopaedics and Traumatology: Surgery and Research. 2016;102(6):701-5.
4. Lindahl H, Malchau H, Herberts P, Garellick G. Periprosthetic femoral fractures - Classification and demographics of 1049 periprosthetic femoral fractures from the Swedish National Hip Arthroplasty Register. Journal of Arthroplasty. 2005;20(7):857-65.
Reason for exclusion: Study did not include the intervention of interest (n=1) 1. Lim SJ, Lee KJ, Min BW, Song JH, So SY, Park YS. High incidence of stem
loosening in association with periprosthetic femur fractures in previously well-fixed cementless grit-blasted tapered-wedge stems. Int Orthop. 2015;39(9):1689-93.
Reason for exclusion: Study did not include PFF (n=1) 1. Fetzer GB, Callaghan JJ, Templeton JE, Goetz DD, Sullivan PM, Johnston RC.
Impaction allografting with cement for extensive femoral bone loss in revision hip surgery: A 4- to 8-year follow-up study. Journal of Arthroplasty. 2001;16(8 SUPPL. 1):195-202.

274
Reason for exclusion: Study included mixed interventions (check number 3) (n=1) 1. McGraw IWW, Spence SC, Baird EJ, Eckhardt SM, Ayana GE. Incidence of
periprosthetic fractures after hip hemiarthroplasty: Are uncemented prostheses unsafe? Injury. 2013;44(12):1945-8.
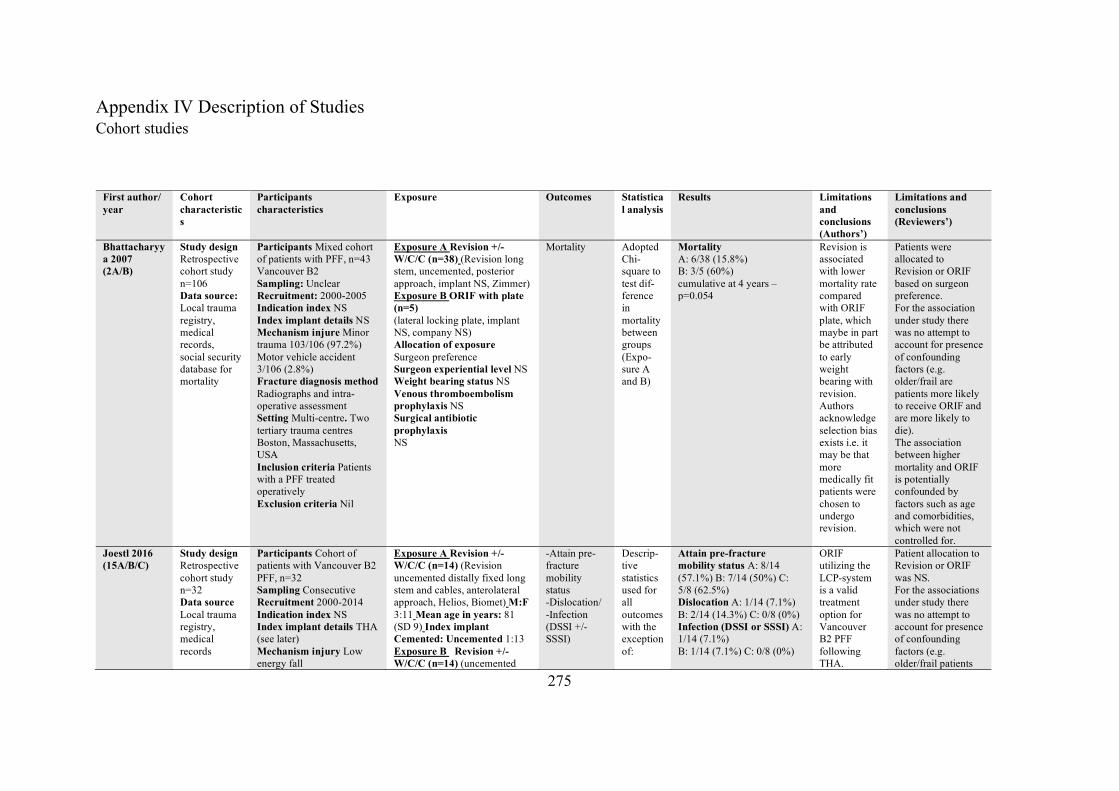
275
Appendix IV Description of Studies Cohort studies
First author/ year
Cohort characteristics
Participants characteristics
Exposure Outcomes Statistical analysis
Results Limitations and conclusions (Authors’)
Limitations and conclusions (Reviewers’)
Bhattacharyya 2007 (2A/B)
Study design Retrospective cohort study n=106 Data source: Local trauma registry, medical records, social security database for mortality
Participants Mixed cohort of patients with PFF, n=43 Vancouver B2 Sampling: Unclear Recruitment: 2000-2005 Indication index NS Index implant details NS Mechanism injure Minor trauma 103/106 (97.2%) Motor vehicle accident 3/106 (2.8%) Fracture diagnosis method Radiographs and intra-operative assessment Setting Multi-centre. Two tertiary trauma centres Boston, Massachusetts, USA Inclusion criteria Patients with a PFF treated operatively Exclusion criteria Nil
Exposure A Revision +/- W/C/C (n=38) (Revision long stem, uncemented, posterior approach, implant NS, Zimmer) Exposure B ORIF with plate (n=5) (lateral locking plate, implant NS, company NS) Allocation of exposure Surgeon preference Surgeon experiential level NS Weight bearing status NS Venous thromboembolism prophylaxis NS Surgical antibiotic prophylaxis NS
Mortality Adopted Chi-square to test dif-ference in mortality between groups (Expo-sure A and B)
Mortality A: 6/38 (15.8%) B: 3/5 (60%) cumulative at 4 years – p=0.054
Revision is associated with lower mortality rate compared with ORIF plate, which maybe in part be attributed to early weight bearing with revision. Authors acknowledge selection bias exists i.e. it may be that more medically fit patients were chosen to undergo revision.
Patients were allocated to Revision or ORIF based on surgeon preference. For the association under study there was no attempt to account for presence of confounding factors (e.g. older/frail are patients more likely to receive ORIF and are more likely to die). The association between higher mortality and ORIF is potentially confounded by factors such as age and comorbidities, which were not controlled for.
Joestl 2016 (15A/B/C)
Study design Retrospective cohort study n=32 Data source Local trauma registry, medical records
Participants Cohort of patients with Vancouver B2 PFF, n=32 Sampling Consecutive Recruitment 2000-2014 Indication index NS Index implant details THA (see later) Mechanism injury Low energy fall
Exposure A Revision +/- W/C/C (n=14) (Revision uncemented distally fixed long stem and cables, anterolateral approach, Helios, Biomet) M:F 3:11 Mean age in years: 81 (SD 9) Index implant Cemented: Uncemented 1:13 Exposure B Revision +/- W/C/C (n=14) (uncemented
-Attain pre-fracture mobility status -Dislocation/ -Infection (DSSI +/- SSSI)
Descrip-tive statistics used for all outcomes with the exception of:
Attain pre-fracture mobility status A: 8/14 (57.1%) B: 7/14 (50%) C: 5/8 (62.5%) Dislocation A: 1/14 (7.1%) B: 2/14 (14.3%) C: 0/8 (0%) Infection (DSSI or SSSI) A: 1/14 (7.1%) B: 1/14 (7.1%) C: 0/8 (0%)
ORIF utilizing the LCP-system is a valid treatment option for Vancouver B2 PFF following THA.
Patient allocation to Revision or ORIF was NS. For the associations under study there was no attempt to account for presence of confounding factors (e.g. older/frail patients
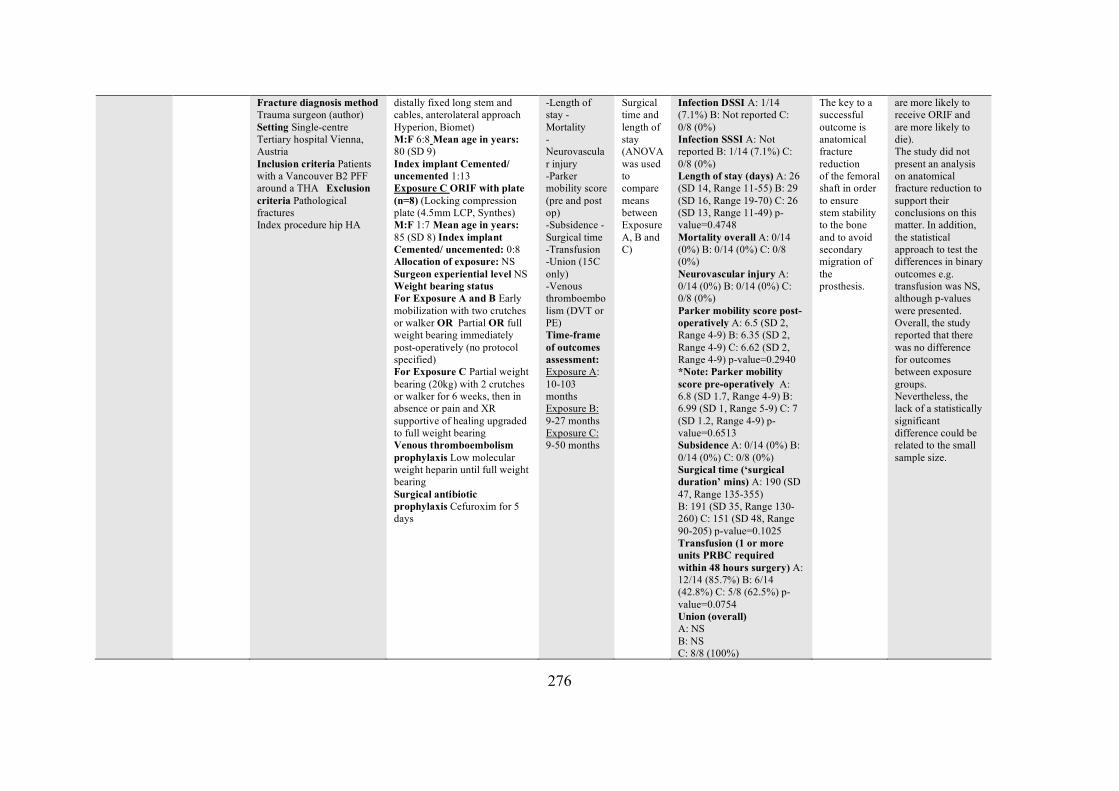
276
Fracture diagnosis method Trauma surgeon (author) Setting Single-centre Tertiary hospital Vienna, Austria Inclusion criteria Patients with a Vancouver B2 PFF around a THA Exclusion criteria Pathological fractures Index procedure hip HA
distally fixed long stem and cables, anterolateral approach Hyperion, Biomet) M:F 6:8 Mean age in years: 80 (SD 9) Index implant Cemented/ uncemented 1:13 Exposure C ORIF with plate (n=8) (Locking compression plate (4.5mm LCP, Synthes) M:F 1:7 Mean age in years: 85 (SD 8) Index implant Cemented/ uncemented: 0:8 Allocation of exposure: NS Surgeon experiential level NS Weight bearing status For Exposure A and B Early mobilization with two crutches or walker OR Partial OR full weight bearing immediately post-operatively (no protocol specified) For Exposure C Partial weight bearing (20kg) with 2 crutches or walker for 6 weeks, then in absence or pain and XR supportive of healing upgraded to full weight bearing Venous thromboembolism prophylaxis Low molecular weight heparin until full weight bearing Surgical antibiotic prophylaxis Cefuroxim for 5 days
-Length of stay -Mortality -Neurovascular injury -Parker mobility score (pre and post op) -Subsidence -Surgical time -Transfusion -Union (15C only) -Venous thromboembolism (DVT or PE) Time-frame of outcomes assessment: Exposure A: 10-103 months Exposure B: 9-27 months Exposure C: 9-50 months
Surgical time and length of stay (ANOVA was used to compare means between Exposure A, B and C)
Infection DSSI A: 1/14 (7.1%) B: Not reported C: 0/8 (0%) Infection SSSI A: Not reported B: 1/14 (7.1%) C: 0/8 (0%) Length of stay (days) A: 26 (SD 14, Range 11-55) B: 29 (SD 16, Range 19-70) C: 26 (SD 13, Range 11-49) p-value=0.4748 Mortality overall A: 0/14 (0%) B: 0/14 (0%) C: 0/8 (0%) Neurovascular injury A: 0/14 (0%) B: 0/14 (0%) C: 0/8 (0%) Parker mobility score post-operatively A: 6.5 (SD 2, Range 4-9) B: 6.35 (SD 2, Range 4-9) C: 6.62 (SD 2, Range 4-9) p-value=0.2940 *Note: Parker mobility score pre-operatively A: 6.8 (SD 1.7, Range 4-9) B: 6.99 (SD 1, Range 5-9) C: 7 (SD 1.2, Range 4-9) p-value=0.6513 Subsidence A: 0/14 (0%) B: 0/14 (0%) C: 0/8 (0%) Surgical time (‘surgical duration’ mins) A: 190 (SD 47, Range 135-355) B: 191 (SD 35, Range 130-260) C: 151 (SD 48, Range 90-205) p-value=0.1025 Transfusion (1 or more units PRBC required within 48 hours surgery) A: 12/14 (85.7%) B: 6/14 (42.8%) C: 5/8 (62.5%) p-value=0.0754 Union (overall) A: NS B: NS C: 8/8 (100%)
The key to a successful outcome is anatomical fracture reduction of the femoral shaft in order to ensure stem stability to the bone and to avoid secondary migration of the prosthesis.
are more likely to receive ORIF and are more likely to die). The study did not present an analysis on anatomical fracture reduction to support their conclusions on this matter. In addition, the statistical approach to test the differences in binary outcomes e.g. transfusion was NS, although p-values were presented. Overall, the study reported that there was no difference for outcomes between exposure groups. Nevertheless, the lack of a statistically significant difference could be related to the small sample size.
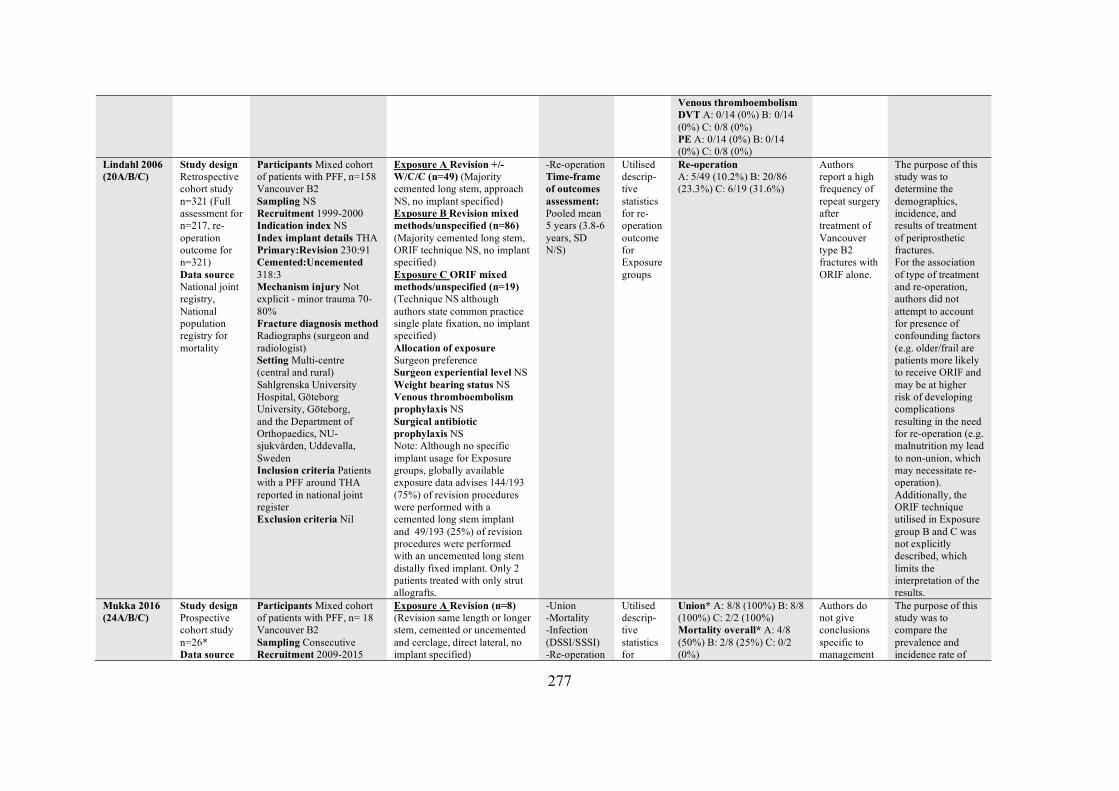
277
Venous thromboembolism DVT A: 0/14 (0%) B: 0/14 (0%) C: 0/8 (0%) PE A: 0/14 (0%) B: 0/14 (0%) C: 0/8 (0%)
Lindahl 2006 (20A/B/C)
Study design Retrospective cohort study n=321 (Full assessment for n=217, re-operation outcome for n=321) Data source National joint registry, National population registry for mortality
Participants Mixed cohort of patients with PFF, n=158 Vancouver B2 Sampling NS Recruitment 1999-2000 Indication index NS Index implant details THA Primary:Revision 230:91 Cemented:Uncemented 318:3 Mechanism injury Not explicit - minor trauma 70-80% Fracture diagnosis method Radiographs (surgeon and radiologist) Setting Multi-centre (central and rural) Sahlgrenska University Hospital, Göteborg University, Göteborg, and the Department of Orthopaedics, NU-sjukvården, Uddevalla, Sweden Inclusion criteria Patients with a PFF around THA reported in national joint register Exclusion criteria Nil
Exposure A Revision +/- W/C/C (n=49) (Majority cemented long stem, approach NS, no implant specified) Exposure B Revision mixed methods/unspecified (n=86) (Majority cemented long stem, ORIF technique NS, no implant specified) Exposure C ORIF mixed methods/unspecified (n=19) (Technique NS although authors state common practice single plate fixation, no implant specified) Allocation of exposure Surgeon preference Surgeon experiential level NS Weight bearing status NS Venous thromboembolism prophylaxis NS Surgical antibiotic prophylaxis NS Note: Although no specific implant usage for Exposure groups, globally available exposure data advises 144/193 (75%) of revision procedures were performed with a cemented long stem implant and 49/193 (25%) of revision procedures were performed with an uncemented long stem distally fixed implant. Only 2 patients treated with only strut allografts.
-Re-operation Time-frame of outcomes assessment: Pooled mean 5 years (3.8-6 years, SD N/S)
Utilised descrip-tive statistics for re-operation outcome for Exposure groups
Re-operation A: 5/49 (10.2%) B: 20/86 (23.3%) C: 6/19 (31.6%)
Authors report a high frequency of repeat surgery after treatment of Vancouver type B2 fractures with ORIF alone.
The purpose of this study was to determine the demographics, incidence, and results of treatment of periprosthetic fractures. For the association of type of treatment and re-operation, authors did not attempt to account for presence of confounding factors (e.g. older/frail are patients more likely to receive ORIF and may be at higher risk of developing complications resulting in the need for re-operation (e.g. malnutrition my lead to non-union, which may necessitate re-operation). Additionally, the ORIF technique utilised in Exposure group B and C was not explicitly described, which limits the interpretation of the results.
Mukka 2016 (24A/B/C)
Study design Prospective cohort study n=26* Data source
Participants Mixed cohort of patients with PFF, n= 18 Vancouver B2 Sampling Consecutive Recruitment 2009-2015
Exposure A Revision (n=8) (Revision same length or longer stem, cemented or uncemented and cerclage, direct lateral, no implant specified)
-Union -Mortality -Infection (DSSI/SSSI) -Re-operation
Utilised descrip-tive statistics for
Union* A: 8/8 (100%) B: 8/8 (100%) C: 2/2 (100%) Mortality overall* A: 4/8 (50%) B: 2/8 (25%) C: 0/2 (0%)
Authors do not give conclusions specific to management
The purpose of this study was to compare the prevalence and incidence rate of
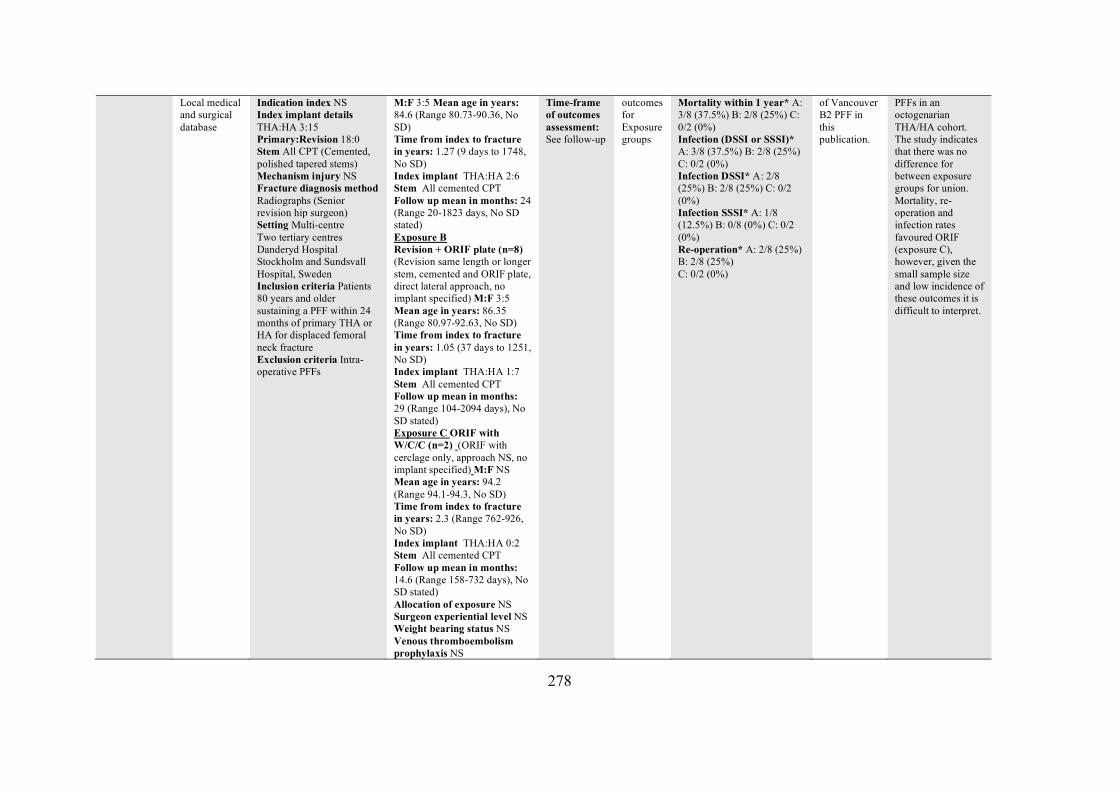
278
Local medical and surgical database
Indication index NS Index implant details THA:HA 3:15 Primary:Revision 18:0 Stem All CPT (Cemented, polished tapered stems) Mechanism injury NS Fracture diagnosis method Radiographs (Senior revision hip surgeon) Setting Multi-centre Two tertiary centres Danderyd Hospital Stockholm and Sundsvall Hospital, Sweden Inclusion criteria Patients 80 years and older sustaining a PFF within 24 months of primary THA or HA for displaced femoral neck fracture Exclusion criteria Intra-operative PFFs
M:F 3:5 Mean age in years: 84.6 (Range 80.73-90.36, No SD) Time from index to fracture in years: 1.27 (9 days to 1748, No SD) Index implant THA:HA 2:6 Stem All cemented CPT Follow up mean in months: 24 (Range 20-1823 days, No SD stated) Exposure B Revision + ORIF plate (n=8) (Revision same length or longer stem, cemented and ORIF plate, direct lateral approach, no implant specified) M:F 3:5 Mean age in years: 86.35 (Range 80.97-92.63, No SD) Time from index to fracture in years: 1.05 (37 days to 1251, No SD) Index implant THA:HA 1:7 Stem All cemented CPT Follow up mean in months: 29 (Range 104-2094 days), No SD stated) Exposure C ORIF with W/C/C (n=2) (ORIF with cerclage only, approach NS, no implant specified) M:F NS Mean age in years: 94.2 (Range 94.1-94.3, No SD) Time from index to fracture in years: 2.3 (Range 762-926, No SD) Index implant THA:HA 0:2 Stem All cemented CPT Follow up mean in months: 14.6 (Range 158-732 days), No SD stated) Allocation of exposure NS Surgeon experiential level NS Weight bearing status NS Venous thromboembolism prophylaxis NS
Time-frame of outcomes assessment: See follow-up
outcomes for Exposure groups
Mortality within 1 year* A: 3/8 (37.5%) B: 2/8 (25%) C: 0/2 (0%) Infection (DSSI or SSSI)* A: 3/8 (37.5%) B: 2/8 (25%) C: 0/2 (0%) Infection DSSI* A: 2/8 (25%) B: 2/8 (25%) C: 0/2 (0%) Infection SSSI* A: 1/8 (12.5%) B: 0/8 (0%) C: 0/2 (0%) Re-operation* A: 2/8 (25%) B: 2/8 (25%) C: 0/2 (0%)
of Vancouver B2 PFF in this publication.
PFFs in an octogenarian THA/HA cohort. The study indicates that there was no difference for between exposure groups for union. Mortality, re-operation and infection rates favoured ORIF (exposure C), however, given the small sample size and low incidence of these outcomes it is difficult to interpret.
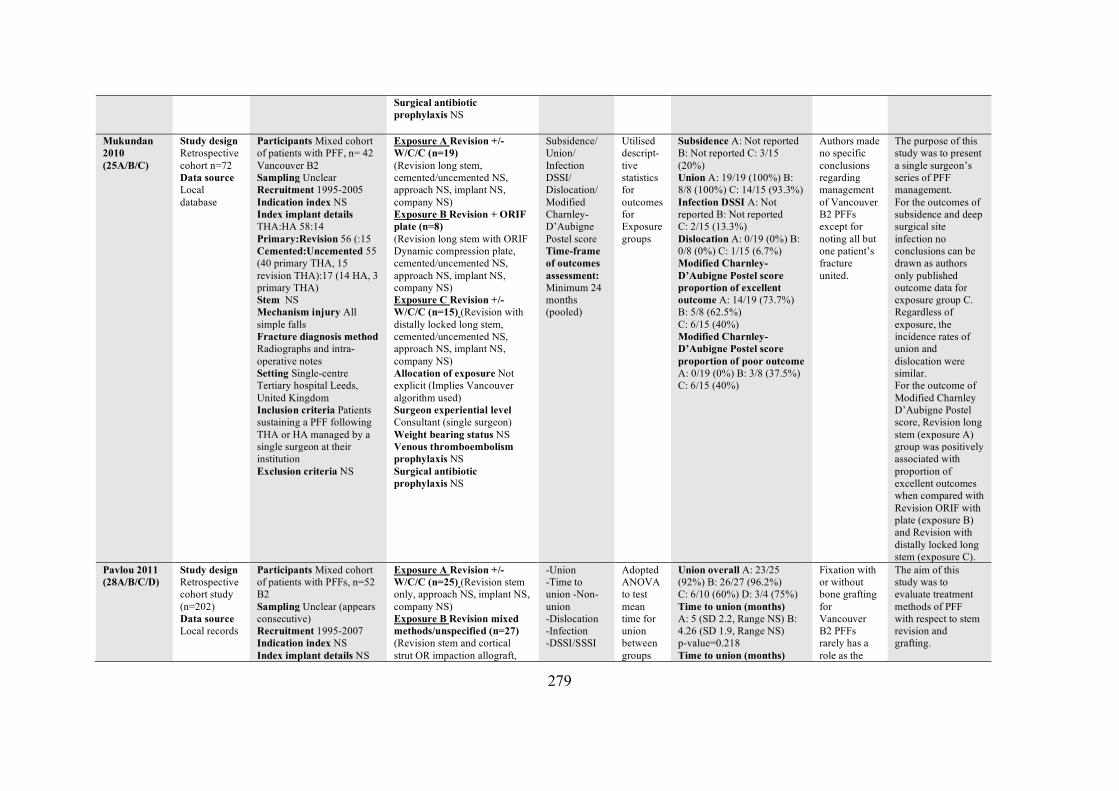
279
Surgical antibiotic prophylaxis NS
Mukundan 2010 (25A/B/C)
Study design Retrospective cohort n=72 Data source Local database
Participants Mixed cohort of patients with PFF, n= 42 Vancouver B2 Sampling Unclear Recruitment 1995-2005 Indication index NS Index implant details THA:HA 58:14 Primary:Revision 56 (:15 Cemented:Uncemented 55 (40 primary THA, 15 revision THA):17 (14 HA, 3 primary THA) Stem NS Mechanism injury All simple falls Fracture diagnosis method Radiographs and intra-operative notes Setting Single-centre Tertiary hospital Leeds, United Kingdom Inclusion criteria Patients sustaining a PFF following THA or HA managed by a single surgeon at their institution Exclusion criteria NS
Exposure A Revision +/- W/C/C (n=19) (Revision long stem, cemented/uncemented NS, approach NS, implant NS, company NS) Exposure B Revision + ORIF plate (n=8) (Revision long stem with ORIF Dynamic compression plate, cemented/uncemented NS, approach NS, implant NS, company NS) Exposure C Revision +/- W/C/C (n=15) (Revision with distally locked long stem, cemented/uncemented NS, approach NS, implant NS, company NS) Allocation of exposure Not explicit (Implies Vancouver algorithm used) Surgeon experiential level Consultant (single surgeon) Weight bearing status NS Venous thromboembolism prophylaxis NS Surgical antibiotic prophylaxis NS
Subsidence/ Union/ Infection DSSI/ Dislocation/ Modified Charnley-D’Aubigne Postel score Time-frame of outcomes assessment: Minimum 24 months (pooled)
Utilised descript-tive statistics for outcomes for Exposure groups
Subsidence A: Not reported B: Not reported C: 3/15 (20%) Union A: 19/19 (100%) B: 8/8 (100%) C: 14/15 (93.3%) Infection DSSI A: Not reported B: Not reported C: 2/15 (13.3%) Dislocation A: 0/19 (0%) B: 0/8 (0%) C: 1/15 (6.7%) Modified Charnley-D’Aubigne Postel score proportion of excellent outcome A: 14/19 (73.7%) B: 5/8 (62.5%) C: 6/15 (40%) Modified Charnley-D’Aubigne Postel score proportion of poor outcome A: 0/19 (0%) B: 3/8 (37.5%) C: 6/15 (40%)
Authors made no specific conclusions regarding management of Vancouver B2 PFFs except for noting all but one patient’s fracture united.
The purpose of this study was to present a single surgeon’s series of PFF management. For the outcomes of subsidence and deep surgical site infection no conclusions can be drawn as authors only published outcome data for exposure group C. Regardless of exposure, the incidence rates of union and dislocation were similar. For the outcome of Modified Charnley D’Aubigne Postel score, Revision long stem (exposure A) group was positively associated with proportion of excellent outcomes when compared with Revision ORIF with plate (exposure B) and Revision with distally locked long stem (exposure C).
Pavlou 2011 (28A/B/C/D)
Study design Retrospective cohort study (n=202) Data source Local records
Participants Mixed cohort of patients with PFFs, n=52 B2 Sampling Unclear (appears consecutive) Recruitment 1995-2007 Indication index NS Index implant details NS
Exposure A Revision +/- W/C/C (n=25) (Revision stem only, approach NS, implant NS, company NS) Exposure B Revision mixed methods/unspecified (n=27) (Revision stem and cortical strut OR impaction allograft,
-Union -Time to union -Non-union -Dislocation -Infection -DSSI/SSSI
Adopted ANOVA to test mean time for union between groups
Union overall A: 23/25 (92%) B: 26/27 (96.2%) C: 6/10 (60%) D: 3/4 (75%) Time to union (months) A: 5 (SD 2.2, Range NS) B: 4.26 (SD 1.9, Range NS) p-value=0.218 Time to union (months)
Fixation with or without bone grafting for Vancouver B2 PFFs rarely has a role as the
The aim of this study was to evaluate treatment methods of PFF with respect to stem revision and grafting.
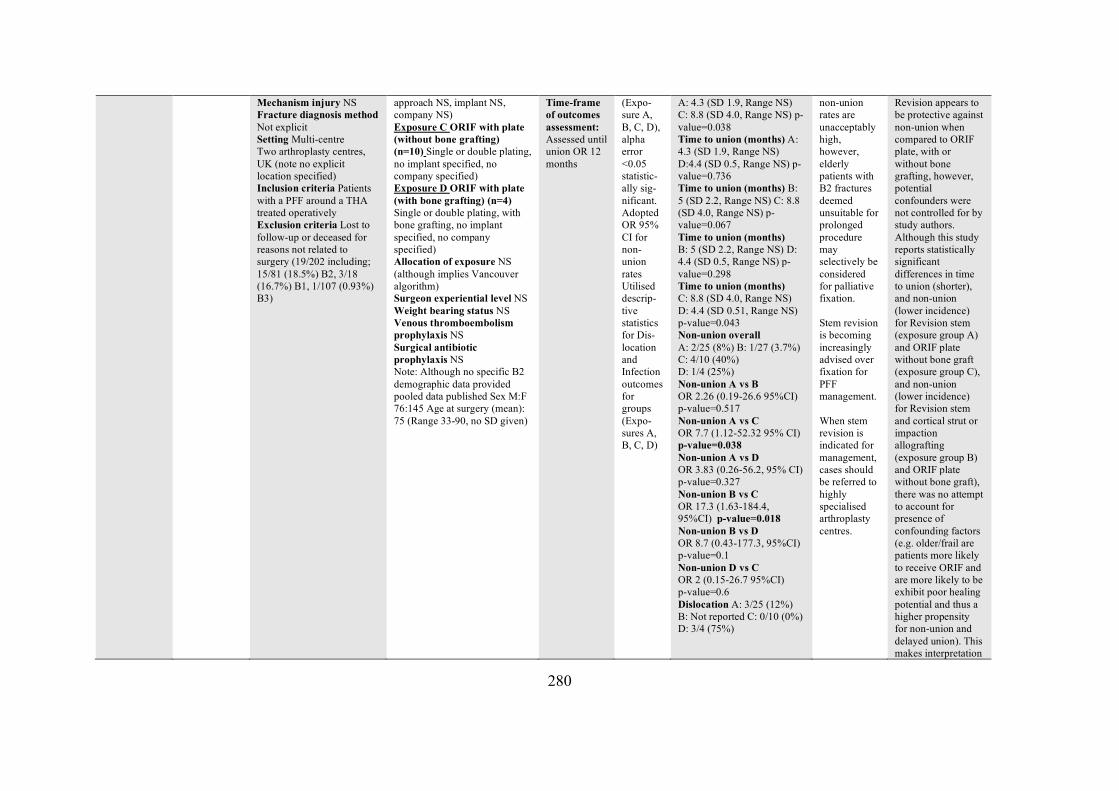
280
Mechanism injury NS Fracture diagnosis method Not explicit Setting Multi-centre Two arthroplasty centres, UK (note no explicit location specified) Inclusion criteria Patients with a PFF around a THA treated operatively Exclusion criteria Lost to follow-up or deceased for reasons not related to surgery (19/202 including; 15/81 (18.5%) B2, 3/18 (16.7%) B1, 1/107 (0.93%) B3)
approach NS, implant NS, company NS) Exposure C ORIF with plate (without bone grafting) (n=10) Single or double plating, no implant specified, no company specified) Exposure D ORIF with plate (with bone grafting) (n=4) Single or double plating, with bone grafting, no implant specified, no company specified) Allocation of exposure NS (although implies Vancouver algorithm) Surgeon experiential level NS Weight bearing status NS Venous thromboembolism prophylaxis NS Surgical antibiotic prophylaxis NS Note: Although no specific B2 demographic data provided pooled data published Sex M:F 76:145 Age at surgery (mean): 75 (Range 33-90, no SD given)
Time-frame of outcomes assessment: Assessed until union OR 12 months
(Expo-sure A, B, C, D), alpha error <0.05 statistic-ally sig-nificant. Adopted OR 95% CI for non-union rates Utilised descrip-tive statistics for Dis-location and Infection outcomes for groups (Expo-sures A, B, C, D)
A: 4.3 (SD 1.9, Range NS) C: 8.8 (SD 4.0, Range NS) p-value=0.038 Time to union (months) A: 4.3 (SD 1.9, Range NS) D:4.4 (SD 0.5, Range NS) p-value=0.736 Time to union (months) B: 5 (SD 2.2, Range NS) C: 8.8 (SD 4.0, Range NS) p-value=0.067 Time to union (months) B: 5 (SD 2.2, Range NS) D: 4.4 (SD 0.5, Range NS) p-value=0.298 Time to union (months) C: 8.8 (SD 4.0, Range NS) D: 4.4 (SD 0.51, Range NS) p-value=0.043 Non-union overall A: 2/25 (8%) B: 1/27 (3.7%) C: 4/10 (40%) D: 1/4 (25%) Non-union A vs B OR 2.26 (0.19-26.6 95%CI) p-value=0.517 Non-union A vs C OR 7.7 (1.12-52.32 95% CI) p-value=0.038 Non-union A vs D OR 3.83 (0.26-56.2, 95% CI) p-value=0.327 Non-union B vs C OR 17.3 (1.63-184.4, 95%CI) p-value=0.018 Non-union B vs D OR 8.7 (0.43-177.3, 95%CI) p-value=0.1 Non-union D vs C OR 2 (0.15-26.7 95%CI) p-value=0.6 Dislocation A: 3/25 (12%) B: Not reported C: 0/10 (0%) D: 3/4 (75%)
non-union rates are unacceptably high, however, elderly patients with B2 fractures deemed unsuitable for prolonged procedure may selectively be considered for palliative fixation. Stem revision is becoming increasingly advised over fixation for PFF management. When stem revision is indicated for management, cases should be referred to highly specialised arthroplasty centres.
Revision appears to be protective against non-union when compared to ORIF plate, with or without bone grafting, however, potential confounders were not controlled for by study authors. Although this study reports statistically significant differences in time to union (shorter), and non-union (lower incidence) for Revision stem (exposure group A) and ORIF plate without bone graft (exposure group C), and non-union (lower incidence) for Revision stem and cortical strut or impaction allografting (exposure group B) and ORIF plate without bone graft), there was no attempt to account for presence of confounding factors (e.g. older/frail are patients more likely to receive ORIF and are more likely to be exhibit poor healing potential and thus a higher propensity for non-union and delayed union). This makes interpretation
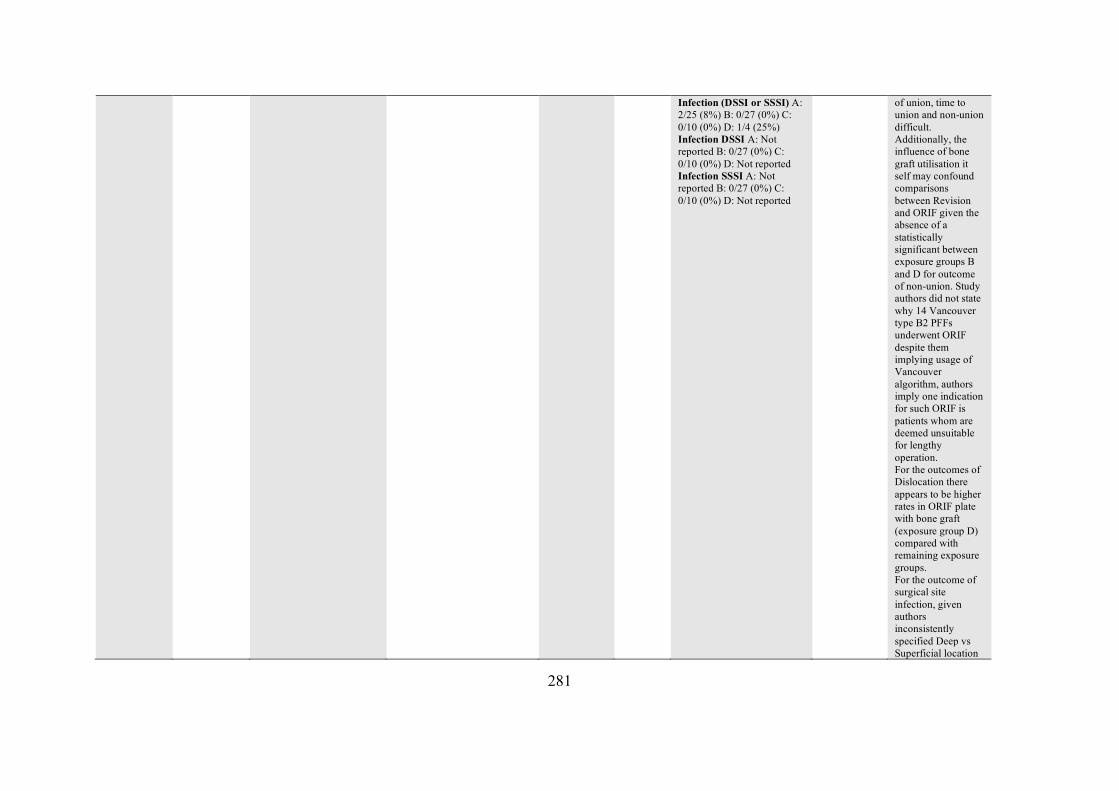
281
Infection (DSSI or SSSI) A: 2/25 (8%) B: 0/27 (0%) C: 0/10 (0%) D: 1/4 (25%) Infection DSSI A: Not reported B: 0/27 (0%) C: 0/10 (0%) D: Not reported Infection SSSI A: Not reported B: 0/27 (0%) C: 0/10 (0%) D: Not reported
of union, time to union and non-union difficult. Additionally, the influence of bone graft utilisation it self may confound comparisons between Revision and ORIF given the absence of a statistically significant between exposure groups B and D for outcome of non-union. Study authors did not state why 14 Vancouver type B2 PFFs underwent ORIF despite them implying usage of Vancouver algorithm, authors imply one indication for such ORIF is patients whom are deemed unsuitable for lengthy operation. For the outcomes of Dislocation there appears to be higher rates in ORIF plate with bone graft (exposure group D) compared with remaining exposure groups. For the outcome of surgical site infection, given authors inconsistently specified Deep vs Superficial location
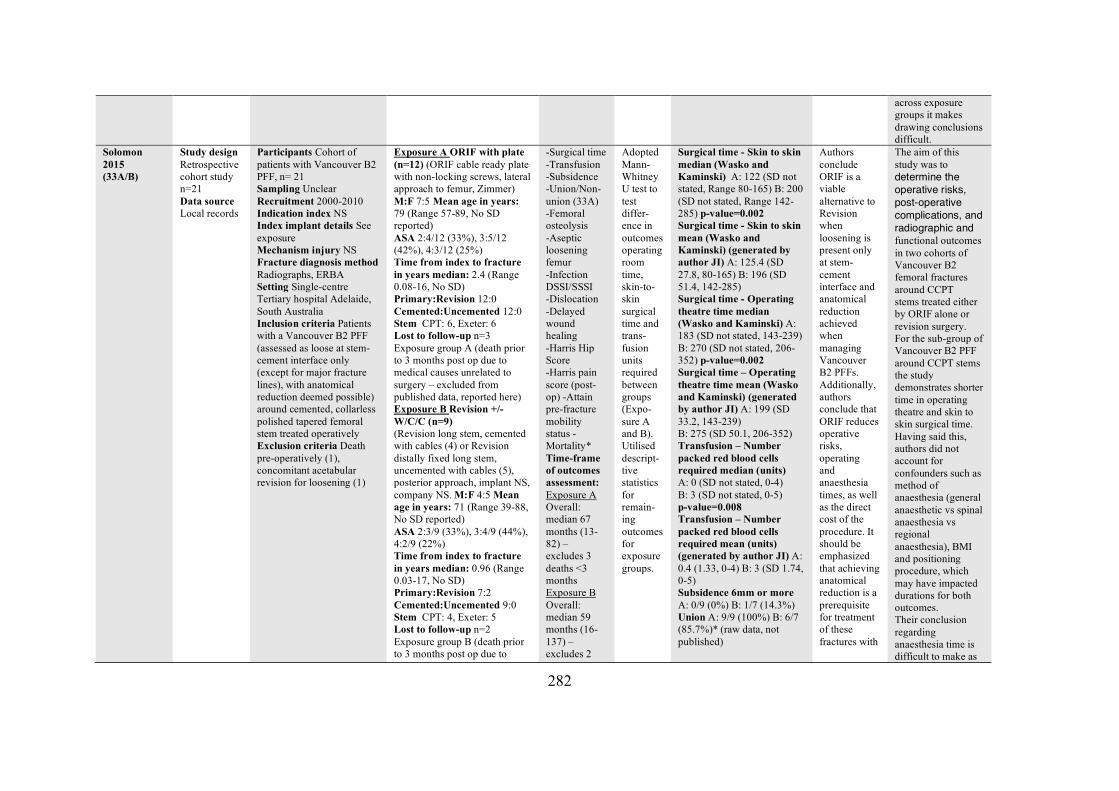
282
across exposure groups it makes drawing conclusions difficult.
Solomon 2015 (33A/B)
Study design Retrospective cohort study n=21 Data source Local records
Participants Cohort of patients with Vancouver B2 PFF, n= 21 Sampling Unclear Recruitment 2000-2010 Indication index NS Index implant details See exposure Mechanism injury NS Fracture diagnosis method Radiographs, ERBA Setting Single-centre Tertiary hospital Adelaide, South Australia Inclusion criteria Patients with a Vancouver B2 PFF (assessed as loose at stem-cement interface only (except for major fracture lines), with anatomical reduction deemed possible) around cemented, collarless polished tapered femoral stem treated operatively Exclusion criteria Death pre-operatively (1), concomitant acetabular revision for loosening (1)
Exposure A ORIF with plate (n=12) (ORIF cable ready plate with non-locking screws, lateral approach to femur, Zimmer) M:F 7:5 Mean age in years: 79 (Range 57-89, No SD reported) ASA 2:4/12 (33%), 3:5/12 (42%), 4:3/12 (25%) Time from index to fracture in years median: 2.4 (Range 0.08-16, No SD) Primary:Revision 12:0 Cemented:Uncemented 12:0 Stem CPT: 6, Exeter: 6 Lost to follow-up n=3 Exposure group A (death prior to 3 months post op due to medical causes unrelated to surgery – excluded from published data, reported here) Exposure B Revision +/- W/C/C (n=9) (Revision long stem, cemented with cables (4) or Revision distally fixed long stem, uncemented with cables (5), posterior approach, implant NS, company NS. M:F 4:5 Mean age in years: 71 (Range 39-88, No SD reported) ASA 2:3/9 (33%), 3:4/9 (44%), 4:2/9 (22%) Time from index to fracture in years median: 0.96 (Range 0.03-17, No SD) Primary:Revision 7:2 Cemented:Uncemented 9:0 Stem CPT: 4, Exeter: 5 Lost to follow-up n=2 Exposure group B (death prior to 3 months post op due to
-Surgical time -Transfusion -Subsidence -Union/Non-union (33A) -Femoral osteolysis -Aseptic loosening femur -Infection DSSI/SSSI -Dislocation -Delayed wound healing -Harris Hip Score -Harris pain score (post-op) -Attain pre-fracture mobility status -Mortality* Time-frame of outcomes assessment: Exposure A Overall: median 67 months (13-82) – excludes 3 deaths <3 months Exposure B Overall: median 59 months (16-137) – excludes 2
Adopted Mann-Whitney U test to test differ-ence in outcomes operating room time, skin-to-skin surgical time and trans-fusion units required between groups (Expo-sure A and B). Utilised descript-tive statistics for remain-ing outcomes for exposure groups.
Surgical time - Skin to skin median (Wasko and Kaminski) A: 122 (SD not stated, Range 80-165) B: 200 (SD not stated, Range 142-285) p-value=0.002 Surgical time - Skin to skin mean (Wasko and Kaminski) (generated by author JI) A: 125.4 (SD 27.8, 80-165) B: 196 (SD 51.4, 142-285) Surgical time - Operating theatre time median (Wasko and Kaminski) A: 183 (SD not stated, 143-239) B: 270 (SD not stated, 206-352) p-value=0.002 Surgical time – Operating theatre time mean (Wasko and Kaminski) (generated by author JI) A: 199 (SD 33.2, 143-239) B: 275 (SD 50.1, 206-352) Transfusion – Number packed red blood cells required median (units) A: 0 (SD not stated, 0-4) B: 3 (SD not stated, 0-5) p-value=0.008 Transfusion – Number packed red blood cells required mean (units) (generated by author JI) A: 0.4 (1.33, 0-4) B: 3 (SD 1.74, 0-5) Subsidence 6mm or more A: 0/9 (0%) B: 1/7 (14.3%) Union A: 9/9 (100%) B: 6/7 (85.7%)* (raw data, not published)
Authors conclude ORIF is a viable alternative to Revision when loosening is present only at stem-cement interface and anatomical reduction achieved when managing Vancouver B2 PFFs. Additionally, authors conclude that ORIF reduces operative risks, operating and anaesthesia times, as well as the direct cost of the procedure. It should be emphasized that achieving anatomical reduction is a prerequisite for treatment of these fractures with
The aim of this study was to determine the operative risks, post-operative complications, and radiographic and functional outcomes in two cohorts of Vancouver B2 femoral fractures around CCPT stems treated either by ORIF alone or revision surgery. For the sub-group of Vancouver B2 PFF around CCPT stems the study demonstrates shorter time in operating theatre and skin to skin surgical time. Having said this, authors did not account for confounders such as method of anaesthesia (general anaesthetic vs spinal anaesthesia vs regional anaesthesia), BMI and positioning procedure, which may have impacted durations for both outcomes. Their conclusion regarding anaesthesia time is difficult to make as
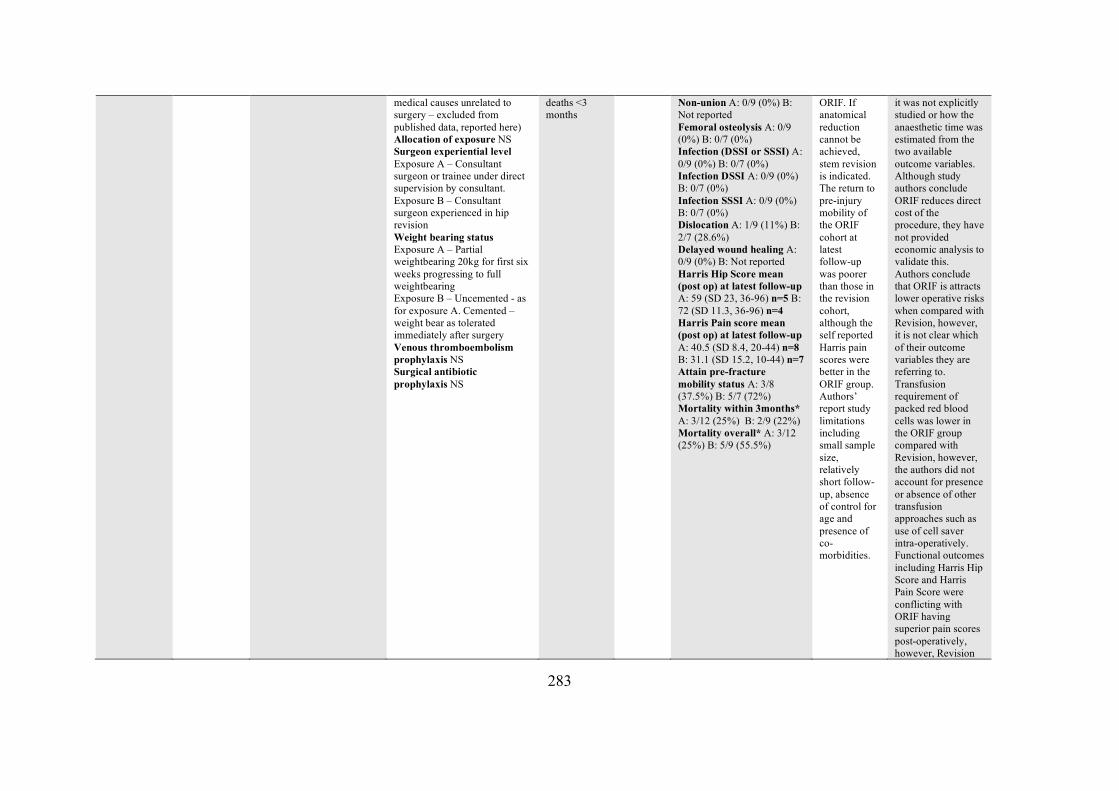
283
medical causes unrelated to surgery – excluded from published data, reported here) Allocation of exposure NS Surgeon experiential level Exposure A – Consultant surgeon or trainee under direct supervision by consultant. Exposure B – Consultant surgeon experienced in hip revision Weight bearing status Exposure A – Partial weightbearing 20kg for first six weeks progressing to full weightbearing Exposure B – Uncemented - as for exposure A. Cemented – weight bear as tolerated immediately after surgery Venous thromboembolism prophylaxis NS Surgical antibiotic prophylaxis NS
deaths <3 months
Non-union A: 0/9 (0%) B: Not reported Femoral osteolysis A: 0/9 (0%) B: 0/7 (0%) Infection (DSSI or SSSI) A: 0/9 (0%) B: 0/7 (0%) Infection DSSI A: 0/9 (0%) B: 0/7 (0%) Infection SSSI A: 0/9 (0%) B: 0/7 (0%) Dislocation A: 1/9 (11%) B: 2/7 (28.6%) Delayed wound healing A: 0/9 (0%) B: Not reported Harris Hip Score mean (post op) at latest follow-up A: 59 (SD 23, 36-96) n=5 B: 72 (SD 11.3, 36-96) n=4 Harris Pain score mean (post op) at latest follow-up A: 40.5 (SD 8.4, 20-44) n=8 B: 31.1 (SD 15.2, 10-44) n=7 Attain pre-fracture mobility status A: 3/8 (37.5%) B: 5/7 (72%) Mortality within 3months* A: 3/12 (25%) B: 2/9 (22%) Mortality overall* A: 3/12 (25%) B: 5/9 (55.5%)
ORIF. If anatomical reduction cannot be achieved, stem revision is indicated. The return to pre-injury mobility of the ORIF cohort at latest follow-up was poorer than those in the revision cohort, although the self reported Harris pain scores were better in the ORIF group. Authors’ report study limitations including small sample size, relatively short follow-up, absence of control for age and presence of co-morbidities.
it was not explicitly studied or how the anaesthetic time was estimated from the two available outcome variables. Although study authors conclude ORIF reduces direct cost of the procedure, they have not provided economic analysis to validate this. Authors conclude that ORIF is attracts lower operative risks when compared with Revision, however, it is not clear which of their outcome variables they are referring to. Transfusion requirement of packed red blood cells was lower in the ORIF group compared with Revision, however, the authors did not account for presence or absence of other transfusion approaches such as use of cell saver intra-operatively. Functional outcomes including Harris Hip Score and Harris Pain Score were conflicting with ORIF having superior pain scores post-operatively, however, Revision
284
group having superior Harris hip scores. Furthermore, the revision cohort was associated with a higher incidence of attaining pre-fracture mobility status. It would appear that revision promoted superior functional outcomes however, in the absence of pre-operative Harris hip and pain scores it is difficult to make such a conclusion. It is unclear why the authors did not conduct statistical analysis beyond descriptive statistics for these outcomes. Mortality within 3 months was similar between the ORIF group compared with Revision group, however, mortality overall was higher in ORIF group. This may be reflected by the ORIF group being older (mean age 8 years greater in ORIF group) or given they received ORIF they are likely frailer and thus more likely to die. Regardless of exposure, the incidence rates of union, femoral
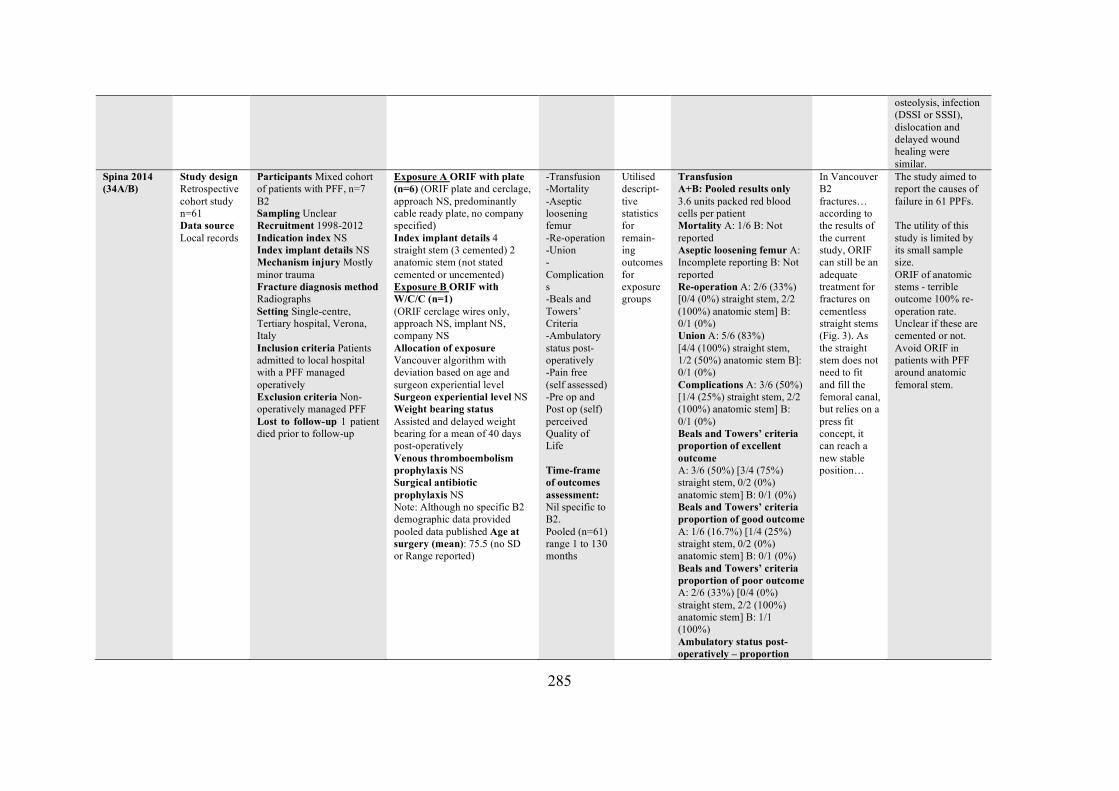
285
osteolysis, infection (DSSI or SSSI), dislocation and delayed wound healing were similar.
Spina 2014 (34A/B)
Study design Retrospective cohort study n=61 Data source Local records
Participants Mixed cohort of patients with PFF, n=7 B2 Sampling Unclear Recruitment 1998-2012 Indication index NS Index implant details NS Mechanism injury Mostly minor trauma Fracture diagnosis method Radiographs Setting Single-centre, Tertiary hospital, Verona, Italy Inclusion criteria Patients admitted to local hospital with a PFF managed operatively Exclusion criteria Non-operatively managed PFF Lost to follow-up 1 patient died prior to follow-up
Exposure A ORIF with plate (n=6) (ORIF plate and cerclage, approach NS, predominantly cable ready plate, no company specified) Index implant details 4 straight stem (3 cemented) 2 anatomic stem (not stated cemented or uncemented) Exposure B ORIF with W/C/C (n=1) (ORIF cerclage wires only, approach NS, implant NS, company NS Allocation of exposure Vancouver algorithm with deviation based on age and surgeon experiential level Surgeon experiential level NS Weight bearing status Assisted and delayed weight bearing for a mean of 40 days post-operatively Venous thromboembolism prophylaxis NS Surgical antibiotic prophylaxis NS Note: Although no specific B2 demographic data provided pooled data published Age at surgery (mean): 75.5 (no SD or Range reported)
-Transfusion -Mortality -Aseptic loosening femur -Re-operation -Union -Complications -Beals and Towers’ Criteria -Ambulatory status post-operatively -Pain free (self assessed) -Pre op and Post op (self) perceived Quality of Life Time-frame of outcomes assessment: Nil specific to B2. Pooled (n=61) range 1 to 130 months
Utilised descript-tive statistics for remain-ing outcomes for exposure groups
Transfusion A+B: Pooled results only 3.6 units packed red blood cells per patient Mortality A: 1/6 B: Not reported Aseptic loosening femur A: Incomplete reporting B: Not reported Re-operation A: 2/6 (33%) [0/4 (0%) straight stem, 2/2 (100%) anatomic stem] B: 0/1 (0%) Union A: 5/6 (83%) [4/4 (100%) straight stem, 1/2 (50%) anatomic stem B]: 0/1 (0%) Complications A: 3/6 (50%) [1/4 (25%) straight stem, 2/2 (100%) anatomic stem] B: 0/1 (0%) Beals and Towers’ criteria proportion of excellent outcome A: 3/6 (50%) [3/4 (75%) straight stem, 0/2 (0%) anatomic stem] B: 0/1 (0%) Beals and Towers’ criteria proportion of good outcome A: 1/6 (16.7%) [1/4 (25%) straight stem, 0/2 (0%) anatomic stem] B: 0/1 (0%) Beals and Towers’ criteria proportion of poor outcome A: 2/6 (33%) [0/4 (0%) straight stem, 2/2 (100%) anatomic stem] B: 1/1 (100%) Ambulatory status post-operatively – proportion
In Vancouver B2 fractures… according to the results of the current study, ORIF can still be an adequate treatment for fractures on cementless straight stems (Fig. 3). As the straight stem does not need to fit and fill the femoral canal, but relies on a press fit concept, it can reach a new stable position…
The study aimed to report the causes of failure in 61 PPFs. The utility of this study is limited by its small sample size. ORIF of anatomic stems - terrible outcome 100% re-operation rate. Unclear if these are cemented or not. Avoid ORIF in patients with PFF around anatomic femoral stem.
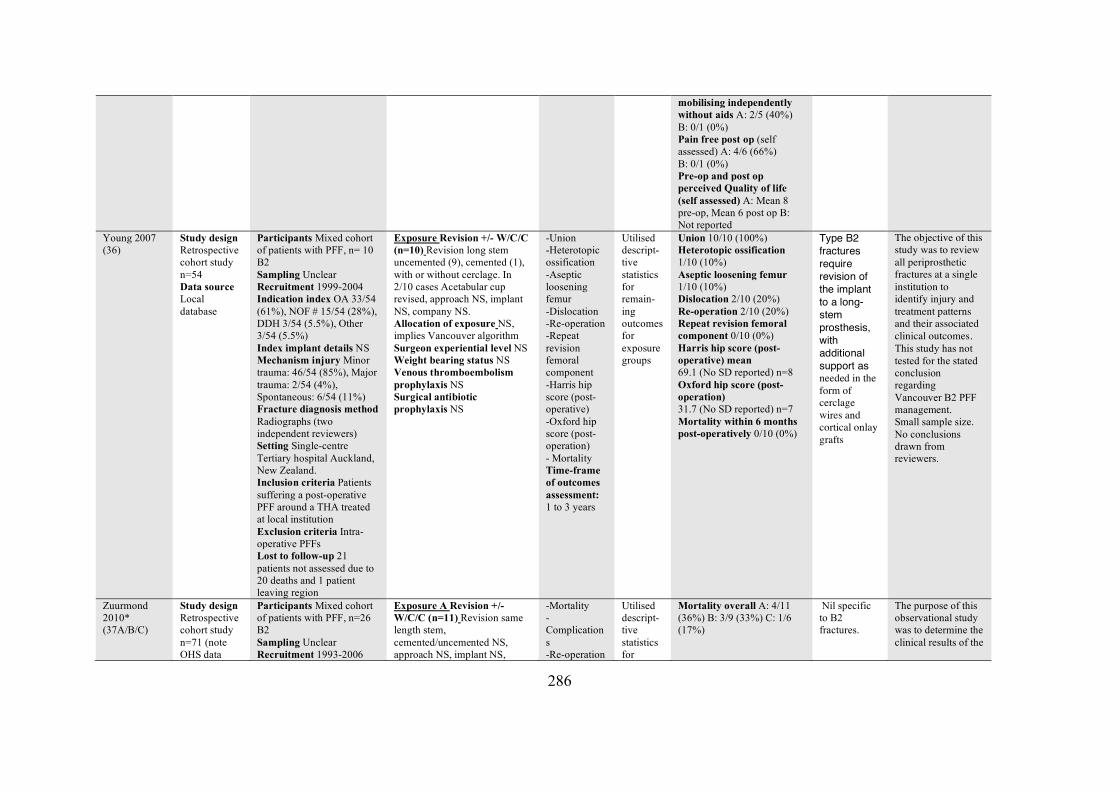
286
mobilising independently without aids A: 2/5 (40%) B: 0/1 (0%) Pain free post op (self assessed) A: 4/6 (66%) B: 0/1 (0%) Pre-op and post op perceived Quality of life (self assessed) A: Mean 8 pre-op, Mean 6 post op B: Not reported
Young 2007 (36)
Study design Retrospective cohort study n=54 Data source Local database
Participants Mixed cohort of patients with PFF, n= 10 B2 Sampling Unclear Recruitment 1999-2004 Indication index OA 33/54 (61%), NOF # 15/54 (28%), DDH 3/54 (5.5%), Other 3/54 (5.5%) Index implant details NS Mechanism injury Minor trauma: 46/54 (85%), Major trauma: 2/54 (4%), Spontaneous: 6/54 (11%) Fracture diagnosis method Radiographs (two independent reviewers) Setting Single-centre Tertiary hospital Auckland, New Zealand. Inclusion criteria Patients suffering a post-operative PFF around a THA treated at local institution Exclusion criteria Intra-operative PFFs Lost to follow-up 21 patients not assessed due to 20 deaths and 1 patient leaving region
Exposure Revision +/- W/C/C (n=10) Revision long stem uncemented (9), cemented (1), with or without cerclage. In 2/10 cases Acetabular cup revised, approach NS, implant NS, company NS. Allocation of exposure NS, implies Vancouver algorithm Surgeon experiential level NS Weight bearing status NS Venous thromboembolism prophylaxis NS Surgical antibiotic prophylaxis NS
-Union -Heterotopic ossification -Aseptic loosening femur -Dislocation -Re-operation -Repeat revision femoral component -Harris hip score (post-operative) -Oxford hip score (post-operation) - Mortality Time-frame of outcomes assessment: 1 to 3 years
Utilised descript-tive statistics for remain-ing outcomes for exposure groups
Union 10/10 (100%) Heterotopic ossification 1/10 (10%) Aseptic loosening femur 1/10 (10%) Dislocation 2/10 (20%) Re-operation 2/10 (20%) Repeat revision femoral component 0/10 (0%) Harris hip score (post-operative) mean 69.1 (No SD reported) n=8 Oxford hip score (post-operation) 31.7 (No SD reported) n=7 Mortality within 6 months post-operatively 0/10 (0%)
Type B2 fractures require revision of the implant to a long-stem prosthesis, with additional support as needed in the form of cerclage wires and cortical onlay grafts
The objective of this study was to review all periprosthetic fractures at a single institution to identify injury and treatment patterns and their associated clinical outcomes. This study has not tested for the stated conclusion regarding Vancouver B2 PFF management. Small sample size. No conclusions drawn from reviewers.
Zuurmond 2010* (37A/B/C)
Study design Retrospective cohort study n=71 (note OHS data
Participants Mixed cohort of patients with PFF, n=26 B2 Sampling Unclear Recruitment 1993-2006
Exposure A Revision +/- W/C/C (n=11) Revision same length stem, cemented/uncemented NS, approach NS, implant NS,
-Mortality -Complications -Re-operation
Utilised descript-tive statistics for
Mortality overall A: 4/11 (36%) B: 3/9 (33%) C: 1/6 (17%)
Nil specific to B2 fractures.
The purpose of this observational study was to determine the clinical results of the
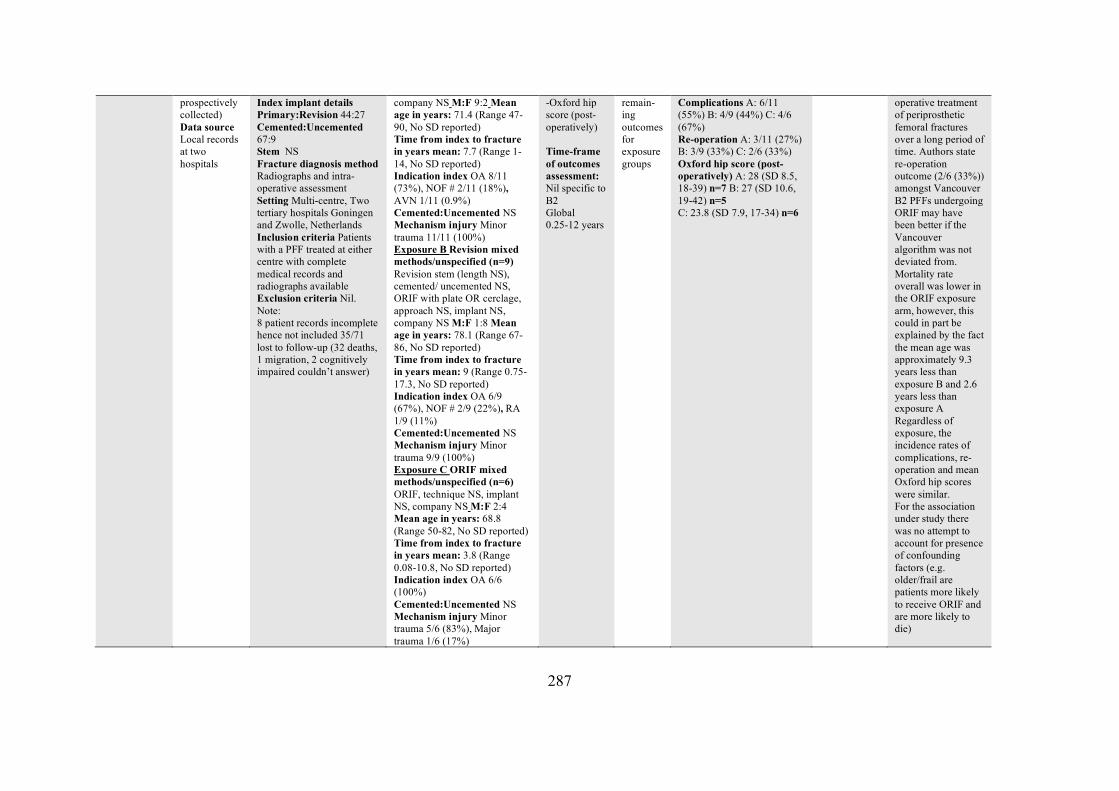
287
prospectively collected) Data source Local records at two hospitals
Index implant details Primary:Revision 44:27 Cemented:Uncemented 67:9 Stem NS Fracture diagnosis method Radiographs and intra-operative assessment Setting Multi-centre, Two tertiary hospitals Goningen and Zwolle, Netherlands Inclusion criteria Patients with a PFF treated at either centre with complete medical records and radiographs available Exclusion criteria Nil. Note: 8 patient records incomplete hence not included 35/71 lost to follow-up (32 deaths, 1 migration, 2 cognitively impaired couldn’t answer)
company NS M:F 9:2 Mean age in years: 71.4 (Range 47-90, No SD reported) Time from index to fracture in years mean: 7.7 (Range 1-14, No SD reported) Indication index OA 8/11 (73%), NOF # 2/11 (18%), AVN 1/11 (0.9%) Cemented:Uncemented NS Mechanism injury Minor trauma 11/11 (100%) Exposure B Revision mixed methods/unspecified (n=9) Revision stem (length NS), cemented/ uncemented NS, ORIF with plate OR cerclage, approach NS, implant NS, company NS M:F 1:8 Mean age in years: 78.1 (Range 67-86, No SD reported) Time from index to fracture in years mean: 9 (Range 0.75-17.3, No SD reported) Indication index OA 6/9 (67%), NOF # 2/9 (22%), RA 1/9 (11%) Cemented:Uncemented NS Mechanism injury Minor trauma 9/9 (100%) Exposure C ORIF mixed methods/unspecified (n=6) ORIF, technique NS, implant NS, company NS M:F 2:4 Mean age in years: 68.8 (Range 50-82, No SD reported) Time from index to fracture in years mean: 3.8 (Range 0.08-10.8, No SD reported) Indication index OA 6/6 (100%) Cemented:Uncemented NS Mechanism injury Minor trauma 5/6 (83%), Major trauma 1/6 (17%)
-Oxford hip score (post-operatively) Time-frame of outcomes assessment: Nil specific to B2 Global 0.25-12 years
remain-ing outcomes for exposure groups
Complications A: 6/11 (55%) B: 4/9 (44%) C: 4/6 (67%) Re-operation A: 3/11 (27%) B: 3/9 (33%) C: 2/6 (33%) Oxford hip score (post-operatively) A: 28 (SD 8.5, 18-39) n=7 B: 27 (SD 10.6, 19-42) n=5 C: 23.8 (SD 7.9, 17-34) n=6
operative treatment of periprosthetic femoral fractures over a long period of time. Authors state re-operation outcome (2/6 (33%)) amongst Vancouver B2 PFFs undergoing ORIF may have been better if the Vancouver algorithm was not deviated from. Mortality rate overall was lower in the ORIF exposure arm, however, this could in part be explained by the fact the mean age was approximately 9.3 years less than exposure B and 2.6 years less than exposure A Regardless of exposure, the incidence rates of complications, re-operation and mean Oxford hip scores were similar. For the association under study there was no attempt to account for presence of confounding factors (e.g. older/frail are patients more likely to receive ORIF and are more likely to die)
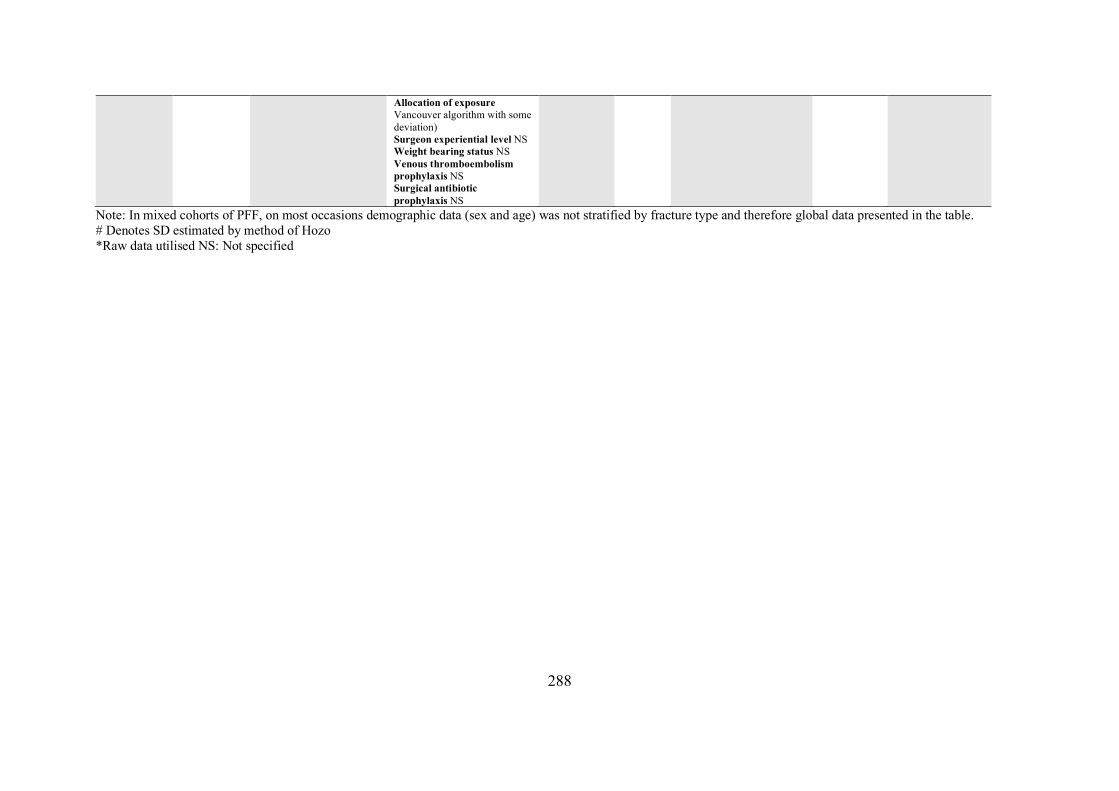
288
Note: In mixed cohorts of PFF, on most occasions demographic data (sex and age) was not stratified by fracture type and therefore global data presented in the table. # Denotes SD estimated by method of Hozo *Raw data utilised NS: Not specified
Allocation of exposure Vancouver algorithm with some deviation) Surgeon experiential level NS Weight bearing status NS Venous thromboembolism prophylaxis NS Surgical antibiotic prophylaxis NS
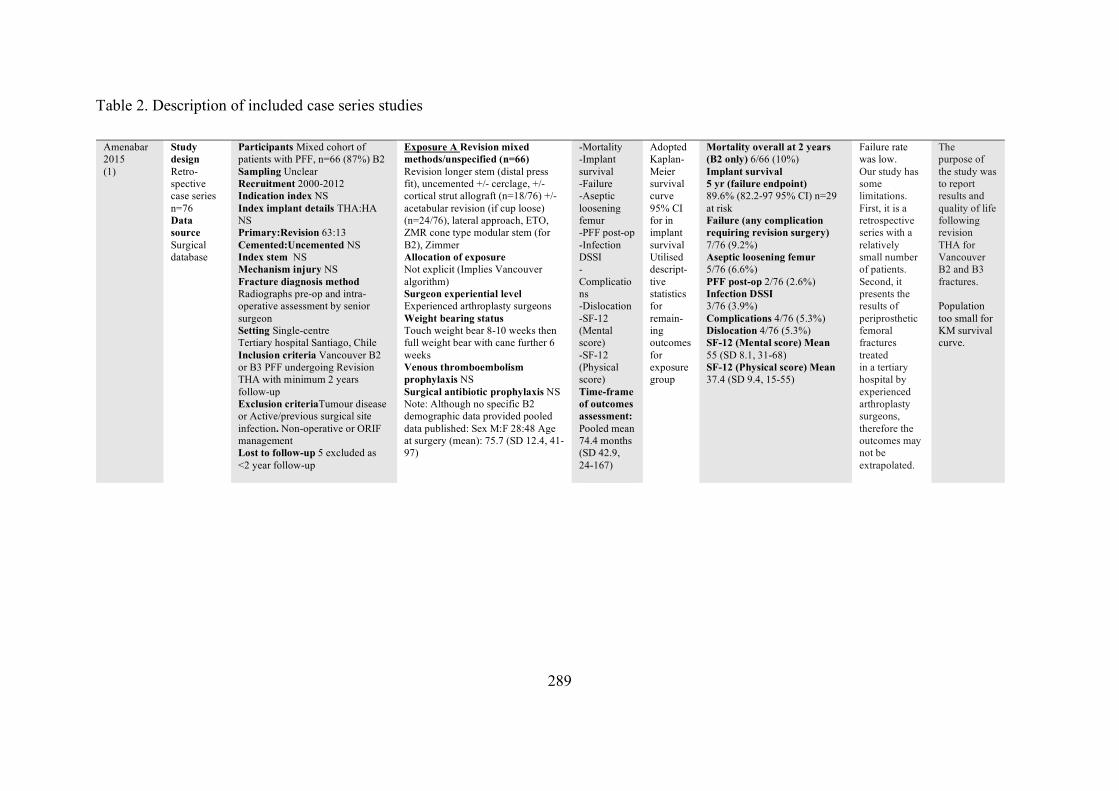
289
Table 2. Description of included case series studies
Amenabar 2015 (1)
Study design Retro-spective case series n=76 Data source Surgical database
Participants Mixed cohort of patients with PFF, n=66 (87%) B2 Sampling Unclear Recruitment 2000-2012 Indication index NS Index implant details THA:HA NS Primary:Revision 63:13 Cemented:Uncemented NS Index stem NS Mechanism injury NS Fracture diagnosis method Radiographs pre-op and intra-operative assessment by senior surgeon Setting Single-centre Tertiary hospital Santiago, Chile Inclusion criteria Vancouver B2 or B3 PFF undergoing Revision THA with minimum 2 years follow-up Exclusion criteriaTumour disease or Active/previous surgical site infection. Non-operative or ORIF management Lost to follow-up 5 excluded as <2 year follow-up
Exposure A Revision mixed methods/unspecified (n=66) Revision longer stem (distal press fit), uncemented +/- cerclage, +/- cortical strut allograft (n=18/76) +/- acetabular revision (if cup loose) (n=24/76), lateral approach, ETO, ZMR cone type modular stem (for B2), Zimmer Allocation of exposure Not explicit (Implies Vancouver algorithm) Surgeon experiential level Experienced arthroplasty surgeons Weight bearing status Touch weight bear 8-10 weeks then full weight bear with cane further 6 weeks Venous thromboembolism prophylaxis NS Surgical antibiotic prophylaxis NS Note: Although no specific B2 demographic data provided pooled data published: Sex M:F 28:48 Age at surgery (mean): 75.7 (SD 12.4, 41-97)
-Mortality -Implant survival -Failure -Aseptic loosening femur -PFF post-op -Infection DSSI -Complications -Dislocation -SF-12 (Mental score) -SF-12 (Physical score) Time-frame of outcomes assessment: Pooled mean 74.4 months (SD 42.9, 24-167)
Adopted Kaplan-Meier survival curve 95% CI for in implant survival Utilised descript-tive statistics for remain-ing outcomes for exposure group
Mortality overall at 2 years (B2 only) 6/66 (10%) Implant survival 5 yr (failure endpoint) 89.6% (82.2-97 95% CI) n=29 at risk Failure (any complication requiring revision surgery) 7/76 (9.2%) Aseptic loosening femur 5/76 (6.6%) PFF post-op 2/76 (2.6%) Infection DSSI 3/76 (3.9%) Complications 4/76 (5.3%) Dislocation 4/76 (5.3%) SF-12 (Mental score) Mean 55 (SD 8.1, 31-68) SF-12 (Physical score) Mean 37.4 (SD 9.4, 15-55)
Failure rate was low. Our study has some limitations. First, it is a retrospective series with a relatively small number of patients. Second, it presents the results of periprosthetic femoral fractures treated in a tertiary hospital by experienced arthroplasty surgeons, therefore the outcomes may not be extrapolated.
The purpose of the study was to report results and quality of life following revision THA for Vancouver B2 and B3 fractures. Population too small for KM survival curve.
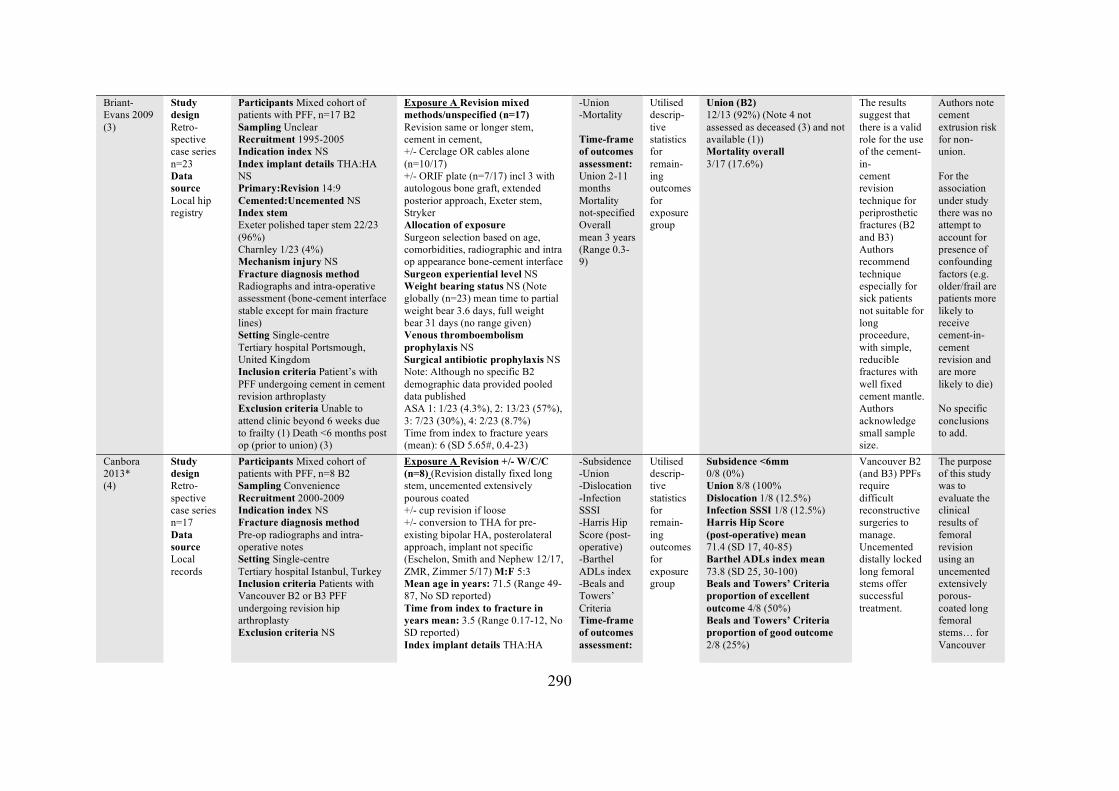
290
Briant-Evans 2009 (3)
Study design Retro-spective case series n=23 Data source Local hip registry
Participants Mixed cohort of patients with PFF, n=17 B2 Sampling Unclear Recruitment 1995-2005 Indication index NS Index implant details THA:HA NS Primary:Revision 14:9 Cemented:Uncemented NS Index stem Exeter polished taper stem 22/23 (96%) Charnley 1/23 (4%) Mechanism injury NS Fracture diagnosis method Radiographs and intra-operative assessment (bone-cement interface stable except for main fracture lines) Setting Single-centre Tertiary hospital Portsmough, United Kingdom Inclusion criteria Patient’s with PFF undergoing cement in cement revision arthroplasty Exclusion criteria Unable to attend clinic beyond 6 weeks due to frailty (1) Death <6 months post op (prior to union) (3)
Exposure A Revision mixed methods/unspecified (n=17) Revision same or longer stem, cement in cement, +/- Cerclage OR cables alone (n=10/17) +/- ORIF plate (n=7/17) incl 3 with autologous bone graft, extended posterior approach, Exeter stem, Stryker Allocation of exposure Surgeon selection based on age, comorbidities, radiographic and intra op appearance bone-cement interface Surgeon experiential level NS Weight bearing status NS (Note globally (n=23) mean time to partial weight bear 3.6 days, full weight bear 31 days (no range given) Venous thromboembolism prophylaxis NS Surgical antibiotic prophylaxis NS Note: Although no specific B2 demographic data provided pooled data published ASA 1: 1/23 (4.3%), 2: 13/23 (57%), 3: 7/23 (30%), 4: 2/23 (8.7%) Time from index to fracture years (mean): 6 (SD 5.65#, 0.4-23)
-Union -Mortality Time-frame of outcomes assessment: Union 2-11 months Mortality not-specified Overall mean 3 years (Range 0.3-9)
Utilised descrip-tive statistics for remain-ing outcomes for exposure group
Union (B2) 12/13 (92%) (Note 4 not assessed as deceased (3) and not available (1)) Mortality overall 3/17 (17.6%)
The results suggest that there is a valid role for the use of the cement-in- cement revision technique for periprosthetic fractures (B2 and B3) Authors recommend technique especially for sick patients not suitable for long proceedure, with simple, reducible fractures with well fixed cement mantle. Authors acknowledge small sample size.
Authors note cement extrusion risk for non-union. For the association under study there was no attempt to account for presence of confounding factors (e.g. older/frail are patients more likely to receive cement-in-cement revision and are more likely to die) No specific conclusions to add.
Canbora 2013* (4)
Study design Retro-spective case series n=17 Data source Local records
Participants Mixed cohort of patients with PFF, n=8 B2 Sampling Convenience Recruitment 2000-2009 Indication index NS Fracture diagnosis method Pre-op radiographs and intra-operative notes Setting Single-centre Tertiary hospital Istanbul, Turkey Inclusion criteria Patients with Vancouver B2 or B3 PFF undergoing revision hip arthroplasty Exclusion criteria NS
Exposure A Revision +/- W/C/C (n=8) (Revision distally fixed long stem, uncemented extensively pourous coated +/- cup revision if loose +/- conversion to THA for pre-existing bipolar HA, posterolateral approach, implant not specific (Eschelon, Smith and Nephew 12/17, ZMR, Zimmer 5/17) M:F 5:3 Mean age in years: 71.5 (Range 49-87, No SD reported) Time from index to fracture in years mean: 3.5 (Range 0.17-12, No SD reported) Index implant details THA:HA
-Subsidence -Union -Dislocation -Infection SSSI -Harris Hip Score (post-operative) -Barthel ADLs index -Beals and Towers’ Criteria Time-frame of outcomes assessment:
Utilised descrip-tive statistics for remain-ing outcomes for exposure group
Subsidence <6mm 0/8 (0%) Union 8/8 (100% Dislocation 1/8 (12.5%) Infection SSSI 1/8 (12.5%) Harris Hip Score (post-operative) mean 71.4 (SD 17, 40-85) Barthel ADLs index mean 73.8 (SD 25, 30-100) Beals and Towers’ Criteria proportion of excellent outcome 4/8 (50%) Beals and Towers’ Criteria proportion of good outcome 2/8 (25%)
Vancouver B2 (and B3) PPFs require difficult reconstructive surgeries to manage. Uncemented distally locked long femoral stems offer successful treatment.
The purpose of this study was to evaluate the clinical results of femoral revision using an uncemented extensively porous-coated long femoral stems… for Vancouver
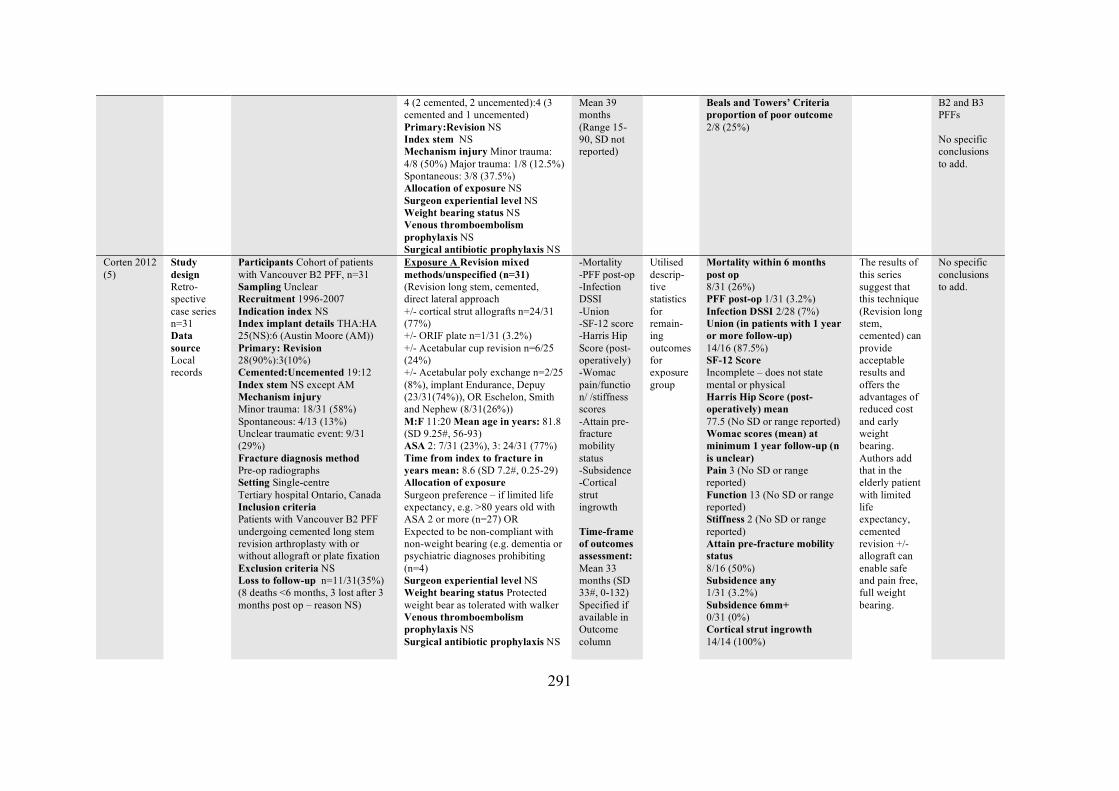
291
4 (2 cemented, 2 uncemented):4 (3 cemented and 1 uncemented) Primary:Revision NS Index stem NS Mechanism injury Minor trauma: 4/8 (50%) Major trauma: 1/8 (12.5%) Spontaneous: 3/8 (37.5%) Allocation of exposure NS Surgeon experiential level NS Weight bearing status NS Venous thromboembolism prophylaxis NS Surgical antibiotic prophylaxis NS
Mean 39 months (Range 15-90, SD not reported)
Beals and Towers’ Criteria proportion of poor outcome 2/8 (25%)
B2 and B3 PFFs No specific conclusions to add.
Corten 2012 (5)
Study design Retro-spective case series n=31 Data source Local records
Participants Cohort of patients with Vancouver B2 PFF, n=31 Sampling Unclear Recruitment 1996-2007 Indication index NS Index implant details THA:HA 25(NS):6 (Austin Moore (AM)) Primary: Revision 28(90%):3(10%) Cemented:Uncemented 19:12 Index stem NS except AM Mechanism injury Minor trauma: 18/31 (58%) Spontaneous: 4/13 (13%) Unclear traumatic event: 9/31 (29%) Fracture diagnosis method Pre-op radiographs Setting Single-centre Tertiary hospital Ontario, Canada Inclusion criteria Patients with Vancouver B2 PFF undergoing cemented long stem revision arthroplasty with or without allograft or plate fixation Exclusion criteria NS Loss to follow-up n=11/31(35%) (8 deaths <6 months, 3 lost after 3 months post op – reason NS)
Exposure A Revision mixed methods/unspecified (n=31) (Revision long stem, cemented, direct lateral approach +/- cortical strut allografts n=24/31 (77%) +/- ORIF plate n=1/31 (3.2%) +/- Acetabular cup revision n=6/25 (24%) +/- Acetabular poly exchange n=2/25 (8%), implant Endurance, Depuy (23/31(74%)), OR Eschelon, Smith and Nephew (8/31(26%)) M:F 11:20 Mean age in years: 81.8 (SD 9.25#, 56-93) ASA 2: 7/31 (23%), 3: 24/31 (77%) Time from index to fracture in years mean: 8.6 (SD 7.2#, 0.25-29) Allocation of exposure Surgeon preference – if limited life expectancy, e.g. >80 years old with ASA 2 or more (n=27) OR Expected to be non-compliant with non-weight bearing (e.g. dementia or psychiatric diagnoses prohibiting (n=4) Surgeon experiential level NS Weight bearing status Protected weight bear as tolerated with walker Venous thromboembolism prophylaxis NS Surgical antibiotic prophylaxis NS
-Mortality -PFF post-op -Infection DSSI -Union -SF-12 score -Harris Hip Score (post-operatively) -Womac pain/function/ /stiffness scores -Attain pre-fracture mobility status -Subsidence -Cortical strut ingrowth Time-frame of outcomes assessment: Mean 33 months (SD 33#, 0-132) Specified if available in Outcome column
Utilised descrip-tive statistics for remain-ing outcomes for exposure group
Mortality within 6 months post op 8/31 (26%) PFF post-op 1/31 (3.2%) Infection DSSI 2/28 (7%) Union (in patients with 1 year or more follow-up) 14/16 (87.5%) SF-12 Score Incomplete – does not state mental or physical Harris Hip Score (post-operatively) mean 77.5 (No SD or range reported) Womac scores (mean) at minimum 1 year follow-up (n is unclear) Pain 3 (No SD or range reported) Function 13 (No SD or range reported) Stiffness 2 (No SD or range reported) Attain pre-fracture mobility status 8/16 (50%) Subsidence any 1/31 (3.2%) Subsidence 6mm+ 0/31 (0%) Cortical strut ingrowth 14/14 (100%)
The results of this series suggest that this technique (Revision long stem, cemented) can provide acceptable results and offers the advantages of reduced cost and early weight bearing. Authors add that in the elderly patient with limited life expectancy, cemented revision +/- allograft can enable safe and pain free, full weight bearing.
No specific conclusions to add.
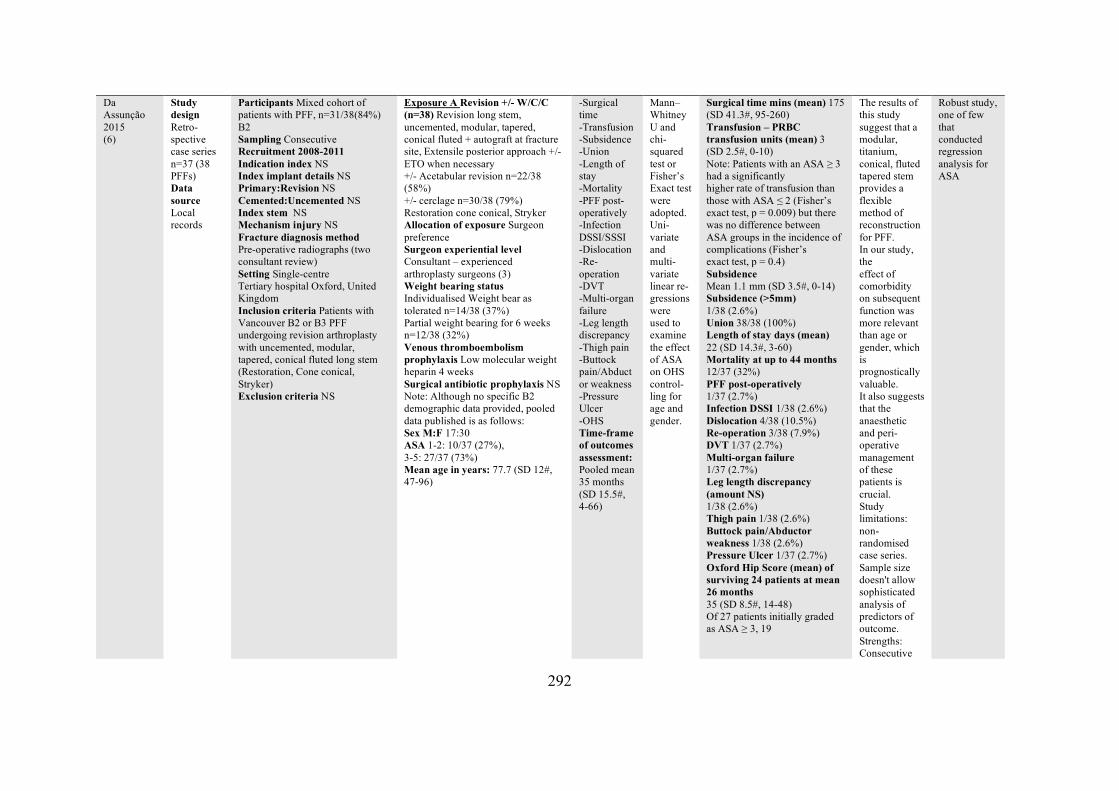
292
Da Assunção 2015 (6)
Study design Retro-spective case series n=37 (38 PFFs) Data source Local records
Participants Mixed cohort of patients with PFF, n=31/38(84%) B2 Sampling Consecutive Recruitment 2008-2011 Indication index NS Index implant details NS Primary:Revision NS Cemented:Uncemented NS Index stem NS Mechanism injury NS Fracture diagnosis method Pre-operative radiographs (two consultant review) Setting Single-centre Tertiary hospital Oxford, United Kingdom Inclusion criteria Patients with Vancouver B2 or B3 PFF undergoing revision arthroplasty with uncemented, modular, tapered, conical fluted long stem (Restoration, Cone conical, Stryker) Exclusion criteria NS
Exposure A Revision +/- W/C/C (n=38) Revision long stem, uncemented, modular, tapered, conical fluted + autograft at fracture site, Extensile posterior approach +/- ETO when necessary +/- Acetabular revision n=22/38 (58%) +/- cerclage n=30/38 (79%) Restoration cone conical, Stryker Allocation of exposure Surgeon preference Surgeon experiential level Consultant – experienced arthroplasty surgeons (3) Weight bearing status Individualised Weight bear as tolerated n=14/38 (37%) Partial weight bearing for 6 weeks n=12/38 (32%) Venous thromboembolism prophylaxis Low molecular weight heparin 4 weeks Surgical antibiotic prophylaxis NS Note: Although no specific B2 demographic data provided, pooled data published is as follows: Sex M:F 17:30 ASA 1-2: 10/37 (27%), 3-5: 27/37 (73%) Mean age in years: 77.7 (SD 12#, 47-96)
-Surgical time -Transfusion -Subsidence -Union -Length of stay -Mortality -PFF post-operatively -Infection DSSI/SSSI -Dislocation -Re-operation -DVT -Multi-organ failure -Leg length discrepancy -Thigh pain -Buttock pain/Abductor weakness -Pressure Ulcer -OHS Time-frame of outcomes assessment: Pooled mean 35 months (SD 15.5#, 4-66)
Mann–Whitney U and chi-squared test or Fisher’s Exact test were adopted. Uni-variate and multi-variate linear re-gressions were used to examine the effect of ASA on OHS control-ling for age and gender.
Surgical time mins (mean) 175 (SD 41.3#, 95-260) Transfusion – PRBC transfusion units (mean) 3 (SD 2.5#, 0-10) Note: Patients with an ASA ≥ 3 had a significantly higher rate of transfusion than those with ASA ≤ 2 (Fisher’s exact test, p = 0.009) but there was no difference between ASA groups in the incidence of complications (Fisher’s exact test, p = 0.4) Subsidence Mean 1.1 mm (SD 3.5#, 0-14) Subsidence (>5mm) 1/38 (2.6%) Union 38/38 (100%) Length of stay days (mean) 22 (SD 14.3#, 3-60) Mortality at up to 44 months 12/37 (32%) PFF post-operatively 1/37 (2.7%) Infection DSSI 1/38 (2.6%) Dislocation 4/38 (10.5%) Re-operation 3/38 (7.9%) DVT 1/37 (2.7%) Multi-organ failure 1/37 (2.7%) Leg length discrepancy (amount NS) 1/38 (2.6%) Thigh pain 1/38 (2.6%) Buttock pain/Abductor weakness 1/38 (2.6%) Pressure Ulcer 1/37 (2.7%) Oxford Hip Score (mean) of surviving 24 patients at mean 26 months 35 (SD 8.5#, 14-48) Of 27 patients initially graded as ASA ≥ 3, 19
The results of this study suggest that a modular, titanium, conical, fluted tapered stem provides a flexible method of reconstruction for PFF. In our study, the effect of comorbidity on subsequent function was more relevant than age or gender, which is prognostically valuable. It also suggests that the anaesthetic and peri-operative management of these patients is crucial. Study limitations: non-randomised case series. Sample size doesn't allow sophisticated analysis of predictors of outcome. Strengths: Consecutive
Robust study, one of few that conducted regression analysis for ASA
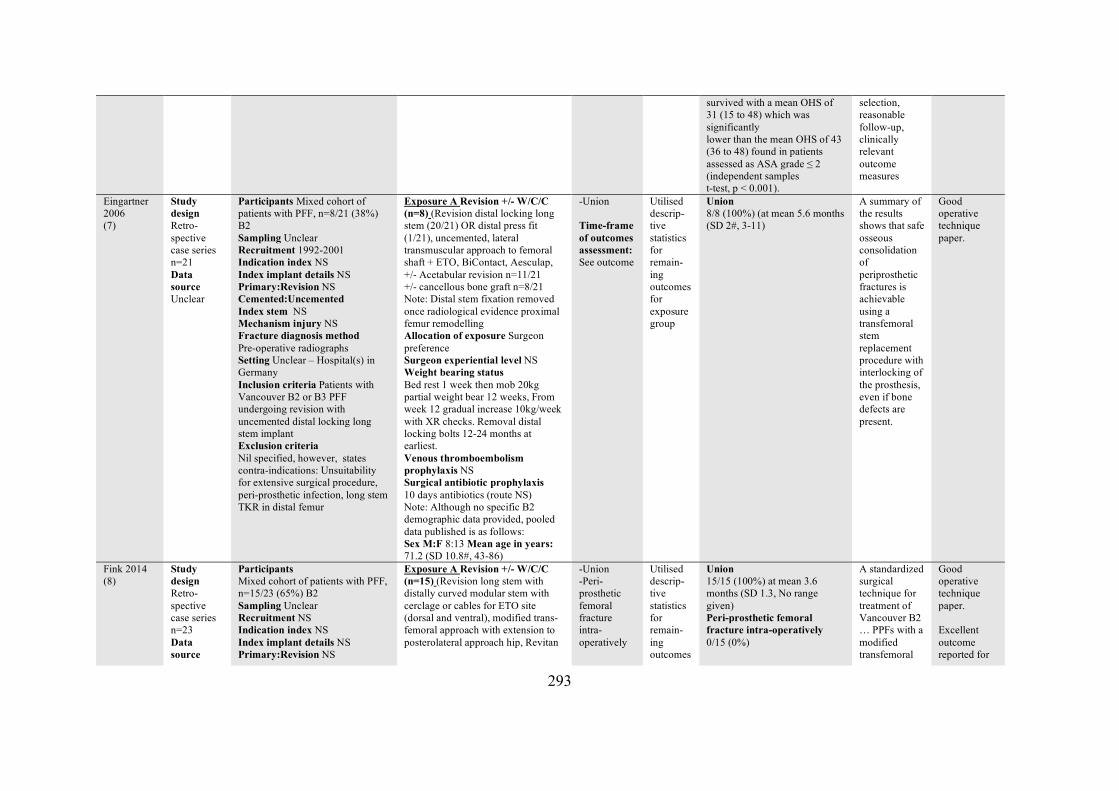
293
survived with a mean OHS of 31 (15 to 48) which was significantly lower than the mean OHS of 43 (36 to 48) found in patients assessed as ASA grade ≤ 2 (independent samples t-test, p < 0.001).
selection, reasonable follow-up, clinically relevant outcome measures
Eingartner 2006 (7)
Study design Retro-spective case series n=21 Data source Unclear
Participants Mixed cohort of patients with PFF, n=8/21 (38%) B2 Sampling Unclear Recruitment 1992-2001 Indication index NS Index implant details NS Primary:Revision NS Cemented:Uncemented Index stem NS Mechanism injury NS Fracture diagnosis method Pre-operative radiographs Setting Unclear – Hospital(s) in Germany Inclusion criteria Patients with Vancouver B2 or B3 PFF undergoing revision with uncemented distal locking long stem implant Exclusion criteria Nil specified, however, states contra-indications: Unsuitability for extensive surgical procedure, peri-prosthetic infection, long stem TKR in distal femur
Exposure A Revision +/- W/C/C (n=8) (Revision distal locking long stem (20/21) OR distal press fit (1/21), uncemented, lateral transmuscular approach to femoral shaft + ETO, BiContact, Aesculap, +/- Acetabular revision n=11/21 +/- cancellous bone graft n=8/21 Note: Distal stem fixation removed once radiological evidence proximal femur remodelling Allocation of exposure Surgeon preference Surgeon experiential level NS Weight bearing status Bed rest 1 week then mob 20kg partial weight bear 12 weeks, From week 12 gradual increase 10kg/week with XR checks. Removal distal locking bolts 12-24 months at earliest. Venous thromboembolism prophylaxis NS Surgical antibiotic prophylaxis 10 days antibiotics (route NS) Note: Although no specific B2 demographic data provided, pooled data published is as follows: Sex M:F 8:13 Mean age in years: 71.2 (SD 10.8#, 43-86)
-Union Time-frame of outcomes assessment: See outcome
Utilised descrip-tive statistics for remain-ing outcomes for exposure group
Union 8/8 (100%) (at mean 5.6 months (SD 2#, 3-11)
A summary of the results shows that safe osseous consolidation of periprosthetic fractures is achievable using a transfemoral stem replacement procedure with interlocking of the prosthesis, even if bone defects are present.
Good operative technique paper.
Fink 2014 (8)
Study design Retro-spective case series n=23 Data source
Participants Mixed cohort of patients with PFF, n=15/23 (65%) B2 Sampling Unclear Recruitment NS Indication index NS Index implant details NS Primary:Revision NS
Exposure A Revision +/- W/C/C (n=15) (Revision long stem with distally curved modular stem with cerclage or cables for ETO site (dorsal and ventral), modified trans-femoral approach with extension to posterolateral approach hip, Revitan
-Union -Peri-prosthetic femoral fracture intra-operatively
Utilised descrip-tive statistics for remain-ing outcomes
Union 15/15 (100%) at mean 3.6 months (SD 1.3, No range given) Peri-prosthetic femoral fracture intra-operatively 0/15 (0%)
A standardized surgical technique for treatment of Vancouver B2 … PPFs with a modified transfemoral
Good operative technique paper. Excellent outcome reported for
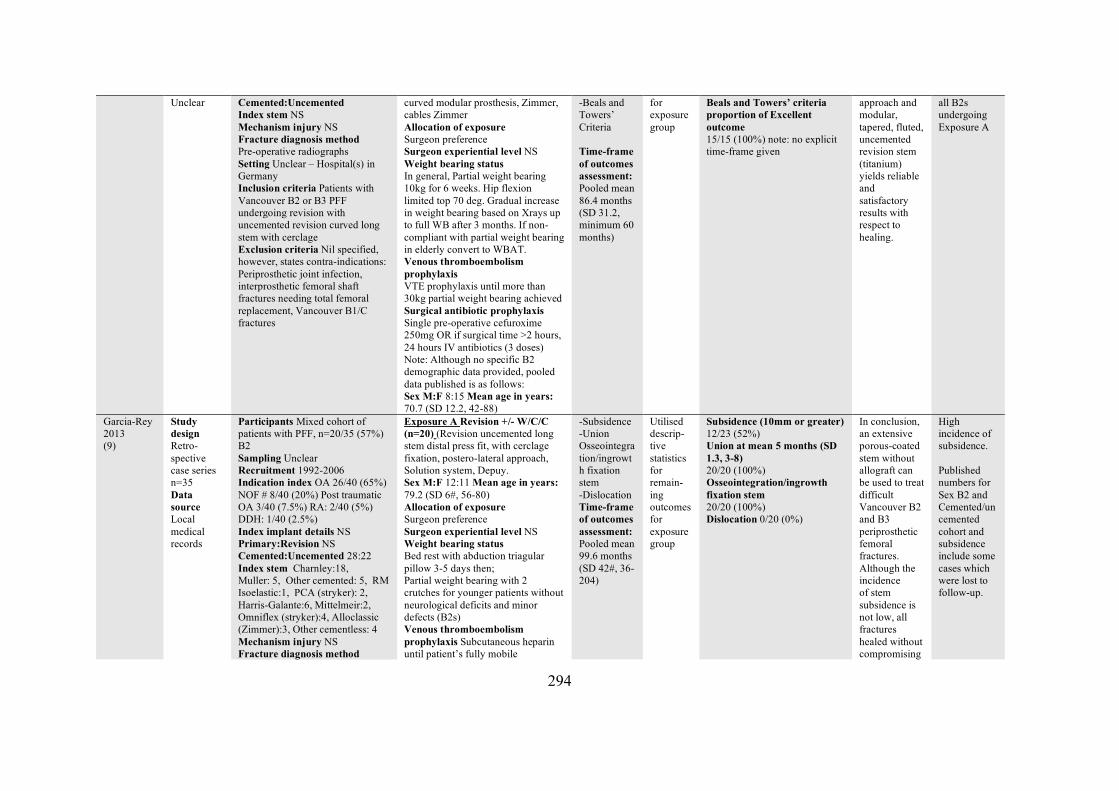
294
Unclear Cemented:Uncemented Index stem NS Mechanism injury NS Fracture diagnosis method Pre-operative radiographs Setting Unclear – Hospital(s) in Germany Inclusion criteria Patients with Vancouver B2 or B3 PFF undergoing revision with uncemented revision curved long stem with cerclage Exclusion criteria Nil specified, however, states contra-indications: Periprosthetic joint infection, interprosthetic femoral shaft fractures needing total femoral replacement, Vancouver B1/C fractures
curved modular prosthesis, Zimmer, cables Zimmer Allocation of exposure Surgeon preference Surgeon experiential level NS Weight bearing status In general, Partial weight bearing 10kg for 6 weeks. Hip flexion limited top 70 deg. Gradual increase in weight bearing based on Xrays up to full WB after 3 months. If non-compliant with partial weight bearing in elderly convert to WBAT. Venous thromboembolism prophylaxis VTE prophylaxis until more than 30kg partial weight bearing achieved Surgical antibiotic prophylaxis Single pre-operative cefuroxime 250mg OR if surgical time >2 hours, 24 hours IV antibiotics (3 doses) Note: Although no specific B2 demographic data provided, pooled data published is as follows: Sex M:F 8:15 Mean age in years: 70.7 (SD 12.2, 42-88)
-Beals and Towers’ Criteria Time-frame of outcomes assessment: Pooled mean 86.4 months (SD 31.2, minimum 60 months)
for exposure group
Beals and Towers’ criteria proportion of Excellent outcome 15/15 (100%) note: no explicit time-frame given
approach and modular, tapered, fluted, uncemented revision stem (titanium) yields reliable and satisfactory results with respect to healing.
all B2s undergoing Exposure A
Garcia-Rey 2013 (9)
Study design Retro-spective case series n=35 Data source Local medical records
Participants Mixed cohort of patients with PFF, n=20/35 (57%) B2 Sampling Unclear Recruitment 1992-2006 Indication index OA 26/40 (65%) NOF # 8/40 (20%) Post traumatic OA 3/40 (7.5%) RA: 2/40 (5%) DDH: 1/40 (2.5%) Index implant details NS Primary:Revision NS Cemented:Uncemented 28:22 Index stem Charnley:18, Muller: 5, Other cemented: 5, RM Isoelastic:1, PCA (stryker): 2, Harris-Galante:6, Mittelmeir:2, Omniflex (stryker):4, Alloclassic (Zimmer):3, Other cementless: 4 Mechanism injury NS Fracture diagnosis method
Exposure A Revision +/- W/C/C (n=20) (Revision uncemented long stem distal press fit, with cerclage fixation, postero-lateral approach, Solution system, Depuy. Sex M:F 12:11 Mean age in years: 79.2 (SD 6#, 56-80) Allocation of exposure Surgeon preference Surgeon experiential level NS Weight bearing status Bed rest with abduction triagular pillow 3-5 days then; Partial weight bearing with 2 crutches for younger patients without neurological deficits and minor defects (B2s) Venous thromboembolism prophylaxis Subcutaneous heparin until patient’s fully mobile
-Subsidence -Union Osseointegration/ingrowth fixation stem -Dislocation Time-frame of outcomes assessment: Pooled mean 99.6 months (SD 42#, 36-204)
Utilised descrip-tive statistics for remain-ing outcomes for exposure group
Subsidence (10mm or greater) 12/23 (52%) Union at mean 5 months (SD 1.3, 3-8) 20/20 (100%) Osseointegration/ingrowth fixation stem 20/20 (100%) Dislocation 0/20 (0%)
In conclusion, an extensive porous-coated stem without allograft can be used to treat difficult Vancouver B2 and B3 periprosthetic femoral fractures. Although the incidence of stem subsidence is not low, all fractures healed without compromising
High incidence of subsidence. Published numbers for Sex B2 and Cemented/uncemented cohort and subsidence include some cases which were lost to follow-up.
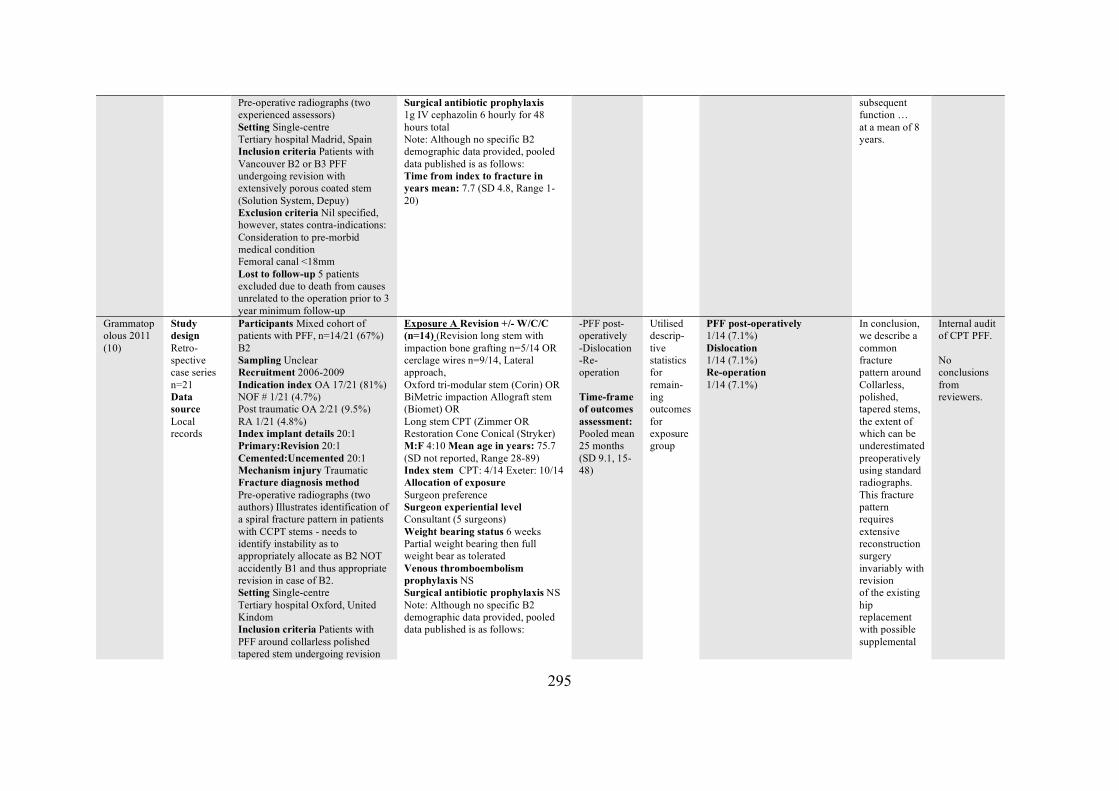
295
Pre-operative radiographs (two experienced assessors) Setting Single-centre Tertiary hospital Madrid, Spain Inclusion criteria Patients with Vancouver B2 or B3 PFF undergoing revision with extensively porous coated stem (Solution System, Depuy) Exclusion criteria Nil specified, however, states contra-indications: Consideration to pre-morbid medical condition Femoral canal <18mm Lost to follow-up 5 patients excluded due to death from causes unrelated to the operation prior to 3 year minimum follow-up
Surgical antibiotic prophylaxis 1g IV cephazolin 6 hourly for 48 hours total Note: Although no specific B2 demographic data provided, pooled data published is as follows: Time from index to fracture in years mean: 7.7 (SD 4.8, Range 1-20)
subsequent function … at a mean of 8 years.
Grammatopolous 2011 (10)
Study design Retro-spective case series n=21 Data source Local records
Participants Mixed cohort of patients with PFF, n=14/21 (67%) B2 Sampling Unclear Recruitment 2006-2009 Indication index OA 17/21 (81%) NOF # 1/21 (4.7%) Post traumatic OA 2/21 (9.5%) RA 1/21 (4.8%) Index implant details 20:1 Primary:Revision 20:1 Cemented:Uncemented 20:1 Mechanism injury Traumatic Fracture diagnosis method Pre-operative radiographs (two authors) Illustrates identification of a spiral fracture pattern in patients with CCPT stems - needs to identify instability as to appropriately allocate as B2 NOT accidently B1 and thus appropriate revision in case of B2. Setting Single-centre Tertiary hospital Oxford, United Kindom Inclusion criteria Patients with PFF around collarless polished tapered stem undergoing revision
Exposure A Revision +/- W/C/C (n=14) (Revision long stem with impaction bone grafting n=5/14 OR cerclage wires n=9/14, Lateral approach, Oxford tri-modular stem (Corin) OR BiMetric impaction Allograft stem (Biomet) OR Long stem CPT (Zimmer OR Restoration Cone Conical (Stryker) M:F 4:10 Mean age in years: 75.7 (SD not reported, Range 28-89) Index stem CPT: 4/14 Exeter: 10/14 Allocation of exposure Surgeon preference Surgeon experiential level Consultant (5 surgeons) Weight bearing status 6 weeks Partial weight bearing then full weight bear as tolerated Venous thromboembolism prophylaxis NS Surgical antibiotic prophylaxis NS Note: Although no specific B2 demographic data provided, pooled data published is as follows:
-PFF post-operatively -Dislocation -Re-operation Time-frame of outcomes assessment: Pooled mean 25 months (SD 9.1, 15-48)
Utilised descrip-tive statistics for remain-ing outcomes for exposure group
PFF post-operatively 1/14 (7.1%) Dislocation 1/14 (7.1%) Re-operation 1/14 (7.1%)
In conclusion, we describe a common fracture pattern around Collarless, polished, tapered stems, the extent of which can be underestimated preoperatively using standard radiographs. This fracture pattern requires extensive reconstruction surgery invariably with revision of the existing hip replacement with possible supplemental
Internal audit of CPT PFF. No conclusions from reviewers.
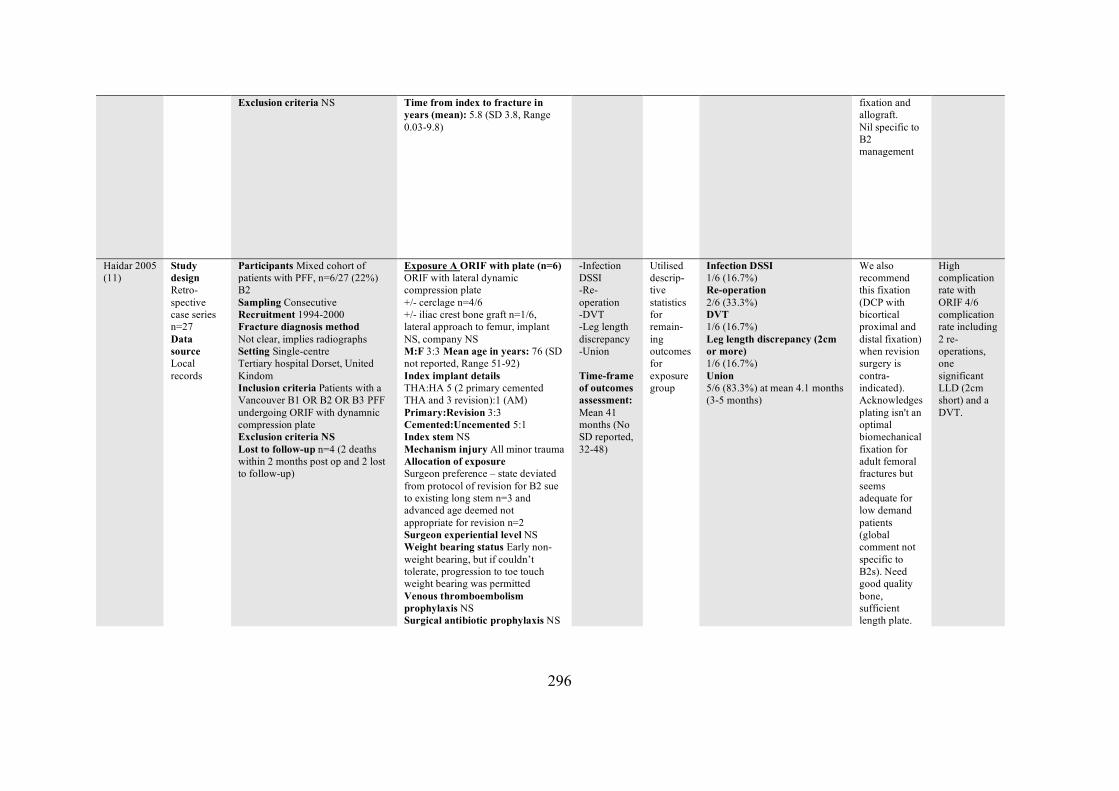
296
Exclusion criteria NS
Time from index to fracture in years (mean): 5.8 (SD 3.8, Range 0.03-9.8)
fixation and allograft. Nil specific to B2 management
Haidar 2005 (11)
Study design Retro-spective case series n=27 Data source Local records
Participants Mixed cohort of patients with PFF, n=6/27 (22%) B2 Sampling Consecutive Recruitment 1994-2000 Fracture diagnosis method Not clear, implies radiographs Setting Single-centre Tertiary hospital Dorset, United Kindom Inclusion criteria Patients with a Vancouver B1 OR B2 OR B3 PFF undergoing ORIF with dynamnic compression plate Exclusion criteria NS Lost to follow-up n=4 (2 deaths within 2 months post op and 2 lost to follow-up)
Exposure A ORIF with plate (n=6) ORIF with lateral dynamic compression plate +/- cerclage n=4/6 +/- iliac crest bone graft n=1/6, lateral approach to femur, implant NS, company NS M:F 3:3 Mean age in years: 76 (SD not reported, Range 51-92) Index implant details THA:HA 5 (2 primary cemented THA and 3 revision):1 (AM) Primary:Revision 3:3 Cemented:Uncemented 5:1 Index stem NS Mechanism injury All minor trauma Allocation of exposure Surgeon preference – state deviated from protocol of revision for B2 sue to existing long stem n=3 and advanced age deemed not appropriate for revision n=2 Surgeon experiential level NS Weight bearing status Early non-weight bearing, but if couldn’t tolerate, progression to toe touch weight bearing was permitted Venous thromboembolism prophylaxis NS Surgical antibiotic prophylaxis NS
-Infection DSSI -Re-operation -DVT -Leg length discrepancy -Union Time-frame of outcomes assessment: Mean 41 months (No SD reported, 32-48)
Utilised descrip-tive statistics for remain-ing outcomes for exposure group
Infection DSSI 1/6 (16.7%) Re-operation 2/6 (33.3%) DVT 1/6 (16.7%) Leg length discrepancy (2cm or more) 1/6 (16.7%) Union 5/6 (83.3%) at mean 4.1 months (3-5 months)
We also recommend this fixation (DCP with bicortical proximal and distal fixation) when revision surgery is contra-indicated). Acknowledges plating isn't an optimal biomechanical fixation for adult femoral fractures but seems adequate for low demand patients (global comment not specific to B2s). Need good quality bone, sufficient length plate.
High complication rate with ORIF 4/6 complication rate including 2 re-operations, one significant LLD (2cm short) and a DVT.
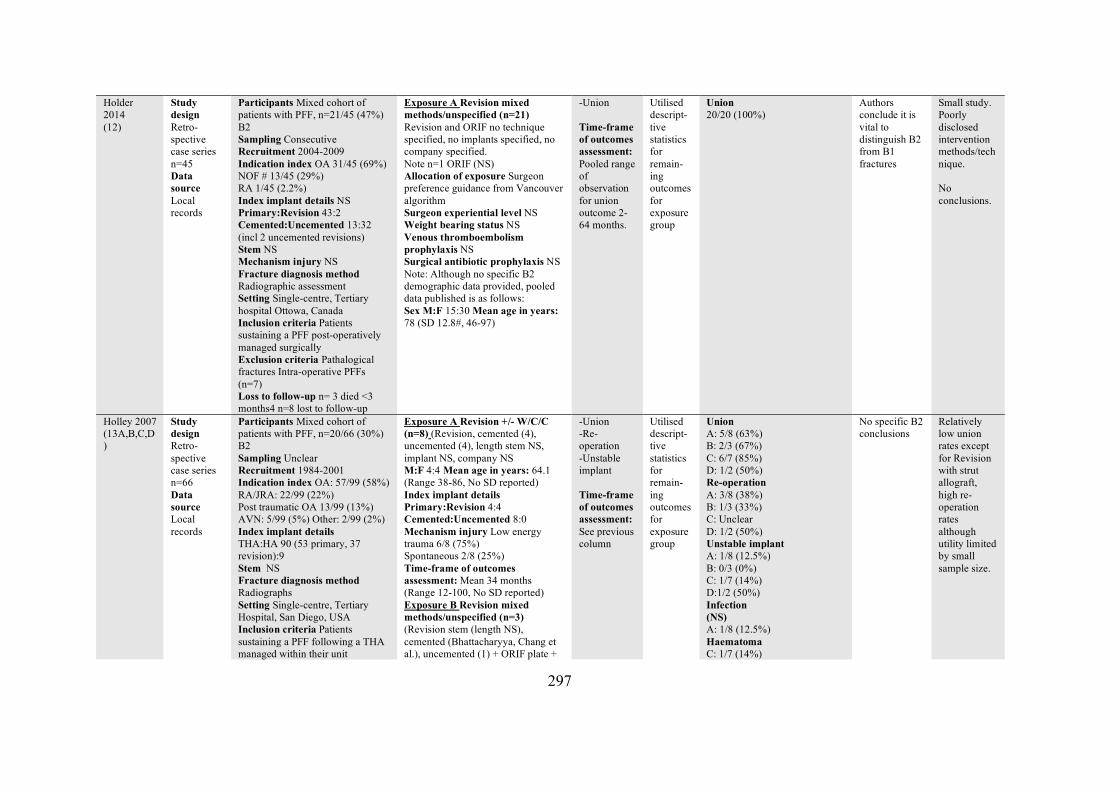
297
Holder 2014 (12)
Study design Retro-spective case series n=45 Data source Local records
Participants Mixed cohort of patients with PFF, n=21/45 (47%) B2 Sampling Consecutive Recruitment 2004-2009 Indication index OA 31/45 (69%) NOF # 13/45 (29%) RA 1/45 (2.2%) Index implant details NS Primary:Revision 43:2 Cemented:Uncemented 13:32 (incl 2 uncemented revisions) Stem NS Mechanism injury NS Fracture diagnosis method Radiographic assessment Setting Single-centre, Tertiary hospital Ottowa, Canada Inclusion criteria Patients sustaining a PFF post-operatively managed surgically Exclusion criteria Pathalogical fractures Intra-operative PFFs (n=7) Loss to follow-up n= 3 died <3 months4 n=8 lost to follow-up
Exposure A Revision mixed methods/unspecified (n=21) Revision and ORIF no technique specified, no implants specified, no company specified. Note n=1 ORIF (NS) Allocation of exposure Surgeon preference guidance from Vancouver algorithm Surgeon experiential level NS Weight bearing status NS Venous thromboembolism prophylaxis NS Surgical antibiotic prophylaxis NS Note: Although no specific B2 demographic data provided, pooled data published is as follows: Sex M:F 15:30 Mean age in years: 78 (SD 12.8#, 46-97)
-Union Time-frame of outcomes assessment: Pooled range of observation for union outcome 2-64 months.
Utilised descript-tive statistics for remain-ing outcomes for exposure group
Union 20/20 (100%)
Authors conclude it is vital to distinguish B2 from B1 fractures
Small study. Poorly disclosed intervention methods/technique. No conclusions.
Holley 2007 (13A,B,C,D)
Study design Retro-spective case series n=66 Data source Local records
Participants Mixed cohort of patients with PFF, n=20/66 (30%) B2 Sampling Unclear Recruitment 1984-2001 Indication index OA: 57/99 (58%) RA/JRA: 22/99 (22%) Post traumatic OA 13/99 (13%) AVN: 5/99 (5%) Other: 2/99 (2%) Index implant details THA:HA 90 (53 primary, 37 revision):9 Stem NS Fracture diagnosis method Radiographs Setting Single-centre, Tertiary Hospital, San Diego, USA Inclusion criteria Patients sustaining a PFF following a THA managed within their unit
Exposure A Revision +/- W/C/C (n=8) (Revision, cemented (4), uncemented (4), length stem NS, implant NS, company NS M:F 4:4 Mean age in years: 64.1 (Range 38-86, No SD reported) Index implant details Primary:Revision 4:4 Cemented:Uncemented 8:0 Mechanism injury Low energy trauma 6/8 (75%) Spontaneous 2/8 (25%) Time-frame of outcomes assessment: Mean 34 months (Range 12-100, No SD reported) Exposure B Revision mixed methods/unspecified (n=3) (Revision stem (length NS), cemented (Bhattacharyya, Chang et al.), uncemented (1) + ORIF plate +
-Union -Re-operation -Unstable implant Time-frame of outcomes assessment: See previous column
Utilised descript-tive statistics for remain-ing outcomes for exposure group
Union A: 5/8 (63%) B: 2/3 (67%) C: 6/7 (85%) D: 1/2 (50%) Re-operation A: 3/8 (38%) B: 1/3 (33%) C: Unclear D: 1/2 (50%) Unstable implant A: 1/8 (12.5%) B: 0/3 (0%) C: 1/7 (14%) D:1/2 (50%) Infection (NS) A: 1/8 (12.5%) Haematoma C: 1/7 (14%)
No specific B2 conclusions
Relatively low union rates except for Revision with strut allograft, high re-operation rates although utility limited by small sample size.
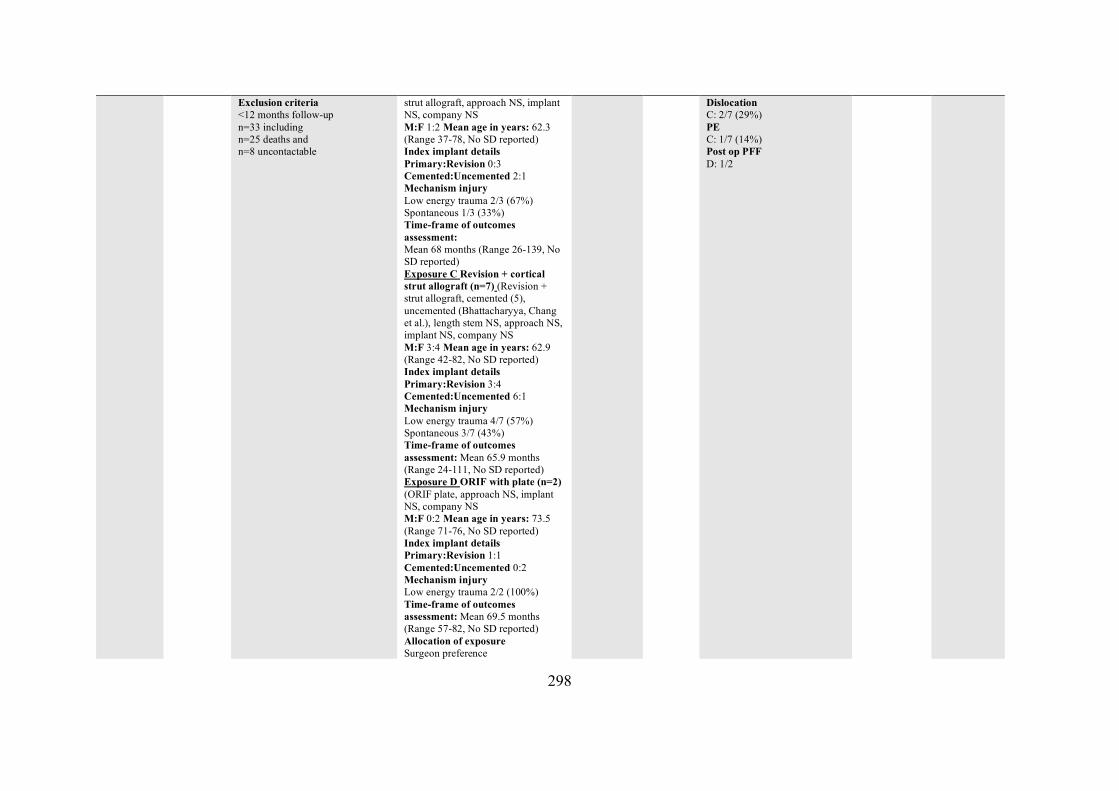
298
Exclusion criteria <12 months follow-up n=33 including n=25 deaths and n=8 uncontactable
strut allograft, approach NS, implant NS, company NS M:F 1:2 Mean age in years: 62.3 (Range 37-78, No SD reported) Index implant details Primary:Revision 0:3 Cemented:Uncemented 2:1 Mechanism injury Low energy trauma 2/3 (67%) Spontaneous 1/3 (33%) Time-frame of outcomes assessment: Mean 68 months (Range 26-139, No SD reported) Exposure C Revision + cortical strut allograft (n=7) (Revision + strut allograft, cemented (5), uncemented (Bhattacharyya, Chang et al.), length stem NS, approach NS, implant NS, company NS M:F 3:4 Mean age in years: 62.9 (Range 42-82, No SD reported) Index implant details Primary:Revision 3:4 Cemented:Uncemented 6:1 Mechanism injury Low energy trauma 4/7 (57%) Spontaneous 3/7 (43%) Time-frame of outcomes assessment: Mean 65.9 months (Range 24-111, No SD reported) Exposure D ORIF with plate (n=2) (ORIF plate, approach NS, implant NS, company NS M:F 0:2 Mean age in years: 73.5 (Range 71-76, No SD reported) Index implant details Primary:Revision 1:1 Cemented:Uncemented 0:2 Mechanism injury Low energy trauma 2/2 (100%) Time-frame of outcomes assessment: Mean 69.5 months (Range 57-82, No SD reported) Allocation of exposure Surgeon preference
Dislocation C: 2/7 (29%) PE C: 1/7 (14%) Post op PFF D: 1/2
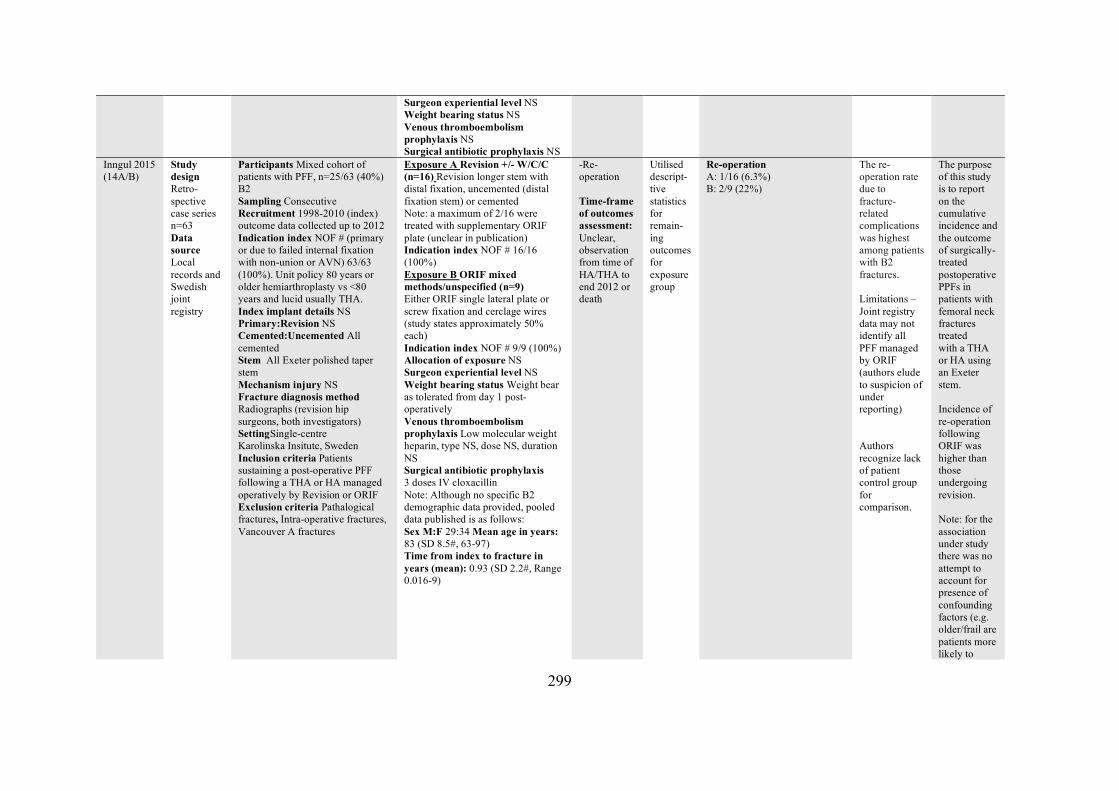
299
Surgeon experiential level NS Weight bearing status NS Venous thromboembolism prophylaxis NS Surgical antibiotic prophylaxis NS
Inngul 2015 (14A/B)
Study design Retro-spective case series n=63 Data source Local records and Swedish joint registry
Participants Mixed cohort of patients with PFF, n=25/63 (40%) B2 Sampling Consecutive Recruitment 1998-2010 (index) outcome data collected up to 2012 Indication index NOF # (primary or due to failed internal fixation with non-union or AVN) 63/63 (100%). Unit policy 80 years or older hemiarthroplasty vs <80 years and lucid usually THA. Index implant details NS Primary:Revision NS Cemented:Uncemented All cemented Stem All Exeter polished taper stem Mechanism injury NS Fracture diagnosis method Radiographs (revision hip surgeons, both investigators) SettingSingle-centre Karolinska Insitute, Sweden Inclusion criteria Patients sustaining a post-operative PFF following a THA or HA managed operatively by Revision or ORIF Exclusion criteria Pathalogical fractures, Intra-operative fractures, Vancouver A fractures
Exposure A Revision +/- W/C/C (n=16) Revision longer stem with distal fixation, uncemented (distal fixation stem) or cemented Note: a maximum of 2/16 were treated with supplementary ORIF plate (unclear in publication) Indication index NOF # 16/16 (100%) Exposure B ORIF mixed methods/unspecified (n=9) Either ORIF single lateral plate or screw fixation and cerclage wires (study states approximately 50% each) Indication index NOF # 9/9 (100%) Allocation of exposure NS Surgeon experiential level NS Weight bearing status Weight bear as tolerated from day 1 post-operatively Venous thromboembolism prophylaxis Low molecular weight heparin, type NS, dose NS, duration NS Surgical antibiotic prophylaxis 3 doses IV cloxacillin Note: Although no specific B2 demographic data provided, pooled data published is as follows: Sex M:F 29:34 Mean age in years: 83 (SD 8.5#, 63-97) Time from index to fracture in years (mean): 0.93 (SD 2.2#, Range 0.016-9)
-Re-operation Time-frame of outcomes assessment: Unclear, observation from time of HA/THA to end 2012 or death
Utilised descript-tive statistics for remain-ing outcomes for exposure group
Re-operation A: 1/16 (6.3%) B: 2/9 (22%)
The re-operation rate due to fracture-related complications was highest among patients with B2 fractures. Limitations – Joint registry data may not identify all PFF managed by ORIF (authors elude to suspicion of under reporting) Authors recognize lack of patient control group for comparison.
The purpose of this study is to report on the cumulative incidence and the outcome of surgically-treated postoperative PPFs in patients with femoral neck fractures treated with a THA or HA using an Exeter stem. Incidence of re-operation following ORIF was higher than those undergoing revision. Note: for the association under study there was no attempt to account for presence of confounding factors (e.g. older/frail are patients more likely to
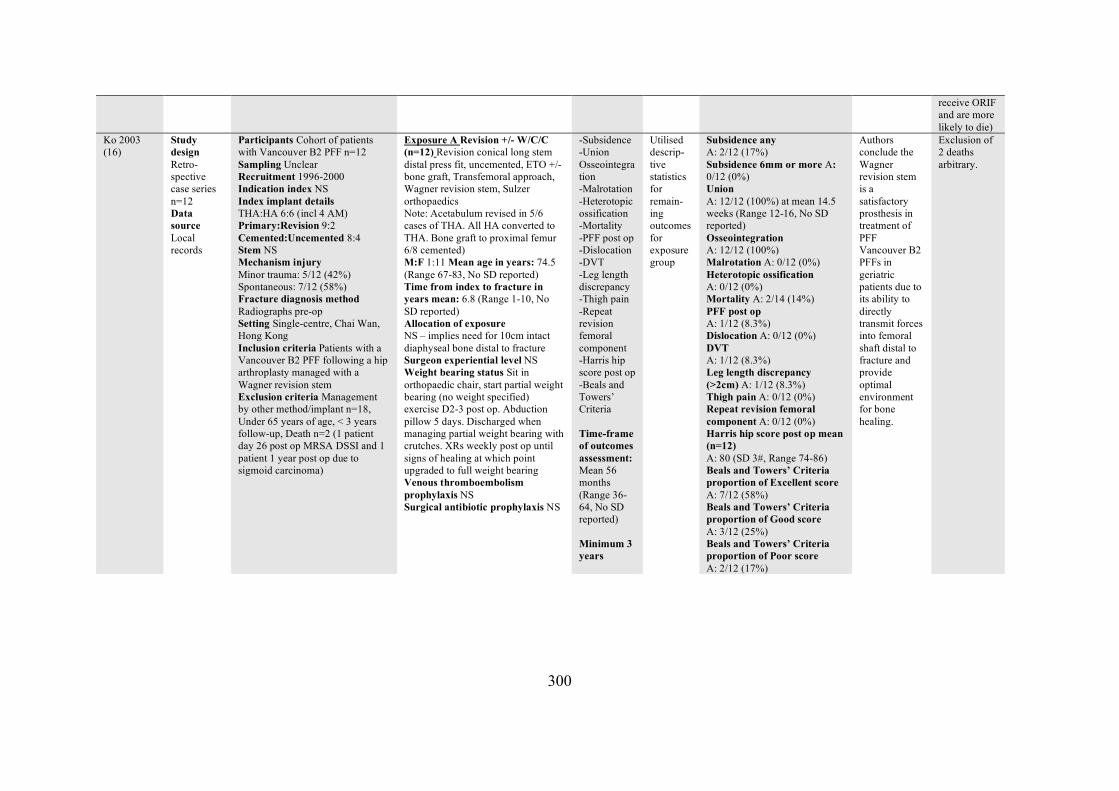
300
receive ORIF and are more likely to die)
Ko 2003 (16)
Study design Retro-spective case series n=12 Data source Local records
Participants Cohort of patients with Vancouver B2 PFF n=12 Sampling Unclear Recruitment 1996-2000 Indication index NS Index implant details THA:HA 6:6 (incl 4 AM) Primary:Revision 9:2 Cemented:Uncemented 8:4 Stem NS Mechanism injury Minor trauma: 5/12 (42%) Spontaneous: 7/12 (58%) Fracture diagnosis method Radiographs pre-op Setting Single-centre, Chai Wan, Hong Kong Inclusion criteria Patients with a Vancouver B2 PFF following a hip arthroplasty managed with a Wagner revision stem Exclusion criteria Management by other method/implant n=18, Under 65 years of age, < 3 years follow-up, Death n=2 (1 patient day 26 post op MRSA DSSI and 1 patient 1 year post op due to sigmoid carcinoma)
Exposure A Revision +/- W/C/C (n=12) Revision conical long stem distal press fit, uncemented, ETO +/- bone graft, Transfemoral approach, Wagner revision stem, Sulzer orthopaedics Note: Acetabulum revised in 5/6 cases of THA. All HA converted to THA. Bone graft to proximal femur 6/8 cemented) M:F 1:11 Mean age in years: 74.5 (Range 67-83, No SD reported) Time from index to fracture in years mean: 6.8 (Range 1-10, No SD reported) Allocation of exposure NS – implies need for 10cm intact diaphyseal bone distal to fracture Surgeon experiential level NS Weight bearing status Sit in orthopaedic chair, start partial weight bearing (no weight specified) exercise D2-3 post op. Abduction pillow 5 days. Discharged when managing partial weight bearing with crutches. XRs weekly post op until signs of healing at which point upgraded to full weight bearing Venous thromboembolism prophylaxis NS Surgical antibiotic prophylaxis NS
-Subsidence -Union Osseointegration -Malrotation -Heterotopic ossification -Mortality -PFF post op -Dislocation -DVT -Leg length discrepancy -Thigh pain -Repeat revision femoral component -Harris hip score post op -Beals and Towers’ Criteria Time-frame of outcomes assessment: Mean 56 months (Range 36-64, No SD reported) Minimum 3 years
Utilised descrip-tive statistics for remain-ing outcomes for exposure group
Subsidence any A: 2/12 (17%) Subsidence 6mm or more A: 0/12 (0%) Union A: 12/12 (100%) at mean 14.5 weeks (Range 12-16, No SD reported) Osseointegration A: 12/12 (100%) Malrotation A: 0/12 (0%) Heterotopic ossification A: 0/12 (0%) Mortality A: 2/14 (14%) PFF post op A: 1/12 (8.3%) Dislocation A: 0/12 (0%) DVT A: 1/12 (8.3%) Leg length discrepancy (>2cm) A: 1/12 (8.3%) Thigh pain A: 0/12 (0%) Repeat revision femoral component A: 0/12 (0%) Harris hip score post op mean (n=12) A: 80 (SD 3#, Range 74-86) Beals and Towers’ Criteria proportion of Excellent score A: 7/12 (58%) Beals and Towers’ Criteria proportion of Good score A: 3/12 (25%) Beals and Towers’ Criteria proportion of Poor score A: 2/12 (17%)
Authors conclude the Wagner revision stem is a satisfactory prosthesis in treatment of PFF Vancouver B2 PFFs in geriatric patients due to its ability to directly transmit forces into femoral shaft distal to fracture and provide optimal environment for bone healing.
Exclusion of 2 deaths arbitrary.
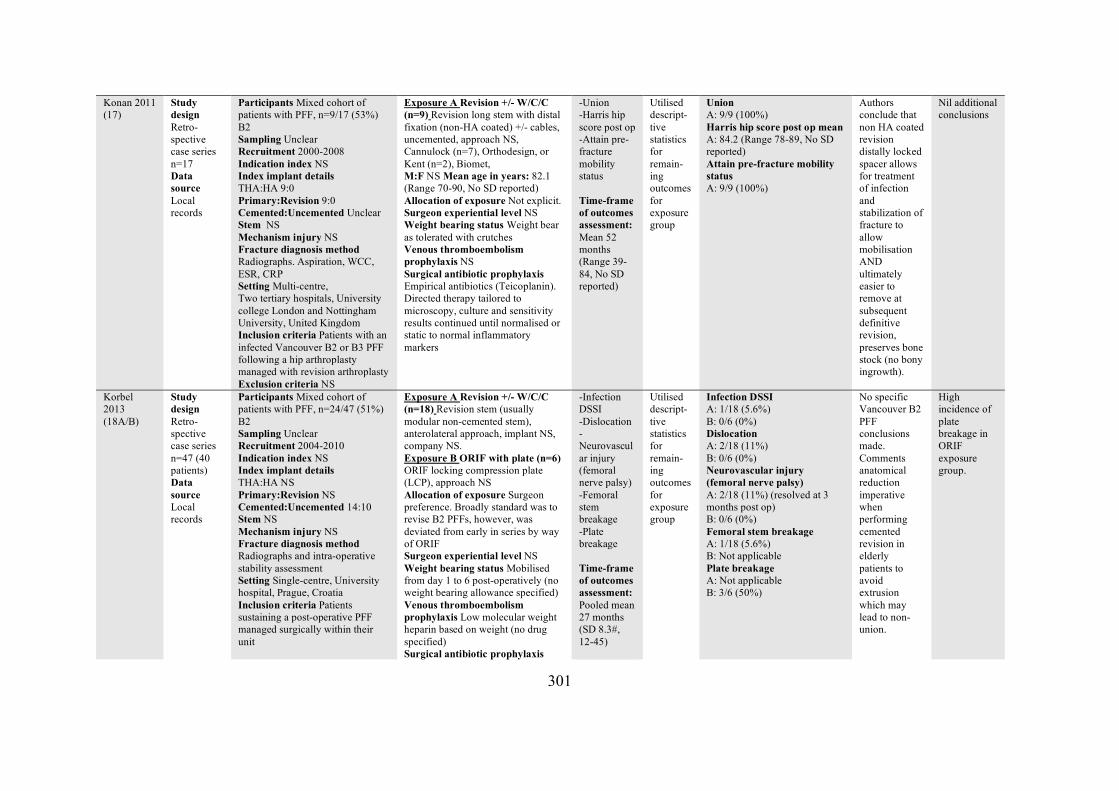
301
Konan 2011 (17)
Study design Retro-spective case series n=17 Data source Local records
Participants Mixed cohort of patients with PFF, n=9/17 (53%) B2 Sampling Unclear Recruitment 2000-2008 Indication index NS Index implant details THA:HA 9:0 Primary:Revision 9:0 Cemented:Uncemented Unclear Stem NS Mechanism injury NS Fracture diagnosis method Radiographs. Aspiration, WCC, ESR, CRP Setting Multi-centre, Two tertiary hospitals, University college London and Nottingham University, United Kingdom Inclusion criteria Patients with an infected Vancouver B2 or B3 PFF following a hip arthroplasty managed with revision arthroplasty Exclusion criteria NS
Exposure A Revision +/- W/C/C (n=9) Revision long stem with distal fixation (non-HA coated) +/- cables, uncemented, approach NS, Cannulock (n=7), Orthodesign, or Kent (n=2), Biomet, M:F NS Mean age in years: 82.1 (Range 70-90, No SD reported) Allocation of exposure Not explicit. Surgeon experiential level NS Weight bearing status Weight bear as tolerated with crutches Venous thromboembolism prophylaxis NS Surgical antibiotic prophylaxis Empirical antibiotics (Teicoplanin). Directed therapy tailored to microscopy, culture and sensitivity results continued until normalised or static to normal inflammatory markers
-Union -Harris hip score post op -Attain pre-fracture mobility status Time-frame of outcomes assessment: Mean 52 months (Range 39-84, No SD reported)
Utilised descript-tive statistics for remain-ing outcomes for exposure group
Union A: 9/9 (100%) Harris hip score post op mean A: 84.2 (Range 78-89, No SD reported) Attain pre-fracture mobility status A: 9/9 (100%)
Authors conclude that non HA coated revision distally locked spacer allows for treatment of infection and stabilization of fracture to allow mobilisation AND ultimately easier to remove at subsequent definitive revision, preserves bone stock (no bony ingrowth).
Nil additional conclusions
Korbel 2013 (18A/B)
Study design Retro-spective case series n=47 (40 patients) Data source Local records
Participants Mixed cohort of patients with PFF, n=24/47 (51%) B2 Sampling Unclear Recruitment 2004-2010 Indication index NS Index implant details THA:HA NS Primary:Revision NS Cemented:Uncemented 14:10 Stem NS Mechanism injury NS Fracture diagnosis method Radiographs and intra-operative stability assessment Setting Single-centre, University hospital, Prague, Croatia Inclusion criteria Patients sustaining a post-operative PFF managed surgically within their unit
Exposure A Revision +/- W/C/C (n=18) Revision stem (usually modular non-cemented stem), anterolateral approach, implant NS, company NS. Exposure B ORIF with plate (n=6) ORIF locking compression plate (LCP), approach NS Allocation of exposure Surgeon preference. Broadly standard was to revise B2 PFFs, however, was deviated from early in series by way of ORIF Surgeon experiential level NS Weight bearing status Mobilised from day 1 to 6 post-operatively (no weight bearing allowance specified) Venous thromboembolism prophylaxis Low molecular weight heparin based on weight (no drug specified) Surgical antibiotic prophylaxis
-Infection DSSI -Dislocation -Neurovascular injury (femoral nerve palsy) -Femoral stem breakage -Plate breakage Time-frame of outcomes assessment: Pooled mean 27 months (SD 8.3#, 12-45)
Utilised descript-tive statistics for remain-ing outcomes for exposure group
Infection DSSI A: 1/18 (5.6%) B: 0/6 (0%) Dislocation A: 2/18 (11%) B: 0/6 (0%) Neurovascular injury (femoral nerve palsy) A: 2/18 (11%) (resolved at 3 months post op) B: 0/6 (0%) Femoral stem breakage A: 1/18 (5.6%) B: Not applicable Plate breakage A: Not applicable B: 3/6 (50%)
No specific Vancouver B2 PFF conclusions made. Comments anatomical reduction imperative when performing cemented revision in elderly patients to avoid extrusion which may lead to non-union.
High incidence of plate breakage in ORIF exposure group.
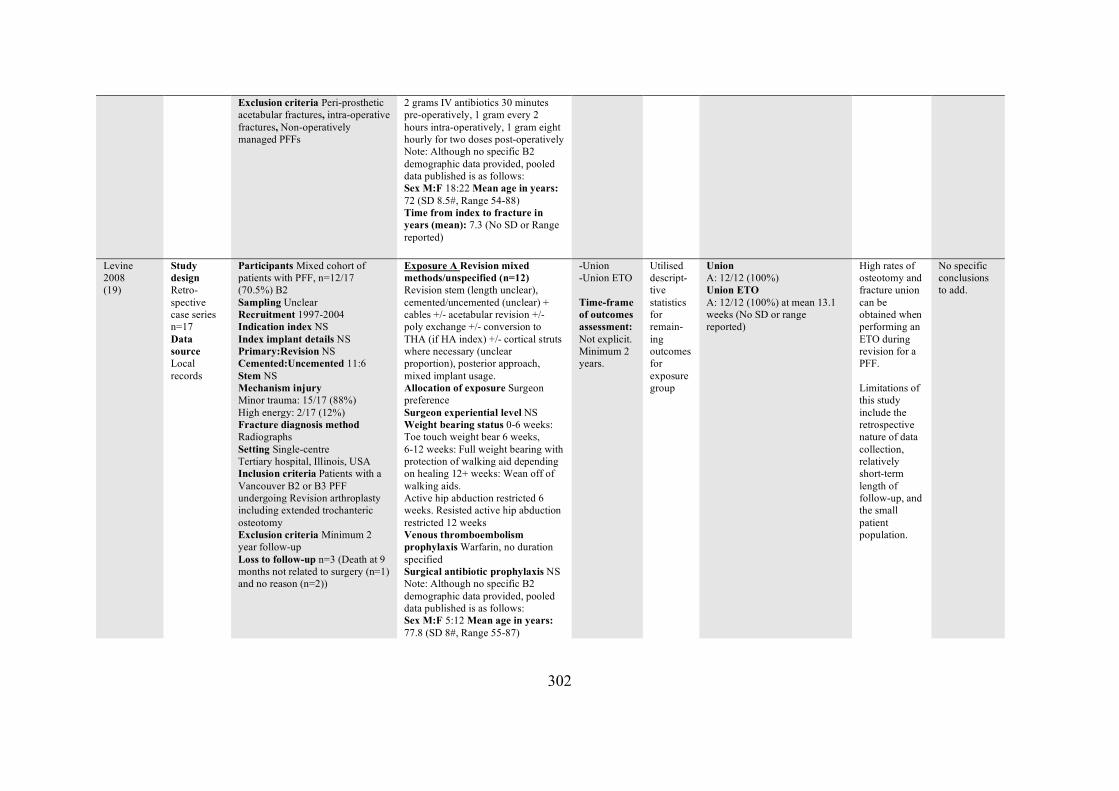
302
Exclusion criteria Peri-prosthetic acetabular fractures, intra-operative fractures, Non-operatively managed PFFs
2 grams IV antibiotics 30 minutes pre-operatively, 1 gram every 2 hours intra-operatively, 1 gram eight hourly for two doses post-operatively Note: Although no specific B2 demographic data provided, pooled data published is as follows: Sex M:F 18:22 Mean age in years: 72 (SD 8.5#, Range 54-88) Time from index to fracture in years (mean): 7.3 (No SD or Range reported)
Levine 2008 (19)
Study design Retro-spective case series n=17 Data source Local records
Participants Mixed cohort of patients with PFF, n=12/17 (70.5%) B2 Sampling Unclear Recruitment 1997-2004 Indication index NS Index implant details NS Primary:Revision NS Cemented:Uncemented 11:6 Stem NS Mechanism injury Minor trauma: 15/17 (88%) High energy: 2/17 (12%) Fracture diagnosis method Radiographs Setting Single-centre Tertiary hospital, Illinois, USA Inclusion criteria Patients with a Vancouver B2 or B3 PFF undergoing Revision arthroplasty including extended trochanteric osteotomy Exclusion criteria Minimum 2 year follow-up Loss to follow-up n=3 (Death at 9 months not related to surgery (n=1) and no reason (n=2))
Exposure A Revision mixed methods/unspecified (n=12) Revision stem (length unclear), cemented/uncemented (unclear) + cables +/- acetabular revision +/- poly exchange +/- conversion to THA (if HA index) +/- cortical struts where necessary (unclear proportion), posterior approach, mixed implant usage. Allocation of exposure Surgeon preference Surgeon experiential level NS Weight bearing status 0-6 weeks: Toe touch weight bear 6 weeks, 6-12 weeks: Full weight bearing with protection of walking aid depending on healing 12+ weeks: Wean off of walking aids. Active hip abduction restricted 6 weeks. Resisted active hip abduction restricted 12 weeks Venous thromboembolism prophylaxis Warfarin, no duration specified Surgical antibiotic prophylaxis NS Note: Although no specific B2 demographic data provided, pooled data published is as follows: Sex M:F 5:12 Mean age in years: 77.8 (SD 8#, Range 55-87)
-Union -Union ETO Time-frame of outcomes assessment: Not explicit. Minimum 2 years.
Utilised descript-tive statistics for remain-ing outcomes for exposure group
Union A: 12/12 (100%) Union ETO A: 12/12 (100%) at mean 13.1 weeks (No SD or range reported)
High rates of osteotomy and fracture union can be obtained when performing an ETO during revision for a PFF. Limitations of this study include the retrospective nature of data collection, relatively short-term length of follow-up, and the small patient population.
No specific conclusions to add.
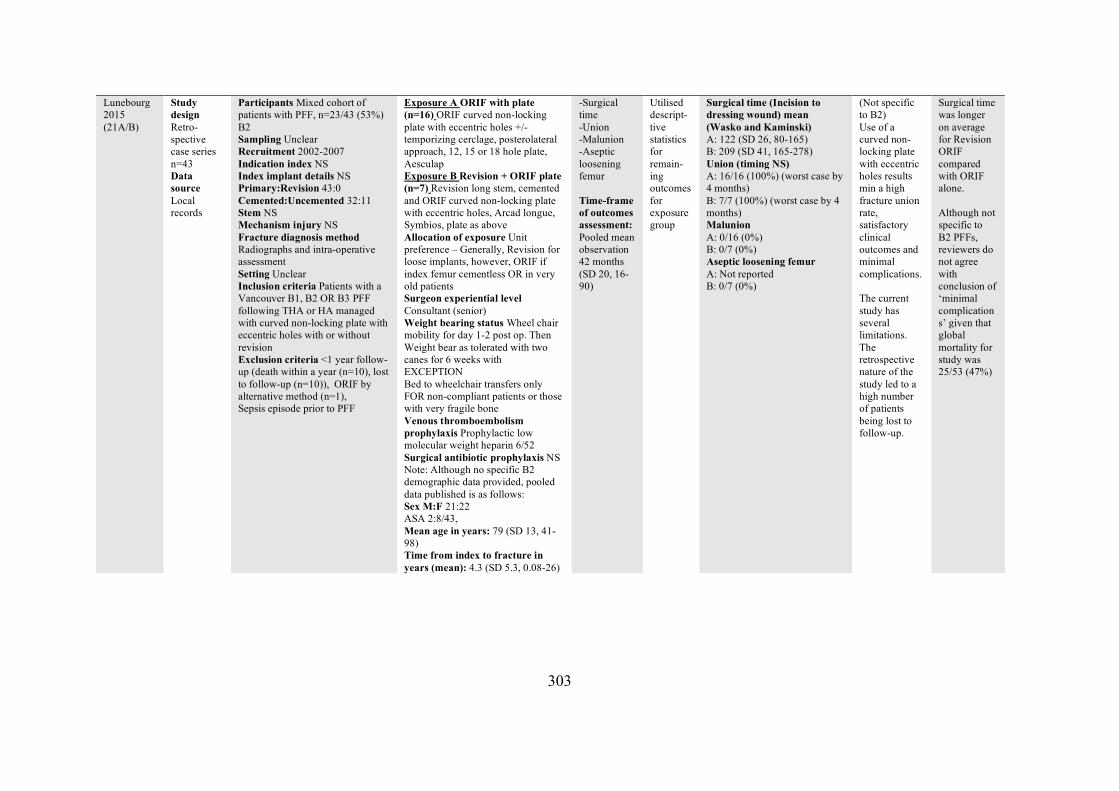
303
Lunebourg 2015 (21A/B)
Study design Retro-spective case series n=43 Data source Local records
Participants Mixed cohort of patients with PFF, n=23/43 (53%) B2 Sampling Unclear Recruitment 2002-2007 Indication index NS Index implant details NS Primary:Revision 43:0 Cemented:Uncemented 32:11 Stem NS Mechanism injury NS Fracture diagnosis method Radiographs and intra-operative assessment Setting Unclear Inclusion criteria Patients with a Vancouver B1, B2 OR B3 PFF following THA or HA managed with curved non-locking plate with eccentric holes with or without revision Exclusion criteria <1 year follow-up (death within a year (n=10), lost to follow-up (n=10)), ORIF by alternative method (n=1), Sepsis episode prior to PFF
Exposure A ORIF with plate (n=16) ORIF curved non-locking plate with eccentric holes +/- temporizing cerclage, posterolateral approach, 12, 15 or 18 hole plate, Aesculap Exposure B Revision + ORIF plate (n=7) Revision long stem, cemented and ORIF curved non-locking plate with eccentric holes, Arcad longue, Symbios, plate as above Allocation of exposure Unit preference – Generally, Revision for loose implants, however, ORIF if index femur cementless OR in very old patients Surgeon experiential level Consultant (senior) Weight bearing status Wheel chair mobility for day 1-2 post op. Then Weight bear as tolerated with two canes for 6 weeks with EXCEPTION Bed to wheelchair transfers only FOR non-compliant patients or those with very fragile bone Venous thromboembolism prophylaxis Prophylactic low molecular weight heparin 6/52 Surgical antibiotic prophylaxis NS Note: Although no specific B2 demographic data provided, pooled data published is as follows: Sex M:F 21:22 ASA 2:8/43, Mean age in years: 79 (SD 13, 41-98) Time from index to fracture in years (mean): 4.3 (SD 5.3, 0.08-26)
-Surgical time -Union -Malunion -Aseptic loosening femur Time-frame of outcomes assessment: Pooled mean observation 42 months (SD 20, 16-90)
Utilised descript-tive statistics for remain-ing outcomes for exposure group
Surgical time (Incision to dressing wound) mean (Wasko and Kaminski) A: 122 (SD 26, 80-165) B: 209 (SD 41, 165-278) Union (timing NS) A: 16/16 (100%) (worst case by 4 months) B: 7/7 (100%) (worst case by 4 months) Malunion A: 0/16 (0%) B: 0/7 (0%) Aseptic loosening femur A: Not reported B: 0/7 (0%)
(Not specific to B2) Use of a curved non-locking plate with eccentric holes results min a high fracture union rate, satisfactory clinical outcomes and minimal complications. The current study has several limitations. The retrospective nature of the study led to a high number of patients being lost to follow-up.
Surgical time was longer on average for Revision ORIF compared with ORIF alone. Although not specific to B2 PFFs, reviewers do not agree with conclusion of ‘minimal complications’ given that global mortality for study was 25/53 (47%)
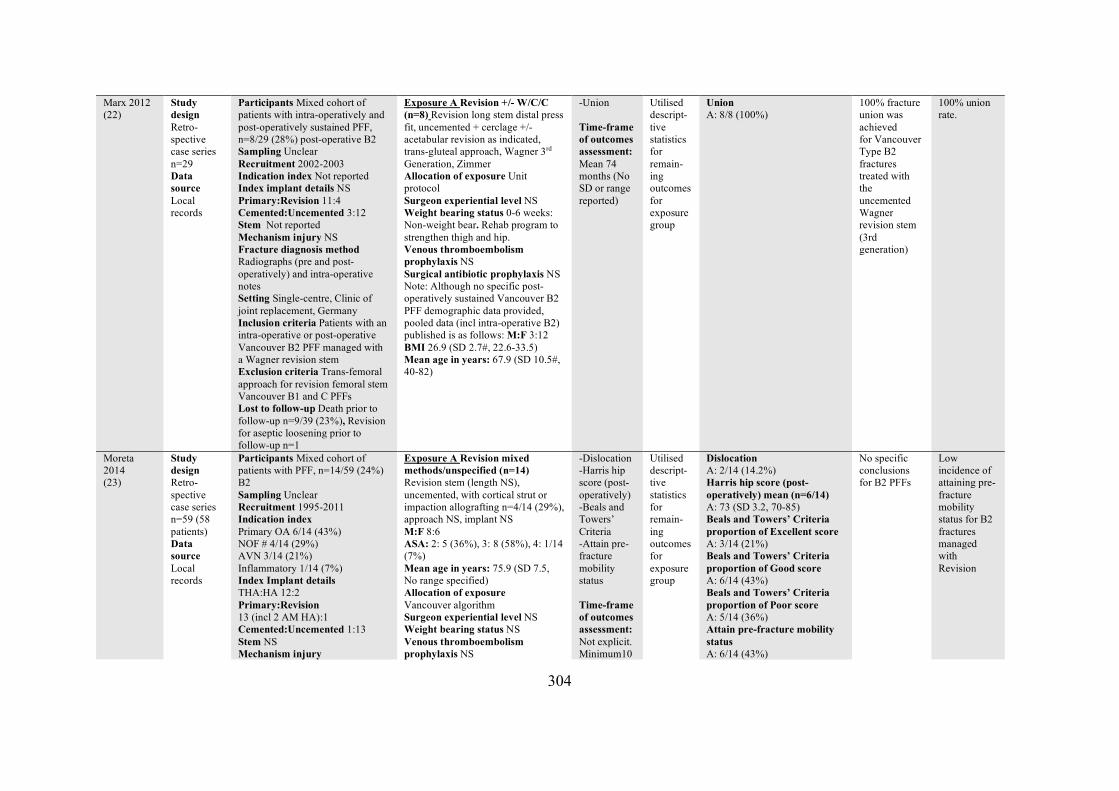
304
Marx 2012 (22)
Study design Retro-spective case series n=29 Data source Local records
Participants Mixed cohort of patients with intra-operatively and post-operatively sustained PFF, n=8/29 (28%) post-operative B2 Sampling Unclear Recruitment 2002-2003 Indication index Not reported Index implant details NS Primary:Revision 11:4 Cemented:Uncemented 3:12 Stem Not reported Mechanism injury NS Fracture diagnosis method Radiographs (pre and post-operatively) and intra-operative notes Setting Single-centre, Clinic of joint replacement, Germany Inclusion criteria Patients with an intra-operative or post-operative Vancouver B2 PFF managed with a Wagner revision stem Exclusion criteria Trans-femoral approach for revision femoral stem Vancouver B1 and C PFFs Lost to follow-up Death prior to follow-up n=9/39 (23%), Revision for aseptic loosening prior to follow-up n=1
Exposure A Revision +/- W/C/C (n=8) Revision long stem distal press fit, uncemented + cerclage +/- acetabular revision as indicated, trans-gluteal approach, Wagner 3rd Generation, Zimmer Allocation of exposure Unit protocol Surgeon experiential level NS Weight bearing status 0-6 weeks: Non-weight bear. Rehab program to strengthen thigh and hip. Venous thromboembolism prophylaxis NS Surgical antibiotic prophylaxis NS Note: Although no specific post-operatively sustained Vancouver B2 PFF demographic data provided, pooled data (incl intra-operative B2) published is as follows: M:F 3:12 BMI 26.9 (SD 2.7#, 22.6-33.5) Mean age in years: 67.9 (SD 10.5#, 40-82)
-Union Time-frame of outcomes assessment: Mean 74 months (No SD or range reported)
Utilised descript-tive statistics for remain-ing outcomes for exposure group
Union A: 8/8 (100%)
100% fracture union was achieved for Vancouver Type B2 fractures treated with the uncemented Wagner revision stem (3rd generation)
100% union rate.
Moreta 2014 (23)
Study design Retro-spective case series n=59 (58 patients) Data source Local records
Participants Mixed cohort of patients with PFF, n=14/59 (24%) B2 Sampling Unclear Recruitment 1995-2011 Indication index Primary OA 6/14 (43%) NOF # 4/14 (29%) AVN 3/14 (21%) Inflammatory 1/14 (7%) Index Implant details THA:HA 12:2 Primary:Revision 13 (incl 2 AM HA):1 Cemented:Uncemented 1:13 Stem NS Mechanism injury
Exposure A Revision mixed methods/unspecified (n=14) Revision stem (length NS), uncemented, with cortical strut or impaction allografting n=4/14 (29%), approach NS, implant NS M:F 8:6 ASA: 2: 5 (36%), 3: 8 (58%), 4: 1/14 (7%) Mean age in years: 75.9 (SD 7.5, No range specified) Allocation of exposure Vancouver algorithm Surgeon experiential level NS Weight bearing status NS Venous thromboembolism prophylaxis NS
-Dislocation -Harris hip score (post-operatively) -Beals and Towers’ Criteria -Attain pre-fracture mobility status Time-frame of outcomes assessment: Not explicit. Minimum10
Utilised descript-tive statistics for remain-ing outcomes for exposure group
Dislocation A: 2/14 (14.2%) Harris hip score (post-operatively) mean (n=6/14) A: 73 (SD 3.2, 70-85) Beals and Towers’ Criteria proportion of Excellent score A: 3/14 (21%) Beals and Towers’ Criteria proportion of Good score A: 6/14 (43%) Beals and Towers’ Criteria proportion of Poor score A: 5/14 (36%) Attain pre-fracture mobility status A: 6/14 (43%)
No specific conclusions for B2 PFFs
Low incidence of attaining pre-fracture mobility status for B2 fractures managed with Revision
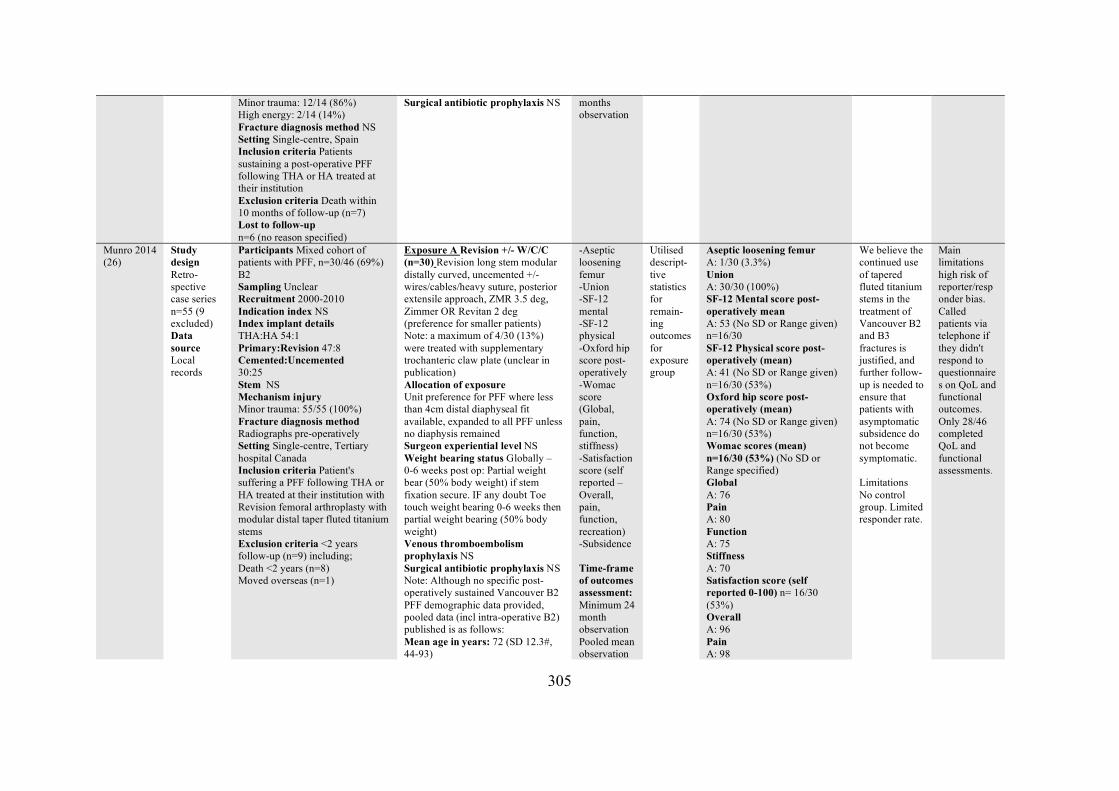
305
Minor trauma: 12/14 (86%) High energy: 2/14 (14%) Fracture diagnosis method NS Setting Single-centre, Spain Inclusion criteria Patients sustaining a post-operative PFF following THA or HA treated at their institution Exclusion criteria Death within 10 months of follow-up (n=7) Lost to follow-up n=6 (no reason specified)
Surgical antibiotic prophylaxis NS
months observation
Munro 2014 (26)
Study design Retro-spective case series n=55 (9 excluded) Data source Local records
Participants Mixed cohort of patients with PFF, n=30/46 (69%) B2 Sampling Unclear Recruitment 2000-2010 Indication index NS Index implant details THA:HA 54:1 Primary:Revision 47:8 Cemented:Uncemented 30:25 Stem NS Mechanism injury Minor trauma: 55/55 (100%) Fracture diagnosis method Radiographs pre-operatively Setting Single-centre, Tertiary hospital Canada Inclusion criteria Patient's suffering a PFF following THA or HA treated at their institution with Revision femoral arthroplasty with modular distal taper fluted titanium stems Exclusion criteria <2 years follow-up (n=9) including; Death <2 years (n=8) Moved overseas (n=1)
Exposure A Revision +/- W/C/C (n=30) Revision long stem modular distally curved, uncemented +/- wires/cables/heavy suture, posterior extensile approach, ZMR 3.5 deg, Zimmer OR Revitan 2 deg (preference for smaller patients) Note: a maximum of 4/30 (13%) were treated with supplementary trochanteric claw plate (unclear in publication) Allocation of exposure Unit preference for PFF where less than 4cm distal diaphyseal fit available, expanded to all PFF unless no diaphysis remained Surgeon experiential level NS Weight bearing status Globally – 0-6 weeks post op: Partial weight bear (50% body weight) if stem fixation secure. IF any doubt Toe touch weight bearing 0-6 weeks then partial weight bearing (50% body weight) Venous thromboembolism prophylaxis NS Surgical antibiotic prophylaxis NS Note: Although no specific post-operatively sustained Vancouver B2 PFF demographic data provided, pooled data (incl intra-operative B2) published is as follows: Mean age in years: 72 (SD 12.3#, 44-93)
-Aseptic loosening femur -Union -SF-12 mental -SF-12 physical -Oxford hip score post-operatively -Womac score (Global, pain, function, stiffness) -Satisfaction score (self reported – Overall, pain, function, recreation) -Subsidence Time-frame of outcomes assessment: Minimum 24 month observation Pooled mean observation
Utilised descript-tive statistics for remain-ing outcomes for exposure group
Aseptic loosening femur A: 1/30 (3.3%) Union A: 30/30 (100%) SF-12 Mental score post-operatively mean A: 53 (No SD or Range given) n=16/30 SF-12 Physical score post-operatively (mean) A: 41 (No SD or Range given) n=16/30 (53%) Oxford hip score post-operatively (mean) A: 74 (No SD or Range given) n=16/30 (53%) Womac scores (mean) n=16/30 (53%) (No SD or Range specified) Global A: 76 Pain A: 80 Function A: 75 Stiffness A: 70 Satisfaction score (self reported 0-100) n= 16/30 (53%) Overall A: 96 Pain A: 98
We believe the continued use of tapered fluted titanium stems in the treatment of Vancouver B2 and B3 fractures is justified, and further follow-up is needed to ensure that patients with asymptomatic subsidence do not become symptomatic. Limitations No control group. Limited responder rate.
Main limitations high risk of reporter/responder bias. Called patients via telephone if they didn't respond to questionnaires on QoL and functional outcomes. Only 28/46 completed QoL and functional assessments.
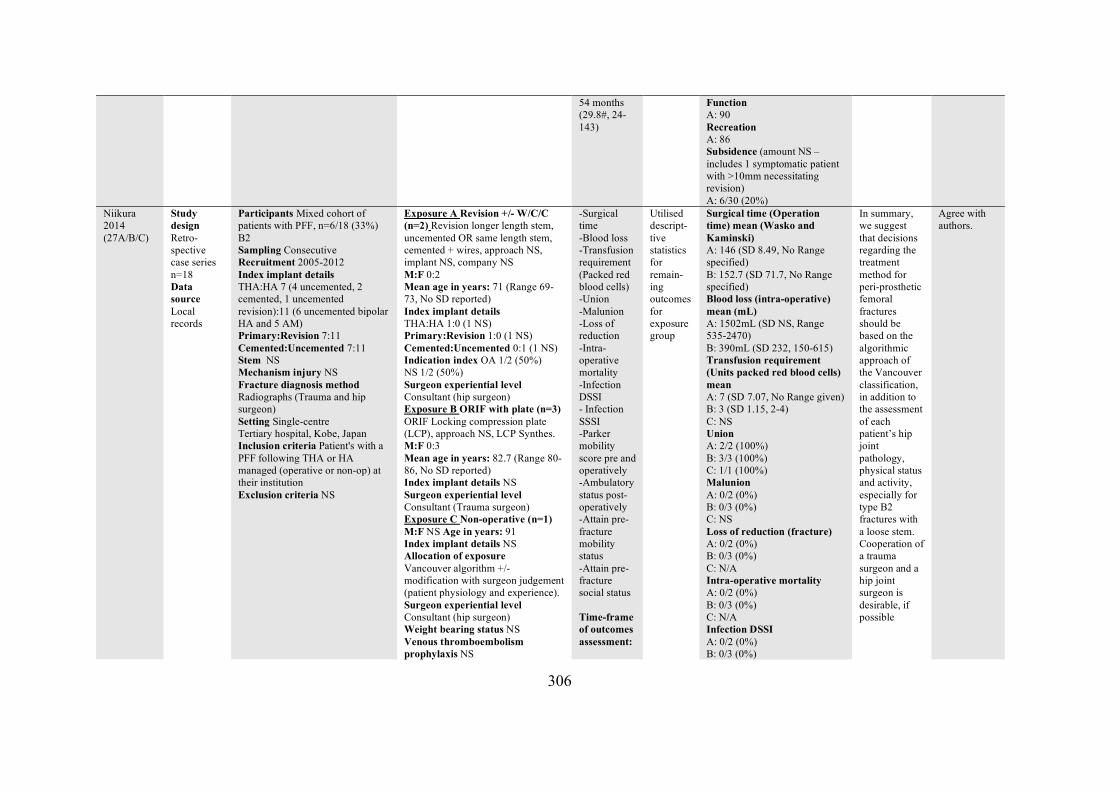
306
54 months (29.8#, 24-143)
Function A: 90 Recreation A: 86 Subsidence (amount NS – includes 1 symptomatic patient with >10mm necessitating revision) A: 6/30 (20%)
Niikura 2014 (27A/B/C)
Study design Retro-spective case series n=18 Data source Local records
Participants Mixed cohort of patients with PFF, n=6/18 (33%) B2 Sampling Consecutive Recruitment 2005-2012 Index implant details THA:HA 7 (4 uncemented, 2 cemented, 1 uncemented revision):11 (6 uncemented bipolar HA and 5 AM) Primary:Revision 7:11 Cemented:Uncemented 7:11 Stem NS Mechanism injury NS Fracture diagnosis method Radiographs (Trauma and hip surgeon) Setting Single-centre Tertiary hospital, Kobe, Japan Inclusion criteria Patient's with a PFF following THA or HA managed (operative or non-op) at their institution Exclusion criteria NS
Exposure A Revision +/- W/C/C (n=2) Revision longer length stem, uncemented OR same length stem, cemented + wires, approach NS, implant NS, company NS M:F 0:2 Mean age in years: 71 (Range 69-73, No SD reported) Index implant details THA:HA 1:0 (1 NS) Primary:Revision 1:0 (1 NS) Cemented:Uncemented 0:1 (1 NS) Indication index OA 1/2 (50%) NS 1/2 (50%) Surgeon experiential level Consultant (hip surgeon) Exposure B ORIF with plate (n=3) ORIF Locking compression plate (LCP), approach NS, LCP Synthes. M:F 0:3 Mean age in years: 82.7 (Range 80-86, No SD reported) Index implant details NS Surgeon experiential level Consultant (Trauma surgeon) Exposure C Non-operative (n=1) M:F NS Age in years: 91 Index implant details NS Allocation of exposure Vancouver algorithm +/- modification with surgeon judgement (patient physiology and experience). Surgeon experiential level Consultant (hip surgeon) Weight bearing status NS Venous thromboembolism prophylaxis NS
-Surgical time -Blood loss -Transfusion requirement (Packed red blood cells) -Union -Malunion -Loss of reduction -Intra-operative mortality -Infection DSSI - Infection SSSI -Parker mobility score pre and operatively -Ambulatory status post-operatively -Attain pre-fracture mobility status -Attain pre-fracture social status Time-frame of outcomes assessment:
Utilised descript-tive statistics for remain-ing outcomes for exposure group
Surgical time (Operation time) mean (Wasko and Kaminski) A: 146 (SD 8.49, No Range specified) B: 152.7 (SD 71.7, No Range specified) Blood loss (intra-operative) mean (mL) A: 1502mL (SD NS, Range 535-2470) B: 390mL (SD 232, 150-615) Transfusion requirement (Units packed red blood cells) mean A: 7 (SD 7.07, No Range given) B: 3 (SD 1.15, 2-4) C: NS Union A: 2/2 (100%) B: 3/3 (100%) C: 1/1 (100%) Malunion A: 0/2 (0%) B: 0/3 (0%) C: NS Loss of reduction (fracture) A: 0/2 (0%) B: 0/3 (0%) C: N/A Intra-operative mortality A: 0/2 (0%) B: 0/3 (0%) C: N/A Infection DSSI A: 0/2 (0%) B: 0/3 (0%)
In summary, we suggest that decisions regarding the treatment method for peri-prosthetic femoral fractures should be based on the algorithmic approach of the Vancouver classification, in addition to the assessment of each patient’s hip joint pathology, physical status and activity, especially for type B2 fractures with a loose stem. Cooperation of a trauma surgeon and a hip joint surgeon is desirable, if possible
Agree with authors.
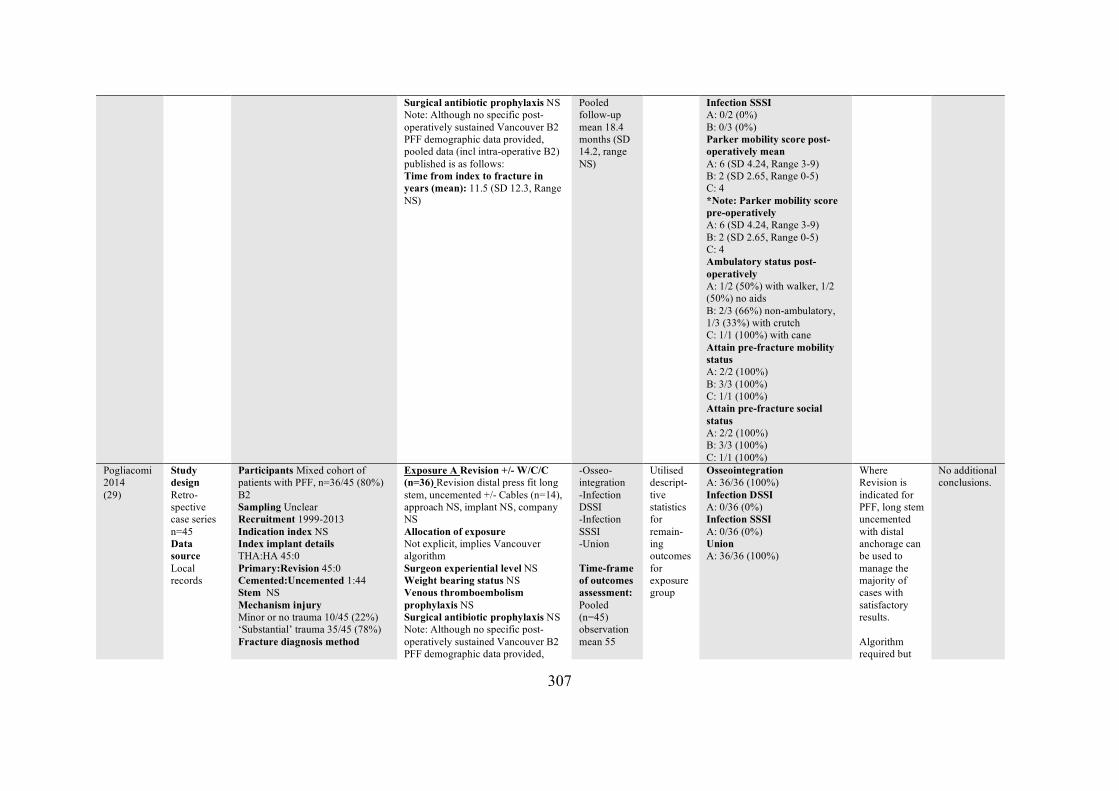
307
Surgical antibiotic prophylaxis NS Note: Although no specific post-operatively sustained Vancouver B2 PFF demographic data provided, pooled data (incl intra-operative B2) published is as follows: Time from index to fracture in years (mean): 11.5 (SD 12.3, Range NS)
Pooled follow-up mean 18.4 months (SD 14.2, range NS)
Infection SSSI A: 0/2 (0%) B: 0/3 (0%) Parker mobility score post-operatively mean A: 6 (SD 4.24, Range 3-9) B: 2 (SD 2.65, Range 0-5) C: 4 *Note: Parker mobility score pre-operatively A: 6 (SD 4.24, Range 3-9) B: 2 (SD 2.65, Range 0-5) C: 4 Ambulatory status post-operatively A: 1/2 (50%) with walker, 1/2 (50%) no aids B: 2/3 (66%) non-ambulatory, 1/3 (33%) with crutch C: 1/1 (100%) with cane Attain pre-fracture mobility status A: 2/2 (100%) B: 3/3 (100%) C: 1/1 (100%) Attain pre-fracture social status A: 2/2 (100%) B: 3/3 (100%) C: 1/1 (100%)
Pogliacomi 2014 (29)
Study design Retro-spective case series n=45 Data source Local records
Participants Mixed cohort of patients with PFF, n=36/45 (80%) B2 Sampling Unclear Recruitment 1999-2013 Indication index NS Index implant details THA:HA 45:0 Primary:Revision 45:0 Cemented:Uncemented 1:44 Stem NS Mechanism injury Minor or no trauma 10/45 (22%) ‘Substantial’ trauma 35/45 (78%) Fracture diagnosis method
Exposure A Revision +/- W/C/C (n=36) Revision distal press fit long stem, uncemented +/- Cables (n=14), approach NS, implant NS, company NS Allocation of exposure Not explicit, implies Vancouver algorithm Surgeon experiential level NS Weight bearing status NS Venous thromboembolism prophylaxis NS Surgical antibiotic prophylaxis NS Note: Although no specific post-operatively sustained Vancouver B2 PFF demographic data provided,
-Osseo-integration -Infection DSSI -Infection SSSI -Union Time-frame of outcomes assessment: Pooled (n=45) observation mean 55
Utilised descript-tive statistics for remain-ing outcomes for exposure group
Osseointegration A: 36/36 (100%) Infection DSSI A: 0/36 (0%) Infection SSSI A: 0/36 (0%) Union A: 36/36 (100%)
Where Revision is indicated for PFF, long stem uncemented with distal anchorage can be used to manage the majority of cases with satisfactory results. Algorithm required but
No additional conclusions.
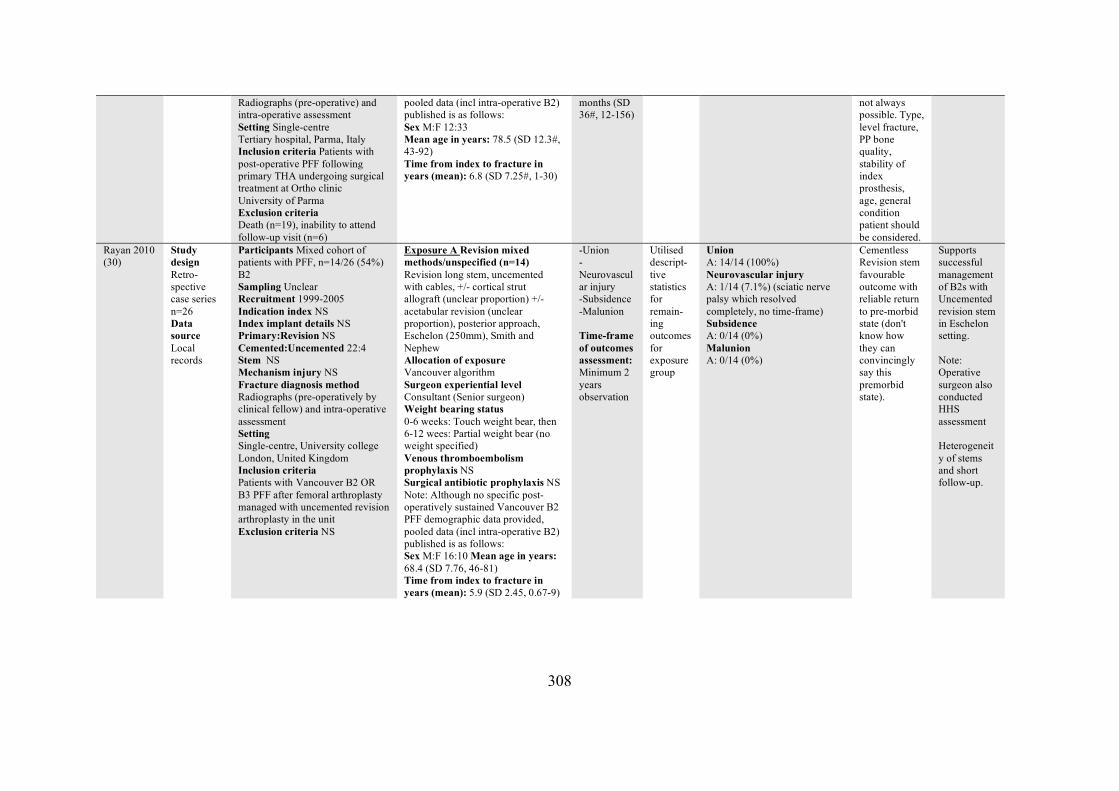
308
Radiographs (pre-operative) and intra-operative assessment Setting Single-centre Tertiary hospital, Parma, Italy Inclusion criteria Patients with post-operative PFF following primary THA undergoing surgical treatment at Ortho clinic University of Parma Exclusion criteria Death (n=19), inability to attend follow-up visit (n=6)
pooled data (incl intra-operative B2) published is as follows: Sex M:F 12:33 Mean age in years: 78.5 (SD 12.3#, 43-92) Time from index to fracture in years (mean): 6.8 (SD 7.25#, 1-30)
months (SD 36#, 12-156)
not always possible. Type, level fracture, PP bone quality, stability of index prosthesis, age, general condition patient should be considered.
Rayan 2010 (30)
Study design Retro-spective case series n=26 Data source Local records
Participants Mixed cohort of patients with PFF, n=14/26 (54%) B2 Sampling Unclear Recruitment 1999-2005 Indication index NS Index implant details NS Primary:Revision NS Cemented:Uncemented 22:4 Stem NS Mechanism injury NS Fracture diagnosis method Radiographs (pre-operatively by clinical fellow) and intra-operative assessment Setting Single-centre, University college London, United Kingdom Inclusion criteria Patients with Vancouver B2 OR B3 PFF after femoral arthroplasty managed with uncemented revision arthroplasty in the unit Exclusion criteria NS
Exposure A Revision mixed methods/unspecified (n=14) Revision long stem, uncemented with cables, +/- cortical strut allograft (unclear proportion) +/- acetabular revision (unclear proportion), posterior approach, Eschelon (250mm), Smith and Nephew Allocation of exposure Vancouver algorithm Surgeon experiential level Consultant (Senior surgeon) Weight bearing status 0-6 weeks: Touch weight bear, then 6-12 wees: Partial weight bear (no weight specified) Venous thromboembolism prophylaxis NS Surgical antibiotic prophylaxis NS Note: Although no specific post-operatively sustained Vancouver B2 PFF demographic data provided, pooled data (incl intra-operative B2) published is as follows: Sex M:F 16:10 Mean age in years: 68.4 (SD 7.76, 46-81) Time from index to fracture in years (mean): 5.9 (SD 2.45, 0.67-9)
-Union -Neurovascular injury -Subsidence -Malunion Time-frame of outcomes assessment: Minimum 2 years observation
Utilised descript-tive statistics for remain-ing outcomes for exposure group
Union A: 14/14 (100%) Neurovascular injury A: 1/14 (7.1%) (sciatic nerve palsy which resolved completely, no time-frame) Subsidence A: 0/14 (0%) Malunion A: 0/14 (0%)
Cementless Revision stem favourable outcome with reliable return to pre-morbid state (don't know how they can convincingly say this premorbid state).
Supports successful management of B2s with Uncemented revision stem in Eschelon setting. Note: Operative surgeon also conducted HHS assessment Heterogeneity of stems and short follow-up.
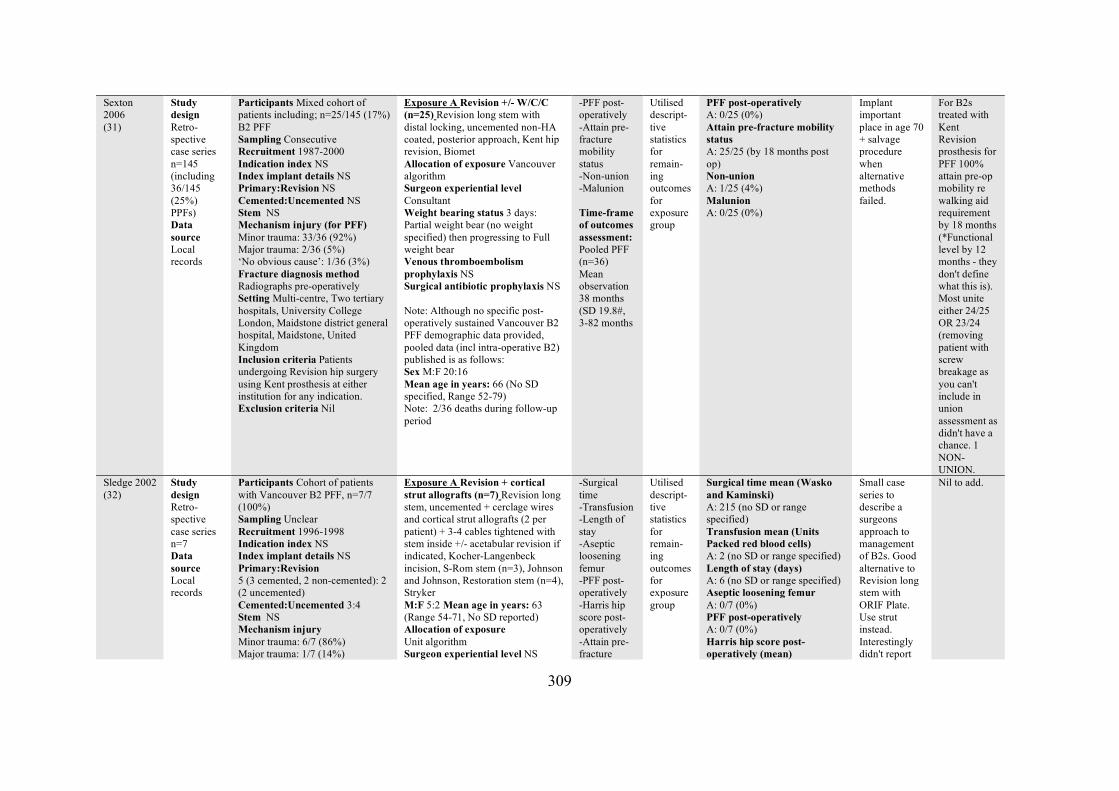
309
Sexton 2006 (31)
Study design Retro-spective case series n=145 (including 36/145 (25%) PPFs) Data source Local records
Participants Mixed cohort of patients including; n=25/145 (17%) B2 PFF Sampling Consecutive Recruitment 1987-2000 Indication index NS Index implant details NS Primary:Revision NS Cemented:Uncemented NS Stem NS Mechanism injury (for PFF) Minor trauma: 33/36 (92%) Major trauma: 2/36 (5%) ‘No obvious cause’: 1/36 (3%) Fracture diagnosis method Radiographs pre-operatively Setting Multi-centre, Two tertiary hospitals, University College London, Maidstone district general hospital, Maidstone, United Kingdom Inclusion criteria Patients undergoing Revision hip surgery using Kent prosthesis at either institution for any indication. Exclusion criteria Nil
Exposure A Revision +/- W/C/C (n=25) Revision long stem with distal locking, uncemented non-HA coated, posterior approach, Kent hip revision, Biomet Allocation of exposure Vancouver algorithm Surgeon experiential level Consultant Weight bearing status 3 days: Partial weight bear (no weight specified) then progressing to Full weight bear Venous thromboembolism prophylaxis NS Surgical antibiotic prophylaxis NS Note: Although no specific post-operatively sustained Vancouver B2 PFF demographic data provided, pooled data (incl intra-operative B2) published is as follows: Sex M:F 20:16 Mean age in years: 66 (No SD specified, Range 52-79) Note: 2/36 deaths during follow-up period
-PFF post-operatively -Attain pre-fracture mobility status -Non-union -Malunion Time-frame of outcomes assessment: Pooled PFF (n=36) Mean observation 38 months (SD 19.8#, 3-82 months
Utilised descript-tive statistics for remain-ing outcomes for exposure group
PFF post-operatively A: 0/25 (0%) Attain pre-fracture mobility status A: 25/25 (by 18 months post op) Non-union A: 1/25 (4%) Malunion A: 0/25 (0%)
Implant important place in age 70 + salvage procedure when alternative methods failed.
For B2s treated with Kent Revision prosthesis for PFF 100% attain pre-op mobility re walking aid requirement by 18 months (*Functional level by 12 months - they don't define what this is). Most unite either 24/25 OR 23/24 (removing patient with screw breakage as you can't include in union assessment as didn't have a chance. 1 NON-UNION.
Sledge 2002 (32)
Study design Retro-spective case series n=7 Data source Local records
Participants Cohort of patients with Vancouver B2 PFF, n=7/7 (100%) Sampling Unclear Recruitment 1996-1998 Indication index NS Index implant details NS Primary:Revision 5 (3 cemented, 2 non-cemented): 2 (2 uncemented) Cemented:Uncemented 3:4 Stem NS Mechanism injury Minor trauma: 6/7 (86%) Major trauma: 1/7 (14%)
Exposure A Revision + cortical strut allografts (n=7) Revision long stem, uncemented + cerclage wires and cortical strut allografts (2 per patient) + 3-4 cables tightened with stem inside +/- acetabular revision if indicated, Kocher-Langenbeck incision, S-Rom stem (n=3), Johnson and Johnson, Restoration stem (n=4), Stryker M:F 5:2 Mean age in years: 63 (Range 54-71, No SD reported) Allocation of exposure Unit algorithm Surgeon experiential level NS
-Surgical time -Transfusion -Length of stay -Aseptic loosening femur -PFF post-operatively -Harris hip score post-operatively -Attain pre-fracture
Utilised descript-tive statistics for remain-ing outcomes for exposure group
Surgical time mean (Wasko and Kaminski) A: 215 (no SD or range specified) Transfusion mean (Units Packed red blood cells) A: 2 (no SD or range specified) Length of stay (days) A: 6 (no SD or range specified) Aseptic loosening femur A: 0/7 (0%) PFF post-operatively A: 0/7 (0%) Harris hip score post-operatively (mean)
Small case series to describe a surgeons approach to management of B2s. Good alternative to Revision long stem with ORIF Plate. Use strut instead. Interestingly didn't report
Nil to add.
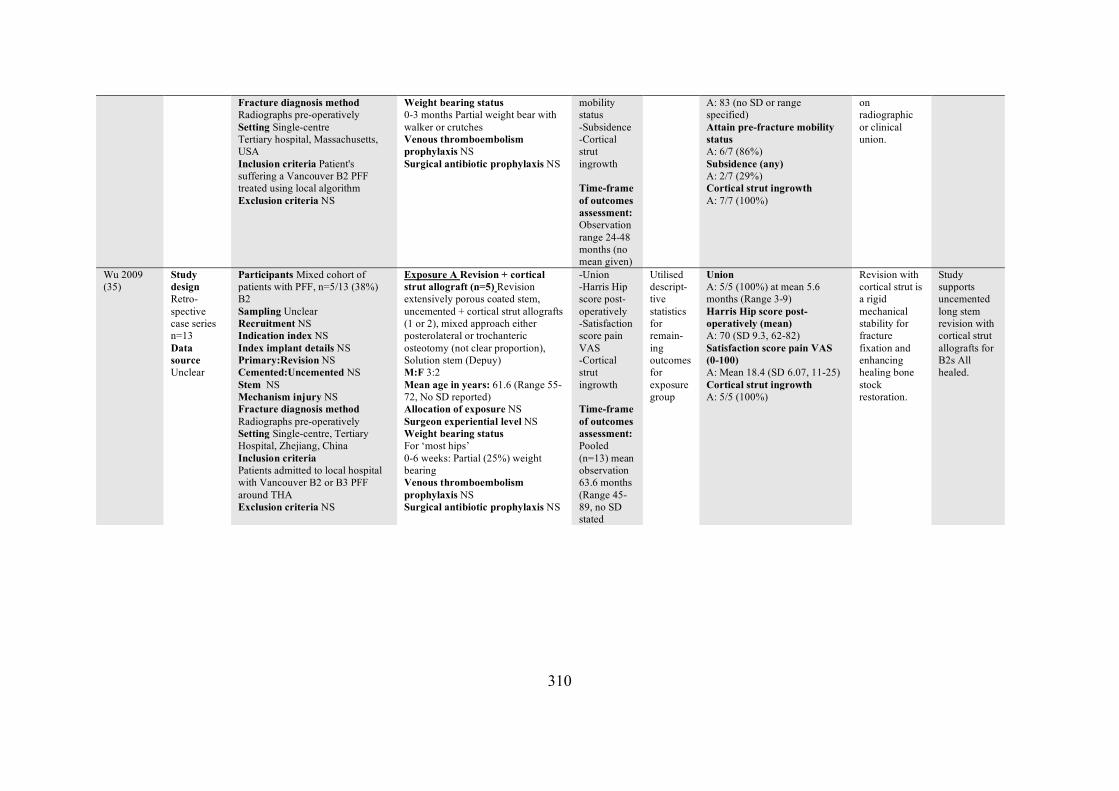
310
Fracture diagnosis method Radiographs pre-operatively Setting Single-centre Tertiary hospital, Massachusetts, USA Inclusion criteria Patient's suffering a Vancouver B2 PFF treated using local algorithm Exclusion criteria NS
Weight bearing status 0-3 months Partial weight bear with walker or crutches Venous thromboembolism prophylaxis NS Surgical antibiotic prophylaxis NS
mobility status -Subsidence -Cortical strut ingrowth Time-frame of outcomes assessment: Observation range 24-48 months (no mean given)
A: 83 (no SD or range specified) Attain pre-fracture mobility status A: 6/7 (86%) Subsidence (any) A: 2/7 (29%) Cortical strut ingrowth A: 7/7 (100%)
on radiographic or clinical union.
Wu 2009 (35)
Study design Retro-spective case series n=13 Data source Unclear
Participants Mixed cohort of patients with PFF, n=5/13 (38%) B2 Sampling Unclear Recruitment NS Indication index NS Index implant details NS Primary:Revision NS Cemented:Uncemented NS Stem NS Mechanism injury NS Fracture diagnosis method Radiographs pre-operatively Setting Single-centre, Tertiary Hospital, Zhejiang, China Inclusion criteria Patients admitted to local hospital with Vancouver B2 or B3 PFF around THA Exclusion criteria NS
Exposure A Revision + cortical strut allograft (n=5) Revision extensively porous coated stem, uncemented + cortical strut allografts (1 or 2), mixed approach either posterolateral or trochanteric osteotomy (not clear proportion), Solution stem (Depuy) M:F 3:2 Mean age in years: 61.6 (Range 55-72, No SD reported) Allocation of exposure NS Surgeon experiential level NS Weight bearing status For ‘most hips’ 0-6 weeks: Partial (25%) weight bearing Venous thromboembolism prophylaxis NS Surgical antibiotic prophylaxis NS
-Union -Harris Hip score post-operatively -Satisfaction score pain VAS -Cortical strut ingrowth Time-frame of outcomes assessment: Pooled (n=13) mean observation 63.6 months (Range 45-89, no SD stated
Utilised descript-tive statistics for remain-ing outcomes for exposure group
Union A: 5/5 (100%) at mean 5.6 months (Range 3-9) Harris Hip score post-operatively (mean) A: 70 (SD 9.3, 62-82) Satisfaction score pain VAS (0-100) A: Mean 18.4 (SD 6.07, 11-25) Cortical strut ingrowth A: 5/5 (100%)
Revision with cortical strut is a rigid mechanical stability for fracture fixation and enhancing healing bone stock restoration.
Study supports uncemented long stem revision with cortical strut allografts for B2s All healed.
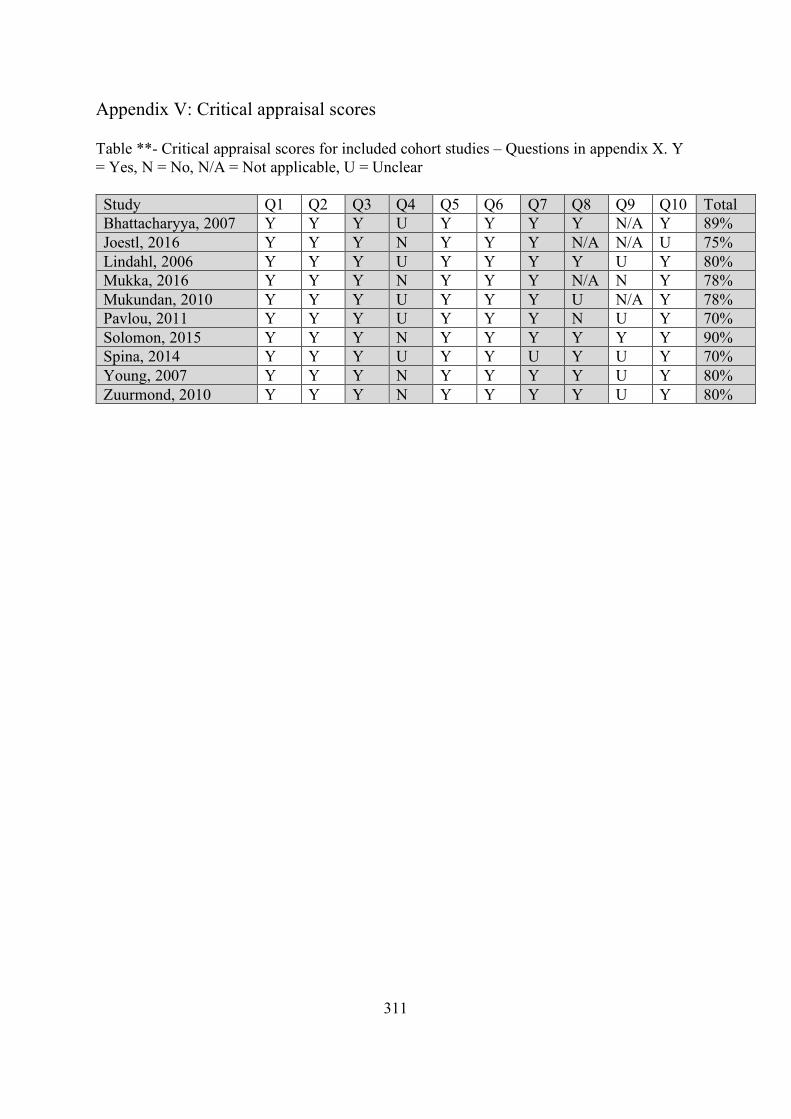
311
Appendix V: Critical appraisal scores Table **- Critical appraisal scores for included cohort studies – Questions in appendix X. Y = Yes, N = No, N/A = Not applicable, U = Unclear Study Q1 Q2 Q3 Q4 Q5 Q6 Q7 Q8 Q9 Q10 Total Bhattacharyya, 2007 Y Y Y U Y Y Y Y N/A Y 89% Joestl, 2016 Y Y Y N Y Y Y N/A N/A U 75% Lindahl, 2006 Y Y Y U Y Y Y Y U Y 80% Mukka, 2016 Y Y Y N Y Y Y N/A N Y 78% Mukundan, 2010 Y Y Y U Y Y Y U N/A Y 78% Pavlou, 2011 Y Y Y U Y Y Y N U Y 70% Solomon, 2015 Y Y Y N Y Y Y Y Y Y 90% Spina, 2014 Y Y Y U Y Y U Y U Y 70% Young, 2007 Y Y Y N Y Y Y Y U Y 80% Zuurmond, 2010 Y Y Y N Y Y Y Y U Y 80%
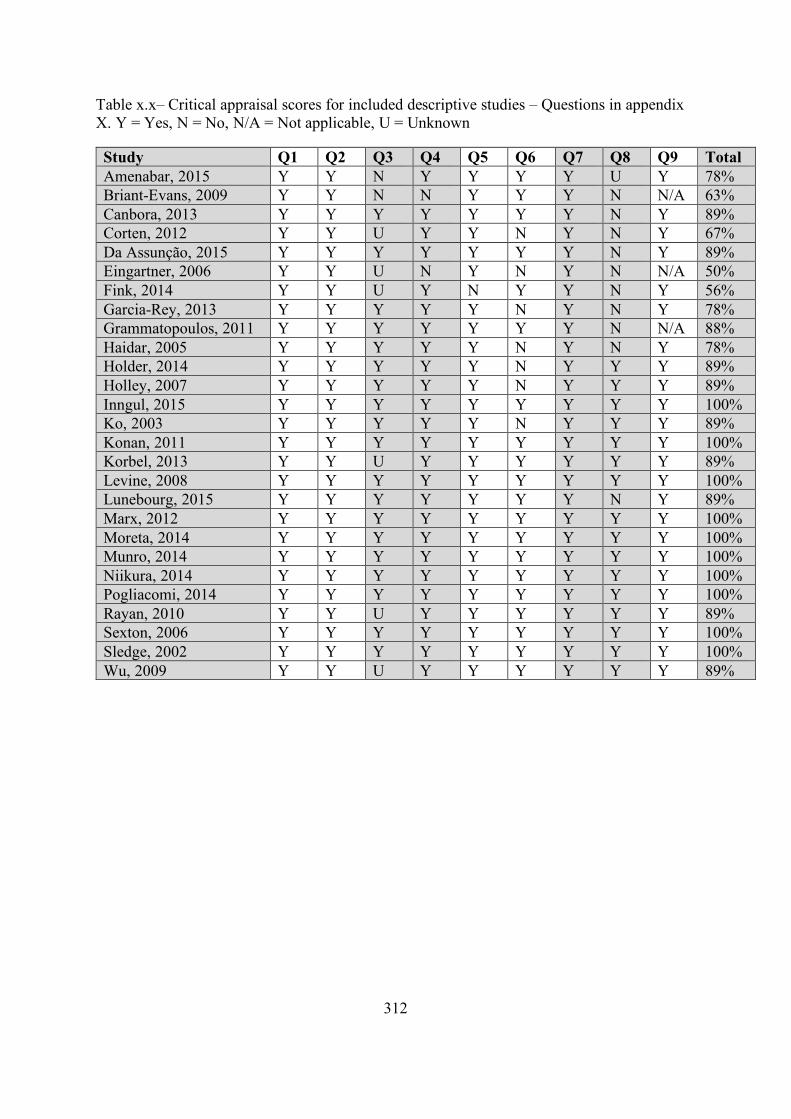
312
Table x.x– Critical appraisal scores for included descriptive studies – Questions in appendix X. Y = Yes, N = No, N/A = Not applicable, U = Unknown Study Q1 Q2 Q3 Q4 Q5 Q6 Q7 Q8 Q9 Total Amenabar, 2015 Y Y N Y Y Y Y U Y 78% Briant-Evans, 2009 Y Y N N Y Y Y N N/A 63% Canbora, 2013 Y Y Y Y Y Y Y N Y 89% Corten, 2012 Y Y U Y Y N Y N Y 67% Da Assunção, 2015 Y Y Y Y Y Y Y N Y 89% Eingartner, 2006 Y Y U N Y N Y N N/A 50% Fink, 2014 Y Y U Y N Y Y N Y 56% Garcia-Rey, 2013 Y Y Y Y Y N Y N Y 78% Grammatopoulos, 2011 Y Y Y Y Y Y Y N N/A 88% Haidar, 2005 Y Y Y Y Y N Y N Y 78% Holder, 2014 Y Y Y Y Y N Y Y Y 89% Holley, 2007 Y Y Y Y Y N Y Y Y 89% Inngul, 2015 Y Y Y Y Y Y Y Y Y 100% Ko, 2003 Y Y Y Y Y N Y Y Y 89% Konan, 2011 Y Y Y Y Y Y Y Y Y 100% Korbel, 2013 Y Y U Y Y Y Y Y Y 89% Levine, 2008 Y Y Y Y Y Y Y Y Y 100% Lunebourg, 2015 Y Y Y Y Y Y Y N Y 89% Marx, 2012 Y Y Y Y Y Y Y Y Y 100% Moreta, 2014 Y Y Y Y Y Y Y Y Y 100% Munro, 2014 Y Y Y Y Y Y Y Y Y 100% Niikura, 2014 Y Y Y Y Y Y Y Y Y 100% Pogliacomi, 2014 Y Y Y Y Y Y Y Y Y 100% Rayan, 2010 Y Y U Y Y Y Y Y Y 89% Sexton, 2006 Y Y Y Y Y Y Y Y Y 100% Sledge, 2002 Y Y Y Y Y Y Y Y Y 100% Wu, 2009 Y Y U Y Y Y Y Y Y 89%

313