Embed Size (px)
Citation preview

Effectiveness of Online Textbooks vs. Interactive Web-Native Content
Alex Edgcomb and Frank Vahid Department of Computer Science and Engineering
University of California, Riverside Also with zyBooks.com.
Abstract Material written for traditional textbooks is increasingly being made available via online textbooks. Such material still uses text and drawings to explain concepts. In contrast, material written natively for the web can use less text and drawings, and instead use animations, responsive questions, and interactive exercises. This work compares the lesson effectiveness of electronic textbooks having static content, versus interactive web-native content. Student learning using static content was compared with interactive web-native content, for the particular topic of writing output statements in the C++ programming language, with both groups also provided a programming tool. 136 participants in an Introduction to Programming course were given a pre-lesson quiz (4 questions), a lesson (randomly-assigned), and a post-lesson quiz (11 questions). Participants assigned static web content got on average 1.8 pre-lesson questions right, while participants assigned interactive web-native content got 2.2 right. Participants assigned static web content got on average 7.3 post-lesson questions right, while participants assigned interactive web-native content got 8.6 right. Participants assigned the interactive web-native content improved 16% more (p-value = 0.016) than the static web content. Even greater improvement was noticed in the lower-quartile. Participants with pre-lesson quiz scores in the lower-quartile improved 64% more (p-value < 0.001) with the interactive web-native content than with the static web content. This significant improvement may have been caused by the higher (p-value = 0.055) self-reported engagement with the interactive web-native content (5.3 of 6 points) than the static web content (4.8 of 6 points). Also, participants chose to spend more time (p-value < 0.001) with the interactive web-native content (17.5 minutes) than the static web content plus tool (9.4 minutes). Keywords: Online textbooks, static web content, web-native content, interactive content, programming, computer science. Introduction Textbook publishers increasingly make textbooks available online. Having been written for a paper medium, such textbooks make extensive use of text and drawings, forming static web content. Figure 1 provides an example. In contrast, material written natively for the web may use less text and fewer figures, and instead use animations as in Figure 2, responsive question sets as in Figure 3, and interactive exercises. The objective of this study was to determine the effectiveness of static web content compared to interactive web-native content.

Figure 1: Static web content (left) plus a tool (right). Users enter the code then press "Play" to compile and execute the code.
Figure 2: Screenshot of an animation from the interactive web-native content. The animation has four scenes, each showing the effect of one line of code within main(). Animation controls are in the top-left.

Background Researchers have shown that interactive learning materials improve student learning outcomes in STEM fields[2],[5],[14]. For example, Wood[14] developed an interactive program from which a student could manipulate signal filters and simultaneously see the affects on many perspectives of the equation. ALEKS[5] is a web-based interactive education system for college algebra that significantly improved student exam scores in college algebra courses. Broschat[2] built interactive education material from which a student could manipulate electromagnetism equations and visualize the 3D shape of the electromagnetic forces. Interactive web activities have been developed to explain engineering concepts for undergraduates, such as data structures[4],[8],[9] and algorithms[10]. For example, Kloss[9] developed an activity from which a student could insert a number into a binary tree, delete a number, and search for a number. Web-based textbooks have been and currently are being developed by academic institutions[11],[12] and companies[1],[3][7],[13],[15]. OpenDSA[11], developed at Virginia Tech, is an open source web-based textbook for data structures and algorithms that includes frequent interactive animations and exercises, as well as, recordings of student activity. The Open Learning Initiative (OLI) at Carnegie Mellon University[12] offers 15+ courses with a web-based textbook that utilizes videos, as well as, multiple choice question sets and interactive activities that are recorded. OLI has a portal for instructors to view student activity and performance data. Flat World Knowledge's[3] web-based textbooks include tool tip definitions for key terms and videos, as well as, re-orderable content. Inkling's[7] web-based textbooks utilize hyperlinks and a note-taking platform alongside the textbook. Zyante's[15] web-based textbooks utilize frequent animations, interactive tools, videos, and a diverse set of interactive problem sets. Zyante also includes re-orderable content, recording of student activity, and a portal for instructors to view student activity data. Participants
Figure 3: Screenshot of a responsive question set. The user is tasked with producing the output text on the left. The user has selected correctly for the first statement, but incorrectly for the second statement. On the right is the explanation for why the second statement is incorrect.

The participants were undergraduate students at University of California, Riverside enrolled in CS1 in C++ during the first week of the 2013 Fall quarter. 72% of the participants were freshmen, 9% were sophomores, 12% were juniors, and 6% were seniors. 79% of the participants were enrolled in the Bourne's College of Engineering, 16% in the College of Natural and Agricultural Sciences, and 4% in the College of Humanities, Arts, and Social Sciences. Solicitation for participation in the study was made in two ways: a post to the CS1 course message boards by the instructor and an in-class announcement by a researcher associated with the study. The in-class announcement occurred on the first day of the CS1 course, in which the instructor covered administrative materials and not C++ topics. The CS1 students were incentivized to participate with extra credit worth 1 lab assignment. The participants were self-selected. 144 students participated in the study, which is approximately half of the students in CS1. 8 participants were excluded: 2 due to a second student helping, 4 due to duplicate survey entries, and 2 due to not having a follow-up survey entry. Therefore, the results consider 136 participants. A computer lab was reserved for the study, and each participant could attend the study at his or her convenience. The study's hours were on the Friday prior to the first lectures on C++ from 9 AM to 4 PM. Participants could attend anytime during study hours. The participants were blind to the conditions and specific purpose of the experiment. The experiment was approved by the University of California, Riverside's IRB (Institutional Review Board). Design The two content styles were evaluated for quantity of learning and engagement. A first measure was the number of correct answers on the pre-lesson quiz by each participant. A second measure was the number of correct answers on the post-lesson quiz by each participant. A third measure was the numerical difference between the number of correct answers on a given participant's pre-lesson quiz and post-lesson quiz, known as the improvement score. A fourth measure was a Likert-style rating of each participant's self-perceived engagement. A fifth measure was the length of time spent on the lesson by each participant. Materials A computer lab was reserved at the University of California, Riverside during the Fall of 2013. The computer lab was the same lab that would be used by some of the participants for the CS1 course and nearly identical to the other lab used by CS1. The lab had approximately 40 desktop computers with identically configured Linux and Mozilla's Firefox installed. Over 400 unique identifiers were printed, each on a small strip of paper. The unique identifiers were passed out to participants to maintain participant anonymity.

The experiment consisted of 1 webpage with 7 steps. Only one step could be viewed at a time and participants could only progress forward between steps. At the bottom of each step was a button to proceed. If the button was clicked for the first time and one of the fields in the current step was empty, then the webpage would generate a pop-up informing the participant that a field was missed. Otherwise, the current step would disappear and the next step would appear. The top of the webpage stated: "Your responses are completely anonymous. You will be graded on participation only." The top of the webpage stated the general purpose of the experiment, which was "to evaluate different ways of presenting educational content." Lastly, the top of the webpage stated: "You are welcome to use any form of note-taking, but please refrain from leaving this webpage or get outside assistance, using other devices, or asking the TA or others for assistance on the content." Step 1 required the participant to enter his or her unique identifier. Step 1 would not allow the participant to proceed until an identifier was entered. Step 2 was a background survey that asked the participant's major, year in college, previous experience with programming, and previous experience with digital textbooks. Step 3 was the pre-lesson quiz, shown in Figure 4, that consisted of 4 multiple-choice questions, which were ordered the same for each participant. Step 4 was a lesson on basic output in C++. The lesson was randomly-assigned with equal chances to be either a static web content plus a programming tool, or interactive web-native content (including the tool). To consider the possibility that an online textbook might come with an accompanying tool, we provided Zyante's web-based programming environment with both styles of content. The static web content plus a tool (shown in Figure 1) utilized text and pictures for the core explanations (like a traditional
Figure 4: The pre-lesson quiz given to all participants consisted of 4 multiple choice questions.
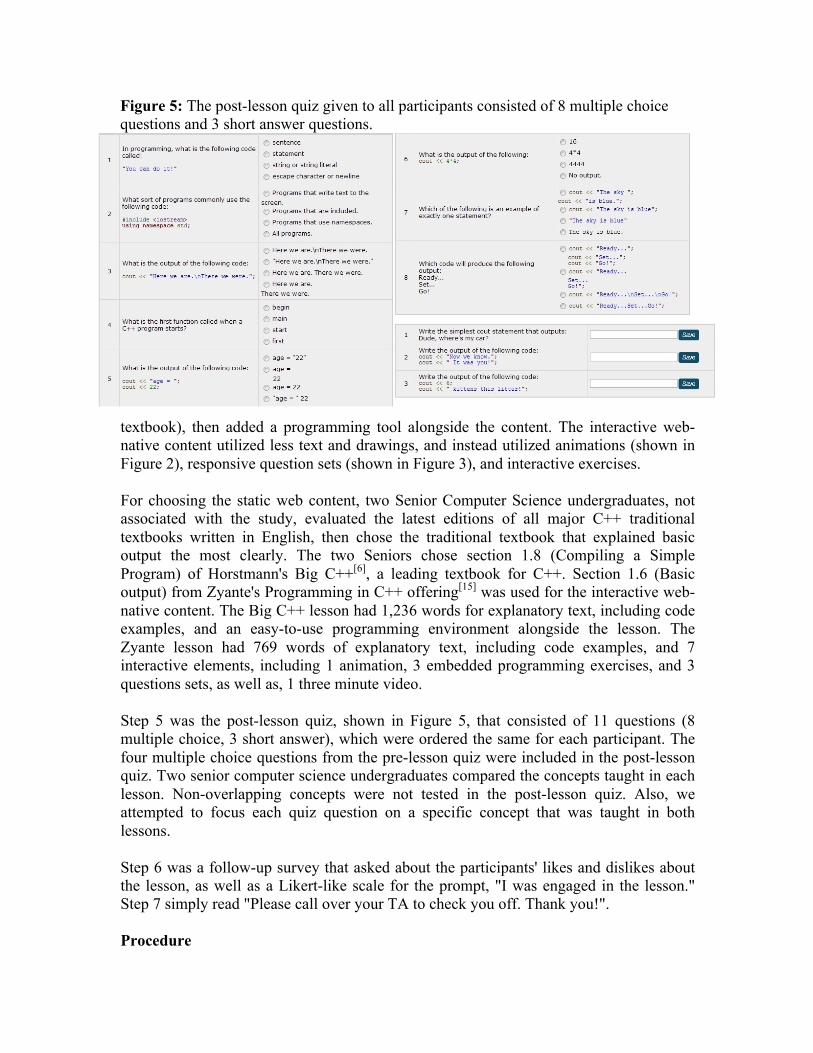
textbook), then added a programming tool alongside the content. The interactive web-native content utilized less text and drawings, and instead utilized animations (shown in Figure 2), responsive question sets (shown in Figure 3), and interactive exercises. For choosing the static web content, two Senior Computer Science undergraduates, not associated with the study, evaluated the latest editions of all major C++ traditional textbooks written in English, then chose the traditional textbook that explained basic output the most clearly. The two Seniors chose section 1.8 (Compiling a Simple Program) of Horstmann's Big C++[6], a leading textbook for C++. Section 1.6 (Basic output) from Zyante's Programming in C++ offering[15] was used for the interactive web-native content. The Big C++ lesson had 1,236 words for explanatory text, including code examples, and an easy-to-use programming environment alongside the lesson. The Zyante lesson had 769 words of explanatory text, including code examples, and 7 interactive elements, including 1 animation, 3 embedded programming exercises, and 3 questions sets, as well as, 1 three minute video. Step 5 was the post-lesson quiz, shown in Figure 5, that consisted of 11 questions (8 multiple choice, 3 short answer), which were ordered the same for each participant. The four multiple choice questions from the pre-lesson quiz were included in the post-lesson quiz. Two senior computer science undergraduates compared the concepts taught in each lesson. Non-overlapping concepts were not tested in the post-lesson quiz. Also, we attempted to focus each quiz question on a specific concept that was taught in both lessons. Step 6 was a follow-up survey that asked about the participants' likes and dislikes about the lesson, as well as a Likert-like scale for the prompt, "I was engaged in the lesson." Step 7 simply read "Please call over your TA to check you off. Thank you!". Procedure
Figure 5: The post-lesson quiz given to all participants consisted of 8 multiple choice questions and 3 short answer questions.
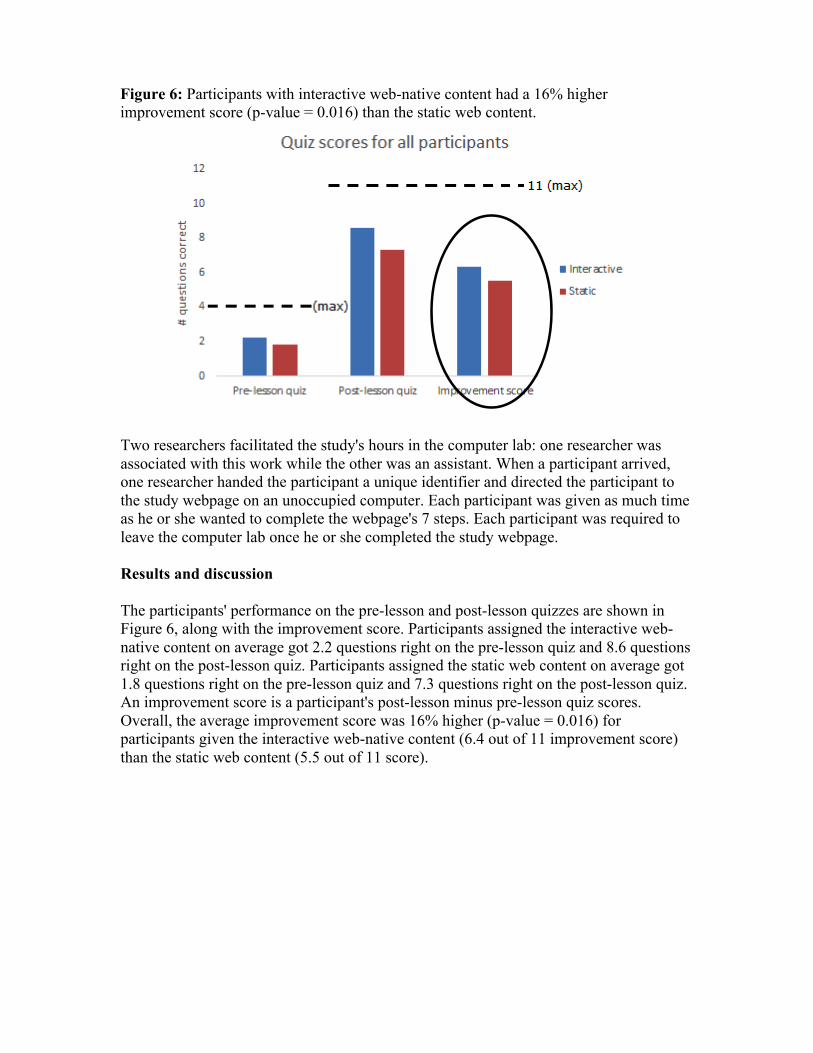
Two researchers facilitated the study's hours in the computer lab: one researcher was associated with this work while the other was an assistant. When a participant arrived, one researcher handed the participant a unique identifier and directed the participant to the study webpage on an unoccupied computer. Each participant was given as much time as he or she wanted to complete the webpage's 7 steps. Each participant was required to leave the computer lab once he or she completed the study webpage. Results and discussion The participants' performance on the pre-lesson and post-lesson quizzes are shown in Figure 6, along with the improvement score. Participants assigned the interactive web-native content on average got 2.2 questions right on the pre-lesson quiz and 8.6 questions right on the post-lesson quiz. Participants assigned the static web content on average got 1.8 questions right on the pre-lesson quiz and 7.3 questions right on the post-lesson quiz. An improvement score is a participant's post-lesson minus pre-lesson quiz scores. Overall, the average improvement score was 16% higher (p-value = 0.016) for participants given the interactive web-native content (6.4 out of 11 improvement score) than the static web content (5.5 out of 11 score).
Figure 6: Participants with interactive web-native content had a 16% higher improvement score (p-value = 0.016) than the static web content.

Moreover, as Figure 7 shows, for the participants who scored in the lower-quartile of the pre-lesson quiz (the least-prepared participants), the average improvement score was 64% higher (p-value < 0.001) for the interactive web-native content (7.4 out of 11 score) versus for the static web content plus tool (4.5 out of 11 score). The self-reported engagement score was out of 6 points (higher means more engaged). The least-prepared participants who were assigned the interactive web-native content reported an average of 5.3, while participants assigned static web content reported 4.8. The significant improvement of the least-prepared participants may have been caused by the higher (p-value = 0.055) self-reported engagement with the interactive web-native lesson. In fact, one participant with the interactive web-native content wrote: “I can learn by practicing and auto-check the answer right away ... the activities are fun and helpful.” Also, participants chose to spend more time (p-value < 0.001) with the interactive web-native content (17.5 minutes) than the static web content plus tool (9.4 minutes). Future work The effectiveness of static and interactive web content in this study considered a specific concept in Computer Science, namely basic output in C++. Future work includes considering the effectiveness of content styles across many more topics in Computer Science, as well as, a breadth of subjects. The effectiveness of specific types of interactive tools, such as animations or question sets, is still to be explored. Furthermore, the effectiveness of different interactive tools on a breadth of subjects needs to be explored. We expect that some types of interactive tools will be more effective with certain subjects, such as animations being more effective with STEM subjects than literary subjects. We also expect that some interactive tools, like questions sets, will be effective across all subjects. However, this requires further
Figure 7: Participants who had pre-lesson scores in the lowest quartile had a 64% higher improvement score (p-value < 0.001) with interactive web-native content than the static web content.

investigation. Conclusion The interactive web-native content was significantly more effective than the static web content plus tool, improving quiz scores by 16% more (p = 0.016). More importantly, the participants in the lower-quartile of the pre-lesson quiz improved 64% more (p < 0.001) with the interactive web-native content. This significant improvement may have been caused by the higher (p-value = 0.055) self-reported engagement with the interactive web-native content (5.3 of 6 points) than the static web content plus tool (4.8 of 6 points). Also, participants chose to spend more time (p-value < 0.001) with the interactive web-native content (17.5 minutes) than the static web content plus tool (9.4 minutes). Ultimately, the study along with other data suggests that the common approach of porting paper textbooks to electronic form, even with some additional tool support, may be a poor approach. The study suggests that writing new material natively for the web, using less text and drawings, and instead more interactive items, may enable higher learner engagement and more-effective learning. Of course, further study is needed, and ongoing. References [1] Boundless. https://www.boundless.com/. January 2014. [2] Broschat, S.L. Interactive software for undergraduate electromagnetics. Education,
IEEE Transactions, Volume 36, No. 1, pgs. 123-126, 1993. [3] Flat World Knowledge. http://catalog.flatworldknowledge.com/. January 2014. [4] Franco, J. http://www.ece.uc.edu/~franco/C321/html/RedBlack/redblack.html.
January 2014. [5] Hagerty, G. and S. Smith. Using the web-based interactive software ALEKS to
enhance college algebra. Mathematics and Computer Education, Volume 39, No. 3, pgs 183-194, 2005.
[6] Horstmann, C. and T. Budd. Big C++ 2nd Edition. John Wiley & Sons, 2006. [7] Inkling. https://www.inkling.com/. January 2014. [8] Jarc, D. J. http://nova.umuc.edu/~jarc/idsv/lesson1.html. January 2014. [9] Kloss, J. http://www.cs.jhu.edu/~goodrich/dsa/trees/btree.html. January 2014. [10] Mukundan, R. http://www.cosc.canterbury.ac.nz/mukundan/dsal/GraphAppl.html.
January 2014. [11] OpenDSA: Open Source Interactive Data Structures and Algorithms.
http://algoviz.org/OpenDSA/. January 2014. [12] Open Learning Initiative at Carnegie Mellon University. http://oli.cmu.edu/. January
2014. [13] WileyPLUS. https://www.wileyplus.com/. January 2014.

[14] Wood, S.L. A new approach to interactive tutorial software for engineering education. Education, IEEE Transactions, Volume 39, No. 3, pgs 399-408, 1996.
[15] Zyante. http://zyante.com/. January 2014.