Embed Size (px)
Citation preview
Effectiveness of Education on Economic Development in Asia:
A New Policy Modelling Approach for Public Services Equalisation
18 Aug 2008Faculty of Economics,
Thammasat University, Bangkok

Tran Van Hoa
Professor and Director, Vietnam and East Asia Summit Research Program
Centre for Strategic Economic StudiesVictoria University, Melbourne, VIC 8001, Australia
Email: [email protected]; Website: http://www.staff.vu.edu.au/CSESBL/
ABSTRACT
• The paper uses a new endogenous growth regression model to explore the impact of education on growth in China and India
• To inform debates on public services equalisation effectiveness and regional competitiveness policy
• Under increasing global economic integration, robust domestic reforms and damaging regional crises and natural disasters.
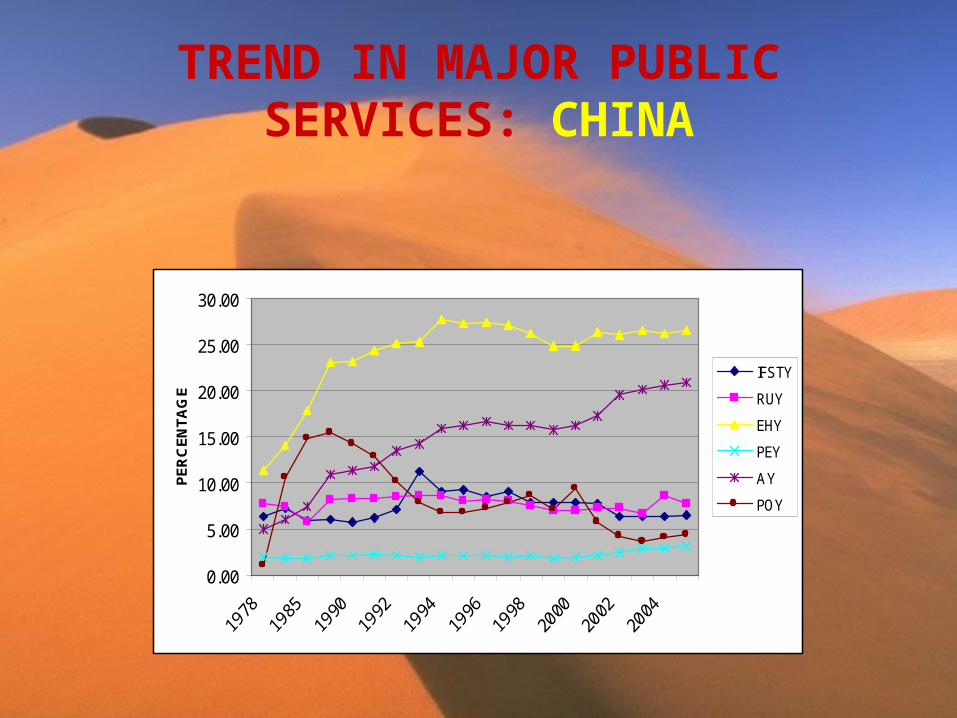
TREND IN MAJOR PUBLIC SERVICES: CHINA
0.00
5.00
10.00
15.00
20.00
25.00
30.00
PE
RC
EN
TA
GE
IFSTY
RUY
EHY
PEY
AY
POY
CHINA PUBLIC SERVICES: HISTORICAL PATTERN
• Education and Health: Largest
• Followed by Administrative Expenses
• Both are Parallel and Rising
• Rural Support Stable
• Pensions Payment Lowest and Slowly Rising
• Innovation, Policy Expenses Falling
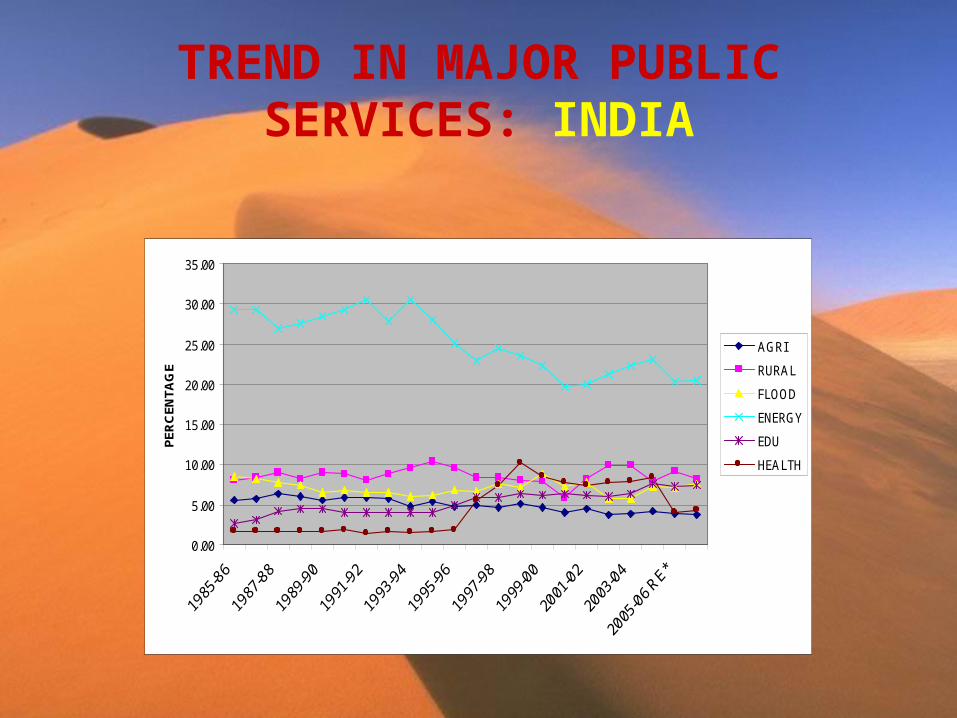
TREND IN MAJOR PUBLIC SERVICES: INDIA
0.00
5.00
10.00
15.00
20.00
25.00
30.00
35.00
PE
RC
EN
TA
GE
AGRI
RURAL
FLOOD
ENERGY
EDU
HEALTH
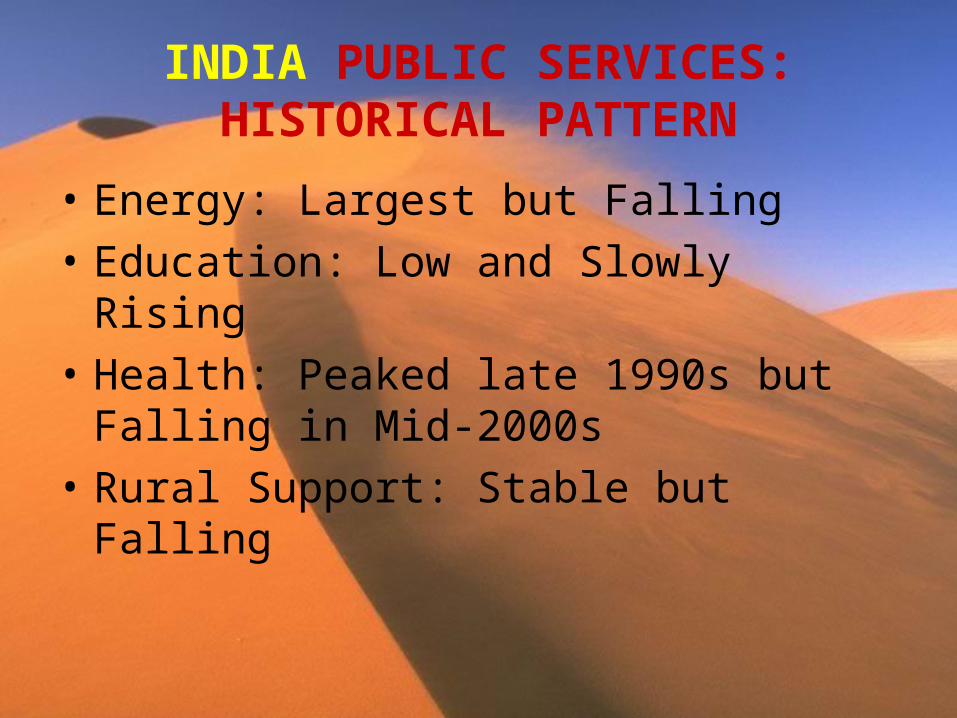
INDIA PUBLIC SERVICES: HISTORICAL PATTERN
• Energy: Largest but Falling
• Education: Low and Slowly Rising
• Health: Peaked late 1990s but Falling in Mid-2000s
• Rural Support: Stable but Falling
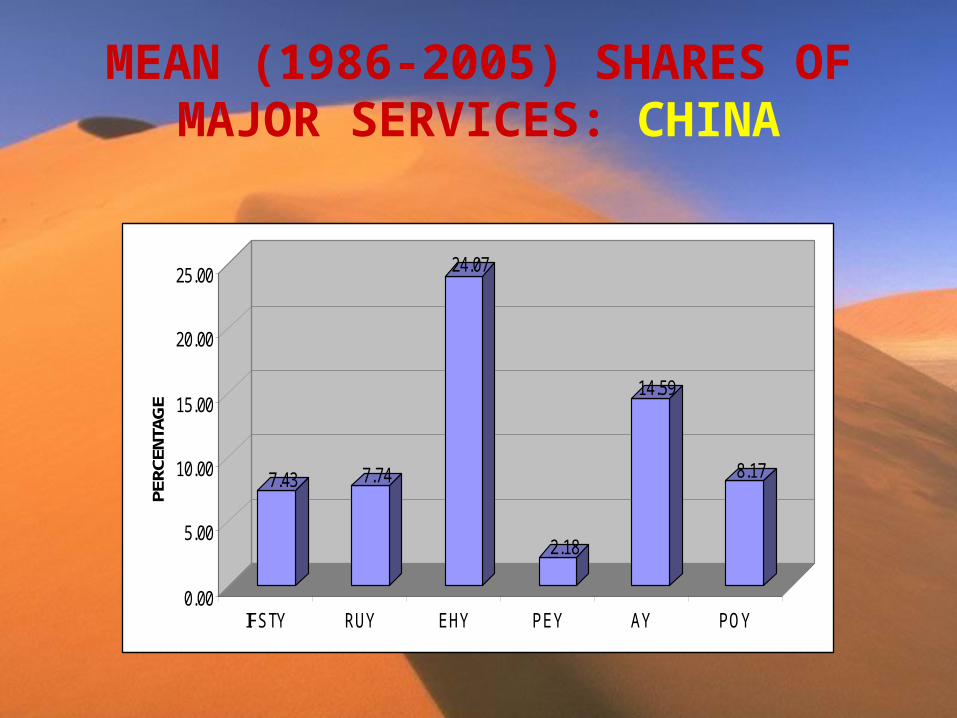
MEAN (1986-2005) SHARES OF MAJOR SERVICES: CHINA
7.43 7.74
24.07
2.18
14.59
8.17
0.00
5.00
10.00
15.00
20.00
25.00
PERC
ENTA
GE
IFSTY RUY EHY PEY AY POY
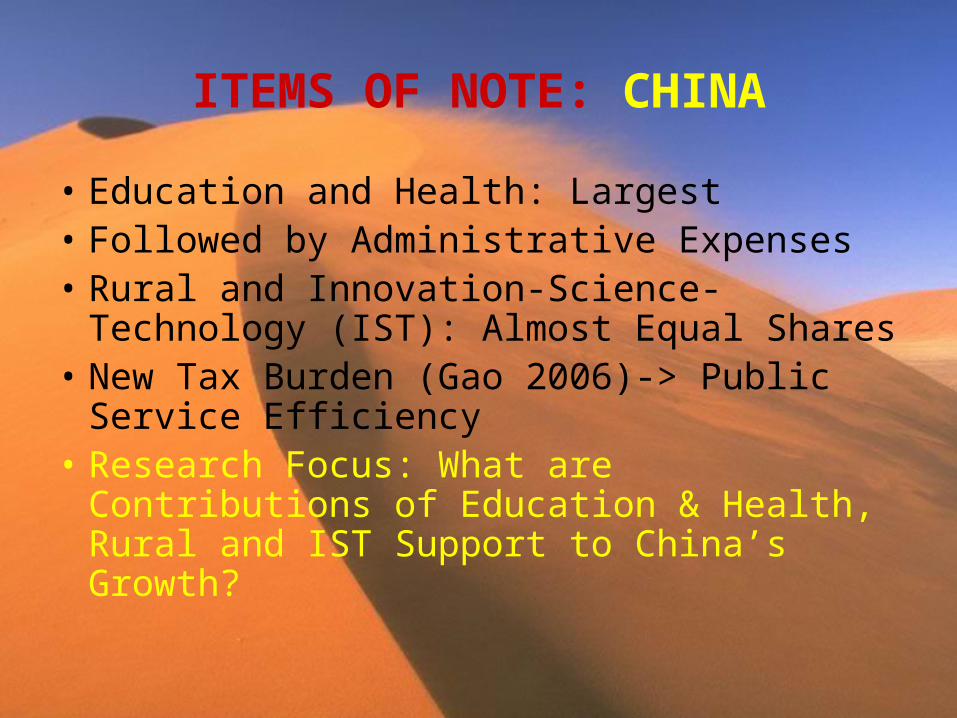
ITEMS OF NOTE: CHINA
• Education and Health: Largest• Followed by Administrative Expenses• Rural and Innovation-Science-Technology
(IST): Almost Equal Shares• New Tax Burden (Gao 2006)-> Public
Service Efficiency• Research Focus: What are Contributions
of Education & Health, Rural and IST Support to China’s Growth?
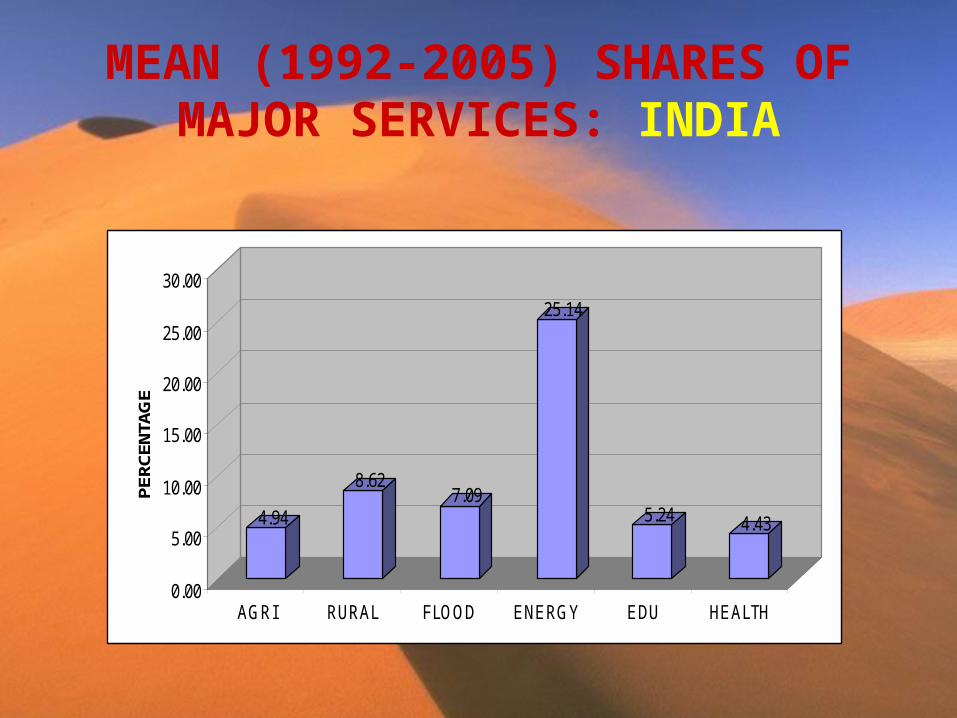
MEAN (1992-2005) SHARES OF MAJOR SERVICES: INDIA
4.94
8.627.09
25.14
5.24 4.43
0.00
5.00
10.00
15.00
20.00
25.00
30.00
PER
CENT
AGE
AGRI RURAL FLOOD ENERGY EDU HEALTH
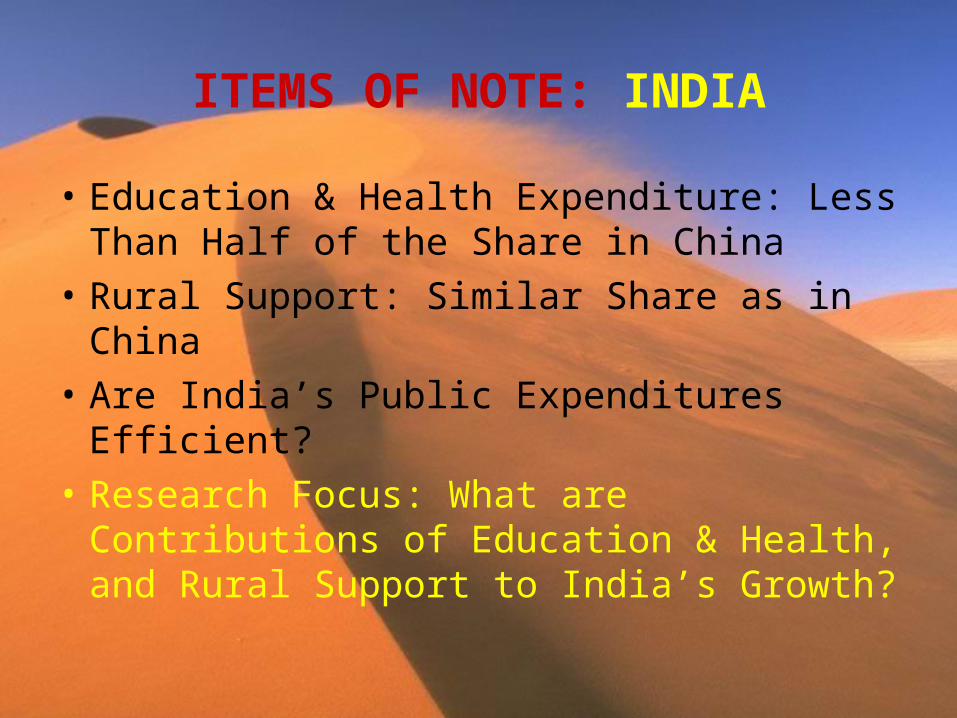
ITEMS OF NOTE: INDIA
• Education & Health Expenditure: Less Than Half of the Share in China
• Rural Support: Similar Share as in China
• Are India’s Public Expenditures Efficient?
• Research Focus: What are Contributions of Education & Health, and Rural Support to India’s Growth?
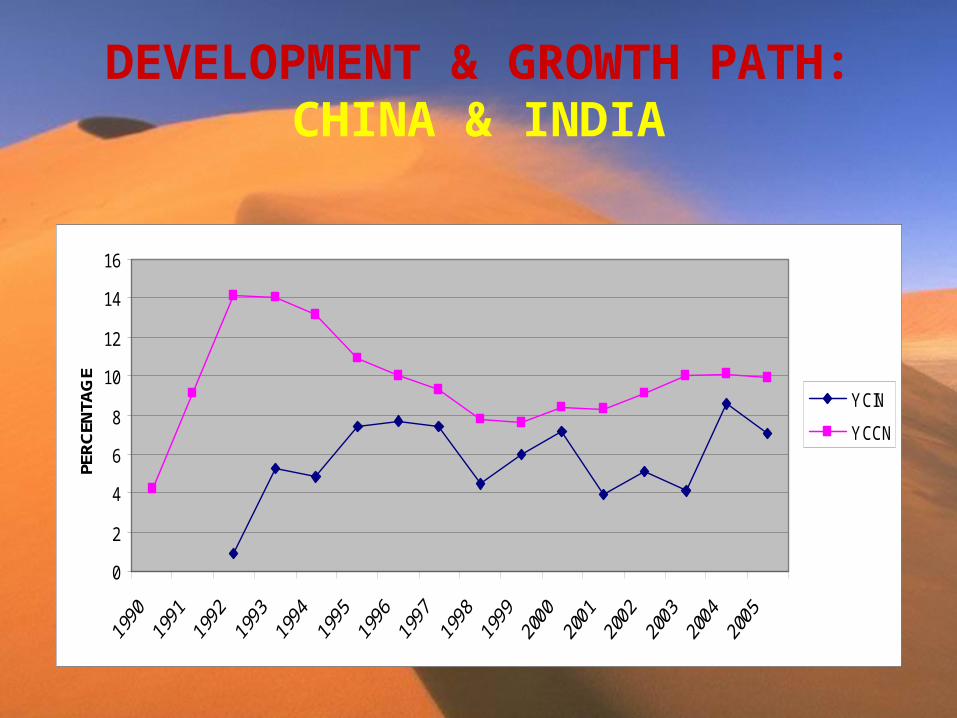
DEVELOPMENT & GROWTH PATH:CHINA & INDIA
0
2
4
6
8
10
12
14
16
PER
CEN
TAG
E
YCIN
YCCN
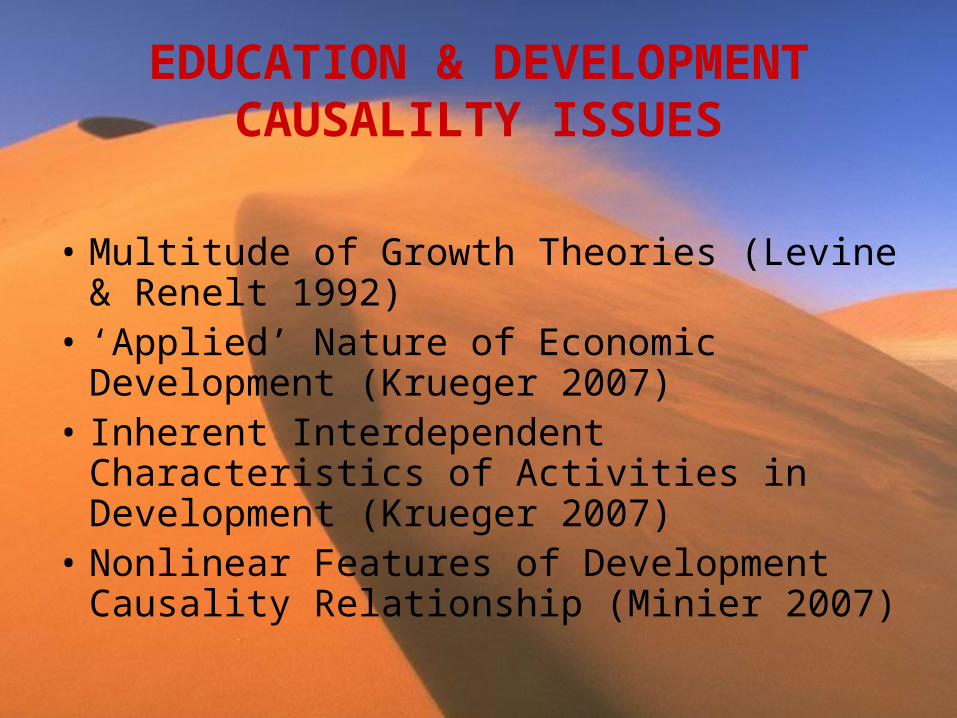
EDUCATION & DEVELOPMENT CAUSALILTY ISSUES
• Multitude of Growth Theories (Levine & Renelt 1992)
• ‘Applied’ Nature of Economic Development (Krueger 2007)
• Inherent Interdependent Characteristics of Activities in Development (Krueger 2007)
• Nonlinear Features of Development Causality Relationship (Minier 2007)
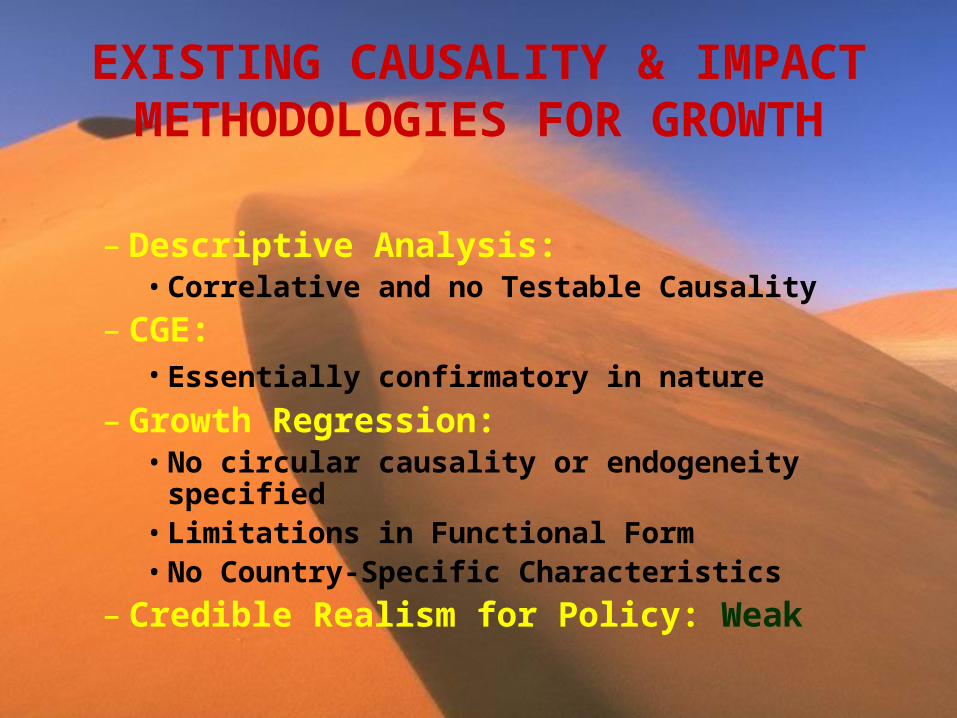
EXISTING CAUSALITY & IMPACT METHODOLOGIES FOR GROWTH
– Descriptive Analysis:• Correlative and no Testable Causality
– CGE:• Essentially confirmatory in nature
– Growth Regression: • No circular causality or endogeneity specified• Limitations in Functional Form• No Country-Specific Characteristics
– Credible Realism for Policy: Weak
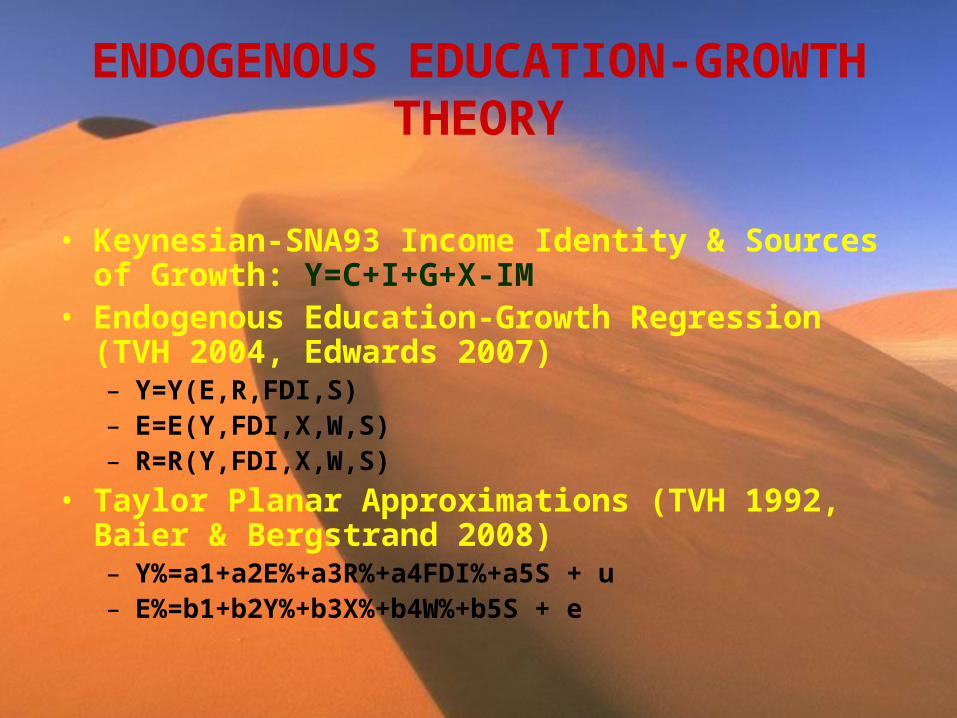
ENDOGENOUS EDUCATION-GROWTH THEORY
• Keynesian-SNA93 Income Identity & Sources of Growth: Y=C+I+G+X-IM
• Endogenous Education-Growth Regression (TVH 2004, Edwards 2007)– Y=Y(E,R,FDI,S)– E=E(Y,FDI,X,W,S)– R=R(Y,FDI,X,W,S)
• Taylor Planar Approximations (TVH 1992, Baier & Bergstrand 2008)– Y%=a1+a2E%+a3R%+a4FDI%+a5S + u– E%=b1+b2Y%+b3X%+b4W%+b5S + e
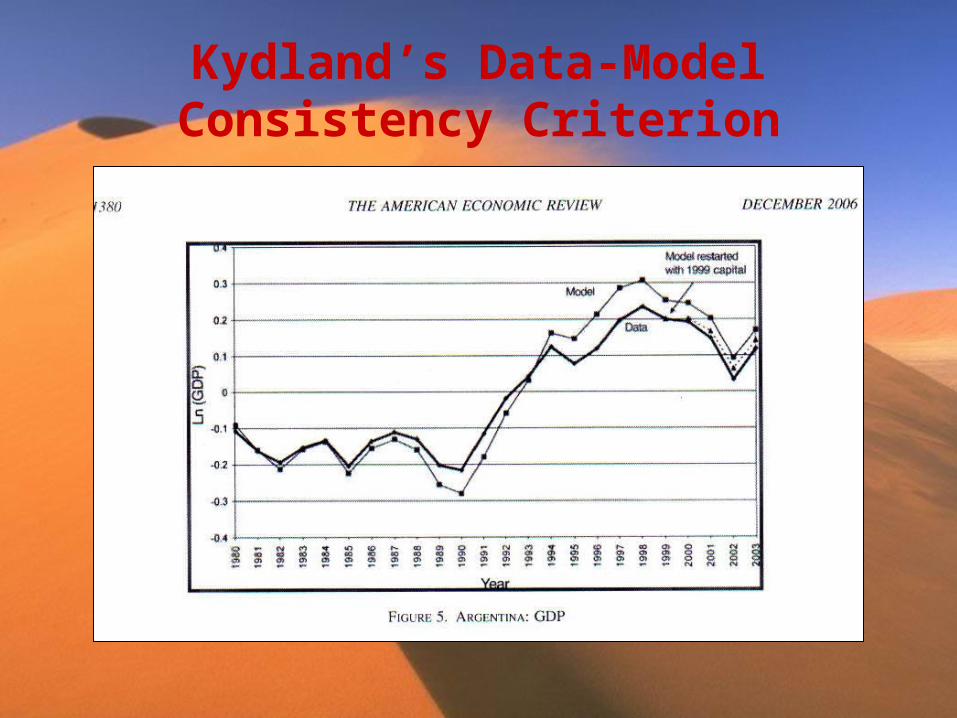
Kydland’s Data-Model Consistency Criterion

SUBSTANTIVE FINDINGS:EDUCATION-GROWTH CAUSALITY
IN CHINA & INDIA CHINA INDIA GDP Income/Head GDP Income/Head Variables Impact Impact Impact Impact Constant 3.994** 2.541** 1.950* 0.825 Education/GDP 0.004 0.046 Health/GDP 0.001 0.007 Education+Health/GDP -0.186** -0.195** Rural Subsidies/GDP 0.028 0.029 0.043 0.071* Innovation+Technology/GDP -0.046** -0.047** Unemployment -0.014 -0.015 FDI/GDP 0.036** 0.036** 0.005^ 0.003 ODA/GDP 0.001 0.001 0.001 0.002* China Reforms 1991 5.083** 5.186** China Reforms 1993 0.646 0.775 India Reforms 1995 6.067** 4.459** Asia Crisis 1997 0.047 0.367 -1.509 -0.543 Terrorist Crisis 2001 -0.322 -0.085 -2.239* -2.206* India Reforms 2004 3.864** 3.884** R2 96.18 96.30 89.92 89.28 DW 2.74 2.68 2.87 2.78
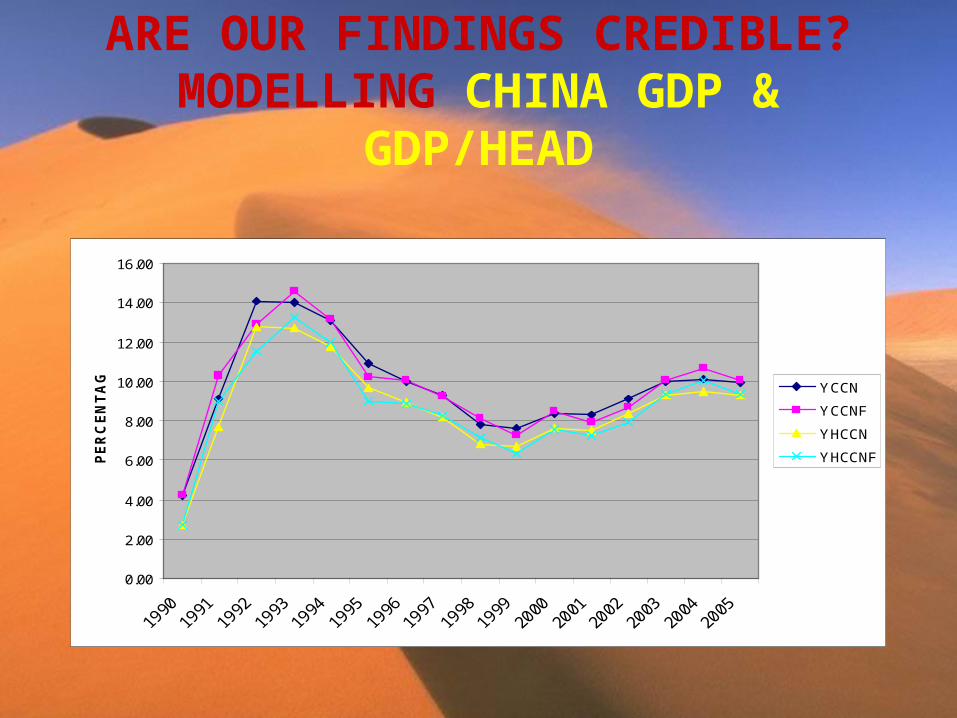
ARE OUR FINDINGS CREDIBLE?MODELLING CHINA GDP &
GDP/HEAD
0.00
2.00
4.00
6.00
8.00
10.00
12.00
14.00
16.00
PE
RC
EN
TA
GE
YCCN
YCCNF
YHCCN
YHCCNF
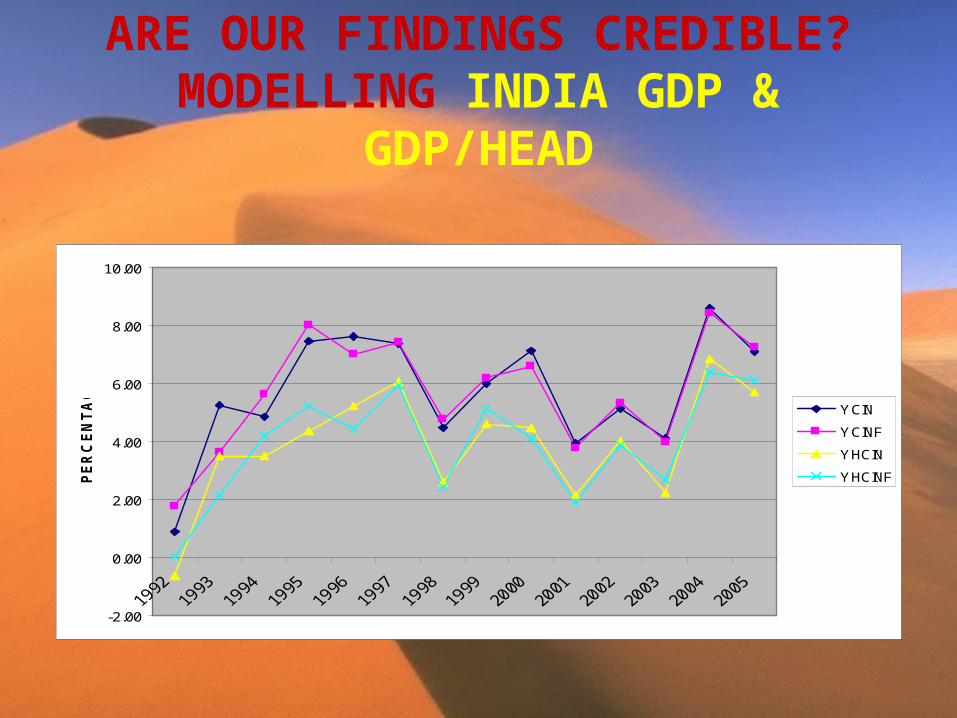
ARE OUR FINDINGS CREDIBLE?MODELLING INDIA GDP &
GDP/HEAD
-2.00
0.00
2.00
4.00
6.00
8.00
10.00
PE
RC
EN
TA
GE
YCIN
YCINF
YHCIN
YHCINF
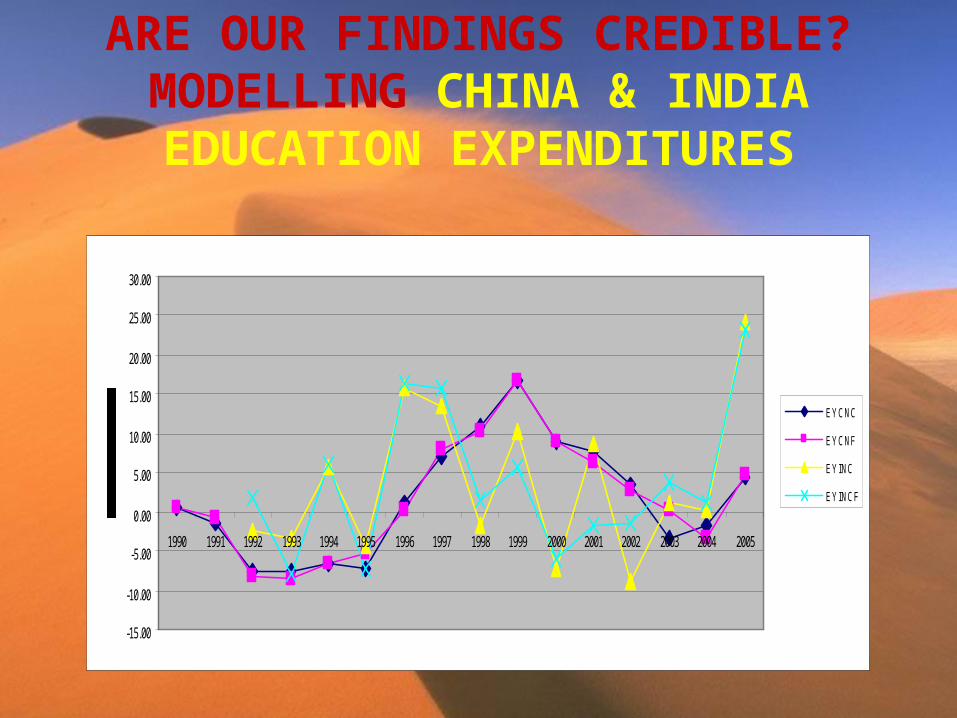
ARE OUR FINDINGS CREDIBLE?MODELLING CHINA & INDIA
EDUCATION EXPENDITURES
-15.00
-10.00
-5.00
0.00
5.00
10.00
15.00
20.00
25.00
30.00
1990 1991 1992 1993 1994 1995 1996 1997 1998 1999 2000 2001 2002 2003 2004 2005
EYCNC
EYCNF
EY INC
EY INCF

IMPLICATIONS FOR EDUCATION REFORMS & PUBLIC SERVICE
EQUALISATION IN CHINA 1
• Education & Health: Strong negative contribution
• Rural Support: Weak beneficial impact• Innovation-Science-Technology Support:
Strong negative effect
IMPLICATIONS FOR EDUCATION REFORMS & PUBLIC SERVICE
EQUALISATION IN CHINA 2
• Policy Implications (see also OECD & WB 08): – Support for Education & Health Efficiency
Reforms– Support for More Rural Expenditure– Support for Innovation, Science & Technology
Efficiency Reforms– Need for research on Administrative impact on
growth– ODA: Beneficial but weak impact on growth
IMPLICATIONS FOR CHINA & INDIA REGIONAL COMPETITIVENESS 1
• India’s more efficiency in education and health expenditures
• This is exacerbated by their much smaller shares in public service expenditure
• India’s slightly more efficiency in rural support contribution to growth
• This may be attenuated by India’s slightly higher public expenditure in rural programs
IMPLICATIONS FOR CHINA & INDIA REGIONAL COMPETITIVENESS 2
• In both countries, good reforms contribute far more to growth than expenditure on public services
• India’s good reforms achieve higher growth returns than China’s.
• However, China’s much higher efficiency in FDI utilisation (underscoring FDI-led growth)
IMPLICATIONS FOR INTERNATIONAL EDUCATION
(BASIC SERVICES) EQUALISATION
• OECD-WB: Recommend China’s education expenditure scale to reach OECD (24%) level
• Our findings indicate that, while increasing China’s expenditure on education is important, improving education efficiency is a higher priority
• Improving public expenditure share on education in India however improves its growth