Embed Size (px)
Citation preview
Effectiveness of Ballast Water Exchange
in Protecting Puget Sound from Invasive Species
Washington Department of Fish and Wildlife Contract 12-1212
Task 6 – Deliverable 6.1: Phase 3 Final Report
Results From WDFW/UW Ballast Water Sampling, 2001-2014
Jeff Cordell and Olga Kalata
School of Aquatic and Fishery Sciences, University of Washington
Allen Pleus, Amanda Newsom, Keith Strieck, and Gary Gertsen Washington Department of Fish and Wildlife
Funded by the Environmental Protection Agency through the Puget Sound Marine and Nearshore Grant Program
March 2015
Photo: Port of Seattle – Don Wilson
Effectiveness of BWE in Protecting Puget Sound from Invasive Species March 2015
2
Introduction ............................................................................................................................... 4 Background ........................................................................................................................................... 4 Ballast Water Exchange Effectiveness History ......................................................................... 5 Ballast Water Exchange Sampling as a Management Tool................................................... 6
Objectives .................................................................................................................................... 6
Methods ........................................................................................................................................ 7 Ship Selection Method ....................................................................................................................... 7 Ballast Water Sampling and Laboratory Methods .................................................................. 8 Data Management and Analysis ................................................................................................. 11
Results and Discussion ........................................................................................................ 12 Sample Numbers and Locations ................................................................................................. 12 Journey Length (Ballast Water Age) ......................................................................................... 12
Results ............................................................................................................................................................. 12 Discussion ...................................................................................................................................................... 13
Ship Type ............................................................................................................................................ 15 Results ............................................................................................................................................................. 15
Comparison by arrivals and number samples collected .......................................................................... 15 Comparison by coastal zooplankton and management type ................................................................. 15
Discussion ...................................................................................................................................................... 17 Ballast Origin ..................................................................................................................................... 18
Results ............................................................................................................................................................. 18 Comparison of coastal zooplankton in samples by management type .............................................. 18 Comparison of non-indigenous zooplankton species in samples by management type ........... 19
Discussion ...................................................................................................................................................... 22 Ballast Water Exchange Method ................................................................................................. 22
Results ............................................................................................................................................................. 23 Ballast water exchange effectiveness by exchange method and ballast origin .............................. 23
Discussion ...................................................................................................................................................... 24 Ballast Water Exchange Effectiveness Through Time ........................................................ 25
Trends in densities and percent composition by ballast origin ............................................................ 25 Results ............................................................................................................................................................. 25
Trends in densities and percent composition for three vessels sampled multiple times ......... 28 Discussion ...................................................................................................................................................... 31
Non-Indigenous Species in Ballast Water and in Puget Sound ........................................ 31 Results ............................................................................................................................................................. 31 Discussion ...................................................................................................................................................... 35
Ballast Water Exchange as a Management Tool ................................................................... 36 Relationship between percent composition and density ........................................................................ 37
Results ............................................................................................................................................................. 37 Identification of threshold percent composition and density values ................................................. 38
Results ............................................................................................................................................................. 38 Application of threshold values for identification of higher risk samples ....................................... 39
Results ............................................................................................................................................................. 39
Effectiveness of BWE in Protecting Puget Sound from Invasive Species March 2015
3
Application of a method to identify low, moderate, and high priority vessels for management ............................................................................................................................................................................................ 40
Results ............................................................................................................................................................. 40 Discussion ...................................................................................................................................................... 42
Conclusions .............................................................................................................................. 44
Recommendations ................................................................................................................. 46
References ................................................................................................................................ 48
Appendix A. .............................................................................................................................. 50
Appendix B. .............................................................................................................................. 52
This project has been funded wholly or in part by the United States Environmental Protection Agency under assistance agreement PC 00J29801 to Washington Department of
Fish and Wildlife. The contents of this document do not necessarily reflect the views and policies of the Environmental Protection Agency, nor does mention of trade names or
commercial products constitute endorsement or recommendation for use.
Effectiveness of BWE in Protecting Puget Sound from Invasive Species March 2015
4
INTRODUCTION This report is provided to meet project scope of work requirements for Task 6 (Phase 3 Stakeholder review of draft final report), deliverable 6.1 (Phase 3 final report), which incorporates all stakeholder review comments provided by the Washington Department of Fish and Wildlife’s Ballast Water Work Group1. This report was made possible by a grant of $139,943 from the Environmental Protection Agency’s Puget Sound Marine and Nearshore Grant Program.
Background
Preventing invasive species from establishing and spreading is the most cost effective and least environmentally damaging method of protecting Puget Sound ecosystems and local economies from the impacts of those species. This project addresses the Puget Sound Partnership’s 2012/2013 Action Agenda priority B5.3 NTA 4 to “complete an assessment of and make recommendations to improve the effectiveness of open sea exchange and treatment in meeting state ballast water standards.” This project addresses the effectiveness of ballast water exchange, as it remains the primary management requirement for ships until operation of treatment systems to meet federal discharge standards is required. It is expected ballast water exchange will remain a significant management option until at least 2021 because at the time of this report, very few ships using treatment systems have been arriving at state ports, no treatment systems have been type-approved by the U.S. Coast Guard resulting in numerous compliance date extension requests, and the implementation timeline for the largest class of existing vessels (>5,000 cubic meter volume ballast water capacity) will likely result in those vessels not installing treatment systems until 2021 (first scheduled drydocking after January 1, 2016 – and applying common drydock period of 5 years).
Ballast water is one of the most significant global pathways for movement and spread of invasive non-indigenous species (Ruiz et al., 1997; Molnar et al., 2008; Hulme 2009; Keller et al., 2010; Kolzsch and Blasius 2011). Ships use ballast water taken up in other national or international locations to maintain trim and stability during voyages and then discharge the ballast water when taking on cargo, containers, passengers, or fuel at Washington ports. On average, 1,350 or a third of Washington State total annual vessel arrivals (4,100) discharge over 15 million cubic meters of ballast water, which is equivalent to the volume capacity of 104,550 railroad grain cars. Such a train would stretch from Los Angeles, California, to Seattle. Within Puget Sound, on average 735 vessel arrivals discharge 6.6 million cubic meters of ballast water per year. In 2000, the legislature directed WDFW under Chapter 77.120 of the Revised Code of Washington (RCW) to ensure that the discharge of ballast water by ships poses minimal risk of introducing non-indigenous invasive species into waters of the state.
1 Established under WAC 220-150-010(2)
Effectiveness of BWE in Protecting Puget Sound from Invasive Species March 2015
5
State ballast water management regulations under chapter 220-150 of the Washington Administrative Code (WAC) require ships to perform an open sea ballast water exchange (or “exchange”) to minimize discharge of high-risk coastal species which contain varying densities of potentially invasive non-indigenous species. Exchange is required beyond 200 nautical miles from any shore and in waters greater than 2,000 meters deep for voyages from outside the U.S. Exclusive Economic Zone (EEZ) and beyond 50 nautical miles from any shore and in waters greater than 200 meters deep for coastal voyages that do not voyage outside the U.S. EEZ.” Exchange is not required for voyages from a “common water” zone established between the Columbia River (including both Washington and Oregon ports) ports that are south of 50° N latitude in British Columbia.
Ballast Water Exchange Effectiveness History
The purpose of ballast water exchange is to minimize invasive species risks by reducing the densities of all coastal organisms in ship’s ballast. This is accomplished by flushing coastal organisms into open sea waters and then altering the environmental conditions (e.g. salinity and temperature) within the ballast tank to decrease survivorship of any residual coastal organisms that remain following exchange. Coastal zooplankton species are used as a surrogate for efficacy of ballast water exchange for all coastal organisms as identification of coastal from oceanic species is possible. In controlled studies on four ship types, Ruiz et al. (2007) found that three of the four ship types tested (i.e. crude oil tankers, USN refueling ships, bulk carriers) reduced the densities of coastal zooplankton on average by ≥90%. The fourth ship type (container) reduced the densities of coastal zooplankton on average by ≥80%. Lower efficacy was assumed to be a result of generally smaller ballast tank size and more complex design.
Previous studies using Washington State ballast water exchange data have shown that although compliance with exchange regulations is high, exchange does not necessarily correlate with significant reductions in coastal zooplankton (Cordell et al. 2009; Lawrence and Cordell 2010). One of the primary purposes of this report is to build on these and other studies to assess whether factors such as ship type, ballast origin, ballast water age, and ballast water exchange method can be used to enhance the state’s risk-based management program.
In 2001, the University of Washington (UW) began collecting zooplankton samples from ballast water held in ballast tanks from a subset of ships arriving in Seattle ports. In 2004, WDFW took over this sampling and expanded it to all Washington ports as part of an initial ballast water management and compliance program to determine the effectiveness of state ballast water exchange management requirements. This is a unique program with an unprecedented archive of existing samples. Prior to this project, approximately 380 samples taken between 2001 and 2007 had been analyzed and the results presented in two published papers (Cordell et al. 2009; Lawrence and Cordell 2010). For this project, an additional 436 samples have been collected for a combined data set of 816 samples from 569 individual
Effectiveness of BWE in Protecting Puget Sound from Invasive Species March 2015
6
ships2. There is no data on the actual number of ship arrivals that discharged into Puget Sound since 2001, but assuming an average of 735 vessel arrivals that discharged annually, the 816 samples represent up to 8% of those arrivals.
Ballast Water Exchange Sampling as a Management Tool
WDFW has used ballast water exchange sampling in the past primarily to estimate overall non-indigenous zooplankton introduction risks by vessels discharging into Puget Sound and secondarily to demonstrate relative vessel risks due to factors such as frequent routing from ports with high risk non-indigenous zooplankton profiles, suspected ballast tank design limitations, and discharge of non-compliant ballast water. The assumption is that samples from vessels that conducted effective exchanges would have relatively lower percent compositions and densities of coastal zooplankton than those vessels that did not.
A major challenge of using ballast water exchange sampling is determining when higher percent composition and density of coastal species indicates poor exchange effectiveness due to ballast tank design limitations, non-compliance with exchange regulations, or environmental factors.
In 2009, WDFW established provisions for using ballast water exchange sampling as a management tool under Washington Administrative Code (WAC) 220-150-035 “Vessels carrying high risk ballast water.” This regulation directs the department to “identify, publish, and maintain a list of vessels that pose an elevated risk of discharging ballast water or sediment containing non-indigenous species into the waters of the state.” The primary listing criteria for using exchange sampling is to provide a non-indigenous species profile of originating waters and evidence of ballast tank design limitations that prevent effective exchanges. Vessels on the list could then be prioritized for further evaluation, which might include additional sampling and completion of temporary compliance plans or alternative strategies under WAC 220-150-037.
One of the objectives of this report is to identify and recommend threshold(s) for determining when there is sufficient evidence for listing (or delisting) a vessel under WAC 220-150-035, and determine if there is a gross exceedance threshold that can establish non-compliance.
OBJECTIVES The purpose of this project was to examine zooplankton compositions found in ballast water samples to assess the relative risks of discharging non-indigenous
2 Total samples can represent different ballast tanks on same ship and same voyage or from same ship and different voyages.
Effectiveness of BWE in Protecting Puget Sound from Invasive Species March 2015
7
species into Puget Sound from different ship and voyage types. The objectives of this project included:
(1) Estimate the relative risk posed by variation in journey length (ballast water age), ship type, ballast origin, and other factors.
(2) Determine if there are any changes in patterns of ballast water zooplankton species over time and if it can be correlated to changes in ballast water regulation and enforcement.
(3) Determine if there is any relationship between ambient zooplankton species in Puget Sound and those which are being delivered by ballast water discharge.
(4) Develop recommendations for using ballast water exchange sampling as a regulatory (management) tool for minimizing future invasive species risks to Puget Sound.
The first phase of the project evaluated the processed and analyzed ballast water zooplankton samples collected prior to 2013 to further characterize the data gaps identified in Cordell et al. (2009) and Lawrence and Cordell (2010). The project grant provided funding for the collection and processing of additional samples, some of which had already been collected by WDFW between 2009 and 2013 that were unprocessed, and some of which were to be taken from new collections by WDFW in 2013-14. Based on sample evaluation, the data gaps that were identified to help guide the collection of new samples included: un-exchanged ballast water; common water source; individual ship; regional source; and ship type.
We present the results based on the objectives and data gaps outlined above, and also update previously published results from Cordell et al. 2009 and Lawrence and Cordell 2010.
METHODS Methods used in this report to collect, transport, store, and process ballast water samples, and for data management and analysis of those samples were approved in the “Quality Assurance Project Plan” (Bateman and Cordell, 2012) by the Washington Department of Ecology Quality Assurance Officer acting under the Environmental Protection Agency’s National Estuary Program’s Puget Sound Marine Nearshore Grant Program process.
Ship Selection Method
In general, ships were selected for sampling when they arrived into Washington State ports based on established WDFW ballast water risk factors including ship’s compliance history, first voyage or several years since last arrival to state, West
Effectiveness of BWE in Protecting Puget Sound from Invasive Species March 2015
8
Coast ballast water source, or high volume of ballast water to be discharged. Although WDFW samples ships arriving at all Washington ports (Puget Sound, Columbia River, and Coastal), only samples collected from ships at Puget Sound ports are used in this report. A table of all samples by categorical factors used in the analyses is provided in Appendix A. Sampling information as collected from each ship’s Ballast Water Reporting Form (BWRF) included: ship name, IMO number, owner, ship type, last port, total ballast capacity, water volume of the sampled tank, total discharge of the ship, exchange status (yes/no), exchange method, date source water was ballasted, exchange date, and exchange location.
Ballast Water Sampling and Laboratory Methods
Zooplankton samples were usually collected from a single ballast tank per ship, although occasionally up to three tanks were sampled, especially if they represented different risk profiles. In general, ballast tanks were chosen in the following order of priority: (1) random selection based on a dice roll; (2) targeted selection based on Ballast Water Reporting Form; (3) fullest tanks; and (4) arbitrary choice by master or chief mate of the ship. Since 2013, an additional priority was to sample ships that met this project’s key data gap targets as noted in the Objectives section above. Some ship types (e.g. fishing, car carrier, and passenger) were not sampled due to assumed low risk (low discharge volumes) and resource limitations.
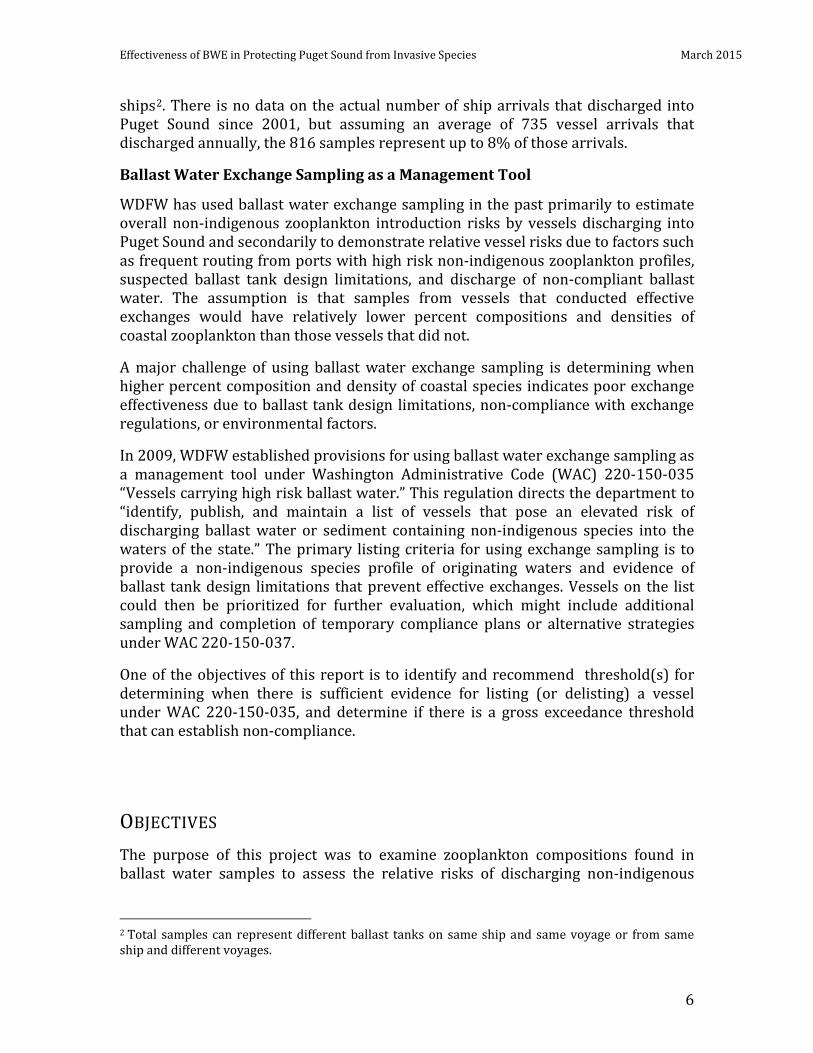
Zooplankton in the ballast tanks were sampled with a 30 cm diameter 73 µm mesh plankton net (Figure 1). Depth was measured with a 30 m weighted measuring tape, from tank bottom to the top of the water column. The net was then lowered to the bottom, and after approximately 15 seconds, it was pulled to the surface at a rate of approximately 30 centimeters per second. Occasionally, the internal structure of the
ballast tank prevented the net from reaching the tank bottom, which was noted by the inspector during sampling. Zooplankton was washed from the cod-end of the net into plastic sample jars and fixed in 10% buffered formalin. In each tank near-surface salinity and temperature were measured with a YSI model 33 salinity-temperature meter or with a handheld refractometer and thermometer. For processing in the laboratory, each zooplankton sample was filtered through a 30 µm mesh screen and placed into a plankton counting tray.
Zooplankton taxa were counted under a microscope at 25X magnification, except for
some taxa, which were removed and identified using a compound microscope. Larval forms of invertebrates were generally identified to higher taxonomic levels such as order (e.g., Calanoida), suborder (e.g., Balanomorpha), or class (e.g., Bivalvia). Adults were identified to species in most cases.
Figure 1. Ship-board zooplankton sampling
Effectiveness of BWE in Protecting Puget Sound from Invasive Species March 2015
9
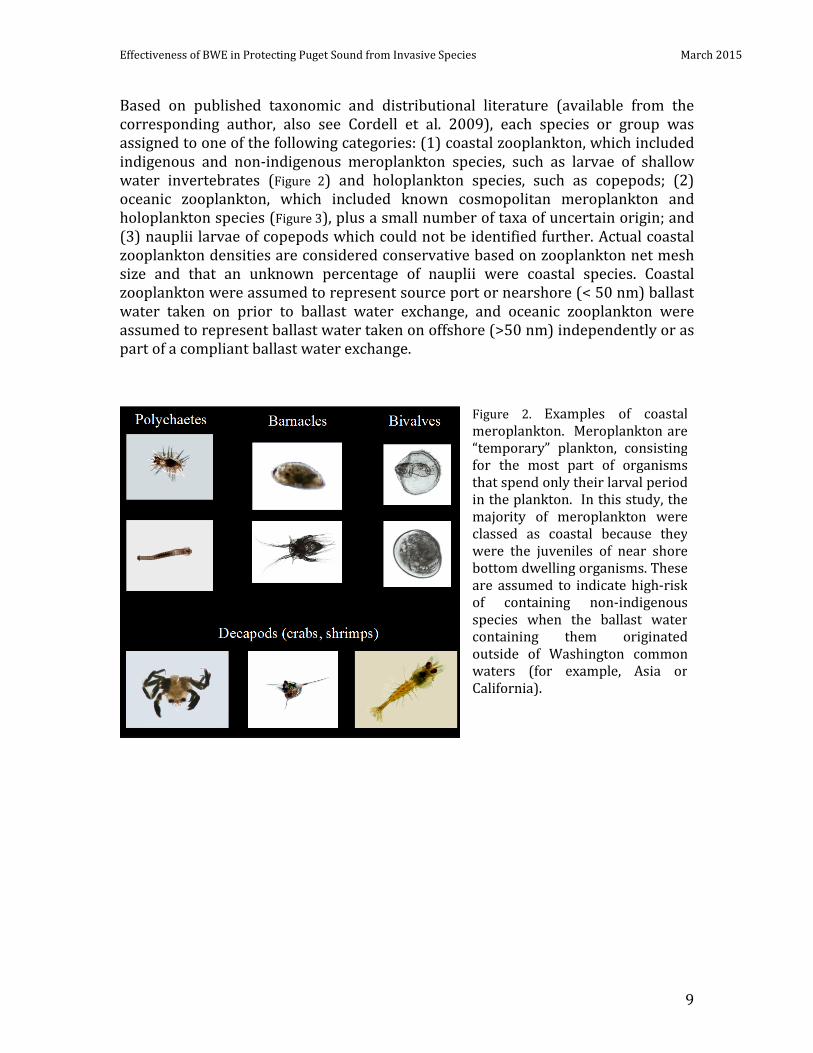
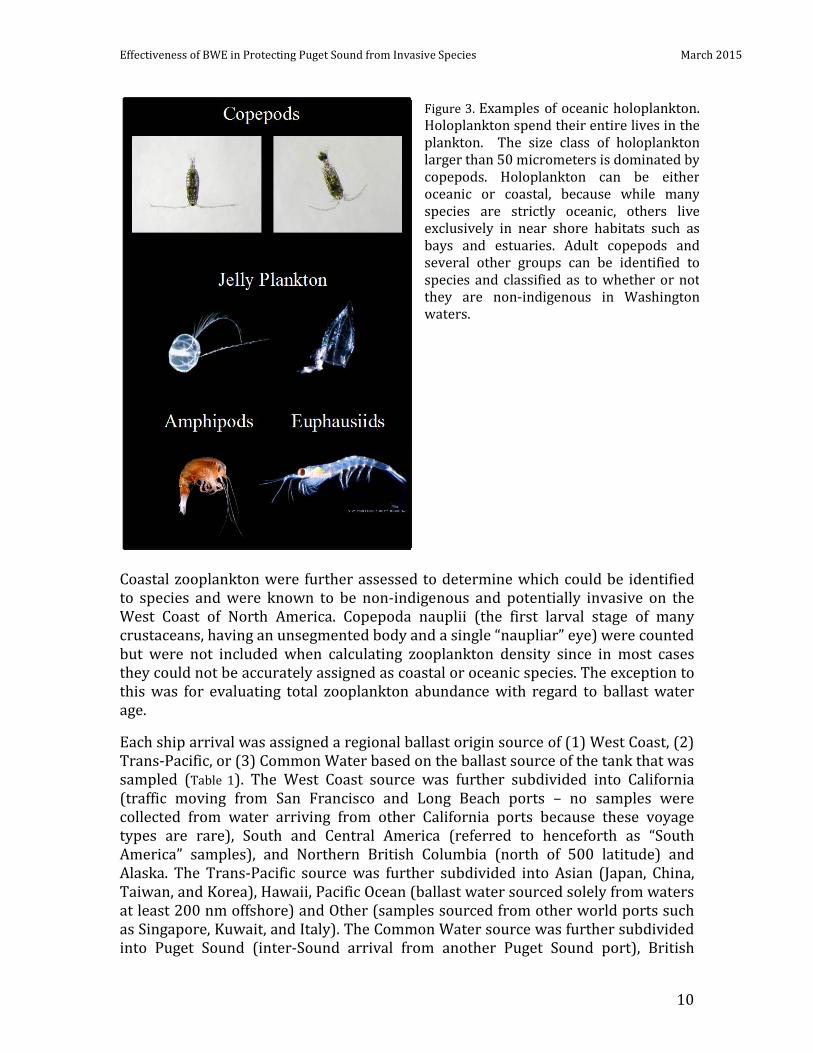
Based on published taxonomic and distributional literature (available from the corresponding author, also see Cordell et al. 2009), each species or group was assigned to one of the following categories: (1) coastal zooplankton, which included indigenous and non-indigenous meroplankton species, such as larvae of shallow water invertebrates (Figure 2) and holoplankton species, such as copepods; (2) oceanic zooplankton, which included known cosmopolitan meroplankton and holoplankton species (Figure 3), plus a small number of taxa of uncertain origin; and (3) nauplii larvae of copepods which could not be identified further. Actual coastal zooplankton densities are considered conservative based on zooplankton net mesh size and that an unknown percentage of nauplii were coastal species. Coastal zooplankton were assumed to represent source port or nearshore (< 50 nm) ballast water taken on prior to ballast water exchange, and oceanic zooplankton were assumed to represent ballast water taken on offshore (>50 nm) independently or as part of a compliant ballast water exchange.
Figure 2. Examples of coastal meroplankton. Meroplankton are “temporary” plankton, consisting for the most part of organisms that spend only their larval period in the plankton. In this study, the majority of meroplankton were classed as coastal because they were the juveniles of near shore bottom dwelling organisms. These are assumed to indicate high-risk of containing non-indigenous species when the ballast water containing them originated outside of Washington common waters (for example, Asia or California).
Effectiveness of BWE in Protecting Puget Sound from Invasive Species March 2015
10
Coastal zooplankton were further assessed to determine which could be identified to species and were known to be non-indigenous and potentially invasive on the West Coast of North America. Copepoda nauplii (the first larval stage of many crustaceans, having an unsegmented body and a single “naupliar” eye) were counted but were not included when calculating zooplankton density since in most cases they could not be accurately assigned as coastal or oceanic species. The exception to this was for evaluating total zooplankton abundance with regard to ballast water age.
Each ship arrival was assigned a regional ballast origin source of (1) West Coast, (2) Trans-Pacific, or (3) Common Water based on the ballast source of the tank that was sampled (Table 1). The West Coast source was further subdivided into California (traffic moving from San Francisco and Long Beach ports – no samples were collected from water arriving from other California ports because these voyage types are rare), South and Central America (referred to henceforth as “South America” samples), and Northern British Columbia (north of 500 latitude) and Alaska. The Trans-Pacific source was further subdivided into Asian (Japan, China, Taiwan, and Korea), Hawaii, Pacific Ocean (ballast water sourced solely from waters at least 200 nm offshore) and Other (samples sourced from other world ports such as Singapore, Kuwait, and Italy). The Common Water source was further subdivided into Puget Sound (inter-Sound arrival from another Puget Sound port), British
Figure 3. Examples of oceanic holoplankton. Holoplankton spend their entire lives in the plankton. The size class of holoplankton larger than 50 micrometers is dominated by copepods. Holoplankton can be either oceanic or coastal, because while many species are strictly oceanic, others live exclusively in near shore habitats such as bays and estuaries. Adult copepods and several other groups can be identified to species and classified as to whether or not they are non-indigenous in Washington waters.
Effectiveness of BWE in Protecting Puget Sound from Invasive Species March 2015
11
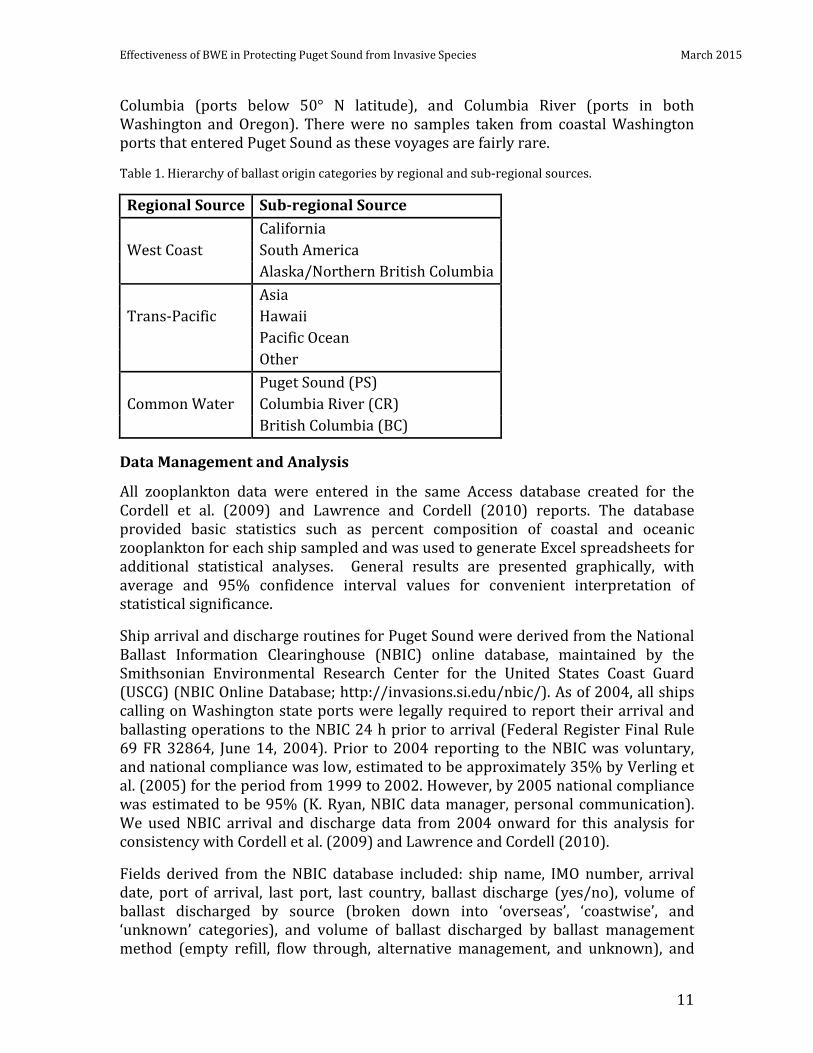
Columbia (ports below 50° N latitude), and Columbia River (ports in both Washington and Oregon). There were no samples taken from coastal Washington ports that entered Puget Sound as these voyages are fairly rare.
Table 1. Hierarchy of ballast origin categories by regional and sub-regional sources.
Regional Source Sub-regional Source California West Coast South America Alaska/Northern British Columbia Asia Trans-Pacific Hawaii Pacific Ocean Other Puget Sound (PS) Common Water Columbia River (CR) British Columbia (BC)
Data Management and Analysis
All zooplankton data were entered in the same Access database created for the Cordell et al. (2009) and Lawrence and Cordell (2010) reports. The database provided basic statistics such as percent composition of coastal and oceanic zooplankton for each ship sampled and was used to generate Excel spreadsheets for additional statistical analyses. General results are presented graphically, with average and 95% confidence interval values for convenient interpretation of statistical significance.
Ship arrival and discharge routines for Puget Sound were derived from the National Ballast Information Clearinghouse (NBIC) online database, maintained by the Smithsonian Environmental Research Center for the United States Coast Guard (USCG) (NBIC Online Database; http://invasions.si.edu/nbic/). As of 2004, all ships calling on Washington state ports were legally required to report their arrival and ballasting operations to the NBIC 24 h prior to arrival (Federal Register Final Rule 69 FR 32864, June 14, 2004). Prior to 2004 reporting to the NBIC was voluntary, and national compliance was low, estimated to be approximately 35% by Verling et al. (2005) for the period from 1999 to 2002. However, by 2005 national compliance was estimated to be 95% (K. Ryan, NBIC data manager, personal communication). We used NBIC arrival and discharge data from 2004 onward for this analysis for consistency with Cordell et al. (2009) and Lawrence and Cordell (2010).
Fields derived from the NBIC database included: ship name, IMO number, arrival date, port of arrival, last port, last country, ballast discharge (yes/no), volume of ballast discharged by source (broken down into ‘overseas’, ‘coastwise’, and ‘unknown’ categories), and volume of ballast discharged by ballast management method (empty refill, flow through, alternative management, and unknown), and
Effectiveness of BWE in Protecting Puget Sound from Invasive Species March 2015
12
ship type. Specific ship types identified in the NBIC database were container, bulk carrier, general cargo, tanker, and other.
RESULTS AND DISCUSSION This section provides both results and discussion for analysis of questions under Objectives 1 through 3. Discussion is provided for each section below for clarity.
Sample Numbers and Locations
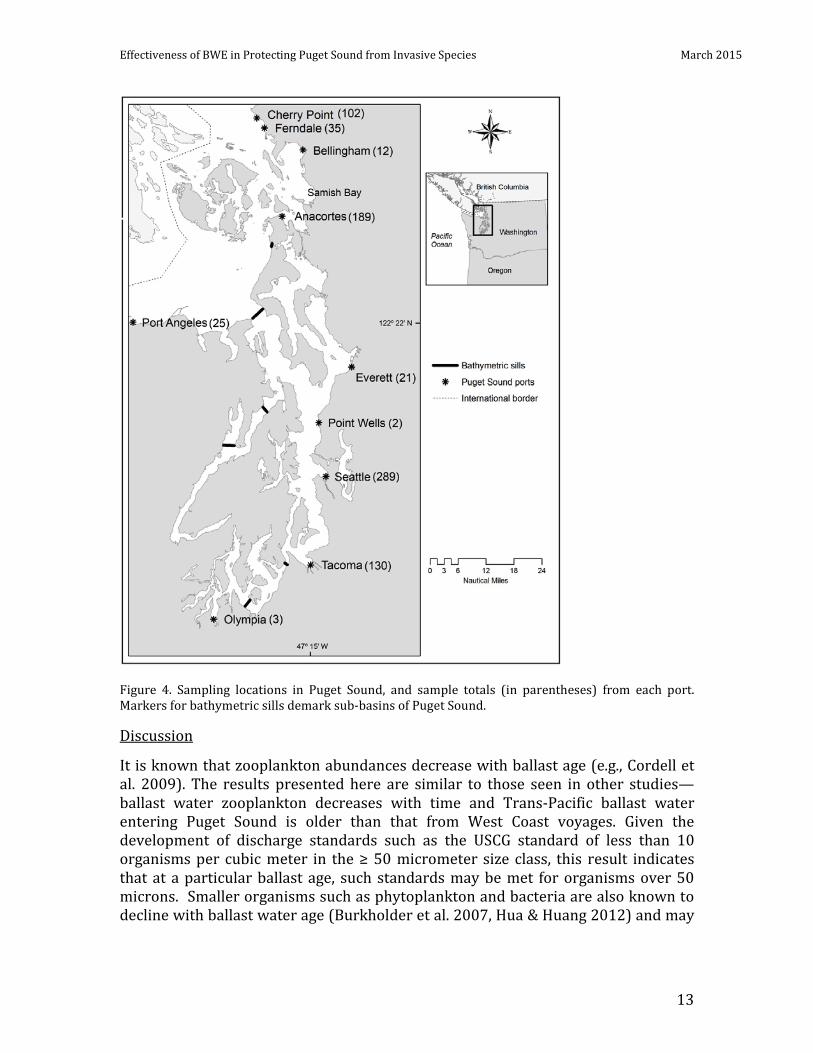
Between 2001 and 2014, 816 plankton samples were taken and analyzed from ships entering Puget Sound ports ( Figure 4). The majority of the samples were obtained from the northern Puget Sound (ports of Cherry Point, Anacortes, Ferndale, and Bellingham) and the central basin of Puget Sound (Everett, Seattle, and Tacoma); of these, 695 were taken from ships that stated they had undergone a ballast water exchange. Such vessels were assumed to be in compliance with either federal or state requirements based on voyage type. The data set also included 107 samples from ballast tanks that had not undergone a ballast water exchange. Un-exchanged samples may reflect a violation of regulatory requirements, ballast water not intended to be discharged into Puget Sound, or ballast water taken up from common waters. Fourteen samples were from tanks for which no information was provided about ballast water exchange.
Journey Length (Ballast Water Age)
Results
For this analysis, we used a total of 923 samples taken both in Puget Sound ports and in coastal and Columbia River Washington ports (the latter two sets of samples were not used for the remainder of the analyses which focus on Puget Sound). Ballast age was measured in the number of days from the ballast water exchange date or the ballast source date (for un-exchanged water) to the ballast discharge date.
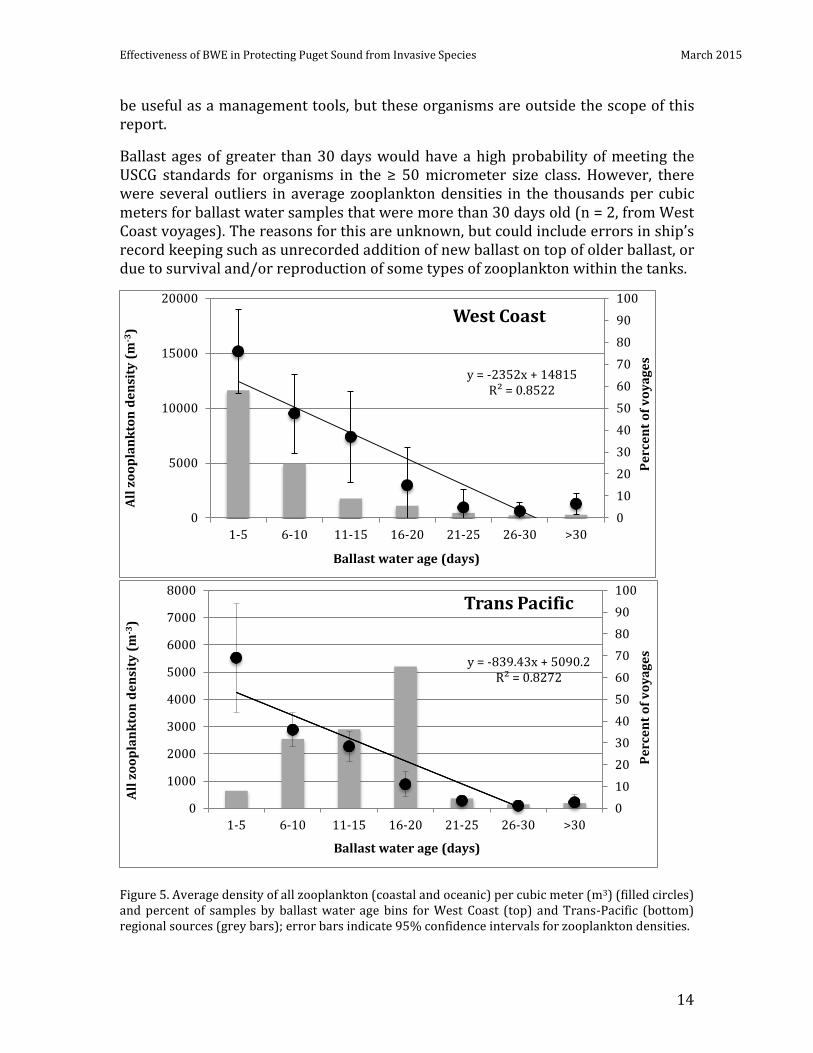
Zooplankton densities decreased with age of ballast water for both West Coast and Trans-Pacific sources, nearing zero after about 30 days, independent of ballast water source, management practice, or other factors (Figure 5). Most ballast water sampled from West Coast voyages was in the 1-5 day age bin, while that from Trans-Pacific voyages was in the 16-20 day age bin. Shorter voyages of less than seven days for Trans-Pacific sources were generally from Pacific Ocean sub-regions taken up during voyages to Washington State.
Effectiveness of BWE in Protecting Puget Sound from Invasive Species March 2015
13
Figure 4. Sampling locations in Puget Sound, and sample totals (in parentheses) from each port. Markers for bathymetric sills demark sub-basins of Puget Sound.
Discussion
It is known that zooplankton abundances decrease with ballast age (e.g., Cordell et al. 2009). The results presented here are similar to those seen in other studies—ballast water zooplankton decreases with time and Trans-Pacific ballast water entering Puget Sound is older than that from West Coast voyages. Given the development of discharge standards such as the USCG standard of less than 10 organisms per cubic meter in the ≥ 50 micrometer size class, this result indicates that at a particular ballast age, such standards may be met for organisms over 50 microns. Smaller organisms such as phytoplankton and bacteria are also known to decline with ballast water age (Burkholder et al. 2007, Hua & Huang 2012) and may
Effectiveness of BWE in Protecting Puget Sound from Invasive Species March 2015
14
be useful as a management tools, but these organisms are outside the scope of this report.
Ballast ages of greater than 30 days would have a high probability of meeting the USCG standards for organisms in the ≥ 50 micrometer size class. However, there were several outliers in average zooplankton densities in the thousands per cubic meters for ballast water samples that were more than 30 days old (n = 2, from West Coast voyages). The reasons for this are unknown, but could include errors in ship’s record keeping such as unrecorded addition of new ballast on top of older ballast, or due to survival and/or reproduction of some types of zooplankton within the tanks.
Figure 5. Average density of all zooplankton (coastal and oceanic) per cubic meter (m3) (filled circles) and percent of samples by ballast water age bins for West Coast (top) and Trans-Pacific (bottom) regional sources (grey bars); error bars indicate 95% confidence intervals for zooplankton densities.
y = -2352x + 14815 R² = 0.8522
0102030405060708090100
0
5000
10000
15000
20000
1-5 6-10 11-15 16-20 21-25 26-30 >30
Perc
ent o
f voy
ages
All z
oopl
ankt
on d
ensi
ty (m
-3)
Ballast water age (days)
West Coast
y = -839.43x + 5090.2 R² = 0.8272
0102030405060708090100
0
1000
2000
3000
4000
5000
6000
7000
8000
1-5 6-10 11-15 16-20 21-25 26-30 >30
Perc
ent o
f voy
ages
All z
oopl
ankt
on d
ensi
ty (m
-3)
Ballast water age (days)
Trans Pacific
Effectiveness of BWE in Protecting Puget Sound from Invasive Species March 2015
15
Ship Type
Results
Analyses for the contribution of ship type to ballast tank zooplankton assemblages included: (1) comparison of arrivals and number of samples collected between 2004 (start of NBIC record keeping) and 2014; and (2) comparison of coastal zooplankton in samples by management type (exchanged and un-exchanged). In the first analysis, five general NBIC ship type categories were analyzed based on highest discharge volumes including: tanker; general cargo; container; bulk carrier; and other. In the second analysis, tanker ship type was further divided into: articulated tug-barge; integrated tug-barge; oil tanker (crude and refined) and “other” tanker which included chemical and other product tanker types. Ships in the “Other” general ship type category were not included in this analysis due to low sample size in both un-exchanged and exchanged categories.
Comparison by arrivals and number samples collected
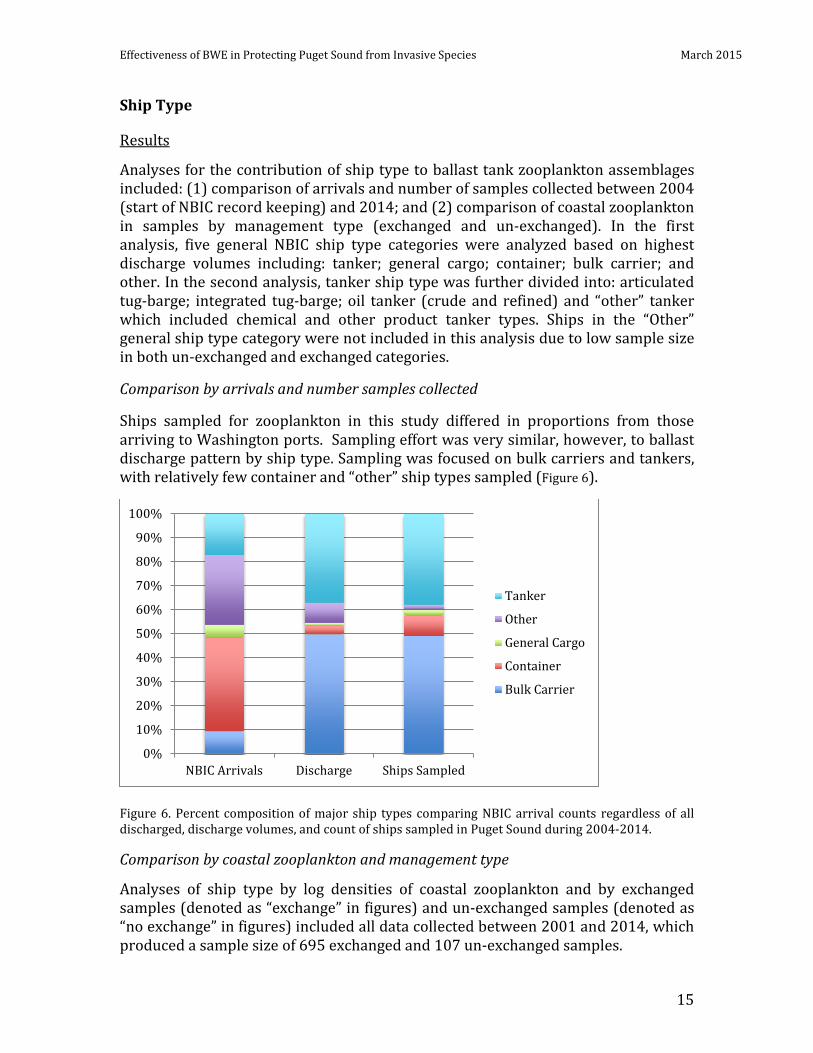
Ships sampled for zooplankton in this study differed in proportions from those arriving to Washington ports. Sampling effort was very similar, however, to ballast discharge pattern by ship type. Sampling was focused on bulk carriers and tankers, with relatively few container and “other” ship types sampled (Figure 6).
Figure 6. Percent composition of major ship types comparing NBIC arrival counts regardless of all discharged, discharge volumes, and count of ships sampled in Puget Sound during 2004-2014.
Comparison by coastal zooplankton and management type
Analyses of ship type by log densities of coastal zooplankton and by exchanged samples (denoted as “exchange” in figures) and un-exchanged samples (denoted as “no exchange” in figures) included all data collected between 2001 and 2014, which produced a sample size of 695 exchanged and 107 un-exchanged samples.
0%
10%
20%
30%
40%
50%
60%
70%
80%
90%
100%
NBIC Arrivals Discharge Ships Sampled
Tanker
Other
General Cargo
Container
Bulk Carrier
Effectiveness of BWE in Protecting Puget Sound from Invasive Species March 2015
16
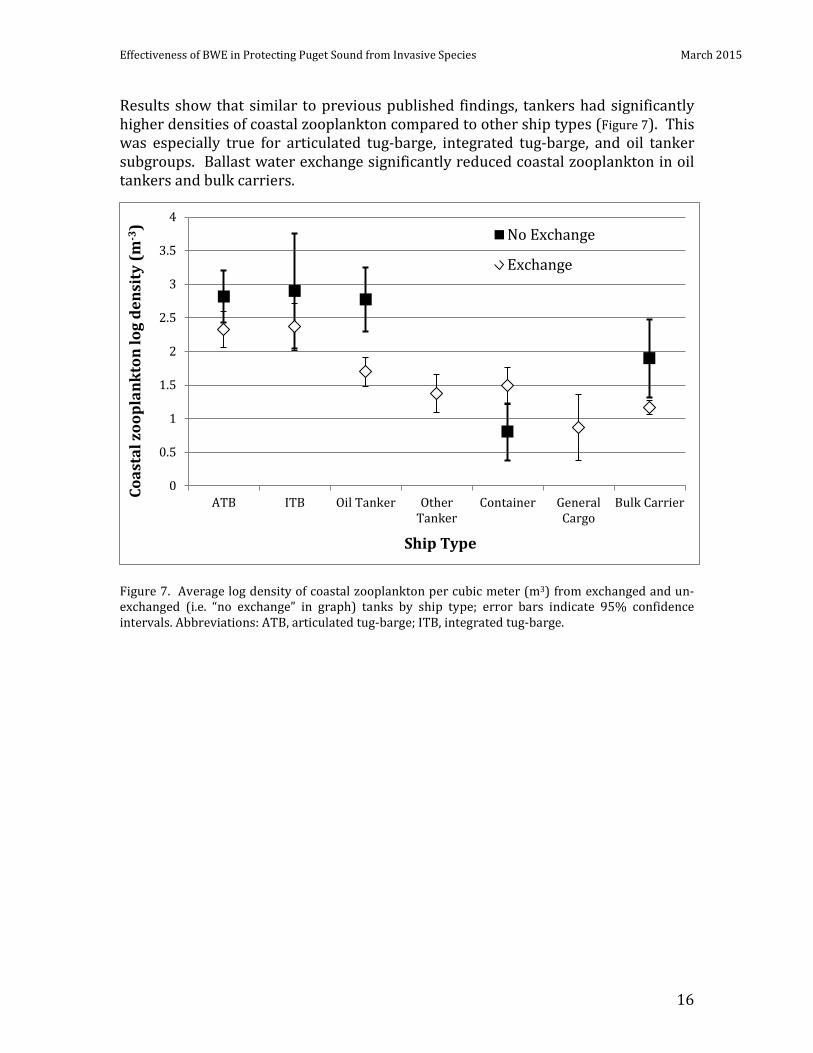
Results show that similar to previous published findings, tankers had significantly higher densities of coastal zooplankton compared to other ship types (Figure 7). This was especially true for articulated tug-barge, integrated tug-barge, and oil tanker subgroups. Ballast water exchange significantly reduced coastal zooplankton in oil tankers and bulk carriers.
Figure 7. Average log density of coastal zooplankton per cubic meter (m3) from exchanged and un-exchanged (i.e. “no exchange” in graph) tanks by ship type; error bars indicate 95% confidence intervals. Abbreviations: ATB, articulated tug-barge; ITB, integrated tug-barge.
0
0.5
1
1.5
2
2.5
3
3.5
4
ATB ITB Oil Tanker OtherTanker
Container GeneralCargo
Bulk Carrier
Coas
tal z
oopl
ankt
on lo
g de
nsit
y (m
-3)
Ship Type
No Exchange
Exchange
Effectiveness of BWE in Protecting Puget Sound from Invasive Species March 2015
17
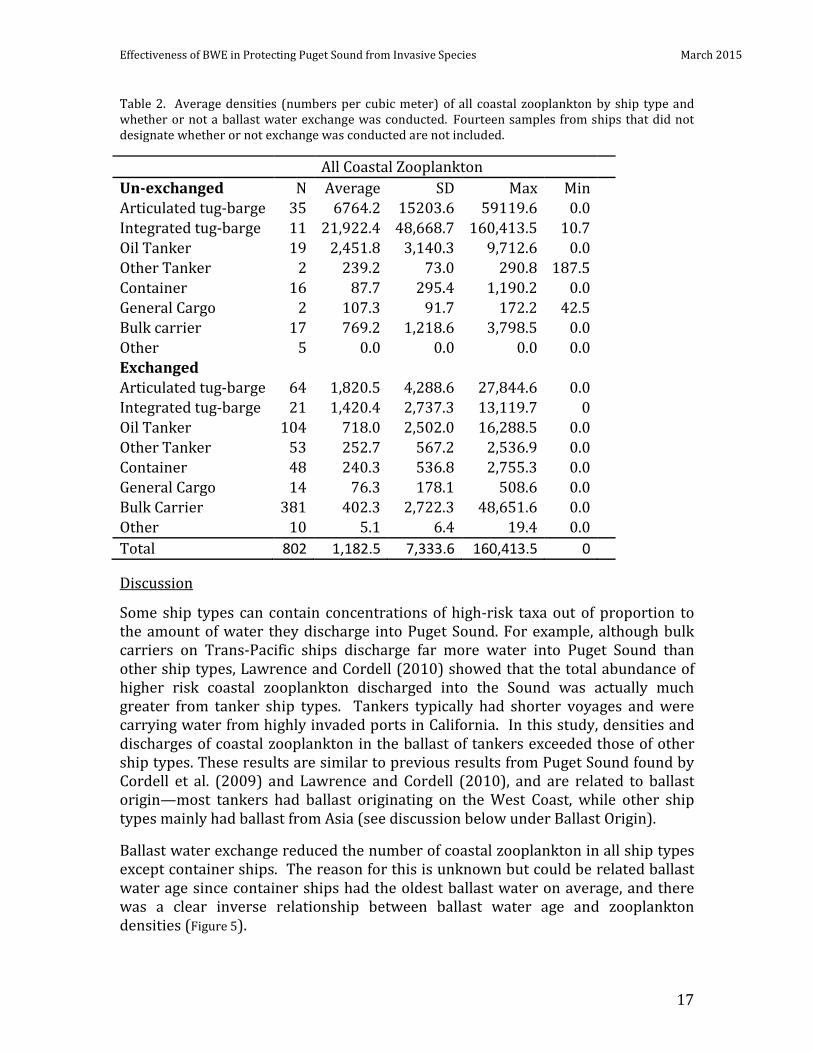
Table 2. Average densities (numbers per cubic meter) of all coastal zooplankton by ship type and whether or not a ballast water exchange was conducted. Fourteen samples from ships that did not designate whether or not exchange was conducted are not included.
All Coastal Zooplankton Un-exchanged N Average SD Max Min Articulated tug-barge 35 6764.2 15203.6 59119.6 0.0 Integrated tug-barge 11 21,922.4 48,668.7 160,413.5 10.7 Oil Tanker 19 2,451.8 3,140.3 9,712.6 0.0 Other Tanker 2 239.2 73.0 290.8 187.5 Container 16 87.7 295.4 1,190.2 0.0 General Cargo 2 107.3 91.7 172.2 42.5 Bulk carrier 17 769.2 1,218.6 3,798.5 0.0 Other 5 0.0 0.0 0.0 0.0 Exchanged Articulated tug-barge 64 1,820.5 4,288.6 27,844.6 0.0 Integrated tug-barge 21 1,420.4 2,737.3 13,119.7 0 Oil Tanker 104 718.0 2,502.0 16,288.5 0.0 Other Tanker 53 252.7 567.2 2,536.9 0.0 Container 48 240.3 536.8 2,755.3 0.0 General Cargo 14 76.3 178.1 508.6 0.0 Bulk Carrier 381 402.3 2,722.3 48,651.6 0.0 Other 10 5.1 6.4 19.4 0.0 Total 802 1,182.5 7,333.6 160,413.5 0
Discussion
Some ship types can contain concentrations of high-risk taxa out of proportion to the amount of water they discharge into Puget Sound. For example, although bulk carriers on Trans-Pacific ships discharge far more water into Puget Sound than other ship types, Lawrence and Cordell (2010) showed that the total abundance of higher risk coastal zooplankton discharged into the Sound was actually much greater from tanker ship types. Tankers typically had shorter voyages and were carrying water from highly invaded ports in California. In this study, densities and discharges of coastal zooplankton in the ballast of tankers exceeded those of other ship types. These results are similar to previous results from Puget Sound found by Cordell et al. (2009) and Lawrence and Cordell (2010), and are related to ballast origin—most tankers had ballast originating on the West Coast, while other ship types mainly had ballast from Asia (see discussion below under Ballast Origin).
Ballast water exchange reduced the number of coastal zooplankton in all ship types except container ships. The reason for this is unknown but could be related ballast water age since container ships had the oldest ballast water on average, and there was a clear inverse relationship between ballast water age and zooplankton densities (Figure 5).
Effectiveness of BWE in Protecting Puget Sound from Invasive Species March 2015
18
Ballast Origin
Differences among ballast water zooplankton concentrations by origin were assessed by: (1) comparison of coastal zooplankton in samples by management type (exchanged and un-exchanged) and (2) comparison of non-indigenous zooplankton in samples by management type (exchanged and un-exchanged).
Results
Comparison of coastal zooplankton in samples by management type
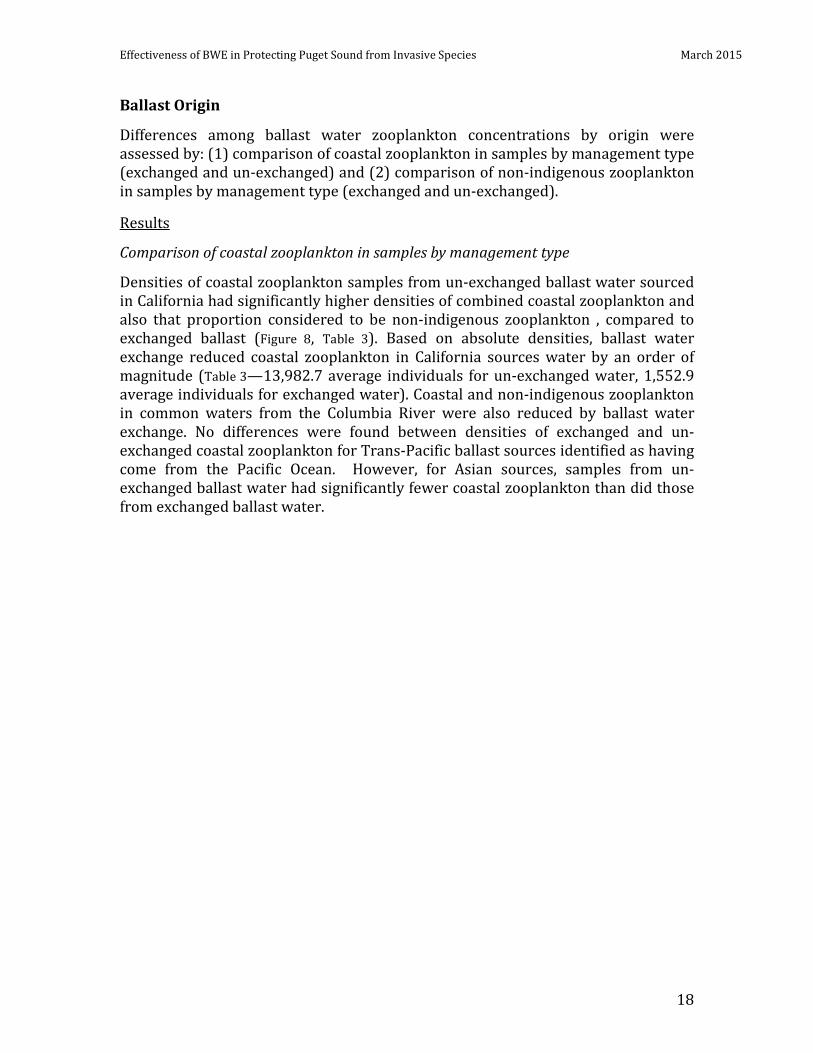
Densities of coastal zooplankton samples from un-exchanged ballast water sourced in California had significantly higher densities of combined coastal zooplankton and also that proportion considered to be non-indigenous zooplankton , compared to exchanged ballast (Figure 8, Table 3). Based on absolute densities, ballast water exchange reduced coastal zooplankton in California sources water by an order of magnitude (Table 3—13,982.7 average individuals for un-exchanged water, 1,552.9 average individuals for exchanged water). Coastal and non-indigenous zooplankton in common waters from the Columbia River were also reduced by ballast water exchange. No differences were found between densities of exchanged and un-exchanged coastal zooplankton for Trans-Pacific ballast sources identified as having come from the Pacific Ocean. However, for Asian sources, samples from un-exchanged ballast water had significantly fewer coastal zooplankton than did those from exchanged ballast water.
Effectiveness of BWE in Protecting Puget Sound from Invasive Species March 2015
19
Figure 8. Effect of ballast water exchange on densities of all coastal zooplankton by ballast origin; error bars indicate 95% confidence intervals. Abbreviations: BC, British Columbia; PS, Puget Sound; CR, Columbia River.
Comparison of non-indigenous zooplankton in samples by management type
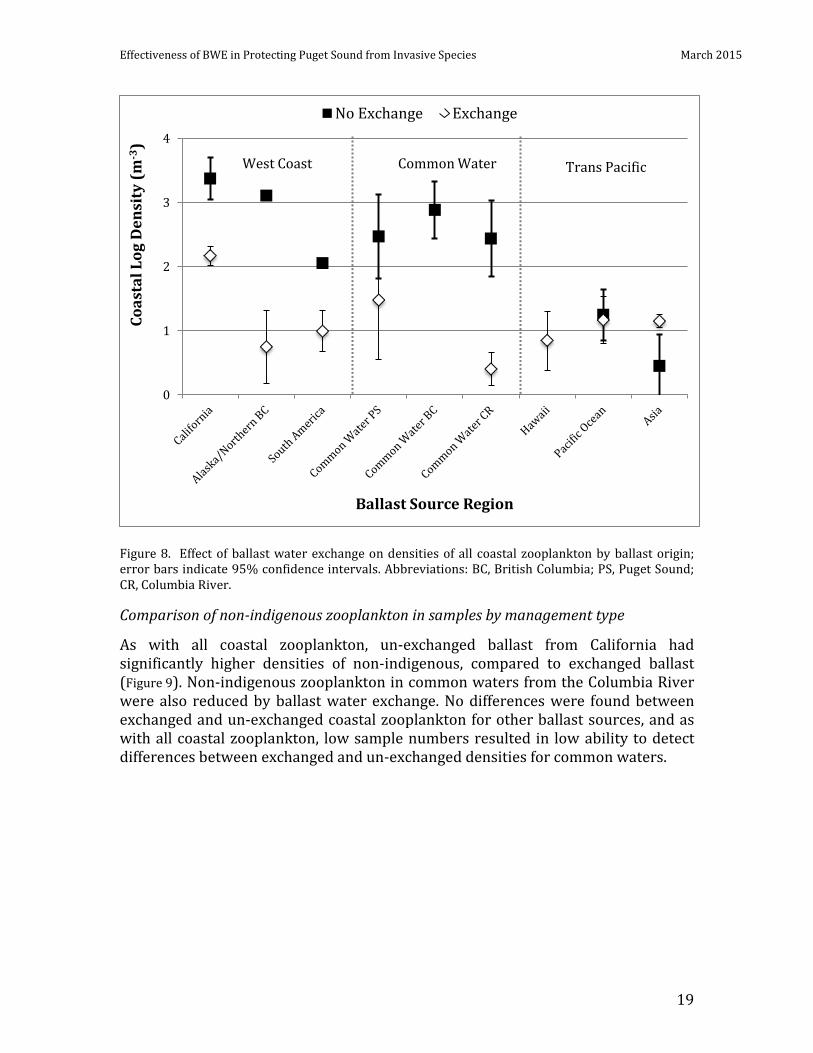
As with all coastal zooplankton, un-exchanged ballast from California had significantly higher densities of non-indigenous, compared to exchanged ballast (Figure 9). Non-indigenous zooplankton in common waters from the Columbia River were also reduced by ballast water exchange. No differences were found between exchanged and un-exchanged coastal zooplankton for other ballast sources, and as with all coastal zooplankton, low sample numbers resulted in low ability to detect differences between exchanged and un-exchanged densities for common waters.
0
1
2
3
4Co
asta
l Log
Den
sity
(m-3
)
Ballast Source Region
No Exchange Exchange
Trans Pacific West Coast Common Water
Effectiveness of BWE in Protecting Puget Sound from Invasive Species March 2015
20
Figure 9. Effect of ballast water exchange on densities of non-indigenous zooplankton by ballast origin; error bars indicate 95% confidence intervals.
0
1
2
3N
IS L
og D
ensi
ty (m
-3)
Ballast Source Region
No Exchange Exchange
West Coast Trans Pacific Common Water
Effectiveness of BWE in Protecting Puget Sound from Invasive Species March 2015
21
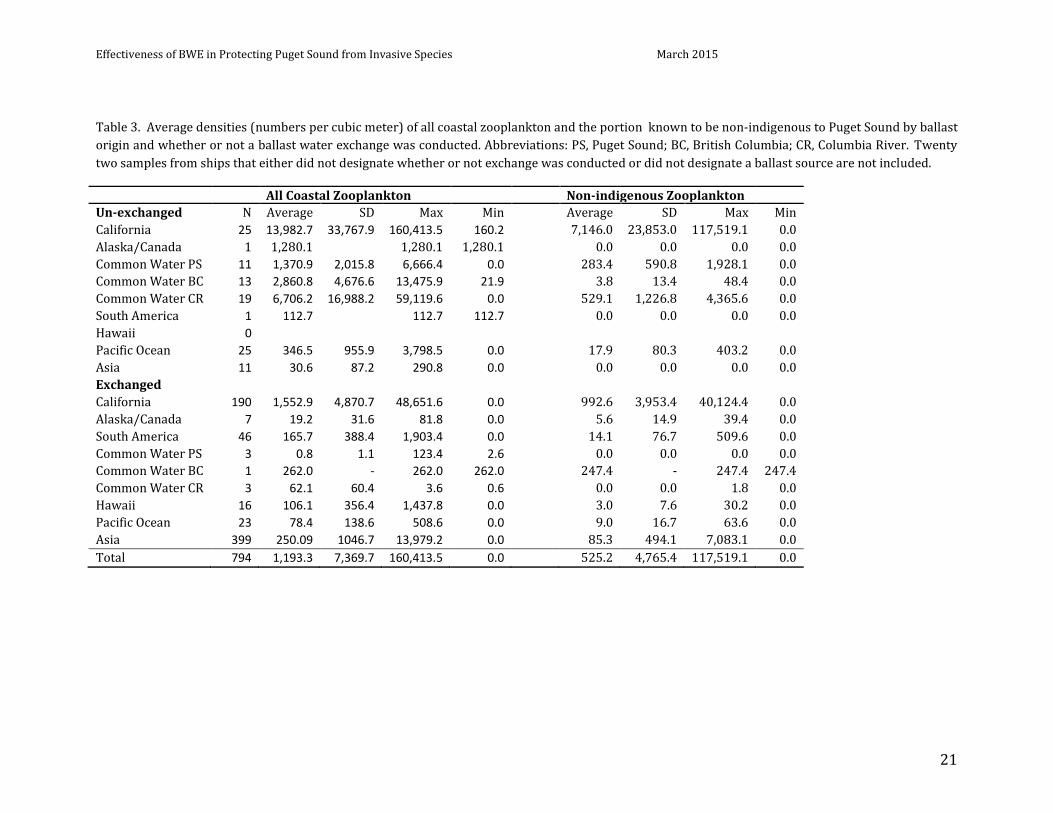
Table 3. Average densities (numbers per cubic meter) of all coastal zooplankton and the portion known to be non-indigenous to Puget Sound by ballast origin and whether or not a ballast water exchange was conducted. Abbreviations: PS, Puget Sound; BC, British Columbia; CR, Columbia River. Twenty two samples from ships that either did not designate whether or not exchange was conducted or did not designate a ballast source are not included.
All Coastal Zooplankton Non-indigenous Zooplankton Un-exchanged N Average SD Max Min Average SD Max Min California 25 13,982.7 33,767.9 160,413.5 160.2 7,146.0 23,853.0 117,519.1 0.0 Alaska/Canada 1 1,280.1 1,280.1 1,280.1 0.0 0.0 0.0 0.0 Common Water PS 11 1,370.9 2,015.8 6,666.4 0.0 283.4 590.8 1,928.1 0.0 Common Water BC 13 2,860.8 4,676.6 13,475.9 21.9 3.8 13.4 48.4 0.0 Common Water CR 19 6,706.2 16,988.2 59,119.6 0.0 529.1 1,226.8 4,365.6 0.0 South America 1 112.7 112.7 112.7 0.0 0.0 0.0 0.0 Hawaii 0 Pacific Ocean 25 346.5 955.9 3,798.5 0.0 17.9 80.3 403.2 0.0 Asia 11 30.6 87.2 290.8 0.0 0.0 0.0 0.0 0.0 Exchanged California 190 1,552.9 4,870.7 48,651.6 0.0 992.6 3,953.4 40,124.4 0.0 Alaska/Canada 7 19.2 31.6 81.8 0.0 5.6 14.9 39.4 0.0 South America 46 165.7 388.4 1,903.4 0.0 14.1 76.7 509.6 0.0 Common Water PS 3 0.8 1.1 123.4 2.6 0.0 0.0 0.0 0.0 Common Water BC 1 262.0 - 262.0 262.0 247.4 - 247.4 247.4 Common Water CR 3 62.1 60.4 3.6 0.6 0.0 0.0 1.8 0.0 Hawaii 16 106.1 356.4 1,437.8 0.0 3.0 7.6 30.2 0.0 Pacific Ocean 23 78.4 138.6 508.6 0.0 9.0 16.7 63.6 0.0 Asia 399 250.09 1046.7 13,979.2 0.0 85.3 494.1 7,083.1 0.0 Total 794 1,193.3 7,369.7 160,413.5 0.0 525.2 4,765.4 117,519.1 0.0
Effectiveness of BWE in Protecting Puget Sound from Invasive Species March 2015
22
Discussion
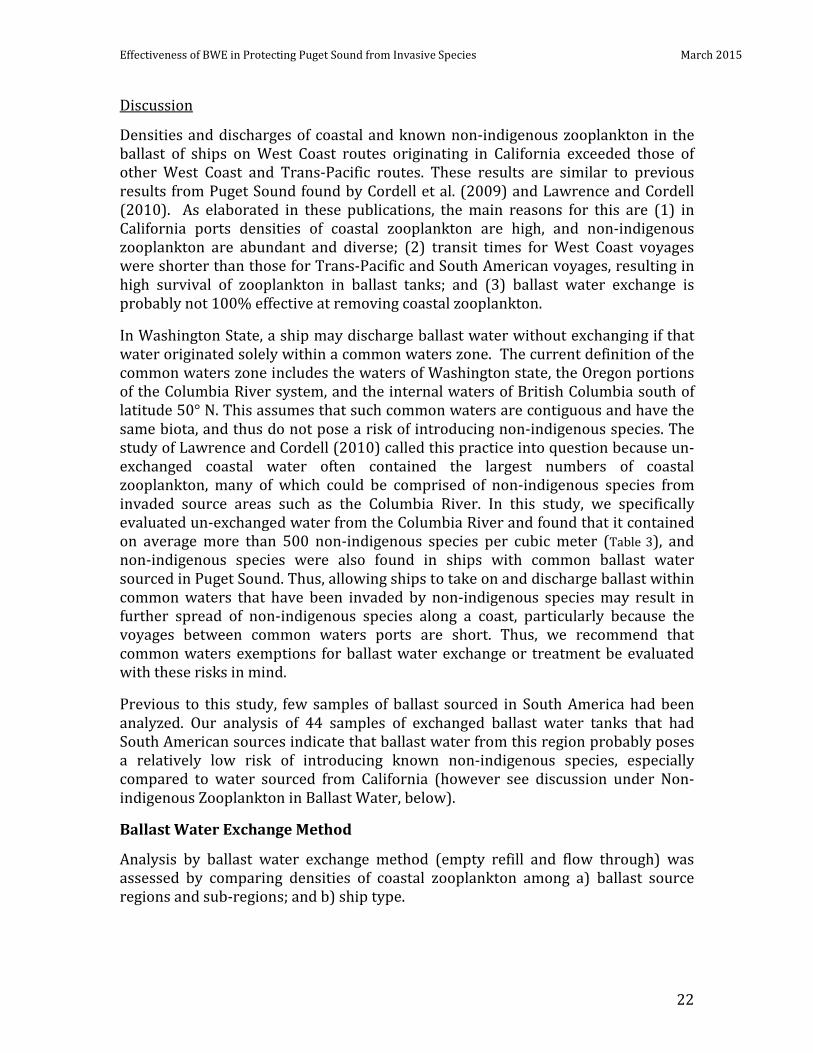
Densities and discharges of coastal and known non-indigenous zooplankton in the ballast of ships on West Coast routes originating in California exceeded those of other West Coast and Trans-Pacific routes. These results are similar to previous results from Puget Sound found by Cordell et al. (2009) and Lawrence and Cordell (2010). As elaborated in these publications, the main reasons for this are (1) in California ports densities of coastal zooplankton are high, and non-indigenous zooplankton are abundant and diverse; (2) transit times for West Coast voyages were shorter than those for Trans-Pacific and South American voyages, resulting in high survival of zooplankton in ballast tanks; and (3) ballast water exchange is probably not 100% effective at removing coastal zooplankton.
In Washington State, a ship may discharge ballast water without exchanging if that water originated solely within a common waters zone. The current definition of the common waters zone includes the waters of Washington state, the Oregon portions of the Columbia River system, and the internal waters of British Columbia south of latitude 50° N. This assumes that such common waters are contiguous and have the same biota, and thus do not pose a risk of introducing non-indigenous species. The study of Lawrence and Cordell (2010) called this practice into question because un-exchanged coastal water often contained the largest numbers of coastal zooplankton, many of which could be comprised of non-indigenous species from invaded source areas such as the Columbia River. In this study, we specifically evaluated un-exchanged water from the Columbia River and found that it contained on average more than 500 non-indigenous species per cubic meter (Table 3), and non-indigenous species were also found in ships with common ballast water sourced in Puget Sound. Thus, allowing ships to take on and discharge ballast within common waters that have been invaded by non-indigenous species may result in further spread of non-indigenous species along a coast, particularly because the voyages between common waters ports are short. Thus, we recommend that common waters exemptions for ballast water exchange or treatment be evaluated with these risks in mind.
Previous to this study, few samples of ballast sourced in South America had been analyzed. Our analysis of 44 samples of exchanged ballast water tanks that had South American sources indicate that ballast water from this region probably poses a relatively low risk of introducing known non-indigenous species, especially compared to water sourced from California (however see discussion under Non-indigenous Zooplankton in Ballast Water, below).
Ballast Water Exchange Method
Analysis by ballast water exchange method (empty refill and flow through) was assessed by comparing densities of coastal zooplankton among a) ballast source regions and sub-regions; and b) ship type.
Effectiveness of BWE in Protecting Puget Sound from Invasive Species March 2015
23
Results
Ballast water exchange effectiveness by exchange method and ballast origin
For analysis of ballast water exchange effectiveness, ballast water tank samples were assessed by exchange method (empty refill, flow through, no exchange), ballast origin, and ship type.
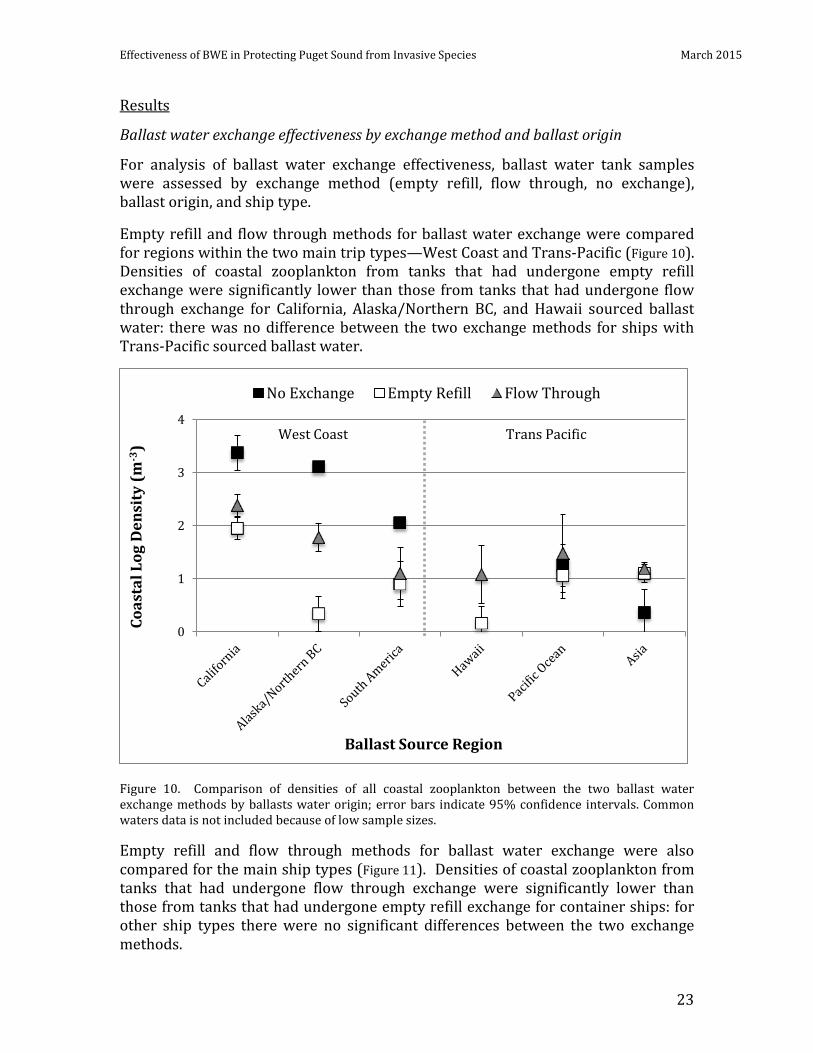
Empty refill and flow through methods for ballast water exchange were compared for regions within the two main trip types—West Coast and Trans-Pacific (Figure 10). Densities of coastal zooplankton from tanks that had undergone empty refill exchange were significantly lower than those from tanks that had undergone flow through exchange for California, Alaska/Northern BC, and Hawaii sourced ballast water: there was no difference between the two exchange methods for ships with Trans-Pacific sourced ballast water.
Figure 10. Comparison of densities of all coastal zooplankton between the two ballast water exchange methods by ballasts water origin; error bars indicate 95% confidence intervals. Common waters data is not included because of low sample sizes.
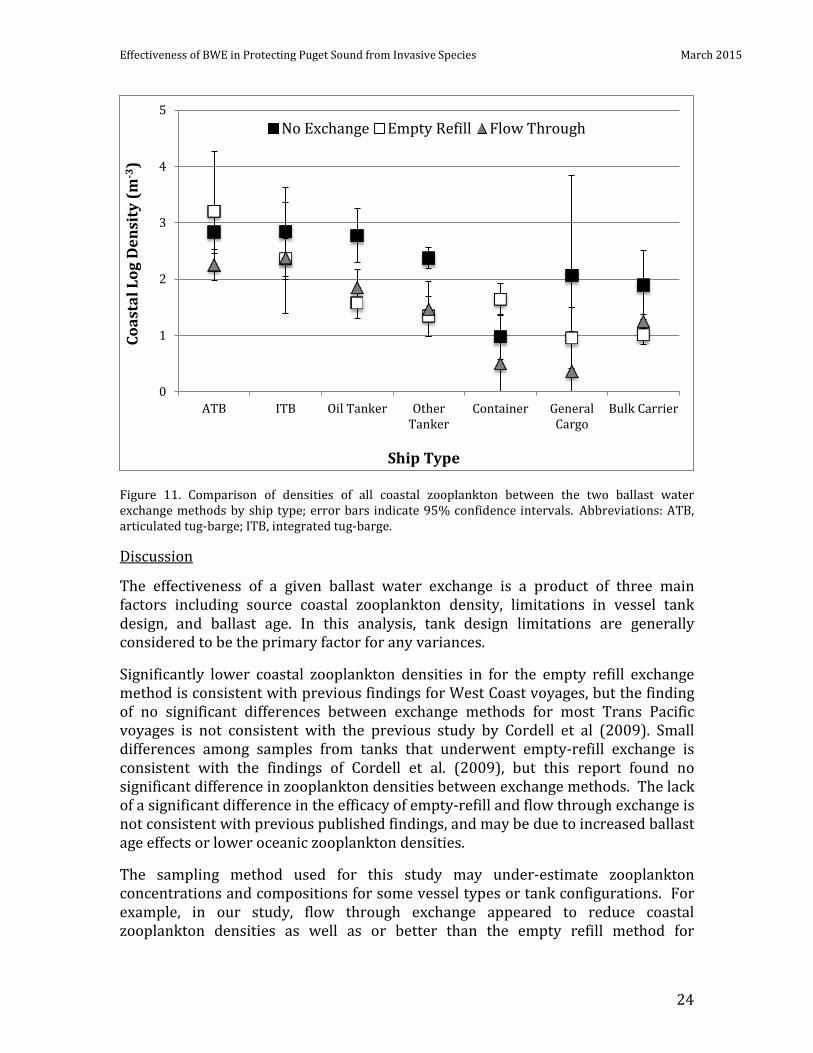
Empty refill and flow through methods for ballast water exchange were also compared for the main ship types (Figure 11). Densities of coastal zooplankton from tanks that had undergone flow through exchange were significantly lower than those from tanks that had undergone empty refill exchange for container ships: for other ship types there were no significant differences between the two exchange methods.
0
1
2
3
4
Coas
tal L
og D
ensi
ty (m
-3)
Ballast Source Region
No Exchange Empty Refill Flow Through
West Coast Trans Pacific
Effectiveness of BWE in Protecting Puget Sound from Invasive Species March 2015
24
Figure 11. Comparison of densities of all coastal zooplankton between the two ballast water exchange methods by ship type; error bars indicate 95% confidence intervals. Abbreviations: ATB, articulated tug-barge; ITB, integrated tug-barge.
Discussion
The effectiveness of a given ballast water exchange is a product of three main factors including source coastal zooplankton density, limitations in vessel tank design, and ballast age. In this analysis, tank design limitations are generally considered to be the primary factor for any variances.
Significantly lower coastal zooplankton densities in for the empty refill exchange method is consistent with previous findings for West Coast voyages, but the finding of no significant differences between exchange methods for most Trans Pacific voyages is not consistent with the previous study by Cordell et al (2009). Small differences among samples from tanks that underwent empty-refill exchange is consistent with the findings of Cordell et al. (2009), but this report found no significant difference in zooplankton densities between exchange methods. The lack of a significant difference in the efficacy of empty-refill and flow through exchange is not consistent with previous published findings, and may be due to increased ballast age effects or lower oceanic zooplankton densities.
The sampling method used for this study may under-estimate zooplankton concentrations and compositions for some vessel types or tank configurations. For example, in our study, flow through exchange appeared to reduce coastal zooplankton densities as well as or better than the empty refill method for
0
1
2
3
4
5
ATB ITB Oil Tanker OtherTanker
Container GeneralCargo
Bulk Carrier
Coas
tal L
og D
ensi
ty (m
-3)
Ship Type
No Exchange Empty Refill Flow Through
Effectiveness of BWE in Protecting Puget Sound from Invasive Species March 2015
25
articulated tug-barges and similarly constructed integrated tug-barges, but this is inconsistent with the engineering study by Reynolds (2008) who found that “dead zones” in an articulated tug-barge ballast tank system could not be flushed properly using a flow through exchange method. This discrepancy may be an artifact of our sampling protocol, which may have missed such dead zones and overestimated the efficacy of flow through exchange. Any conclusions regarding the efficacy of flow through versus empty refill exchange should be made in light of all available information on a vessel’s ballast tank system.
Ballast Water Exchange Effectiveness Through Time
Effectiveness of ballast water exchange over time was assessed by: (1) trends in densities and percent composition by ballast origin; (2) trends in ballast discharge and number of discharged coastal zooplankton for bulk carrier and tanker ship types; and (3) trends in densities and percent composition for three vessels sampled multiple times.
Trends in densities and percent composition by ballast origin
Further comparisons of un-exchanged and exchanged coastal zooplankton samples over time included: log density by Trans Pacific voyages; log density by West Coast voyages; percent composition by Trans Pacific voyages; and percent composition by West Coast voyages.
Results
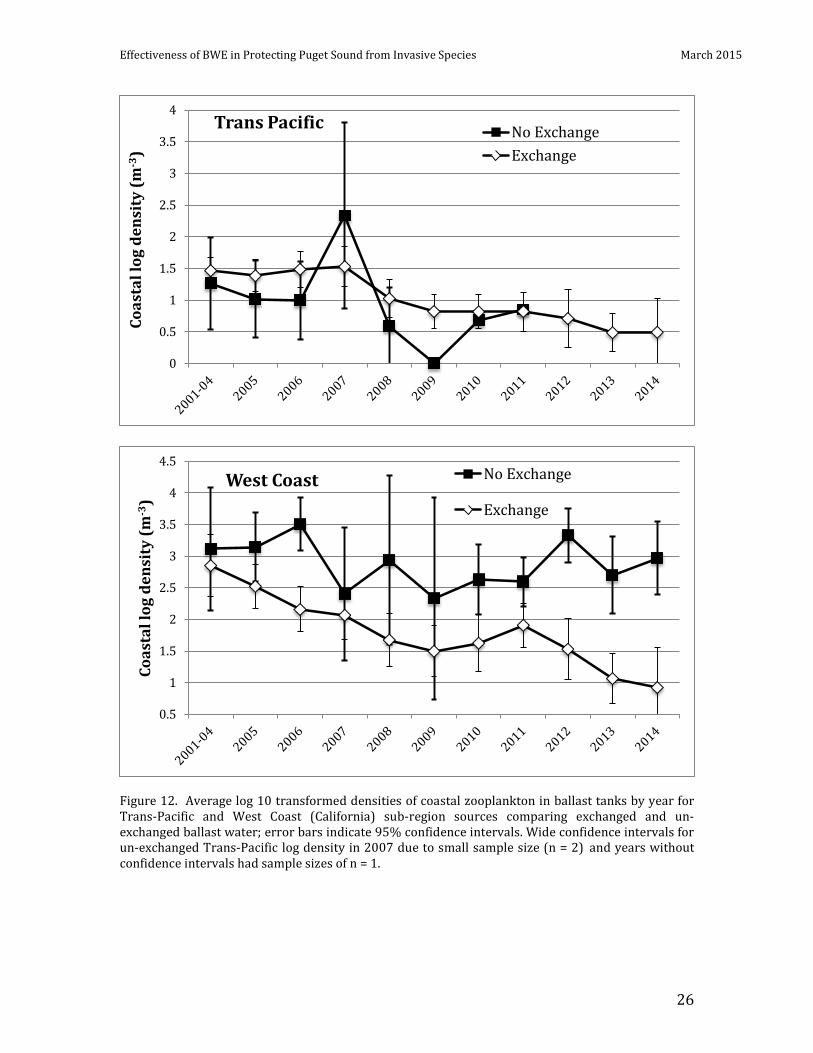
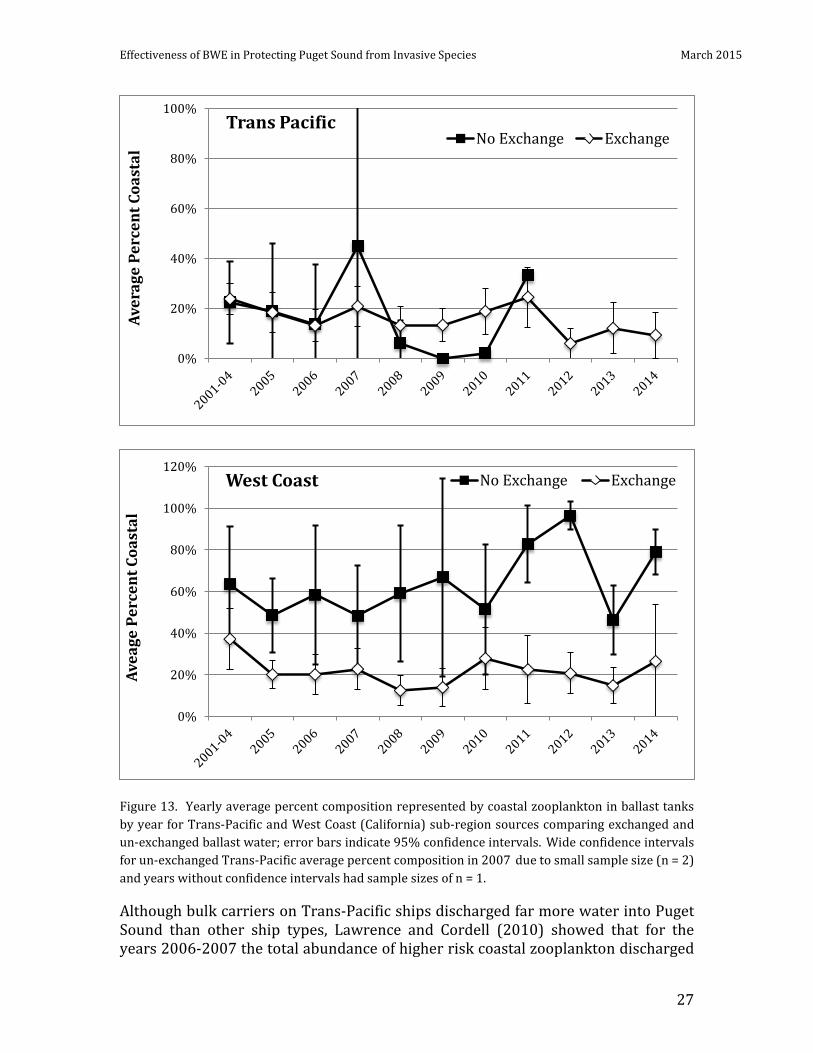
Densities of coastal and non-indigenous zooplankton in the ballast of ships reporting ballast water exchange declined between 2001 and 2014 for ships on both Trans-Pacific and West Coast (California) sub-region sources (Figure 12). In ballast water from West Coast region sources, densities before 2008 were significantly higher than those from after 2008. There were no differences among years in average percent composition represented by coastal zooplankton in either exchanged or un-exchanged ballast water from Trans Pacific and West Coast voyages (Figure 13). For West Coast voyages, both densities and percent compositions of coastal zooplankton were usually significantly lower in exchanged ballast water compared to un-exchanged ballast water. Densities and percent composition for Trans Pacific voyages are included, but sample sizes by year were very low resulting in no significant results and difficulty in interpreting the data. Years 2001-04 had the highest number samples with 12, with 2007 to 2011 ranging from 1 -5, and no un-exchanged samples outside of common waters were collected after 2011.
Effectiveness of BWE in Protecting Puget Sound from Invasive Species March 2015
26
Figure 12. Average log 10 transformed densities of coastal zooplankton in ballast tanks by year for Trans-Pacific and West Coast (California) sub-region sources comparing exchanged and un-exchanged ballast water; error bars indicate 95% confidence intervals. Wide confidence intervals for un-exchanged Trans-Pacific log density in 2007 due to small sample size (n = 2) and years without confidence intervals had sample sizes of n = 1.
0
0.5
1
1.5
2
2.5
3
3.5
4
Coas
tal l
og d
ensi
ty (m
-3)
Trans Pacific No ExchangeExchange
0.5
1
1.5
2
2.5
3
3.5
4
4.5
Coas
tal l
og d
ensi
ty (m
-3)
West Coast No Exchange
Exchange
Effectiveness of BWE in Protecting Puget Sound from Invasive Species March 2015
27
Figure 13. Yearly average percent composition represented by coastal zooplankton in ballast tanks by year for Trans-Pacific and West Coast (California) sub-region sources comparing exchanged and un-exchanged ballast water; error bars indicate 95% confidence intervals. Wide confidence intervals for un-exchanged Trans-Pacific average percent composition in 2007 due to small sample size (n = 2) and years without confidence intervals had sample sizes of n = 1.
Although bulk carriers on Trans-Pacific ships discharged far more water into Puget Sound than other ship types, Lawrence and Cordell (2010) showed that for the years 2006-2007 the total abundance of higher risk coastal zooplankton discharged
0%
20%
40%
60%
80%
100%
Aver
age
Perc
ent C
oast
al
Trans Pacific No Exchange Exchange
0%
20%
40%
60%
80%
100%
120%
Avea
ge P
erce
nt C
oast
al
West Coast No Exchange Exchange
Effectiveness of BWE in Protecting Puget Sound from Invasive Species March 2015
28
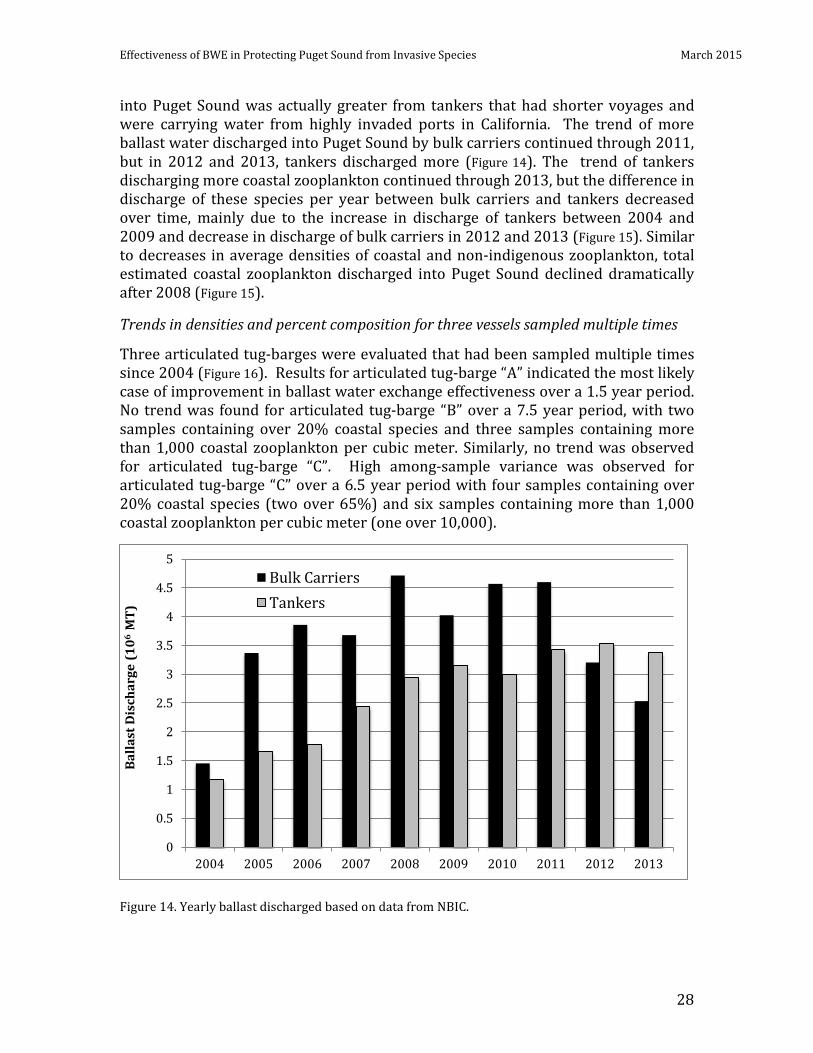
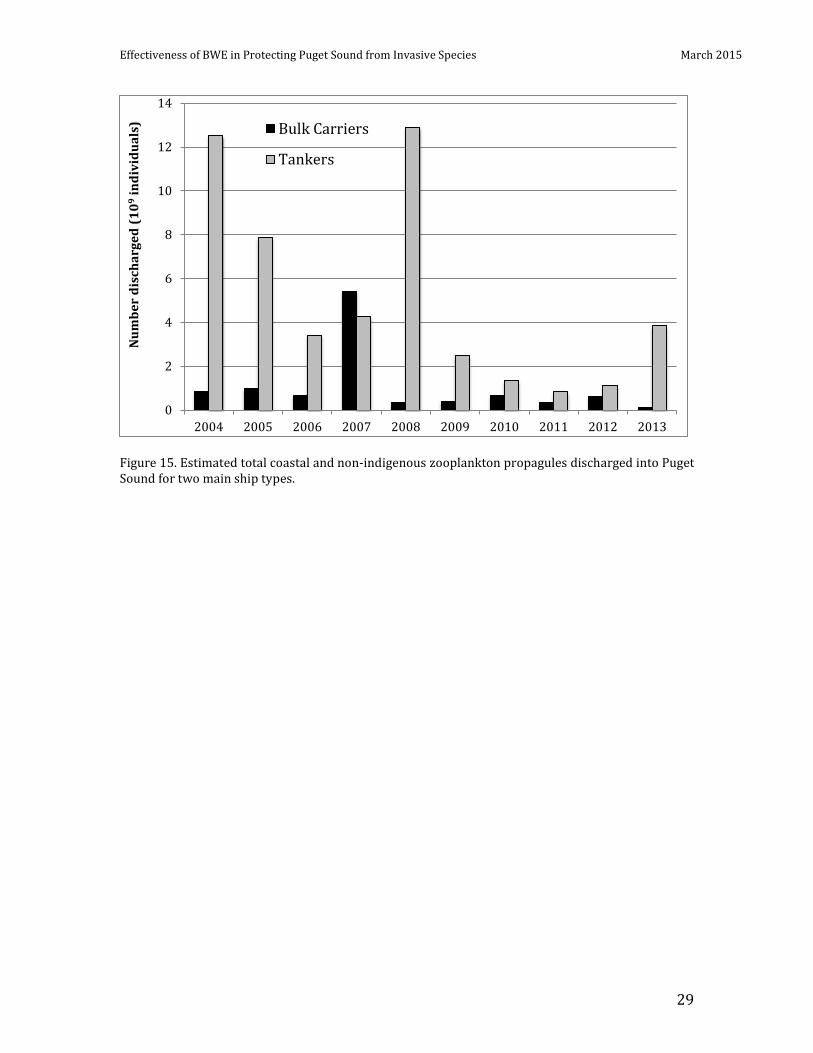
into Puget Sound was actually greater from tankers that had shorter voyages and were carrying water from highly invaded ports in California. The trend of more ballast water discharged into Puget Sound by bulk carriers continued through 2011, but in 2012 and 2013, tankers discharged more (Figure 14). The trend of tankers discharging more coastal zooplankton continued through 2013, but the difference in discharge of these species per year between bulk carriers and tankers decreased over time, mainly due to the increase in discharge of tankers between 2004 and 2009 and decrease in discharge of bulk carriers in 2012 and 2013 (Figure 15). Similar to decreases in average densities of coastal and non-indigenous zooplankton, total estimated coastal zooplankton discharged into Puget Sound declined dramatically after 2008 (Figure 15).
Trends in densities and percent composition for three vessels sampled multiple times
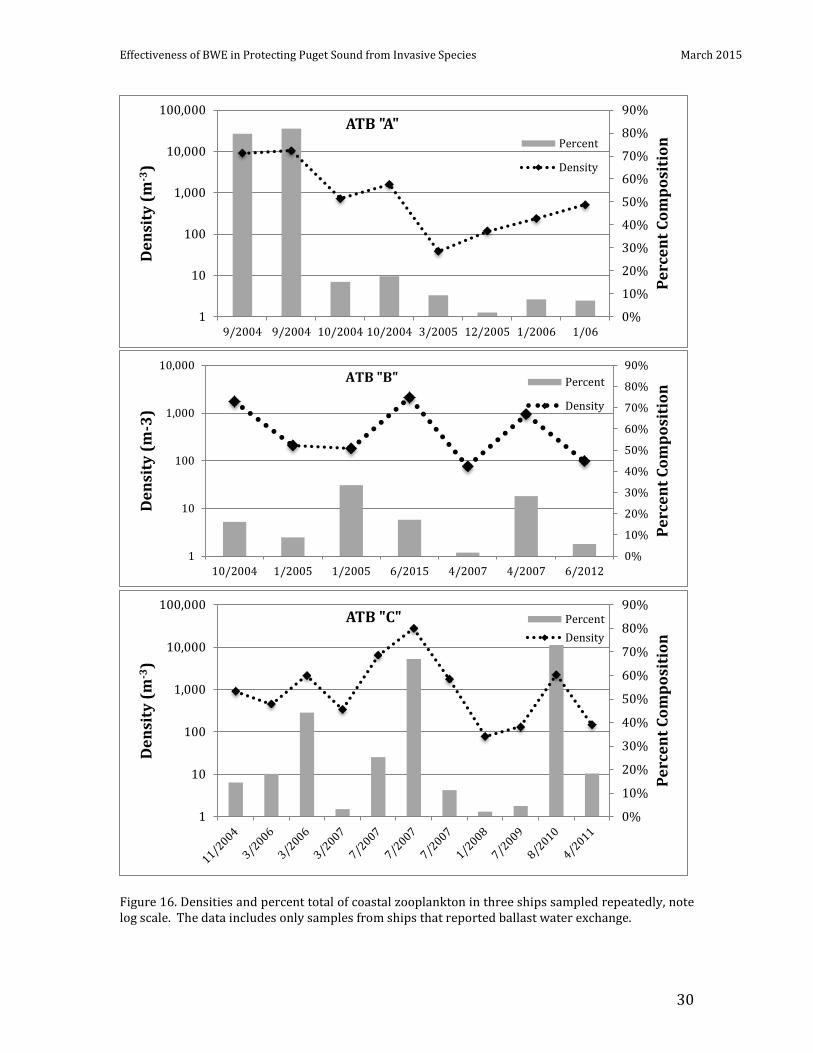
Three articulated tug-barges were evaluated that had been sampled multiple times since 2004 (Figure 16). Results for articulated tug-barge “A” indicated the most likely case of improvement in ballast water exchange effectiveness over a 1.5 year period. No trend was found for articulated tug-barge “B” over a 7.5 year period, with two samples containing over 20% coastal species and three samples containing more than 1,000 coastal zooplankton per cubic meter. Similarly, no trend was observed for articulated tug-barge “C”. High among-sample variance was observed for articulated tug-barge “C” over a 6.5 year period with four samples containing over 20% coastal species (two over 65%) and six samples containing more than 1,000 coastal zooplankton per cubic meter (one over 10,000).
Figure 14. Yearly ballast discharged based on data from NBIC.
0
0.5
1
1.5
2
2.5
3
3.5
4
4.5
5
2004 2005 2006 2007 2008 2009 2010 2011 2012 2013
Balla
st D
isch
arge
(106
MT)
Bulk CarriersTankers
Effectiveness of BWE in Protecting Puget Sound from Invasive Species March 2015
29
Figure 15. Estimated total coastal and non-indigenous zooplankton propagules discharged into Puget Sound for two main ship types.
0
2
4
6
8
10
12
14
2004 2005 2006 2007 2008 2009 2010 2011 2012 2013
Num
ber
disc
harg
ed (1
09 ind
ivid
uals
) Bulk Carriers
Tankers
Effectiveness of BWE in Protecting Puget Sound from Invasive Species March 2015
30
Figure 16. Densities and percent total of coastal zooplankton in three ships sampled repeatedly, note log scale. The data includes only samples from ships that reported ballast water exchange.
0%
10%
20%
30%
40%
50%
60%
70%
80%
90%
1
10
100
1,000
10,000
100,000
9/2004 9/2004 10/2004 10/2004 3/2005 12/2005 1/2006 1/06
Perc
ent C
ompo
siti
on
Den
sity
(m-3
) ATB "A"
Percent
Density
0%
10%
20%
30%
40%
50%
60%
70%
80%
90%
1
10
100
1,000
10,000
10/2004 1/2005 1/2005 6/2015 4/2007 4/2007 6/2012
Perc
ent C
ompo
siti
on
Den
sity
(m-3
)
ATB "B" Percent
Density
0%
10%
20%
30%
40%
50%
60%
70%
80%
90%
1
10
100
1,000
10,000
100,000
Perc
ent C
ompo
siti
on
Den
sity
(m-3
)
ATB "C" PercentDensity
Effectiveness of BWE in Protecting Puget Sound from Invasive Species March 2015
31
Discussion
In Washington State, overall ballast water management compliance has steadily increased after institution of WDFW ship inspections, review of ballasting records, collecting samples from ballast tanks for zooplankton analysis, and an increased awareness by vessel operators regarding ballast water management efforts at local, international, and federal levels. These improvements are reflected in factors ranging from increases in timely submission of the vessel’s ballast water reporting form to reductions in the volume of discharged un-exchanged water (PSAT 2007; WDFW monthly compliance reports to BWWG). Effectiveness of ballast water exchange also appears to have increased over the course of this study, with a reduction in densities of coastal species and non-indigenous zooplankton in ballast water samples, indicating that the risk of non-indigenous zooplankton introductions has also decreased.
Results from sampling the same vessel multiple times do not indicate that multiple sampling in itself is an effective management tool to improve ballast water exchange effectiveness. The presence in a single sample of high densities and percent composition of coastal species may instead indicate either poor tank design limitations, environmental factors due to source or exchange area zooplankton densities, or non-compliant exchange management.
For ballast water exchange or ballast water treatment to significantly reduce the risk of new invasions, all viable non-indigenous organisms must be reduced below a critical threshold. Over the past decade, thresholds for different size classes of organisms have been extensively discussed, resulting in discharge standards being established by various regulatory bodies. For example, IMO and U.S. federal government ballast treatment performance standards for zooplankton greater than 50 microns mandate that numbers be reduced to less than 10 per cubic meter, while the state of California standards are more stringent, allowing for no viable organisms in this size class (Scianni et al. 2013). While it is expected that exchange will be replaced by ballast treatment systems in the near future, such systems may not be in wide use for some time, and regulatory agencies such as WDFW are interested in exchange effectiveness. In both models and controlled experiments, it has been shown that exchange can be very effective in replacing potential invaders with less risky oceanic species, and in this study, many ships that conducted exchange had less than 10 coastal organisms per cubic meter. However, although exchange reduces the number of coastal and non-indigenous species, it does not eliminate them altogether, and ultimately it may not be possible to meet ballast water discharge standards using ballast water exchange.
Non-Indigenous Zooplankton in Ballast Water and in Puget Sound
Results
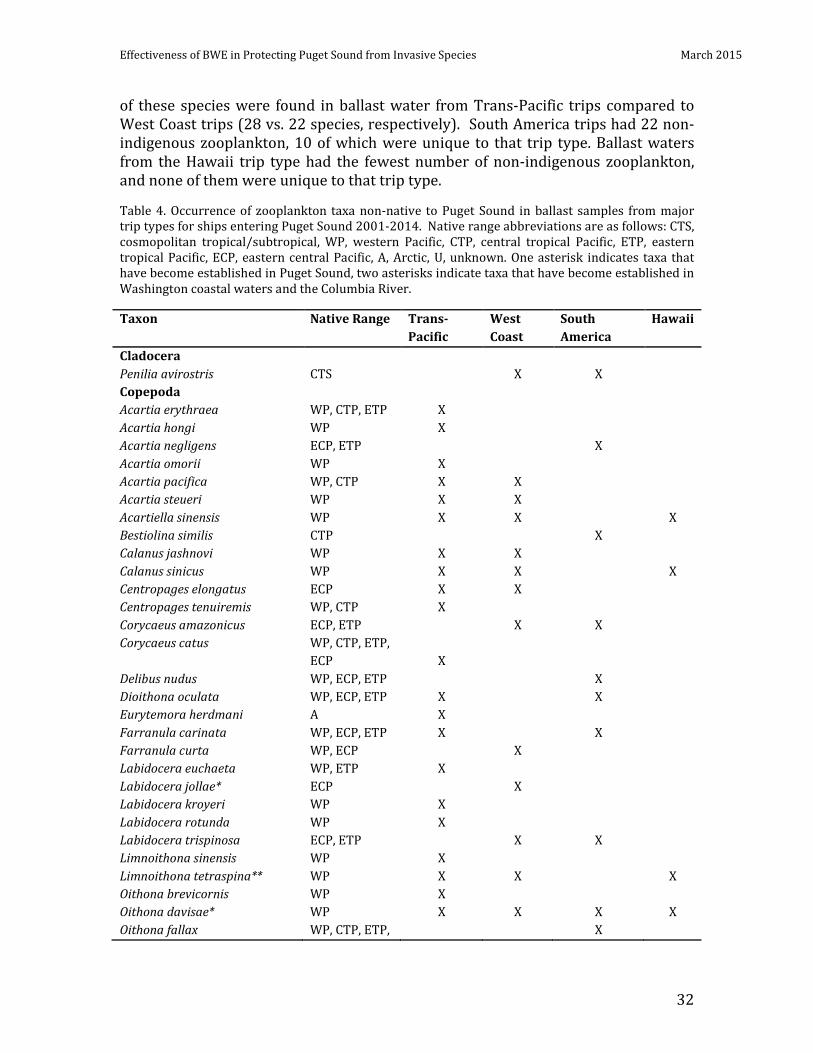
A total of 55 species of zooplankton known to be non-indigenous to Puget Sound were found in ship’s ballast during this study (Table 4). As in previous studies, more
Effectiveness of BWE in Protecting Puget Sound from Invasive Species March 2015
32
of these species were found in ballast water from Trans-Pacific trips compared to West Coast trips (28 vs. 22 species, respectively). South America trips had 22 non-indigenous zooplankton, 10 of which were unique to that trip type. Ballast waters from the Hawaii trip type had the fewest number of non-indigenous zooplankton, and none of them were unique to that trip type.
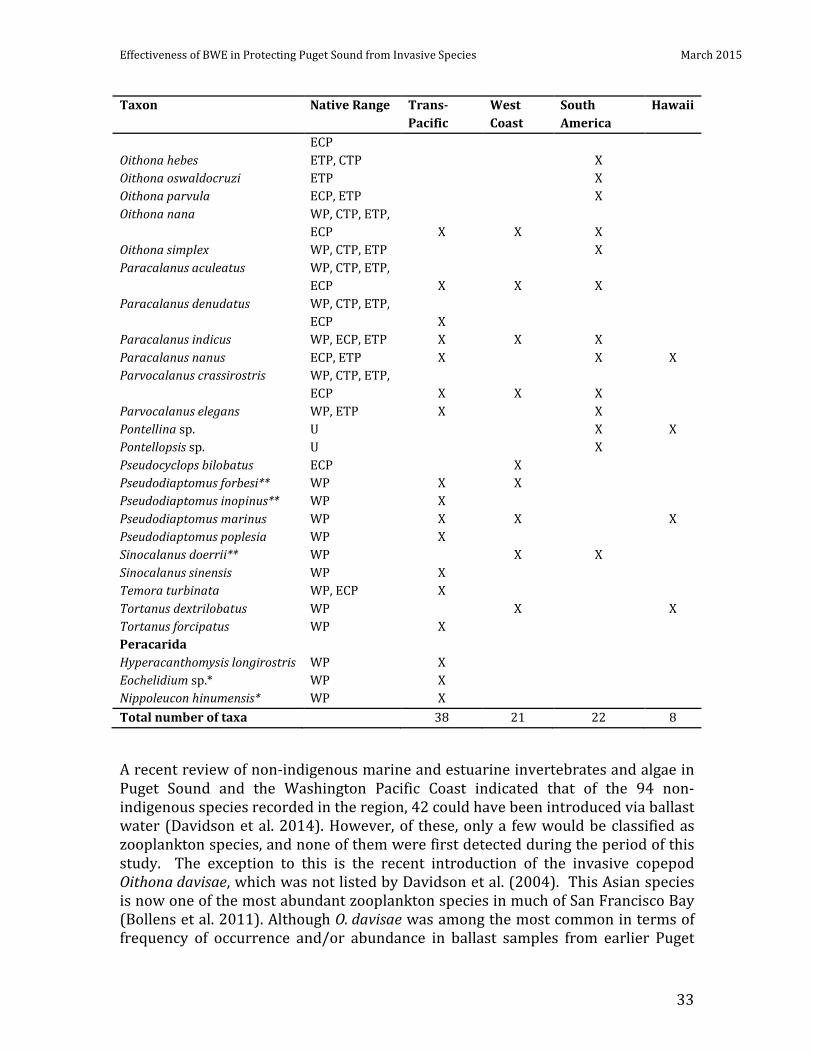
Table 4. Occurrence of zooplankton taxa non-native to Puget Sound in ballast samples from major trip types for ships entering Puget Sound 2001-2014. Native range abbreviations are as follows: CTS, cosmopolitan tropical/subtropical, WP, western Pacific, CTP, central tropical Pacific, ETP, eastern tropical Pacific, ECP, eastern central Pacific, A, Arctic, U, unknown. One asterisk indicates taxa that have become established in Puget Sound, two asterisks indicate taxa that have become established in Washington coastal waters and the Columbia River.
Taxon Native Range Trans-Pacific
West Coast
South America
Hawaii
Cladocera Penilia avirostris CTS X X Copepoda Acartia erythraea WP, CTP, ETP X Acartia hongi WP X Acartia negligens ECP, ETP X Acartia omorii WP X Acartia pacifica WP, CTP X X Acartia steueri WP X X Acartiella sinensis WP X X X Bestiolina similis CTP X Calanus jashnovi WP X X Calanus sinicus WP X X X Centropages elongatus ECP X X Centropages tenuiremis WP, CTP X Corycaeus amazonicus ECP, ETP X X Corycaeus catus WP, CTP, ETP,
ECP X Delibus nudus WP, ECP, ETP X Dioithona oculata WP, ECP, ETP X X Eurytemora herdmani A X Farranula carinata WP, ECP, ETP X X Farranula curta WP, ECP X Labidocera euchaeta WP, ETP X Labidocera jollae* ECP X Labidocera kroyeri WP X Labidocera rotunda WP X Labidocera trispinosa ECP, ETP X X Limnoithona sinensis WP X Limnoithona tetraspina** WP X X X Oithona brevicornis WP X Oithona davisae* WP X X X X Oithona fallax WP, CTP, ETP, X
Effectiveness of BWE in Protecting Puget Sound from Invasive Species March 2015
33
Taxon Native Range Trans-Pacific
West Coast
South America
Hawaii
ECP Oithona hebes ETP, CTP X Oithona oswaldocruzi ETP X Oithona parvula ECP, ETP X Oithona nana WP, CTP, ETP,
ECP X X X Oithona simplex WP, CTP, ETP X Paracalanus aculeatus WP, CTP, ETP,
ECP X X X Paracalanus denudatus WP, CTP, ETP,
ECP X Paracalanus indicus WP, ECP, ETP X X X Paracalanus nanus ECP, ETP X X X Parvocalanus crassirostris WP, CTP, ETP,
ECP X X X Parvocalanus elegans WP, ETP X X Pontellina sp. U X X Pontellopsis sp. U X Pseudocyclops bilobatus ECP X Pseudodiaptomus forbesi** WP X X Pseudodiaptomus inopinus** WP X Pseudodiaptomus marinus WP X X X Pseudodiaptomus poplesia WP X Sinocalanus doerrii** WP X X Sinocalanus sinensis WP X Temora turbinata WP, ECP X Tortanus dextrilobatus WP X X Tortanus forcipatus WP X Peracarida Hyperacanthomysis longirostris WP X Eochelidium sp.* WP X Nippoleucon hinumensis* WP X Total number of taxa 38 21 22 8
A recent review of non-indigenous marine and estuarine invertebrates and algae in Puget Sound and the Washington Pacific Coast indicated that of the 94 non-indigenous species recorded in the region, 42 could have been introduced via ballast water (Davidson et al. 2014). However, of these, only a few would be classified as zooplankton species, and none of them were first detected during the period of this study. The exception to this is the recent introduction of the invasive copepod Oithona davisae, which was not listed by Davidson et al. (2004). This Asian species is now one of the most abundant zooplankton species in much of San Francisco Bay (Bollens et al. 2011). Although O. davisae was among the most common in terms of frequency of occurrence and/or abundance in ballast samples from earlier Puget
Effectiveness of BWE in Protecting Puget Sound from Invasive Species March 2015
34
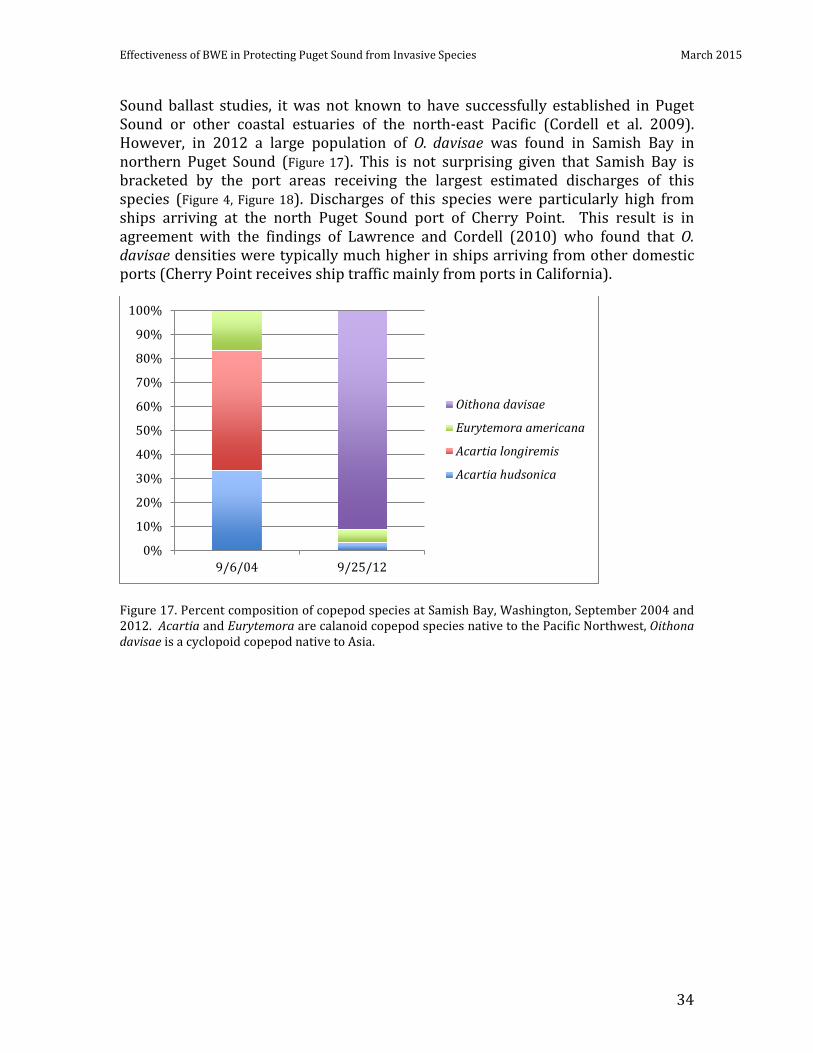
Sound ballast studies, it was not known to have successfully established in Puget Sound or other coastal estuaries of the north-east Pacific (Cordell et al. 2009). However, in 2012 a large population of O. davisae was found in Samish Bay in northern Puget Sound (Figure 17). This is not surprising given that Samish Bay is bracketed by the port areas receiving the largest estimated discharges of this species (Figure 4, Figure 18). Discharges of this species were particularly high from ships arriving at the north Puget Sound port of Cherry Point. This result is in agreement with the findings of Lawrence and Cordell (2010) who found that O. davisae densities were typically much higher in ships arriving from other domestic ports (Cherry Point receives ship traffic mainly from ports in California).
Figure 17. Percent composition of copepod species at Samish Bay, Washington, September 2004 and 2012. Acartia and Eurytemora are calanoid copepod species native to the Pacific Northwest, Oithona davisae is a cyclopoid copepod native to Asia.
0%
10%
20%
30%
40%
50%
60%
70%
80%
90%
100%
9/6/04 9/25/12
Oithona davisae
Eurytemora americana
Acartia longiremis
Acartia hudsonica
Effectiveness of BWE in Protecting Puget Sound from Invasive Species March 2015
35
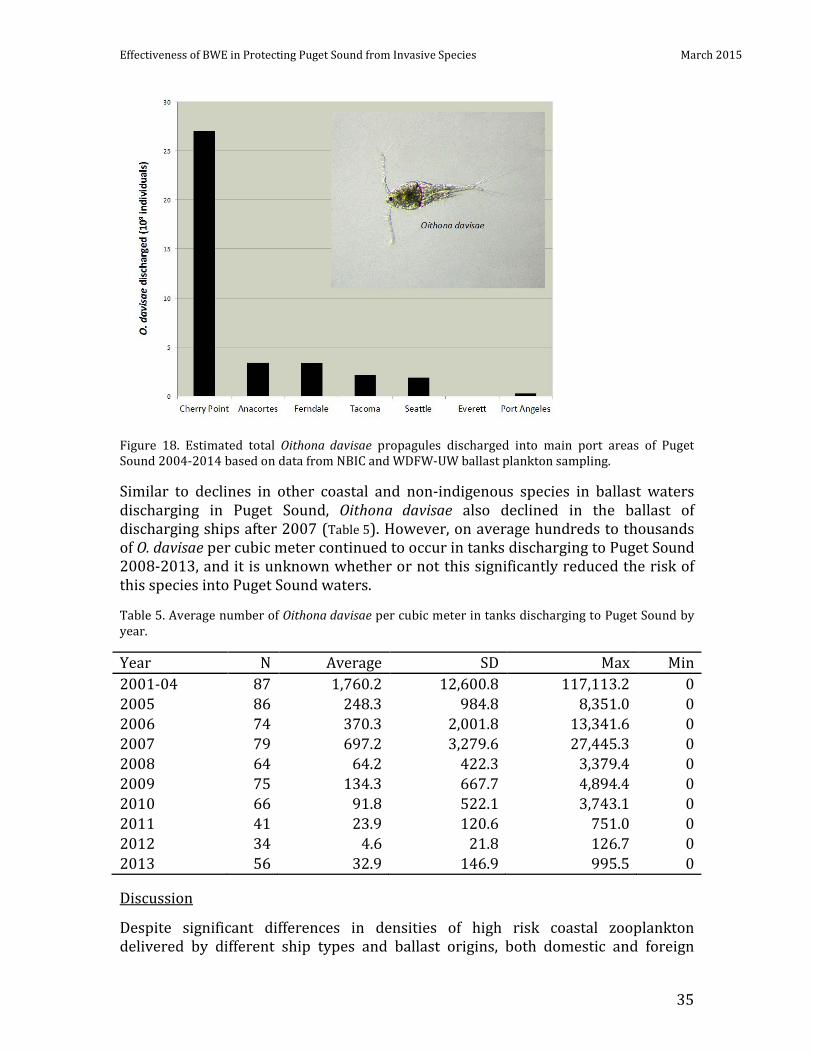
Figure 18. Estimated total Oithona davisae propagules discharged into main port areas of Puget Sound 2004-2014 based on data from NBIC and WDFW-UW ballast plankton sampling.
Similar to declines in other coastal and non-indigenous species in ballast waters discharging in Puget Sound, Oithona davisae also declined in the ballast of discharging ships after 2007 (Table 5). However, on average hundreds to thousands of O. davisae per cubic meter continued to occur in tanks discharging to Puget Sound 2008-2013, and it is unknown whether or not this significantly reduced the risk of this species into Puget Sound waters.
Table 5. Average number of Oithona davisae per cubic meter in tanks discharging to Puget Sound by year.
Year N Average SD Max Min 2001-04 87 1,760.2 12,600.8 117,113.2 0 2005 86 248.3 984.8 8,351.0 0 2006 74 370.3 2,001.8 13,341.6 0 2007 79 697.2 3,279.6 27,445.3 0 2008 64 64.2 422.3 3,379.4 0 2009 75 134.3 667.7 4,894.4 0 2010 66 91.8 522.1 3,743.1 0 2011 41 23.9 120.6 751.0 0 2012 34 4.6 21.8 126.7 0 2013 56 32.9 146.9 995.5 0
Discussion
Despite significant differences in densities of high risk coastal zooplankton delivered by different ship types and ballast origins, both domestic and foreign
Effectiveness of BWE in Protecting Puget Sound from Invasive Species March 2015
36
routes can be considered vectors of introduction for non-indigenous zooplankton. Domestic sourced ballast waters had higher densities of non-indigenous zooplankton, while those from foreign sources had more non-indigenous zooplankton diversity. This had previously been shown for West Coast vs. Trans-Pacific sources, and in this study we found it to be true for South America voyages as well, which contained 10 unique species that are not indigenous to Puget Sound. Thus, ballast discharged from ships on intra-coastal routes is more likely to introduce species that are already established elsewhere on the West Coast of the United States, while ballast from ships on trans-oceanic and South American routes may result in more primary (i.e. new) introductions.
The invasion of Puget Sound waters by Oithona davisae is of concern because it is smaller in size compared to native calanoid copepods. In addition to smaller size, the family containing O. davisae (Oithonidae) also differ from calanoids in terms of their mode of swimming and their predator escape responses and Bouley and Kimmerer (2006) hypothesized that these attributes might reduce the susceptibility of oithonids to visual predators, specifically juvenile fish, compared with calanoids. Purcell et al. (Purcell et al., 2007) suggested that a plankton community dominated by smaller copepods might be detrimental to visual predators like fish and beneficial to non-visual predators, such as jellyfish.
To understand if ballast water management or any other non-indigenous species reduction effort reduces the risk of new non-indigenous species becoming established, more needs to be known about how often new non-indigenous species successfully invade the receiving ecosystem. While the results of this and similar studies can offer valuable information (e.g. on ballast management effects on ballast risk), such data will be much more useful for predicting and understanding future invasions when integrated with information on the ambient environment. For example, periodic surveys of Puget Sound biota would provide information on the rates and sources of new non-indigenous species invasions. Ballast water-introduced non-indigenous species continue to appear in Puget Sound and other waters of Washington State, the recent establishment of the Asian copepod Oithona davisae being a case in point. Climate change and other environmental perturbations may further change the dynamics of new species introductions. For example, another copepod, Labidocera jollae, that has a native range in near shore waters from Cape Mendocino, California to the Gulf of California, Mexico, has recently been found in Hood Canal, Washington (J. Cordell, unpublished) and was also recorded in this study from ballast waters sourced in California (Table 4). This warm water, surface dwelling copepod may be able to successfully colonize surface waters of Hood Canal because of warm water temperatures and/or low dissolved oxygen in deeper waters there.
Ballast Water Exchange as a Management Tool
The results presented in this report indicate that the majority of vessels conducting ballast water exchanges discharge low densities of coastal zooplankton into Puget Sound. A significant number of vessels, however, discharge potentially high risk
Effectiveness of BWE in Protecting Puget Sound from Invasive Species March 2015
37
ballast water due to poor exchange efficacy (ballast tank design limitations), non-compliant exchange management, or environmental factors beyond the vessel’s control. The two main variables used in this report to determine exchange effectiveness are percent composition and density per cubic meter (m3) of coastal zooplankton.
Results indicated that ballast water exchange effectiveness improved after 2008, and the following analysis focuses on post-2008 data (283 samples). In order to fulfill the Program mandate to identify and list high risk vessels as defined by WAC 020-150-035, we conducted an analysis in four parts: (1) the relationship between percent composition and density; (2) identification of threshold percent composition and density values; (3) application of threshold values for identification of higher risk samples; and (4) application of a method to identify low, moderate, and high priority vessels for management; and (5) assessment of environmental factors that may affect percent composition and density values.
Relationship between percent composition and density
A regression analysis between percent composition and density in coastal zooplankton for exchanged samples taken between 2009 and 2014 was applied to determine relationships helpful in evaluating risk.
Results
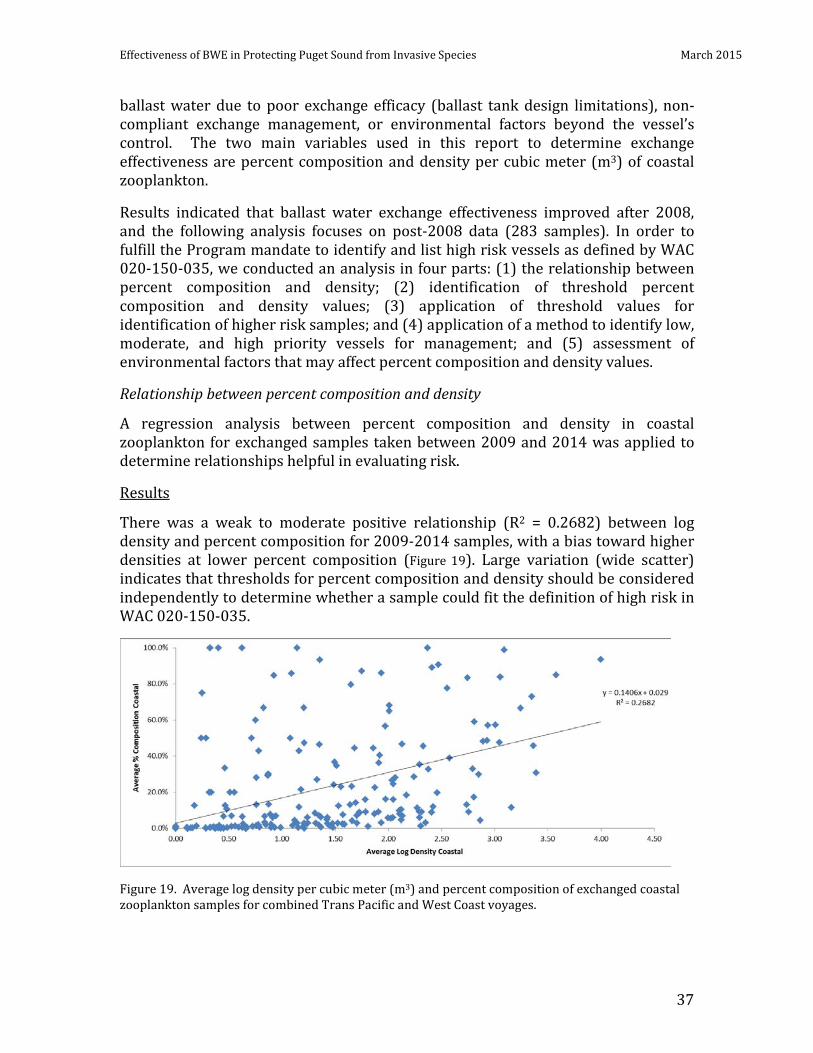
There was a weak to moderate positive relationship (R2 = 0.2682) between log density and percent composition for 2009-2014 samples, with a bias toward higher densities at lower percent composition (Figure 19). Large variation (wide scatter) indicates that thresholds for percent composition and density should be considered independently to determine whether a sample could fit the definition of high risk in WAC 020-150-035.
Figure 19. Average log density per cubic meter (m3) and percent composition of exchanged coastal zooplankton samples for combined Trans Pacific and West Coast voyages.
Effectiveness of BWE in Protecting Puget Sound from Invasive Species March 2015
38
Identification of threshold percent composition and density values
Average and upper 95% confidence interval values for percent composition and density were applied consistent with their previous use in this report to place samples in the higher risk category. These values are presented for different voyage types, and analyses were conducted over the aggregate 2009-2014 period and evaluated to identify these thresholds. An aggregate time period was used because variability among years was high (see Figures 12 and 13).
Results
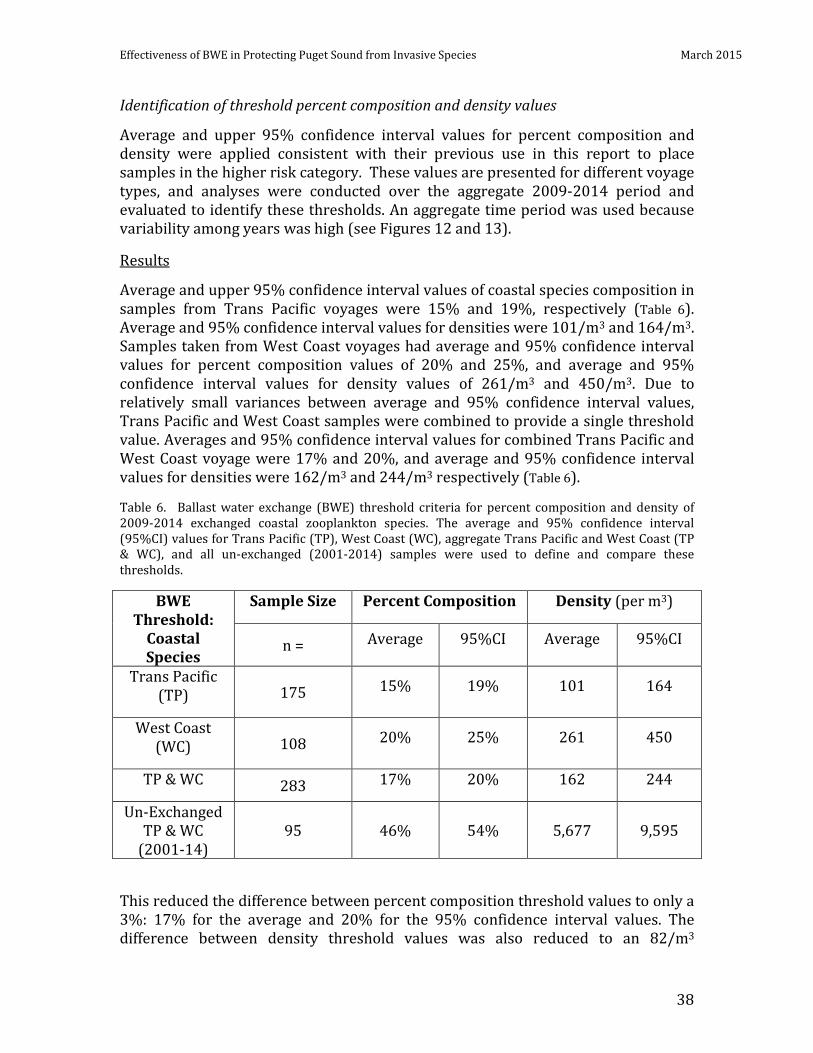
Average and upper 95% confidence interval values of coastal species composition in samples from Trans Pacific voyages were 15% and 19%, respectively (Table 6). Average and 95% confidence interval values for densities were 101/m3 and 164/m3. Samples taken from West Coast voyages had average and 95% confidence interval values for percent composition values of 20% and 25%, and average and 95% confidence interval values for density values of 261/m3 and 450/m3. Due to relatively small variances between average and 95% confidence interval values, Trans Pacific and West Coast samples were combined to provide a single threshold value. Averages and 95% confidence interval values for combined Trans Pacific and West Coast voyage were 17% and 20%, and average and 95% confidence interval values for densities were 162/m3 and 244/m3 respectively (Table 6).
Table 6. Ballast water exchange (BWE) threshold criteria for percent composition and density of 2009-2014 exchanged coastal zooplankton species. The average and 95% confidence interval (95%CI) values for Trans Pacific (TP), West Coast (WC), aggregate Trans Pacific and West Coast (TP & WC), and all un-exchanged (2001-2014) samples were used to define and compare these thresholds.
BWE Threshold:
Coastal Species
Sample Size Percent Composition Density (per m3)
n = Average 95%CI Average 95%CI
Trans Pacific (TP) 175 15% 19% 101 164
West Coast (WC) 108 20% 25% 261 450
TP & WC 283 17% 20% 162 244
Un-Exchanged TP & WC
(2001-14) 95 46% 54% 5,677 9,595
This reduced the difference between percent composition threshold values to only a 3%: 17% for the average and 20% for the 95% confidence interval values. The difference between density threshold values was also reduced to an 82/m3
Effectiveness of BWE in Protecting Puget Sound from Invasive Species March 2015
39
difference: 162/m3 for the average and 244/m3 for the 95% confidence interval values. All exchanged values are significantly lower than un-exchanged values.
Application of threshold values for identification of higher risk samples
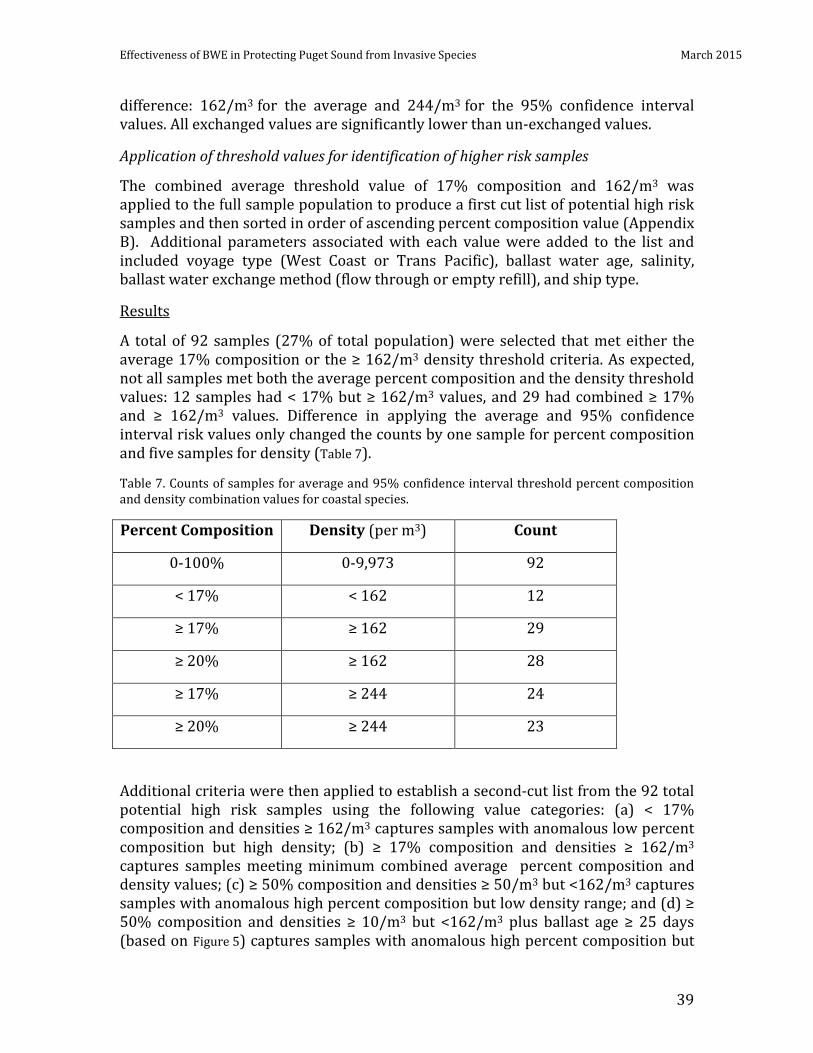
The combined average threshold value of 17% composition and 162/m3 was applied to the full sample population to produce a first cut list of potential high risk samples and then sorted in order of ascending percent composition value (Appendix B). Additional parameters associated with each value were added to the list and included voyage type (West Coast or Trans Pacific), ballast water age, salinity, ballast water exchange method (flow through or empty refill), and ship type.
Results
A total of 92 samples (27% of total population) were selected that met either the average 17% composition or the ≥ 162/m3 density threshold criteria. As expected, not all samples met both the average percent composition and the density threshold values: 12 samples had < 17% but ≥ 162/m3 values, and 29 had combined ≥ 17% and ≥ 162/m3 values. Difference in applying the average and 95% confidence interval risk values only changed the counts by one sample for percent composition and five samples for density (Table 7).
Table 7. Counts of samples for average and 95% confidence interval threshold percent composition and density combination values for coastal species.
Percent Composition Density (per m3) Count
0-100% 0-9,973 92
< 17% < 162 12
≥ 17% ≥ 162 29
≥ 20% ≥ 162 28
≥ 17% ≥ 244 24
≥ 20% ≥ 244 23
Additional criteria were then applied to establish a second-cut list from the 92 total potential high risk samples using the following value categories: (a) < 17% composition and densities ≥ 162/m3 captures samples with anomalous low percent composition but high density; (b) ≥ 17% composition and densities ≥ 162/m3 captures samples meeting minimum combined average percent composition and density values; (c) ≥ 50% composition and densities ≥ 50/m3 but <162/m3 captures samples with anomalous high percent composition but low density range; and (d) ≥ 50% composition and densities ≥ 10/m3 but <162/m3 plus ballast age ≥ 25 days (based on Figure 5) captures samples with anomalous high percent composition but
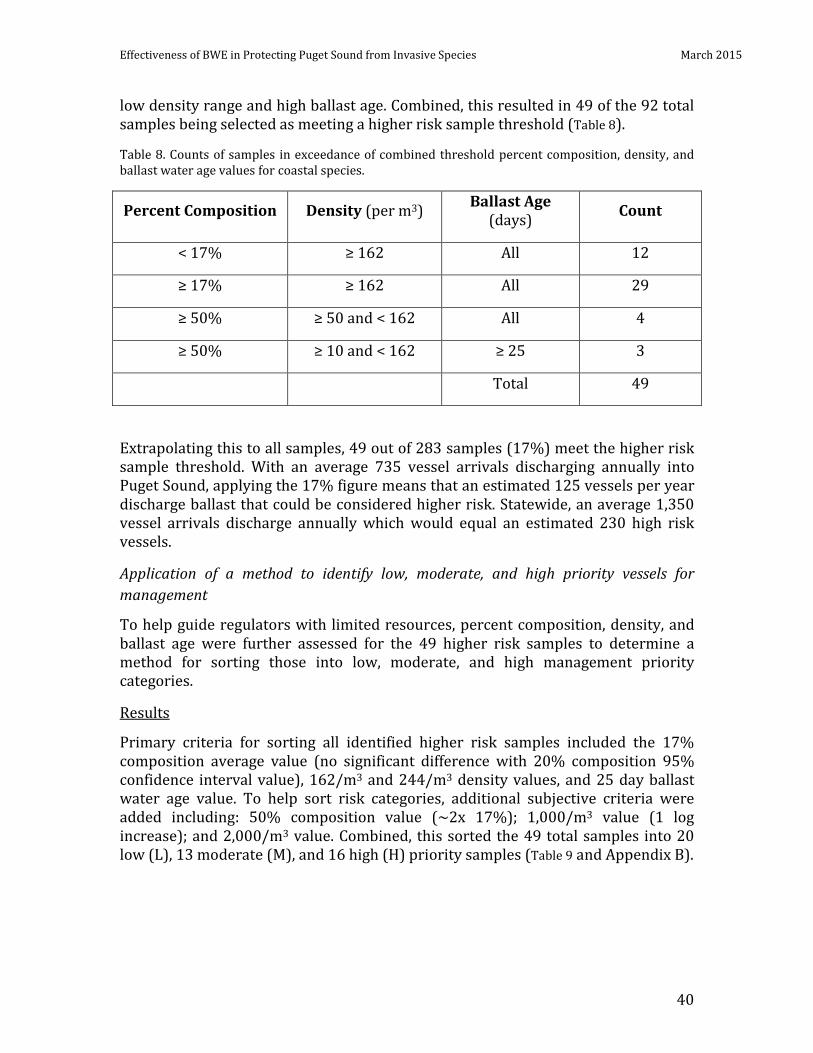
Effectiveness of BWE in Protecting Puget Sound from Invasive Species March 2015
40
low density range and high ballast age. Combined, this resulted in 49 of the 92 total samples being selected as meeting a higher risk sample threshold (Table 8).
Table 8. Counts of samples in exceedance of combined threshold percent composition, density, and ballast water age values for coastal species.
Percent Composition Density (per m3) Ballast Age (days) Count
< 17% ≥ 162 All 12
≥ 17% ≥ 162 All 29
≥ 50% ≥ 50 and < 162 All 4
≥ 50% ≥ 10 and < 162 ≥ 25 3
Total 49
Extrapolating this to all samples, 49 out of 283 samples (17%) meet the higher risk sample threshold. With an average 735 vessel arrivals discharging annually into Puget Sound, applying the 17% figure means that an estimated 125 vessels per year discharge ballast that could be considered higher risk. Statewide, an average 1,350 vessel arrivals discharge annually which would equal an estimated 230 high risk vessels.
Application of a method to identify low, moderate, and high priority vessels for management
To help guide regulators with limited resources, percent composition, density, and ballast age were further assessed for the 49 higher risk samples to determine a method for sorting those into low, moderate, and high management priority categories.
Results
Primary criteria for sorting all identified higher risk samples included the 17% composition average value (no significant difference with 20% composition 95% confidence interval value), 162/m3 and 244/m3 density values, and 25 day ballast water age value. To help sort risk categories, additional subjective criteria were added including: 50% composition value (~2x 17%); 1,000/m3 value (1 log increase); and 2,000/m3 value. Combined, this sorted the 49 total samples into 20 low (L), 13 moderate (M), and 16 high (H) priority samples (Table 9 and Appendix B).
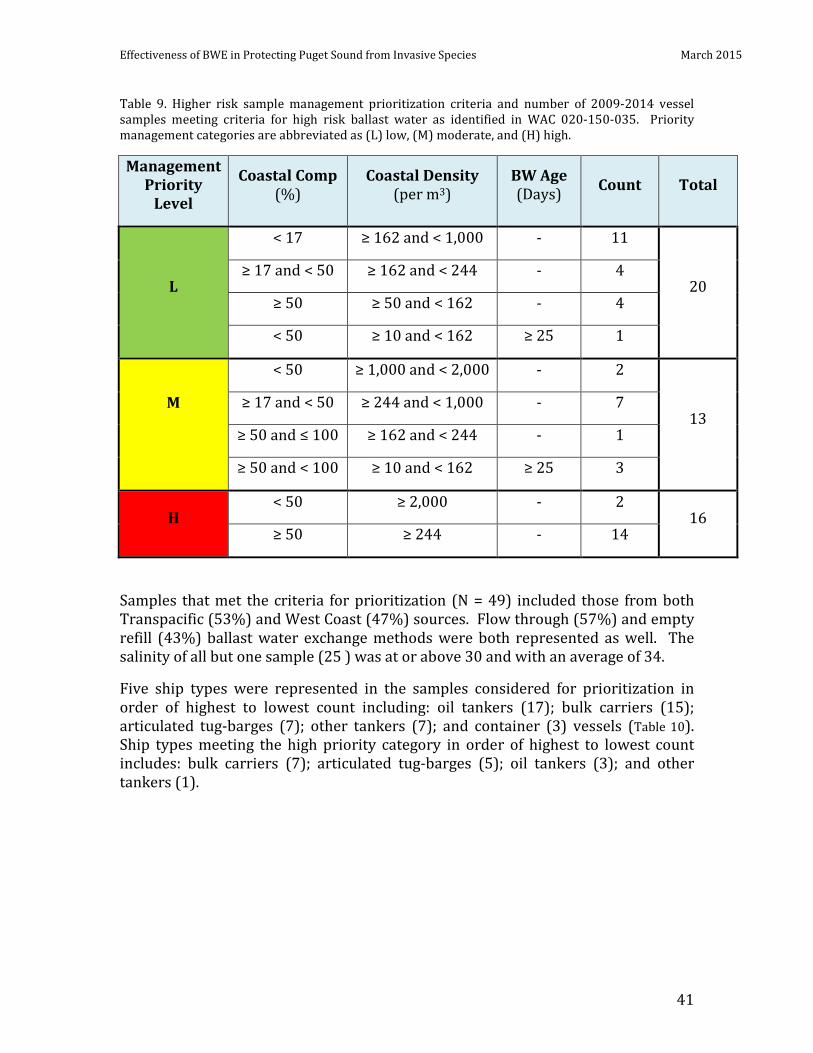
Effectiveness of BWE in Protecting Puget Sound from Invasive Species March 2015
41
Table 9. Higher risk sample management prioritization criteria and number of 2009-2014 vessel samples meeting criteria for high risk ballast water as identified in WAC 020-150-035. Priority management categories are abbreviated as (L) low, (M) moderate, and (H) high.
Management Priority
Level
Coastal Comp (%)
Coastal Density (per m3)
BW Age (Days) Count Total
L
< 17 ≥ 162 and < 1,000 - 11
20 ≥ 17 and < 50 ≥ 162 and < 244 - 4
≥ 50 ≥ 50 and < 162 - 4
< 50 ≥ 10 and < 162 ≥ 25 1
M
< 50 ≥ 1,000 and < 2,000 - 2
13 ≥ 17 and < 50 ≥ 244 and < 1,000 - 7
≥ 50 and ≤ 100 ≥ 162 and < 244 - 1
≥ 50 and < 100 ≥ 10 and < 162 ≥ 25 3
H < 50 ≥ 2,000 - 2
16 ≥ 50 ≥ 244 - 14
Samples that met the criteria for prioritization (N = 49) included those from both Transpacific (53%) and West Coast (47%) sources. Flow through (57%) and empty refill (43%) ballast water exchange methods were both represented as well. The salinity of all but one sample (25 ) was at or above 30 and with an average of 34.
Five ship types were represented in the samples considered for prioritization in order of highest to lowest count including: oil tankers (17); bulk carriers (15); articulated tug-barges (7); other tankers (7); and container (3) vessels (Table 10). Ship types meeting the high priority category in order of highest to lowest count includes: bulk carriers (7); articulated tug-barges (5); oil tankers (3); and other tankers (1).
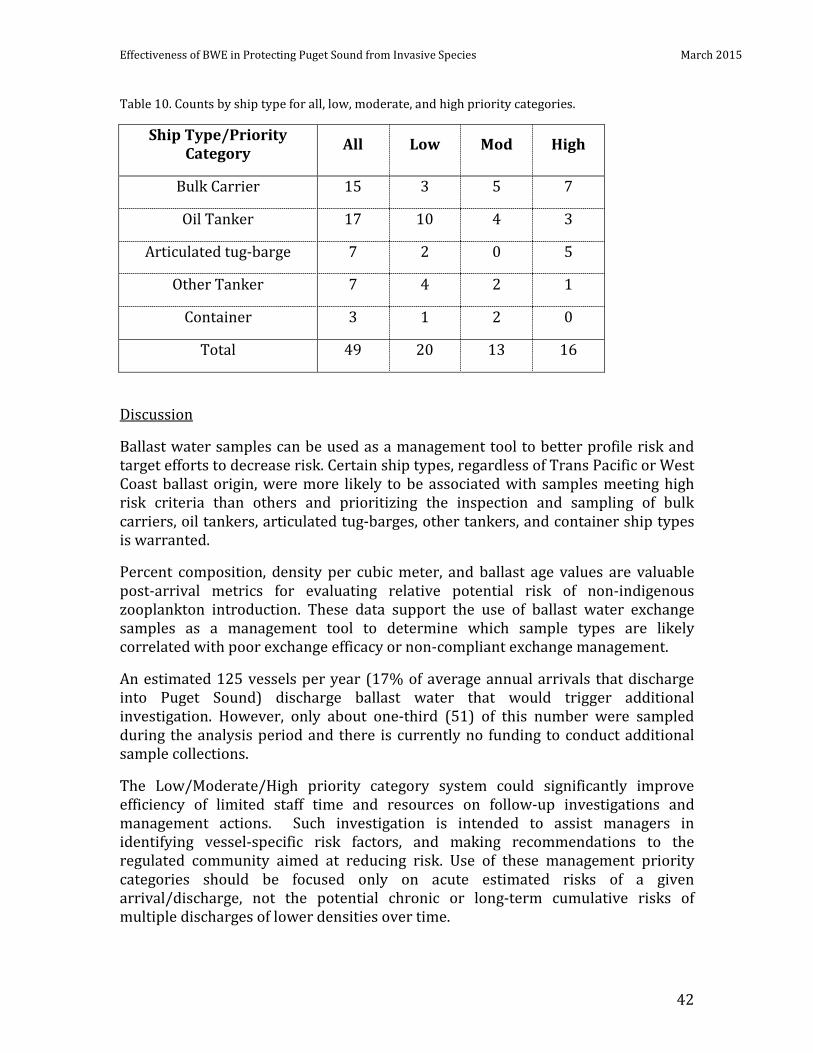
Effectiveness of BWE in Protecting Puget Sound from Invasive Species March 2015
42
Table 10. Counts by ship type for all, low, moderate, and high priority categories.
Ship Type/Priority Category All Low Mod High
Bulk Carrier 15 3 5 7
Oil Tanker 17 10 4 3
Articulated tug-barge 7 2 0 5
Other Tanker 7 4 2 1
Container 3 1 2 0
Total 49 20 13 16
Discussion
Ballast water samples can be used as a management tool to better profile risk and target efforts to decrease risk. Certain ship types, regardless of Trans Pacific or West Coast ballast origin, were more likely to be associated with samples meeting high risk criteria than others and prioritizing the inspection and sampling of bulk carriers, oil tankers, articulated tug-barges, other tankers, and container ship types is warranted.
Percent composition, density per cubic meter, and ballast age values are valuable post-arrival metrics for evaluating relative potential risk of non-indigenous zooplankton introduction. These data support the use of ballast water exchange samples as a management tool to determine which sample types are likely correlated with poor exchange efficacy or non-compliant exchange management.
An estimated 125 vessels per year (17% of average annual arrivals that discharge into Puget Sound) discharge ballast water that would trigger additional investigation. However, only about one-third (51) of this number were sampled during the analysis period and there is currently no funding to conduct additional sample collections.
The Low/Moderate/High priority category system could significantly improve efficiency of limited staff time and resources on follow-up investigations and management actions. Such investigation is intended to assist managers in identifying vessel-specific risk factors, and making recommendations to the regulated community aimed at reducing risk. Use of these management priority categories should be focused only on acute estimated risks of a given arrival/discharge, not the potential chronic or long-term cumulative risks of multiple discharges of lower densities over time.
Effectiveness of BWE in Protecting Puget Sound from Invasive Species March 2015
43
Two environmental issues that have been noted by industry as possible contributing factors for higher densities or percent compositions of coastal species in West Coast ballast water samples coming from California ports are effects of the Columbia River plume (freshwater surges during high winter flow events) and coastal upwelling (offshore winds pushing surface coastal water out). The assumption is that coastal species pushed out past the 50 nautical mile exchange zone boundary may compromise ballast water exchange effectiveness. In general, if the one of these events were responsible for high coastal zooplankton organism densities in exchanged ballast water, we would expect to see lower associated salinity values. As noted above, there is only one case out of the 49 risk threshold samples were salinity was less than normal open sea salinities of ≥ 30 ppt. Also, recent studies of zooplankton collected along the west coast on transects perpendicular to shore show that coastal plankton is quite rare beyond approximately 20 nautical miles off shore in both spring and summer (including off the Columbia River) (J. Cordell, unpublished, also see Murphy et al. 2013 for transect locations). This supports the original rationale for establishing the coastal ballast water exchange BWE zone boundary at 50 nautical miles (PSQAT 2000). Although these environmental factors thus are unlikely to influence BWE exchange percent composition and density values, those factors were not specifically evaluated for this report.
Effectiveness of BWE in Protecting Puget Sound from Invasive Species March 2015
44
CONCLUSIONS Ballast Water Age
As in previous studies, ballast water zooplankton densities decrease with time and Trans-Pacific ballast water entering Puget Sound was generally older than that from West Coast voyages. Our study indicates that ballast ages of greater than 30 days would have been most likely to meet the USCG standards for less than 10 organisms in the ≥ 50 micrometer size class. The presence of a few “outliers” in which ballast water more than 30 days old had average zooplankton densities in the thousands per cubic meters could be due to errors in record keeping, unrecorded addition of new ballast (often called “pressing-up” tanks), or survival and/or reproduction of some types of organisms within the tanks.
Ship Type
Although bulk carriers discharged more water into Puget Sound than other ship types, total abundance of higher risk coastal zooplankton discharged into the Sound was greater from tankers (articulated tug-barges, integrated tug-barges3, oil tankers). These ship type results are related to ballast origin—most discharging tankers carried ballast only a few days old from highly invaded ports in California, while other ship types generally carried older ballast from Asia. These findings are consistent with previous studies.
Ballast Water Origin
Densities and discharges of coastal and known non-indigenous zooplankton in ballast water of ships on West Coast routes originating in California exceeded those from other West Coast and Trans-Pacific routes. These results are similar to previous results from Puget Sound are likely due to: (1) densities of coastal zooplankton in California ports are high, and non-indigenous species are abundant and diverse; (2) transit times for West Coast voyages are shorter than those for Trans-Pacific voyages, resulting in high survival of zooplankton in ballast tanks; and (3) ballast water exchange is not 100% effective at removing coastal zooplankton. Previously, little data on ballast sourced in South America had been analyzed, and in this study our analysis of 44 samples of exchanged ballast water from this source indicate that it probably poses a relatively low risk of introducing non-indigenous species, especially compared to water sourced from California (however see discussion under Non-indigenous Species in Puget Sound, below).
Ballast Water Exchange Trends Through Time
In Washington State, overall ballast water management compliance has steadily increased after institution of WDFW ship inspections, review of ballasting records, sample collection from ballast tanks for zooplankton analysis, and an increased 3 Although the integrated tug-barge ship type has not operated in Washington State for many years, they could be redeployed to this area in the future based on industry needs.
Effectiveness of BWE in Protecting Puget Sound from Invasive Species March 2015
45
awareness by vessel operators regarding ballast water management efforts at the international and federal levels as well. Effectiveness of ballast water exchange also appears to have increased over the course of this study. Significant reductions were observed in densities of coastal zooplankton and non-indigenous zooplankton in ballast water samples, especially after 2008. While promising, this result does not necessarily indicate that the risk of non-indigenous species introductions to Puget Sound has also reduced. For exchange or ballast water treatment to significantly reduce the risk of new invasions, viable non-indigenous species taxa must be reduced below a critical threshold, and such thresholds are unknown for many invasive organisms. Although exchange reduces the number of coastal and non-indigenous zooplankton, it does not eliminate them altogether, and ultimately, ballast water exchange cannot be used to meet ballast water discharge standards as efficacy is highly variable, does not address reductions of oceanic species, and there are no onboard tools to determine efficacy prior to discharge.
Non-Indigenous Species in Puget Sound
Despite significant differences in densities of high risk coastal zooplankton delivered by different ship types and ballast origins, both domestic and foreign routes can continue to introduce non-indigenous species into Puget Sound. Domestic sourced ballast waters had higher densities of non-indigenous zooplankton, while those from foreign sources had more non-indigenous zooplankton diversity. An example of the latter is ballast water sourced from South America, which contained 10 unique species that are not indigenous to Puget Sound. Ballast discharged from ships on domestic routes is more likely to introduce species that are already established elsewhere on the West Coast, while ballast from ships on trans-oceanic and South American routes may result in more new (or primary) introductions.
At least one new presumably ballast-introduced non-indigenous zooplankton species has recently invaded Puget Sound. The arrival of the copepod Oithona davisae is of concern because it is smaller in size compared to native copepods and may not be as susceptible to visual predators such as juvenile fish, compared with native copepods.
Ballast Water Exchange Sampling as Management Tool
The management priority category system developed for this report is intended to allow limited staff time and resources to focus on follow-up investigations and management actions. Use of these categories should focus only on estimated acute or short-term risks of a given arrival/discharge, not the potential chronic or long-term cumulative risks of multiple discharges of lower densities over time. Continued ballast water sampling for such assessment could, however, lead to further insight on chronic risk for particular vessel types and voyage profiles.
Effectiveness of BWE in Protecting Puget Sound from Invasive Species March 2015
46
RECOMMENDATIONS Based on the findings of this report, recommendations are provided for improving future biological sampling efforts, evaluating vessel risk assessment procedures, and the development of coastal species composition and density thresholds for vessels discharging ballast water in Washington State. Results of this report provide ballast water invasive risk information for Puget Sound, but can be used to indicate risks to other port regions of Washington State. These recommendations are general and implementation will require funding.
1. Collect and analyze ballast water exchange samples from vessels using risk profiles, data gaps, and random selection criteria.
The results presented here support the continued use of ship type to categorize the relative risk of vessels calling on Puget Sound ports. Articulated tug-barges and oil tankers, for example, carried the highest densities and percent composition of coastal zooplankton in their ballast water and are already prioritized for inspection. Ballast water originating from west coast ports, particularly California, is also considered to be of relatively high risk by Washington State’s Ballast Water Program staff. Ballast water from these sources contained the highest concentrations of coastal zooplankton, and ballast water exchange significantly reduced coastal zooplankton densities. In order to continue to refine relative risk profiles and determine whether or not trends in the data (e.g., decreasing densities of coastal zooplankton in ballast over time) continue, continued sampling is recommended. This would also have the added benefit of providing data to compare with new ballast management methods such as treatment as they are introduced. Numbers of samples needed to make statistically sound evaluations could be determined from the existing data set by conducting power analyses on different trip and ship types.
Our ability to draw conclusions regarding exchange efficacy for container and general cargo vessels was constrained by low sample sizes for these ship types, both for exchanged and un-exchanged ballast water. However, these ship types typically visited Puget Sound via Trans Pacific routes, and thus were holding older ballast water which is considered low risk and a low priority for boarding by Program staff. More sampling of these vessel types in future would allow for more comparisons within ship types. There were also relatively few samples from common water sources such as Columbia River and coastal Washington ports, and the data indicate that these can deliver non-indigenous species to Puget Sound. Thus, consideration should also be given to additional sampling of these sources in particular.
2. Increase ambient zooplankton research and monitoring efforts in Puget Sound.
Ultimately, ballast water sampling is intended to aid efforts to prevent future species invasions via commercial shipping. Robust sampling of ambient plankton densities, particularly those surrounding commercial ports, is needed in order to determine whether these efforts are effective in protecting State waters. Sampling
Effectiveness of BWE in Protecting Puget Sound from Invasive Species March 2015
47
efforts should span multiple seasons and locations within Puget Sound, in order to establish a baseline for detecting future ballast water-mediated invasions. Both traditional microscopy and new techniques such as environmental DNA (eDNA) to help identify species too rare, small, or damaged to identify may be needed to accurately and completely describe ambient plankton communities.
3. Consult with Ballast Water Working Group to define regulatory and management actions based on prioritization thresholds.
Biological sampling should be used as a management tool to better profile risk and target efforts to decrease risk of non-indigenous species introductions posed by individual vessels, and in future could inform assessments of vessel compliance with ballast water management regulations. . Thresholds developed in this report should be refined and utilized to identify and prioritize vessels for additional evaluation, sampling, and when it is practical and appropriate to requiring temporary compliance plans or alternative strategies under WAC 220-150-037 to improve ballast water exchange effectiveness until those vessels convert to ballast water treatment systems. The department should work with their Ballast Water Work Group to identify and recommend threshold(s) for determining when there is sufficient evidence for listing (or delisting) a vessel under WAC 220-150-035, and determine if there is a gross exceedance threshold that can establish non-compliance.
4. Consult with Ballast Water Working Group to determine whether changes to Common Water Zone exemption area are warranted.
Known invasive non-indigenous species that are not currently resident in Puget Sound were found in ballast water samples originating from the Columbia River. In fact, ballast samples sourced from the Columbia River consistently contained the second highest non-indigenous species densities of any source examined in this report (highest source is California). This is a problem because all Oregon and Washington ports on the Columbia River are within a “common waters” geographic area as designated by statute under the Revised Code of Washington (RCW) 77.120.030(8)4. This designation exempts vessels with ballast water sourced from those ports from having to meet ballast water exchange standards prior to discharge at Puget Sound or coastal ports. The department should work with their Ballast Water Working Group to consider whether these findings: (1) are sufficient evidence of elevated risk; (2) if more samples are required to confirm elevated risk; and (3) if elevated risk is confirmed, whether to recommend legislative action to remove or condition the Columbia River from Washington Common Water designation under this statute.
4 Originally established by legislature in 2000 (SHB 2466)
Effectiveness of BWE in Protecting Puget Sound from Invasive Species March 2015
48
REFERENCES Bateman, P., and J. Cordell (2012). Quality assurance project plan: Effectiveness of ballast water exchange in protecting Puget Sound from invasive species. Prepared for the Washington Dept. of Fish and Wildlife under EPA grant contract 12-1173. November.
Bollens, S.M., Breckenridge, J.K., Vanden Hoof, R.C., and Cordell, J.R. (2011) Mesozooplankton of the lower San Francisco Estuary: spatio-temporal patterns, ENSO effects and the prevalence of non-indigenous species. J. Plankt. Res. 33: 1358-1377
Bouley, P., and Kimmerer, W. J. (2006) Ecology of a highly abundant, introduced cyclopoid copepod in a temperate estuary, Mar. Ecol. Prog. Ser. 324: 210–228.
Burkholder, J M., Hallegraef, G. M., Melia, G., Cohen, A., Bowers, H. A., Oldach, D. W., Parrow, M. W., Sullivan, M. J., Zimba, P. V., Allen, E. H., Kindera, C. A., and Mallin, M. A. (2007) Phytoplankton and bacterial assemblages in ballast water of U.S. military ships as a function of port of origin, voyage time, and ocean exchange practices. Harmful Algae 6: 486–518.
Cordell, J.R., Lawrence, D.J., Ferm, N.C., Tear, L.M., Smith, S.S., and Herwig, R.P. (2009) Factors influencing densities of non-indigenous species in the ballast water of ships arriving at ports in Puget Sound, Washington, United States. Aquat. Cons.: Mar. Freshw. Ecosyst. 19: 322–343.
Cordell, J., Lawrence, D., and Pleus, A. (2013) Evaluation and Recommendation of Existing and New Zooplankton Samples for Project Effectiveness Analysis. Unpublished Report.
Davidson, I., Zabin, C., Ashton, G., and Ruiz, G. (2014) An assessment of the biofouling introductions to the Puget Sound region of Washington State. Report to the Washington Department of Fish & Wildlife and Washington Department of Natural Resources, Olympia, Washington. 111pp.
Hua, J., and Whang, W. H. (2012). Effects of voyage routing on the survival of microbes in ballast water. Ocean Engineering. 42: 165-175.
Hulme, P.E. (2009) Trade, transport and trouble: managing invasive species pathways in an era of globalization. J. Appl. Ecol., 46, 10–18.
Keller, R.P., Drake, J.M., Drew, M.B. & Lodge, D.M. (2010) Linking environmental conditions and ship movements to estimate invasive species transport across the global shipping network. Divers. Distrib., 17, 93–102.
Kolzsch, A. & Blasius, B. (2011) Indications of marine bioinvasion from network theory. An analysis of the global cargo ship network. Europ. Phys. J. B., 84, 601–612.
Effectiveness of BWE in Protecting Puget Sound from Invasive Species March 2015
49
Lawrence, D.J. and Cordell, J.R. (2010) Relative contributions of domestic and foreign sourced ballast water to propagule pressure in Puget Sound, Washington, USA. Biol. Conserv. 143:700-709.
Molnar, J.L., Gamboa, R.L., Revenga, C. and Spalding, M.D. (2008) Assessing the global threat of invasive species to marine biodiversity. Front. Ecol. Environ., 6, 485–492.
Murphy, K.R., Boehme, J.R., Brown, C., Noble, M., Smith, G., Sparks, D. and Ruiz, G.M. (2013) Exploring the limits of dissolved organic matter fluorescence for determining seawater sources and ballast water exchange on the US Pacific coast. Journal of Marine Systems: 111-113, 157-166.
Puget Sound Action Team (2007) Ballast water management in Washington State: A report of the State Ballast Water Work Group to the 2007 regular session of the Washington State legislature.
Puget Sound Water Quality Action Team (2000). Ballast Water and Shipping Patterns in Puget Sound: Considerations for Siting of Alternative Ballast Water Exchange Zones.
Reynolds, K. (2008). Ballast water flow-through exchange best practices review. Technical report for the Washington Dept. of Fish and Wildlife. File No. 07107.01, 10 December.
Ruiz, G.M., Carlton, J.T., Grosholz, E.D. and Hines, A.H. (1997) Global invasions of marine and estuarine habitats by non-indigenous species: mechanisms, extent, and consequences. Integr. Comp. Biol., 37, 621–632.
Scianni, C., Brown, C., Newsom, A., Nedelcheva, R., Falnker, M., and Dobroski, N. 2013 Biennial Report on the California Marine Invasive Species Program. Produced for the California State Legislature. California State Lands Commission.
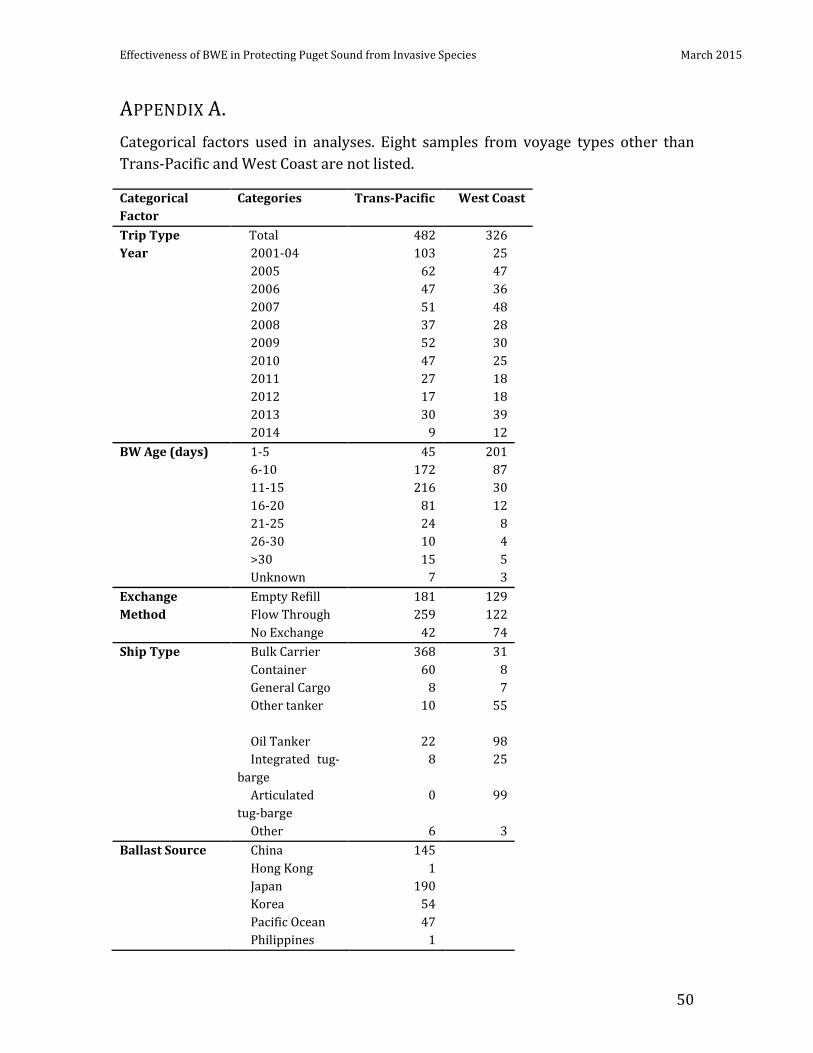
Effectiveness of BWE in Protecting Puget Sound from Invasive Species March 2015
50
APPENDIX A. Categorical factors used in analyses. Eight samples from voyage types other than Trans-Pacific and West Coast are not listed.
Categorical Factor
Categories Trans-Pacific West Coast
Trip Type Total 482 326 Year 2001-04 103 25 2005 62 47 2006 47 36 2007 51 48 2008 37 28 2009 52 30 2010 47 25 2011 27 18 2012 17 18 2013 30 39 2014 9 12 BW Age (days) 1-5 45 201 6-10 172 87 11-15 216 30 16-20 81 12 21-25 24 8 26-30 10 4 >30 15 5 Unknown 7 3 Exchange Method
Empty Refill 181 129 Flow Through 259 122
No Exchange 42 74 Ship Type Bulk Carrier 368 31 Container 60 8 General Cargo 8 7 Other tanker 10 55 Oil Tanker 22 98 Integrated tug-
barge 8 25
Articulated tug-barge
0 99
Other 6 3 Ballast Source China 145 Hong Kong 1 Japan 190 Korea 54 Pacific Ocean 47 Philippines 1
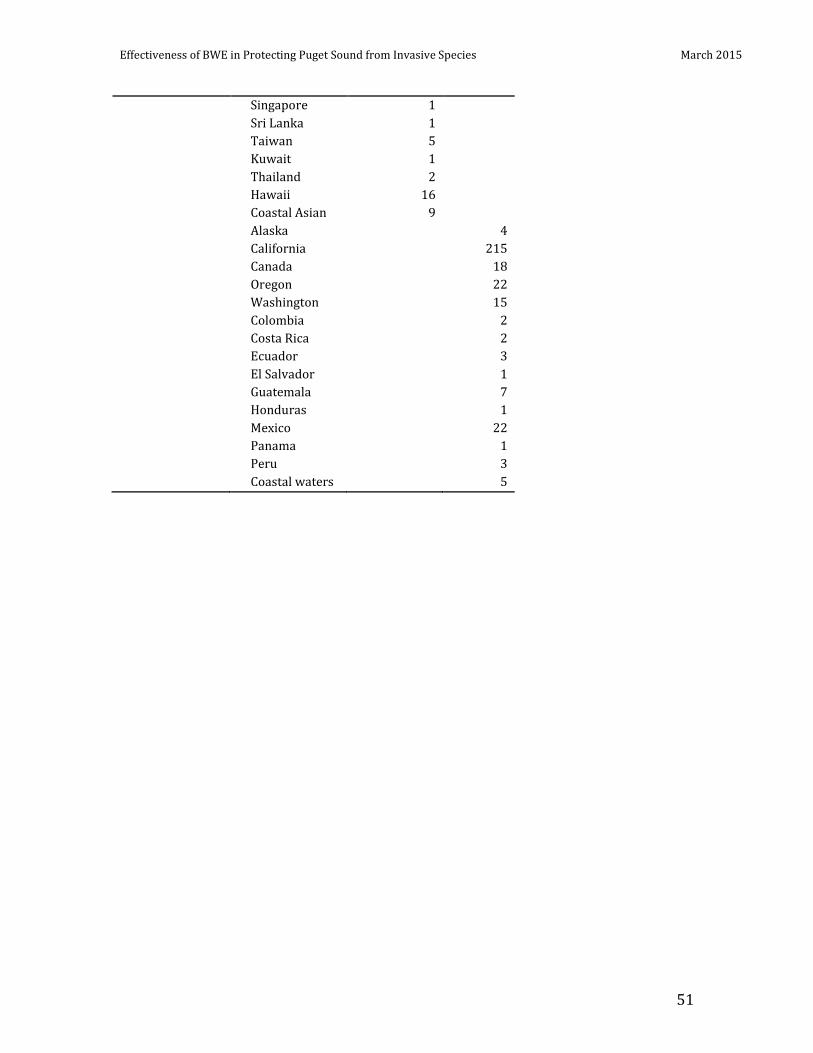
Effectiveness of BWE in Protecting Puget Sound from Invasive Species March 2015
51
Singapore 1 Sri Lanka 1 Taiwan 5 Kuwait 1 Thailand 2 Hawaii 16 Coastal Asian 9 Alaska 4 California 215 Canada 18 Oregon 22 Washington 15 Colombia 2 Costa Rica 2 Ecuador 3 El Salvador 1 Guatemala 7 Honduras 1 Mexico 22 Panama 1 Peru 3 Coastal waters 5
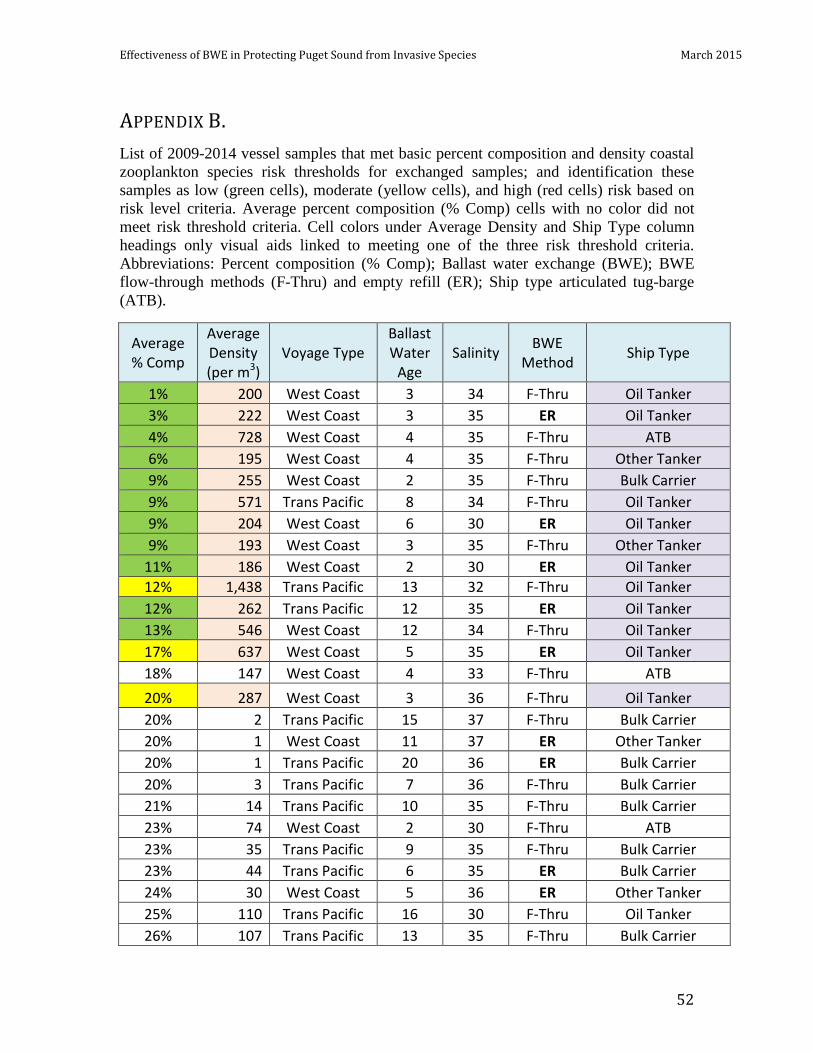
Effectiveness of BWE in Protecting Puget Sound from Invasive Species March 2015
52
APPENDIX B. List of 2009-2014 vessel samples that met basic percent composition and density coastal zooplankton species risk thresholds for exchanged samples; and identification these samples as low (green cells), moderate (yellow cells), and high (red cells) risk based on risk level criteria. Average percent composition (% Comp) cells with no color did not meet risk threshold criteria. Cell colors under Average Density and Ship Type column headings only visual aids linked to meeting one of the three risk threshold criteria. Abbreviations: Percent composition (% Comp); Ballast water exchange (BWE); BWE flow-through methods (F-Thru) and empty refill (ER); Ship type articulated tug-barge (ATB).
Average % Comp
Average Density (per m3)
Voyage Type Ballast Water
Age Salinity BWE
Method Ship Type
1% 200 West Coast 3 34 F-Thru Oil Tanker 3% 222 West Coast 3 35 ER Oil Tanker 4% 728 West Coast 4 35 F-Thru ATB 6% 195 West Coast 4 35 F-Thru Other Tanker 9% 255 West Coast 2 35 F-Thru Bulk Carrier 9% 571 Trans Pacific 8 34 F-Thru Oil Tanker 9% 204 West Coast 6 30 ER Oil Tanker 9% 193 West Coast 3 35 F-Thru Other Tanker
11% 186 West Coast 2 30 ER Oil Tanker 12% 1,438 Trans Pacific 13 32 F-Thru Oil Tanker 12% 262 Trans Pacific 12 35 ER Oil Tanker 13% 546 West Coast 12 34 F-Thru Oil Tanker 17% 637 West Coast 5 35 ER Oil Tanker 18% 147 West Coast 4 33 F-Thru ATB 20% 287 West Coast 3 36 F-Thru Oil Tanker 20% 2 Trans Pacific 15 37 F-Thru Bulk Carrier 20% 1 West Coast 11 37 ER Other Tanker 20% 1 Trans Pacific 20 36 ER Bulk Carrier 20% 3 Trans Pacific 7 36 F-Thru Bulk Carrier 21% 14 Trans Pacific 10 35 F-Thru Bulk Carrier 23% 74 West Coast 2 30 F-Thru ATB 23% 35 Trans Pacific 9 35 F-Thru Bulk Carrier 23% 44 Trans Pacific 6 35 ER Bulk Carrier 24% 30 West Coast 5 36 ER Other Tanker 25% 110 Trans Pacific 16 30 F-Thru Oil Tanker 26% 107 Trans Pacific 13 35 F-Thru Bulk Carrier
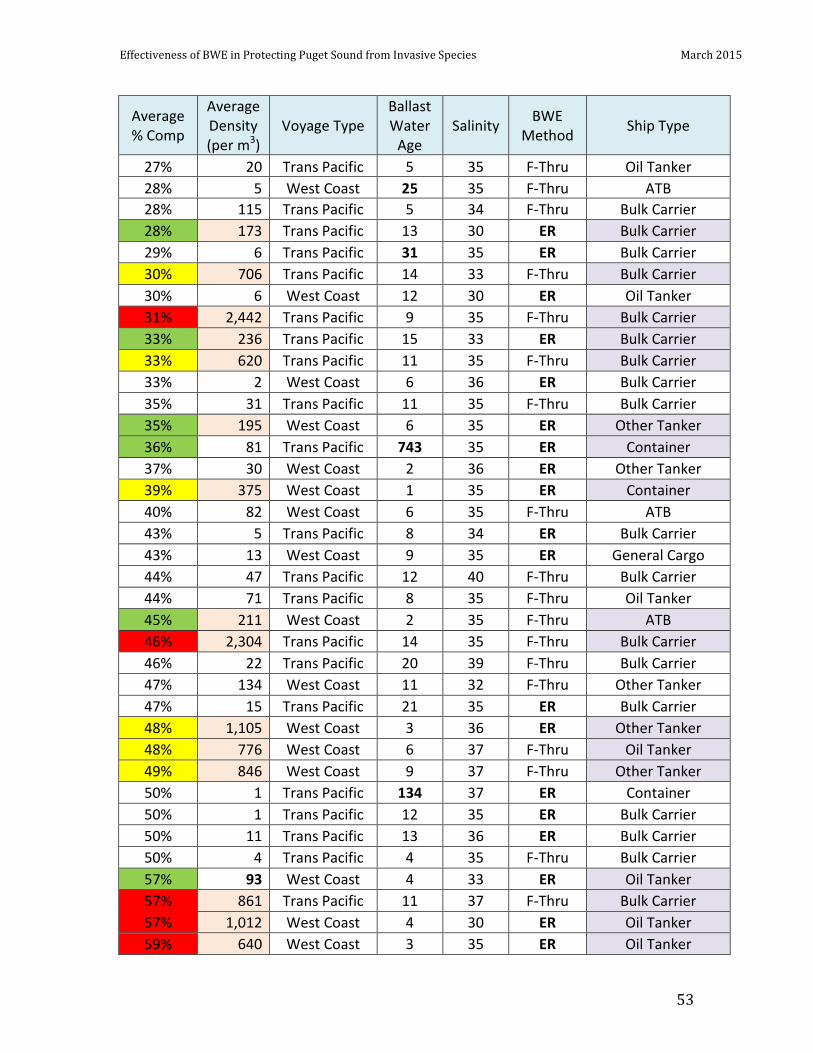
Effectiveness of BWE in Protecting Puget Sound from Invasive Species March 2015
53
Average % Comp
Average Density (per m3)
Voyage Type Ballast Water
Age Salinity BWE
Method Ship Type
27% 20 Trans Pacific 5 35 F-Thru Oil Tanker 28% 5 West Coast 25 35 F-Thru ATB 28% 115 Trans Pacific 5 34 F-Thru Bulk Carrier 28% 173 Trans Pacific 13 30 ER Bulk Carrier 29% 6 Trans Pacific 31 35 ER Bulk Carrier 30% 706 Trans Pacific 14 33 F-Thru Bulk Carrier 30% 6 West Coast 12 30 ER Oil Tanker 31% 2,442 Trans Pacific 9 35 F-Thru Bulk Carrier 33% 236 Trans Pacific 15 33 ER Bulk Carrier 33% 620 Trans Pacific 11 35 F-Thru Bulk Carrier 33% 2 West Coast 6 36 ER Bulk Carrier 35% 31 Trans Pacific 11 35 F-Thru Bulk Carrier 35% 195 West Coast 6 35 ER Other Tanker 36% 81 Trans Pacific 743 35 ER Container 37% 30 West Coast 2 36 ER Other Tanker 39% 375 West Coast 1 35 ER Container 40% 82 West Coast 6 35 F-Thru ATB 43% 5 Trans Pacific 8 34 ER Bulk Carrier 43% 13 West Coast 9 35 ER General Cargo 44% 47 Trans Pacific 12 40 F-Thru Bulk Carrier 44% 71 Trans Pacific 8 35 F-Thru Oil Tanker 45% 211 West Coast 2 35 F-Thru ATB 46% 2,304 Trans Pacific 14 35 F-Thru Bulk Carrier 46% 22 Trans Pacific 20 39 F-Thru Bulk Carrier 47% 134 West Coast 11 32 F-Thru Other Tanker 47% 15 Trans Pacific 21 35 ER Bulk Carrier 48% 1,105 West Coast 3 36 ER Other Tanker 48% 776 West Coast 6 37 F-Thru Oil Tanker 49% 846 West Coast 9 37 F-Thru Other Tanker 50% 1 Trans Pacific 134 37 ER Container 50% 1 Trans Pacific 12 35 ER Bulk Carrier 50% 11 Trans Pacific 13 36 ER Bulk Carrier 50% 4 Trans Pacific 4 35 F-Thru Bulk Carrier 57% 93 West Coast 4 33 ER Oil Tanker 57% 861 Trans Pacific 11 37 F-Thru Bulk Carrier 57% 1,012 West Coast 4 30 ER Oil Tanker 59% 640 West Coast 3 35 ER Oil Tanker
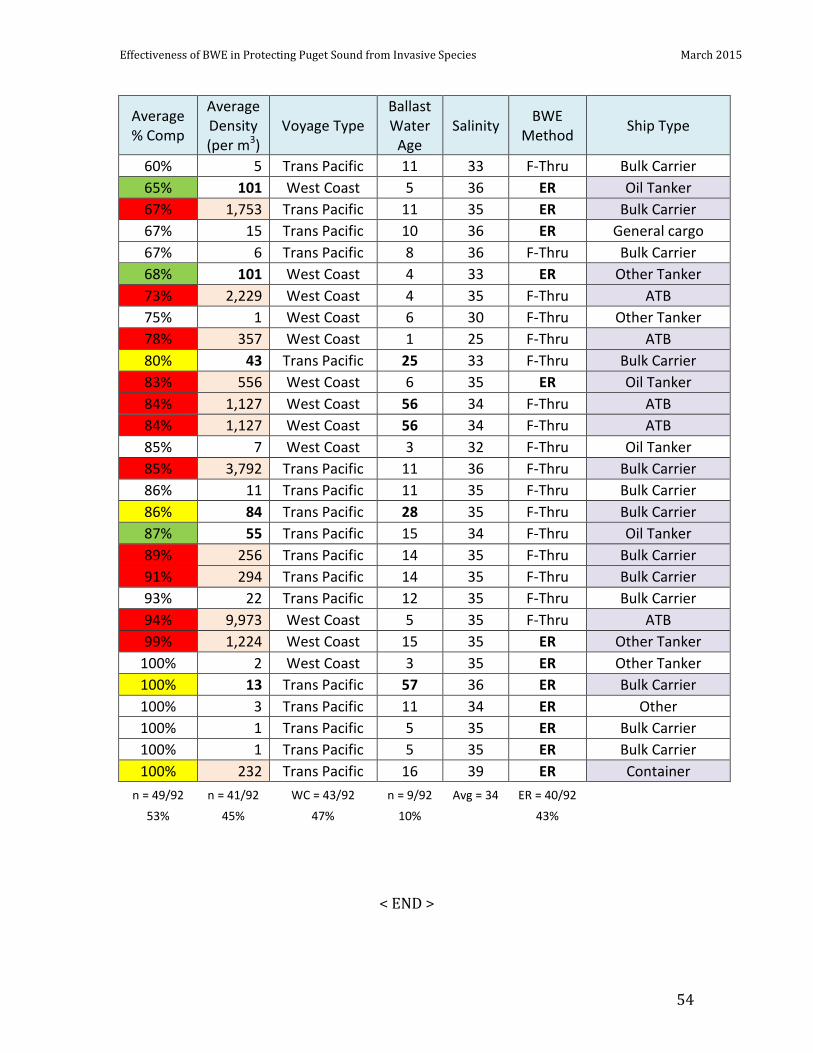
Effectiveness of BWE in Protecting Puget Sound from Invasive Species March 2015
54
Average % Comp
Average Density (per m3)
Voyage Type Ballast Water
Age Salinity BWE
Method Ship Type
60% 5 Trans Pacific 11 33 F-Thru Bulk Carrier 65% 101 West Coast 5 36 ER Oil Tanker 67% 1,753 Trans Pacific 11 35 ER Bulk Carrier 67% 15 Trans Pacific 10 36 ER General cargo 67% 6 Trans Pacific 8 36 F-Thru Bulk Carrier 68% 101 West Coast 4 33 ER Other Tanker 73% 2,229 West Coast 4 35 F-Thru ATB 75% 1 West Coast 6 30 F-Thru Other Tanker 78% 357 West Coast 1 25 F-Thru ATB 80% 43 Trans Pacific 25 33 F-Thru Bulk Carrier 83% 556 West Coast 6 35 ER Oil Tanker 84% 1,127 West Coast 56 34 F-Thru ATB 84% 1,127 West Coast 56 34 F-Thru ATB 85% 7 West Coast 3 32 F-Thru Oil Tanker 85% 3,792 Trans Pacific 11 36 F-Thru Bulk Carrier 86% 11 Trans Pacific 11 35 F-Thru Bulk Carrier 86% 84 Trans Pacific 28 35 F-Thru Bulk Carrier 87% 55 Trans Pacific 15 34 F-Thru Oil Tanker 89% 256 Trans Pacific 14 35 F-Thru Bulk Carrier 91% 294 Trans Pacific 14 35 F-Thru Bulk Carrier 93% 22 Trans Pacific 12 35 F-Thru Bulk Carrier 94% 9,973 West Coast 5 35 F-Thru ATB 99% 1,224 West Coast 15 35 ER Other Tanker
100% 2 West Coast 3 35 ER Other Tanker 100% 13 Trans Pacific 57 36 ER Bulk Carrier 100% 3 Trans Pacific 11 34 ER Other 100% 1 Trans Pacific 5 35 ER Bulk Carrier 100% 1 Trans Pacific 5 35 ER Bulk Carrier 100% 232 Trans Pacific 16 39 ER Container
n = 49/92 n = 41/92 WC = 43/92 n = 9/92 Avg = 34 ER = 40/92 53% 45% 47% 10%
43%
< END >
Effectiveness of BWE in Protecting Puget Sound from Invasive Species March 2015
55
[This page intentionally blank to provide back cover]