Embed Size (px)
Citation preview
Effectiveness and efficiency of SME innovation policy
James Foreman-Peck
Accepted: 29 February 2012
� Springer Science+Business Media, LLC. 2012
Abstract This paper assesses UK innovation policy
impact on a large, population weighted, sample of both
service and manufacturing SMEs. By focussing on
self-reported innovation the study achieves a wider
coverage of the effects of SME innovation policy than
possible with more traditional indicators. Propensity
score matching indicates that SMEs receiving UK
state support for innovation were more likely to
innovate than unsupported comparable enterprises.
Innovating enterprises are shown to have grown
significantly faster over the years 2002–2004 when
other growth influences are appropriately controlled.
Combining these two results and comparing the
outlays on SME innovation policy with the estimated
effects suggests that policy was efficient as well as
effective. There is evidence that SME tax credits were
expensive compared with earlier support instruments.
But the overall high returns estimated suggest that,
even in times of public spending cuts, persisting with
SME innovation policy would be prudent.
Keywords Innovation � State aid � SME �Policy evaluation
JEL Classifications L25 � L26 � R38
1 Introduction
Innovation policy aims to promote the commercial
exploitation of new ideas as products, processes, and
organisational techniques (OECD 2003). The policy is
increasingly prominent in EU and OECD countries
because ‘market failure’ is judged to matter in this
field. EU Member States are permitted to provide state
aid to firms as long as it ‘‘addresses a defined market
failure, and the identified benefits outweigh the
distortions to competition resulting from the aid’’
(Commission of the European Communities 2006).
Market failures are particularly liable to arise in the
generation and utilisation of knowledge; one example
occurs when those who do not invest in research and
development (R&D) nonetheless gain knowledge
from others’ investments. As a consequence of such
market failures, social returns to R&D are estimated to
be high and to exceed private returns by a wide margin
(Griffith et al. 2001; H M Treasury et al. 2004; Wieser
2005).
Typically innovation policy evaluation has focused
on the R&D input, rather than on the innovations
themselves, and restricted the analysis to large man-
ufacturing firms (Jones and Williams 1998; Hall and
Electronic supplementary material The online version ofthis article (doi:10.1007/s11187-012-9426-z) containssupplementary material, which is available to authorized users.
J. Foreman-Peck (&)
Cardiff Business School, Cardiff University,
Colum Drive, Cardiff CF10 3EU, UK
e-mail: [email protected]
123
Small Bus Econ
DOI 10.1007/s11187-012-9426-z
Van Reenen 1999)—although more recently coverage
has been extended to manufacturing SMEs (e.g. Hall
et al. 2009)1. Service as well as manufacturing firms
employing fewer than 250 persons accounted for about
one half of private sector jobs and turnover in the
United Kingdom during 2007 (BERR 2008, Table 1);
all types of SMEs matter for the economy. For these
enterprises there is evidence that R&D surveys
markedly under-report research activity and innova-
tiveness (Kleinknecht 1987; Harris 2008).2 Lev (2001)
noted that many innovative firms did not include any
R&D expenditure figures in their reports. Instead of
formal R&D, investment in plant and equipment is
more strongly associated with innovation by smaller
businesses (Smith 2005; Skuras et al. 2008).3 The
approach adopted here to evaluating policy therefore
is to consider the impact on self-reported innovation
on both manufacturing and services SMEs, and how
this innovation affects the economy.
The central question is whether ‘reporting unit’
level data in the Fourth Community Innovation Survey
(CIS4) (DTI 2006) shows that British SME innovation
policy in 2002–2004 was effective and efficient.4 An
effective policy is simply one that gets results—
achieves ‘additionality’—but the costs of doing so
might exceed the benefits.5 The resources deployed
with an efficient policy yield social returns greater
than their alternative uses.
In their recent survey Ientile and Mairesse (2009)
concluded that an innovation policy was effective;
business R&D investment grew in response to a tax
credit in all the cases reviewed. Their observation that
a unit of taxpayer’s money sometimes generated less
than a unit of additional R&D does not necessarily
indicate the policy was inefficient. The evaluation of
this so-called ‘bang for the buck’ (Baghana and
Mohnen 2009) need not even approximate an assess-
ment of social efficiency, for it fails to take into
account the social returns to the induced R&D. If
returns to unsubsidised R&D at the margin are high (as
for instance the survey of Wieser 2005 finds), then
they may still be high (albeit reduced) on the tax credit
that induced less than one for one R&D outlays. Links
between policy spending and ultimate social returns
must be established to evaluate policy efficiency, a
contribution of the present paper. A second contribu-
tion is to distinguish between the impacts of traditional
state support for SME innovation and of R&D tax
credits. Studies such as Czarnitzki et al. (2011) that
estimate the impact of tax credits typically do not
compare them with alternative innovation policies.
Section 2 outlines UK state aid for innovation in an
international context. Then Sect. 3 discusses the
method and the data. A key methodological problem
is how to establish what supported firms would have
done if they had not received state aid for innovation
and conversely, whether or not unsupported enter-
prises would have innovated had they been helped. A
propensity score matching solution is outlined. No less
essential to policy evaluation is estimation of the
impact of innovations. The section therefore considers
how the growth of the firm responds to them, the
measurement of the ultimate policy output and control
function and instrumental variables estimation. Sec-
tion 3.4 discusses the CIS4 data from which these
equations are estimated. In Sect. 4 the results are
reported and in the following Sect. 5 the estimated
parameters are employed to calculate a downward
biased or conservative estimate of the overall impact
and efficiency of SME innovation policy.
2 Context of UK innovation policy
Official concern about possible uncorrected market
failure in British innovation focused on business R&D
intensity, which was persistently lower in the United
Kingdom than in the United States, France or
Germany over the decade after 1992 (DTI 2003,
1 SMEs are defined throughout the present paper as enterprises
employing fewer than 250 persons.2 Kleinkncht’s study showed that according to the official R&D
survey, 91 % of private R&D in Dutch manufacturing firms was
undertaken by large firms (with 500 and more employees).
According to Kleinknecht’s estimate, this percentage would fall
to 82.4 % (when considering only firms with 50 and more
employees), and declines even more to 77.3 % when adding the
R&D of firms with 10–49 employees not covered in the official
survey.3 If this point is accepted then the Crepon et al. (1998) model
using R&D as an intermediate variable, standard for larger
firms, is not appropriate for SMEs.4 The UK CIS5 cannot be used for this purpose because the
public policy questions were dropped.5 Following H M Treasury (2003, p. 52) for the definition. ‘‘The
success of government intervention in terms of increasing
output or employment in a given target area is usually assessed
in terms of its ‘additionality’. This is its net, rather than its gross,
impact after making allowances for what would have happened
in the absence of the intervention.’’
J. Foreman-Peck
123
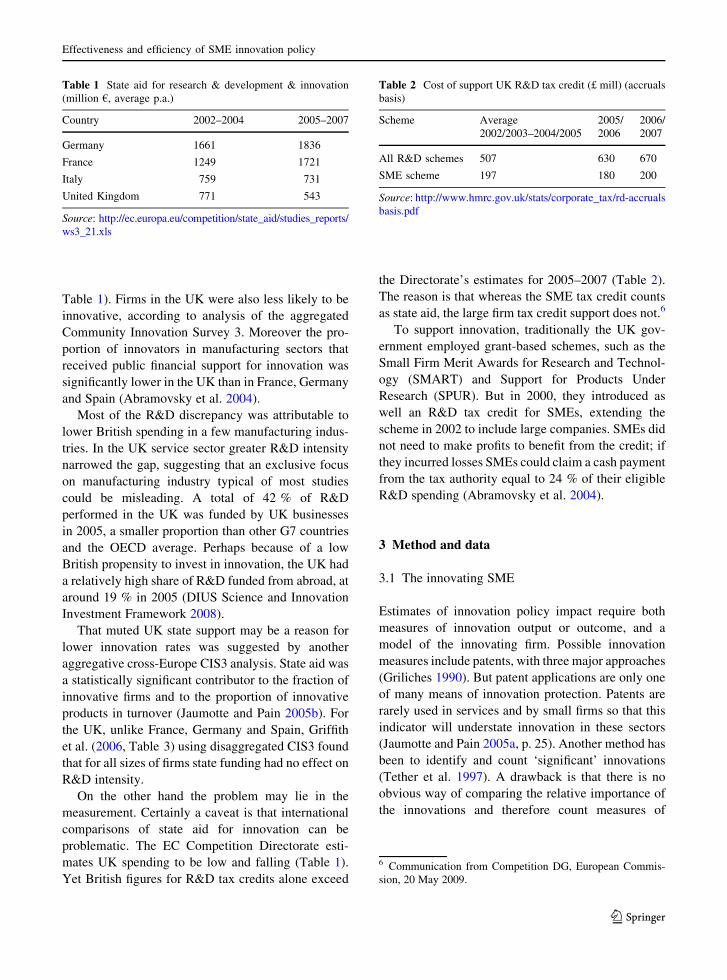
Table 1). Firms in the UK were also less likely to be
innovative, according to analysis of the aggregated
Community Innovation Survey 3. Moreover the pro-
portion of innovators in manufacturing sectors that
received public financial support for innovation was
significantly lower in the UK than in France, Germany
and Spain (Abramovsky et al. 2004).
Most of the R&D discrepancy was attributable to
lower British spending in a few manufacturing indus-
tries. In the UK service sector greater R&D intensity
narrowed the gap, suggesting that an exclusive focus
on manufacturing industry typical of most studies
could be misleading. A total of 42 % of R&D
performed in the UK was funded by UK businesses
in 2005, a smaller proportion than other G7 countries
and the OECD average. Perhaps because of a low
British propensity to invest in innovation, the UK had
a relatively high share of R&D funded from abroad, at
around 19 % in 2005 (DIUS Science and Innovation
Investment Framework 2008).
That muted UK state support may be a reason for
lower innovation rates was suggested by another
aggregative cross-Europe CIS3 analysis. State aid was
a statistically significant contributor to the fraction of
innovative firms and to the proportion of innovative
products in turnover (Jaumotte and Pain 2005b). For
the UK, unlike France, Germany and Spain, Griffith
et al. (2006, Table 3) using disaggregated CIS3 found
that for all sizes of firms state funding had no effect on
R&D intensity.
On the other hand the problem may lie in the
measurement. Certainly a caveat is that international
comparisons of state aid for innovation can be
problematic. The EC Competition Directorate esti-
mates UK spending to be low and falling (Table 1).
Yet British figures for R&D tax credits alone exceed
the Directorate’s estimates for 2005–2007 (Table 2).
The reason is that whereas the SME tax credit counts
as state aid, the large firm tax credit support does not.6
To support innovation, traditionally the UK gov-
ernment employed grant-based schemes, such as the
Small Firm Merit Awards for Research and Technol-
ogy (SMART) and Support for Products Under
Research (SPUR). But in 2000, they introduced as
well an R&D tax credit for SMEs, extending the
scheme in 2002 to include large companies. SMEs did
not need to make profits to benefit from the credit; if
they incurred losses SMEs could claim a cash payment
from the tax authority equal to 24 % of their eligible
R&D spending (Abramovsky et al. 2004).
3 Method and data
3.1 The innovating SME
Estimates of innovation policy impact require both
measures of innovation output or outcome, and a
model of the innovating firm. Possible innovation
measures include patents, with three major approaches
(Griliches 1990). But patent applications are only one
of many means of innovation protection. Patents are
rarely used in services and by small firms so that this
indicator will understate innovation in these sectors
(Jaumotte and Pain 2005a, p. 25). Another method has
been to identify and count ‘significant’ innovations
(Tether et al. 1997). A drawback is that there is no
obvious way of comparing the relative importance of
the innovations and therefore count measures of
Table 1 State aid for research & development & innovation
(million €, average p.a.)
Country 2002–2004 2005–2007
Germany 1661 1836
France 1249 1721
Italy 759 731
United Kingdom 771 543
Source: http://ec.europa.eu/competition/state_aid/studies_reports/
ws3_21.xls
Table 2 Cost of support UK R&D tax credit (£ mill) (accruals
basis)
Scheme Average
2002/2003–2004/2005
2005/
2006
2006/
2007
All R&D schemes 507 630 670
SME scheme 197 180 200
Source: http://www.hmrc.gov.uk/stats/corporate_tax/rd-accruals
basis.pdf
6 Communication from Competition DG, European Commis-
sion, 20 May 2009.
Effectiveness and efficiency of SME innovation policy
123
innovation output may be misleading. A number of
recent studies suggest instead that the self-reported
approach can explain company performance (North
and Smallbone 2000; Freel 2000; Roper et al. 2008;
Skuras et al. 2008; Hall et al. 2009).
This self-reported approach, as employed by the
CIS4 questionnaire to management, is probably cur-
rently the best available SME innovation measure for
the UK. Innovations are here defined as products or
processes that were at a minimum, new (or signifi-
cantly improved) to the enterprise. The CIS definition
of innovations does not require them to be profitable or
accepted by the market7; quality enhancement or cost
reduction could come at the expense of each other,
change can be damaging. In principle then it is
possible that innovations, as measured, impact
adversely or not at all on business performance.
How SMEs innovate will depend on how they
acquire and utilise knowledge, how they invest in
innovation and the challenges posed by this type of
investment, in contrast to others (Hall 2009). Such
investment creates an intangible asset, the firm’s
knowledge base, from which innovations and profits
may be generated. Much of this ‘knowledge capital’ is
implicit rather than formal, dependent upon the firm’s
employees. So, human capital of graduates should be
an important, measurable, contributor to this base.
SMEs may be especially likely to abstain from
intramural R&D on grounds of excessive risk and
limited access to finance compared with larger firms
(Rammer et al. 2009).
Effective public support intended to counteract
market failures, the central concern of the present
study, will further add to an enterprise’s resource base
and so stimulate innovation. The in-part tacit nature of
knowledge implies that personal contacts, imitation
and frequent interactions for SMEs are particularly
necessary for knowledge transmission. Collaboration
with other firms and institutions will therefore matter
(Cassiman and Veugelers 2002, 2005; Roper et al.
2008); around 13 % of UK firms in the CIS4 engaged
in such arrangements (DTI 2006, pp. 25–26). In short,
the ‘innovative SME’ model proposed here controls
for the direct influence of collaboration arrangements
on an enterprise’s chances of innovating.
Another control in the model recognizes that
enterprise resources for utilizing knowledge will
include human capital. Non-human resources devoted
to knowledge production, utilization and innovation
comprise R&D spending and investment in plant and
machinery. New firms may be more likely than other
businesses to have been established to exploit an
innovation, so that age or date of formation could be an
influence upon the chances of innovating. Larger
enterprises are usually able to draw upon more
indivisible knowledge or other resources than smaller,
in which case firm size will positively influence
innovation, though the relationship may be more
subtle than the Schumpeter hypothesis about the
greater innovativeness of larger firms (Acs and
Audretsch 1988; Tether et al. 1997; Hall et al. 2009).
Membership of an enterprise group could exercise a
similar effect. Technological opportunities for inno-
vation are likely to vary between industries. Conse-
quently sector controls are included in the model.
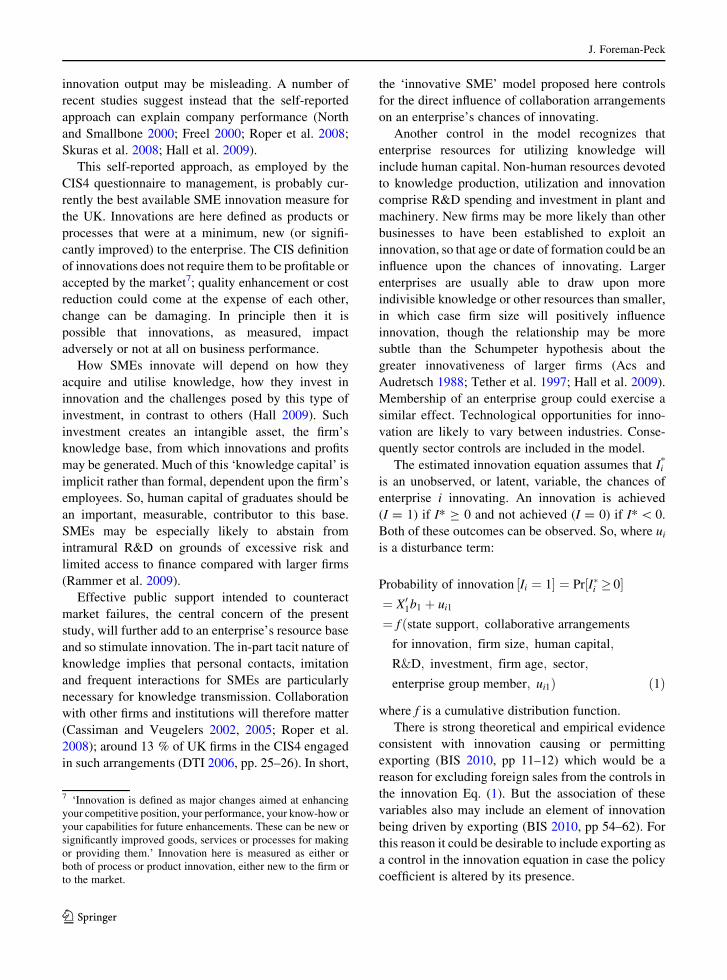
The estimated innovation equation assumes that Ii*
is an unobserved, or latent, variable, the chances of
enterprise i innovating. An innovation is achieved
(I = 1) if I* C 0 and not achieved (I = 0) if I* \ 0.
Both of these outcomes can be observed. So, where ui
is a disturbance term:
Probability of innovation ½Ii ¼ 1� ¼ Pr½I�i � 0�¼ X01b1 þ ui1
¼ f ðstate support; collaborative arrangements
for innovation; firm size; human capital;
R&D; investment; firm age; sector;
enterprise group member; ui1Þ ð1Þ
where f is a cumulative distribution function.
There is strong theoretical and empirical evidence
consistent with innovation causing or permitting
exporting (BIS 2010, pp 11–12) which would be a
reason for excluding foreign sales from the controls in
the innovation Eq. (1). But the association of these
variables also may include an element of innovation
being driven by exporting (BIS 2010, pp 54–62). For
this reason it could be desirable to include exporting as
a control in the innovation equation in case the policy
coefficient is altered by its presence.
7 ‘Innovation is defined as major changes aimed at enhancing
your competitive position, your performance, your know-how or
your capabilities for future enhancements. These can be new or
significantly improved goods, services or processes for making
or providing them.’ Innovation here is measured as either or
both of process or product innovation, either new to the firm or
to the market.
J. Foreman-Peck
123
3.2 Allocation of state aid for innovation
Whether traditional state aid for innovation is given to
an SME depends upon management making an
application and upon civil servants judging the
application appropriate for the terms of the support.
The allocation of aid is determined by the interaction
of these two groups; even if state officials could ‘pick
winners’ they cannot force state aid upon an enter-
prise. Even if an enterprise knows they have a good
idea they cannot insist that civil servants allocate state
aid to innovate it. When successful applicants exclude
a high proportion of firms poor at innovating and
consist of those likely anyway to innovate, there would
be much less policy ‘additionality’ than at first sight
appears. The disturbance term in the innovation
equation (ui1) would be positively correlated with
the state aid allocation in this case. Aid would be non-
randomly assigned to SMEs. On the other hand,
unobserved particularly innovative managements may
for lack of time perhaps have a lower propensity to
seek and obtain state support for innovation, generat-
ing a negative association between ui1 and the
independent variable of interest. A priori the coeffi-
cient estimation bias could be in either direction.
What determines an enterprise’s willingness to
apply for innovation aid and the inclination of the
authorities to grant it? If the likely success of the aid is
a determinant then everything that influences the
probability of innovation might be included in the aid
allocation equation. In addition, policy has a strong
regional element in the UK and therefore the location
of the enterprise also influences the chances of
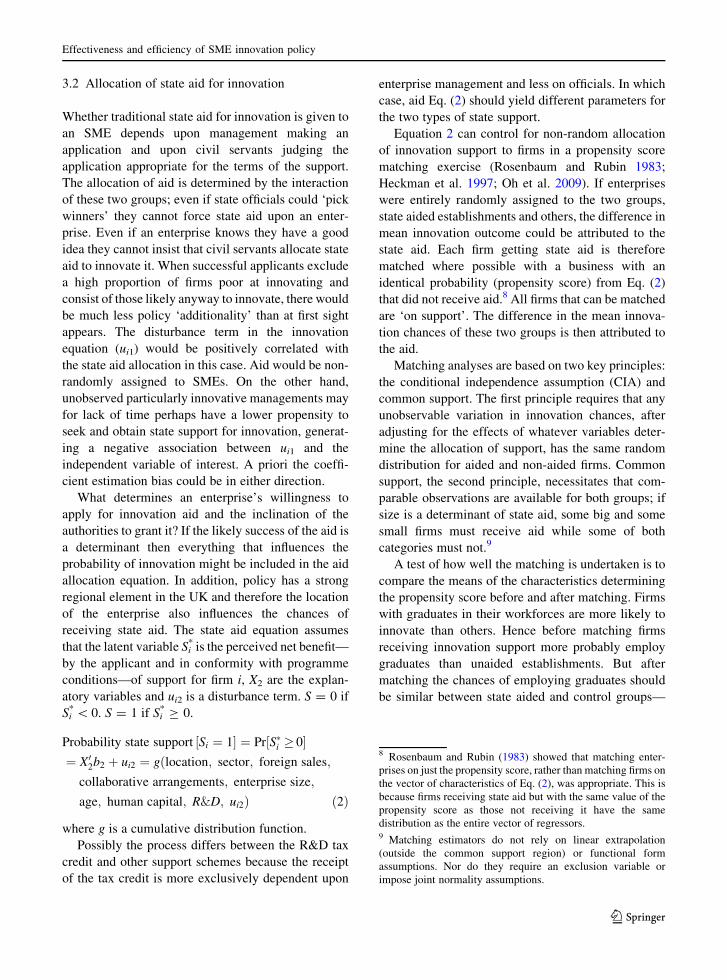
receiving state aid. The state aid equation assumes
that the latent variable Si* is the perceived net benefit—
by the applicant and in conformity with programme
conditions—of support for firm i, X2 are the explan-
atory variables and ui2 is a disturbance term. S = 0 if
Si* \ 0. S = 1 if Si
* C 0.
Probability state support ½Si ¼ 1� ¼ Pr½S�i � 0�¼ X02b2 þ ui2 ¼ gðlocation; sector; foreign sales;
collaborative arrangements; enterprise size;
age; human capital; R&D; ui2Þ ð2Þ
where g is a cumulative distribution function.
Possibly the process differs between the R&D tax
credit and other support schemes because the receipt
of the tax credit is more exclusively dependent upon
enterprise management and less on officials. In which
case, aid Eq. (2) should yield different parameters for
the two types of state support.
Equation 2 can control for non-random allocation
of innovation support to firms in a propensity score
matching exercise (Rosenbaum and Rubin 1983;
Heckman et al. 1997; Oh et al. 2009). If enterprises
were entirely randomly assigned to the two groups,
state aided establishments and others, the difference in
mean innovation outcome could be attributed to the
state aid. Each firm getting state aid is therefore
matched where possible with a business with an
identical probability (propensity score) from Eq. (2)
that did not receive aid.8 All firms that can be matched
are ‘on support’. The difference in the mean innova-
tion chances of these two groups is then attributed to
the aid.
Matching analyses are based on two key principles:
the conditional independence assumption (CIA) and
common support. The first principle requires that any
unobservable variation in innovation chances, after
adjusting for the effects of whatever variables deter-
mine the allocation of support, has the same random
distribution for aided and non-aided firms. Common
support, the second principle, necessitates that com-
parable observations are available for both groups; if
size is a determinant of state aid, some big and some
small firms must receive aid while some of both
categories must not.9
A test of how well the matching is undertaken is to
compare the means of the characteristics determining
the propensity score before and after matching. Firms
with graduates in their workforces are more likely to
innovate than others. Hence before matching firms
receiving innovation support more probably employ
graduates than unaided establishments. But after
matching the chances of employing graduates should
be similar between state aided and control groups—
8 Rosenbaum and Rubin (1983) showed that matching enter-
prises on just the propensity score, rather than matching firms on
the vector of characteristics of Eq. (2), was appropriate. This is
because firms receiving state aid but with the same value of the
propensity score as those not receiving it have the same
distribution as the entire vector of regressors.9 Matching estimators do not rely on linear extrapolation
(outside the common support region) or functional form
assumptions. Nor do they require an exclusion variable or
impose joint normality assumptions.
Effectiveness and efficiency of SME innovation policy
123
even though the matching is on the score and not on
the determinants of the score.10
3.3 Innovation and SME growth
Commonly, models of the impact of innovation and
knowledge seek to explain labour productivity (for
example Belderbos et al. 2004; Roper et al. 2008).
Alternatively they employ a Cobb-Douglas production
function to predict output (for instance Harris et al.
2009). Crepon et al. (1998) use as dependent variable
value added per employee, while van Leeuwen and
Klomp (2006) and Hall et al. (2009) favour turnover
per employee. The present exercise instead adopts
proportionate increase in turnover as the measure of
innovation impact. As discussed below, rise in turn-
over provides the closest approximation to the
increase in welfare from innovation and it is also
readily measurable with CIS4.
Successful innovation either lowers an SME’s costs
or expands their demand or both. If a firm faces a
perfectly price inelastic demand then the proportionate
cut in price from a successful process innovation
would match the proportionate increase in welfare.
Productivity increase would be a good proxy for the
impact of the innovation. But profit maximisation
requires that firms operate in the output range where
they face a price elastic demand. Consequently a cost
and price reduction expands sales and turnover, and
productivity increase understates the value of the
innovation. How much expansion takes place depends
upon the price elasticity of demand.
An impact assessment based solely on labour
productivity and a production function is especially
mis-specified when a product innovation shifts the
enterprise’s demand function. Profit maximisation
normally ensures that sales volume of the now
improved products expands but, with a constant
elasticity of demand and constant returns to scale,
the price remains unchanged. Turnover and output (or
value added) increase, but measured productivity does
not; only welfare or ‘utility’ productivity rise (see
Appendix A in Electronic Supplementary Material). A
conventional productivity index will markedly under-
state the welfare effect of such innovations.
The output increase from innovation is more
closely related to the ‘surplus’ measures of well-being
from welfare economics: consumers’ surplus and
profits. The relation varies with the average price
elasticity of demand faced by the firm in the short run.
Tellis’ (1988) meta-analysis of several hundred stud-
ies concluded that the mean price elasticity faced by
firms was in the region of -2.5. With constant
elasticity demand functions and constant returns to
scale, in this region the proportionate change in sales
revenue is a downward biased measure of welfare
expansion in relation to initial turnover—but consid-
erably less biased downwards than change in produc-
tivity (Appendix A in Electronic Supplementary
Material).
Turning now to the model in which the impact of
innovation on enterprise growth is embedded, younger
firms may possess a greater capacity for learning about
their own capabilities, as well as about their markets,
boosting their growth rates by this route (Pakes and
Ericson 1998). Allowing for enterprise age in the
enterprise growth equation therefore would help
distinguish between innovation itself and other
sources of growth. For the same reason, firms with
greater knowledge capital should be better placed to
grow. Thus human capital and membership of an
enterprise group (Sutton 1997) may be expected to
influence growth independently of size and innova-
tion. For the ith firm then,
Growth rateti ¼ X03b3 þ ui3 ¼ f ðInnovation; Lagged
Output; Age; Human Capital; Enterprise Group
Membership; ui3Þ ð3Þ
Unbiassed estimates of the effect of innovation on
turnover require that the disturbance term, ui3, is
uncorrelated with innovation. Unobserved, especially
innovative managements, may also be less interested
in, or competent at, running a large firm than other
management teams; if so there would be a negative
association between the output disturbance term and
the innovation variable. Equally possibly the opposite
may be true, with a consequential positive association.
Measuring output or turnover before and after the
innovation (in 2002 and 2004 in the present study) and
considering the difference for innovators and non-
10 Combining the propensity score matching with a difference-
in-differences estimator (Blundell and Costa Dias 2000) might
improve the efficiency of estimates. Unfortunately, Community
Innovation Survey 4, the data source for the present exercise,
does not include the observations on SME innovation in two
distinct periods that would permit this approach.
J. Foreman-Peck
123
innovators goes some way to eliminating this problem.
Unobserved management of the above type would be a
common factor that was eliminated by differencing
(Blundell and Costa Dias 2000). However this
‘difference in differences’ approach does not address
the case where, say, unobserved innovative manage-
ment are not very interested in, or conversely good at,
growth.
A potential solution to such bias in this instance is
to instrument innovation to obtain the estimate of the
impact on output growth. In practice good instruments
may not be available and invalid or ‘weak’ instruments
estimate more biased and inconsistent IV coefficients,
as well as with larger standard errors, than those of
OLS (Staiger and Stock 1997). Because instrumental
variables estimators are less efficient than OLS,
whether IV estimation is necessary should be first
tested. Including the residuals from innovation Eq. (1)
in Eq. (3) is such a test for potential bias in the
parameter estimate of the impact of innovation on
growth. It also provides a control function estimate of
the parameter (Heckman and Navarro 2004).11 If the
residuals’ coefficient is not significantly different from
zero the hypothesis can be rejected that the disturbance
term in the growth equation is correlated with the
innovation measure.12 In these circumstances single
equation estimates of the impact of innovation on
growth are consistent and unbiased.
The policy effect then is deduced from the two
basic Eqs. (1) and (3). Two magnitudes can be
obtained from them: the effect of support on the
chances of innovation, and the impact of innovation on
turnover/profits plus consumers’ surplus (on the
assumptions discussed above). The product of these
two parameters gives the average impact of policy on
those enterprises that received support. Multiplying by
the proportion of firms that obtained state aid and their
contribution to the performance measure yields the
boost due to policy. Then if we know how much is
spent on policy this outcome may be interpreted as the
return.
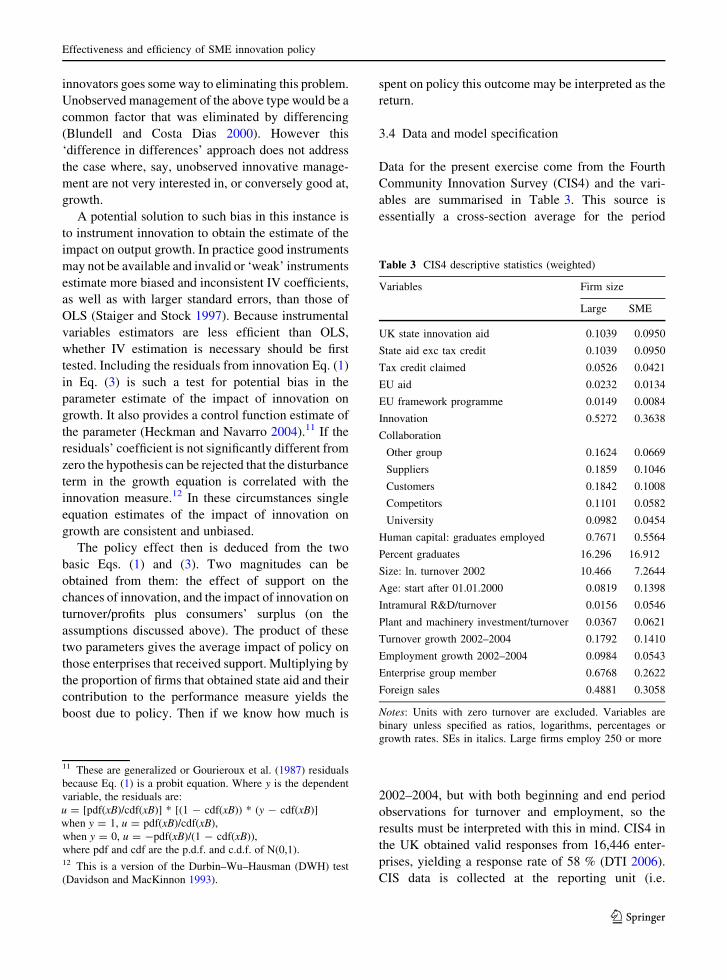
3.4 Data and model specification
Data for the present exercise come from the Fourth
Community Innovation Survey (CIS4) and the vari-
ables are summarised in Table 3. This source is
essentially a cross-section average for the period
2002–2004, but with both beginning and end period
observations for turnover and employment, so the
results must be interpreted with this in mind. CIS4 in
the UK obtained valid responses from 16,446 enter-
prises, yielding a response rate of 58 % (DTI 2006).
CIS data is collected at the reporting unit (i.e.
Table 3 CIS4 descriptive statistics (weighted)
Variables Firm size
Large SME
UK state innovation aid 0.1039 0.0950
State aid exc tax credit 0.1039 0.0950
Tax credit claimed 0.0526 0.0421
EU aid 0.0232 0.0134
EU framework programme 0.0149 0.0084
Innovation 0.5272 0.3638
Collaboration
Other group 0.1624 0.0669
Suppliers 0.1859 0.1046
Customers 0.1842 0.1008
Competitors 0.1101 0.0582
University 0.0982 0.0454
Human capital: graduates employed 0.7671 0.5564
Percent graduates 16.296 16.912
Size: ln. turnover 2002 10.466 7.2644
Age: start after 01.01.2000 0.0819 0.1398
Intramural R&D/turnover 0.0156 0.0546
Plant and machinery investment/turnover 0.0367 0.0621
Turnover growth 2002–2004 0.1792 0.1410
Employment growth 2002–2004 0.0984 0.0543
Enterprise group member 0.6768 0.2622
Foreign sales 0.4881 0.3058
Notes: Units with zero turnover are excluded. Variables are
binary unless specified as ratios, logarithms, percentages or
growth rates. SEs in italics. Large firms employ 250 or more
11 These are generalized or Gourieroux et al. (1987) residuals
because Eq. (1) is a probit equation. Where y is the dependent
variable, the residuals are:
u = [pdf(xB)/cdf(xB)] * [(1 - cdf(xB)) * (y - cdf(xB)]
when y = 1, u = pdf(xB)/cdf(xB),
when y = 0, u = -pdf(xB)/(1 - cdf(xB)),
where pdf and cdf are the p.d.f. and c.d.f. of N(0,1).12 This is a version of the Durbin–Wu–Hausman (DWH) test
(Davidson and MacKinnon 1993).
Effectiveness and efficiency of SME innovation policy
123
establishment) level, not at the firm/enterprise or
plant/local unit level.13
Sampling weights for CIS4 were created by using
the inverse sampling proportion in each stratum.14
These weights may correct for bias introduced by
different response rates across enterprise size, sector
or region, in particular compensating for under-
sampling of small businesses. Formally CIS4 includes
enterprises as small as ten employees, although in the
unweighted data set of the present analysis, 10 %
employ ten or fewer.
In the empirical specification of (1) human capital
is measured by whether or not the enterprise employs
graduates.15 Collaboration options are those with other
group enterprises, with customers, with suppliers, with
competitors and with universities. Firm size is mea-
sured as the log of turnover in 2002. Enterprise ‘age’ is
whether the firm was established after 1 January 2000.
Intramural R&D spending is normalised by turnover
and so is plant and machinery investment. Binary UK
state policy variables distinguish R&D tax credit
claimed, local/regional state support for innovation,
and national/devolved state support. EU policy vari-
ables are first, whether support was received, and
second, if so, whether the enterprise participated in the
5th or 6th Framework. Fourteen industrial sectors are
distinguished and 12 regions.
Just under one in ten SMEs received some form of
state innovation aid (Table 3). R&D tax credits were
more of a minority interest, with slightly less than one
half of firms that received state aid also claiming the
credits. More than half of large businesses stated that
they innovated in the period 2002–2004, compared
with little more than one-third of SMEs.
SMEs more probably started recently and recorded
the higher mean ratios of intramural R&D to turnover
and investment. Smaller establishments were less
likely to utilise graduates but those that did employed
sufficient to ensure that the average proportion of
graduate workers, at just under 17 %, did not vary
much between the two size categories. All forms of
extra-firm collaboration for innovation were more
common with large enterprises.
A comparison of mean turnover and employment
growth across enterprise size indicates that, although
on average SMEs’ turnover rose more slowly, labour
productivity grew faster. Large establishments were
likely to be members of an enterprise group whereas
small establishments were not (three out of four were
not). Consistent with their greater probability of a
more recent start, small firms were unlikely to export
(not much more than a one in four chance) while
almost half of large establishments did so.
The foregoing data provide the variables for
isolating the impact of receipt of state aid on
innovation and, indirectly, on growth. For each
enterprise there are two equations of fundamental
interest, determining the likelihoods of innovation and
growth, and one equation, determining the chances of
state support that may be necessary to ensure such
support can be treated as exogenous to innovation.
4 Results
4.1 State aid and innovation
The first relationship, how state aid affects innovation
by SMEs, is estimated by nearest neighbour propen-
sity score matching (Leuven and Sianesi 2003; Oh
et al. 2009). For matching based upon weighted
equations, standard errors of estimates have not been
defined in the literature. The propensity score
programme PSMatch2 authors (Leuven and Sianesi
13 The CIS survey questionnaire refers to enterprise, but defines
this as a reporting unit. ‘An enterprise is defined as the smallestcombination of legal units that is an organisational unitproducing goods or services, which benefits from a certainautonomy in decision making, especially for the allocation of itscurrent resources. An enterprise carries out one or moreactivities at one or more location.’ So the reporting unit may be
a subsidiary of a larger firm, or it may be a single plant or even
several plants in the same or different regions. Some enterprises
operating in one region may be owned by enterprises located in
another region and so classified to this other region. The smaller
the unit size the more likely it is to be a single plant firm
operating at a single location. The theoretically ideal unit is one
with substantial operational autonomy at the location where it is
recorded. In practice the unit could affect places where it
controls other units without substantial autonomy. For empirical
purposes much depends upon how ‘a certain autonomy’ is
interpreted in the data.14 The weight assigned to each enterprise was the number in the
population divided by the number of responses in that stratum.
On average each respondent represents 11 enterprises in the
population. In our smaller sample there is a maximum of 13,367
enterprises, the median weight is 7.4 and the mean 10.4. The
largest percentile has a weight of 45.7 and the smallest 1.43.15 The proportions of science and engineering graduates
employed in the labour force and the proportion of other
graduates did not prove significant explanatory variables.
J. Foreman-Peck
123
2003) recommend looking at the balance of weighted
and unweighted estimates and choosing the best
balance. In addition to doing this, a pseudo-sample is
created by grossing up the data with the sample
weights, and the matching exercise is conducted on
this much larger data set.
In practice there is little difference between results
from weighted and unweighted data (Appendix B in
Electronic Supplementary Material), and the standard
errors for the unweighted and grossed up data are very
small relative to the coefficients. Collaboration with
universities is one of the most important positive
correlates of the likelihood of receiving state aid for
innovation. Exporters, employers of graduates and
spenders on R&D are also more likely to have
innovation aid. Wales is the region where enterprises
are most likely to get aid, and London the least likely.
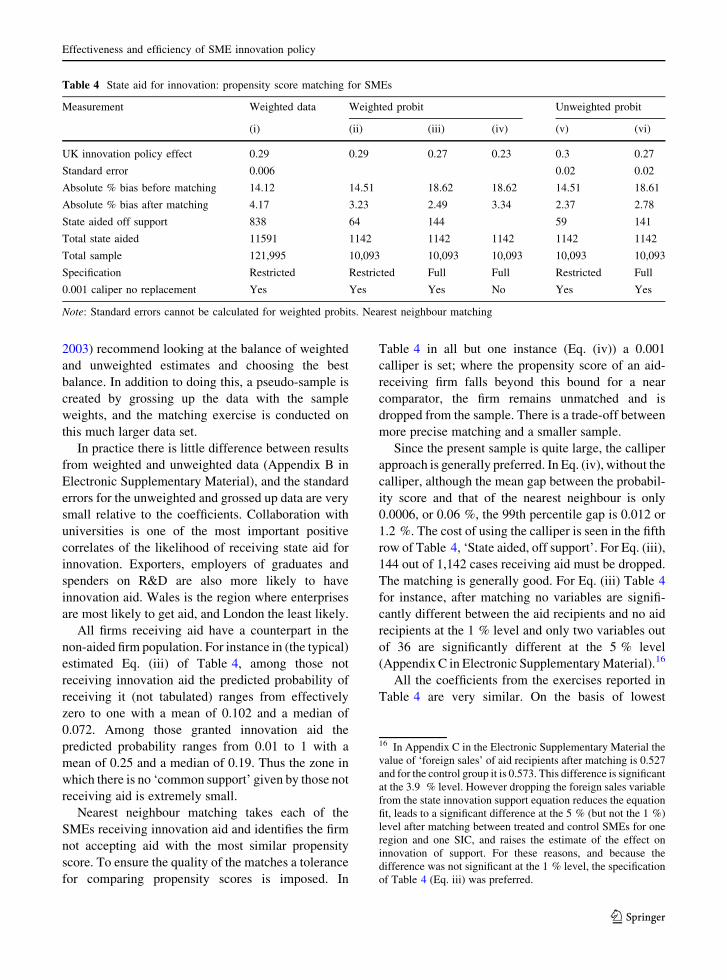
All firms receiving aid have a counterpart in the
non-aided firm population. For instance in (the typical)
estimated Eq. (iii) of Table 4, among those not
receiving innovation aid the predicted probability of
receiving it (not tabulated) ranges from effectively
zero to one with a mean of 0.102 and a median of
0.072. Among those granted innovation aid the
predicted probability ranges from 0.01 to 1 with a
mean of 0.25 and a median of 0.19. Thus the zone in
which there is no ‘common support’ given by those not
receiving aid is extremely small.
Nearest neighbour matching takes each of the
SMEs receiving innovation aid and identifies the firm
not accepting aid with the most similar propensity
score. To ensure the quality of the matches a tolerance
for comparing propensity scores is imposed. In
Table 4 in all but one instance (Eq. (iv)) a 0.001
calliper is set; where the propensity score of an aid-
receiving firm falls beyond this bound for a near
comparator, the firm remains unmatched and is
dropped from the sample. There is a trade-off between
more precise matching and a smaller sample.
Since the present sample is quite large, the calliper
approach is generally preferred. In Eq. (iv), without the
calliper, although the mean gap between the probabil-
ity score and that of the nearest neighbour is only
0.0006, or 0.06 %, the 99th percentile gap is 0.012 or
1.2 %. The cost of using the calliper is seen in the fifth
row of Table 4, ‘State aided, off support’. For Eq. (iii),
144 out of 1,142 cases receiving aid must be dropped.
The matching is generally good. For Eq. (iii) Table 4
for instance, after matching no variables are signifi-
cantly different between the aid recipients and no aid
recipients at the 1 % level and only two variables out
of 36 are significantly different at the 5 % level
(Appendix C in Electronic Supplementary Material).16
All the coefficients from the exercises reported in
Table 4 are very similar. On the basis of lowest
Table 4 State aid for innovation: propensity score matching for SMEs
Measurement Weighted data Weighted probit Unweighted probit
(i) (ii) (iii) (iv) (v) (vi)
UK innovation policy effect 0.29 0.29 0.27 0.23 0.3 0.27
Standard error 0.006 0.02 0.02
Absolute % bias before matching 14.12 14.51 18.62 18.62 14.51 18.61
Absolute % bias after matching 4.17 3.23 2.49 3.34 2.37 2.78
State aided off support 838 64 144 59 141
Total state aided 11591 1142 1142 1142 1142 1142
Total sample 121,995 10,093 10,093 10,093 10,093 10,093
Specification Restricted Restricted Full Full Restricted Full
0.001 caliper no replacement Yes Yes Yes No Yes Yes
Note: Standard errors cannot be calculated for weighted probits. Nearest neighbour matching
16 In Appendix C in the Electronic Supplementary Material the
value of ‘foreign sales’ of aid recipients after matching is 0.527
and for the control group it is 0.573. This difference is significant
at the 3.9 % level. However dropping the foreign sales variable
from the state innovation support equation reduces the equation
fit, leads to a significant difference at the 5 % (but not the 1 %)
level after matching between treated and control SMEs for one
region and one SIC, and raises the estimate of the effect on
innovation of support. For these reasons, and because the
difference was not significant at the 1 % level, the specification
of Table 4 (Eq. iii) was preferred.
Effectiveness and efficiency of SME innovation policy
123
absolute percentage bias after matching, an innovation
aid ‘treatment effect’ of 0.27 with a standard error of
about 0.02 seems the most justifiable.17 The lowest
effect (0.23, Table 4, Eq. (iv)) is achieved with the
uncallipered approach but the maximum absolute
value of [propensity score - propensity score (nearest
neighbour)] was as high as 0.037. Hence the calliper
results are preferred; dropping some observations
seemed a worthwhile price to achieve a closer match.
Because the state aid equation specification may
affect the results, a version (‘restricted’) (not tabu-
lated) excluding the collaboration arrangements of the
SME was compared with a version including them
(‘full’) (Appendix B in Electronic Supplementary
Material). The fuller specification is a better predictor
of support and reduces the absolute bias after matching
relative to the restricted specification in the weighted
callipered equations (compare estimated Eqs. (ii) and
(iii) Table 4) from 3.23 to 2.49 %. Equations (v) and
(vi), the unweighted versions of Eqs. (ii) and (iii),
might suggest a preference for the larger coefficient of
0.3, for Eq. (v) has the lower bias. But the aim of the
present exercise is to establish a conservative or
downward biased estimate of the policy impact so
Eq. (iii) (or vi) is preferred.
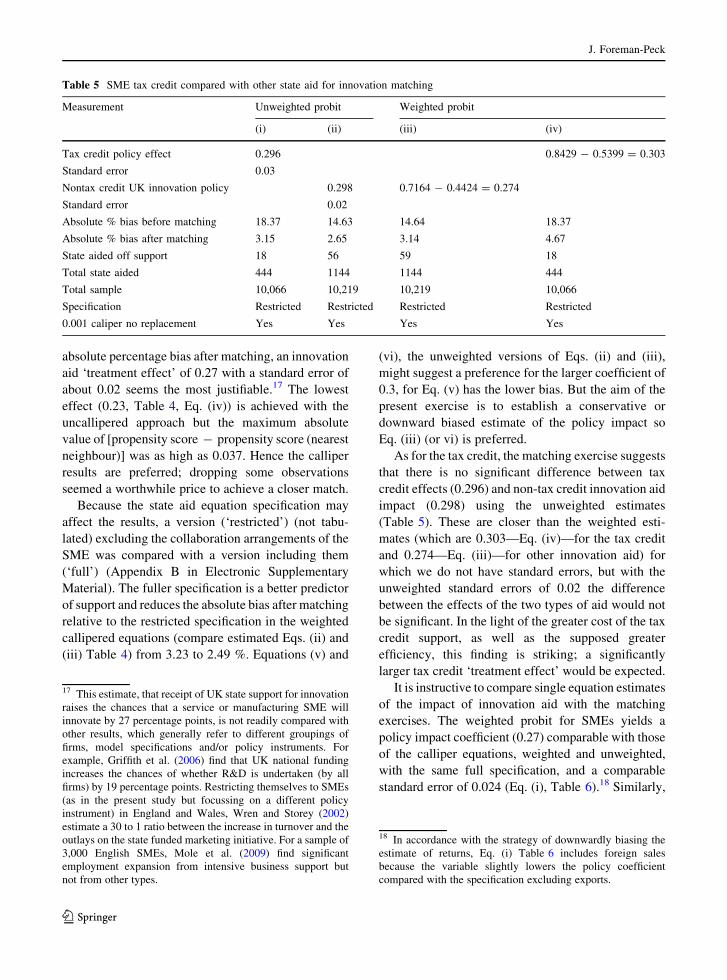
As for the tax credit, the matching exercise suggests
that there is no significant difference between tax
credit effects (0.296) and non-tax credit innovation aid
impact (0.298) using the unweighted estimates
(Table 5). These are closer than the weighted esti-
mates (which are 0.303—Eq. (iv)—for the tax credit
and 0.274—Eq. (iii)—for other innovation aid) for
which we do not have standard errors, but with the
unweighted standard errors of 0.02 the difference
between the effects of the two types of aid would not
be significant. In the light of the greater cost of the tax
credit support, as well as the supposed greater
efficiency, this finding is striking; a significantly
larger tax credit ‘treatment effect’ would be expected.
It is instructive to compare single equation estimates
of the impact of innovation aid with the matching
exercises. The weighted probit for SMEs yields a
policy impact coefficient (0.27) comparable with those
of the calliper equations, weighted and unweighted,
with the same full specification, and a comparable
standard error of 0.024 (Eq. (i), Table 6).18 Similarly,
Table 5 SME tax credit compared with other state aid for innovation matching
Measurement Unweighted probit Weighted probit
(i) (ii) (iii) (iv)
Tax credit policy effect 0.296 0.8429 - 0.5399 = 0.303
Standard error 0.03
Nontax credit UK innovation policy 0.298 0.7164 - 0.4424 = 0.274
Standard error 0.02
Absolute % bias before matching 18.37 14.63 14.64 18.37
Absolute % bias after matching 3.15 2.65 3.14 4.67
State aided off support 18 56 59 18
Total state aided 444 1144 1144 444
Total sample 10,066 10,219 10,219 10,066
Specification Restricted Restricted Restricted Restricted
0.001 caliper no replacement Yes Yes Yes Yes
17 This estimate, that receipt of UK state support for innovation
raises the chances that a service or manufacturing SME will
innovate by 27 percentage points, is not readily compared with
other results, which generally refer to different groupings of
firms, model specifications and/or policy instruments. For
example, Griffith et al. (2006) find that UK national funding
increases the chances of whether R&D is undertaken (by all
firms) by 19 percentage points. Restricting themselves to SMEs
(as in the present study but focussing on a different policy
instrument) in England and Wales, Wren and Storey (2002)
estimate a 30 to 1 ratio between the increase in turnover and the
outlays on the state funded marketing initiative. For a sample of
3,000 English SMEs, Mole et al. (2009) find significant
employment expansion from intensive business support but
not from other types.
18 In accordance with the strategy of downwardly biasing the
estimate of returns, Eq. (i) Table 6 includes foreign sales
because the variable slightly lowers the policy coefficient
compared with the specification excluding exports.
J. Foreman-Peck
123
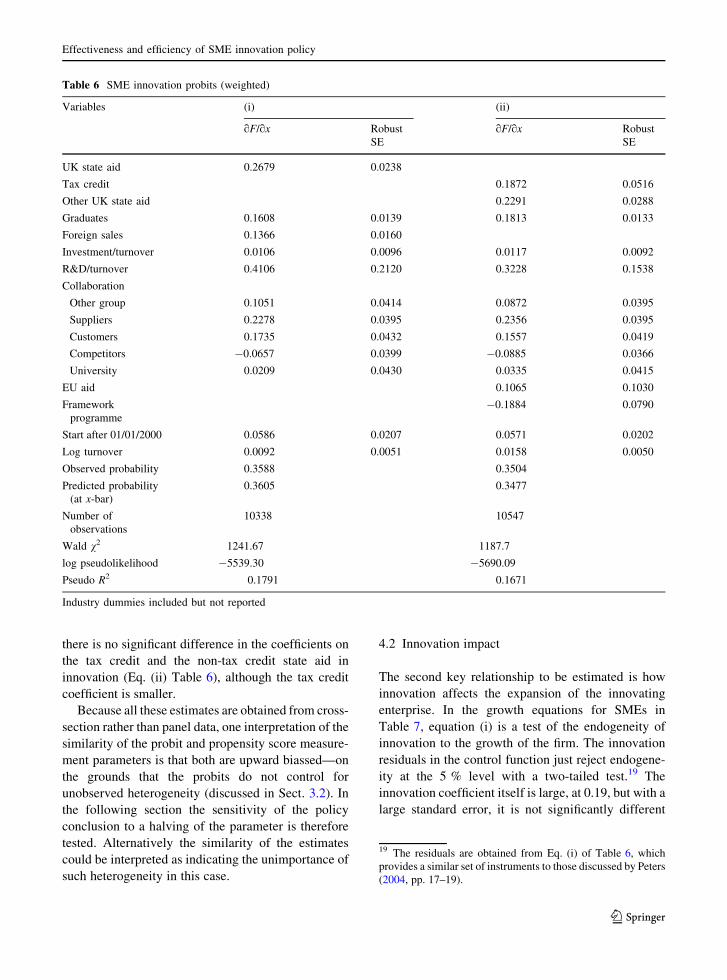
there is no significant difference in the coefficients on
the tax credit and the non-tax credit state aid in
innovation (Eq. (ii) Table 6), although the tax credit
coefficient is smaller.
Because all these estimates are obtained from cross-
section rather than panel data, one interpretation of the
similarity of the probit and propensity score measure-
ment parameters is that both are upward biassed—on
the grounds that the probits do not control for
unobserved heterogeneity (discussed in Sect. 3.2). In
the following section the sensitivity of the policy
conclusion to a halving of the parameter is therefore
tested. Alternatively the similarity of the estimates
could be interpreted as indicating the unimportance of
such heterogeneity in this case.
4.2 Innovation impact
The second key relationship to be estimated is how
innovation affects the expansion of the innovating
enterprise. In the growth equations for SMEs in
Table 7, equation (i) is a test of the endogeneity of
innovation to the growth of the firm. The innovation
residuals in the control function just reject endogene-
ity at the 5 % level with a two-tailed test.19 The
innovation coefficient itself is large, at 0.19, but with a
large standard error, it is not significantly different
Table 6 SME innovation probits (weighted)
Variables (i) (ii)
qF/qx Robust
SE
qF/qx Robust
SE
UK state aid 0.2679 0.0238
Tax credit 0.1872 0.0516
Other UK state aid 0.2291 0.0288
Graduates 0.1608 0.0139 0.1813 0.0133
Foreign sales 0.1366 0.0160
Investment/turnover 0.0106 0.0096 0.0117 0.0092
R&D/turnover 0.4106 0.2120 0.3228 0.1538
Collaboration
Other group 0.1051 0.0414 0.0872 0.0395
Suppliers 0.2278 0.0395 0.2356 0.0395
Customers 0.1735 0.0432 0.1557 0.0419
Competitors -0.0657 0.0399 -0.0885 0.0366
University 0.0209 0.0430 0.0335 0.0415
EU aid 0.1065 0.1030
Framework
programme
-0.1884 0.0790
Start after 01/01/2000 0.0586 0.0207 0.0571 0.0202
Log turnover 0.0092 0.0051 0.0158 0.0050
Observed probability 0.3588 0.3504
Predicted probability
(at x-bar)
0.3605 0.3477
Number of
observations
10338 10547
Wald v2 1241.67 1187.7
log pseudolikelihood -5539.30 -5690.09
Pseudo R2 0.1791 0.1671
Industry dummies included but not reported
19 The residuals are obtained from Eq. (i) of Table 6, which
provides a similar set of instruments to those discussed by Peters
(2004, pp. 17–19).
Effectiveness and efficiency of SME innovation policy
123
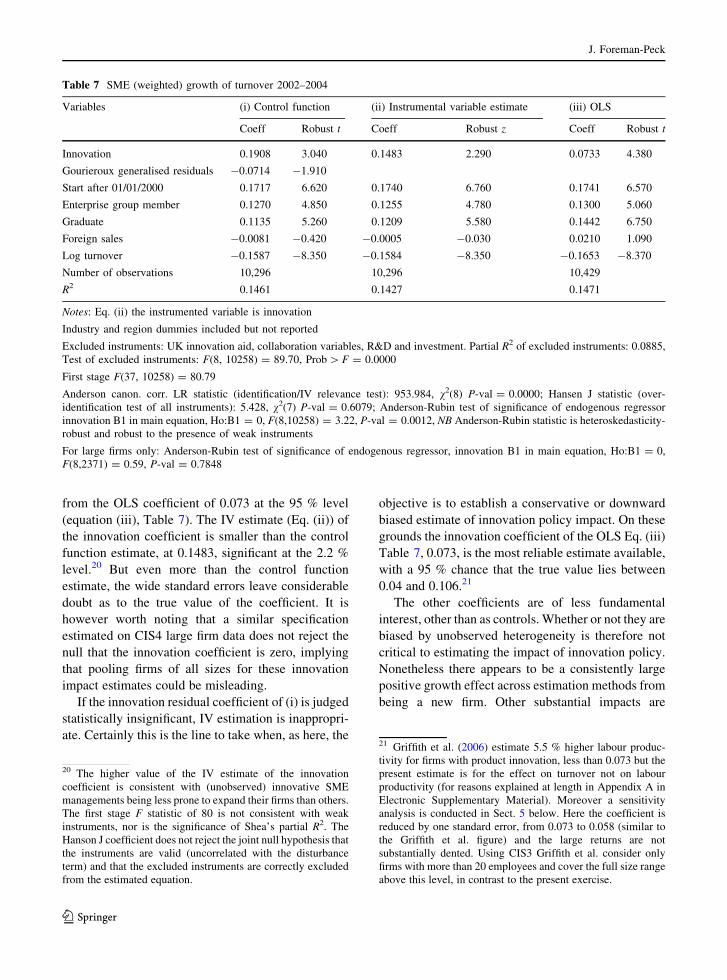
from the OLS coefficient of 0.073 at the 95 % level
(equation (iii), Table 7). The IV estimate (Eq. (ii)) of
the innovation coefficient is smaller than the control
function estimate, at 0.1483, significant at the 2.2 %
level.20 But even more than the control function
estimate, the wide standard errors leave considerable
doubt as to the true value of the coefficient. It is
however worth noting that a similar specification
estimated on CIS4 large firm data does not reject the
null that the innovation coefficient is zero, implying
that pooling firms of all sizes for these innovation
impact estimates could be misleading.
If the innovation residual coefficient of (i) is judged
statistically insignificant, IV estimation is inappropri-
ate. Certainly this is the line to take when, as here, the
objective is to establish a conservative or downward
biased estimate of innovation policy impact. On these
grounds the innovation coefficient of the OLS Eq. (iii)
Table 7, 0.073, is the most reliable estimate available,
with a 95 % chance that the true value lies between
0.04 and 0.106.21
The other coefficients are of less fundamental
interest, other than as controls. Whether or not they are
biased by unobserved heterogeneity is therefore not
critical to estimating the impact of innovation policy.
Nonetheless there appears to be a consistently large
positive growth effect across estimation methods from
being a new firm. Other substantial impacts are
Table 7 SME (weighted) growth of turnover 2002–2004
Variables (i) Control function (ii) Instrumental variable estimate (iii) OLS
Coeff Robust t Coeff Robust z Coeff Robust t
Innovation 0.1908 3.040 0.1483 2.290 0.0733 4.380
Gourieroux generalised residuals -0.0714 -1.910
Start after 01/01/2000 0.1717 6.620 0.1740 6.760 0.1741 6.570
Enterprise group member 0.1270 4.850 0.1255 4.780 0.1300 5.060
Graduate 0.1135 5.260 0.1209 5.580 0.1442 6.750
Foreign sales -0.0081 -0.420 -0.0005 -0.030 0.0210 1.090
Log turnover -0.1587 -8.350 -0.1584 -8.350 -0.1653 -8.370
Number of observations 10,296 10,296 10,429
R2 0.1461 0.1427 0.1471
Notes: Eq. (ii) the instrumented variable is innovation
Industry and region dummies included but not reported
Excluded instruments: UK innovation aid, collaboration variables, R&D and investment. Partial R2 of excluded instruments: 0.0885,
Test of excluded instruments: F(8, 10258) = 89.70, Prob [ F = 0.0000
First stage F(37, 10258) = 80.79
Anderson canon. corr. LR statistic (identification/IV relevance test): 953.984, v2(8) P-val = 0.0000; Hansen J statistic (over-
identification test of all instruments): 5.428, v2(7) P-val = 0.6079; Anderson-Rubin test of significance of endogenous regressor
innovation B1 in main equation, Ho:B1 = 0, F(8,10258) = 3.22, P-val = 0.0012, NB Anderson-Rubin statistic is heteroskedasticity-
robust and robust to the presence of weak instruments
For large firms only: Anderson-Rubin test of significance of endogenous regressor, innovation B1 in main equation, Ho:B1 = 0,
F(8,2371) = 0.59, P-val = 0.7848
20 The higher value of the IV estimate of the innovation
coefficient is consistent with (unobserved) innovative SME
managements being less prone to expand their firms than others.
The first stage F statistic of 80 is not consistent with weak
instruments, nor is the significance of Shea’s partial R2. The
Hanson J coefficient does not reject the joint null hypothesis that
the instruments are valid (uncorrelated with the disturbance
term) and that the excluded instruments are correctly excluded
from the estimated equation.
21 Griffith et al. (2006) estimate 5.5 % higher labour produc-
tivity for firms with product innovation, less than 0.073 but the
present estimate is for the effect on turnover not on labour
productivity (for reasons explained at length in Appendix A in
Electronic Supplementary Material). Moreover a sensitivity
analysis is conducted in Sect. 5 below. Here the coefficient is
reduced by one standard error, from 0.073 to 0.058 (similar to
the Griffith et al. figure) and the large returns are not
substantially dented. Using CIS3 Griffith et al. consider only
firms with more than 20 employees and cover the full size range
above this level, in contrast to the present exercise.
J. Foreman-Peck
123
associated with membership of an enterprise group
and employing graduates. Surprisingly perhaps,
exporting appears to make no difference to growth
of turnover.
SMEs in mining and quarrying, the base case, were
in a relatively fast growing sector, not different from
financial intermediation and significantly greater than
most manufacturing sectors. Only SMEs in electricity
gas and water were likely to grow faster. The sole
significant effect at the regional level was the slower
growth of SMEs in the West Midlands.
5 Was innovation policy efficient?
The return to the state support for innovation by SMEs
depends on the boost to well-being from innovation. In
Sect. 3.3 and Appendix A in the Electronic Supple-
mentary Material it is contended that change in
turnover or revenue (DR) is the most appropriate
available indicator of change in wellbeing, as mea-
sured by consumers’ surplus and profits. This then is
the return to policy. The counterfactual policy is no
state support. So the number of firms (n) actually
receiving aid may be denoted by the increase in state
support (DS) from the counterfactual position (where
S is a binary variable as defined in Sect. 3.2 above).
The proportionate increase in turnover induced by
innovation aid for the average firm is the proportion of
SMEs aided (n/N) times the product of two parameters.
They are, first from Eq. (1), the increase in the chances
of the average firm innovating (DPr(I)) as a conse-
quence of receiving state aid for this purpose (defined
as a = DPr(I)/DS)). The second, from Eq. (3), is the
average SME’s lift to turnover as a result of innovating
(defined as k = DR/(RDI)). The result of state sup-
ported innovation for the average SME is then:
DR=R ¼ akðn=NÞ ð4Þ
where DR is the measure of induced SME profit (P)
and the consumers’ surplus (CS). Aggregating over
the whole economy DR must be evaluated in terms of
value added. Relevant GDP is Nv, where v is the
average SME value added and N is the number of
SMEs. Average SME value added is less than average
turnover. The consumers’ surplus and profit measures
are calculated as proportions of turnover (DR/
R B ((DCS ? DP)/R)) and so are multiplied by R/v
to convert them into GDP units. This allows Eq. (4) to
be expanded to yield the value of the welfare gain—
the product of the turnover boost to the average (non-
micro) SME (DR) and the number of SMEs (N).
NvðR=vÞðDR=RÞ ¼ akðn=NÞðR=vÞNv ¼ NDR ð5ÞUK private sector GDP 2002 was £830 billion.22
SMEs account for about one half of British private
sector output, but micro firms are not sampled by CIS.
Micro firms produce approximately one half of the
turnover of the SME sector (BERR 2008). Including
their output contribution in the model would upward
bias the calculation and excluding it would impart a
downward bias. The latter option is preferred here. So
SME innovation policy is assumed to be working on
27.5 % of private sector output in 2002 or (£830
billion * 0.275=) £228 billion. This must equal the
product of the average value added per SME (v) and
the number of (non-micro) SMEs (N). The ratio R/v for
the private sector SMEs was about 2.75 in 2002.23 The
proportion of SMEs aided was (n/N = 9.5 %), the
total innovation impact on output (in Table 7 esti-
mated Eq. (iii)) is k = 0.0733, and the innovation
parameter for total innovation support (Table 4, Eqs.
(iii) or (vi)) is a = 0.27.
Using Eq. (5), where DR is welfare improvement
(=increase in consumers’ surplus plus profit), the
return to state aid in terms of GDP is
¼ relevant GDPð Þ R=vð Þ DR=RDIð ÞðDPr Ið Þ=DSÞ n=Nð Þ¼ 228 � 2:75 � 0:0733 � 0:27 � 0:095
¼ £1180 million in each year in 2002 prices
This must be compared with the approximately
£320 million p.a. cost of SME innovation policy
2002–2004 to obtain the return.24 Then the downward
biased benefit estimate implies more than a 250 %
22 Government weight 0.225 removed from £1075 billion GDP
for 2002 from Meader and Tily (2008).23 Calculated from BIS (Table 1) 2002 and 2007 Enterprise and
Small Businesses. http://webarchive.nationalarchives.gov.uk/
?/http://www.berr.gov.uk/whatwedo/enterprise/enterprisesmes/
index.html.24 Abramovsky et al. (2004)’s named support programme totals
(using the earlier years, where there are two) amount to £156
million per annum. Multiply by 0.8 (because in January 2004,
there were 899 Knowledge Transfer Partnerships, roughly 80 %
of which involved SMEs; about 2,400 firms, mostly SMEs, and
about 200 research base institutions were involved in 75 LINK
programmes since the launch of LINK in 1986) to get an
approximation to the SME allocation. Add in SME R&D tax
Effectiveness and efficiency of SME innovation policy
123
return on the £320 million outlay. Reducing the state
aid coefficient (a) by one standard error (0.02) lowers
the return to £1090 million, making little difference.
Cutting it in half, halves the money valued return,
which is still an excellent 84 %. Lowering the growth
impact of innovation (k) by one standard error (0.015)
cuts the benefit to £930 million, again not significantly
denting the massive return. Combining this reduced
k with a halving of a yields a return of 46 %; there is
plenty of scope for downward revisions of parameter
estimates while leaving high policy returns. It should
also be remembered that among other large downward
biases to the welfare estimates is that benefits to micro
firms are not considered, nor are spillovers, and that
the output impact of an innovation may well continue
after the 3-year period considered.25
According to the SME equation much of the return
to innovation could apparently be earned without the
expensive tax credit.26 Tax credits had a smaller take
up than other innovation policies (4.2 % of SMEs
compared with 9.5 %, Table 3). Table 5 (propensity
score matching) and Table 6 (the weighted innovation
equation) suggest that the tax credit impact on
innovation was unlikely to have been significantly
stronger than other innovation policy instruments,
despite the greater expense. Perhaps the spread of
information about the tax credit in due course would
raise innovation rates, but presumably at additional
public cost.
6 Conclusion
Three basic equations have been proposed to link
innovation support, innovation outcomes and SME
growth. By focussing on self-reported innovation the
approach ensures a wider coverage of innovative
SMEs that respond to policy than included in most
studies. The large (around 10,000 observations) rep-
resentative UK SME sample includes both services
and manufacturing businesses, although micro firms
are largely excluded.
In view of the inevitable uncertainties in evaluating
SME innovation policy, the method has been to aim
for a downward biased or conservative estimate of
impact. The study addresses the policy counterfactual
of how an enterprise would have performed if it had
not received innovation support, when actually it did,
with propensity score matching. The matching exer-
cises generated broadly similar estimates of the impact
of UK state aid upon innovation, the first key
parameter, to those from conventional single equation
approaches.
To justify the use of the turnover SME performance
variable, the paper discussed how policy benefits
could best be defined and measured, a theme generally
left implicit in the literature. UK SME performance
and innovation equations show that self-reported
innovation significantly predicts differences in enter-
prise turnover growth. Estimates of the second key
parameter, the effect of innovations on growth,
indicate strong and significant boosts to SME revenue.
There is no significant difference between the effects
on SMEs of R&D tax credits and other state aid for
innovation. Since the much smaller take up implies
that the tax credit is an expensive instrument, the
findings are consistent with Baghana and Mohnen’s
(2009) assessment of considerable deadweight losses
from such credits.
Comparing the calculated payoffs with the outlays
implies that the returns to British innovation policy
2002–2004 were nonetheless very substantial.
Because no attempt is made to calculate spillover
benefits between enterprises, the gains for micro
enterprises or the persistence of induced innovation
effects beyond the 3-year window, the estimates of
policy impact will be downward biased for these
reasons. The bias reinforces the conclusion that SME
innovation policy is efficient as well as effective. Also,
the finding supplements the consensus view of high
social returns to R&D by extending it to include other
forms of innovation effort, as far as SMEs are
concerned. A reason the estimated returns are so large
is that, unlike the conventional productivity approach,
the performance measure here does take into account
demand shifting by innovation and measures welfare
effects more appropriately. Also the greater coverage
of firms without formal R&D recorded markedly
expands the number of SMEs assessed as responding
Footnote 24 continued
credits of about £0.2 billion p.a. to reach approximately £ 320
million p.a. as the cost of SME innovation policy 2002–2004.25 The profits and consumers’ surplus performance measure are
ratios with turnovers as denominators so the same turnover to
value added ratio is needed to calculate the impact in these
terms.26 Unless tax credits triggered innovations that were dispro-
portionately productive.
J. Foreman-Peck
123
to state innovation aid. These very high returns found
suggest that, even in times of public spending cuts,
persisting with SME innovation policy would be
prudent.
Acknowledgments Thanks to Peng Zhou and Tom Nicholls
for excellent research assistance and to anonymous referees for
their comments on an earlier draft.
Disclaimer This work contains statistical data from ONS
which is Crown copyright and reproduced with the permission
of the controller of HMSO and Queen’s Printer for Scotland.
The use of the ONS statistical data in this work does not imply
the endorsement of the ONS in relation to the interpretation or
analysis of the statistical data. This work uses research datasets
which may not exactly reproduce National Statistics aggregates.
References
Abramovsky, L., Harrison, R., & Simpson, H. (2004). Increas-
ing innovative activity in the UK? Where now for gov-
ernment support for innovation and technology transfer?
IFS Briefing Note no. 53.
Acs, Z., & Audretsch, D. (1988). Innovation in large and small
firms: An empirical analysis. American Economic Review,78, 678–690.
Baghana, R., & Mohnen, P. (2009). Effectiveness of R&D tax
incentives in small and large enterprises in Quebec. SmallBusiness Economics, 33, 91–107.
Belderbos, R., Carree, M., & Lokshin, B. (2004). Cooperative
R&D and firm performance. Research Policy, 33(10),
1477–1492.
BERR. (2008). SME statistics for the UK and regions 2007,
http://webarchive.nationalarchives.gov.uk/201109201517
22/http://stats.bis.gov.uk/ed/sme/index.htm.
BIS. (2010). Internationalisation of innovative and high growth
SMEs. BIS Economics Paper No. 5 March, Department for
Business Innovation and Skills.
Blundell, R., & Costa Dias, M. (2000). Evaluation methods for
non-experimental data. Fiscal Studies, 21, 427–468.
Cassiman, B., & Veugelers, R. (2002). R&D cooperation and
spillovers: Some empirical evidence from Belgium.
American Economic Review, 92(4), 1169–1184.
Cassiman, B., & Veugelers, R. (2005). R&D cooperation
between firms and universities, some empirical evidence
from Belgian manufacturing. International Journal ofIndustrial Organization, 23, 355–379.
Commission of the European Communities (2006). Framework
for state aid for research and development and innovation
(2006/C 323/01)
Crepon, B., Duguet, E., & Mairesse, J. (1998). Research,
innovation, and productivity: An econometric analysis at
the firm level. Economics of Innovation and New Tech-nology, 7(2), 115–158.
Czarnitzki, D., Hanel, P., & Rosa, J. (2011). Evaluating
the impact of R&D tax credit on innovation: A
microeconometric study on Canadian firms. ResearchPolicy, 40(2), 217–229.
Davidson, R., & Mackinnon, J.G. (1993). Estimation andInference in Econometrics. New York: Oxford University
Press.
Department for Innovation Universities and Skills. (2008).
Persistence and change in UK innovation 2002–2006.
http://www.dius.gov.uk.
DTI. (2006). Innovation in the UK: Indicators and insights. DTI
occasional paper no. 6 July.
DTI Innovation Report. (2003). Competing in the global econ-
omy: the innovation challenge. December, http://www.
berr.gov.uk/files/file12093.pdf. Accessed 11 March 2012.
Freel, M. S. (2000). Do small innovating firms outperform non-
innovators? Small Business Economics, 14, 195–210.
Gourieroux, C., Monfort, A., Renault, E., & Trognon, Al.
(1987). Generalised residuals. Journal of Econometrics,34(1/2), 5–32.
Griffith, R., Huergo, E., Mairesse, J., & Peters, B. (2006).
Innovation and productivity across four European coun-
tries. Oxford Review of Economic Policy, 22(4), 483–498.
Griffith, R., Redding, S., & Van Reenen, J. (2001). Measuring
the cost-effectiveness of an R&D tax credit for the UK.
Fiscal Studies, 22(3), 375–399.
Griliches, Z. (1990). Patent statistics as economic indicators: A
survey. Journal of Economic Literature, 28, 1661–1707.
H M Treasury. (2003). The Green Book: Appraisal and evalu-
ation in Central Government. London TSO. http://www.
hm-treasury.gov.uk/d/green_book_complete.pdf. Acces-
sed 11 March 2012.
H M Treasury, DTI, & DfES. (2004). Science and innovation
investment framework 2004–2014. July. http://www.bis.
gov.uk/files/file40398.doc
Hall, B. (2009). The financing of innovative firms. EIB Papers,14(2), 8–29.
Hall, B., Lotti, F., & Mairesse, J. (2009). Innovation and pro-
ductivity in SMEs: Empirical evidence for Italy. SmallBusiness Economics, 33(1), 13–33.
Hall, B., & Van Reenen, J. (1999). How effective are fiscal
incentives for R&D? A review of the evidence. ResearchPolicy, 29, 449–469.
Harris R. (2008). An empirical study of the respective contri-
butions of exporting and foreign direct investment to UK
R&D, UK Trade and Industry, November. http://www.
tradeinvest.gov.uk/download/file/115272.html
Harris, R., Cher Li, Q., & Trainor, M. (2009). Is a higher rate of
R&D tax credit a panacea for low levels of R&D in dis-
advantaged regions? Research Policy, 38, 192–200.
Heckman, J. J., Ichimura, H., & Todd, P. (1997). Matching as an
econometric evaluation estimator: Evidence from evalu-
ating a job training program. Review of Economic Studies,64(4), 605–654.
Heckman, J. J., & Navarro, S. (2004). Using matching, instru-
mental variables, and control functions to estimate eco-
nomic choice models. Review of Economics and Statistics,86(1), 30–57.
Ientile, D., & Mairesse, J. (2009). A policy to boost R&D: Does
the R&D tax credit work? EIB Papers, 14(1), 145–168.
Jaumotte, F., & Pain, N. (2005a). Innovation in the business
sector, OECD Economics Department Working Papers no.
459.
Effectiveness and efficiency of SME innovation policy
123
Jaumotte, F., & Pain, N. (2005b). From innovation development
to implementation: Evidence from the community inno-
vation survey, OECD Economics Department Working
Papers no. 458.
Jones, C., & Williams, J. (1998). Measuring the social return to
R&D. Quarterly Journal of Economics, 113, 1119–1136.
Kleinknecht, A. (1987). Measuring R&D in small firms: How
much are we missing? Journal of Industrial Economics, 36,
253–256.
Leuven, E., & Sianesi, B. (2003). PSMATCH2: Stata module to
perform full Mahalanobis and propensity score matching,
common support graphing, and covariate imbalance test-
ing. http://ideas.repec.org/c/boc/bocode/s432001.html.
Accessed 11 March 2012.
Lev, B. (2001). Intangibles: Management, measurement, andreporting. Washington, DC: Brookings Institution Press.
Meader, R., & Tily, G. (2008). Overview of UK national
accounts and balance of payments: Blue Book and Pink
Book 2008. Economic and Labour Market Review, 2(10),
33–43.
Mole, K., Hart, M., & Roper, S. (2009). Assessing the effec-
tiveness of business support services in England. Interna-tional Small Business Journal, 27, 557–583.
North, D., & Smallbone, D. (2000). The innovativeness and
growth of rural SMEs during the 1990s. Regional Studies,34, 145–157.
OECD. (2003). Tax incentives for research and development:Trends and issues. Paris: OECD.
Oh, I., Lee, J.-D., Heshmati, A., & Choi, G.-G. (2009). Evalu-
ation of credit guarantee policy using propensity score
matching. Small Business Economics, 33, 335–351.
Pakes, A., & Ericson, R. (1998). Empirical implications of
alternative models of firm dynamics. Journal of EconomicTheory, 79, 1–45.
Peters, B. (2004). Employment effects of different innovation
activities: Microeconometric evidence. ZEW—Centre for
European Economic Research Discussion Paper No.
04-073.
Rammer, C., Czarnitzki, D., & Spielkamp, A. (2009). Innova-
tion success of non-R&D-performers: Substituting tech-
nology by management in SMEs. Small BusinessEconomics, 33, 35–58.
Roper, S., Du, J., & Love, J. H. (2008). Modelling the innovation
value chain. Research Policy, 37, 961–977.
Rosenbaum, P., & Rubin, D. (1983). The central role of the
propensity score in observational studies for causal effects.
Biometrica, 70, 41–50.
Skuras, D., Tsegenidi, K., & Tsekouras, K. (2008). Product
innovation and the decision to invest in fixed capital assets:
Evidence from an SME survey in six European Union
member states. Research Policy, 37, 1778–1789.
Smith, K. (2005). Measuring Innovation. In J. Fagerberg, D.
C. Mowery, & R. R. Nelson (Eds.), Oxford handbook ofinnovation. Oxford: Oxford University Press.
Staiger, D., & Stock, J. (1997). Instrumental variables regression
with weak instruments. Econometrica, 65(3), 557–586.
Sutton, J. (1997). Gibrat’s legacy. Journal of Economic Liter-ature, 35, 40–59.
Tellis, G. J. (1988). The price elasticity of selective demand: A
meta-analysis of econometric models of sales. Journal ofMarketing Research, 25, 331–341.
Tether, B. S., Smith, I. J., & Thwaites, A. T. (1997). Smaller
enterprises and innovation in the UK: The SPRU innova-
tions database revisited. Research Policy, 2, 19–32.
van Leeuwen, G., & Klomp, L. (2006). On the contribution of
innovation to multi-factor productivity growth. Economicsof Innovation and New Technology, 15(4–5), 367–390.
Wieser, R. (2005). Research and development productivity and
spillovers: Empirical evidence at the firm level. Journal ofEconomic Surveys, 19(4), 587–621.
Wren, C., & Storey, D. J. (2002). Evaluating the effect of soft
business support upon small firm performance. OxfordEconomic Papers, 54, 334–355.
J. Foreman-Peck
123