Embed Size (px)
Citation preview
RESEARCH ARTICLE Open Access
Effective separation of organic dyes usingionic liquids as green mobile phase andpolyaniline-modified silica gelnanocomposite-based thin-layerchromatographyAli Mohammad1*, Mahfoozurrahman Khan1, Qasim Ullah2 and Faiz Mohammad1
Abstract
Background: Organic dyes are used for a wide variety of purposes including their applications in textiles, foods,printing cosmetics and pharmaceuticals. Thus, these are industrially very important and their analysis is alwaysrequired before putting to particular use.
Methods: To develop the extremely efficient thin layer chromatographic system for the resolution of co-existingdyes, the silica gel was modified with the conducting polymer polyaniline. Silica gel and polyaniline modified silicagel were used as stationary phase while the different formulations based on aqueous solutions of ionic liquids suchas 1-methyl-imidazolium chloride, 1,2,3-trimethylimidazolium methyl sulphate and 1-ethyl 3-methyl-imidazoliumtetrafluoroborate were used as mobile phase to study the migration behaviour of organic dyes.
Results: Comparatively better separation efficiency was observed in case of polyaniline modified silica gel withrespect to unmodified silica gel. Densitogrpahic presentation of separation of organic dyes achieved usingpolyaniline modified silica gel (Pani@SG-ES) was also presented. The thin layer chromatographic system comprisingof polyaniline modified silica gel (Pani@SG-ES) as stationary phase and 2% aqueous 1- methyl-imidazolium chlorideas green mobile phase was observed to be most efficient towards separation of several three-component mixturesof organic dyes. The effect of presence of impurities on the efficiency of separation was examined and thedetection limits of the dyes were also calculated. Fourier transform infrared spectroscopy (FTIR), X-ray diffraction(XRD), scanning electron microscopy (SEM with EDX) and transmission electron micrograph (TEM) studies wereundertaken to characterize silica gel and polyaniline modified silica.
Conclusions: A new thin layer chromatographic system consisting of polyaniline modified silica gel (S2) asstationary phase with 2 % aqueous (1-methylimidazolium chloride) as eco-friendly mobile phase is most favourablefor the identification and separation of three-component mixtures of organic dyes.
Keywords: Thin-layer chromatography, Polyaniline-modified silica gel nanocomposites, Efficient separation oforganic dyes, Ionic liquids
* Correspondence: [email protected] of Applied Chemistry, Faculty of Engineering and Technology,Aligarh Muslim University, Aligarh 202002, IndiaFull list of author information is available at the end of the article
Journal of Analytical Scienceand Technology
© The Author(s). 2017 Open Access This article is distributed under the terms of the Creative Commons Attribution 4.0International License (http://creativecommons.org/licenses/by/4.0/), which permits unrestricted use, distribution, andreproduction in any medium, provided you give appropriate credit to the original author(s) and the source, provide a link tothe Creative Commons license, and indicate if changes were made.
Mohammad et al. Journal of Analytical Science and Technology (2017) 8:18 DOI 10.1186/s40543-017-0127-8
BackgroundA wide variety of colours and shades imparts beauty toour planet, and everyone is attracted towards anythingthat is colourful and beautiful, but natural dyes arehighly unstable and undergo degradation during the in-dustrial processing. The counterparts of natural pig-ments are the synthetic dyes that are coloured aromaticcompounds having strong affinity to the substrates onwhich they are applied. Although the dyes are used for awide variety of purposes, their application such as in tex-tiles, foods and printing is industrially very important(Alves et al. 2008; Amini et al. 2011; Charumathi andDas 2012). Food dyes are the most controversial but es-sential group of food additives as they are unavoidablecolourants of foods, cosmetics and drugs for aestheticreasons (Piccin et al. 2009; Wrolstad and Culver 2012).The tinge of colour of a product psychologically im-proves its attractiveness, freshness and taste.Thin-layer chromatography (TLC) is one of the most effi-
cient and versatile separation methods for many classes ofchemical compounds. It has advantages over the otherchromatographic techniques such as low cost of instrumen-tation, the ability of making simultaneous separations andshorter time required in analysis. All these make TLC aconvenient choice for a variety of chemical procedures in-cluding monitoring the progress of a reaction, analysing acompound or mixture of compounds, determining optimalchromatographic conditions for the separation of compo-nents in a mixture and identifying the components in amixture (Oka et al. 1994; Hoodless et al. 1971). TLC hasalso been established as an essential educational tool for theteaching of chromatographic principles in organic chemis-try laboratories worldwide (Clark 2007; Atayan et al. 2003).It is a simply known fact that the double-distilled water
(DDW) has occupied the top position in the list of greensolvents due to its non-toxicity, amazing solubilising prop-erties, ease of availability and low thermal conductivity(Mohammad and Mobin, 2015a, 2015b). On the otherhand, certain ionic liquids have attracted a lot of attentionof researchers working in the areas of organic synthesis(Friedmann et al. 2016), chromatography (Tabar Heydaret al. 2013; Wang et al. 2014; Yoshinaga et al. 2014; Yoshi-naga et al. 2014; Yoshinaga et al. 2014), biotechnology andenvironmental engineering (Jones et al. 2002) mainly dueto their unique combination of physicochemical proper-ties such as very low volatility, non-flammability, highthermal and chemical stability and a large range of tem-peratures of their liquid state (Seddon 2003; Gutowski etal. 2003). The ionic liquids have also become greatly usefulin spectroscopy and electrochemistry (López-Lorente etal. 2013; Lee et al. 2014; Sun et al. 2012; Ejigu et al. 2011).The coupling of favourable properties of polyaniline
(Pani) such as good environmental stability, high electricalconductivity, electrochromism, reversible transformation
of various oxidation states, and catalytic, antistatic and an-ticorrosion activity with the favourable properties of silicagel such as good heat resistance, high strength and hard-ness will be expected to produce a new and novel station-ary phase of improved structural and chromatographiccharacteristics (Ge and Wallace 1991). The Pani@SG-S2enhances the selectivity and chemical stability of the sta-tionary phase (Siddiq et al. 2014) while the ionic liquids asgreen mobile phase have been used due to their versatilityand environmental friendliness. In TLC, the ionic liquidshave been found useful as mobile phase for the separationof peptides and in the determination of naphazoline ni-trate in nasal drops (Marszall et al. 2013).In the present study, the polyaniline-modified silica gel
nanocomposite (Pani@SG-S2) has been prepared by in situpolymerisation of aniline to be used as stationary phasewith several aqueous ionic liquid mobile phases for thin-layer chromatographic analysis of six dyes, viz. alizarin redS, xylenol orange, bromo-cresol purple, brilliant blue, tar-trazine and carmoisine. Chromatographic parameters havebeen calculated for ternary separations of dyes onPani@SG-S2 stationary phase in the presence of 2% aque-ous 1-methyl-imidazolium chloride as mobile phase. Theuse of green mobile phase as well as polyaniline-modifiedsilica gel nanocomposite as stationary phase is a novel ap-proach to develop an environmental-friendly TLCmethod. Thus, prepared Pani@SG-S2 stationary phase hasalso been characterised by Fourier transform infrared(FTIR) spectroscopy, X-ray diffraction (XRD), scanningelectron microscopy (SEM with energy-dispersive X-ray(EDX)) and transmission electron micrograph (TEM).
MethodsApparatusGlass plates 20 × 3.5 cm were coated with silica gel andpolyaniline-modified silica gel using a TLC applicator(Toshniwal, India). The micropipette (Tripette, Germany)was used for spotting of analytes and 24 × 6 cm glass jarswere used to perform TLC.
Experimental temperatureAll the experiments were performed at 25 ± 2 °C.
Chemicals and instrumentationSilica gel (Fisher Scientific, India); methanol, ethanol,propanol-1, potassium persulphate, copper sulphate, zincsulphate, manganese sulphate and nickel nitrate (HCl);sodium salts of bromide, chloride, carbonate, acetate andnitrate (Central Drug House; CDH, India); 1-methyl-imidazolium chloride, 1,2,3-trimethylimidazolium methylsulphate and 1-ethyl 3-methyl-imidazolium tetrafluorobo-rate (Sigma-Aldrich) and aniline (E-Merck India Ltd.)were used as received. Brilliant blue, tartrazine and
Mohammad et al. Journal of Analytical Science and Technology (2017) 8:18 Page 2 of 14
carmoisine (Roha Dyechem. Pvt. Ltd., Mumbai, India) aswell as alizarin red S, xylenol orange and bromo-cresolpurple (CDH India) were used. All chemicals were ofanalytical reagent (AR) grade. The water used in theseexperiments was double distilled.The Fourier transform infrared (FTIR) spectra were
recorded using the Perkin-Elmer 1725 spectrometer op-erating in the 400–4000-cm− 1 range. X-ray diffraction(XRD) data were recorded by using the Bruker D8 dif-fractometer with Cu Kα radiation at 1.540 in therange of 5° ≤ 2θ ≤ 70° at 40 kV. The morphology of sta-tionary phase was observed by a JSM-6510LV systemwith a JEOL scanning electron microscope (SEM) withEDX. Transmission electron micrograph (TEM) wasdone with the help of JEM 2100, JEOL instrument tostudy the morphology and the particle size.
Test solutionsSolutions 5% (w/v) of dyes were prepared in double-distilled water (DDW).
Stationary phaseThe following were used as stationary phase:S1=SG, S2=Pani@SG(ES), S3=Pani@SG(EB1) and
S4=Pani@SG(EB2).
Mobile phaseThe mobile phases used are listed in Table 1.
Composition of RoscillinR syrup and Ambrodil*S syrupThe RoscillinR syrup from Ranbaxy Laboratories Ltd.(Bhatoli Kalan, Himachal Pradesh, India) and Ambro-dil*S syrup from AISTO Pharmaceutical Pvt. Ltd. (Rai-sen, Madhya Pradesh, India) were studied to identifytartrazine and brilliant-blue food dyes, respectively. Thepharmaceutical formulation of RoscillinR contains ampi-cilline IP (ampicilline trihydrate equivalent to anhydrousampicilline, 125 mg), paracetamol IP 125 mg and colour-ing agent tartrazine. The pharmaceutical formulation ofAmbrodil*S contains ambroxol hydrochloride IP 15 mg,salbutamol sulphate IP 1 mg, flavoured syrup base andcolourant brilliant blue FCF.
Preparation of polyaniline-modified silica gelnanocompositePani@SG nanocomposites were prepared by simple insitu oxidative polymerisation of aniline using potassium
persulfate as an oxidising agent in the presence of differ-ent amounts of silica gel (SG). Aniline (1.02 g) was dis-solved in 200 mL of 1 M aqueous solution of HCl.Different amounts (30 and 60 g) of silica gel were addedin an aniline solution. Later, potassium persulphate (5 g),dissolved in 1 M HCl (500 mL), was added dropwise inthe aniline solution for the polymerisation. The reactionmixture was put under continuous stirring for 22 h. Theresultant mixture containing emeraldine salt turnedslowly into greenish black slurry which was filtered,washed thoroughly with DDW and undoped with500 mL of 1 M ammonia solution for making Pani@SG(EB). The resultant product was washed with DDW andmethanol to remove the impurities until filtrate becameneutral and colourless. The prepared nanocompositeswere dried at 70–80 °C for 12 h in an air oven, con-verted into fine powders and were stored in a desiccatorfor further investigations of Pani@SG(EB2) (Table 2).
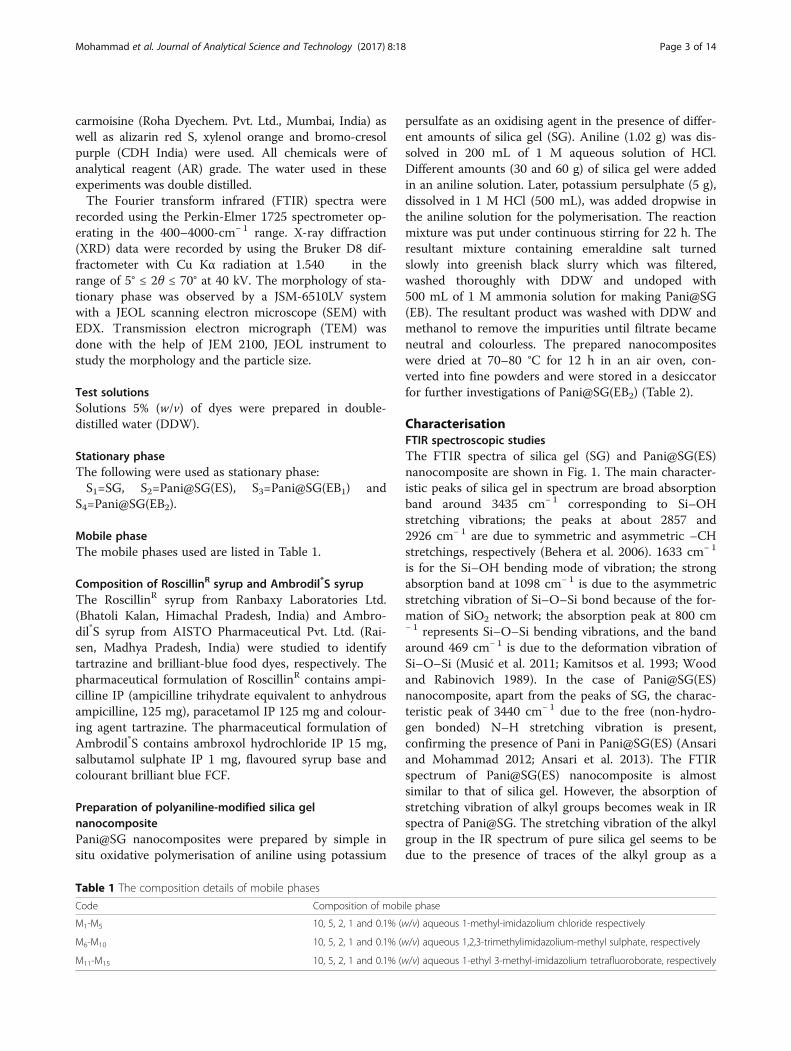
CharacterisationFTIR spectroscopic studiesThe FTIR spectra of silica gel (SG) and Pani@SG(ES)nanocomposite are shown in Fig. 1. The main character-istic peaks of silica gel in spectrum are broad absorptionband around 3435 cm− 1 corresponding to Si–OHstretching vibrations; the peaks at about 2857 and2926 cm− 1 are due to symmetric and asymmetric –CHstretchings, respectively (Behera et al. 2006). 1633 cm− 1
is for the Si–OH bending mode of vibration; the strongabsorption band at 1098 cm− 1 is due to the asymmetricstretching vibration of Si–O–Si bond because of the for-mation of SiO2 network; the absorption peak at 800 cm− 1 represents Si–O–Si bending vibrations, and the bandaround 469 cm− 1 is due to the deformation vibration ofSi–O–Si (Musić et al. 2011; Kamitsos et al. 1993; Woodand Rabinovich 1989). In the case of Pani@SG(ES)nanocomposite, apart from the peaks of SG, the charac-teristic peak of 3440 cm− 1 due to the free (non-hydro-gen bonded) N–H stretching vibration is present,confirming the presence of Pani in Pani@SG(ES) (Ansariand Mohammad 2012; Ansari et al. 2013). The FTIRspectrum of Pani@SG(ES) nanocomposite is almostsimilar to that of silica gel. However, the absorption ofstretching vibration of alkyl groups becomes weak in IRspectra of Pani@SG. The stretching vibration of the alkylgroup in the IR spectrum of pure silica gel seems to bedue to the presence of traces of the alkyl group as a
Table 1 The composition details of mobile phases
Code Composition of mobile phase
M1-M5 10, 5, 2, 1 and 0.1% (w/v) aqueous 1-methyl-imidazolium chloride respectively
M6-M10 10, 5, 2, 1 and 0.1% (w/v) aqueous 1,2,3-trimethylimidazolium-methyl sulphate, respectively
M11-M15 10, 5, 2, 1 and 0.1% (w/v) aqueous 1-ethyl 3-methyl-imidazolium tetrafluoroborate, respectively
Mohammad et al. Journal of Analytical Science and Technology (2017) 8:18 Page 3 of 14
result of incomplete hydrolysis of tetraethylorthosilicatewhich is suppressed by the incorporation of polyanilinein silica gel (Sharma et al. 2015; Kausar and Siddiq2015).
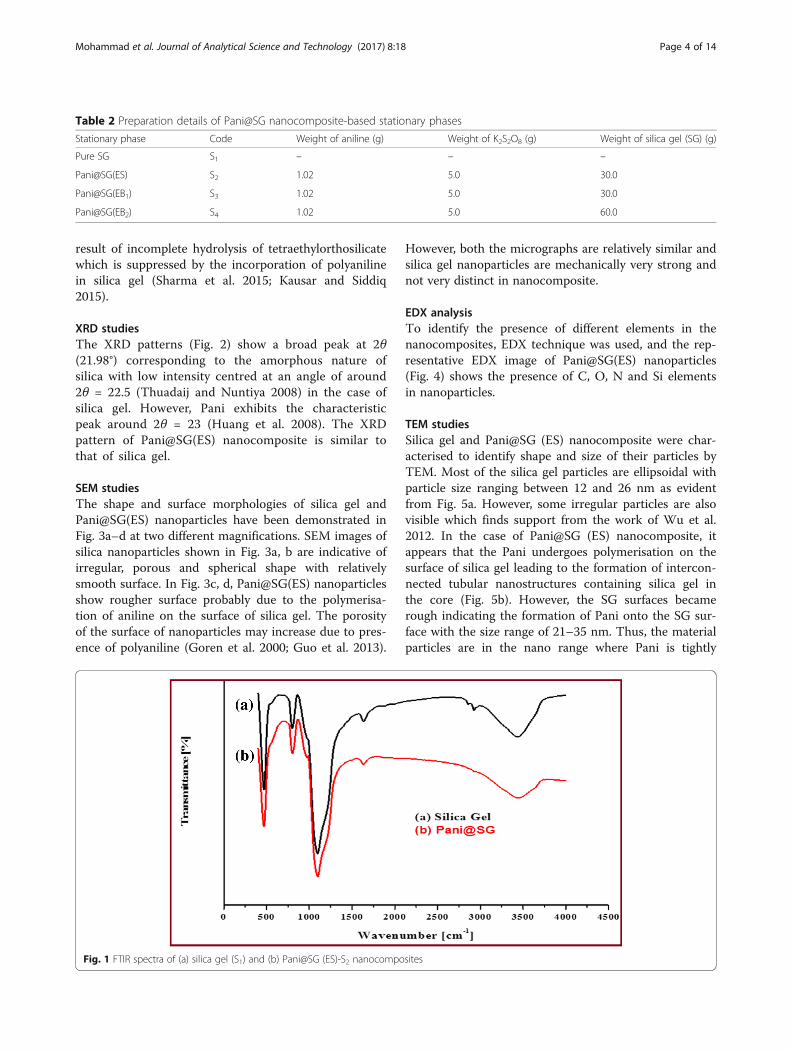
XRD studiesThe XRD patterns (Fig. 2) show a broad peak at 2θ(21.98°) corresponding to the amorphous nature ofsilica with low intensity centred at an angle of around2θ = 22.5 (Thuadaij and Nuntiya 2008) in the case ofsilica gel. However, Pani exhibits the characteristicpeak around 2θ = 23 (Huang et al. 2008). The XRDpattern of Pani@SG(ES) nanocomposite is similar tothat of silica gel.
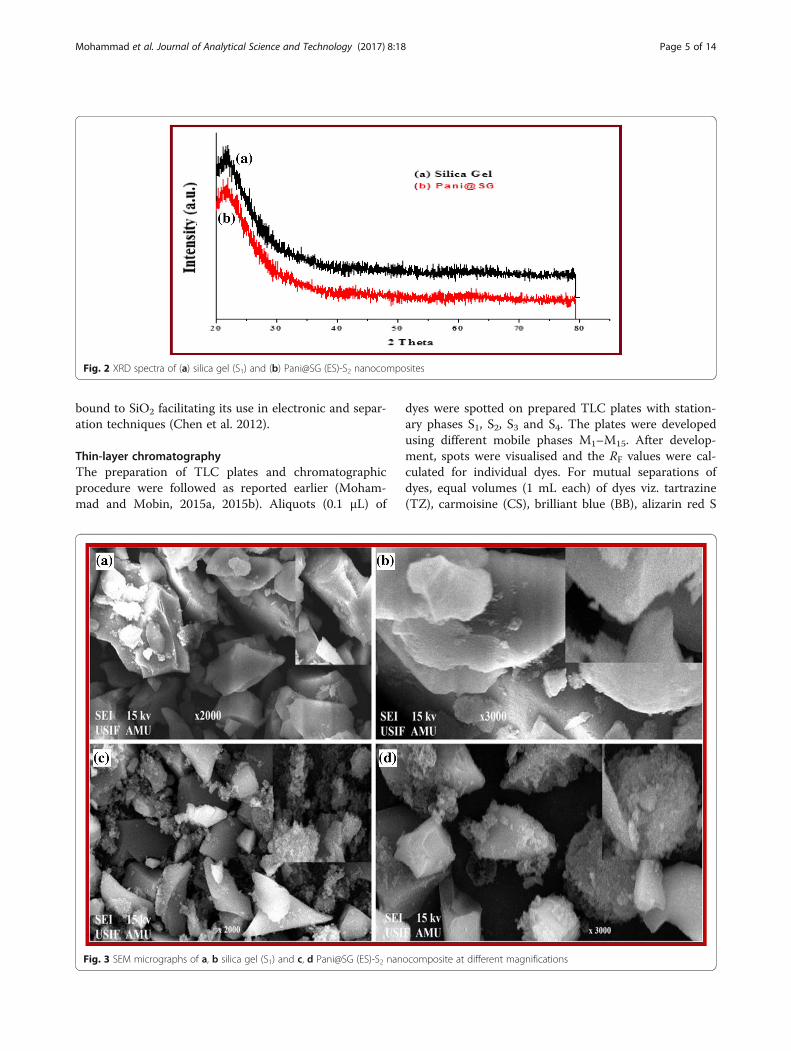
SEM studiesThe shape and surface morphologies of silica gel andPani@SG(ES) nanoparticles have been demonstrated inFig. 3a–d at two different magnifications. SEM images ofsilica nanoparticles shown in Fig. 3a, b are indicative ofirregular, porous and spherical shape with relativelysmooth surface. In Fig. 3c, d, Pani@SG(ES) nanoparticlesshow rougher surface probably due to the polymerisa-tion of aniline on the surface of silica gel. The porosityof the surface of nanoparticles may increase due to pres-ence of polyaniline (Goren et al. 2000; Guo et al. 2013).
However, both the micrographs are relatively similar andsilica gel nanoparticles are mechanically very strong andnot very distinct in nanocomposite.
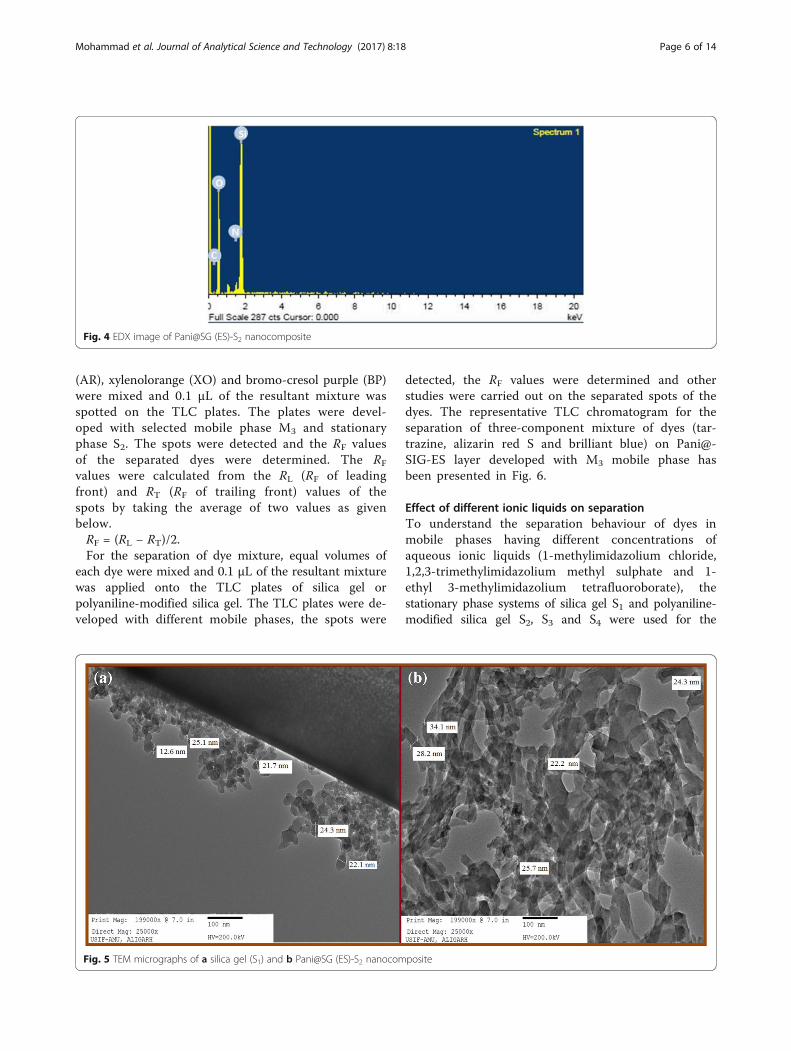
EDX analysisTo identify the presence of different elements in thenanocomposites, EDX technique was used, and the rep-resentative EDX image of Pani@SG(ES) nanoparticles(Fig. 4) shows the presence of C, O, N and Si elementsin nanoparticles.
TEM studiesSilica gel and Pani@SG (ES) nanocomposite were char-acterised to identify shape and size of their particles byTEM. Most of the silica gel particles are ellipsoidal withparticle size ranging between 12 and 26 nm as evidentfrom Fig. 5a. However, some irregular particles are alsovisible which finds support from the work of Wu et al.2012. In the case of Pani@SG (ES) nanocomposite, itappears that the Pani undergoes polymerisation on thesurface of silica gel leading to the formation of intercon-nected tubular nanostructures containing silica gel inthe core (Fig. 5b). However, the SG surfaces becamerough indicating the formation of Pani onto the SG sur-face with the size range of 21–35 nm. Thus, the materialparticles are in the nano range where Pani is tightly
Table 2 Preparation details of Pani@SG nanocomposite-based stationary phases
Stationary phase Code Weight of aniline (g) Weight of K2S2O8 (g) Weight of silica gel (SG) (g)
Pure SG S1 – – –
Pani@SG(ES) S2 1.02 5.0 30.0
Pani@SG(EB1) S3 1.02 5.0 30.0
Pani@SG(EB2) S4 1.02 5.0 60.0
Fig. 1 FTIR spectra of (a) silica gel (S1) and (b) Pani@SG (ES)-S2 nanocomposites
Mohammad et al. Journal of Analytical Science and Technology (2017) 8:18 Page 4 of 14
bound to SiO2 facilitating its use in electronic and separ-ation techniques (Chen et al. 2012).
Thin-layer chromatographyThe preparation of TLC plates and chromatographicprocedure were followed as reported earlier (Moham-mad and Mobin, 2015a, 2015b). Aliquots (0.1 μL) of
dyes were spotted on prepared TLC plates with station-ary phases S1, S2, S3 and S4. The plates were developedusing different mobile phases M1–M15. After develop-ment, spots were visualised and the RF values were cal-culated for individual dyes. For mutual separations ofdyes, equal volumes (1 mL each) of dyes viz. tartrazine(TZ), carmoisine (CS), brilliant blue (BB), alizarin red S
Fig. 2 XRD spectra of (a) silica gel (S1) and (b) Pani@SG (ES)-S2 nanocomposites
Fig. 3 SEM micrographs of a, b silica gel (S1) and c, d Pani@SG (ES)-S2 nanocomposite at different magnifications
Mohammad et al. Journal of Analytical Science and Technology (2017) 8:18 Page 5 of 14
(AR), xylenolorange (XO) and bromo-cresol purple (BP)were mixed and 0.1 μL of the resultant mixture wasspotted on the TLC plates. The plates were devel-oped with selected mobile phase M3 and stationaryphase S2. The spots were detected and the RF valuesof the separated dyes were determined. The RF
values were calculated from the RL (RF of leadingfront) and RT (RF of trailing front) values of thespots by taking the average of two values as givenbelow.RF = (RL − RT)/2.For the separation of dye mixture, equal volumes of
each dye were mixed and 0.1 μL of the resultant mixturewas applied onto the TLC plates of silica gel orpolyaniline-modified silica gel. The TLC plates were de-veloped with different mobile phases, the spots were
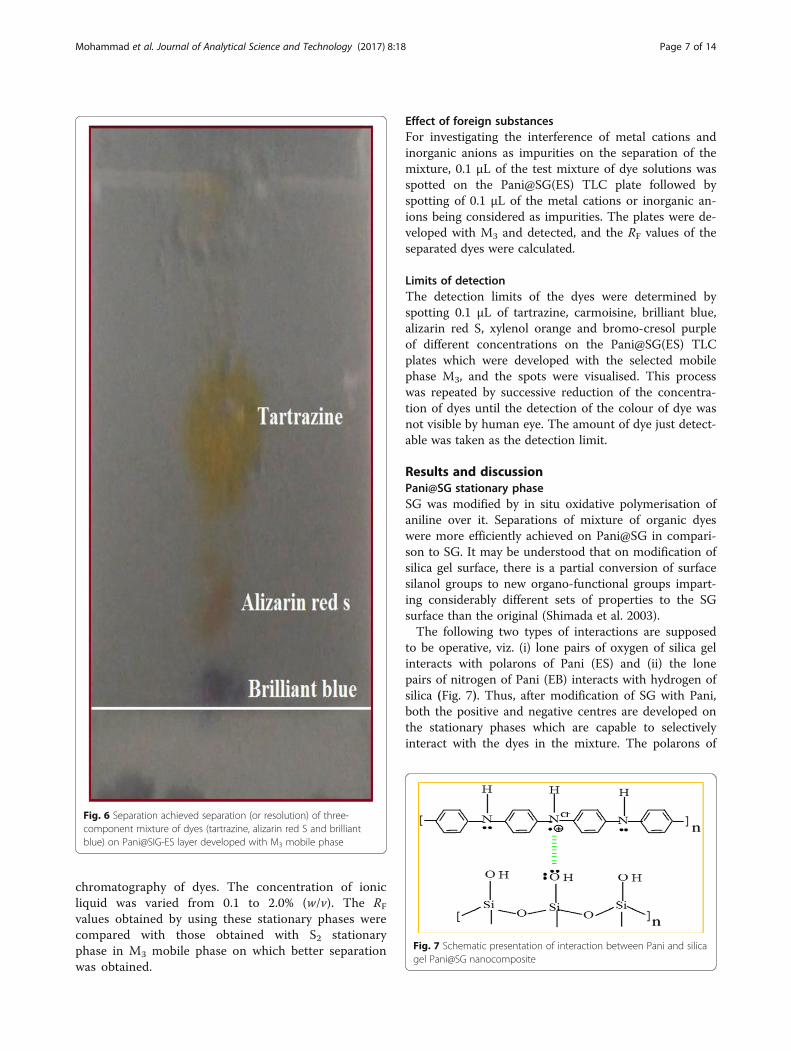
detected, the RF values were determined and otherstudies were carried out on the separated spots of thedyes. The representative TLC chromatogram for theseparation of three-component mixture of dyes (tar-trazine, alizarin red S and brilliant blue) on Pani@-SIG-ES layer developed with M3 mobile phase hasbeen presented in Fig. 6.
Effect of different ionic liquids on separationTo understand the separation behaviour of dyes inmobile phases having different concentrations ofaqueous ionic liquids (1-methylimidazolium chloride,1,2,3-trimethylimidazolium methyl sulphate and 1-ethyl 3-methylimidazolium tetrafluoroborate), thestationary phase systems of silica gel S1 and polyaniline-modified silica gel S2, S3 and S4 were used for the
Fig. 4 EDX image of Pani@SG (ES)-S2 nanocomposite
Fig. 5 TEM micrographs of a silica gel (S1) and b Pani@SG (ES)-S2 nanocomposite
Mohammad et al. Journal of Analytical Science and Technology (2017) 8:18 Page 6 of 14
chromatography of dyes. The concentration of ionicliquid was varied from 0.1 to 2.0% (w/v). The RF
values obtained by using these stationary phases werecompared with those obtained with S2 stationaryphase in M3 mobile phase on which better separationwas obtained.
Effect of foreign substancesFor investigating the interference of metal cations andinorganic anions as impurities on the separation of themixture, 0.1 μL of the test mixture of dye solutions wasspotted on the Pani@SG(ES) TLC plate followed byspotting of 0.1 μL of the metal cations or inorganic an-ions being considered as impurities. The plates were de-veloped with M3 and detected, and the RF values of theseparated dyes were calculated.
Limits of detectionThe detection limits of the dyes were determined byspotting 0.1 μL of tartrazine, carmoisine, brilliant blue,alizarin red S, xylenol orange and bromo-cresol purpleof different concentrations on the Pani@SG(ES) TLCplates which were developed with the selected mobilephase M3, and the spots were visualised. This processwas repeated by successive reduction of the concentra-tion of dyes until the detection of the colour of dye wasnot visible by human eye. The amount of dye just detect-able was taken as the detection limit.
Results and discussionPani@SG stationary phaseSG was modified by in situ oxidative polymerisation ofaniline over it. Separations of mixture of organic dyeswere more efficiently achieved on Pani@SG in compari-son to SG. It may be understood that on modification ofsilica gel surface, there is a partial conversion of surfacesilanol groups to new organo-functional groups impart-ing considerably different sets of properties to the SGsurface than the original (Shimada et al. 2003).The following two types of interactions are supposed
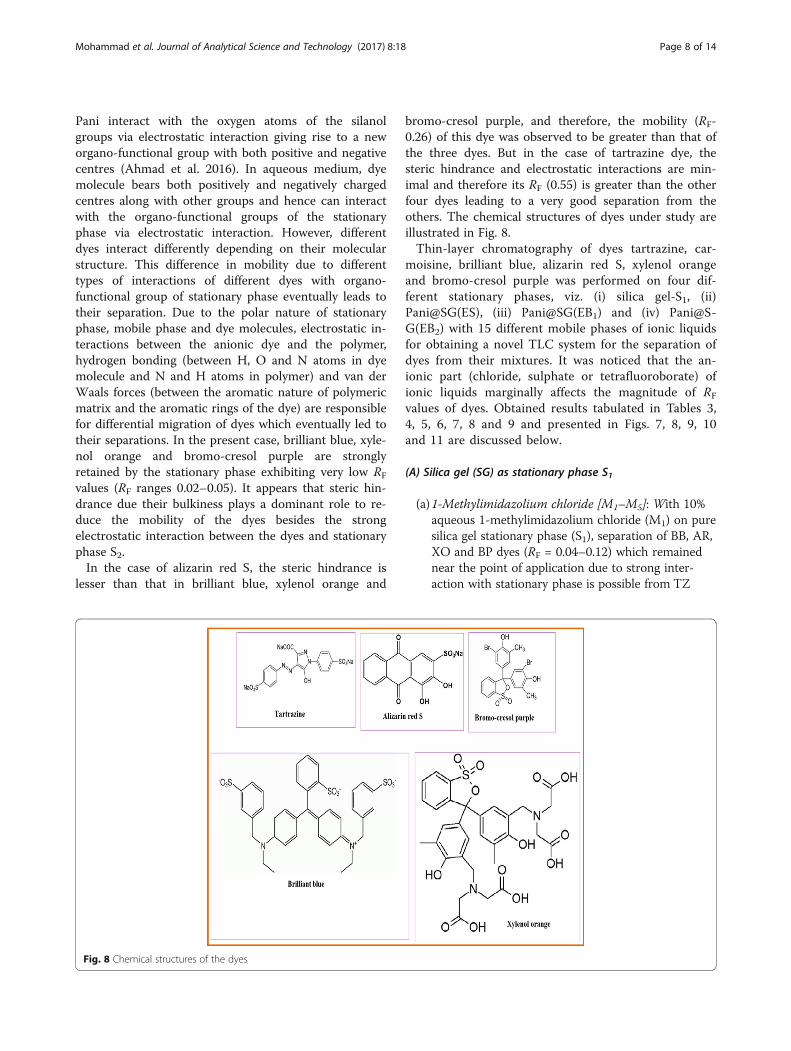
to be operative, viz. (i) lone pairs of oxygen of silica gelinteracts with polarons of Pani (ES) and (ii) the lonepairs of nitrogen of Pani (EB) interacts with hydrogen ofsilica (Fig. 7). Thus, after modification of SG with Pani,both the positive and negative centres are developed onthe stationary phases which are capable to selectivelyinteract with the dyes in the mixture. The polarons of
Fig. 6 Separation achieved separation (or resolution) of three-component mixture of dyes (tartrazine, alizarin red S and brilliantblue) on Pani@SIG-ES layer developed with M3 mobile phase
Fig. 7 Schematic presentation of interaction between Pani and silicagel Pani@SG nanocomposite
Mohammad et al. Journal of Analytical Science and Technology (2017) 8:18 Page 7 of 14
Pani interact with the oxygen atoms of the silanolgroups via electrostatic interaction giving rise to a neworgano-functional group with both positive and negativecentres (Ahmad et al. 2016). In aqueous medium, dyemolecule bears both positively and negatively chargedcentres along with other groups and hence can interactwith the organo-functional groups of the stationaryphase via electrostatic interaction. However, differentdyes interact differently depending on their molecularstructure. This difference in mobility due to differenttypes of interactions of different dyes with organo-functional group of stationary phase eventually leads totheir separation. Due to the polar nature of stationaryphase, mobile phase and dye molecules, electrostatic in-teractions between the anionic dye and the polymer,hydrogen bonding (between H, O and N atoms in dyemolecule and N and H atoms in polymer) and van derWaals forces (between the aromatic nature of polymericmatrix and the aromatic rings of the dye) are responsiblefor differential migration of dyes which eventually led totheir separations. In the present case, brilliant blue, xyle-nol orange and bromo-cresol purple are stronglyretained by the stationary phase exhibiting very low RF
values (RF ranges 0.02–0.05). It appears that steric hin-drance due their bulkiness plays a dominant role to re-duce the mobility of the dyes besides the strongelectrostatic interaction between the dyes and stationaryphase S2.In the case of alizarin red S, the steric hindrance is
lesser than that in brilliant blue, xylenol orange and
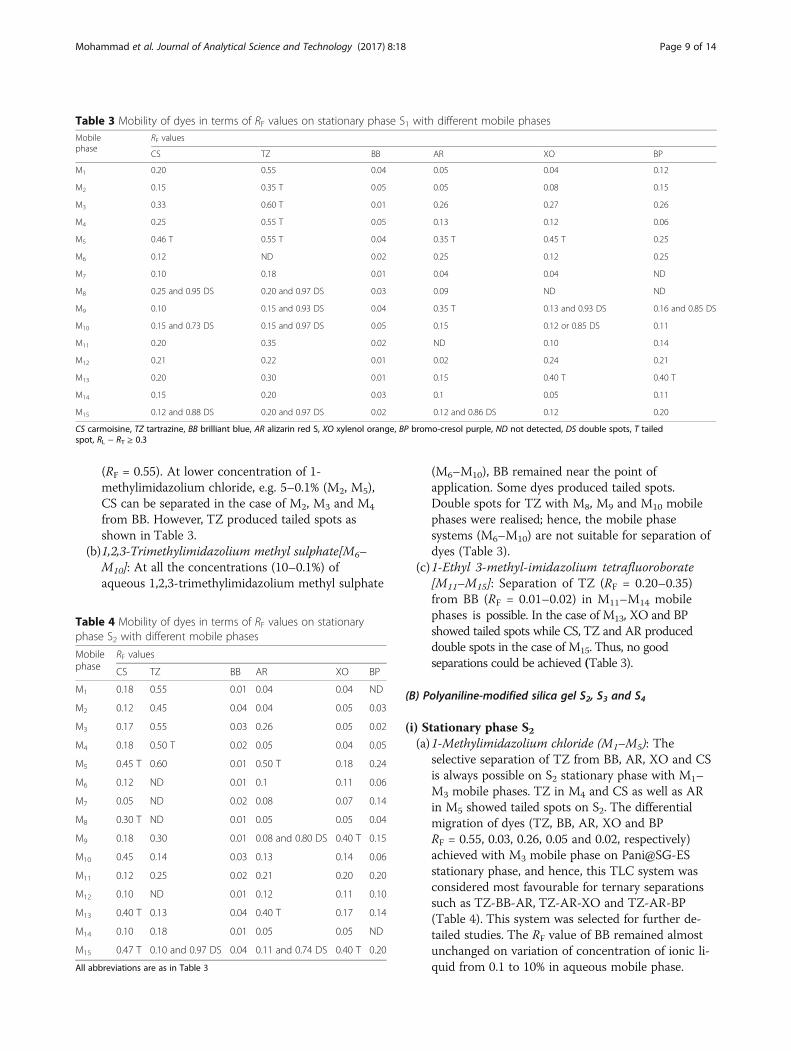
bromo-cresol purple, and therefore, the mobility (RF-0.26) of this dye was observed to be greater than that ofthe three dyes. But in the case of tartrazine dye, thesteric hindrance and electrostatic interactions are min-imal and therefore its RF (0.55) is greater than the otherfour dyes leading to a very good separation from theothers. The chemical structures of dyes under study areillustrated in Fig. 8.Thin-layer chromatography of dyes tartrazine, car-
moisine, brilliant blue, alizarin red S, xylenol orangeand bromo-cresol purple was performed on four dif-ferent stationary phases, viz. (i) silica gel-S1, (ii)Pani@SG(ES), (iii) Pani@SG(EB1) and (iv) Pani@S-G(EB2) with 15 different mobile phases of ionic liquidsfor obtaining a novel TLC system for the separation ofdyes from their mixtures. It was noticed that the an-ionic part (chloride, sulphate or tetrafluoroborate) ofionic liquids marginally affects the magnitude of RF
values of dyes. Obtained results tabulated in Tables 3,4, 5, 6, 7, 8 and 9 and presented in Figs. 7, 8, 9, 10and 11 are discussed below.
(A) Silica gel (SG) as stationary phase S1
(a)1-Methylimidazolium chloride [M1–M5]: With 10%aqueous 1-methylimidazolium chloride (M1) on puresilica gel stationary phase (S1), separation of BB, AR,XO and BP dyes (RF = 0.04–0.12) which remainednear the point of application due to strong inter-action with stationary phase is possible from TZ
Fig. 8 Chemical structures of the dyes
Mohammad et al. Journal of Analytical Science and Technology (2017) 8:18 Page 8 of 14
(RF = 0.55). At lower concentration of 1-methylimidazolium chloride, e.g. 5–0.1% (M2, M5),CS can be separated in the case of M2, M3 and M4
from BB. However, TZ produced tailed spots asshown in Table 3.
(b)1,2,3-Trimethylimidazolium methyl sulphate[M6–M10]: At all the concentrations (10–0.1%) ofaqueous 1,2,3-trimethylimidazolium methyl sulphate
(M6–M10), BB remained near the point ofapplication. Some dyes produced tailed spots.Double spots for TZ with M8, M9 and M10 mobilephases were realised; hence, the mobile phasesystems (M6–M10) are not suitable for separation ofdyes (Table 3).
(c)1-Ethyl 3-methyl-imidazolium tetrafluoroborate[M11–M15]: Separation of TZ (RF = 0.20–0.35)from BB (RF = 0.01–0.02) in M11–M14 mobilephases is possible. In the case of M13, XO and BPshowed tailed spots while CS, TZ and AR produceddouble spots in the case of M15. Thus, no goodseparations could be achieved (Table 3).
(B) Polyaniline-modified silica gel S2, S3 and S4
(i) Stationary phase S2(a)1-Methylimidazolium chloride (M1–M5): The
selective separation of TZ from BB, AR, XO and CSis always possible on S2 stationary phase with M1–M3 mobile phases. TZ in M4 and CS as well as ARin M5 showed tailed spots on S2. The differentialmigration of dyes (TZ, BB, AR, XO and BPRF = 0.55, 0.03, 0.26, 0.05 and 0.02, respectively)achieved with M3 mobile phase on Pani@SG-ESstationary phase, and hence, this TLC system wasconsidered most favourable for ternary separationssuch as TZ-BB-AR, TZ-AR-XO and TZ-AR-BP(Table 4). This system was selected for further de-tailed studies. The RF value of BB remained almostunchanged on variation of concentration of ionic li-quid from 0.1 to 10% in aqueous mobile phase.
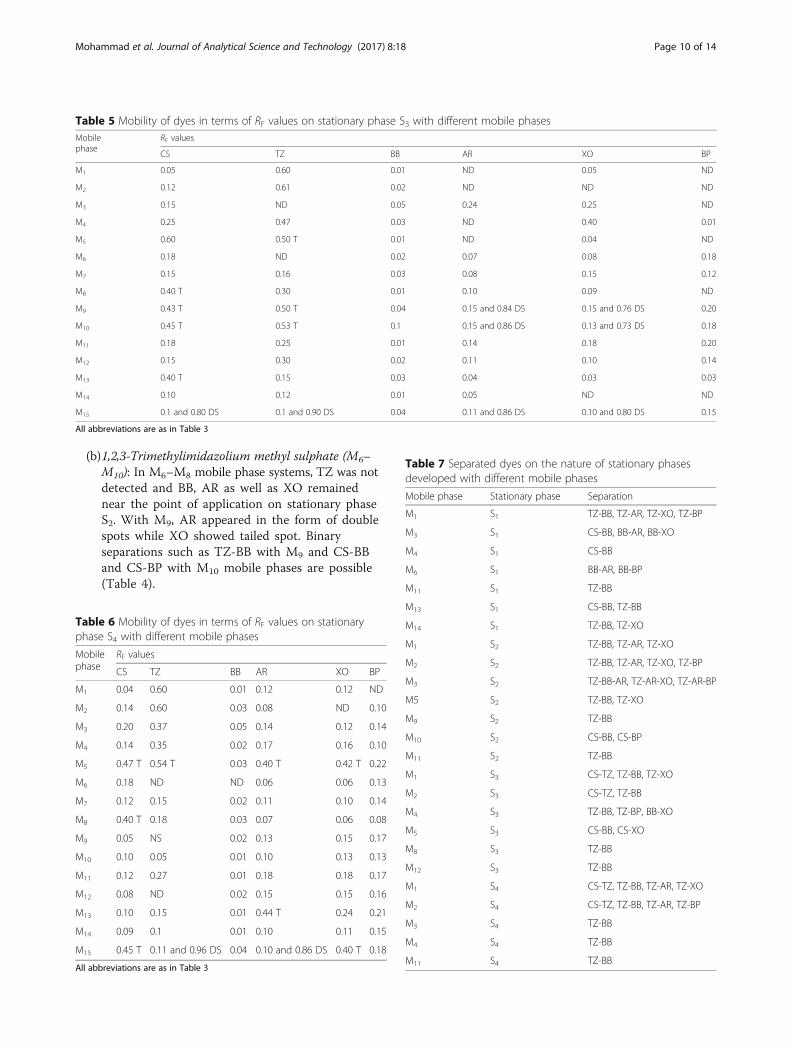
Table 3 Mobility of dyes in terms of RF values on stationary phase S1 with different mobile phasesMobilephase
RF values
CS TZ BB AR XO BP
M1 0.20 0.55 0.04 0.05 0.04 0.12
M2 0.15 0.35 T 0.05 0.05 0.08 0.15
M3 0.33 0.60 T 0.01 0.26 0.27 0.26
M4 0.25 0.55 T 0.05 0.13 0.12 0.06
M5 0.46 T 0.55 T 0.04 0.35 T 0.45 T 0.25
M6 0.12 ND 0.02 0.25 0.12 0.25
M7 0.10 0.18 0.01 0.04 0.04 ND
M8 0.25 and 0.95 DS 0.20 and 0.97 DS 0.03 0.09 ND ND
M9 0.10 0.15 and 0.93 DS 0.04 0.35 T 0.13 and 0.93 DS 0.16 and 0.85 DS
M10 0.15 and 0.73 DS 0.15 and 0.97 DS 0.05 0.15 0.12 or 0.85 DS 0.11
M11 0.20 0.35 0.02 ND 0.10 0.14
M12 0.21 0.22 0.01 0.02 0.24 0.21
M13 0.20 0.30 0.01 0.15 0.40 T 0.40 T
M14 0.15 0.20 0.03 0.1 0.05 0.11
M15 0.12 and 0.88 DS 0.20 and 0.97 DS 0.02 0.12 and 0.86 DS 0.12 0.20
CS carmoisine, TZ tartrazine, BB brilliant blue, AR alizarin red S, XO xylenol orange, BP bromo-cresol purple, ND not detected, DS double spots, T tailedspot, RL − RT ≥ 0.3
Table 4 Mobility of dyes in terms of RF values on stationaryphase S2 with different mobile phases
Mobilephase
RF values
CS TZ BB AR XO BP
M1 0.18 0.55 0.01 0.04 0.04 ND
M2 0.12 0.45 0.04 0.04 0.05 0.03
M3 0.17 0.55 0.03 0.26 0.05 0.02
M4 0.18 0.50 T 0.02 0.05 0.04 0.05
M5 0.45 T 0.60 0.01 0.50 T 0.18 0.24
M6 0.12 ND 0.01 0.1 0.11 0.06
M7 0.05 ND 0.02 0.08 0.07 0.14
M8 0.30 T ND 0.01 0.05 0.05 0.04
M9 0.18 0.30 0.01 0.08 and 0.80 DS 0.40 T 0.15
M10 0.45 0.14 0.03 0.13 0.14 0.06
M11 0.12 0.25 0.02 0.21 0.20 0.20
M12 0.10 ND 0.01 0.12 0.11 0.10
M13 0.40 T 0.13 0.04 0.40 T 0.17 0.14
M14 0.10 0.18 0.01 0.05 0.05 ND
M15 0.47 T 0.10 and 0.97 DS 0.04 0.11 and 0.74 DS 0.40 T 0.20
All abbreviations are as in Table 3
Mohammad et al. Journal of Analytical Science and Technology (2017) 8:18 Page 9 of 14
(b)1,2,3-Trimethylimidazolium methyl sulphate (M6–M10): In M6–M8 mobile phase systems, TZ was notdetected and BB, AR as well as XO remainednear the point of application on stationary phaseS2. With M9, AR appeared in the form of doublespots while XO showed tailed spot. Binaryseparations such as TZ-BB with M9 and CS-BBand CS-BP with M10 mobile phases are possible(Table 4).
Table 5 Mobility of dyes in terms of RF values on stationary phase S3 with different mobile phasesMobilephase
RF values
CS TZ BB AR XO BP
M1 0.05 0.60 0.01 ND 0.05 ND
M2 0.12 0.61 0.02 ND ND ND
M3 0.15 ND 0.05 0.24 0.25 ND
M4 0.25 0.47 0.03 ND 0.40 0.01
M5 0.60 0.50 T 0.01 ND 0.04 ND
M6 0.18 ND 0.02 0.07 0.08 0.18
M7 0.15 0.16 0.03 0.08 0.15 0.12
M8 0.40 T 0.30 0.01 0.10 0.09 ND
M9 0.43 T 0.50 T 0.04 0.15 and 0.84 DS 0.15 and 0.76 DS 0.20
M10 0.45 T 0.53 T 0.1 0.15 and 0.86 DS 0.13 and 0.73 DS 0.18
M11 0.18 0.25 0.01 0.14 0.18 0.20
M12 0.15 0.30 0.02 0.11 0.10 0.14
M13 0.40 T 0.15 0.03 0.04 0.03 0.03
M14 0.10 0.12 0.01 0.05 ND ND
M15 0.1 and 0.80 DS 0.1 and 0.90 DS 0.04 0.11 and 0.86 DS 0.10 and 0.80 DS 0.15
All abbreviations are as in Table 3
Table 6 Mobility of dyes in terms of RF values on stationaryphase S4 with different mobile phases
Mobilephase
RF values
CS TZ BB AR XO BP
M1 0.04 0.60 0.01 0.12 0.12 ND
M2 0.14 0.60 0.03 0.08 ND 0.10
M3 0.20 0.37 0.05 0.14 0.12 0.14
M4 0.14 0.35 0.02 0.17 0.16 0.10
M5 0.47 T 0.54 T 0.03 0.40 T 0.42 T 0.22
M6 0.18 ND ND 0.06 0.06 0.13
M7 0.12 0.15 0.02 0.11 0.10 0.14
M8 0.40 T 0.18 0.03 0.07 0.06 0.08
M9 0.05 NS 0.02 0.13 0.15 0.17
M10 0.10 0.05 0.01 0.10 0.13 0.13
M11 0.12 0.27 0.01 0.18 0.18 0.17
M12 0.08 ND 0.02 0.15 0.15 0.16
M13 0.10 0.15 0.01 0.44 T 0.24 0.21
M14 0.09 0.1 0.01 0.10 0.11 0.15
M15 0.45 T 0.11 and 0.96 DS 0.04 0.10 and 0.86 DS 0.40 T 0.18
All abbreviations are as in Table 3
Table 7 Separated dyes on the nature of stationary phasesdeveloped with different mobile phases
Mobile phase Stationary phase Separation
M1 S1 TZ-BB, TZ-AR, TZ-XO, TZ-BP
M3 S1 CS-BB, BB-AR, BB-XO
M4 S1 CS-BB
M6 S1 BB-AR, BB-BP
M11 S1 TZ-BB
M13 S1 CS-BB, TZ-BB
M14 S1 TZ-BB, TZ-XO
M1 S2 TZ-BB, TZ-AR, TZ-XO
M2 S2 TZ-BB, TZ-AR, TZ-XO, TZ-BP
M3 S2 TZ-BB-AR, TZ-AR-XO, TZ-AR-BP
M5 S2 TZ-BB, TZ-XO
M9 S2 TZ-BB
M10 S2 CS-BB, CS-BP
M11 S2 TZ-BB
M1 S3 CS-TZ, TZ-BB, TZ-XO
M2 S3 CS-TZ, TZ-BB
M4 S3 TZ-BB, TZ-BP, BB-XO
M5 S3 CS-BB, CS-XO
M8 S3 TZ-BB
M12 S3 TZ-BB
M1 S4 CS-TZ, TZ-BB, TZ-AR, TZ-XO
M2 S4 CS-TZ, TZ-BB, TZ-AR, TZ-BP
M3 S4 TZ-BB
M4 S4 TZ-BB
M11 S4 TZ-BB
Mohammad et al. Journal of Analytical Science and Technology (2017) 8:18 Page 10 of 14
(c)1-Ethyl 3-methyl-imidazolium tetrafluoroborate(M11–M15): Most of the dyes are not separable withM11–M15 mobile phases on stationary phase S2.However, TZ-BB separation is possible with M11. TZand BP are not detected in M12 and M14, respect-ively. While CS showed tailed spots in M13 as well asM15, AR produced tailed spots in M13. In M15,double spots for TZ and AR appeared (Table 4).
(ii) Stationary phase S3(a)1-Methylimidazolium chloride (M1–M5): On
stationary phase S3, the mobility of CS slightlyincreases with decreasing concentration of ionicliquid. With mobile phases M1–M2, TZ (RF = 0.60,0.61, respectively) can be separated from BB (RF0.01, 0.02, respectively) and CS (RF 0.05, 0.12,respectively). Furthermore, TZ-XO separation withM1 mobile phase is also possible. AR and BP organicdyes were not detected when TLC plates were devel-oped with M1, M2 mobile phases. With M3 mobilephase, TZ and BP were not detected and AR, XOand CS showed broad peaks and remained BB near
the point of application. On S3 with M4 mobilephase, binary separations such as TZ-BP, TZ-BB andBB-XO are possible while AR is not detected asshown in (Table 5). With M5 mobile phase, CS-BBand CS-XO separations are possible whereas otherdyes (AR and BP) could not be detected and TZshowed tailed spots.
(b)1,2,3-Trimethylimidazolium methyl sulphate(M6–M10): In M6 and M7 mobile phases on S3 stationaryphase, CS, XO and BP showed broad spots and boththe BB and AR remained near the point ofapplication; hence, no separation possibilities arise.In M8 mobile phase, TZ can be separated from BB.There are no separation possibilities in most casesdue to formation of either tailed spots or doublespots of dyes (Table 5).
(c)1-Ethyl 3-methyl-imidazolium tetrafluoroborate(M11–M15): In M11–M15 mobile phases, CS, TZ, AR,XO and BP dyes showed broad spots with M11 onS3. Tailed spots in M13 of CS and non-detectabilityof XO and BP in M15 hampered the separation pos-sibilities. Double spots were realised for CS, TZ, ARand XO with M15 (Table 5).
(iii) Stationary phase S4(a)1-Methylimidazolium chloride (M1–M5): This TLC
system is most suitable for the selective separationof TZ from other food dyes under study with M1–M4 mobile phase system. However, with M5 tailedspots for CS, TZ, AR and XO on S4 were noticed(Table 6).
(b)1,2,3-Trimethylimidazolium methyl sulphate (M6–M10): In M6 mobile phase on S4 stationary phase, BBand TZ could not be detected and tailed spot of CSwith M8 mobile phase was observed. From aseparate point of view, this TLC system is unsuitablefor analysis of dyes (Table 6).
(c)1-Ethyl 3-methyl-imidazolium tetrafluoroborate(M11–M15): With M11–M14 mobile phases, all thedyes showed little mobility and remained near thepoint of application. In M12, TZ was not detectedand AR showed tailed spot in M13. There was noseparation possibility in the case of M15 mobilephase; tailed spots of CS and XO and double spotsof TZ and AR were obtained as reported in Table 6.There is no possibility of separation of dyes with thisTLC system.
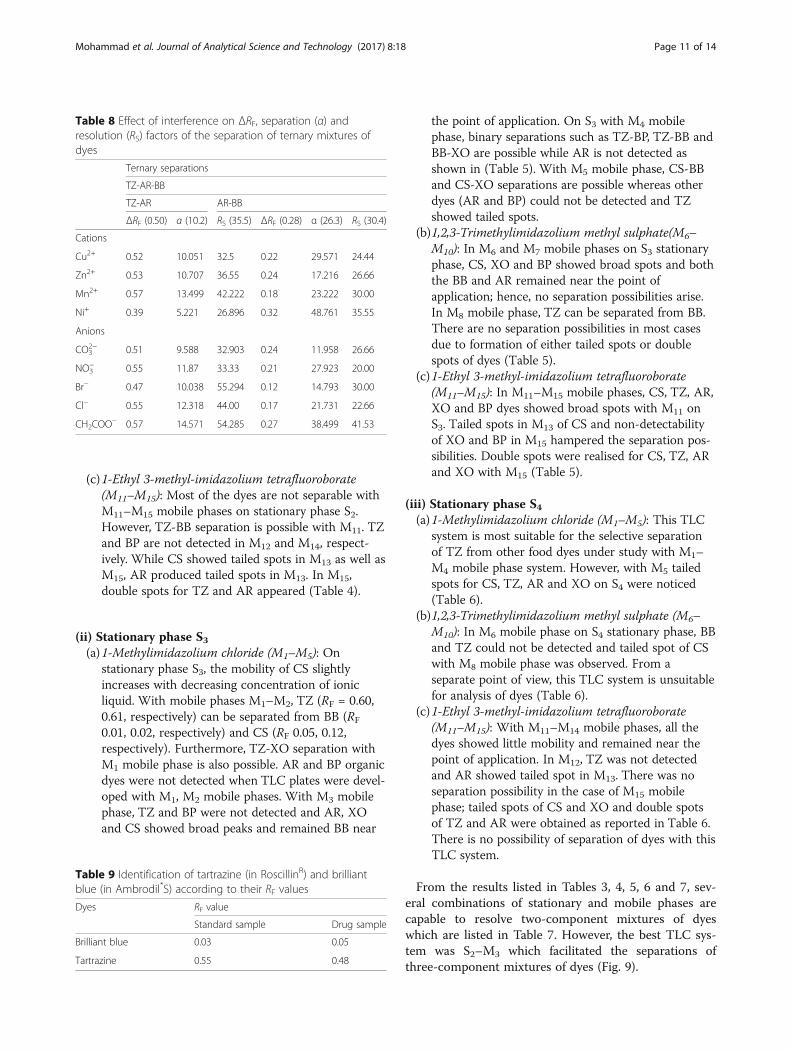
From the results listed in Tables 3, 4, 5, 6 and 7, sev-eral combinations of stationary and mobile phases arecapable to resolve two-component mixtures of dyeswhich are listed in Table 7. However, the best TLC sys-tem was S2–M3 which facilitated the separations ofthree-component mixtures of dyes (Fig. 9).
Table 8 Effect of interference on ΔRF, separation (α) andresolution (RS) factors of the separation of ternary mixtures ofdyes
Ternary separations
TZ-AR-BB
TZ-AR AR-BB
ΔRF (0.50) α (10.2) RS (35.5) ΔRF (0.28) α (26.3) RS (30.4)
Cations
Cu2+ 0.52 10.051 32.5 0.22 29.571 24.44
Zn2+ 0.53 10.707 36.55 0.24 17.216 26.66
Mn2+ 0.57 13.499 42.222 0.18 23.222 30.00
Ni+ 0.39 5.221 26.896 0.32 48.761 35.55
Anions
CO32− 0.51 9.588 32.903 0.24 11.958 26.66
NO3− 0.55 11.87 33.33 0.21 27.923 20.00
Br− 0.47 10.038 55.294 0.12 14.793 30.00
Cl− 0.55 12.318 44.00 0.17 21.731 22.66
CH2COO− 0.57 14.571 54.285 0.27 38.499 41.53
Table 9 Identification of tartrazine (in RoscillinR) and brilliantblue (in Ambrodil*S) according to their RF values
Dyes RF value
Standard sample Drug sample
Brilliant blue 0.03 0.05
Tartrazine 0.55 0.48
Mohammad et al. Journal of Analytical Science and Technology (2017) 8:18 Page 11 of 14
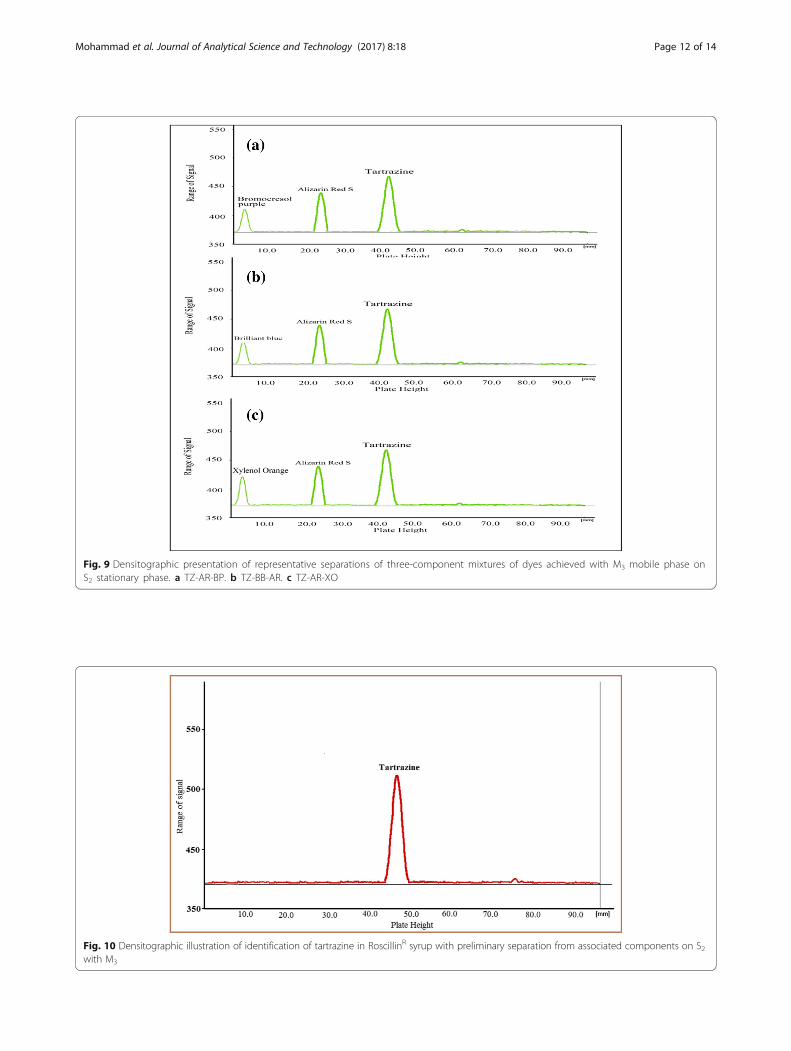
Fig. 9 Densitographic presentation of representative separations of three-component mixtures of dyes achieved with M3 mobile phase onS2 stationary phase. a TZ-AR-BP. b TZ-BB-AR. c TZ-AR-XO
Fig. 10 Densitographic illustration of identification of tartrazine in RoscillinR syrup with preliminary separation from associated components on S2with M3
Mohammad et al. Journal of Analytical Science and Technology (2017) 8:18 Page 12 of 14
Effect of replacement of silica with modified Pani@SGstationary phaseModified silica gel was used in place of silica gel withthe hope of getting new separations. In the case ofPani@SG (ES), ternary separation was obtained with 2%aqueous 1-methyl-imidazolium chloride (M3) mobilephase. The separation efficacy of different stationaryphases towards dyes was in the order or S2>S4>S1>S3. Itappears that the differences in surface area and activitylevel of these stationary phases influence the separationpattern. Compared to plain (or non-modified) silica gel,Pani-modified silica gel performs better as stationaryphase in the separation of dyes.
Effect of interferenceEffect of metal cations and anions on the magnitude ofseparation factor (α), resolution parameter (Rs) and ΔRF
values for separation of three-component mixtures con-sisting of TZ, AR and BB has been examined, and theresults are presented in Table 8. From the results, it isclear that magnitude of these parameters is marginallyinfluenced (increased or decreased) in the presence ofthese foreign substances, but separation was always pos-sible in each case. The minor change in the value ofthese parameters was due to the slight increase in spotsize of the analyte because of certain interactions of dyeswith these foreign substances.
Ageing effect of mobile phaseThe stability (ageing effect) of mobile phase (M3) on theseparation was insignificant since slight variation in theirRF values was observed during the separation of dyesfrom their ternary mixture with the use of freshly pre-pared mobile phase and use of the same mobile phase
after storing for 24 h. Hence, it can be concluded thatthe composition of mobile phase (M3) remains unalteredfor several hours, and therefore, it is most suitable forchromatographic analysis.
Limit of detectionThe lowest possible detectable amounts (μg/spot) of car-mosine, tartrazine and brilliant tartrazine, carmoisine,brilliant blue, alizarin red S, xylenol orange and bromo-cresol purple on S3 developed with M3 (2% aqueous 1-methylimidazolium chloride) were 1.0, 0.75, 1.0, 1.0, 1.25and 1.0, respectively.
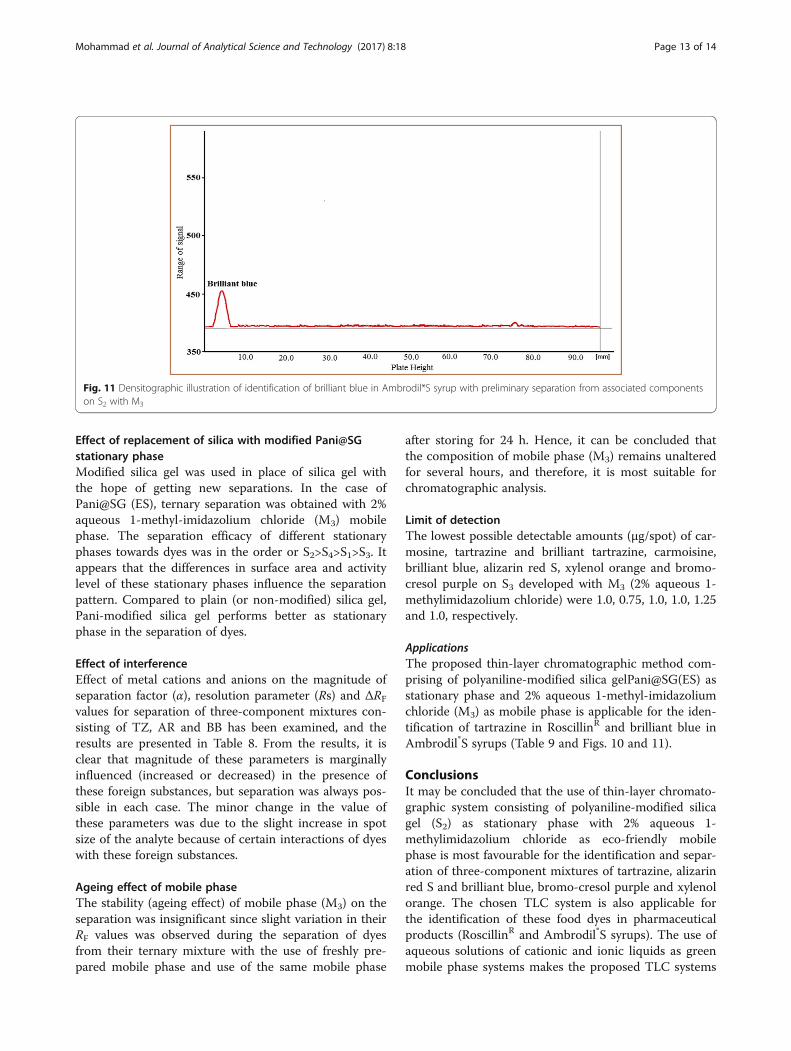
ApplicationsThe proposed thin-layer chromatographic method com-prising of polyaniline-modified silica gelPani@SG(ES) asstationary phase and 2% aqueous 1-methyl-imidazoliumchloride (M3) as mobile phase is applicable for the iden-tification of tartrazine in RoscillinR and brilliant blue inAmbrodil*S syrups (Table 9 and Figs. 10 and 11).
ConclusionsIt may be concluded that the use of thin-layer chromato-graphic system consisting of polyaniline-modified silicagel (S2) as stationary phase with 2% aqueous 1-methylimidazolium chloride as eco-friendly mobilephase is most favourable for the identification and separ-ation of three-component mixtures of tartrazine, alizarinred S and brilliant blue, bromo-cresol purple and xylenolorange. The chosen TLC system is also applicable forthe identification of these food dyes in pharmaceuticalproducts (RoscillinR and Ambrodil*S syrups). The use ofaqueous solutions of cationic and ionic liquids as greenmobile phase systems makes the proposed TLC systems
Fig. 11 Densitographic illustration of identification of brilliant blue in Ambrodil*S syrup with preliminary separation from associated componentson S2 with M3
Mohammad et al. Journal of Analytical Science and Technology (2017) 8:18 Page 13 of 14
as environment friendly and paves the way for the devel-opment of green chromatography as a future analyticaltechnique.
AcknowledgementsThe authors are thankful to the University Grants Commission (UGC), NewDelhi, for providing financial assistance to carry out on work.
Authors’ contributionsAll authors read and approved the final manuscript.
Competing interestsThe authors declare that they have no competing interests.
Author details1Department of Applied Chemistry, Faculty of Engineering and Technology,Aligarh Muslim University, Aligarh 202002, India. 2Department of Chemistry,School of Sciences, Maulana Azad National Urdu University, Hyderabad500032, India.
Received: 2 April 2017 Accepted: 31 August 2017
ReferencesAhmad S, Sultan A, Raza W, Muneer M, Mohammad F. Boron nitride based
polyaniline nanocomposite: preparation, property, and application. J ApplPolym Sci. 2016;133:43989–97.
Alves SP, Brum DM, Branco de Andrade ÉC, Pereira Netto AD. Determination ofsynthetic dyes in selected foodstuffs by high performance liquidchromatography with UV-DAD detection. Food Chem. 2008;107:489–96.
Amini M, Arami M, Mahmoodi NM, Akbari A. Dye removal from colored textilewastewater using acrylic grafted nanomembrane. Desalination. 2011;267:107–13.
Ansari MO, Mohammad F. Thermal stability and electrical properties of dodecyl-benzene-sulfonic- acid doped nanocomposites of polyaniline and multi-walled carbon nanotubes. Compos. Part B Eng. 2012;43:3541–8.
Ansari MO, Yadav SK, Cho JW, Mohammad F. Thermal stability in terms of DCelectrical conductivity retention and the efficacy of mixing technique in thepreparation of nanocomposites of graphene/polyaniline over the carbonnanotubes/polyaniline. Compos Part B Eng. 2013;47:155–61.
Atayan VZ, Sumina EG, Shtykov SN. Determination of food dyes by thin layerchromatography with cyclodextrin mobile phases. J Anal Chem. 2003;58:642–642.
Behera D, Satapathy H, Banthia AK. Synthesis, purification and curing studies ofvinyl ester network. Pigment Resin Technol. 2006;36:271–8.
Charumathi D, Das N. Packed bed column studies for the removal of syntheticdyes from textile wastewater using immobilised dead C. Tropicalis.Desalination. 2012;285:22–30.
Chen M, Du C, Wang L, Yin G, Shi P. Silicon/graphite/polyaniline nanocompositewith improved lithium-storage capacity and cyclability as anode materials forlithium-ion batteries. Int J Electrochem Sci. 2012;7:819–29.
Clark DD. Analysis and identification of acid base indicator dyes by thin-layerchromatography. J Chem Educ. 2007;84:1186–7.
Ejigu A, Lovelock KRJ, Licence P, Walsh DA. Iodide/triiodide electrochemistry inionic liquids: effect of viscosity on mass transport, voltammetry and scanningelectrochemical microscopy. Electrochim Acta. 2011;56:10313–20.
Friedmann D, Hakki A, Kim H, Choi W, Bahnemann D. Heterogeneousphotocatalytic organic synthesis: state-of-the-art and future perspectives.Green Chem. 2016;18:5391–411.
Ge H, Wallace GG. High-performance liquid chromatography on polypyrrole-modified silica. J Chromatogr A. 1991;588(1–2):25–31.
Goren M, Qi Z, Lennox RB. Selective templated growth of polypyrrole strands onlipid tubule edges. Chem Mater. 2000;12:1222–8.
Guo J, Gu H, Wei H, Zhang Q, Haldolaarachchige N, Li Y, et al. Magnetite-polypyrrole metacomposites: dielectric properties and magnetoresistancebehavior. J Phys Chem C. 2013;117:10191–202.
Gutowski KE, Broker GA, Willauer HD, Huddleston JG, Swatloski RP, Holbrey JD, etal. Controlling the aqueous miscibility of ionic liquids: aqueous biphasicsystems of water-miscible ionic liquids and water-structuring salts for recycle,metathesis, and separations. J Am Chem Soc. 2003;125:6632–6633.
Hoodless NA, Pitman KG, Stewart TE, Thomson J, Arnold JE. Identification ofsynthetic water soluble food colours using thin-layer chromatography. JChromatog. 1971;54:393–404.
Huang H, Feng X, Zhu J-J. Synthesis, characterization and application in electrocatalysisof polyaniline/Au composite nanotubes. Nanotechnology. 2008;19:145607–13.
Jones DA, Lelyveld TP, Mavrofidis SD, Kingman SW, Miles NJ. Microwave heatingapplications in environmental engineering—a review. Resour Conserv Recycl.2002;34:75–90.
Kamitsos EI, Patsis AP, Kordas G. Infrared-reflectance spectra of heat-treated sol-gel-derived silica. Phys Rev B. 1993;48:12499–505.
Kausar A, Siddiq M. Synthesis, characterization and properties of in-situ generatedpolyimide/silica/polyoxometalate hybrids via sol-gel method. AmericanJournal of Polymer Science & Engineering. 2015;3:172–82.
Lee MT, Li YS, Sun IW, Chang JK. Pseudocapacitive behavior of manganese oxidein lithium-ion-doped butylmethylpyrrolidinium-dicyanamide ionic liquidinvestigated using in situ X-ray absorption spectroscopy. J Power Sources.2014;246:269–76. Elsevier B.V
López-Lorente AI, Simonet BM, Valcárcel M. Determination of carboxylic SWCNTsin river water by microextraction in ionic liquid and determination by Ramanspectroscopy. Talanta. 2013;105:75–9.
Marszall MP, Sroka WD, Balinowska A, Mieszkowski D, Koba M, Kaliszan R. Ionicliquids as mobile phase additives for feasible assay of naphazoline inpharmaceutical formulation by HPTLC-UV-densitometric method. JChromatogr Sci. 2013;51:560–5.
Mohammad A, Mobin R. Eco-favourable mobile phase in thin layerchromatographic analysis of surfactants: resolution of coexisting alkyldimethylbenzyl ammonium chloride, cetyltrimethyl ammonium bromide andTriton X 100. Tenside Surf Det. 2015a;52:414–23.
Mohammad A, Mobin R. Resolution of a three-component mixture of methyl groupsubstituted cationic surfactants by use of a green eluent: a thin-layerchromatographic approach. J Planar Chromatogr – Mod TLC. 2015b;28:17–23.
Music S, Filipovic-Vincekovic N, Sekovanic L. Precipitation of amorphous SiO2
particules and their properties. Brazilian J Chem Eng. 2011;28:89–94.Oka H, Ikaia Y, Ohno T, Kawamura N, Hayakawa J, Harada K Ichi, et al.
Identification of unlawful food dyes by thin-layer chromatography-fast atombombardment mass spectrometry. J Chromatogr A 1994;674(1–2):301–307.
Piccin JS, Vieira MLG, Gonçalves JO, Dotto GL, Pinto LAA. Adsorption of FD&CRed no. 40 by chitosan: isotherms analysis. J. Food Eng. 2009;95:16–20.
Seddon KR. Ionic liquids: a taste of the future. Nat Mater. 2003;2:363–5.Sharma RK, Sharma S, Dutta S, Zboril R, Gawande MB. Silica-nanosphere-based
organic–inorganic hybrid nanomaterials: synthesis, functionalization andapplications in catalysis. Green Chem. 2015;17:3207–30.
Shimada T, Aoki K, Shinoda Y, Nakamura T, Tokunaga N, Inagaki S, Hayashi T.Functionalization on silica gel with allylsilanes. A new method of covalentattachment of organic functional groups on silica gel. J. Am. Chem Soc.2003;125:4688–5.
Siddiq A, Ansari MO, Mohammad A, Mohammad F, El-Desoky GE. Synergisticeffect of polyaniline modified silica gel for highly efficient separation of nonresolvable amino acids. Int J Polym Mater Polym Biomater. 2014;63:277–81.
Sun W, Guo Y, Li T, Ju X, Lou J, Ruan C. Electrochemistry of horseradishperoxidase entrapped in graphene and dsDNA composite modified carbonionic liquid electrode. Electrochim Acta. 2012;75:381–6.
Tabar Heydar K, Gharavi HG, Nazifi M, Mirzaei M, Sharifi A. Using binary mixtures ofdicationic ionic liquids for determination of activity coefficients at infinite dilutionby gas-liquid chromatography. Fluid Phase Equilib. 2013;353:93–100. Elsevier B.V
Thuadaij N, Nuntiya A. Preparation of nanosilica powder from rice husk ash byprecipitation method. Chiang Mai J Sci. 2008;35(1):206–11.
Wang X, Qi M, Fu R. Separation performance of cucurbituril in ionic liquid-basedsol-gel coating as stationary phase for capillary gas chromatography. JChromatogr A. 2014;1371:237–43.
Wood DL, Rabinovich EM. Study of alkoxide silica gels by infrared spectroscopy.Appl Spectrosc. 1989;43:263–7.
Wrolstad RE, Culver CA. Alternatives to those artificial FD&C food colorants. AnnuRev Food Sci Technol. 2012;3:59–77.
Wu CM, Lin SY, Chen HL. Structure of a monolithic silica aerogel prepared from ashort-chain ionic liquid. Microporous Mesoporous Mater. 2012;156:189–95.
Yoshinaga K, Asanuma M, Mizobe H, Kojima K, Nagai T, Beppu F, et al.Characterization of cis- and trans-octadecenoic acid positional isomers inedible fat and oil using gas chromatography-flame ionisation detectorequipped with highly polar ionic liquid capillary column. Food Chem. 2014;160:39–45.
Mohammad et al. Journal of Analytical Science and Technology (2017) 8:18 Page 14 of 14