Embed Size (px)
Citation preview

Effective indicators for freshwater management: attributes and frameworks for development


Effective indicators for freshwater management: attributes and frameworks for development
Will Allen
Learning for Sustainability
Andrew Fenemor
Landcare Research
David Wood
ESR
Prepared for:
Aqualinc Research for the MSI Wheel of Water Project
Level 2, 11 Deans Ave, Riccarton PO Box 20-462, Bishopdale Christchurch 8011 New Zealand
June 2012
Learning for Sustainability, PO Box 30108, Barrington, Christchurch 8244, New Zealand
Landcare Research, Private Bag, Nelson 7042, New Zealand
ESR Christchurch Science Centre, PO Box 29181, Christchurch, New Zealand

Reviewed by: Approved for release by:
Chris Jones Scientist Landcare Research
Chris Phillips Portfolio Leader, Realising Land’s Potential Landcare Research
Landcare Research Contract Report: LC 995
Disclaimer
This report has been prepared by Landcare Research for MSI. If used by other parties, no warranty or representation is given as to its accuracy and no liability is accepted for loss or damage arising directly or indirectly from reliance on the information in it.
© Landcare Research New Zealand Ltd 2012
This information may be copied and distributed to others without limitation, provided Landcare Research New Zealand Ltd and the source of the information are acknowledged. Under no circumstances may a charge be made for this information without the written permission of Landcare Research.

Landcare Research Page iii
Contents
Summary ..................................................................................................................................... v
1 Aim and objective .............................................................................................................. 1
2 Report structure ................................................................................................................ 1
3 A context for using indicators in catchment management ............................................... 2
3.1 Using indicators in monitoring and evaluation systems ..................................................... 2
3.2 Complicated or complex – managing different systems ..................................................... 4
3.3 Section overview ................................................................................................................. 6
4 Indicator selection criteria ................................................................................................ 6
4.1 Direct relevance to objectives or problems ........................................................................ 7
4.2 General considerations ....................................................................................................... 8
4.3 Section overview ............................................................................................................... 12
5 Steps and guidelines for indicator selection ................................................................... 13
5.1 Section overview ............................................................................................................... 18
6 Frameworks for indicator identification and development ............................................ 19
6.1 Underpinning elements ..................................................................................................... 19
6.2 Programme-based models ................................................................................................ 20
6.3 Pressure–State–Response frameworks ............................................................................. 25
6.4 Section overview ............................................................................................................... 29
7 Working towards collaborative adaptive management.................................................. 29
8 Acknowledgements ......................................................................................................... 32
9 References ....................................................................................................................... 32
Appendix 1 – Indicator lists ....................................................................................................... 39

Landcare Research Page v
Summary
Project and Client
Regional and unitary councils are increasingly setting limits on river flows, bulk water
allocation and water quality at the scales of catchment, sub-catchment and water management
zone. The MSI-funded Wheel of Water (WOW) programme will examine how to set and
implement such limits collaboratively with water users and stakeholders.
An indicator tool - based on the spokes of a water wheel - will be developed within this
collaborative approach. The spokes represent indicators across the four wellbeings:
environmental, economic, social and cultural. They will inform and be informed by
catchment, regional and national policy so that each WaterWheel at sub-catchment scale
combines with others up to catchment, then regional and national scales to achieve agreed
environmental, cultural, economic and social outcomes. Land and water users will be able to
use this tool to track their progress towards these multiple outcomes, and constructively adapt
practices as required. This will enable landowners and water users to view themselves as
water managers in a collective manner, taking account of the limits agreed by the community
and incorporated in their regional water plan.
Objectives
To contribute to the design of the wider Wheel of Water collaborative water management
concept by providing ideas for identifying and selecting appropriate indicators (as spokes of
the waterwheel), from the twin perspectives of:
A social learning process for stakeholders to agree on a relevant bundle of those
indicators
Their effectiveness as measures of achievement of the agreed limits
Main findings
Indicators quantify and simplify phenomena, and help us understand and make sense of
complex realities. However, their greatest strength is in aiding development and operation of
monitoring and evaluation (M&E) systems that increase understanding (research), support
accounting and certification (audits), assess resource status, and monitor performance
effectiveness.
To be most meaningful, a monitoring programme should provide insights into cause-and-
effect relationships between environmental or socio-economic stressors and the anticipated
ecosystem responses and subsequent social and economic outcomes. Conceptual models are
often used to investigate the relationships between anticipated stressors and downstream
consequences. Within this process, a monitoring programme may utilise indicators chosen for
their ability to clearly link stressors and drivers with pathways to consequential ecological
and socio-economic changes. This provides the opportunity to develop predictive models to
anticipate trends instead of waiting until adverse impacts have been demonstrated, and to

Effective indicators for freshwater management: attributes and frameworks for development
Page vi Landcare Research
support responsive decision making through the use of an adaptive management and policy
system.
Useful indicators have a number of characteristics. They should:
Be directly relevant to the issue or problem in question
Have a direct or proxy relationship to the attribute (value, threat, action) being
assessed
Complement other indicators to adequately characterise the system collectively
Be able to be feasibly collected, analysed and reported on in a cost-effective and
timely way
Be defensible and transparent to a range of audiences
Have a direct use for decision making
In addition useful indicators should be relatively few in number, but sufficient to represent
cause and effect in the system. They need to reflect changes that are relevant to management
and policy, and be able to support and influence future action.
To be useful, indicators must be embedded in a monitoring and evaluation (M&E) system
that is seen as an integral component of a the wider management and decision making
system. Key steps for indicator-based reporting include the following:
1. Clarify purpose, scope and scale
2. Involve the right people
3. Develop a conceptual framework and models to identify what needs to be
evaluated
4. Identify possible indicators
5. Assess best candidate indicators and measures (using selection criteria)
6. Undertake monitoring, evaluation and adaptive management
Although these steps are presented here in an order, in practice some of them can be
undertaken simultaneously or in an iterative approach. The steps may be applied to develop a
full set of indicators for a new project, or in part, when teams are looking to modify
individual indicators.
Frameworks help us identify what needs to be evaluated by providing conceptual models that
outline the interconnections between ecosystem and socio-economic components (e.g.
Niemeijer & de Groot 2008). Frameworks also help us to evaluate trends over time.
Monitoring and evaluation frameworks that meet these needs for natural resource
management tend to either be programme-outcome-based or driver/pressure-based.
Irrespective of which framework is chosen it will still be important to provide three sets of
supporting information to underpin the utility and transparency of the subsequent models:
Scoping and planning
Well-documented underpinning assumptions
Internal and external factors that influence outcomes
Effective indicators for freshwater management: attributes and frameworks for development
Landcare Research Page vii
Useful programme-based frameworks include the Policy Cycle Model, the Logic Model
and the Orders of Outcomes Model.
The Policy Cycle Model acknowledges that successful programmes advance and change
through successive cycles of planning, implementation and reassessment. A logic model can
assist managers and stakeholders to plan for results by envisioning a ‘big picture’ view of a
project or programme’s scope of work and potential significance to varied target systems. An
orders of outcomes model groups together the sequences of institutional, behavioural and
social/environmental changes that lead to more sustainable forms of catchment or river-basin
development.
There are a number of driver/pressure-based models. One of the most common is the
DPSIR model (Driving forces-Pressures-State-Impacts-Responses), which is used to assess
and manage environmental problems. It is another of the wide family of frameworks based on
the concept of causality chains for data synthesis, which links environmental and socio-
economic information using indicators for the five categories. ‘Driving forces’ are the socio-
economic and socio-cultural forces driving human activities that increase or mitigate
pressures on the environment. ‘Pressures’ are the stresses that human activities place on the
environment. ‘State’, or state of the environment, is the condition of the environment and of
the socio-economic system. ‘Impacts’ are the effects of environmental degradation.
‘Responses’ refer to the responses by society to the environmental situation.
Conclusions
The first steps for developing indicator sets involve discussions among the stakeholders
involved about how the problem in question should be framed. This should lead to the
development of broad agreement about what the indicators should report on.
Collectively the use of frameworks and models contributes towards a holistic cross-
theme view of the design and development of policy and management initiatives. At the
same time the frameworks and models serve as a tool for identifying indicators to help
assess and improve ongoing initiatives.
Jointly developing conceptual models (of the systems in question) and the associated
indicators (needed for informed decision making) helps support collaborative and co-
operative approaches across stakeholder groups. These are particularly useful for
helping us understand and intervene constructively in coupled social–ecological
systems (SES). Participating in these exercises helps participants clarify the system
boundaries, formulate questions, and reveal the assumptions of the different groups
involved.
Working together in this way helps the different stakeholders involved to generate
some consensus about what is important, and engages them in working towards shared
goals. It helps set up the capacities and systems to support collaborative adaptive
management.

Landcare Research Page 1
1 Aim and objective
Regional and unitary councils are increasingly setting limits on river flows, bulk water
allocation and water quality at the scales of catchment, sub-catchment and water management
zone. The MSI-funded Wheel of Water (WOW) programme will examine how to set and
implement such limits collaboratively with water users and stakeholders.
An indicator tool - based on the spokes of a water wheel - will be developed within this
collaborative approach. The spokes represent indicators across the four wellbeings:
environmental, economic, social and cultural. They will inform and be informed by
catchment, regional and national policy so that each WaterWheel at sub-catchment scale
combines with others up to catchment, then regional and national scales to achieve agreed
environmental, cultural, economic and social outcomes. Land and water users will be able to
use this tool to track their progress towards these multiple outcomes, and constructively adapt
practices as required. This will enable landowners and water users to view themselves as
water managers in a collective manner, taking account of the limits agreed by the community
and incorporated in their regional water plan.This report provides ideas for the identification
and selection of appropriate indicators as spokes of the Wheel of Water, from the twin
perspectives of:
A social learning process for stakeholders to agree on a relevant bundle of those
indicators
Their effectiveness as measures of achievement of the agreed limits
This thinking will then contribute to the design of the wider Wheel of Water collaborative
water management concept.
2 Report structure
This report begins by providing an introduction (Section 3) to how indicators can be used in
catchment land and water management. This highlights the need for any indicators
programme to begin with a clear identification of the problem and the establishment of target
goals and outcomes.
Selection criteria for optimal indicators are the focus of Section 4, which looks at some of the
key issues that make a good indicator. Section 5 outlines the main steps for embedding
indicators within a monitoring and evaluation (M&E) programme designed to support
constructive and adaptive management practice.
Two common frameworks used in environmental M&E systems are then examined (Section
6); these help us identify what needs to be evaluated by providing conceptual models that
outline the interconnections between societal and ecosystem components. The first
framework is based around the achievment of specific outcomes and is a programme-oriented
approach; it is most useful for a well-defined area such as a catchment, where the
specification of some particular management objectives is feasible. The second framework
looks at the family of Pressure-State-Response approaches; these are preferable in situations
that take broader policy approaches, for example looking at national goals.
Effective indicators for freshwater management: attributes and frameworks for development
Page 2 Landcare Research
Finally, Section 7 looks at how indicators and M&E can be used within an ongoing system
that supports adaptive management. Attention is paid to factors such as participation,
information technology and inter-agency coordination.
3 A context for using indicators in catchment management
The Land and Water Forum, a collaboration between all major water sector stakeholders,
proposed the adoption of a framework for New Zealand water management that ‘requires
regions to engage communities, including iwi, about the ways in which their water bodies are
valued, and to work collaboratively with the relevant land and water users and interested
parties to set catchment-specific targets, standards and limits’ (Land and Water Forum 2010).
To comply with these targets and the practice of adaptive management will require our linked
ecological and socio-economic systems to be closely monitored to assess the effects of
different practices and policies. A good monitoring and evaluation (M&E) system can make
the difference between a practice or policy that has an impact on the ground or one that
merely indicates good intention (Global Water Partnership 2006).
This section provides an introduction to how indicators can be used in monitoring and
evaluation systems to support sound management. It introduces the need for any indicators
programme to begin with a clear identification of the problem and the establishment of target
goals and outcomes. It then talks about different management systems
3.1 Using indicators in monitoring and evaluation systems
Indicators provide the basic building blocks for monitoring and evaluation systems, which in
themselves are integral parts of wider management systems. Water management indicators
are an important component in the development of catchment plans. They can help us set
goals and targets and then to monitor and evaluate catchment management performance. An
appropriate combination of indicators shows how freshwater objectives are being met. They
then provide the means to support reformulation of policies and programmes. Indicators
support transparency and enable stakeholders, communities and policymakers to judge
performance.
Indicators may or may not be a direct measure of a system performance. Many indicators in
fact are not direct measures, but proxy measures – often calculated from multiple variables –
which can be used to provide information on the performance of a system. Examples include
inflation figures in economics, diversity indexes in ecology, or indicator organisms such as
E. coli used to indicate a risk to human health from pathogenic organisms.
There are already a wide range of indicators in use in environmental and natural resource
reporting; for example, the Ministry for the Environment’s Environmental Performance
Indicators programme developed 160 indicators, subsequently refined to 22 across 10
environmental domains1. These indicators seek to reflect trends in the environment and
monitor progress in achieving policy and management targets. However, given the number
1 http://www.mfe.govt.nz/environmental-reporting/about/tools-guidelines/indicators/core-indicators.html
Effective indicators for freshwater management: attributes and frameworks for development
Landcare Research Page 3
and diversity of different indicators in use it is often hard to be sure about the exact meaning
and relevance of any particular set. Moreover, new sets are continually being developed.
Accordingly, we need to be clear on ways that indicators are developed, structured and
analysed and on the specific purpose of a set of indicators.
Indicators quantify and simplify phenomena, and help us understand and make sense of
complex realities. They tell us something about changes in a system. For example we are all
familiar with financial indicators that tell us about changes in the state of individual, local or
national economies. Similarly, reviewers note that the provision of information is a central
requirement to underpin the governance of natural resources (Dietz et al. 2003). Blood
pressure and temperature are well-used indicators of personal health. In short, indicators
simplify information that can help reveal complex phenomena. They focus on certain aspects
that are regarded as relevant and on the data available (Gabrielson & Bosch 2003).
Supporting good communication about the way the system under study is changing is the
main function of indicators, and communication is fundamental to the new mode of
collaborative governance being implemented for improving freshwater management in
New Zealand. Information is necessary but not sufficient to manage any system, including
social–ecological systems (SES). If information is to be useful it needs to be ‘congruent with
decision makers needs in terms of timing, content and form of presentation’ (Dietz et al.
2003). Given a clear understanding of the environmental system in question, indicators
communicate aspects about that system that help us understand the complex
interrelationships between that environment and society. However, their significance goes
beyond that obtained directly from the observed properties. Indicators come into their own
when used as primary components in the development and operation of monitoring and
evaluation (M&E) systems, to support one or more purposes: increasing understanding
(research), accounting and certification (audits), status assessment, and performance
effectiveness (Stem et al. 2005).
Evaluation for status assessment includes approaches such as population monitoring and
state-of-the-environment reporting. State of environment (SoE) reporting offers a way of
systematically documenting the status and change in environmental conditions through
tracking key environmental indicators. These indicators give a general sense of where a
country, region or area is in terms of key environmental variables, but they are generally not
linked to specific interventions. Report cards or scorecards are often used as a way to present
these higher level indicators, and serve as a communication tool for public and policymakers
alike. SoE indicators can offer insights into the impacts that policies and other high-level
actions have on our natural resources (Stem et al. 2005). In general, however, these indicators
are not designed to demonstrate causality. One limitation is that they often do not link
interventions (the results of socio-economic actions) with impacts on specific environmental
(and social, cultural and economic) states. Although as Stem and colleagues (2005) observe,
some do so implicitly.
Attention is increasingly being paid to the use of monitoring and evaluation programmes as a
way to determine whether interventions are effective and are in fact achieving the outcomes
they were set up to achieve. This role has its early history in impact evaluation initiatives –
one-time impact assessments of an intervention. And more recently, more effort is being
given to embed M&E programmes within wider adaptive management initiatives. Ostrom’s
fourth principle for managing ‘common pooled resource’ points to the importance of
effective monitoring (Ostrom 1990).

Effective indicators for freshwater management: attributes and frameworks for development
Page 4 Landcare Research
To be most meaningful, a monitoring programme should provide insights into cause-and-
effect relationships between environmental or socio-economic stressors and anticipated
ecosystem responses and subsequent social and economic outcomes (Bosch et al. 1996).
Indicators should therefore be chosen based on a conceptual model clearly linking stressors
and indicators with pathways leading to subsequent ecological and socio-economic changes
(Mulder et al. 1999). This process enables the monitoring programme to investigate the
relationships between anticipated stressors and downstream consequences. This provides an
opportunity to develop predictive models to anticipate trends instead of waiting until trends
have been demonstrated.
Accordingly, the first steps for anyone developing indicators involve holding discussions
about how the problem in question should be framed, and gaining broad agreement from the
key stakeholders involved on what the indicators should report on. This is in contrast with
many approaches that begin with a discussion on the selection of indicators (Gabrielson &
Bosch 2003). Thus the two first steps are problem identification and the establishment of
objectives (Winograd et al. 1999). These discussions should involve all key stakeholders,
both to gain the benefit of different ways of seeing the problem and in part to help ensure that
the resulting indicators are ‘owned’ by the parties with a stake in the issue.
Both problem identification and the establishment of desired outcomes benefit from being as
detailed as possible, as it is this detail that enables the indicator selection to be appropriately
targeted. Vague or overly broad objectives – such as ‘improving water quality’ – are of little
use in selecting indicators (Winograd et al. 1999) – and may well indicate that the project or
component is not very well thought out.
3.2 Complicated or complex – managing different systems
As we have seen indicators can play a key role in decision making, but the emphasis on how
to use indicators can differ according to the particular system being managed. A major
breakthrough in understanding the complex world of organisations and socio-ecological
environments is the field of systems theory. Catchment management is characterised by
socio-ecological complexities and its success needs a trans-disciplinary systems approach
(Allen et al. 2011; Fenemor et al. 2011b). ‘Systems thinking’ is a way of helping people to
see the overall structures, patterns and cycles in systems, rather than seeing only specific
events or elements. It allows the identification of solutions that simultaneously address
different problem areas and leverage improvement throughout the system. It is important to
distinguish between ‘complicated’ and ‘complex adaptive’ systems.
Complicated systems are all fully predictable. These systems are often engineered. We can
understand these systems by taking them apart and analysing the details. From a management
point of view we can create these systems by first designing the parts, and then putting them
together. However, we cannot build a complex adaptive system (CAS) from scratch and
expect it to turn out exactly in the way that we intended. CAS are made up of multiple
interconnected elements, and adaptive in that they have the capacity to change and learn from
experience. Examples of CAS include human beings, the stock market, ecosystems, immune
systems, and any human social-group-based endeavour – including water management – in a
cultural and social system. CAS defy attempts to be created in an engineering effort, and the
components in the system co-evolve through their relationships with other components. But
we can achieve some understanding by studying how the whole system operates, and we can

Effective indicators for freshwater management: attributes and frameworks for development
Landcare Research Page 5
influence the system by implementing a range of well-thought-out and constructive
interventions. A useful outline of the management differences between complicated and
complex systems is provided by Glouberman and Zimmerman (2002) (see Table 1).
As Table 1 shows, developing a complicated system is like building a moon rocket. It
requires high levels of coordinated knowledge, expertise and experience to achieve the
required result. A clear plan is critical and the process requires the rigorous coordination of a
range of experts. In catchment management terms, this is like building a dam. In contrast,
managing a complex adaptive system is more akin to raising a child. There is no blueprint,
recipe or hard-and-fast rules. Expertise can help, but is not sufficient. Every child is unique
and the outcome remains uncertain, despite a parent or caregiver’s best efforts. Children must
be allowed to take risks so they can learn. Too much or too little parental control throughout
their development tends to lead to less positive outcomes, making it necessary to strike a
balance and to effectively negotiate the path of the child’s upbringing with that child.
Principles can be used to guide parenting, but not to prescribe it. It is impossible to know
what the right way to do this is. Judgement may be a matter of perspective.
Table 1 Managing complicated and complex systems (Glouberman & Zimmerman 2002)
Complicated systems
(like sending a rocket to the moon)
Complex adaptive systems
(like raising a child)
Formulae are critical and necessary
Sending one rocket increases assurance that the next will be OK
High levels of expertise in a variety of fields are necessary for success
Rockets are similar in critical ways
There is a high degree of certainty of outcome
Formulae have limited application
Raising one child provides experience but no assurance of success with the next
Expertise can contribute but is neither necessary nor sufficient to assure success
Every child is unique and must be understood as an individual – relationships are important
Uncertainty of outcome remains
Getting people to work collectively in a coordinated fashion in areas such as catchment
management is more akin to raising children than building rockets to go to the moon and
back – a fact many people recognise. Tools such as hydrological catchment models will help
identify primary biophysical indicators, but experience and collaborative behaviours in a
particular catchment setting will govern selection of other indicators.
Indicators of progress in managing a complicated system are directly linked through cause
and effect. However, indicators of progress in a complex system are better seen as providing
a focus around which different stakeholders can come together and discuss, with a view to
potentially changing their practices to improve the way the wider system is trending.
Understanding this difference has important implications for management action as Table 2
highlights. In many cases people continue to refer to the system they are trying to influence
as if it were complicated rather than complex, perhaps because this is a familiar approach,
and there is a sense of security in having a blueprint, and fixed milestones. Furthermore, it is
easier to spend time refining a blueprint than it is to accept that there is much uncertainty
about what action is required and what outcomes will be achieved. When dealing with a
complex system, it is better to conduct a range of smaller innovations and find ways to
Effective indicators for freshwater management: attributes and frameworks for development
Page 6 Landcare Research
constantly evaluate and learn from the results and adjust the next steps rather than to work to
a set plan (e.g. Anderson & McDaniel 2000). The art of management and leadership is having
an array of approaches and being aware of when to use which approach. Most issues will
have all system types present, and there may well be multiple systems involved.
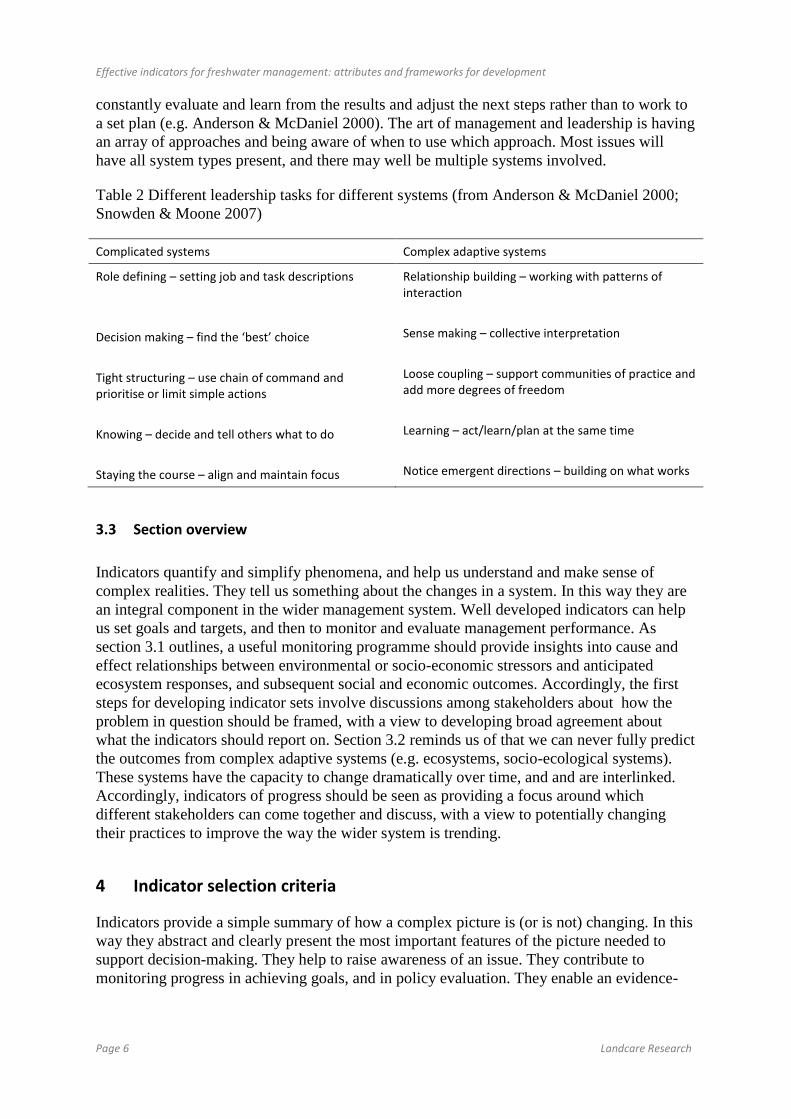
Table 2 Different leadership tasks for different systems (from Anderson & McDaniel 2000;
Snowden & Moone 2007)
Complicated systems Complex adaptive systems
Role defining – setting job and task descriptions
Decision making – find the ‘best’ choice
Tight structuring – use chain of command and prioritise or limit simple actions
Knowing – decide and tell others what to do
Staying the course – align and maintain focus
Relationship building – working with patterns of interaction
Sense making – collective interpretation
Loose coupling – support communities of practice and add more degrees of freedom
Learning – act/learn/plan at the same time
Notice emergent directions – building on what works
3.3 Section overview
Indicators quantify and simplify phenomena, and help us understand and make sense of
complex realities. They tell us something about the changes in a system. In this way they are
an integral component in the wider management system. Well developed indicators can help
us set goals and targets, and then to monitor and evaluate management performance. As
section 3.1 outlines, a useful monitoring programme should provide insights into cause and
effect relationships between environmental or socio-economic stressors and anticipated
ecosystem responses, and subsequent social and economic outcomes. Accordingly, the first
steps for developing indicator sets involve discussions among stakeholders about how the
problem in question should be framed, with a view to developing broad agreement about
what the indicators should report on. Section 3.2 reminds us of that we can never fully predict
the outcomes from complex adaptive systems (e.g. ecosystems, socio-ecological systems).
These systems have the capacity to change dramatically over time, and and are interlinked.
Accordingly, indicators of progress should be seen as providing a focus around which
different stakeholders can come together and discuss, with a view to potentially changing
their practices to improve the way the wider system is trending.
4 Indicator selection criteria
Indicators provide a simple summary of how a complex picture is (or is not) changing. In this
way they abstract and clearly present the most important features of the picture needed to
support decision-making. They help to raise awareness of an issue. They contribute to
monitoring progress in achieving goals, and in policy evaluation. They enable an evidence-
Effective indicators for freshwater management: attributes and frameworks for development
Landcare Research Page 7
based comparison of trends over time, and within and between catchments, regions or
countries. They are also important for enhancing accountability.
While specific definitions may vary, there is consensus that indicators provide a summary
indication of a condition or problem, and permit the observation of progress or change. The
progress can be measured over time or against benchmarks, targets or visions for the future.
The indicator should give a clear and unambiguous indication of change, in terms of whether
the aspect of life captured by the indicator is progressing or regressing. Woodhouse et al.
(2000) identify major functions of indicators as:
To assess conditions and changes
To compare across place and situations
To assess conditions and trends in relation to goals and targets
To provide early-warning information
To help anticipate future conditions and trends
There is no universal set of indicators that are equally applicable in all cases. However, there
are a number of criteria that help assure the relevance of any particular indicator or indicator
set is, and there are a number of general considerations that should be taken into account
through the selection process.
4.1 Direct relevance to objectives or problems
The indicator selection must be closely linked to objectives being sought, or problems being
addressed. The important thing is to be clear about what you want to measure, or you will
find it a struggle to find the right measure; for example, in a catchment context, measuring
the achievement or non-compliance with a water quality limit. In addition there are a number
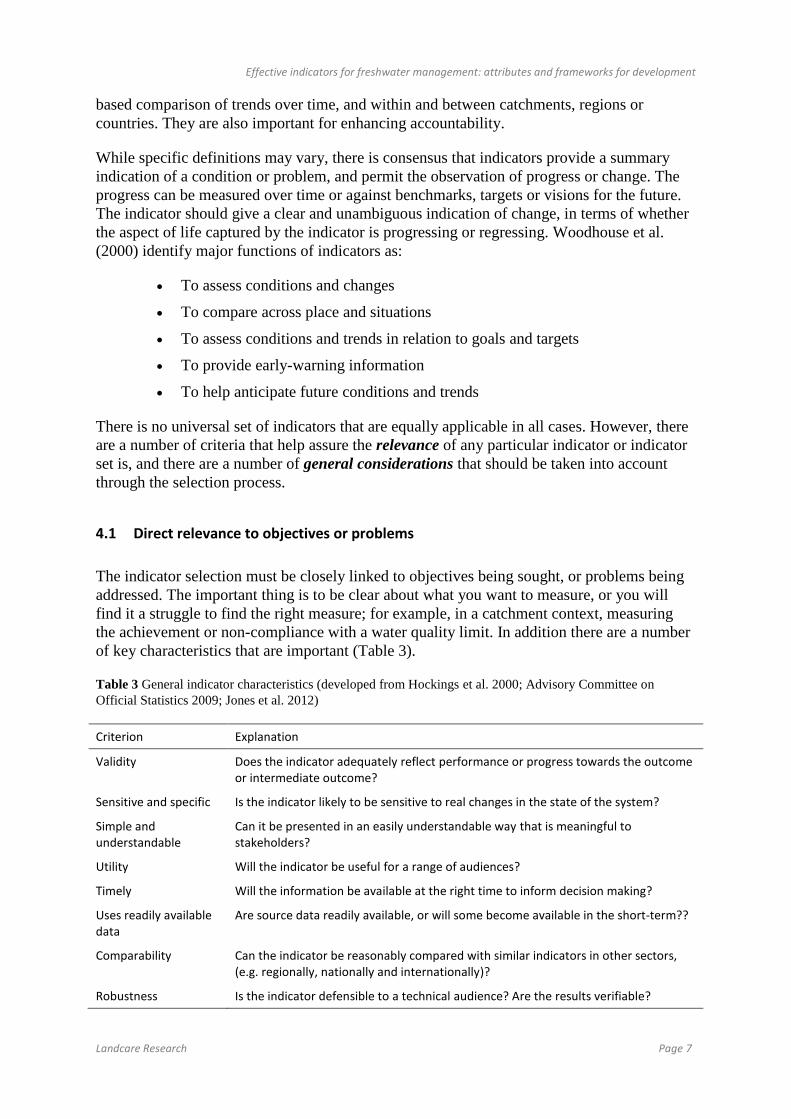
of key characteristics that are important (Table 3).
Table 3 General indicator characteristics (developed from Hockings et al. 2000; Advisory Committee on
Official Statistics 2009; Jones et al. 2012)
Criterion Explanation
Validity Does the indicator adequately reflect performance or progress towards the outcome or intermediate outcome?
Sensitive and specific Is the indicator likely to be sensitive to real changes in the state of the system?
Simple and understandable
Can it be presented in an easily understandable way that is meaningful to stakeholders?
Utility Will the indicator be useful for a range of audiences?
Timely Will the information be available at the right time to inform decision making?
Uses readily available data
Are source data readily available, or will some become available in the short-term??
Comparability Can the indicator be reasonably compared with similar indicators in other sectors, (e.g. regionally, nationally and internationally)?
Robustness Is the indicator defensible to a technical audience? Are the results verifiable?

Effective indicators for freshwater management: attributes and frameworks for development
Page 8 Landcare Research
Consistent and repeatable
Can the data be obtained regularly to inform a trend?
Limit-based Do you have a target level or bottom line against which to assess the indicator, or indicator trend?
4.2 General considerations
Besides these general points the following are other considerations to keep in mind through
the process of indicator selection.
Be limited in number
A small set of well-chosen indicators will usually prove the most effective approach.
Developing performance measures and indicators can seem a huge and complex undertaking,
especially for water management programmes that may contribute to a range of
environmental, economic, social and cultural outcomes. It is impossible for agencies,
managers, or others to measure everything that could be measured, so it is important to
identify what has been termed the ‘vital few’ measures and indicators that jointly can provide
a general assessment of what is being looked at or for.
There is no rule on the number of indicators; however, the Chartered Institute of Public
Finance Accountancy argue that 10 to 20 indicators is sufficient for any one person to
understand (Audit Commission 2000). The goal is to develop a balanced set of indicators that
meet the needs of the different managers and stakeholders involved.
In some cases it may be appropriate to use composite indexes to reduce the number of
indicators. Examples of techniques when there are too many data are envelopment analysis,
producing an overall indicator of efficiency or effectiveness (Spottiswood 2000), or
ecological footprinting. However, in many cases, an oversupply of perfect information is not
usually the issue. The more common issue is what indicators can usefully be developed and
implemented given the constraints associated with poor data quality and data gaps.
Realistic collection or development costs
Indicators must be practical and realistic; therefore the cost of their collection and
development needs to be considered. This may lead to trade-offs between the information
content of various indicators and the cost of collecting them.
Qualitative and quantitative
Quantitative indicators are numerical and easily amenable to statistical analysis. They can
often be easily standardised and aggregated. Qualitative indicators are more descriptive and
evocative, but can often provide a more realistic measure of outcomes that relate to social and
cultural issues – such as many of the outcomes sought through social marketing work. This
reflects the fact they are often dealing with less tangible impacts (e.g. on status, spiritual
values, conflict). For example, imagine a photo of children playing around a freshwater

Effective indicators for freshwater management: attributes and frameworks for development
Landcare Research Page 9
source. A caption that includes both quantitative and qualitative data could read ‘There are
nine (quantitative) happy (qualitative) children.’ Both indicators – relating to numbers and
emotional state respectively – add value to the assessment of what is happening in the picture.
More thought is needed to ensure that important social and cultural issues can be effectively
communicated to decision makers.
Internal or external
Key questions in any monitoring and evaluation programme are who identifies the indicators
and on what basis? Externally defined indicators are based on predefined and external views
and agreements. Having widely-accepted definitions, these indicators lend themselves to
aggregation and comparison. Internally-defined indicators are useful to programme partners
or stakeholders looking to assess their progress to internally-important goals – they are more
locally relevant. Many evaluation programmes look to provide for a combination of both
internally- and externally-defined indicators.
Issues of scale
Careful thought should be given to the appropriate spatial and temporal scale of indicators.
Since the environmental impact of project activities seldom coincides with administrative
boundaries, indicators often need to be measured on different scales. There might also be lags
in time before project effects are felt.
Thresholds
The definition of thresholds for systems (and choosing appropriate indicators) is an important
developing issue (Woodhouse et al. 2000). A threshold is a boundary level of a variable,
which is regarded on the basis of expertise to represent the point at which significant changes
occur. Thresholds are particularly important in an agri-environmental context because
ecological systems have a propensity to ‘flip’ from one state to another (Rigby et al. 2001).
When an indicator passes this level then the system is considered to be unsustainable or on
the road to unsustainability. Issues arise as to the identification of a threshold level (be it
qualitative or quantitative) and whether passing a threshold level for one indicator is
sufficient to signify unsustainability, or whether several indicators need to have passed their
threshold levels before the system is unsustainable.
Direction of trends
In the case of the waterwheel concept it is important that indicators are designed so that
direction has a consistent meaning. That is, change in one direction will always be interpreted
as an improvement and in another direction as a decline. To illustrate. Perhaps the
government has a target growth rate of 3%. If the actual growth rate changes from 1 to 2%,
this would be regarded as an improvement. But if the actual growth rate changes from 4 to
5%, though the direction is the same as before, it might not be regarded as an improvement as
it is moving away from the target and possibly putting other parts of the economy at risk.
Effective indicators for freshwater management: attributes and frameworks for development
Page 10 Landcare Research
Time lag and attribution
High-level outcomes in many natural resource management issues, such as catchment water
quality, tend to be achieved gradually. Sometimes this will be over a period of many years. In
contrast, performance reporting for agency and political purposes will often be required
within shorter time periods (e.g annually). Accordingly there is a need for indicators that can
track meaningful progress towards these high-level outcomes over these reporting periods.
Short-term patterns in resource states may also fluctuate in the shorter-term due to unseasonal
weather events and other external factors. These time-lag challenges can often be addressed
by breaking the end-outcomes down to more measurable elements (i.e. intermediate
outcomes) amenable to demonstration of shorter-term progress. Accordingly, a more
measurable intermediate outcome can be seen to act as a proxy indicator for a more difficult-
to-measure long-term outcome.
One of the challenges in relying on proxy indicators is that because so many things can affect
outcomes in natural systems, it is quite difficult for us to say that what we do in the shorter
term leads to a particular outcome in the longer term. The issue of attribution (or cause and
effect) can be expressed on two levels – we can rarely be completely certain that today’s
inputs and outputs will lead to the desired outcomes at some future time, and, even if the
desired outcomes occur, it can be hard to be certain that ‘our small intervention’ was the
primary cause.
To address this ‘challenge of causal attribution’, the theory of change needs an accompanying
‘performance story’ (Jones et al. 2012). This story should:
Argue convincingly that activities and outputs are likely to contribute to
ultimate outcomes (the programme’s documented theory of change)
Demonstrate that activities and outputs are contributing to outcomes at some
meaningful level (intermediate outcomes and their associated performance
indicators)
Communicate the performance story effectively to show clearly and explicitly
the logical steps in linking inputs to outcomes
This performance story is generally illustrated through the use of conceptual models that set
out what we expect to happen, how we see things interrelating to arrive at that outcome, and
what assumptions underpin what we believe. Setting out a performance story in this way is
sometimes referred to as a logic model, because it uses the best knowledge we have to be
believable. This knowledge will build on science, local and traditional knowledge. This
information can provide managers with varying levels of support for the causal pathways that
have been proposed in logic models (The Heinz Center 2009).
Approaches to addressing issues of attribution and time lag include:
Robust, justifiable and transparent links in a programme’s logic hierarchy
(i.e. can an effect be assumed reasonable, based on prior evidence?)
A focus on intermediate outcomes that can be attributed directly to programme
activities at a measurable timescale

Effective indicators for freshwater management: attributes and frameworks for development
Landcare Research Page 11
Use of a formal experimental design or a statistical analysis of attribution
Use of qualitative measures of progress
As a catchment management example, the delays in improvement of water quality following
implementation of mitigations such as riparian planting could be monitored by additional
indicators of the extent and state of implementation of those mitigations, as well as of the
water quality improvement expected later.
Visualisation and presentation
Visualisation is a very important part of the indicator selection process. There are practical
issues that need to be taken into account when presenting any form of information. Huff, in
his famous book How to Lie with Statistics (Huff & Geis 1954) pointed out that the language
and presentation of statistics, which appeal to a fact-minded culture, can confuse and at times
mislead. People do not necessarily know that they have been misled or have misunderstood
information; for example in the case of environmental indicators (Johnson & Chess 2006)
noted there was a difference between people’s perceived understanding of information and
their actual comprehension of that information.
One area of research that can help in this regard is Choice Architecture (Thaler & Sunstein
2009), which is concerned with how the presentation of information can influence decisions.
Certain forms of information presentation can influence the decision-making performance, at
least for simple decisions. Decision-making performance can be improved when there is a
‘cognitive fit’ between the information emphasised and the representation of the information;
for example, graphs can be better for representing spatial data and tables for symbolic data
(Vessey 1991). Not only is presentation format important in terms of information uptake, but
the perceived usefulness of information is an important mediator in whether information is
used (Sussman & Siegal 2003). This area of indicator presentation is particularly important in
a project such as the Wheel of Water, which has taken on the challenge of simplifying
complex information to empower land and water users to collectively achieve catchment
objectives, especially environmental ones. Often graphical representations are chosen for
their power of visualization, and these representations often utilise spider diagrams which
allow the display of multiple indicators at once (Gareau et al. 2010). These diagrams are
known by various names including kiviat diagram, star chart or radar plots.
An early example developed by the Swiss College of Agriculture2 for the holistic assessment
of the sustainability of agricultural production at farm level is shown in Figure 1. This
indicator-based web aims to provide farmers with scientifically sound yet practically relevant
information that motivates and helps them improve the sustainability of need to address to
achieve a well-balanced, more sustainable, farming situation. Each component of interest to
farm management is shown along with an indicator of its state (the open square –
optimum=100) and the accompanying pressures (the solid diamond – optimum=0). The
yellow shaded centre circle illustrates the range that is being aimed for at a minimum.
Finally, areas that are doing well are highlighted with green shading (e.g. working condition,
local economy), while those not performing as well as might be hoped (e.g. economic
efficiency, water management) are highlighted with pink shading. Farmers are meant to strive
for a well-balanced situation where all indicators are in the positive range, rather than for a
maximum score in single aspects.

Effective indicators for freshwater management: attributes and frameworks for development
Page 12 Landcare Research
Figure 1 Spider diagrams and the presentation of sustainability-performance-related information. Diagram
shows a summary sustainability polygon for small-scale farmers (source: Swiss College of Agriculture2)
However, although these diagrams play an important role in bringing multiple factors
together, there appears to have been little work undertaken to assess the effectiveness of these
types of diagrams in changing practice. A Web search uncovered a wide range of opinions,
many of which were strongly supportive of their use due to their simplicity and pragmatic
approach for presenting and communicating information. Other reviewers noted the
attractiveness of the approach, but pointed to a number of areas where care needs to be taken
that susch diagrams do not inadvertently lead users to misread the message. These areas of
concern can include situations where the wrong indicators are chosen (Kommenic et al. 2008)
or because of difficulties in representing non linarites and thresholds (DeFries et al. 2004) .
Another possibility is that people may interpret these diagram through the area covered by the
indicators rather than considering the indicators themselves and what they mean, potentially
supporting inappropriate decision trade-offs (Kleijnen & Smits 2003). Clearly there is more
work to be done on understanding the role of information presentation and its impacts on
decision making.
4.3 Section overview
An indicator is something that points to an issue of condition. Its purpose is to show how well
a particular system is working, and whether activities and policies are on track to deliver on
the desired outcomes or goals. Indicators are as varied as the different systems they monitor.
2 http://www.shl.bfh.ch/fileadmin/docs/Forschung/KompetenzenTeams/Nachhaltigkeitsevaluation/RISE/RISE_Flyer_2008__2_.pdf

Effective indicators for freshwater management: attributes and frameworks for development
Landcare Research Page 13
However, there are certain characteristics that effective indicators have in common. As
section 4.1 indicates relevance is all important, indicator selection must be closely linked to
the objectives being sought, or the problems being addressed. Key factors are shown in Table
3 and include the selection of indicators that are sensitive to the changes under consideration,
easy to understand by the range of audiences involved, reliable, and based on accessible and
timely data. Section 4.2 provides a checklist of other considerations that may influence
selection depending on the particular situation in question. These issues include who should
be involved in indicator selection, qualitative vs quantitative data, the need to manage for
problems such as time lag and attribution, and considerations around how indicators are
presented.
5 Steps and guidelines for indicator selection
Selecting appropriate and useful indicators to help guide management and policy initiatives
requires careful thought around purpose and scale, iterative refining, collaboration and
consensus building. There are two main components common to effective M&E systems for
natural resource management (Stem et al. 2005). First is an approach that comprises a
specific process accompanied by a number of steps and guidance. Second, is a conceptual
framework (see Section 6) that comprises one or more conceptual models to provide a
generalised representation of the drivers, states and outcomes under consideration. The
remainder of this section looks at a series of steps to help select optimal indicator sets. These
steps are aimed to ensure indicators and measures are selected using a process that considers
practical, functional and use parameters for any particular issue.
Despite the number of different M&E approaches being used, there is a surprising amount of
convergence among approaches within any specific purpose (Stem et al. 2005). A generic set
of key steps for indicator-based reporting involves the following:
1. Clarify purpose, scope and scale
2. Involve the right people
3. Develop conceptual framework and models to identify what needs to be evaluated
4. Identify possible indicators
5. Assess best candidate indicators and measures (using selection criteria)
6. Undertake monitoring, evaluation and adaptive management
Although these steps are presented here in an order – in practice some of them can be
undertaken simultaneously or in an iterative approach. In particular, steps 1 and 2 will almost
always involve a cyclical approach. The project has to be initiated by someone (often a
governing agency) who recognises that there is a problem situation. As key stakeholders are
brought into the decision-making cycle – with their own set of perspectives and experience –
they will contribute to refining, or even redefining, the purpose, scope and scale of the issue.
This sequence of steps may be applied to develop a full set of indicators for a new project, or
in part, when teams are looking to modify individual indicators.
Effective indicators for freshwater management: attributes and frameworks for development
Page 14 Landcare Research
1. Clarify purpose, scope and scale
Many coordinators of indicator reporting processes jump immediately to steps 5 and 6
(Gabrielson and Bosch 2003). However, it is important to begin with the earlier steps and
gain a deeper understanding and agreement on what the indicators need to report about.
Forging understanding and agreement provides the rationale for involving all the relevant
stakeholders (Gabrielson & Bosch 2003; USAID 2010). This provides for wider viewpoints,
and helps ensure that all stakeholders have a deeper understanding of the final indicator set,
and what they mean. It is this discussion about framing, and joint development of the
underlying indicator framework, that contributes to relevance.
Evaluations of management and policy effectiveness may vary widely in scope and scale. At
one level is the farm or smaller catchment initiative. Often at this more applied level it will be
the effectiveness of a programme or project that is being evaluated. Larger-level evaluations
may focus on river basins, or regions. At these larger scales evaluations are watching for
broader environmental trends, or the broad responses to policies and other system drivers.
Indicators from small-catchment scale may need to be aggregated or considered cumulatively
when working at larger scales, a particular design challenge for the Wheel of Water concept.
2. Involve the right people
In recent years, water governance initiatives have increasingly acknowledged the complexity
of managing across multiple social perspectives, and policy success is seen to depend on the
co-operation of different groups within society. This acknowledges the role of governance as
the ‘art of steering societies and organizations’ (Plumptre & Graham 2000), and this move
towards more inclusive and collaborative approaches is acknowledged in a wide range of
water and other natural resource management situations (Furlong & Bakker 2008; Pahl-Wostl
et al. 2008; de Loë 2009; Fenemor et al. 2011a). Significantly, the 2009 Nobel Prize for
Economics was awarded to Elinor Ostrom for her work on polycentric (distributed)
governance of common-pool resources (Ostrom 1990; Ostrom et al. 1999). Her research is
founded, coincidentally, on water management – water users who devised their own
collective solutions to excessive groundwater withdrawals in Californian basins.
Within this broader move towards inclusive governance, the process of developing an
indicator set provides another opportunity to involve a range of partners and stakeholders
about goals, plans and assessment. This provides for a range of management benefits,
offering the potential to:
Draw on different perspectives and area of expertise
Ensure that focus is on the changes that matter, and as part of a coordinated and
integrated approach to achieve sustainability
Build commitment and understanding of the linkage between indicators and
impacts and outcomes on the ground

Effective indicators for freshwater management: attributes and frameworks for development
Landcare Research Page 15
Build capacity for performance management among the range of partners and
stakeholders
Support monitoring and evaluation systems to be efficient. Often partners and
stakeholders can suggest or facilitate many of the practical issues associated
with indicators and data collection.
The provision of timely and relevant information is obviously a key factor essential to
improving learning. However, this is often difficult to achieve in natural resource
management, where the wide range of stakeholders means that information is highly
fragmented across groups and access to such information can come from a range of sources
(Allen & Kilvington 2005). Science is a main contributor, but there is also a growing
acknowledgement of the need to draw upon local and traditional knowledge systems. Formal
monitoring of the results of management actions to confirm (or otherwise) their effectiveness
is another key source of new information.
However, it is not always easy to facilitate the sharing of information in natural resource
management situations. Leaving aside the problems of trust, and issues that may have caused
conflict between different stakeholders in the past, there are some quite obvious
communication challenges to bridge understandings across the different stakeholders
involved. For example, several difficult communication gaps must be bridged across science
disciplines, especially across the social and biophysical disciplines (Allen et al. 2011).
Traditional knowledge systems bring their own complexities (Harmsworth et al 2011).
Similarly, it can be extraordinarily difficult to get land managers (both traditional and local)
to set out the underlying knowledge behind their practices. Many of these practices are highly
contextual, and it is necessary to find ways to help them express this. The development of
conceptual frameworks and models is a key method to help start addressing these
communications issues (Allen & Jacobson 2009).
Underpinning the successful implementation of participatory processes that contribute to
inclusive governance and collaboration are an increasing range of tools and processes. There
is growing evidence that we need to replace recipe-based approaches that emphasise selecting
the relevant tools for the job with an approach that emphasises participation as a social
process (Keen & Mahanty 2006; Reed 2008). The latter also implies the need to pay more
attention to ensuring that processes are managed by those with well-developed skills in
relationship-building, facilitation and conflict management (Allen et al. 2011). This
importance to paying attention to social process management in indicator development and
other management activities is reinforced by the emerging field of literature that highlights
potential negative impacts inherent in collaborative approaches to governance (e.g. McGuire
2006; Kallis et al. 2009). These and related reviews point out that collaboration will not
necessarily meet the needs of all groupings, and in particular can be used to privilege more
powerful interests (Swyngedouw 2005; Lemos & Agrawal 2006), and further marginalise
weaker actors (Shilling et al. 2009).
3. Develop conceptual frameworks and models
The approach (or steps) described here is one of the two main components of a monitoring
and evaluation system. The other main component is a conceptual framework with
accompanying models that provides a template for understanding generic cause-and-effect
relationships (Stem et al. 2005). Well-developed conceptual models of the managed

Effective indicators for freshwater management: attributes and frameworks for development
Page 16 Landcare Research
ecosystem in question are required to select indicators that reflect the key elements of
ecological systems (Noon & McKelvey 2006). The frequent use of these frameworks and
related models by international agencies (United Nations, World Bank, OECD, European
Environment Agency – EEA) and many other national organisations and governments is a
recognition that a conceptual framework is required to select and organise indicators
(Woodhouse et al. 2000; Ostrom 2009).
In this sense, processes for developing frameworks, pictures, representations and models can
be seen as powerful aids to help people unlock and discuss with others the information and
experience they have (Heemskerk et al. 2003; Allen & Jacobson 2009). The use of pictures
and diagrams can be an important step in developing a shared language and understanding
around the range of concepts and experiences that different stakeholder groups can bring to
light on the situation. This can often be a useful first step in the process of developing more
specialised computer-based models that draw on a range of knowledge systems. By actively
seeking to involve stakeholders in this process, we begin to expand the use and richness of
the word ‘model’ in the adaptive management literature beyond that of quantitative systems
modelling (e.g. Walters 1986) or even that of Bayesian predictive modelling (e.g. Johnson &
Williams 1999) to one of helping people sort out and represent different forms of knowledge.
The conceptual model(s) outline interconnections among socio-ecological system
components and the attributes that characterise the state of the wider system. The model
needs to illustrate how ‘the system’ in question ‘works’ with particular emphasis on
anticipated responses to human-induced stresses and drivers. Conceptual models of
relationships between system components provide a process that can first help clarify
important relationships and secondly provide a framework for identifying indicators. It is
important to consider both long-term outcomes (e.g. maintenance of water quality) and the
intermediate results of policy and management needed to achieve these outcomes. The final
conceptual models should also include both bio-physical and socio-economic aspects of
system relationships at intermediate and long-term scales (Hockings et al. 2008).
Because of uncertainty over the structure and dynamics of ecosystems and related socio-
economic systems, reaching agreement on a single conceptual model to guide indicator
selection is unlikely. Therefore, competing models are likely and desirable. As Noon and
McKelvey (2006) point out, multiple competing models provide a formal expression of
ecological and social uncertainty. As data accumulate around chosen indicators, the
information can be used to refine and discern between competing models. This development
of models from best knowledge, and refining and learning through monitoring and
evaluation, lies at the heart of collaborative adaptive management. This, in turn, supports a
learning-based approach to both policy and management.
4. Identify possible indicators
Usually there are many possible indicators for any particular purpose, but some are always
more appropriate and useful than others.
One way to begin developing indicators is to begin with working sessions to develop the
conceptual frameworks that underpin our understanding of our actions and policies around
the issue in question. This includes building conceptual frameworks that help communication
across different resource perspectives. For example farmers, freshwater scientists and
Effective indicators for freshwater management: attributes and frameworks for development
Landcare Research Page 17
streamcare groups may at times have markedly different perspectives on what is important
and how the catchment responds to natural and human pressures. Where related and nested
models are needed to understand different system interactions and work streams then sub-
groups can be used. Once these models are developed, candidate indicator sets can be
developed, either with the different stakeholders or externally – as a starting point for the
different stakeholders to consider.
In selecting indicators it is important not to settle on the first ideas that come to mind, or that
are suggested. Create an initial list of indicators for each component and interaction set out in
the system model(s) being used. This can be done in several ways:
Conduct a brainstorming session with colleagues or stakeholders. In this way
you can draw upon a wide range of expertise.
Consider related monitoring programmes to see whether their information can
be used directly as an indicator in your situation. Many organisations have
databases and indicator lists for different components of freshwater systems.
State of environment reporting systems and council and research monitoring
programmes are all potential sources. Some New Zealand examples are
provided in Appendix 1.
Create an expert group for a particular component, or consult with people with
expertise.
Review related programmes in similar areas and sectors for ideas.
5. Assess best candidate indicators and measures
Finally, involve all the key players in developing, from this wider set, the final few candidate
indicators and their measures. Selecting the best candidates as indicators can be done using
the criteria described above. Remember that there will be trade-offs. For example the optimal
indicator may not be the most cost-effective. The final set of best indicators to use in the
resulting monitoring and evaluation system should aim to provide an optimal set for
management and policy.
It is important to be strategic and streamline wherever possible. There are costs in terms of
time and money to collect data for each indicator. Ways of managing this include:
Select indicators based on strategic thinking about what really needs to be
measured for system understanding and management and/or policy success.
Review and refine indicators.
Remember that some indicators may be able to be used as measures for multiple
outcomes or components.
Use collaborative approaches in order to discuss and establish priorities and
understandings that help the different managers involved to focus on the key
indicators that are necessary and sufficient.

Effective indicators for freshwater management: attributes and frameworks for development
Page 18 Landcare Research
Ensure that the rationale for indicator selection is recorded in the M&E plan.
There are rarely perfect indicators. It is important to ensure that the rationales
behind the ones that have been selected are recorded so future staff or auditors
understand why each indicator was selected.
Finally, after some rounds of data collection have been undertaken, it is useful to review the
M&E plan and indicators with a view to refining the system.
6. Undertake monitoring, evaluation and adaptive management
A number of factors are important in managing a monitoring and evaluation system that uses
the indicators and feeds the results back into the management and policy systems.
Completing this step effectively supports an adaptive management system.
A good M&E system should support continuous improvement and adaptation at several
levels. At the project management level an M&E system should provide the information
needed to improve efficiency in the implementation process, and the performance of the
system in question to support desired outcomes. At a strategic level it should also support
regular reviews of the M&E system itself – and what it is showing. This helps users revaluate
chosen courses of action and take into account changing contexts.
These collaborative approaches should not be seen as developing and strictly applying a
monitoring protocol; rather they are processes that require ongoing review and improvement.
The most important results of these approaches are not simply data, but rather working
partnerships capable of translating information into wise decision making that helps
stakeholders respond to changing needs in an effective way. Finally, it is important to
remember that these collaborative initiatives should be flexible and designed to grow (Allen
& Kilvington 2002). There is no need to involve reluctant stakeholders in the beginning, and
in some cases new stakeholders may be identified along the way. What is important is that
those already working together can change to accommodate this growth. Broad stakeholder
involvement leads to a diverse range of groups feeling that they are owners of projects and
having a sense of accomplishment in working together to solve problems. This dynamic will,
in turn, encourage other individuals and groups to participate.
5.1 Section overview
Selecting appropriate and useful indicators to help guide management and policy initiatives
requires careful thought around purpose and scale, iterative refining, collaboration and
consensus building. This section acknowledges two main components common to effective
M&E systems for natural resource management. First is an overall approach that comprises a
specific process accompanied by a number of steps and guidance. Second, is a conceptual
framework (see Section 6) that comprises one or more conceptual models to provide a
generalised representation of the drivers, states and outcomes under consideration. The
development of the conceptual framework is inherent in the overall development process.
The steps begin with an iterative process of involving stakeholders in refining, or even,
redefining the purpose, scale and scope of the issue being looked at. The results of these
discussions underpin the development of a conceptual framework and models that help
Effective indicators for freshwater management: attributes and frameworks for development
Landcare Research Page 19
identify what needs to be evaluated. At this stage attention turns to the identification and
selection of indicators. It is suggested that a number of possible indicators be developed, and
then the best candidate set can be developed from these using the criteria outlined in section
4. This sequence of steps may be applied to develop a full set of indicators for a new project,
or in part, when teams are looking to modify individual indicators for already existing
situations.
6 Frameworks for indicator identification and development
6.1 Underpinning elements
Any frameworks and related models that will help with understanding the system and guide
how we can measure change will require three key sets of supporting information and
activities:
The scoping and planning exercise that underpins any model development
Documentation of underpinning assumptions
Noting of internal and external factors that influence outcomes
Finally – but not necessarily last – consideration needs to be given to which stakeholders
should be involved in model and information development.
1. Planning and scoping
M&E frameworks are created as an integral part of management initiatives to address
particular perceived problems or needs. The first step in creating a framework is to clearly
define the problem or need. Your ‘issue’ statement should briefly explain what needs to
change – why is there is a need for intervention? Your issue statement answers the question,
‘What problem/issue does my programme or policy aim to solve?’ and should consider ‘who,
what, why, where, when, and how’ in relation to the problem/issue.
Then consider the overall purpose of your programme. What are you trying to accomplish
over the life of the programme and beyond? The answer to this question is the solution to
your issue statement, and will serve as your programme vision. The programme vision serves
as a reference frame for all elements of the framework.
2. Asssumptions
The links between different model components are based on ‘theories of change’ – sets of
ideas that connect why some happening A is expected to lead to some outcome X. Such
theories of change may be based on science or other sources of knowledge. Clarifying these
provides the assurance that your M&E framework is based on the best available knowledge
(Margoluis et al. 2009). Common underpinning assumptions are developed from:
Wisdom and experience: your work in the field leads you to believe that this set
of actions will lead to your intended outcome.
Effective indicators for freshwater management: attributes and frameworks for development
Page 20 Landcare Research
Research and evaluation: formal or informal research (Western science,
matauranga Māori, local practitioner experience, etc.) indicates that a certain set
of strategies are likely to be successful in achieving the intended outcome.
Best practices: well-regarded and successful initiatives in the field use these
strategies to achieve the outcomes being sought.
It is important to identify and record the theory of change on which the M&E framework and
model(s) is built. The first step is to outline your framework rationale – the beliefs about how
change occurs in the area or system you are looking at, and to do this in conjunction with
your specific stakeholders, based on research, experience, or best practices. The next step is
to identify the assumptions that are built into this underlying rationale.
Assumptions may be biological – for example, the Didymo and other freshwater pest
programmes are based on the assumption that compliance with the ‘Check Clean Dry’
guidelines will reduce or stop the spread of most freshwater pests. Assumptions may also be
social – for example, we assume that behavioural change is a process and that people move
through a number of predictable steps as they move through this process.
3. Internal and external factors
Many factors over which you have little or no control may affect the outcomes of the system
in question. These may be both internal and external, and may help or hinder (=risks) desired
outcomes. Known or anticipated changes in any of these factors may require adjustments in
management or policy actions.
Typical internal factors include such things as affect the management of social-economic-
system intervention through either management or policy. These may include staff capability,
management decision making, including resource allocation priorities and other things related
to the immediate intervening organisational environment. Typical external factors include
both biophysical and socio-economic factors. Biophysical factors may include geography,
climate change and other natural constraints or drivers. Socio-economic factors could include
such things as the political environment, the economic situation and social acceptability.
6.2 Programme-based models
This report offers three related and robust models for planning and assessing programme and
policy progress in water quality initiatives over the extended time periods involved. These are
all based on acknowledging a number of programme components that aim to support each
other iteratively to arrive at a set of desired outcomes. The three models are:
The Policy Cycle model, which acknowledges that successful programmes
advance and change through successive policy cycles of planning,
implementation and reassessment
The Logic model, which can assist management and stakeholders to plan for
results by envisioning a ‘big picture’ view of a project or programme’s scope of
work and potential significance to varied target systems

Effective indicators for freshwater management: attributes and frameworks for development
Landcare Research Page 21
The Orders of Outcomes model, which groups together the sequences of
institutional, behavioural and social/environmental changes that can lead to
more sustainable forms of water and catchment management
Taken together, the three models allow policymakers and managers to visualise both the
cyclical nature of adaptive management and the stepwise nature of progressive outcomes of
the initiative over time. They provide a means for arranging practice and culture-change
initiatives into groupings that highlight the pre-existing governance experience and capacity,
the scale and scope of efforts, and the outcomes that are desired. In this way they combine to
guide programme and project design, and to act as a tool for identifying indicators to help
assess and improve ongoing initiatives.
Policy Cycle model
The policy or management cycle places the many actions of policymaking, implementation,
and evaluation into a sequence and stresses the interconnections and interdependencies
between different groups of activities (Figure 2). It reminds us that policymaking is a learning
process; that it is carried on and adapted over time. The emphasis on sequence does not imply
a blueprint that can be imposed on any situation, but, rather, outlines good practice that
encourages thinking through the realities of practice and culture change. The concept of the
policy cycle highlights that sustained advances will be achieved through a sequence of
connected efforts, not by the construction of a silver-bullet operation that once in place will
transform unsustainable practices into sustainable development.
Figure 2 A policy or management cycle.
There are many variations in how the Policy Cycle Model can be adapted to the introduction
of an integrated policy framework, but the central idea of a multiple-step cycle of planning–
commitment–implementation–evaluation remains constant. It visualises a sequence of
interconnected completions of a stepwise cycle, where each cycle can be thought of as a
‘generation’ of a programme.
The concept of a policy cycle is relevant because different types of indicators will be required
depending on what stage the policy life cycle has reached. For problems that are in the
beginning of their policy life cycle, that is, in the stage of issue identification, indicators of
Effective indicators for freshwater management: attributes and frameworks for development
Page 22 Landcare Research
the state of the environment and of impacts play a major role. These will be mainly
descriptive indicators (Gabrielson & Bosch 2003), which identify potentially alarming
developments in the state of the environment. In the next stages of the policy cycle
(formulation of policy responses, implementation of measures and control) policymakers
focus on using performance indicators to measure changes in those activities and practices
that they can influence. In this phase, the need for policy-effectiveness indicators is also
highest. Assessing progress in changing states of the environment is often difficult in the
shorter-term, but measurements can often be made through the use of ‘intermediate’ states
that can clearly be seen as contributing to the longer-term desired outcomes. In the final
outcome assessment phase of the policy cycle, ‘state’ and ‘impact’ indicators become
important again to watch the recovery of the environment.
Logic models for developing and evaluating complex programmes
In turn, successful policies influence the direction of practice and culture change on-the-
ground. The starting point for introducing challenging programmes that cut across many
work groups and departments is to find ways to articulate and guide planned project,
programme or policy activities, especially those intended to produce dissemination and
utilisation outcomes. Developing sound indicators that help managers ensure such
programmes contribute constructively to the desired outcomes is important, but challenging.
Many managers and policymakers do not have the tools to easily set out, document, and
communicate complex programme goals, activity strategies, and intended outcomes. Logic
models can assist these goals by encouraging project staff to plan for results by envisioning a
‘big picture’ view of a project’s scope of work and potential significance to various target
systems.
Logic models are narrative or graphical depictions of processes in real life that communicate
the underlying assumptions upon which an activity is expected to lead to a specific result
(e.g.W.K. Kellogg Foundation 2004; New Zealand Treasury & State Services Commission
2008; Roughley 2009; Jones et al. 2012). Other names for logic models include ‘outcomes
models,’ ‘causal chains’, or ‘intervention logic models’ (ILM). These models all illustrate a
sequence of cause-and-effect relationships, that is, a systems approach to communicate the
path toward a desired result. They describe logical linkages among programme resources,
activities, outputs, and audiences, and highlight different orders of outcomes related to a
specific problem or situation. Importantly, once a programme has been described in terms of
a logic model, critical measures of performance can be more rigorously identified. In this way
logic models can be seen to support both planning and evaluation (Figure 3).
The main areas for monitoring and evaluation are in relation to the main four components –
typically inputs, activities, outputs and outcomes. The framework helps determine what needs
to be evaluated so that evaluation resources are used effectively and efficiently. Through
evaluation, the reality of how a programme or policy is believed to work can be assessed.
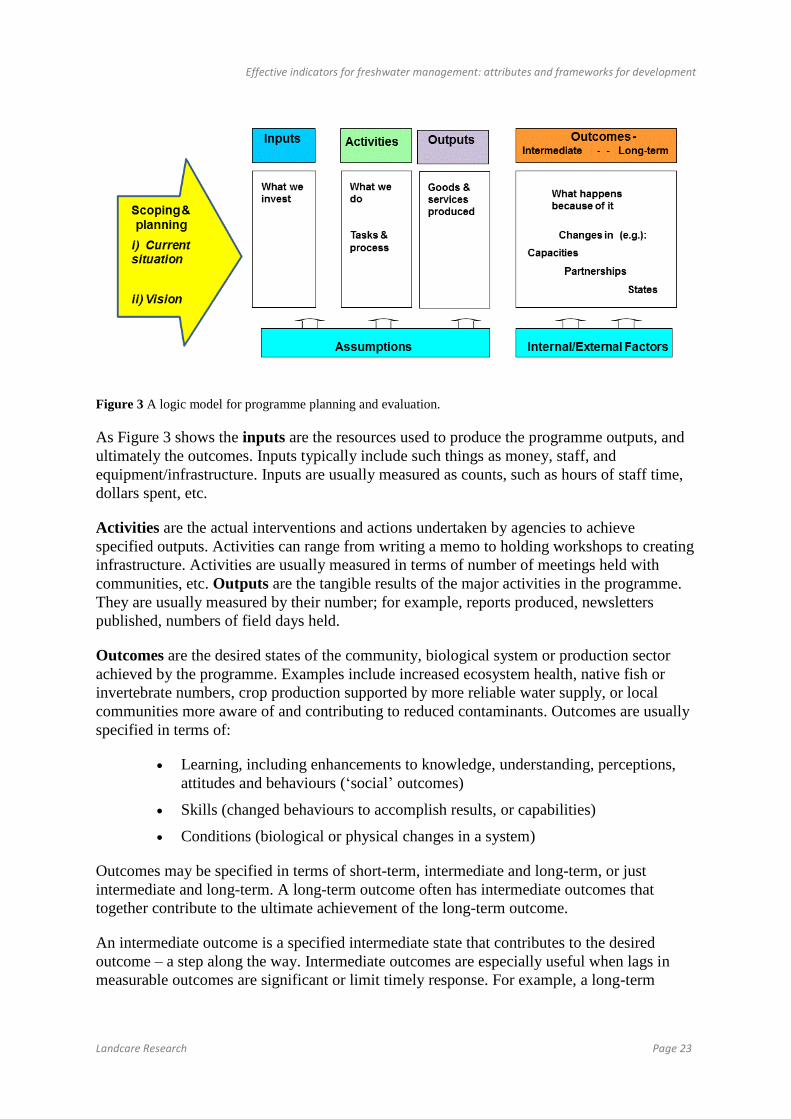
Effective indicators for freshwater management: attributes and frameworks for development
Landcare Research Page 23
Figure 3 A logic model for programme planning and evaluation.
As Figure 3 shows the inputs are the resources used to produce the programme outputs, and
ultimately the outcomes. Inputs typically include such things as money, staff, and
equipment/infrastructure. Inputs are usually measured as counts, such as hours of staff time,
dollars spent, etc.
Activities are the actual interventions and actions undertaken by agencies to achieve
specified outputs. Activities can range from writing a memo to holding workshops to creating
infrastructure. Activities are usually measured in terms of number of meetings held with
communities, etc. Outputs are the tangible results of the major activities in the programme.
They are usually measured by their number; for example, reports produced, newsletters
published, numbers of field days held.
Outcomes are the desired states of the community, biological system or production sector
achieved by the programme. Examples include increased ecosystem health, native fish or
invertebrate numbers, crop production supported by more reliable water supply, or local
communities more aware of and contributing to reduced contaminants. Outcomes are usually
specified in terms of:
Learning, including enhancements to knowledge, understanding, perceptions,
attitudes and behaviours (‘social’ outcomes)
Skills (changed behaviours to accomplish results, or capabilities)
Conditions (biological or physical changes in a system)
Outcomes may be specified in terms of short-term, intermediate and long-term, or just
intermediate and long-term. A long-term outcome often has intermediate outcomes that
together contribute to the ultimate achievement of the long-term outcome.
An intermediate outcome is a specified intermediate state that contributes to the desired
outcome – a step along the way. Intermediate outcomes are especially useful when lags in
measurable outcomes are significant or limit timely response. For example, a long-term
Effective indicators for freshwater management: attributes and frameworks for development
Page 24 Landcare Research
outcome about restored ecosystem health through improved farm management may require
intermediate outcomes about reduced levels of farm fertiliser use.
For large or complex programmes and policy initiatives, the logic model may be divided into
key parts or phases, each with their own set of intermediate outcomes. Intermediate outcomes
may feed into each other, and the time required to achieve intermediate outcomes may also
differ. This means that the logic model may not always be a simple linear hierarchy (as in
Figure 2).
Logic models are most useful when developed at the beginning of project activities. Such
planning at the initiation of a project or within a proposal development context facilitates
coordination of resources and can inspire consideration of project strategies and realistic
expectations for outcomes resulting from the project’s work. However, the desired end-state
outcomes can often take some years to emerge, and so it is important to plan these so
contributions over time can be recognised. One way to expand and fill in the outcomes
section of the logic model is outlined in the next section.
Orders of outcomes
Developing the range of outcomes that support evidence of good policy and practice in
complex social and environmental situations is challenging, not least because results in these
sorts of areas can easily take some years to materialise. Accordingly it is good to visualise
outcomes that can be seen to form a logical sequencing over such time periods.
One such approach for grouping the outcomes of an integrated governance initiative over
time is known as the Orders of Outcomes Model. It highlights the importance of end changes
in state (such as better environmental or social outcomes), but recognises that for each change
in state, there need to be correlated changes in the behaviour of key human actors, which will
have often been initiated as a result of constructive strategy and policy activities. Importantly,
the model helps us plan our activities in sequence so they build on each other over time
(Figure 4).
The Orders of Outcomes framework is a fairly recent development. It was proposed by Olsen
(2003) and is now being used in a number of different international settings, including the
United Nations Environment Programme (UNEP/GPA 2006), South-East Asia (Henocque &
Tandavanitj 2009), Latin America (Olsen et al. 2009) and through the Motueka-ICM
programme in New Zealand (Allen & Jacobson 2009; Hellberg et al. 2009).
First-order ‘enabling’ changes include changes to legislation, policy frameworks, strategies,
plans, infrastructure and funding programmes. Setting up these enabling elements will
underpin the success of the way people are brought into the wider catchment management
system, and that will eventually link the social, ecological and physical (infrastructure) parts
of the system. At this order of change, indicators of effectiveness will measure how well
these institutional changes are developed and administered.
Well-constructed first-order or enabling changes to the catchment management system will
encourage people in the system to work together more effectively (second-order or
‘behavioural’ changes) in the catchment. At this stage programme effectiveness can be
measured by looking at how well this behaviour is taken up. As the first- and second-order
changes occur they will then result in environmental ‘end state’ changes such as improved
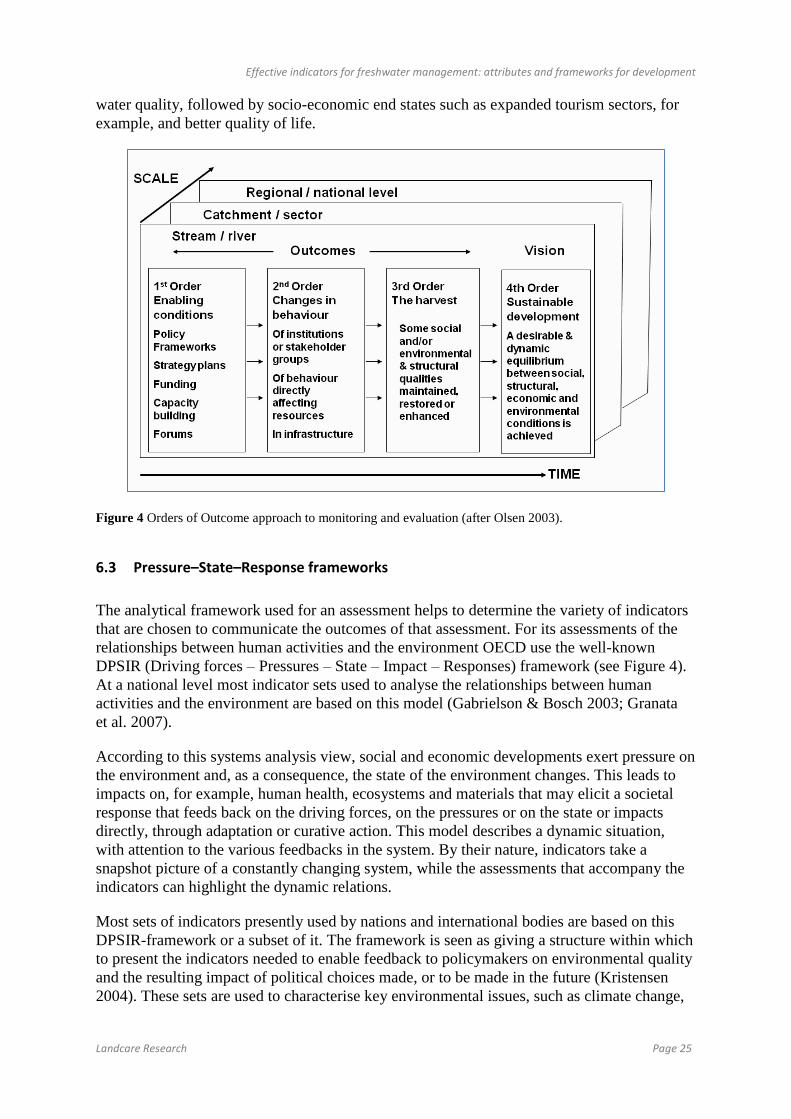
Effective indicators for freshwater management: attributes and frameworks for development
Landcare Research Page 25
water quality, followed by socio-economic end states such as expanded tourism sectors, for
example, and better quality of life.
Figure 4 Orders of Outcome approach to monitoring and evaluation (after Olsen 2003).
6.3 Pressure–State–Response frameworks
The analytical framework used for an assessment helps to determine the variety of indicators
that are chosen to communicate the outcomes of that assessment. For its assessments of the
relationships between human activities and the environment OECD use the well-known
DPSIR (Driving forces – Pressures – State – Impact – Responses) framework (see Figure 4).
At a national level most indicator sets used to analyse the relationships between human
activities and the environment are based on this model (Gabrielson & Bosch 2003; Granata
et al. 2007).
According to this systems analysis view, social and economic developments exert pressure on
the environment and, as a consequence, the state of the environment changes. This leads to
impacts on, for example, human health, ecosystems and materials that may elicit a societal
response that feeds back on the driving forces, on the pressures or on the state or impacts
directly, through adaptation or curative action. This model describes a dynamic situation,
with attention to the various feedbacks in the system. By their nature, indicators take a
snapshot picture of a constantly changing system, while the assessments that accompany the
indicators can highlight the dynamic relations.
Most sets of indicators presently used by nations and international bodies are based on this
DPSIR-framework or a subset of it. The framework is seen as giving a structure within which
to present the indicators needed to enable feedback to policymakers on environmental quality
and the resulting impact of political choices made, or to be made in the future (Kristensen
2004). These sets are used to characterise key environmental issues, such as climate change,

Effective indicators for freshwater management: attributes and frameworks for development
Page 26 Landcare Research
acidification, toxic contamination and wastes in relation to the geographical levels at which
these issues manifest themselves or on which they are managed. In designing indicators for
each of these problems on every geographic scale, the simplicity of the DPSIR framework is
its strength; the principles are very easy to communicate. However, as Gabrielson and Bosch
(2003) remind us, a simple concept needs to be applied where it can be applied, but not
overstretched.
A short history of DPSIR
In describing environmental issues, environmental indicators often follow a causality chain.
One common indicator framework that has been around for many years is the Pressure-
Stress-Response (PSR) framework (Rapport & Friend 1979). This framework was based on
ecosystem behaviour. Rapport and Friend (1979) distinguished: environmental stress
(pressures on the ecosystem), the state of the ecosystem, and the (eco)system response. The
original ideas underlying the framework, however, encompassed all kinds of ecosystem and
societal responses.
This system was picked up by the OECD in the early 1990s and reframed to support more
focus on societal responses and pressures (Gabrielson & Bosch 2003). As these authors point
out, the ‘ecosystem response’ was rephrased to mean ‘societal response’ (policies, targets,
etc.), and pressures were all releases or abstractions by human activities of substances, and
other physical disturbances. ‘State’ was in the beginning limited to the concentrations of
substances and distribution of species. Because environmental statisticians dealt not only with
data on pressures, state and responses, but also with their origins in economic activities, at
various statistical offices an early DPSIR model came into use in the early 1990s as an
organising principle for environmental statistics. This framework described: Human
activities, Pressures, State of the environment, Impacts on ecosystems, human health and
materials, and Responses.
Over the past 20 years, the original PSR framework has developed from a tool to describe
natural ecosystems under stress to a framework for describing human–environment
interactions and the related information flows (Gabrielson & Bosch 2003). At the same time
the need to define the categories precisely and consistently has grown. In this sense, the
current DPSIR model is an evolving model. For example, practitioners in linking
environment and health indicators have added additional steps to give DPSEEA – with
Exposure, Effect and Action as the last steps (Kjellstrom & Corvalan 1995).
The DPSIR framework in detail
From a natural resource management and policy point of view the DPSIR framework
highlights the need for clear and specific information on a number of factors in an interlinked
socio-economic and ecological system. It helps us define what we know about five key
components. These are Driving forces; and the resulting environmental Pressures; on the
State of the environment and the Impacts resulting from changes in environmental quality;
and the subsequent societal Responses to these changes in the environment. Although
managers and policymakers need a wide range of information to support this type of
conceptual model, we can begin to see the central role that indicators play here to
communicate the most relevant features of the environment and other issues included in the
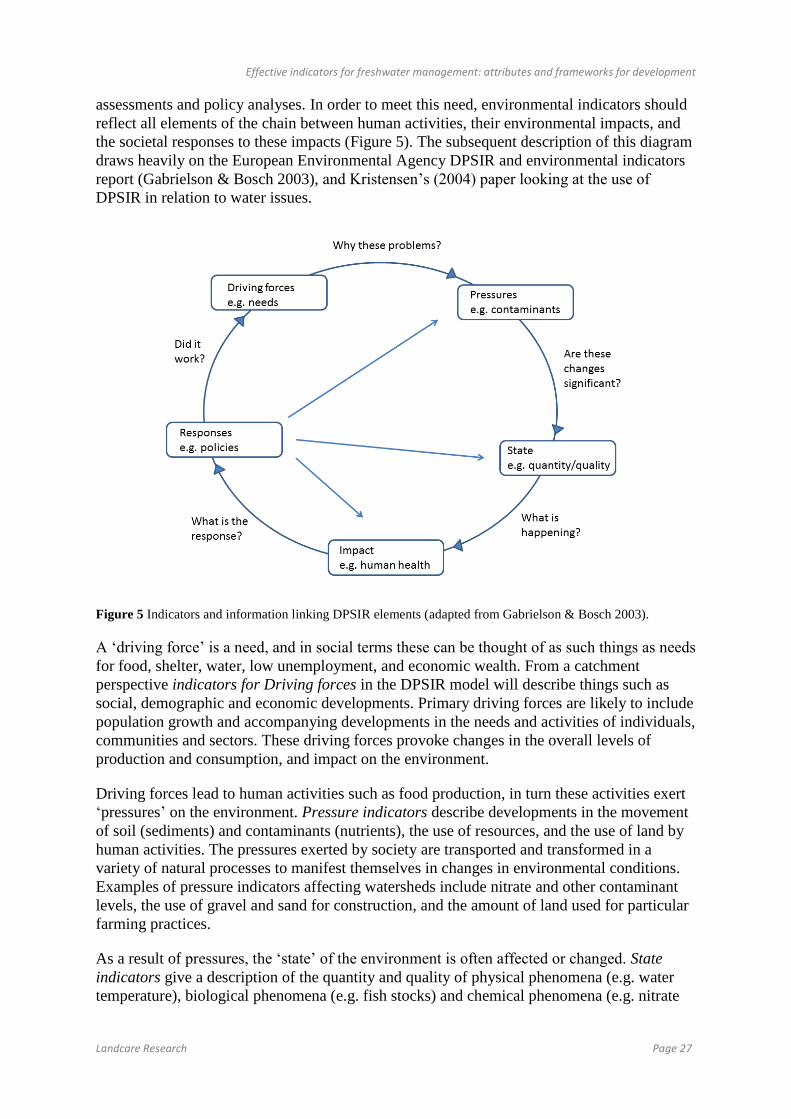
Effective indicators for freshwater management: attributes and frameworks for development
Landcare Research Page 27
assessments and policy analyses. In order to meet this need, environmental indicators should
reflect all elements of the chain between human activities, their environmental impacts, and
the societal responses to these impacts (Figure 5). The subsequent description of this diagram
draws heavily on the European Environmental Agency DPSIR and environmental indicators
report (Gabrielson & Bosch 2003), and Kristensen’s (2004) paper looking at the use of
DPSIR in relation to water issues.
Figure 5 Indicators and information linking DPSIR elements (adapted from Gabrielson & Bosch 2003).
A ‘driving force’ is a need, and in social terms these can be thought of as such things as needs
for food, shelter, water, low unemployment, and economic wealth. From a catchment
perspective indicators for Driving forces in the DPSIR model will describe things such as
social, demographic and economic developments. Primary driving forces are likely to include
population growth and accompanying developments in the needs and activities of individuals,
communities and sectors. These driving forces provoke changes in the overall levels of
production and consumption, and impact on the environment.
Driving forces lead to human activities such as food production, in turn these activities exert
‘pressures’ on the environment. Pressure indicators describe developments in the movement
of soil (sediments) and contaminants (nutrients), the use of resources, and the use of land by
human activities. The pressures exerted by society are transported and transformed in a
variety of natural processes to manifest themselves in changes in environmental conditions.
Examples of pressure indicators affecting watersheds include nitrate and other contaminant
levels, the use of gravel and sand for construction, and the amount of land used for particular
farming practices.
As a result of pressures, the ‘state’ of the environment is often affected or changed. State
indicators give a description of the quantity and quality of physical phenomena (e.g. water
temperature), biological phenomena (e.g. fish stocks) and chemical phenomena (e.g. nitrate

Effective indicators for freshwater management: attributes and frameworks for development
Page 28 Landcare Research
concentrations) in a certain area. State indicators may, for instance, describe indigenous flora
and fauna present, or the concentration of phosphorus and sulphur in lakes.
In turn, these changes then have impacts on the functions of the environment, such as human
health, resources availability, ecosystem services, and biodiversity. Impact indicators are
used to describe changes in these conditions. In the strict definition impacts are only those
parameters that directly reflect changes in environmental use functions by humans. As
humans are a part of the environment, impacts also include health impacts.
Response indicators refer to responses by groups (and individuals) in society, as well as
government attempts to prevent, compensate, ameliorate or adapt to changes in the state of
the environment. Some societal responses may be regarded as negative driving forces, since
they aim at redirecting prevailing trends in consumption and production patterns. Other
responses aim at raising the efficiency of products and processes, through stimulating the
development and penetration of clean technologies. Examples of response indicators could be
the relative numbers of dairy sheds with a particular standard of effluent management.
Although it is tempting to look at the DPSIR framework as a descriptive analysis with a
specific focus on individual elements in the economic, social and environmental system, it is
the relationships between the elements that introduce the dynamics into the framework and
bring about changes. A focus on the links between the DPSIR elements reveals a number of
processes and indicators describing these.
Eco-efficiency indicators such as ‘water productivity’ help determine the relationship
between the driving forces and pressures. Increasing eco-efficiency means that economic
activities can expand without an equivalent increase in pressure on the environment.
Examples would be technology that makes improved use of water through efficient irrigation,
or more targeted nutrient applications. This kind of information contributes to answering the
question: are we making technological progress?
The relationship between the pressure indicator ‘release of nutrients from agriculture’ and the
state indicator ‘development of nitrate concentration in surface waters’ is mainly determined
by the pathways and dispersal patterns of the nutrients. The combination of these indicators
tells a story of time delay in natural processes and the ‘time bombs’ created in the
environment. Knowledge of dispersal patterns can be useful to model current and future
changes in the state of the environment and in impacts.
Similarly, dose–response relationships determine the impacts of a certain state of the
environment. For example, safe levels for stockwater or swimming are developed through
such relationships linked to particular levels of contaminants in the water. Knowledge of
dose–response relationships can be used to predict or quantify the health impacts of water
contamination, or to help in choosing the most appropriate state indicator to act as an early
warning.
The relationship between environmental impacts and societal responses such as taxes and
regulation is often governed by societal perception that the impacts are serious, and this often
requires data on the economic costs of the impact. Policy-effectiveness indicators generally
summarise the relationships between the response and targets for expected change in driving
forces or pressures and sometimes in responses, state or even impacts.
Effective indicators for freshwater management: attributes and frameworks for development
Landcare Research Page 29
The strength of these ‘in-between’ indicators is that they express, more than other indicators,
the dynamics of the interactions in the DPSIR system. Sometimes the information can be
used in predictions of future changes in pressures, states, impacts, and responses. The
existence of these interrelationships also shows that the DPSIR framework, although often
presented as a linear chain or a circle, in fact resembles a very complex web of many
interacting factors some of which may represent highly non-linear dynamics. In many cases
the change in the state of the environment or impacts has several causes, some of which may
be immediate and of local origin, others may be exerting their influence on a continental or
even global scale. Reductions in pressures often result from a mixture of policy responses and
changes in various driving forces.
6.4 Section overview
Frameworks help us identify what needs to be evaluated by providing conceptual models that
outline the interconnections between ecosystem and socio-economic components, and help us
visualise temporal trends. Monitoring and evaluation frameworks that meet these needs for
natural resource management tend to either be programme-outcome-based or driver/pressure-
based. Irrespective of which framework is chosen it is important to underpin its development
with supporting information that sets out the scope and scale of the isue being looked at, the
underpinning assumptions around causality, and related influencing factors.
Useful programme-based frameworks include the Policy Cycle Model, the Logic Model and
the Orders of Outcomes Model.The Policy Cycle Model acknowledges that successful
programmes advance and change through successive phases of planning, implementation and
reassessment. A logic model can assist managers and stakeholders to plan for results by
envisioning a ‘big picture’ view of a project or programme’s scope of work and potential
significance to varied target systems. An orders of outcomes model groups together the
sequences of institutional, behavioural and social/environmental changes that lead to more
sustainable forms of catchment or river-basin development. Different indicators may be
needed depending on the framework and particular aspect or phase being looked at.
Driver/pressure-based models are based on the concept of causality chains for data synthesis,
which links environmental and socio-economic information using indicators for different
categories. One of the most common category groupings is found in the DPSIR model
(Driving forces-Pressures-State-Impacts-Responses), which is used to assess and manage
environmental problems. ‘Driving forces’ are the socio-economic and socio-cultural forces
driving human activities that increase or mitigate pressures on the environment. ‘Pressures’
are the stresses that human activities place on the environment. ‘State’, or state of the
environment, is the condition of the environment and of the socio-economic system.
‘Impacts’ are the effects of environmental degradation. ‘Responses’ refer to the responses by
society to the environmental situation.
7 Working towards collaborative adaptive management
As this report explains, indicators quantify and simplify phenomena, and help us understand
and make sense of complex realities such as those found in catchment land and water
management. To be most meaningful, a M&E programme should utilise indicators to provide
insights into cause-and-effect relationships between what is happening in a catchment and the
Effective indicators for freshwater management: attributes and frameworks for development
Page 30 Landcare Research
anticipated ecosystem responses and subsequent social and economic outcomes. This
provides the opportunity to develop predictive models to anticipate trends instead of waiting
until adverse impacts have been demonstrated, and to support responsive decision making
through the use of an adaptive management and policy system. Indicators are also valuable
becauise the process of developing them serves as a vehicle to generate a shared
understanding and consensus about what is important, and can engage the different
stakeholders involved in working collaboratively towards commonly agreed goals. This
concluding section of the report briefly reminds us of the process and key steps involved in
developing indicators for freshwater management, and then looks in more detail at how the
key stakeholders could utilise these within an ongoing adaptive management approach to
catchment land and water management.
As outlined in Section 5 the process and key steps for developing indicators, and an indicator-
based reporting system, include the following:
1. Clarify purpose, scope and scale
2. Involve the right people
3. Develop a conceptual framework and models to identify what needs to be
evaluated
4. Identify possible indicators
5. Assess best candidate indicators and measures (using selection criteria)
6. Undertake monitoring, evaluation and adaptive management
However, by itself indicator development cannot accomplish all the change that is required,
rather the process can help to educate the different stakeholder groupings, catalyze needed
action and provide feedback on progress over time (Gahin et al. 2003). Completing these
steps effectively supports an adaptive management system (Figure 6). A good adaptive
management system should support continuous improvement and adaptation at several
different levels (e.g. Görgens & Kusek 2009). At the project management level it should
provide information needed to improve the efficiency of the implementation process, and the
performance of the system in question to support desired outcomes. At a strategic level it
should also support regular reviews of the system itself – and what it is showing. This helps
users revaluate chosen courses of action and take into account changing contexts.
The provision of timely and relevant information is obviously a key factor essential to
improving management. However, this is often difficult to achieve in catchment land and
water management where there are commonly a wide range of stakeholders, often with a
range of worldviews and cultures. Accordingly, a number of other factors need to be
considered as integral to getting indicators used in a way that supports a collaborative
adaptive approach to management and policy.
Jointly developing a conceptual framework and models of the systems in question and the
associated indicators needed for informed decision making can help support collaborative and
co-operative approaches across key stakeholder groups. Participating in these exercises helps
participants clarify the system boundaries and formulate questions, and such exercises reveal
the assumptions of the different groups involved (Allen & Jacobson 2009). Some of the most
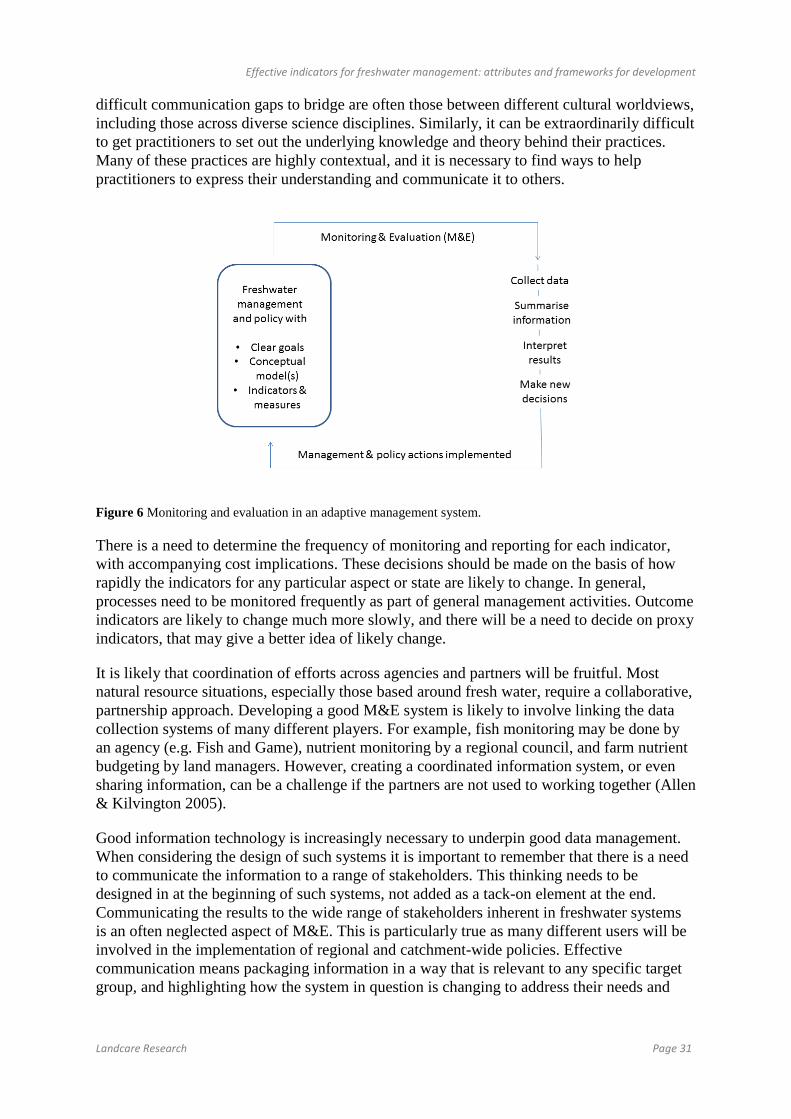
Effective indicators for freshwater management: attributes and frameworks for development
Landcare Research Page 31
difficult communication gaps to bridge are often those between different cultural worldviews,
including those across diverse science disciplines. Similarly, it can be extraordinarily difficult
to get practitioners to set out the underlying knowledge and theory behind their practices.
Many of these practices are highly contextual, and it is necessary to find ways to help
practitioners to express their understanding and communicate it to others.
Figure 6 Monitoring and evaluation in an adaptive management system.
There is a need to determine the frequency of monitoring and reporting for each indicator,
with accompanying cost implications. These decisions should be made on the basis of how
rapidly the indicators for any particular aspect or state are likely to change. In general,
processes need to be monitored frequently as part of general management activities. Outcome
indicators are likely to change much more slowly, and there will be a need to decide on proxy
indicators, that may give a better idea of likely change.
It is likely that coordination of efforts across agencies and partners will be fruitful. Most
natural resource situations, especially those based around fresh water, require a collaborative,
partnership approach. Developing a good M&E system is likely to involve linking the data
collection systems of many different players. For example, fish monitoring may be done by
an agency (e.g. Fish and Game), nutrient monitoring by a regional council, and farm nutrient
budgeting by land managers. However, creating a coordinated information system, or even
sharing information, can be a challenge if the partners are not used to working together (Allen
& Kilvington 2005).
Good information technology is increasingly necessary to underpin good data management.
When considering the design of such systems it is important to remember that there is a need
to communicate the information to a range of stakeholders. This thinking needs to be
designed in at the beginning of such systems, not added as a tack-on element at the end.
Communicating the results to the wide range of stakeholders inherent in freshwater systems
is an often neglected aspect of M&E. This is particularly true as many different users will be
involved in the implementation of regional and catchment-wide policies. Effective
communication means packaging information in a way that is relevant to any specific target
group, and highlighting how the system in question is changing to address their needs and
Effective indicators for freshwater management: attributes and frameworks for development
Page 32 Landcare Research
concerns. This aspect of the process is particularly important to ensure that the wider process
is helping support better decision-making at all levels.
Participatory and adaptive approaches such as those outlined in this report should be flexible,
and designed to grow. The different perspectives of diverse stakeholders, and current and past
conflicts, over natural resource management issues pose their own social process problems.
Nonetheless, the continued demonstration of processes that are genuinely inclusive and
transparent in their decision making will encourage others from the wider community and
government agencies to participate and provide and manage the information required for
making decisions about sustainable resource use.
8 Acknowledgements
Funding for the development of this resource was provided through the Aqualinc Research
MSI Wheel of Water Project. Thanks to Chris Jones for his insightful and helpful comments,
and to Christine Bezar for editing.
9 References
Advisory Committee on Official Statistics 2009. Good practice guidelines for the
development and reporting of indicators. Wellington.
Allen W, Jacobson C 2009. Learning about the social elements of adaptive management in
the South Island tussock grasslands of New Zealand. In: Allan C, Stansky G eds
Adaptive environmental management: a practitioner's guide. Springer and CSIRO.
Pp. 95–114.
Allen W, Kilvington M 2002. Learning and working together for the environment: applying
the Integrated Systems for Knowledge Management approach. Development Bulletin
58: 106–110. Available at:
http://devnet.anu.edu.au/online%20versions%20pdfs/58/2758Allen.pdf
Allen WJ, Kilvington MJ 2005. Getting technical environmental information into watershed
decision making. In: Hatfield JL ed. The farmers’ decision: balancing economic
successful agriculture production with environmental quality. Soil and Water
Conservation Society. Pp. 45–61.
Allen W, Fenemor A, Kilvington M, Harmsworth G, Young R, Deans N, Horn C, Phillips C,
de Oca O, Ataria J, Smith R 2011. Building collaboration and learning in integrated
catchment management: the importance of social process and multiple engagement
approaches. New Zealand Journal of Marine and Freshwater Research 45: 525–539.
Anderson RA, McDaniel RR 2000. Managing healthcare organizations: Where
professionalism meets complexity science. Health Care Management Review 25: 83–
92.
Effective indicators for freshwater management: attributes and frameworks for development
Landcare Research Page 33
Audit Commission 2000. On target – the practice of performance indicators. London.
Bosch OJH, Allen WJ, Williams JM, Ensor A 1996. An integrated system for maximising
community knowledge: Integrating community based monitoring into the adaptive
management process in the New Zealand high country. The Rangeland Journal 18(1):
23–32.
De Loë RC, Armitage D, Plummer R, Davidson S, Morau L 2009. From government to
governanace: A state-of-the-art review of environmental governance. Final report.
Prepared for Alberta Environment, Environmental Stewardship, Environmental
Relations. Guelph. Available at: http://environment.gov.ab.ca/info/library/8187.pdf
DeFries, RS, Foley JA Asner GP 2004. Land-use choices: balancing human needs and
ecosystem function. Frontiers in Ecology and the Environment 2(5): 249–257.
Dietz T, Ostrom E, Stern PC 2003. The struggle to govern the Commons. Science 302: 1907–
1912.
Fenemor A, Neilan D, Allen W, Russell S 2011a. Improving water governance in New
Zealand: Stakeholder views of catchment management processes and plans. Policy
Quarterly 7 (4): 10–19.
Fenemor AD, Phillips C, Allen WJ, Young RG, Harmsworth GR, Bowden WB, Basher L,
Gillespie P, Kilvington M, Davies-Colley RJ, Dymond J, Cole A, Lauder G, Davie T,
Smith RA, Markham S, Deans NA, Atkinson M, Collins A 2011b. Integrated
Catchment Management – interweaving social process and science knowledge. New
Zealand Journal of Marine and Freshwater Research 45: 313–331.
Furlong F, Bakker K 2008. Achieving water conservation: Strategies for good governance.
UBC Program on Water Governance. Available at:
http://www.watergovernance.ca/wp-content/uploads/2010/02/Achieving-Water-
Conservation-Sept08.pdf
Gabrielson P, Bosch P 2003. Environmental indicators: Typology and use in reporting.
European Environment Agency (EEA) internal working paper.
Gahin R, Veleva V, Hart M 2003. Do Indicators help create sustainable communities. Local
Environment 8(6): 661–666.
Gareau TP, Smith RG, Barbercheck ME, Mortensen DA 2010. Spider plots: A tool for
participatory extension learning. Journal of Extension 48(5) Available on-line at
http://www.joe.org/joe/2010october/tt8.php
Global Water Partnership 2006. Monitoring and evaluation indicators for IWRM strategies
and plans. Technical Brief No. 3. 8 p.
Glouberman S, Zimmerman B 2002. Complicated and complex systems: What would
successful reform of Medicare look like? Toronto, Ontario, Commission on the Future
of Health Care in Canada.

Effective indicators for freshwater management: attributes and frameworks for development
Page 34 Landcare Research
Görgens M, Kusek JZ 2009. Making Monitoring and Evaluation Systems Work: A Capacity
Development Toolkit. The World Bank. 493 pp. Available on-line at
http://dmeforpeace.org/sites/default/files/Making_M_and_E_Systems_Work.pdf
Granata A, Palumbo V, Aiello P 2007. Guideline for developing an indicators system for
monitoring sustainability of water management. ARPA, WATERinCORE MED
Programme.
Harmsworth G, Young R, Walker D, Clapcott JE, James T 2011. Linkages between cultural
and scientific indicators of river and stream health. New Zealand Journal of Marine and
Freshwater Research 45: 423–426.
Hellberg C, Davis M, Feeney C, Allen W 2009. A logic model-based evaluation framework
to assess progress with Integrated Catchment Management Planning in the Auckland
Region. A paper presented to the Water New Zealand 5th South Pacific Stormwater
Conference, Auckland, May 2009, and the IAHR Congress in Vancouver, August 2009.
Heemskerk M, Wilson K, Pavao-Zuckerman M 2003. Conceptual models as tools for
communication across disciplines. Conservation Ecology 7(3): 8. Available online at
http://www.consecol.org/vol7/iss3/art8
Henocque Y, Tandavanitj S 2009. CHARM, Coastal habitats and resources management
project in Thailand and mainstreaming of co-management practices into policies.
LOICZ Inprint, Issue 1 (www.charmproject.org). 23 p.
Hockings M, Stolton S, Dudley N 2000. Evaluating effectiveness: a framework for assessing
the management of protected areas. Cambridge, UK, IUCN.
Hockings M, Jacobson C, Carter B 2008. Process guidelines for indicator selection in
protected area management effectiveness evaluation. Building capacity for adaptive
management of protected areas, report to the Natural Heritage Trust. Brisbane, The
University of Queensland.
Huff D, Geis I 1954. How to lie with statistics. London, Victor Gollancz.
Johnson BB, Chess C 2006. Evaluating public responses to environmental trend indicators.
Science Communication 28 (1): 64–92.
Johnson F, Williams K 1999. Protocol and practice in the adaptive management of waterfowl
harvests. Conservation Ecology 3(1): 8.
Jones C, Cowan P, Allen W 2012. Setting outcomes, and measuring and reporting
performance of regional council pest and weed management programmes – Guidelines
and resource materials. Landcare Research Contract Report LC144. Available online:
http://www.landcareresearch.co.nz/research/pestcontrol/measuring_perf/
Kallis G, Kiparsky M, Norgaard R 2009. Collaborative governance and adaptive
management: Lessons from California's CALFED water program. Environmental
Science and Policy 12: 631–643.
Effective indicators for freshwater management: attributes and frameworks for development
Landcare Research Page 35
Keen M, Mahanty S 2006. Learning in sustainable natural resource management: challenges
and opportunities in the Pacific. Society and Natural Resources 19: 497–513.
Kjellstrom T, Corvalan C 1995. Frameworks for the development of environmental health
indicators. World Health Statistics Quarterly 48: 144–154.
Kleijnen JP, Smits M 2003. Performance metrics in supply chain management. Journal of the
Operational Research Society 54: 507-514.
Komnenic V, Ahlers R, van der Zaag P 2008. Assessing the usefulness of the Water Poverty
Index by applying it to a special case: Can one be water poor with high levels of
access? Physics and Chemistry of the Earth 34(4-5): 219–224.
Kristensen P 2004. The DPSIR framework. Paper presented at the 27–29 September 2004
workshop on vulnerability of water resources to environmental change, UNEP
Headquarters, Nairobi, Kenya.
Land and Water Forum. 2010. Report of the Land and Water Forum: A fresh start for fresh
water. Available at:
http://www.landandwater.org.nz/includes/download.aspx?ID=118914
Lemos MC, Agrawal A 2006. Environmental governance. Annual Review of Environment
and Resources 31: 297–325.
Margoluis R, Stem C, Salafsky N, Brown M 2009. Using conceptual models as a planning
and evaluation tool in conservation. Evaluation and Program Planning 32: 138–147.
McGuire M 2006. Collaborative public management: assessing what we know and how we
know it. Public Administration Review 66: 33–42.
MfE 1996. National environmental indicators: Building a framework for a core set. Wellington,
Ministry for the Environment.
Mulder BS, Noon BR, Spies TA, Raphael MG, Palmer CJ, Olsen AR, Reeves GH, Welsh HH
1999. The strategy and design of the effectiveness monitoring program for the
Northwest Forest Plan. Portland, OR, US Department of Agriculture, Forest Service,
Pacific Northwest Research Station.
New Zealand Treasury and State Services Commission 2008. Performance measurement:
advice and examples on how to develop effective frameworks. ISBN 978-0-478-30345-
2.
Niemeijer D, de Groot R. 2008. A conceptual framework for selecting environmental
indicator sets. Ecological Indicators. 8: 14–25.
Noon BR, McKelvey KS 2006. The process of indicator selection. USDA Forest Service
Proceedings RMRS-P-42CD. Pp. 944–951.
Olsen SB 2003. Frameworks and indicators for assessing progress in integrated coastal
management initiatives. Ocean & Coastal Management 46: 347–361.
Effective indicators for freshwater management: attributes and frameworks for development
Page 36 Landcare Research
Olsen SB, Page GG, Ochoa E 2009. The analysis of governance responses to ecosystem
change: A handbook for assembling a baseline. LOICZ Reports & Studies No. 34.
Geesthacht, Germany, GKSS Research Center. 87 p.
Ostrom E 1990. Governing the Commons. The evolution of institutions for collective action.
Cambridge University Press. 270 p.
Ostrom E 2009. A general framework for analyzing sustainability of social-ecological
systems. Science 325: 419–422.
Ostrom E, Burger J, Field CB, Norgaard RB, Policansky D 1999. Revisiting the Commons:
local lessons, global challenges. Science 284: 278–282.
Pahl-Wostl C, Kabat P, Möltgen J 2008. Adaptive and integrated water management: coping
with complexity and uncertainty. Springer.
Plumptre T, Graham J 2000. Governance in the new millennium: Challenges for Canada.
Ottawa, Institute on Governance. Available at:
http://iog.ca/en/publications/governance-new-millenium-challenges-canada
Rapport D, Friend A 1979. Towards a comprehensive framework for environmental statistics:
a stress-response approach. Statistics Canada Catalogue 11-510. Ottawa, Minister of
Supply and Services Canada.
Reed MS 2008. Stakeholder participation for environmental management: a literature
review. Biological Conservation 141: 2417–2431.
Rigby D, Woodhouse P, Young T, Burton M 2001. Constructing a farm level indicator of
sustainable agricultural practice. Ecological Economics 39: 463–478.
Roughley A 2009. Developing and using program logic in natural resource management: user
guide. Canberra, Australia, Australian Government Land and Coasts.
Shilling F, London JK, Levanos R 2009. Marginalization by collaboration: environmental
justice as a third party in and beyond CALFED. Environmental Science and Policy 12:
694–709.
Snowden DJ, Moore ME 2007. A leader’s framework for decision making. Harvard Business
Review (1 Nov.): 69–76.
Spottiswoode C 2000. Improving police performance: a new approach to measuring police
efficiency. London, Public Services Productivity Panel, HM Treasury.
Stem C, Margoluis R, Salafsky N, Brown M 2005. Monitoring and evaluation in
conservation: A review of trends and approaches. Conservation Biology 19: 295–309.
Sussman SW, Siegal WS 2003. Informational influence in organizations: an integrated
approach to knowledge adoption. Information Systems Research 14 (1): 47–65.
Swyngedouw E 2005. Governance innovation and the citizen: the Janus face of governance-
beyond-the-state. Urban Studies 42: 1991–2006.
Effective indicators for freshwater management: attributes and frameworks for development
Landcare Research Page 37
Thaler RH, Sunstein CR 2009. Nudge: improving decisions about health, wealth, and
happiness. London, Penguin. 320 p.
The Heinz Center 2009. Measuring the results of wildlife conservation activities.
Washington, DC. 122 p.
UNEP/GPA (United Nations Environment Programme/Global Programme of Action for the
Protection of the Marine Environment from Land-based Activities, of the United
Nations Environment Programme. 2006. Ecosystem-based management: markers for
assessing progress. UNEP/GPA, The Hague. Available at
http://www.gpa.unep.org/documents/ecosystem-based_management_english.pdf.
USAID 2010. Performance monitoring and evaluation: Selecting performance indicators.
TIPS No. 6. 2nd edn.
Vessey I 1991. Cognitive fit: a theory-based analysis of the graphs versus tables literature.
Decision Sciences 22: 219–240.
W.K. Kellogg Foundation 2004. Logic model development guide. Available at:
http://www.wkkf.org/Pubs/Tools/Evaluation/Pub3669.pdf.
Walters C 1986. Adaptive management of renewable resources. New York, McMillan.
Winograd M, Aguilar M, Farrow A, Segnestam L, Linddal M, Dixon J 1999. Conceptual
framework to develop and use water indicators. Technical note. CIAT–World Bank–
UNEP project. Rural sustainability indicators: Outlook from Central America. CIAT,
CA.
Woodhouse P, Howlett D, Rigby D 2000. A framework for research on sustainability
indicators for agriculture and rural livelihoods. Working Paper 2. ISBN: 1 902518624,
39 p.

Effective indicators for freshwater management: attributes and frameworks for development
Landcare Research Page 39
Appendix 1 – Indicator lists
As noted in Section 5, indicator selection needs to be preceded by processes that clarify
purpose and objectives, and that develop shared understanding through use of conceptual
models of the systems under consideration. With this done it is important to create initial lists
of indicators for subsequent deliberation by those involved. One key support in developing
such lists is to use databases and indicator lists already developed in New Zealand by related
bodies (e.g. agencies, iwi and research groups). Five examples are given below.
Paula Blackett, Bruce Small, Erin Smith, Steven Kelly, Liz Wedderburn, Denise
Bewsell, Mike Mackay 2010. A list of potential values and indicators for
evaluating the social, environmental, economical and cultural impacts of water
quality policy options. AgResearch. Developed for the Land Use and Water
Quality Project Deliberation Matrix. Funded through P-21 Environment
Programme. 12 p.
The annotated bibliography above provides a good starting point. It lists 10–20 potential
values and corresponding indicators developed by the project team for each of four areas
related to land use and water quality: (1) environment/natural; (2) economics; (3) tangata
whenua; (4) social.
Jonet Ward, Eric Pyle 1997. Environmental indicators for the sustainable
management of fresh water. Environmental Performance Indicators Technical
Paper No. 4 Freshwater. Report No. 2416/1. Ministry for the Environment. 86 p.
The purpose of this MfE report is to suggest an approach to and some examples of indicators
for the sustainable management of fresh water. A Pressure–State–Response framework is
proposed for the indicators programme (MfE 1996). ‘Indicators of environmental pressure’
can be thought of as forcing functions; they are actions or impacts that contribute directly or
indirectly to environmental stress. Direct pressures are biophysical stresses while indirect
pressures include human activities or natural events. ‘Indicators of environmental state or
condition’ include the ambient condition of natural and physical resources and ecosystems;
these are the focus of the report above. ‘Indicators of management response’ are the actions
taken to address the observed or predicted environmental changes or adverse effects. The
report sets out indicators for each of these categories separately for rivers, lakes and wetlands.
Effective indicators for freshwater management: attributes and frameworks for development
Page 40 Landcare Research
MARCO (monitoring and reporting community outcomes) indicators, Waikato.
Available online at http://www.choosingfutures.co.nz/MARCO-indicators/
The MARCO (monitoring and reporting community outcomes) team has compiled indicators
that help tell the story about the quality of, and any changes in, life for people in the Waikato
Region. About 75 indicators were selected and grouped into five topics: (1) sustainable
economy, (2) sustainable environment, (3) quality of life, (4) participation and equity, and
(5) culture and identity. The results are displayed on this website for the Waikato Region as a
whole and, where available, by city/district council area. The indicators are updated, analysed
and reported annually.
MfE core set of national indicators. Available online at
http://www.mfe.govt.nz/environmental-reporting/about/tools-
guidelines/indicators/core-indicators.html
The Ministry’s core set of national environmental indicators comprises 66 variables that
report on 22 indicators across 10 key environmental domains (air, atmosphere, biodiversity,
consumption, energy, fresh water, land, oceans, transport and waste). The core indicators
were selected from a wider set of 160 indicators developed by the Ministry through its earlier
Environmental Performance Indicators (EPI) programme. These were developed according to
international best practice, and selected through a process that included extensive
consultation with reporting partners and information users. A set of standard criteria were
used to select the core set of indicators – indicators were assessed as to how nationally
significant, relevant, measurable and statistically sound, simple and easily understood, cost
effective, and internationally comparable they were.
Liz Wedderburn, Denise Bewsell, Paula Blackett, Margaret Brown, Steven
Kelly, Michael Mackay, Kambiz Maani, Oscar Montes, Tracey Paine 2011.
Developing a preferred approach for managing the cumulative effects of land
uses on freshwater quality. An AgResearch report prepared for the P21
Environment Programme and Environment Canterbury
Appendix 9.7 of the above report contains the list of values and associated indicators chosen
by the stakeholder groups under four ‘well-beings’. Allocating weightings across the four
well-beings made transparent the balance of priority for each of the stakeholder groups.