Embed Size (px)
Citation preview
Effective implementation of SPC 217
Effective implementation of SPC
Darja Noskievičová
X
Effective implementation of SPC
Darja Noskievičová VŠB-TU Ostrava
Czech Republic
1. Introduction
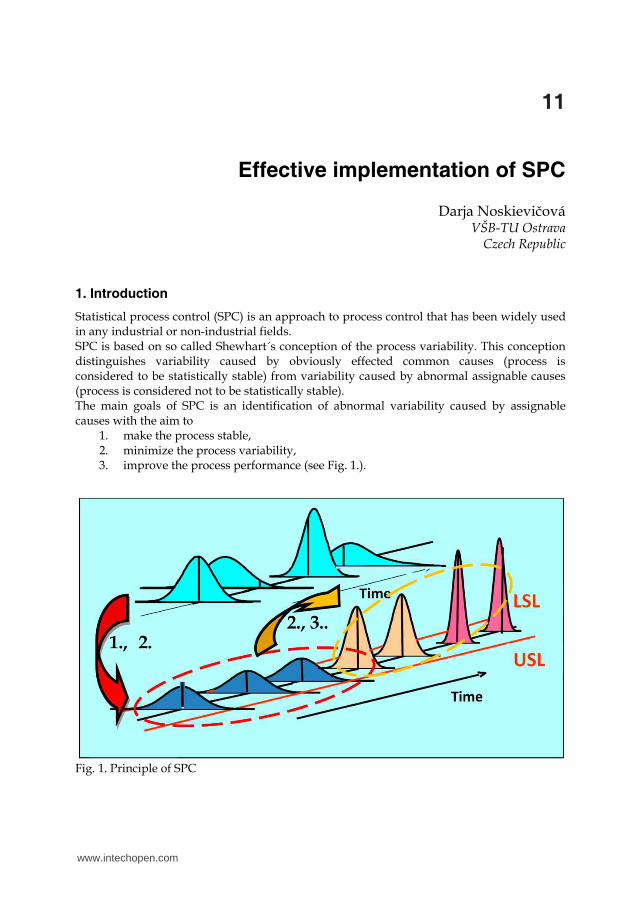
Statistical process control (SPC) is an approach to process control that has been widely used in any industrial or non-industrial fields. SPC is based on so called Shewhart´s conception of the process variability. This conception distinguishes variability caused by obviously effected common causes (process is considered to be statistically stable) from variability caused by abnormal assignable causes (process is considered not to be statistically stable). The main goals of SPC is an identification of abnormal variability caused by assignable causes with the aim to
1. make the process stable, 2. minimize the process variability, 3. improve the process performance (see Fig. 1.).
Fig. 1. Principle of SPC
11
www.intechopen.com
Engineering the Future218
The main function is to ‘’reduce variation in an output characteristic by signalizing the change of an undefined process input” (Dasgupta, 2003). Effective application of SPC is such complex application which leads to the reduction of the process variation, i.e. to the process improvement. Meeting this goal is affecting by many technical, statistical, methodical, social and economical factors. The rate of reaching this goal is proportional to the level of allowing for all groups of these factors during the SPC implementation and application and to the rate of integrating SPC into the overall business system of an organization. But in practice there are many of the factors mentioned above that are not considered when implementing and applying SPC. It often led to ineffective and failure applications, de-motivation of users and consequently de-evolution of SPC (Kelly & Drury, 2002). This situation is strongly correlated to misunderstanding of the main goal of SPC. The daily SPC utilization often predominantly consists of “merely plotting points in the control chart without any action whatsoever and at the end of the day filling it as an evidence of compliance to standardized procedures” (Dasgupta, 2003, p. 328). The failure of SPC application may be often related to a wrong methodology. “In many cases people blindly believe that SPC is about plotting of control charts and sticking them on the walls for satisfying customers” (Antony & Taner, 2003, p. 473). Kelly & Drury (2002) state that “a long conflict between reaction to out-of control signals and ability to meet production schedules result in de-evolution of SPC in companies.’’ They show that many people ‘’find stopping the process because for identification and removing of assignable cause disturbing particularly in the situation when the quality characteristic lies in the specification.” Only process monitoring is not enough for meeting the main goal of SPC and SPC must be implemented in such a way to be able to offer correct and as quick as possible identification of assignable causes and realization of adequate corrective or improvement actions. SPC must be built as the problem-solving process. By the SPC design the general structure of the problem-solving process must be respected and the sequence of the subprocesses “Out-of control signal revelation – Root cause identification – Corrective or improvement action acceptance - verification of action” must be the axis of every SPC application. Other factors such as training, responsibility delegation etc. must support these activities. In spite of the huge of literature on SPC regarding predominantly statistical factors (selection of control chart, construction of control chart, design of new types of control chart) there is little publications that offer practitioners complex methodology for implementing SPC as a problem –solving process. In general the SPC implementation issues are solved in several papers. Gordon et al. (1994) offer statistically supported analysis of factors associated with the successful implementation of SPC. They analyse factors such as top management commitment, training, responsibility for worker training, and involvement of workers. In connection with the last mentioned factor authors generally state that “quality issues are addressed best when personnel are fully engaged in the problem-solving process” (Gordon et al., 1994). But unfortunately they don´t analyse SPC as the problem-solving process in deep and they permit about the defined SPC criterion´s relationship to other factors there were not investigated in their study including the aptness of production decisions based on the SPC techniques and customer satisfaction. Some publications put the stress on the selected factors of the implementation of SPC – methodical aspects (Berger & Hart, 1986) and organizational aspects (Gaafar & Keats, 1992). The both types of factors more comprehensively are considered in the design of the framework for implementation of
SPC in the next publication (Does et al., 1997). But issues such as interpretation of control chart, identification of assignable causes and selection of corrective or improvement actions are described only generally). Other framework for the SPC implementation (Antony & Taner, 2003) is the most complex of all. This conceptual framework covers steps such as construction of control charts and interpretation of control charts but this suggestion suffers from the same problems as the previous one – it offers only general well-known information about construction and interpretation of control charts recommendation to prepare and apply OCAP including. The only one proposal of the comprehensive framework for the SPC application with the special emphasis on the identification of assignable causes could be found in the paper of Dasgupta (Dasgupta, 2003). Author differs the activities linked to the identification of assignable cause according to the stages of the control charting defined in (Palm, 2000). In deep he discusses the problems and gives solutions for complex processes. A special attention he puts on the retrospective process analysis from the point of view of the identification of the assignable causes. But this proposal of the framework for the application of SPC suffers from several shortcomings. The applied three stage methodology is not complex – it doesn´t cover capability analysis. It is not incorporated into the whole system of the factors influencing the effective SPC application. It doesn´t respect all phases of the general problem-solving process. Very important phase of the selection of suitable solution (selection of the suitable corrective or improvement action) has been in this paper defined but has not been solved and the phase of the evaluation of the effectiveness of accepted corrective or improvement action has not been considered at all. The goal of this paper is to - define complex and effective application of SPC, - systematically determine a comprehensive system of statistical, methodological, social
and economical factors affecting the efficiency of the SPC application in relation to the steps of so called SPC cycle,
- define SPC as a total problem-solving process, - define and describe four variants of practically applicable methodology of the SPC
realization as a problem-solving process depending on the number of factors affecting the process variability and the degree of the process dynamics,
- show the practical example of the application of one of variants of the suggested methodology.
2. Complex and effective application of SPC
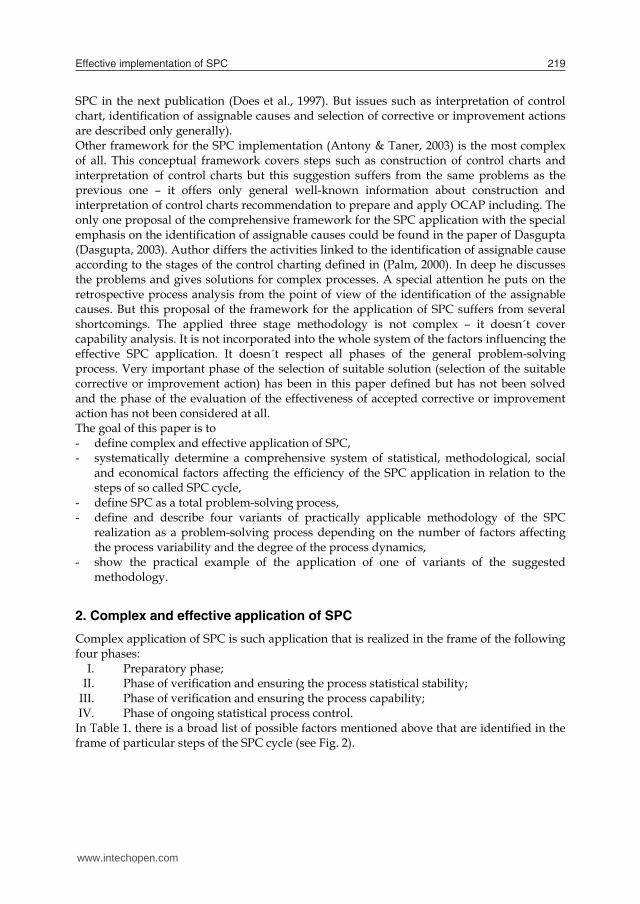
Complex application of SPC is such application that is realized in the frame of the following four phases:
I. Preparatory phase; II. Phase of verification and ensuring the process statistical stability;
III. Phase of verification and ensuring the process capability; IV. Phase of ongoing statistical process control.
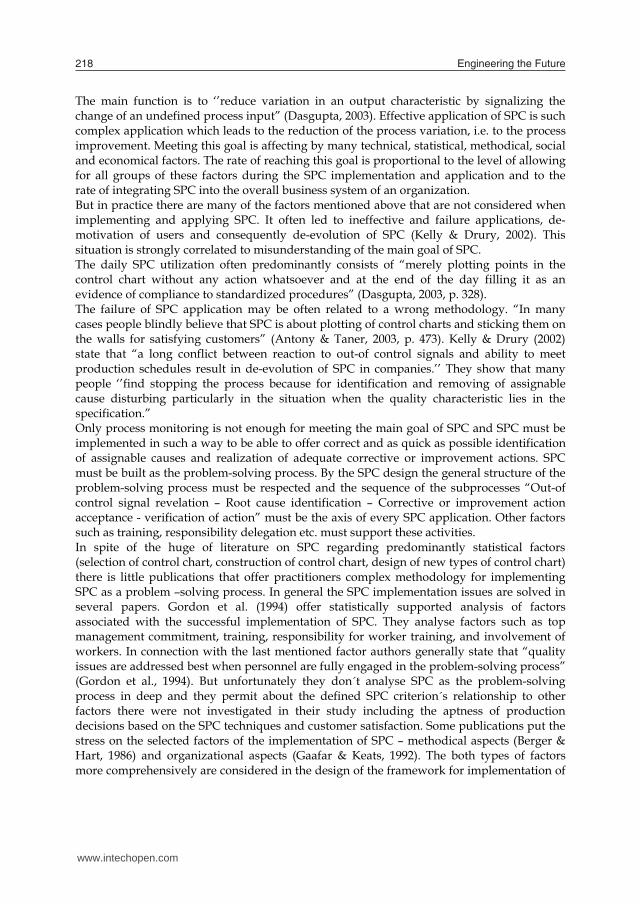
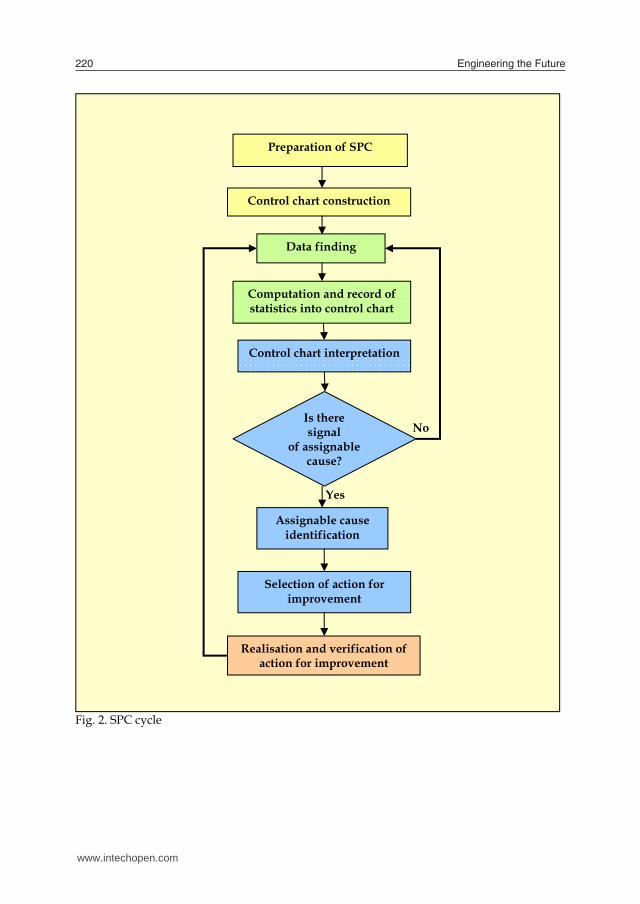
In Table 1. there is a broad list of possible factors mentioned above that are identified in the frame of particular steps of the SPC cycle (see Fig. 2).
www.intechopen.com
Effective implementation of SPC 219
The main function is to ‘’reduce variation in an output characteristic by signalizing the change of an undefined process input” (Dasgupta, 2003). Effective application of SPC is such complex application which leads to the reduction of the process variation, i.e. to the process improvement. Meeting this goal is affecting by many technical, statistical, methodical, social and economical factors. The rate of reaching this goal is proportional to the level of allowing for all groups of these factors during the SPC implementation and application and to the rate of integrating SPC into the overall business system of an organization. But in practice there are many of the factors mentioned above that are not considered when implementing and applying SPC. It often led to ineffective and failure applications, de-motivation of users and consequently de-evolution of SPC (Kelly & Drury, 2002). This situation is strongly correlated to misunderstanding of the main goal of SPC. The daily SPC utilization often predominantly consists of “merely plotting points in the control chart without any action whatsoever and at the end of the day filling it as an evidence of compliance to standardized procedures” (Dasgupta, 2003, p. 328). The failure of SPC application may be often related to a wrong methodology. “In many cases people blindly believe that SPC is about plotting of control charts and sticking them on the walls for satisfying customers” (Antony & Taner, 2003, p. 473). Kelly & Drury (2002) state that “a long conflict between reaction to out-of control signals and ability to meet production schedules result in de-evolution of SPC in companies.’’ They show that many people ‘’find stopping the process because for identification and removing of assignable cause disturbing particularly in the situation when the quality characteristic lies in the specification.” Only process monitoring is not enough for meeting the main goal of SPC and SPC must be implemented in such a way to be able to offer correct and as quick as possible identification of assignable causes and realization of adequate corrective or improvement actions. SPC must be built as the problem-solving process. By the SPC design the general structure of the problem-solving process must be respected and the sequence of the subprocesses “Out-of control signal revelation – Root cause identification – Corrective or improvement action acceptance - verification of action” must be the axis of every SPC application. Other factors such as training, responsibility delegation etc. must support these activities. In spite of the huge of literature on SPC regarding predominantly statistical factors (selection of control chart, construction of control chart, design of new types of control chart) there is little publications that offer practitioners complex methodology for implementing SPC as a problem –solving process. In general the SPC implementation issues are solved in several papers. Gordon et al. (1994) offer statistically supported analysis of factors associated with the successful implementation of SPC. They analyse factors such as top management commitment, training, responsibility for worker training, and involvement of workers. In connection with the last mentioned factor authors generally state that “quality issues are addressed best when personnel are fully engaged in the problem-solving process” (Gordon et al., 1994). But unfortunately they don´t analyse SPC as the problem-solving process in deep and they permit about the defined SPC criterion´s relationship to other factors there were not investigated in their study including the aptness of production decisions based on the SPC techniques and customer satisfaction. Some publications put the stress on the selected factors of the implementation of SPC – methodical aspects (Berger & Hart, 1986) and organizational aspects (Gaafar & Keats, 1992). The both types of factors more comprehensively are considered in the design of the framework for implementation of
SPC in the next publication (Does et al., 1997). But issues such as interpretation of control chart, identification of assignable causes and selection of corrective or improvement actions are described only generally). Other framework for the SPC implementation (Antony & Taner, 2003) is the most complex of all. This conceptual framework covers steps such as construction of control charts and interpretation of control charts but this suggestion suffers from the same problems as the previous one – it offers only general well-known information about construction and interpretation of control charts recommendation to prepare and apply OCAP including. The only one proposal of the comprehensive framework for the SPC application with the special emphasis on the identification of assignable causes could be found in the paper of Dasgupta (Dasgupta, 2003). Author differs the activities linked to the identification of assignable cause according to the stages of the control charting defined in (Palm, 2000). In deep he discusses the problems and gives solutions for complex processes. A special attention he puts on the retrospective process analysis from the point of view of the identification of the assignable causes. But this proposal of the framework for the application of SPC suffers from several shortcomings. The applied three stage methodology is not complex – it doesn´t cover capability analysis. It is not incorporated into the whole system of the factors influencing the effective SPC application. It doesn´t respect all phases of the general problem-solving process. Very important phase of the selection of suitable solution (selection of the suitable corrective or improvement action) has been in this paper defined but has not been solved and the phase of the evaluation of the effectiveness of accepted corrective or improvement action has not been considered at all. The goal of this paper is to - define complex and effective application of SPC, - systematically determine a comprehensive system of statistical, methodological, social
and economical factors affecting the efficiency of the SPC application in relation to the steps of so called SPC cycle,
- define SPC as a total problem-solving process, - define and describe four variants of practically applicable methodology of the SPC
realization as a problem-solving process depending on the number of factors affecting the process variability and the degree of the process dynamics,
- show the practical example of the application of one of variants of the suggested methodology.
2. Complex and effective application of SPC
Complex application of SPC is such application that is realized in the frame of the following four phases:
I. Preparatory phase; II. Phase of verification and ensuring the process statistical stability;
III. Phase of verification and ensuring the process capability; IV. Phase of ongoing statistical process control.
In Table 1. there is a broad list of possible factors mentioned above that are identified in the frame of particular steps of the SPC cycle (see Fig. 2).
www.intechopen.com
Engineering the Future220
Fig. 2. SPC cycle
Preparation of SPC
Control chart construction
Data finding
Computation and record of statistics into control chart
Control chart interpretation
Assignable cause identification
Selection of action for improvement
Realisation and verification of action for improvement
Is there signal
of assignable cause?
Yes
No
Step Factor Preparation of SPC implementation
Understanding of the principles and goals of SPC at all managerial levels
Overcoming of the old thinking according to the spirit of technical variability concept
Leadership encouragement Motivation of involved workers Delegation of roles, competences, responsibilities Preparation and realization of training Quality and specialization of training courses Understanding statistical principles Ability to interpret correctly control charts Appreciation of economical consequences of correct procedures
keeping Verification and ensuring measurement system capability Selection of measurement method Defining the way of collection and recording data Building of defence mechanism against non-keeping defined
procedures Organization of the problem solving step Building of the information system aided problem solving step Selection of the process, process parameters and quality
characteristics Analysis of the process and its variability Definition of the possible assignable causes and adequate actions Building of rules for interpretation of control charts Ability to assign correct cause to signal in control chart and to
select correct action Simplicity and comprehension of the SPC system Time intensity of the designed SPC system Complexity of application Selection of SW Selection of control chart Design of control chart Ability to access new knowledge of industrial statistics
Control chart construction
Construction method Time intensity Mistake proofing
Data collection Observance of the defined procedure for data collection (control interval, rational subgroups forming)
Observance of the defined procedure for the data finding and recording
Mistake proofing Table 1. Factors of the effective SPC implementation
www.intechopen.com
Effective implementation of SPC 221
Fig. 2. SPC cycle
Preparation of SPC
Control chart construction
Data finding
Computation and record of statistics into control chart
Control chart interpretation
Assignable cause identification
Selection of action for improvement
Realisation and verification of action for improvement
Is there signal
of assignable cause?
Yes
No
Step Factor Preparation of SPC implementation
Understanding of the principles and goals of SPC at all managerial levels
Overcoming of the old thinking according to the spirit of technical variability concept
Leadership encouragement Motivation of involved workers Delegation of roles, competences, responsibilities Preparation and realization of training Quality and specialization of training courses Understanding statistical principles Ability to interpret correctly control charts Appreciation of economical consequences of correct procedures
keeping Verification and ensuring measurement system capability Selection of measurement method Defining the way of collection and recording data Building of defence mechanism against non-keeping defined
procedures Organization of the problem solving step Building of the information system aided problem solving step Selection of the process, process parameters and quality
characteristics Analysis of the process and its variability Definition of the possible assignable causes and adequate actions Building of rules for interpretation of control charts Ability to assign correct cause to signal in control chart and to
select correct action Simplicity and comprehension of the SPC system Time intensity of the designed SPC system Complexity of application Selection of SW Selection of control chart Design of control chart Ability to access new knowledge of industrial statistics
Control chart construction
Construction method Time intensity Mistake proofing
Data collection Observance of the defined procedure for data collection (control interval, rational subgroups forming)
Observance of the defined procedure for the data finding and recording
Mistake proofing Table 1. Factors of the effective SPC implementation
www.intechopen.com
Engineering the Future222
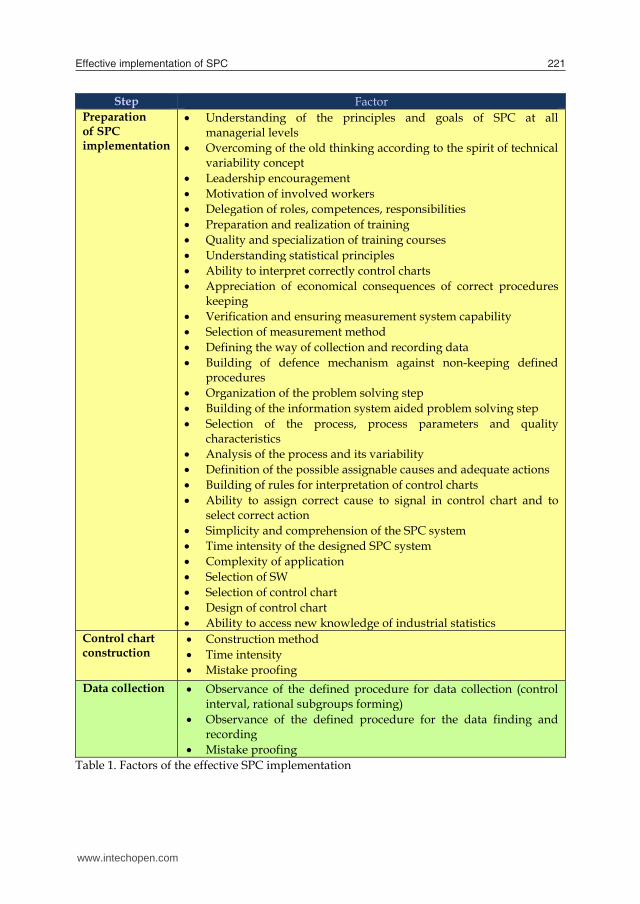
Table 1. Factors of the effective SPC implementation – continuation But in practice there are many of the factors mentioned above that are not considered when implementing SPC. It results from misunderstanding of the main goal of SPC. Only process monitoring is no match for meeting this goal and SPC must be implemented in such a way to be able to offer correct and as quick as possible identification of assignable causes and realization of adequate actions for improvement.
Step Factor Computation and record of statistics into control chart
Way of computation and statistics recording Complexity of statistics computation and recording Keeping the procedure for computations and recording Mistake proofing
Control chart interpretation
Rules existence Clear determination of competencies and responsibilities Ability to „read“ in control chart Skills of responsible workers
Assignable causes identification
Clear determination of competencies and responsibilities Existence of the system of recording and processing historical data
concerned in the process variability causes Deep knowledge of the process variability and its causes Identification speed Existence of the system for decision making and problem solving
support Motivation for making identification Costs of identification Ability to assign cause to signal of nonstability in control chart Leadership encouragement Time sources Communication abilities Experience
Selection of action for improvement
Clear determination of competencies and responsibilities Knowledge in the process Database of causes and possible or accepted actions Costs of realization of particular actions Existence of information about efficiency of accepted actions Managerial encouragement Speed of realization of selected actions Realization of balancing costs and benefits of possible actions Experience
Realization of action for improvement
Clear determination of competencies and responsibilities System for evaluation of the accepted action impact and for the
results recording Resources for realization Experiences
3. SPC and problem-solving
SPC must be built as a problem solving instrument. In the phase of the SPC design the general structure of the problem solving process must be respected and the sequence of the subprocesses “Out-of control signal revelation – Root cause identification – Corrective action acceptance – Verification of corrective action” must be the axis of the SPC application. This axis must be assured with many other actions to really operate.
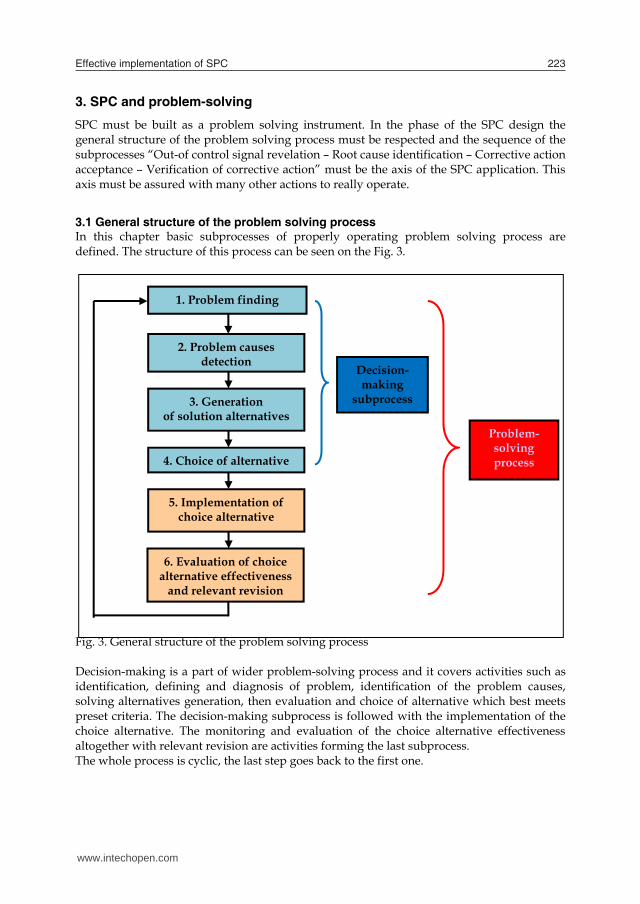
3.1 General structure of the problem solving process In this chapter basic subprocesses of properly operating problem solving process are defined. The structure of this process can be seen on the Fig. 3.
Fig. 3. General structure of the problem solving process Decision-making is a part of wider problem-solving process and it covers activities such as identification, defining and diagnosis of problem, identification of the problem causes, solving alternatives generation, then evaluation and choice of alternative which best meets preset criteria. The decision-making subprocess is followed with the implementation of the choice alternative. The monitoring and evaluation of the choice alternative effectiveness altogether with relevant revision are activities forming the last subprocess. The whole process is cyclic, the last step goes back to the first one.
6. Evaluation of choice alternative effectiveness
and relevant revision
5. Implementation of choice alternative
4. Choice of alternative
3. Generation of solution alternatives
2. Problem causes detection
Decision-making
subprocess
Problem-solving process
1. Problem finding
www.intechopen.com
Effective implementation of SPC 223
Table 1. Factors of the effective SPC implementation – continuation But in practice there are many of the factors mentioned above that are not considered when implementing SPC. It results from misunderstanding of the main goal of SPC. Only process monitoring is no match for meeting this goal and SPC must be implemented in such a way to be able to offer correct and as quick as possible identification of assignable causes and realization of adequate actions for improvement.
Step Factor Computation and record of statistics into control chart
Way of computation and statistics recording Complexity of statistics computation and recording Keeping the procedure for computations and recording Mistake proofing
Control chart interpretation
Rules existence Clear determination of competencies and responsibilities Ability to „read“ in control chart Skills of responsible workers
Assignable causes identification
Clear determination of competencies and responsibilities Existence of the system of recording and processing historical data
concerned in the process variability causes Deep knowledge of the process variability and its causes Identification speed Existence of the system for decision making and problem solving
support Motivation for making identification Costs of identification Ability to assign cause to signal of nonstability in control chart Leadership encouragement Time sources Communication abilities Experience
Selection of action for improvement
Clear determination of competencies and responsibilities Knowledge in the process Database of causes and possible or accepted actions Costs of realization of particular actions Existence of information about efficiency of accepted actions Managerial encouragement Speed of realization of selected actions Realization of balancing costs and benefits of possible actions Experience
Realization of action for improvement
Clear determination of competencies and responsibilities System for evaluation of the accepted action impact and for the
results recording Resources for realization Experiences
3. SPC and problem-solving
SPC must be built as a problem solving instrument. In the phase of the SPC design the general structure of the problem solving process must be respected and the sequence of the subprocesses “Out-of control signal revelation – Root cause identification – Corrective action acceptance – Verification of corrective action” must be the axis of the SPC application. This axis must be assured with many other actions to really operate.
3.1 General structure of the problem solving process In this chapter basic subprocesses of properly operating problem solving process are defined. The structure of this process can be seen on the Fig. 3.
Fig. 3. General structure of the problem solving process Decision-making is a part of wider problem-solving process and it covers activities such as identification, defining and diagnosis of problem, identification of the problem causes, solving alternatives generation, then evaluation and choice of alternative which best meets preset criteria. The decision-making subprocess is followed with the implementation of the choice alternative. The monitoring and evaluation of the choice alternative effectiveness altogether with relevant revision are activities forming the last subprocess. The whole process is cyclic, the last step goes back to the first one.
6. Evaluation of choice alternative effectiveness
and relevant revision
5. Implementation of choice alternative
4. Choice of alternative
3. Generation of solution alternatives
2. Problem causes detection
Decision-making
subprocess
Problem-solving process
1. Problem finding
www.intechopen.com
Engineering the Future224
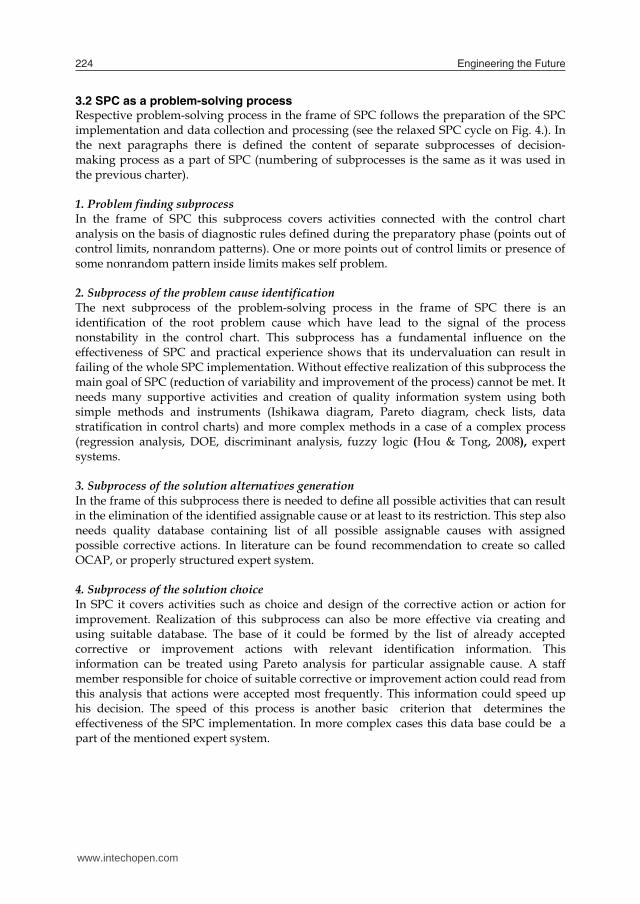
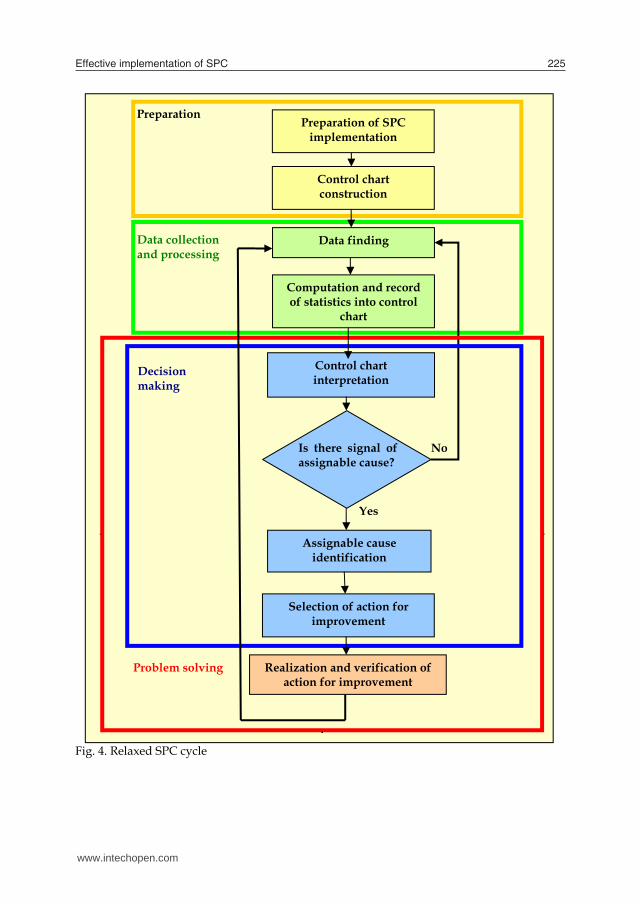
3.2 SPC as a problem-solving process Respective problem-solving process in the frame of SPC follows the preparation of the SPC implementation and data collection and processing (see the relaxed SPC cycle on Fig. 4.). In the next paragraphs there is defined the content of separate subprocesses of decision-making process as a part of SPC (numbering of subprocesses is the same as it was used in the previous charter).
1. Problem finding subprocess In the frame of SPC this subprocess covers activities connected with the control chart analysis on the basis of diagnostic rules defined during the preparatory phase (points out of control limits, nonrandom patterns). One or more points out of control limits or presence of some nonrandom pattern inside limits makes self problem.
2. Subprocess of the problem cause identification The next subprocess of the problem-solving process in the frame of SPC there is an identification of the root problem cause which have lead to the signal of the process nonstability in the control chart. This subprocess has a fundamental influence on the effectiveness of SPC and practical experience shows that its undervaluation can result in failing of the whole SPC implementation. Without effective realization of this subprocess the main goal of SPC (reduction of variability and improvement of the process) cannot be met. It needs many supportive activities and creation of quality information system using both simple methods and instruments (Ishikawa diagram, Pareto diagram, check lists, data stratification in control charts) and more complex methods in a case of a complex process (regression analysis, DOE, discriminant analysis, fuzzy logic (Hou & Tong, 2008), expert systems.
3. Subprocess of the solution alternatives generation In the frame of this subprocess there is needed to define all possible activities that can result in the elimination of the identified assignable cause or at least to its restriction. This step also needs quality database containing list of all possible assignable causes with assigned possible corrective actions. In literature can be found recommendation to create so called OCAP, or properly structured expert system.
4. Subprocess of the solution choice In SPC it covers activities such as choice and design of the corrective action or action for improvement. Realization of this subprocess can also be more effective via creating and using suitable database. The base of it could be formed by the list of already accepted corrective or improvement actions with relevant identification information. This information can be treated using Pareto analysis for particular assignable cause. A staff member responsible for choice of suitable corrective or improvement action could read from this analysis that actions were accepted most frequently. This information could speed up his decision. The speed of this process is another basic criterion that determines the effectiveness of the SPC implementation. In more complex cases this data base could be a part of the mentioned expert system.
Fig. 4. Relaxed SPC cycle
Control chart construction
Data finding
Computation and record of statistics into control
chart
Control chart interpretation
Assignable cause identification
Selection of action for improvement
Realization and verification of action for improvement
Data collection and processing
Decision making
Is there signal of assignable cause?
Problem solving
Preparation
No
Yes
Preparation of SPC implementation
www.intechopen.com
Effective implementation of SPC 225
3.2 SPC as a problem-solving process Respective problem-solving process in the frame of SPC follows the preparation of the SPC implementation and data collection and processing (see the relaxed SPC cycle on Fig. 4.). In the next paragraphs there is defined the content of separate subprocesses of decision-making process as a part of SPC (numbering of subprocesses is the same as it was used in the previous charter).
1. Problem finding subprocess In the frame of SPC this subprocess covers activities connected with the control chart analysis on the basis of diagnostic rules defined during the preparatory phase (points out of control limits, nonrandom patterns). One or more points out of control limits or presence of some nonrandom pattern inside limits makes self problem.
2. Subprocess of the problem cause identification The next subprocess of the problem-solving process in the frame of SPC there is an identification of the root problem cause which have lead to the signal of the process nonstability in the control chart. This subprocess has a fundamental influence on the effectiveness of SPC and practical experience shows that its undervaluation can result in failing of the whole SPC implementation. Without effective realization of this subprocess the main goal of SPC (reduction of variability and improvement of the process) cannot be met. It needs many supportive activities and creation of quality information system using both simple methods and instruments (Ishikawa diagram, Pareto diagram, check lists, data stratification in control charts) and more complex methods in a case of a complex process (regression analysis, DOE, discriminant analysis, fuzzy logic (Hou & Tong, 2008), expert systems.
3. Subprocess of the solution alternatives generation In the frame of this subprocess there is needed to define all possible activities that can result in the elimination of the identified assignable cause or at least to its restriction. This step also needs quality database containing list of all possible assignable causes with assigned possible corrective actions. In literature can be found recommendation to create so called OCAP, or properly structured expert system.
4. Subprocess of the solution choice In SPC it covers activities such as choice and design of the corrective action or action for improvement. Realization of this subprocess can also be more effective via creating and using suitable database. The base of it could be formed by the list of already accepted corrective or improvement actions with relevant identification information. This information can be treated using Pareto analysis for particular assignable cause. A staff member responsible for choice of suitable corrective or improvement action could read from this analysis that actions were accepted most frequently. This information could speed up his decision. The speed of this process is another basic criterion that determines the effectiveness of the SPC implementation. In more complex cases this data base could be a part of the mentioned expert system.
Fig. 4. Relaxed SPC cycle
Control chart construction
Data finding
Computation and record of statistics into control
chart
Control chart interpretation
Assignable cause identification
Selection of action for improvement
Realization and verification of action for improvement
Data collection and processing
Decision making
Is there signal of assignable cause?
Problem solving
Preparation
No
Yes
Preparation of SPC implementation
www.intechopen.com
Engineering the Future226
5. Implementation of the choice solution This subsystem represents true intervention into the process that could result in the real reduction of the process variability and its improvement. It can represent organizational, technological, technical and other solutions.
6. Evaluation of corrective or improvement action and eventual revision Monitoring and evaluation of the effectiveness of accepted corrective or improvement actions must be integral part of the problem-solving process. Obtained information can help to speed up the future decision-making in the frame of the 4th subprocess. The effectiveness can be evaluated using the indicator of the corrective or improvement action effectiveness which expresses how many % of such realized actions resulted in the process variability reduction. When E(RA)ij is the ith kind of action accepted for the solving of the jth cause then its efficiency can be determined using the next formula:
E(RA)ij =��������������� . 100 (1) where RA����)…is the whole number of the ith kind of corrective action realized to solve jth cause, RA�����…is a number of realized actions of ith kind resulting in the process variability
reduction, � � 1, 2, … ,�, m……… is a number of various kinds of actions accepted for the solution of jth cause,
j = 1, 2, … , n, n……….is a number of various kinds of causes so far identified in connection with specific
symptom of nonstability. This information is also important from the point of view of selection of the correct action because so far most often realized action need not to be the most effective one. For this reason when applying Pareto diagram for the analysis of the most often realized actions it should contain also indicator of efficiency of every kind of so far realized actions. 3.3 Specificity of the problem-solving process in the frame of SPC The problem-solving process in the frame of SPC is characterized by some specificity that requires also specific access to its realization.
- Corrective or improvement actions must be realized as soon as possible after signal of working of assignable cause, given by the control chart.
- Many actions realize operators with limited time. - The people influence cannot be excepted in full.
These specificity must be considered during the implementation of SPC. 4. Methodology of realization of the problem-solving process in SPC
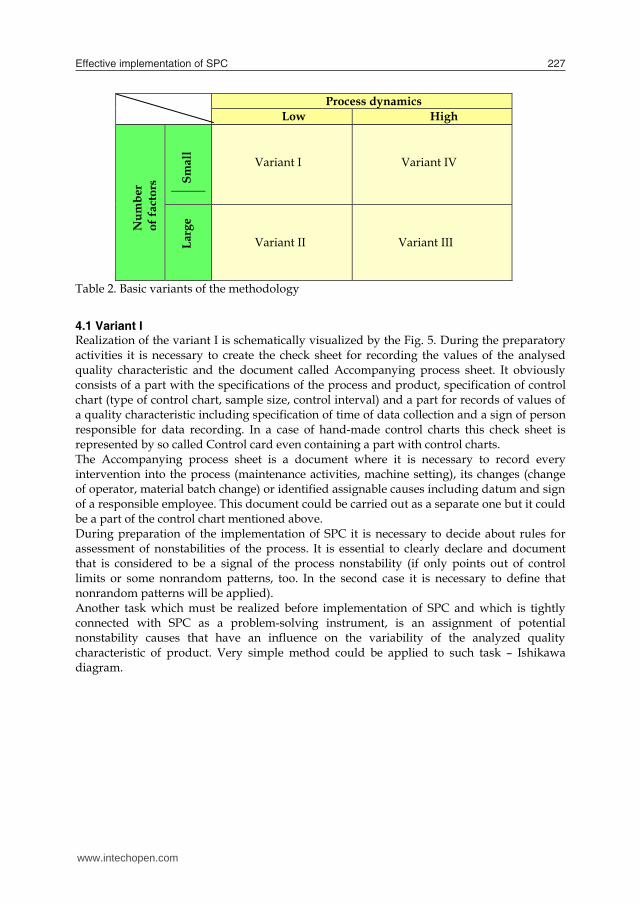
Designed methodology is structured according to the number of factors (inputs) that have influence on the analyzed quality parameter of the product (output) and according to the rate of the process dynamics. Based on the combination of these two criteria there have been defined 4 variants of the methodology (see Table 2.). Because of the necessity to react to the signal of working of assignable cause, given by the control chart as soon as possible a lot of information for decision-making must be taken already in the preparatory phase. The designed methodology contains only activities needed for the realization of the problem-solving process.
Process dynamics Low High
Num
ber
of fa
ctor
s
Smal
l
Variant I
Variant IV
Larg
e Variant II
Variant III
Table 2. Basic variants of the methodology
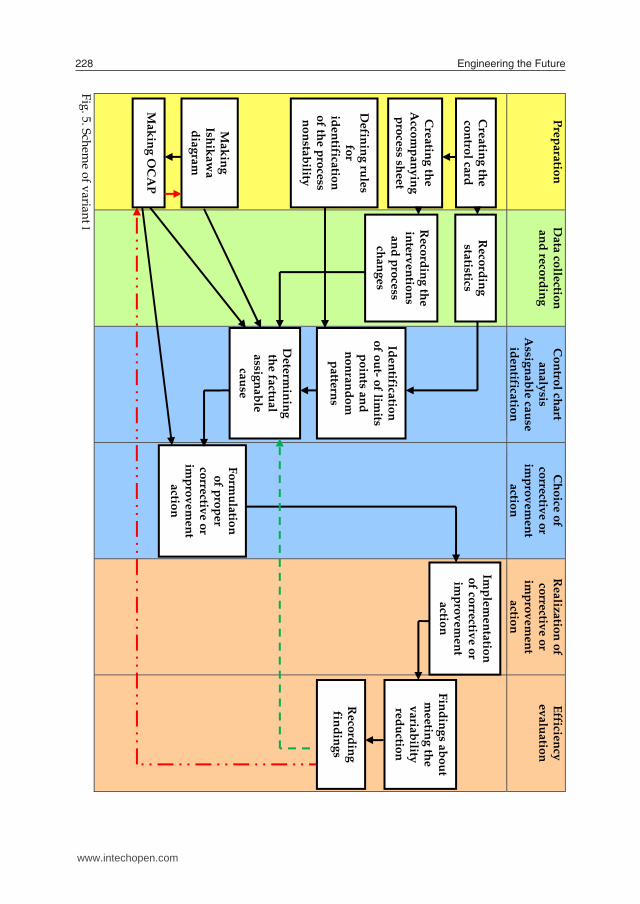
4.1 Variant I Realization of the variant I is schematically visualized by the Fig. 5. During the preparatory activities it is necessary to create the check sheet for recording the values of the analysed quality characteristic and the document called Accompanying process sheet. It obviously consists of a part with the specifications of the process and product, specification of control chart (type of control chart, sample size, control interval) and a part for records of values of a quality characteristic including specification of time of data collection and a sign of person responsible for data recording. In a case of hand-made control charts this check sheet is represented by so called Control card even containing a part with control charts. The Accompanying process sheet is a document where it is necessary to record every intervention into the process (maintenance activities, machine setting), its changes (change of operator, material batch change) or identified assignable causes including datum and sign of a responsible employee. This document could be carried out as a separate one but it could be a part of the control chart mentioned above. During preparation of the implementation of SPC it is necessary to decide about rules for assessment of nonstabilities of the process. It is essential to clearly declare and document that is considered to be a signal of the process nonstability (if only points out of control limits or some nonrandom patterns, too. In the second case it is necessary to define that nonrandom patterns will be applied). Another task which must be realized before implementation of SPC and which is tightly connected with SPC as a problem-solving instrument, is an assignment of potential nonstability causes that have an influence on the variability of the analyzed quality characteristic of product. Very simple method could be applied to such task – Ishikawa diagram.
www.intechopen.com
Effective implementation of SPC 227
5. Implementation of the choice solution This subsystem represents true intervention into the process that could result in the real reduction of the process variability and its improvement. It can represent organizational, technological, technical and other solutions.
6. Evaluation of corrective or improvement action and eventual revision Monitoring and evaluation of the effectiveness of accepted corrective or improvement actions must be integral part of the problem-solving process. Obtained information can help to speed up the future decision-making in the frame of the 4th subprocess. The effectiveness can be evaluated using the indicator of the corrective or improvement action effectiveness which expresses how many % of such realized actions resulted in the process variability reduction. When E(RA)ij is the ith kind of action accepted for the solving of the jth cause then its efficiency can be determined using the next formula:
E(RA)ij =��������������� . 100 (1) where RA����)…is the whole number of the ith kind of corrective action realized to solve jth cause, RA�����…is a number of realized actions of ith kind resulting in the process variability
reduction, � � 1, 2, … ,�, m……… is a number of various kinds of actions accepted for the solution of jth cause,
j = 1, 2, … , n, n……….is a number of various kinds of causes so far identified in connection with specific
symptom of nonstability. This information is also important from the point of view of selection of the correct action because so far most often realized action need not to be the most effective one. For this reason when applying Pareto diagram for the analysis of the most often realized actions it should contain also indicator of efficiency of every kind of so far realized actions. 3.3 Specificity of the problem-solving process in the frame of SPC The problem-solving process in the frame of SPC is characterized by some specificity that requires also specific access to its realization.
- Corrective or improvement actions must be realized as soon as possible after signal of working of assignable cause, given by the control chart.
- Many actions realize operators with limited time. - The people influence cannot be excepted in full.
These specificity must be considered during the implementation of SPC. 4. Methodology of realization of the problem-solving process in SPC
Designed methodology is structured according to the number of factors (inputs) that have influence on the analyzed quality parameter of the product (output) and according to the rate of the process dynamics. Based on the combination of these two criteria there have been defined 4 variants of the methodology (see Table 2.). Because of the necessity to react to the signal of working of assignable cause, given by the control chart as soon as possible a lot of information for decision-making must be taken already in the preparatory phase. The designed methodology contains only activities needed for the realization of the problem-solving process.
Process dynamics Low High
Num
ber
of fa
ctor
s
Smal
l
Variant I
Variant IV
Larg
e Variant II
Variant III
Table 2. Basic variants of the methodology
4.1 Variant I Realization of the variant I is schematically visualized by the Fig. 5. During the preparatory activities it is necessary to create the check sheet for recording the values of the analysed quality characteristic and the document called Accompanying process sheet. It obviously consists of a part with the specifications of the process and product, specification of control chart (type of control chart, sample size, control interval) and a part for records of values of a quality characteristic including specification of time of data collection and a sign of person responsible for data recording. In a case of hand-made control charts this check sheet is represented by so called Control card even containing a part with control charts. The Accompanying process sheet is a document where it is necessary to record every intervention into the process (maintenance activities, machine setting), its changes (change of operator, material batch change) or identified assignable causes including datum and sign of a responsible employee. This document could be carried out as a separate one but it could be a part of the control chart mentioned above. During preparation of the implementation of SPC it is necessary to decide about rules for assessment of nonstabilities of the process. It is essential to clearly declare and document that is considered to be a signal of the process nonstability (if only points out of control limits or some nonrandom patterns, too. In the second case it is necessary to define that nonrandom patterns will be applied). Another task which must be realized before implementation of SPC and which is tightly connected with SPC as a problem-solving instrument, is an assignment of potential nonstability causes that have an influence on the variability of the analyzed quality characteristic of product. Very simple method could be applied to such task – Ishikawa diagram.
www.intechopen.com
Engineering the Future228
Preparation D
ata collection and recording
Control chart analysis
Assignable cause identification
Choice of
corrective or im
provement
action
Realization of
corrective or im
provement
action
Efficiency evaluation
Fig. 5. Scheme of variant I
Making
Ishikawa
diagram
Making O
CA
P
Defining rules
for identification of the process nonstability
Creating the
Accom
panying process sheet
Creating the
control card R
ecording statistics
Recording the
interventions and process
changes Identification
of out- of limits
points and nonrandom
patterns
Determ
ining the factual assignable
cause Form
ulation of proper
corrective or im
provement
action
Implem
entation of corrective or im
provement
action Findings about
meeting the
variability reduction
Recording
findings
As in variant I small number of factors influencing watched quality characteristic is considered all these defined cause of variability are considered during the next analysis. These causes are assigned to defined signals of nonstability and to the particular causes are assigned corrective or improvement actions. This list is called OCAP (Out-of control action plan). From the point of view of the main goal of SPC it represents one of the most important information sources. After recording values to control chart and records to Accompanying process sheet (eventually after translating data into SW) it is necessary to make an interpretation of control charts. That means to find signals of nonstability using predefined rules. When signal has been identified it is necessary to determine the factual assignable cause using information from Ishikawa diagram or OCAP. Through the information in OCAP and eventually through records of the efficiency of accepted corrective or improvement actions there is then selected the most suitable corrective or improvement action which must be realized as soon as possible. On the base of the subsequent data collection and evaluation of the process stability using control chart it is necessary to judge the stabilization of the process and the reduction of the process variability. Results must be recorded. When it has not resulted in the positive results it is necessary to repeat the cause analysis and assignment of the corrective action or to make the new Ishikawa diagram and update OCAP.
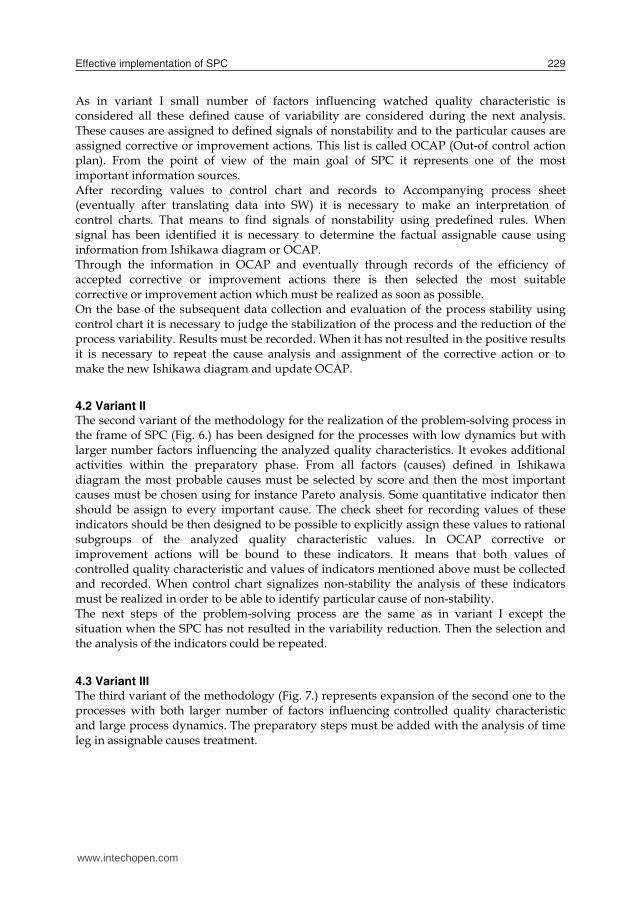
4.2 Variant II The second variant of the methodology for the realization of the problem-solving process in the frame of SPC (Fig. 6.) has been designed for the processes with low dynamics but with larger number factors influencing the analyzed quality characteristics. It evokes additional activities within the preparatory phase. From all factors (causes) defined in Ishikawa diagram the most probable causes must be selected by score and then the most important causes must be chosen using for instance Pareto analysis. Some quantitative indicator then should be assign to every important cause. The check sheet for recording values of these indicators should be then designed to be possible to explicitly assign these values to rational subgroups of the analyzed quality characteristic values. In OCAP corrective or improvement actions will be bound to these indicators. It means that both values of controlled quality characteristic and values of indicators mentioned above must be collected and recorded. When control chart signalizes non-stability the analysis of these indicators must be realized in order to be able to identify particular cause of non-stability. The next steps of the problem-solving process are the same as in variant I except the situation when the SPC has not resulted in the variability reduction. Then the selection and the analysis of the indicators could be repeated.
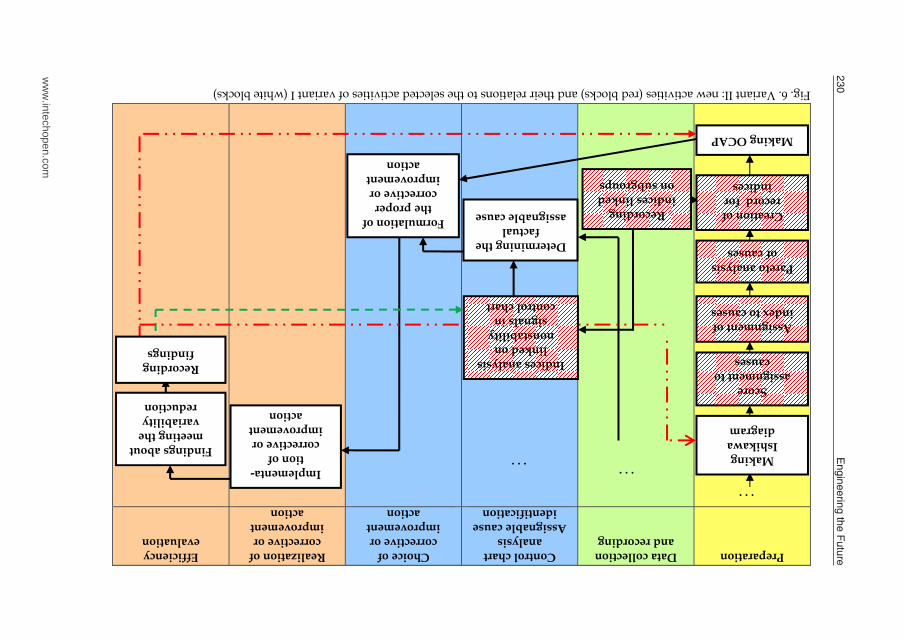
4.3 Variant III The third variant of the methodology (Fig. 7.) represents expansion of the second one to the processes with both larger number of factors influencing controlled quality characteristic and large process dynamics. The preparatory steps must be added with the analysis of time leg in assignable causes treatment.
www.intechopen.com
Effective implementation of SPC 229
Preparation D
ata collection and recording
Control chart analysis
Assignable cause identification
Choice of
corrective or im
provement
action
Realization of
corrective or im
provement
action
Efficiency evaluation
Fig. 5. Scheme of variant I
Making
Ishikawa
diagram
Making O
CA
P
Defining rules
for identification of the process nonstability
Creating the
Accom
panying process sheet
Creating the
control card R
ecording statistics
Recording the
interventions and process
changes Identification
of out- of limits
points and nonrandom
patterns
Determ
ining the factual assignable
cause Form
ulation of proper
corrective or im
provement
action
Implem
entation of corrective or im
provement
action Findings about
meeting the
variability reduction
Recording
findings
As in variant I small number of factors influencing watched quality characteristic is considered all these defined cause of variability are considered during the next analysis. These causes are assigned to defined signals of nonstability and to the particular causes are assigned corrective or improvement actions. This list is called OCAP (Out-of control action plan). From the point of view of the main goal of SPC it represents one of the most important information sources. After recording values to control chart and records to Accompanying process sheet (eventually after translating data into SW) it is necessary to make an interpretation of control charts. That means to find signals of nonstability using predefined rules. When signal has been identified it is necessary to determine the factual assignable cause using information from Ishikawa diagram or OCAP. Through the information in OCAP and eventually through records of the efficiency of accepted corrective or improvement actions there is then selected the most suitable corrective or improvement action which must be realized as soon as possible. On the base of the subsequent data collection and evaluation of the process stability using control chart it is necessary to judge the stabilization of the process and the reduction of the process variability. Results must be recorded. When it has not resulted in the positive results it is necessary to repeat the cause analysis and assignment of the corrective action or to make the new Ishikawa diagram and update OCAP.
4.2 Variant II The second variant of the methodology for the realization of the problem-solving process in the frame of SPC (Fig. 6.) has been designed for the processes with low dynamics but with larger number factors influencing the analyzed quality characteristics. It evokes additional activities within the preparatory phase. From all factors (causes) defined in Ishikawa diagram the most probable causes must be selected by score and then the most important causes must be chosen using for instance Pareto analysis. Some quantitative indicator then should be assign to every important cause. The check sheet for recording values of these indicators should be then designed to be possible to explicitly assign these values to rational subgroups of the analyzed quality characteristic values. In OCAP corrective or improvement actions will be bound to these indicators. It means that both values of controlled quality characteristic and values of indicators mentioned above must be collected and recorded. When control chart signalizes non-stability the analysis of these indicators must be realized in order to be able to identify particular cause of non-stability. The next steps of the problem-solving process are the same as in variant I except the situation when the SPC has not resulted in the variability reduction. Then the selection and the analysis of the indicators could be repeated.
4.3 Variant III The third variant of the methodology (Fig. 7.) represents expansion of the second one to the processes with both larger number of factors influencing controlled quality characteristic and large process dynamics. The preparatory steps must be added with the analysis of time leg in assignable causes treatment.
www.intechopen.com
Engineering the Future
230
Preparation Data collection and recording
Control chart analysis
Assignable cause identification
Choice of corrective or
improvement action
Realization of corrective or
improvement action
Efficiency evaluation
Fig. 6. Variant II: new activities (red blocks) and their relations to the selected activities of variant I (white blocks)
Determining the factual
assignable cause
Formulation of the proper
corrective or improvement
action
Making Ishikawa diagram
Making OCAP
Implementa- tion of
corrective or improvement
action
Findings about meeting the variability reduction
Score assignment to
causes
Pareto analysis of causes
Assignment of index to causes
Creation of record for
indices
Recording indices linked on subgroups
Indices analysis linked on
nonstability signals in
control chart
Recording findings
. . . . . .
. . .
Preparation Data collection and recording
Control chart analysis
Assignable cause identification
Choice of corrective or
improvement action
Realization of corrective or
improvement action
Efficiency evaluation
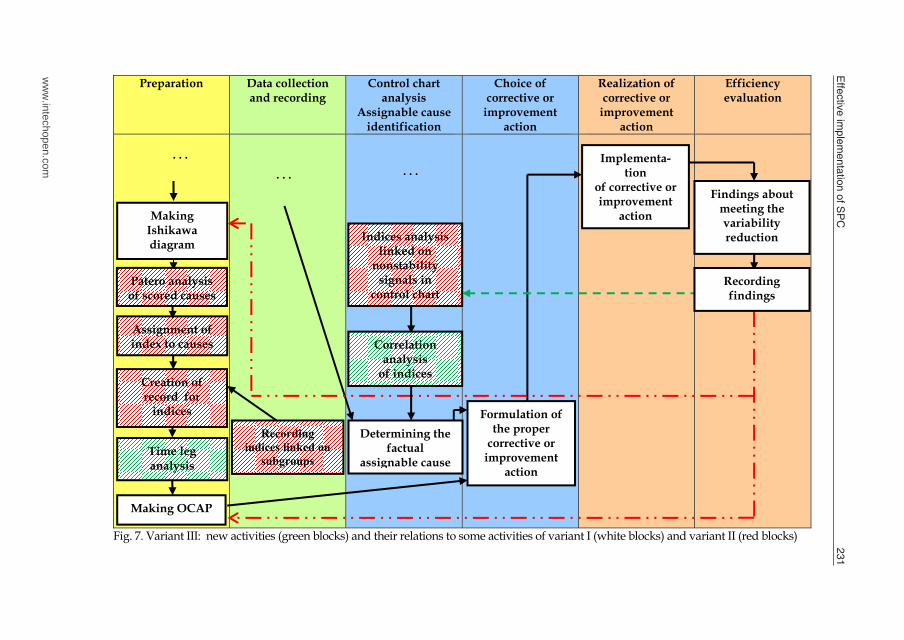
Fig. 7. Variant III: new activities (green blocks) and their relations to some activities of variant I (white blocks) and variant II (red blocks)
Determining the factual
assignable cause
Formulation of the proper
corrective or improvement
action
Making Ishikawa diagram
Making OCAP
Implementa-tion
of corrective or improvement
action
Findings about meeting the variability reduction
Patero analysis of scored causes
Assignment of index to causes
Creation of record for
indices
Time leg analysis
Recording indices linked on
subgroups
Indices analysis linked on
nonstability signals in
control chart Recording findings
Correlation analysis
of indices
. . . . . .
. . .
ww
w.intechopen.com
Effective im
plementation of S
PC
231
Preparation Data collection and recording
Control chart analysis
Assignable cause identification
Choice of corrective or
improvement action
Realization of corrective or
improvement action
Efficiency evaluation
Fig. 6. Variant II: new activities (red blocks) and their relations to the selected activities of variant I (white blocks)
Determining the factual
assignable cause
Formulation of the proper
corrective or improvement
action
Making Ishikawa diagram
Making OCAP
Implementa- tion of
corrective or improvement
action
Findings about meeting the variability reduction
Score assignment to
causes
Pareto analysis of causes
Assignment of index to causes
Creation of record for
indices
Recording indices linked on subgroups
Indices analysis linked on
nonstability signals in
control chart
Recording findings
. . . . . .
. . .
Preparation Data collection and recording
Control chart analysis
Assignable cause identification
Choice of corrective or
improvement action
Realization of corrective or
improvement action
Efficiency evaluation
Fig. 7. Variant III: new activities (green blocks) and their relations to some activities of variant I (white blocks) and variant II (red blocks)
Determining the factual
assignable cause
Formulation of the proper
corrective or improvement
action
Making Ishikawa diagram
Making OCAP
Implementa-tion
of corrective or improvement
action
Findings about meeting the variability reduction
Patero analysis of scored causes
Assignment of index to causes
Creation of record for
indices
Time leg analysis
Recording indices linked on
subgroups
Indices analysis linked on
nonstability signals in
control chart Recording findings
Correlation analysis
of indices
. . . . . .
. . .
ww
w.intechopen.com
Engineering the Future232
Some of the causes can namely affect the controlled quality characteristic with time leg and it can evocate problems with assigning the indicator values to the values of sample statistics computed from the output quality characteristic values. The analysis of the particular indicators in the frame of the assignable cause identification must be spread to (using regression and correlation analysis, DOE) in the situation when there exists important correlation between indicators and their joint could have an significant influence on the quality characteristics values. The forth variant represents the combination of variants I and III.
5. Proposal of expert system for problem-solving process in SPC
As mentioned in chapter 3.2 good expert system can support problem-solving process in the frame of SPC and lead to effective and quick realization of its subprocesses. The proposal of expert system for SPC which is described in this chapter has two main parts: the block for the selection of the control chart and so called identification block.
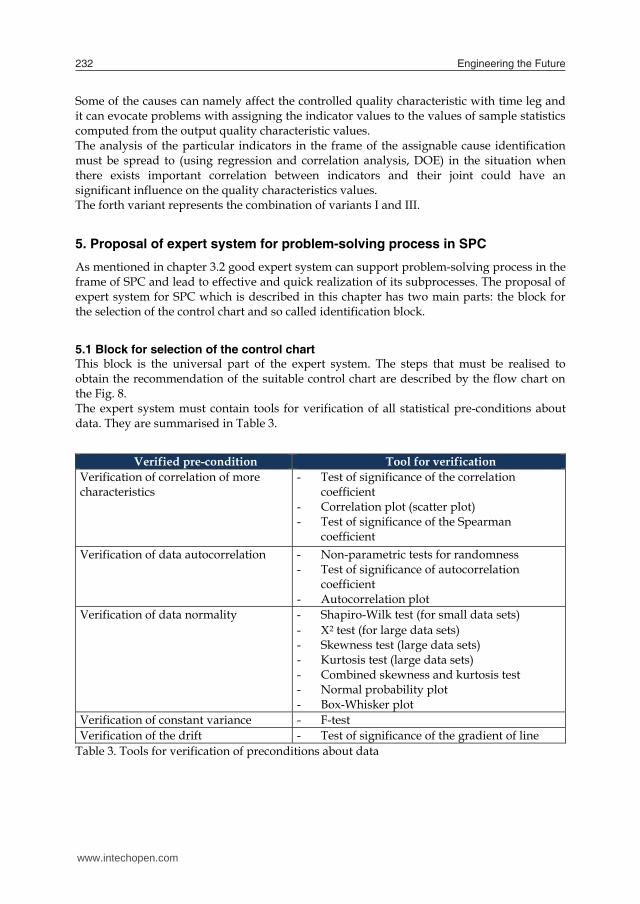
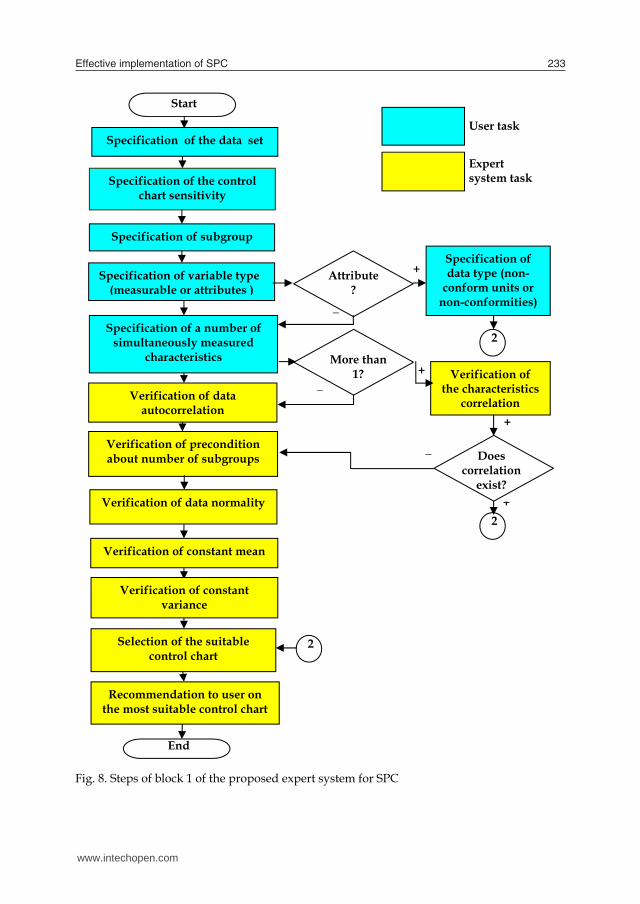
5.1 Block for selection of the control chart This block is the universal part of the expert system. The steps that must be realised to obtain the recommendation of the suitable control chart are described by the flow chart on the Fig. 8. The expert system must contain tools for verification of all statistical pre-conditions about data. They are summarised in Table 3.
Verified pre-condition Tool for verification
Verification of correlation of more characteristics
- Test of significance of the correlation coefficient
- Correlation plot (scatter plot) - Test of significance of the Spearman
coefficient Verification of data autocorrelation - Non-parametric tests for randomness
- Test of significance of autocorrelation coefficient
- Autocorrelation plot Verification of data normality - Shapiro-Wilk test (for small data sets)
- 2 test (for large data sets) - Skewness test (large data sets) - Kurtosis test (large data sets) - Combined skewness and kurtosis test - Normal probability plot - Box-Whisker plot
Verification of constant variance - F-test Verification of the drift - Test of significance of the gradient of line
Table 3. Tools for verification of preconditions about data
Fig. 8. Steps of block 1 of the proposed expert system for SPC
+
End
Attribute?
_
User task
Expert system task
_
+ Specification of data type (non-
conform units or non-conformities)
_
+
Verification of the characteristics
correlation
Does correlation
exist?
+
More than 1?
Specification of variable type (measurable or attributes )
Specification of the data set
Specification of the control chart sensitivity
Specification of subgroup
Verification of data autocorrelation
Verification of precondition about number of subgroups
Verification of data normality
Start
Specification of a number of simultaneously measured
characteristics
Verification of constant mean
Verification of constant variance
Selection of the suitable control chart
Recommendation to user on the most suitable control chart
2
2
2
www.intechopen.com
Effective implementation of SPC 233
Some of the causes can namely affect the controlled quality characteristic with time leg and it can evocate problems with assigning the indicator values to the values of sample statistics computed from the output quality characteristic values. The analysis of the particular indicators in the frame of the assignable cause identification must be spread to (using regression and correlation analysis, DOE) in the situation when there exists important correlation between indicators and their joint could have an significant influence on the quality characteristics values. The forth variant represents the combination of variants I and III.
5. Proposal of expert system for problem-solving process in SPC
As mentioned in chapter 3.2 good expert system can support problem-solving process in the frame of SPC and lead to effective and quick realization of its subprocesses. The proposal of expert system for SPC which is described in this chapter has two main parts: the block for the selection of the control chart and so called identification block.
5.1 Block for selection of the control chart This block is the universal part of the expert system. The steps that must be realised to obtain the recommendation of the suitable control chart are described by the flow chart on the Fig. 8. The expert system must contain tools for verification of all statistical pre-conditions about data. They are summarised in Table 3.
Verified pre-condition Tool for verification
Verification of correlation of more characteristics
- Test of significance of the correlation coefficient
- Correlation plot (scatter plot) - Test of significance of the Spearman
coefficient Verification of data autocorrelation - Non-parametric tests for randomness
- Test of significance of autocorrelation coefficient
- Autocorrelation plot Verification of data normality - Shapiro-Wilk test (for small data sets)
- 2 test (for large data sets) - Skewness test (large data sets) - Kurtosis test (large data sets) - Combined skewness and kurtosis test - Normal probability plot - Box-Whisker plot
Verification of constant variance - F-test Verification of the drift - Test of significance of the gradient of line
Table 3. Tools for verification of preconditions about data
Fig. 8. Steps of block 1 of the proposed expert system for SPC
+
End
Attribute?
_
User task
Expert system task
_
+ Specification of data type (non-
conform units or non-conformities)
_
+
Verification of the characteristics
correlation
Does correlation
exist?
+
More than 1?
Specification of variable type (measurable or attributes )
Specification of the data set
Specification of the control chart sensitivity
Specification of subgroup
Verification of data autocorrelation
Verification of precondition about number of subgroups
Verification of data normality
Start
Specification of a number of simultaneously measured
characteristics
Verification of constant mean
Verification of constant variance
Selection of the suitable control chart
Recommendation to user on the most suitable control chart
2
2
2
www.intechopen.com
Engineering the Future234
Rules for the selection of suitable control chart that must be a part of the knowledge base are summarised in Table 4.
Preconditions Suitable control chart Normally distributed data One characteristic Constant mean and variance Non-correlated data Suitable number of subgroups (20-25) Low sensitivity of chart
Classical Shewhart control charts for variables
Type of characteristic – attribute - low sensitivity - high sensitivity
Classical Shewhart control charts for
attributes CUSUM charts for attributes
More than one characteristic simultaneously measured on one unit - correlated data - non-correlated data
Hotelling chart Classical Shewhart control charts for
variables Autocorrelated data - positive autocorrelation - all situations
Dynamic EWMA chart Shewhart control chart for individuals,
classical EWMA or CUSUM charts – all applied to residuals from ARMA or ARIMA models
Low number of subgroups - consistent variance - non-consistent variance
Goal charts Standardised charts
Non-normally distributed data (for subgroup size less then 5)
Control chart with re-transformed limits
High sensitivity of chart
CUSUM chart Classical EWMA chart
Non constant mean (drift)
Regression chart Chart for residuals from regression
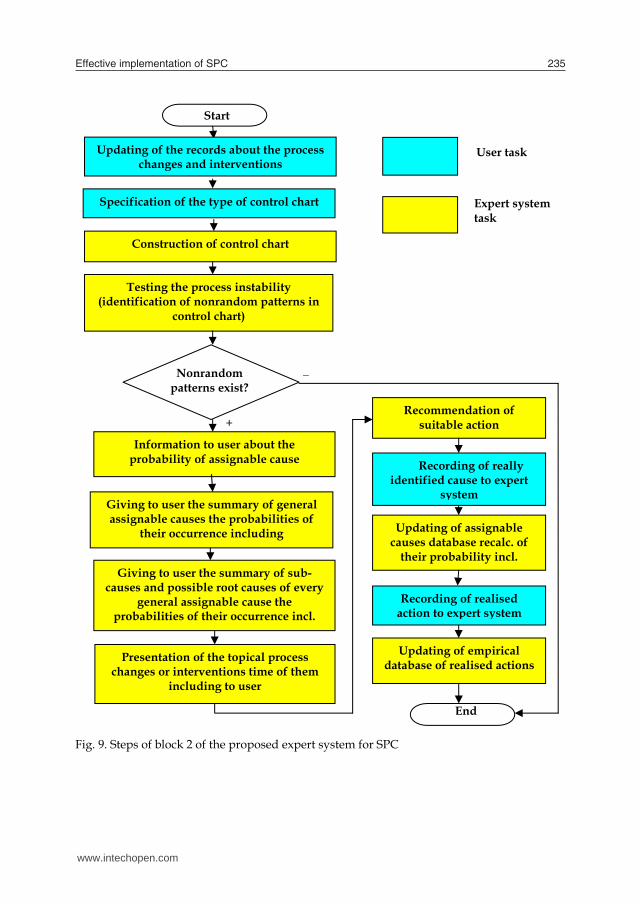
function Table 4. Rules for selection of suitable control chart 5.2 The identification block As compared to the block described above the second block of the proposed expert system– the identification block is the part of the expert system that contains knowledge and experience of experts with the special process. This part is not universal but it will be differ from one process to other process. The goal of this block is to offer to user support for a quick identification of assignable cause of process variation and quick realisation of effective action. Steps that must be realised in the frame of this block are described using the flow chart in Fig. 9. We suppose that the initial information (specification of data set, subgroup size etc.) is shared with the first block for the selection of control chart.
Fig. 9. Steps of block 2 of the proposed expert system for SPC
Start
Nonrandom patterns exist?
+
Specification of the type of control chart
Testing the process instability (identification of nonrandom patterns in
control chart)
Information to user about the probability of assignable cause
Giving to user the summary of general assignable causes the probabilities of
their occurrence including
Giving to user the summary of sub-causes and possible root causes of every
general assignable cause the probabilities of their occurrence incl.
Presentation of the topical process changes or interventions time of them
including to user
Construction of control chart
Updating of assignable causes database recalc. of
their probability incl.
Recommendation of suitable action
Recording of realised action to expert system
Updating of empirical database of realised actions
End
User task
Expert system task
_
Updating of the records about the process changes and interventions
Recording of really identified cause to expert
system
www.intechopen.com
Effective implementation of SPC 235
Rules for the selection of suitable control chart that must be a part of the knowledge base are summarised in Table 4.
Preconditions Suitable control chart Normally distributed data One characteristic Constant mean and variance Non-correlated data Suitable number of subgroups (20-25) Low sensitivity of chart
Classical Shewhart control charts for variables
Type of characteristic – attribute - low sensitivity - high sensitivity
Classical Shewhart control charts for
attributes CUSUM charts for attributes
More than one characteristic simultaneously measured on one unit - correlated data - non-correlated data
Hotelling chart Classical Shewhart control charts for
variables Autocorrelated data - positive autocorrelation - all situations
Dynamic EWMA chart Shewhart control chart for individuals,
classical EWMA or CUSUM charts – all applied to residuals from ARMA or ARIMA models
Low number of subgroups - consistent variance - non-consistent variance
Goal charts Standardised charts
Non-normally distributed data (for subgroup size less then 5)
Control chart with re-transformed limits
High sensitivity of chart
CUSUM chart Classical EWMA chart
Non constant mean (drift)
Regression chart Chart for residuals from regression
function Table 4. Rules for selection of suitable control chart 5.2 The identification block As compared to the block described above the second block of the proposed expert system– the identification block is the part of the expert system that contains knowledge and experience of experts with the special process. This part is not universal but it will be differ from one process to other process. The goal of this block is to offer to user support for a quick identification of assignable cause of process variation and quick realisation of effective action. Steps that must be realised in the frame of this block are described using the flow chart in Fig. 9. We suppose that the initial information (specification of data set, subgroup size etc.) is shared with the first block for the selection of control chart.
Fig. 9. Steps of block 2 of the proposed expert system for SPC
Start
Nonrandom patterns exist?
+
Specification of the type of control chart
Testing the process instability (identification of nonrandom patterns in
control chart)
Information to user about the probability of assignable cause
Giving to user the summary of general assignable causes the probabilities of
their occurrence including
Giving to user the summary of sub-causes and possible root causes of every
general assignable cause the probabilities of their occurrence incl.
Presentation of the topical process changes or interventions time of them
including to user
Construction of control chart
Updating of assignable causes database recalc. of
their probability incl.
Recommendation of suitable action
Recording of realised action to expert system
Updating of empirical database of realised actions
End
User task
Expert system task
_
Updating of the records about the process changes and interventions
Recording of really identified cause to expert
system
www.intechopen.com
Engineering the Future236
The second block must contain algorithms for the construction and analysis of all control charts that are incorporated into the first block of the expert system. Some of them (classical Shewhart control charts, classical EWMA charts, CUSUM charts, Hotelling chart) are contained in many statistical software packages – some such statistical program could be a part of the operational system of the proposed expert system. But the algorithms for the construction and analysis of other control charts mentioned in Table 4. must be created and incorporated into the expert system. Another part of the knowledge base for the second block of the proposed expert system are the tests of the process stability. It is suitable to divide this testing into two parts: 1. Testing in classical Shewhart control charts for sample mean and range
- for testing stability using these control charts the expert system should contain all developed tests of non-random patterns .
2. Testing of all other control charts incorporated into the expert system - for all other charts we recommend to use only basic test (identification of the point
behind the control limits) because of the lack of sufficient theoretical background. Very important part of the knowledge base that the identification block needs for its operating is the part which contains special knowledge and expert experience with the controlled process: a) Results of the team analysis of the process variation (using for instance Ishikawa chart,
Pareto analysis) that give an initial summary of possible general and root assignable causes of the process variation and possible probabilities of their occurring.
b) Results of the history of the process – identified non-random patterns in the old control charts, records about all changes of the process, records of all really identified assignable causes, records of all realised actions.
6. Practical application of the proposed methodology
In this charter there are described selected steps of the preparatory phase of the application of statistical process control to the stamping of metal stampings for the automotive industry (Novosadová, 2010 ).
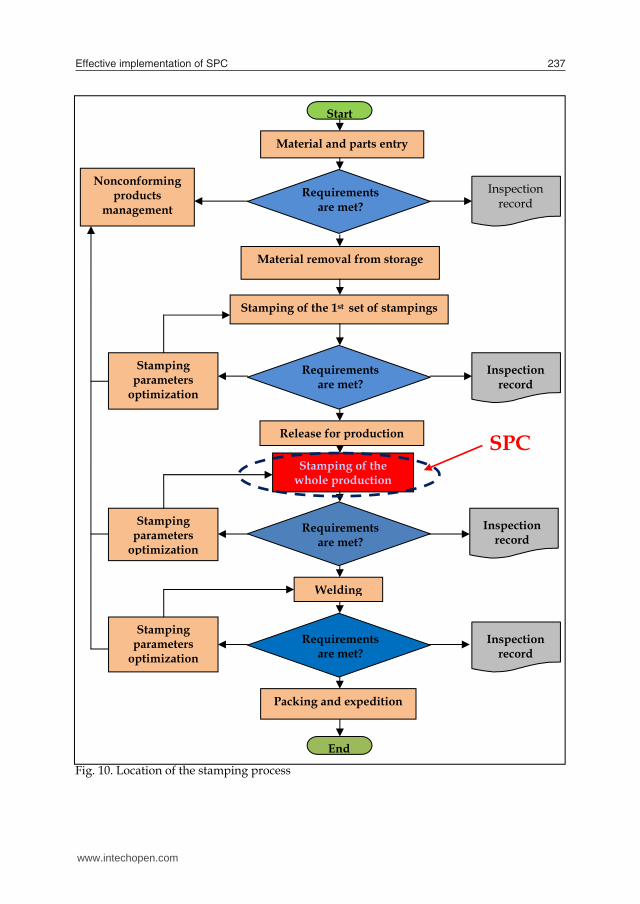
6.1 Selection of the process, product and quality characteristic for SPC The company has decided to apply statistical process control to the stamping process which is the main production operation in the frame of the manufacturing of the product called spoiler holder (see Fig. 10.). This selection has been based on the customer request, production volume of the mentioned product which is the largest of all products produced in the company. The stamping process is realized on the transfer press Beutler 125 t. The left and right front spoiler holder (Fig. 11. (a)) is the output of this process. It makes for mounting the front spoiler to the front fender on the left and on the right side. The basic requirements on the product characteristics are specified in drawing documentation. Specified dimensions and tolerances must be met, product mustn´t have scratches, burrs and undesirable deformations. As a quality characteristic which values are used for statistical process control the shape deviation of the spoiler holder bill with tolerance ± 0,5 mm was chosen (Fig. 11. (b)). This quality characteristic is measured using a digital drift meter.
Fig. 10. Location of the stamping process
SPC
Nonconforming products
management
Stamping parameters
optimization
Stamping parameters
optimization
Stamping parameters
optimization
Material and parts entry
Material removal from storage
Stamping of the 1st set of stampings
Release for production
Stamping of the whole production
Welding
Packing and expedition
Start
End
Requirements are met?
Requirements are met?
Requirements are met?
Requirements are met?
Inspection record
Inspection record
Inspection record
Inspection record
www.intechopen.com
Effective implementation of SPC 237
The second block must contain algorithms for the construction and analysis of all control charts that are incorporated into the first block of the expert system. Some of them (classical Shewhart control charts, classical EWMA charts, CUSUM charts, Hotelling chart) are contained in many statistical software packages – some such statistical program could be a part of the operational system of the proposed expert system. But the algorithms for the construction and analysis of other control charts mentioned in Table 4. must be created and incorporated into the expert system. Another part of the knowledge base for the second block of the proposed expert system are the tests of the process stability. It is suitable to divide this testing into two parts: 1. Testing in classical Shewhart control charts for sample mean and range
- for testing stability using these control charts the expert system should contain all developed tests of non-random patterns .
2. Testing of all other control charts incorporated into the expert system - for all other charts we recommend to use only basic test (identification of the point
behind the control limits) because of the lack of sufficient theoretical background. Very important part of the knowledge base that the identification block needs for its operating is the part which contains special knowledge and expert experience with the controlled process: a) Results of the team analysis of the process variation (using for instance Ishikawa chart,
Pareto analysis) that give an initial summary of possible general and root assignable causes of the process variation and possible probabilities of their occurring.
b) Results of the history of the process – identified non-random patterns in the old control charts, records about all changes of the process, records of all really identified assignable causes, records of all realised actions.
6. Practical application of the proposed methodology
In this charter there are described selected steps of the preparatory phase of the application of statistical process control to the stamping of metal stampings for the automotive industry (Novosadová, 2010 ).
6.1 Selection of the process, product and quality characteristic for SPC The company has decided to apply statistical process control to the stamping process which is the main production operation in the frame of the manufacturing of the product called spoiler holder (see Fig. 10.). This selection has been based on the customer request, production volume of the mentioned product which is the largest of all products produced in the company. The stamping process is realized on the transfer press Beutler 125 t. The left and right front spoiler holder (Fig. 11. (a)) is the output of this process. It makes for mounting the front spoiler to the front fender on the left and on the right side. The basic requirements on the product characteristics are specified in drawing documentation. Specified dimensions and tolerances must be met, product mustn´t have scratches, burrs and undesirable deformations. As a quality characteristic which values are used for statistical process control the shape deviation of the spoiler holder bill with tolerance ± 0,5 mm was chosen (Fig. 11. (b)). This quality characteristic is measured using a digital drift meter.
Fig. 10. Location of the stamping process
SPC
Nonconforming products
management
Stamping parameters
optimization
Stamping parameters
optimization
Stamping parameters
optimization
Material and parts entry
Material removal from storage
Stamping of the 1st set of stampings
Release for production
Stamping of the whole production
Welding
Packing and expedition
Start
End
Requirements are met?
Requirements are met?
Requirements are met?
Requirements are met?
Inspection record
Inspection record
Inspection record
Inspection record
www.intechopen.com
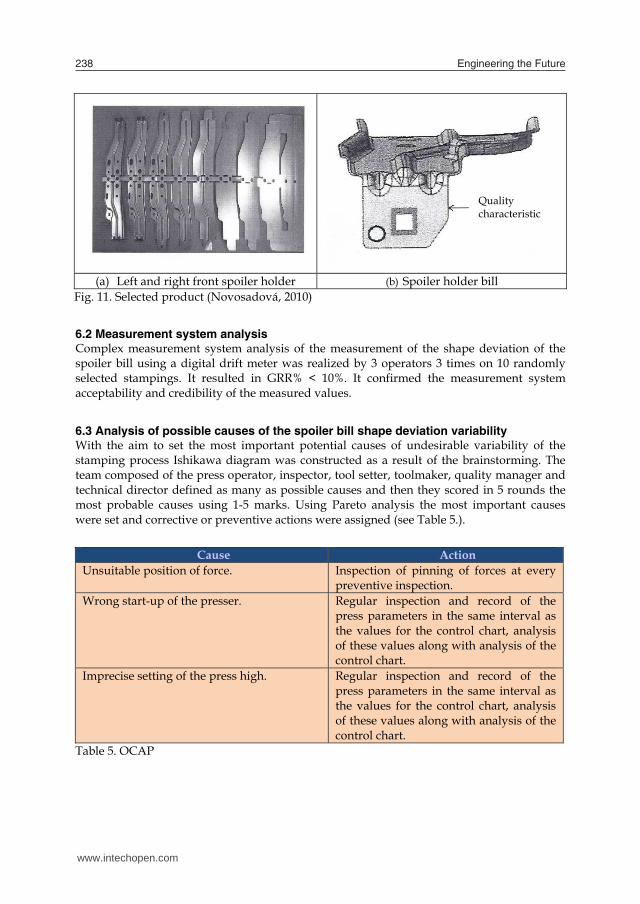
Engineering the Future238
(a) Left and right front spoiler holder (b) Spoiler holder bill
Fig. 11. Selected product (Novosadová, 2010)
6.2 Measurement system analysis Complex measurement system analysis of the measurement of the shape deviation of the spoiler bill using a digital drift meter was realized by 3 operators 3 times on 10 randomly selected stampings. It resulted in GRR% < 10%. It confirmed the measurement system acceptability and credibility of the measured values.
6.3 Analysis of possible causes of the spoiler bill shape deviation variability With the aim to set the most important potential causes of undesirable variability of the stamping process Ishikawa diagram was constructed as a result of the brainstorming. The team composed of the press operator, inspector, tool setter, toolmaker, quality manager and technical director defined as many as possible causes and then they scored in 5 rounds the most probable causes using 1-5 marks. Using Pareto analysis the most important causes were set and corrective or preventive actions were assigned (see Table 5.).
Table 5. OCAP
Cause Action Unsuitable position of force. Inspection of pinning of forces at every
preventive inspection. Wrong start-up of the presser. Regular inspection and record of the
press parameters in the same interval as the values for the control chart, analysis of these values along with analysis of the control chart.
Imprecise setting of the press high. Regular inspection and record of the press parameters in the same interval as the values for the control chart, analysis of these values along with analysis of the control chart.
Quality characteristic
6.4 Design of the system for data collection and record Five values of the selected quality characteristic (the shape deviation of the left and right spoiler bill) were proposed to be collected every 1 hour and recorded to the proposed control record. So called “Accompanying process sheet” for the record of every process change and interventions has been designed as a part of the record mentioned above (table 6.). It means that operator will sample 5 consecutive pieces of stampings of the right and left spoiler every hour. Immediately he will made an inspection of the spoiler bill using digital drift meter and measured values he will record into the suggested record sample time including. After every shift the operator will give the record to the quality operator who put the data in PC. In conjunction with the values mentioned above values of indexes that express cause start up of the press and setting of the press high will be measured and recorded into the suggested control record (see Table 7.) also every hour to be able to analyse these indexes altogether with control charts. The record will be linked to the control record of the quality characteristics used for statistical process control. The suggested way of the collection and data processing corresponds to the first variant of the designed methodology of the realization of statistical process control as a problem-solving process as the stamping is in principle not too dynamic process with the low number of factors influencing its variability. Next verification of the data preconditions (normality, homogeneity, independence) was realized to be able to select the right control chart. After it the matrix of responsibility for all the actions that must be realized in the frame of statistical process control was put together.
Table 6. Accompanying process sheet
Start up of the press Equipment: Beutler 125t
Part name: Spoiler Part number: Instrument number:
Op.: Stamping
Subgroup
Target value
Lifting height
Operational instrument
height
Loader height
Feed length
Stamping force left
Stamping force right
1 2 3 ...
Table 7. Control record
Accompanying process sheet Date/Hour Operator Sign Assignable cause/Process
change/Interventions
www.intechopen.com
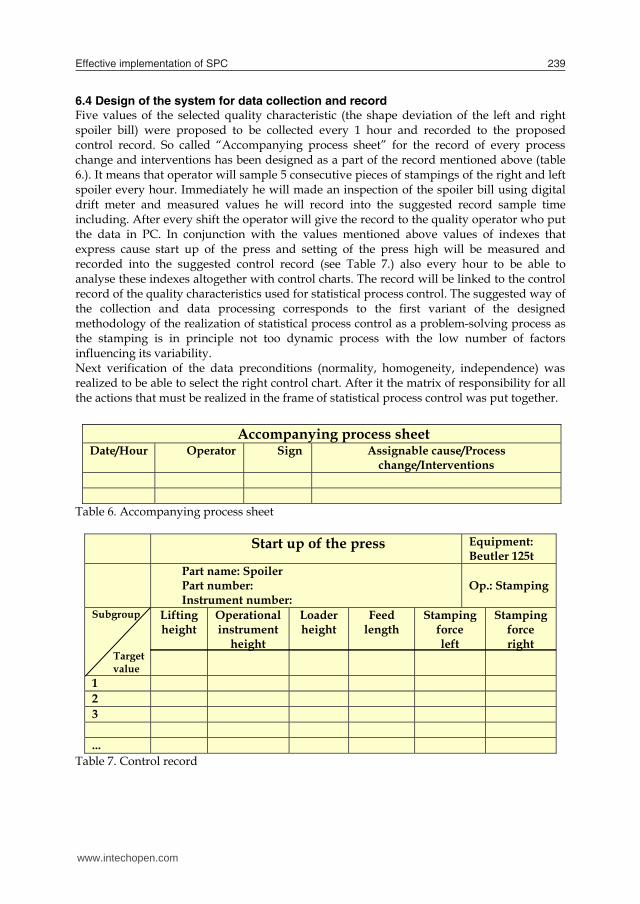
Effective implementation of SPC 239
(a) Left and right front spoiler holder (b) Spoiler holder bill
Fig. 11. Selected product (Novosadová, 2010)
6.2 Measurement system analysis Complex measurement system analysis of the measurement of the shape deviation of the spoiler bill using a digital drift meter was realized by 3 operators 3 times on 10 randomly selected stampings. It resulted in GRR% < 10%. It confirmed the measurement system acceptability and credibility of the measured values.
6.3 Analysis of possible causes of the spoiler bill shape deviation variability With the aim to set the most important potential causes of undesirable variability of the stamping process Ishikawa diagram was constructed as a result of the brainstorming. The team composed of the press operator, inspector, tool setter, toolmaker, quality manager and technical director defined as many as possible causes and then they scored in 5 rounds the most probable causes using 1-5 marks. Using Pareto analysis the most important causes were set and corrective or preventive actions were assigned (see Table 5.).
Table 5. OCAP
Cause Action Unsuitable position of force. Inspection of pinning of forces at every
preventive inspection. Wrong start-up of the presser. Regular inspection and record of the
press parameters in the same interval as the values for the control chart, analysis of these values along with analysis of the control chart.
Imprecise setting of the press high. Regular inspection and record of the press parameters in the same interval as the values for the control chart, analysis of these values along with analysis of the control chart.
Quality characteristic
6.4 Design of the system for data collection and record Five values of the selected quality characteristic (the shape deviation of the left and right spoiler bill) were proposed to be collected every 1 hour and recorded to the proposed control record. So called “Accompanying process sheet” for the record of every process change and interventions has been designed as a part of the record mentioned above (table 6.). It means that operator will sample 5 consecutive pieces of stampings of the right and left spoiler every hour. Immediately he will made an inspection of the spoiler bill using digital drift meter and measured values he will record into the suggested record sample time including. After every shift the operator will give the record to the quality operator who put the data in PC. In conjunction with the values mentioned above values of indexes that express cause start up of the press and setting of the press high will be measured and recorded into the suggested control record (see Table 7.) also every hour to be able to analyse these indexes altogether with control charts. The record will be linked to the control record of the quality characteristics used for statistical process control. The suggested way of the collection and data processing corresponds to the first variant of the designed methodology of the realization of statistical process control as a problem-solving process as the stamping is in principle not too dynamic process with the low number of factors influencing its variability. Next verification of the data preconditions (normality, homogeneity, independence) was realized to be able to select the right control chart. After it the matrix of responsibility for all the actions that must be realized in the frame of statistical process control was put together.
Table 6. Accompanying process sheet
Start up of the press Equipment: Beutler 125t
Part name: Spoiler Part number: Instrument number:
Op.: Stamping
Subgroup
Target value
Lifting height
Operational instrument
height
Loader height
Feed length
Stamping force left
Stamping force right
1 2 3 ...
Table 7. Control record
Accompanying process sheet Date/Hour Operator Sign Assignable cause/Process
change/Interventions
www.intechopen.com
Engineering the Future240
7. Conclusion
This paper shows the need to realize a problem-solving process as an axis of vital complex and effective SPC system. After defining the complex and effective SPC implementation and factors of its efficiency four variants of the methodology for realization of the problem-solving process in the frame of SPC were described. As a part of the proposal of the methodology mentioned above the design of the expert system for SPC was described. Variant II of the methodology was then shown on the practical example in condition of the stamping process. In future research more detailed scenarios of the effective and complex SPC implementation for different productive and non-productive branches in the frame of the designed methodology will be developed using the results of the research of barriers and stimulators of the SPC implementation in companies in Czech Republic and verified in practice.
The work was realized within the solution of the Czech national research project CEZ MSM 6198910019 Reduction of CO2 Production - DECOx Processes.
8. References
Antony, J. & Taner, T. (2003). A conceptual framework for the effective implementation of statistical process control. Business Process Management Journal, Vol. 9, No. 4, pp. 473-389, ISSN 1463-7154
Berger, R. W. & Hart, Th. H. (1986). Statistical process control: A guide for implementation, M. Dekker, ISBN 0824776259, New York, NY.
Dasgupta, T. (2003). Maximizing the effectiveness of control charts: A framework for reacting to out-of-control signals, Proceedings of Annual Quality Congress, Vol. 57, No. 0, pp. 327-337, Kansas City, MI, June, 2003, ASQ, Milwaukee
Does, R. J. et al. (1997). A framework for implementation of statistical process control. International Journal of Quality Sciences,Vol. 2, No. 3, pp. 181-198, ISSN 1359-8538
Gaafar, L. K. & Keats, J. B.(1992). Statistical process control: a guide for implementation. International Journal of Quality and Reliability Management, Vol. 9, No. 4, pp. 9-20, ISSN 0265-671X
Gordon, M. E. et al. (1994). Factors associated with the success of the implementation of statistical process control. Journal of High Technology Management Research, Vol. 5, No. 1. pp. 101-121, ISSN 1047-8310
Hou, S. – Tong, S. (2008). Fuzzy Logic Based Assignable Causes Ranking System for Control Chart Abnormality Diagnosis. Proceedings of IEEE 2008 (FUZZ 2008), pp. 49 – 53, ISBN 978-1-4244-1818-3, Hong Kong, June 2008, IEEE, Los Alamitos.
Kelly, H. W. & Drury, C G. (2002). Socio-technical Reasons for the De-Evolution of Statistical process Control. Quality Management Journal, Vol. 9, No. 1, pp. 8-22, ISSN 1068-6967
Novosadová, M. (2010). Preparation of the SPC introduction to the stamping process. Bachelor thesis, VŠB-TU Ostrava, 45 p. (in Czech)
Palm, A. C. (2000). Discussion on “Controversies and contradictions in statistical process control”. Journal of Quality Technology, Vol. 32, No. 4, ISSN 0022-4065
www.intechopen.com

Engineering the FutureEdited by Laszlo Dudas
ISBN 978-953-307-210-4Hard cover, 414 pagesPublisher SciyoPublished online 02, November, 2010Published in print edition November, 2010
InTech EuropeUniversity Campus STeP Ri Slavka Krautzeka 83/A 51000 Rijeka, Croatia Phone: +385 (51) 770 447 Fax: +385 (51) 686 166www.intechopen.com
InTech ChinaUnit 405, Office Block, Hotel Equatorial Shanghai No.65, Yan An Road (West), Shanghai, 200040, China
Phone: +86-21-62489820 Fax: +86-21-62489821
This book pilots the reader into the future. The first three chapters introduce new materials and materialprocessing methods. Then five chapters present innovative new design directions and solutions. The mainsection of the book contains ten chapters organized around problems and methods of manufacturing andtechnology, from cutting process optimisation through maintenance and control to the Digital Factory. The lasttwo chapters deal with information and energy, as the foundations of a prospering economy.
How to referenceIn order to correctly reference this scholarly work, feel free to copy and paste the following:
Darja Noskievicova (2010). Effective Implementation of Statistical Process Control, Engineering the Future,Laszlo Dudas (Ed.), ISBN: 978-953-307-210-4, InTech, Available from:http://www.intechopen.com/books/engineering-the-future/effective-implementation-of-statistical-process-control-