Embed Size (px)
Citation preview
Steven Carlson, P.E.CDH Energy Corp.Evansville, WIwww.cdhenergy.com
WGBA Leadership ConferenceOctober 19, 2005
Effective Energy Modeling
Presentation Overview
WhatWhyHowIllustrated by experiences in the AlbericiWorld Headquarters LEED Platinum project
Experience –Building Performance
Energy Simulation Development• Buildings – Loads, part-load performance, etc
• Technologies (GSHP, Desiccants, Refrigeration, etc)
Energy Technology Demonstration• Field data
Building Performance• Metrics• Commissioning• Monitoring & Verification
Energy Project Development• Feasibility Studies• Energy Management
Whole Building Energy Analysis
Hourly simulationComprehensive Integration• Loads• Systems• Plant• Economics
Requires detailed design input to represent:• Shell• Systems• Equipment• Use
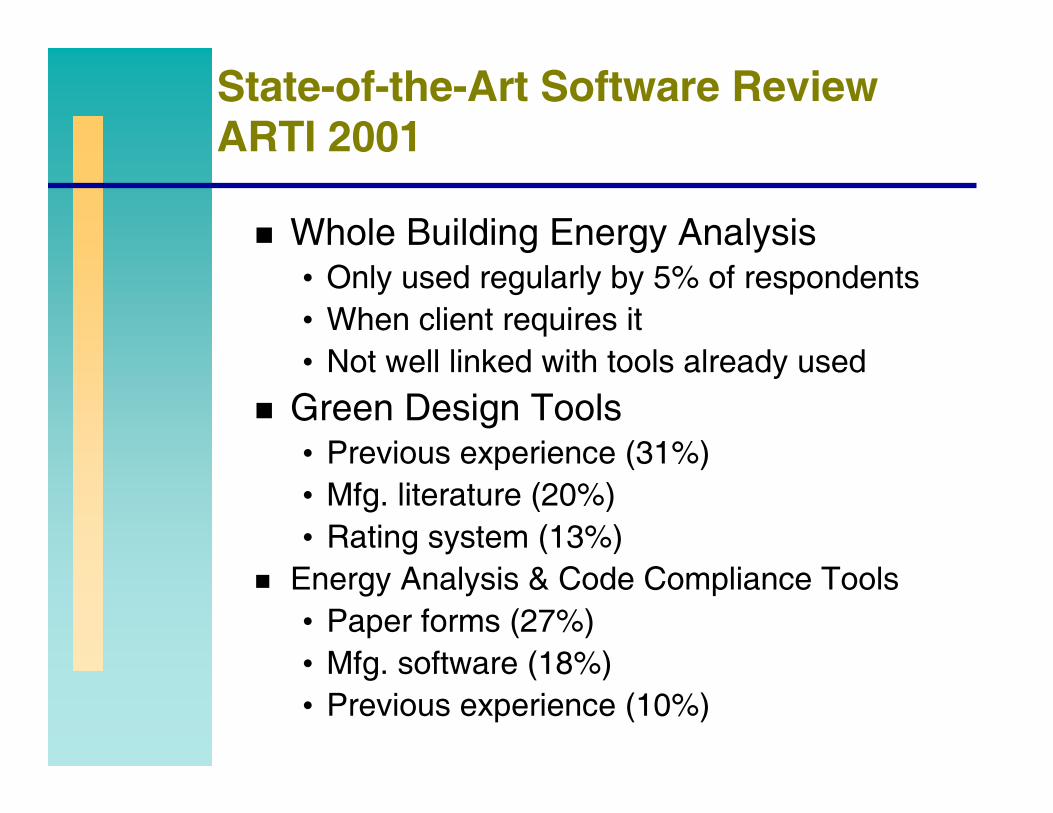
State-of-the-Art Software ReviewARTI 2001
Whole Building Energy Analysis• Only used regularly by 5% of respondents• When client requires it• Not well linked with tools already used
Green Design Tools• Previous experience (31%)• Mfg. literature (20%)• Rating system (13%)
Energy Analysis & Code Compliance Tools• Paper forms (27%)• Mfg. software (18%)• Previous experience (10%)
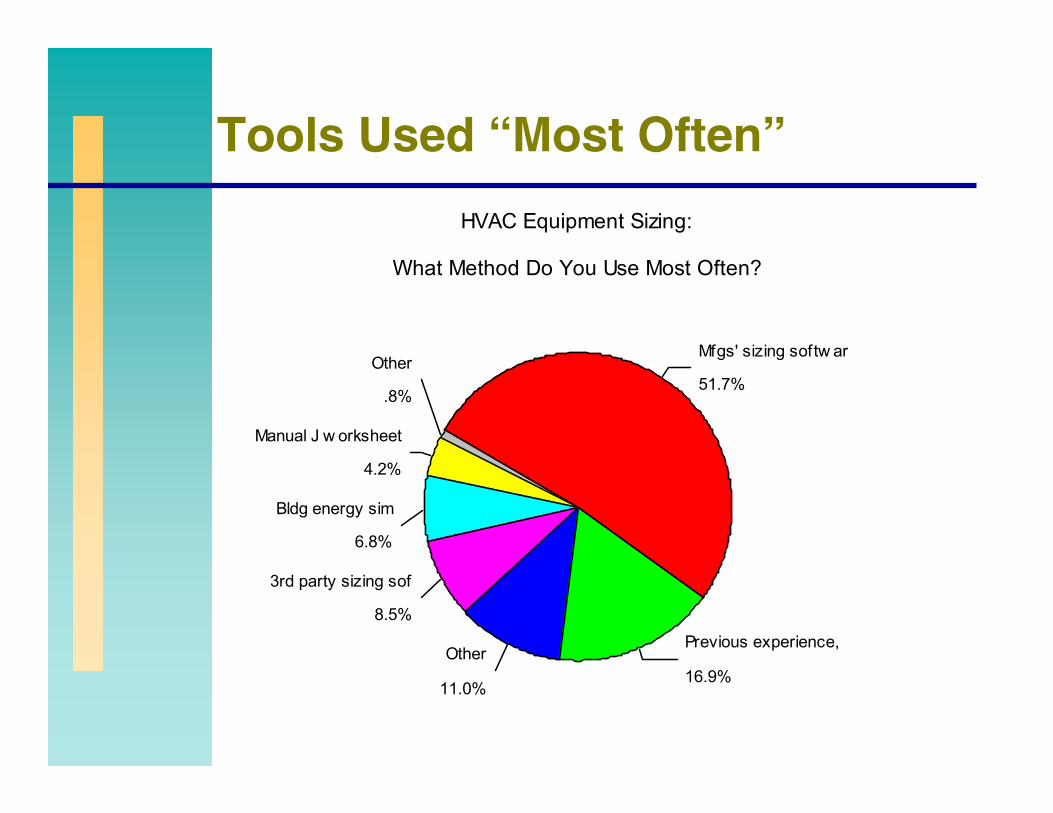
Tools Used “Most Often”HVAC Equipment Sizing:
What Method Do You Use Most Often?
.8%
4.2%
6.8%
8.5%
11.0%16.9%
51.7%Other
Manual J w orksheet
Bldg energy sim
3rd party sizing sof
OtherPrevious experience,
Mfgs' sizing softw ar
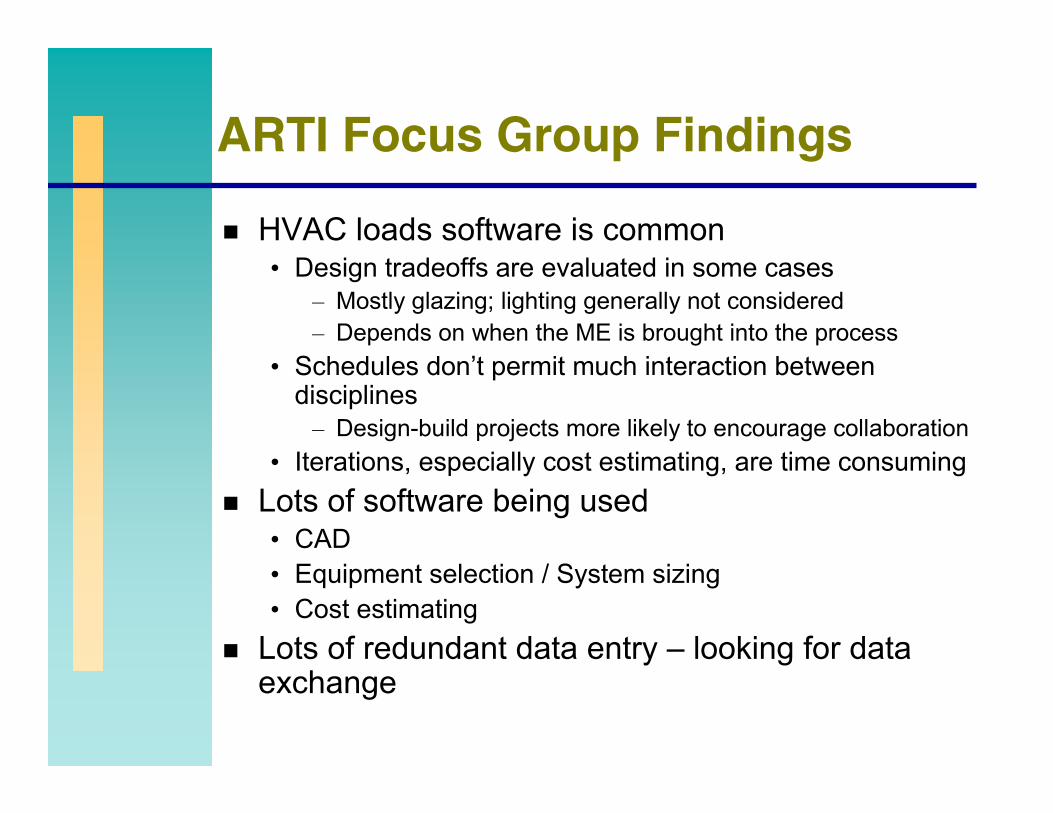
ARTI Focus Group Findings
HVAC loads software is common• Design tradeoffs are evaluated in some cases
– Mostly glazing; lighting generally not considered– Depends on when the ME is brought into the process
• Schedules don’t permit much interaction between disciplines– Design-build projects more likely to encourage collaboration
• Iterations, especially cost estimating, are time consumingLots of software being used• CAD • Equipment selection / System sizing• Cost estimating
Lots of redundant data entry – looking for data exchange
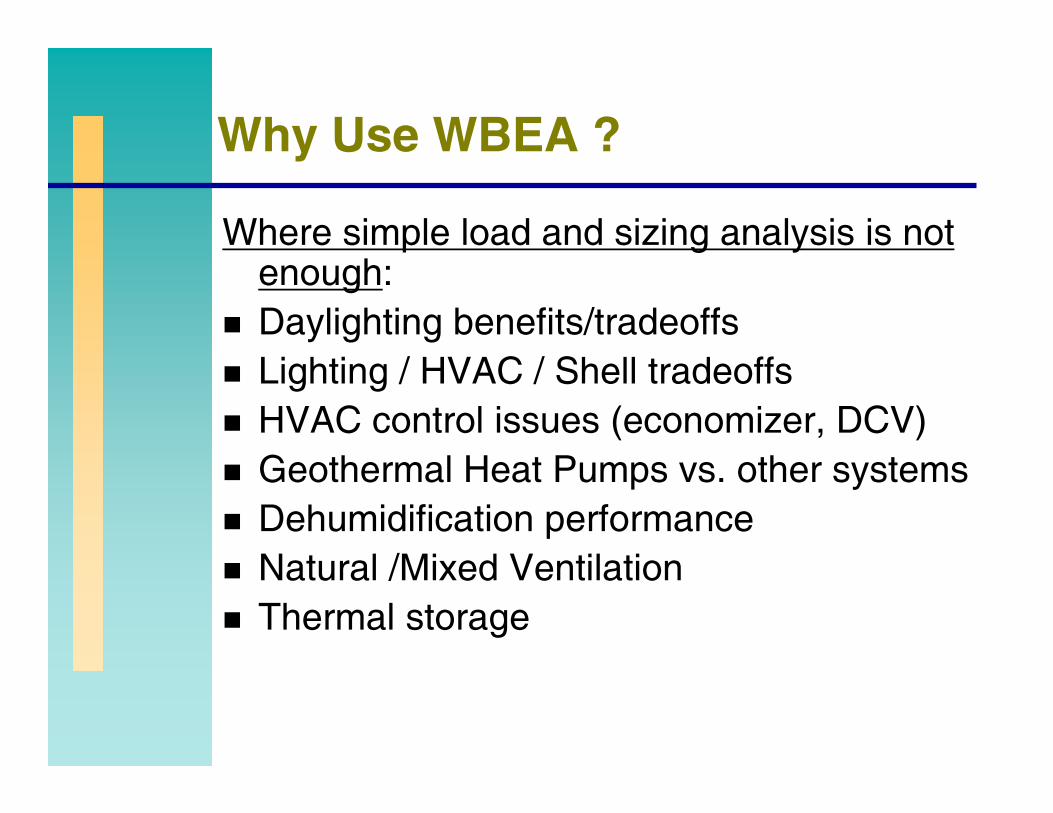
Why Use WBEA ?
Where simple load and sizing analysis is not enough:Daylighting benefits/tradeoffsLighting / HVAC / Shell tradeoffsHVAC control issues (economizer, DCV)Geothermal Heat Pumps vs. other systemsDehumidification performanceNatural /Mixed VentilationThermal storage
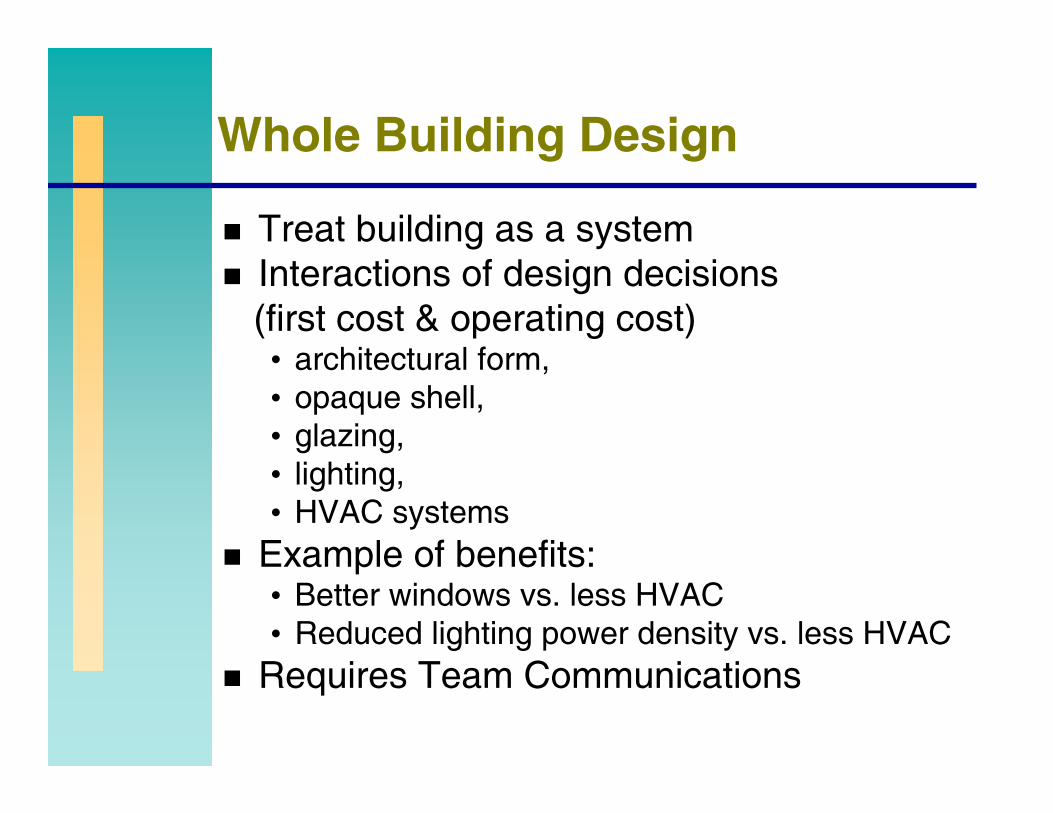
Whole Building Design
Treat building as a systemInteractions of design decisions (first cost & operating cost)• architectural form, • opaque shell,• glazing,• lighting,• HVAC systems
Example of benefits:• Better windows vs. less HVAC• Reduced lighting power density vs. less HVAC
Requires Team Communications
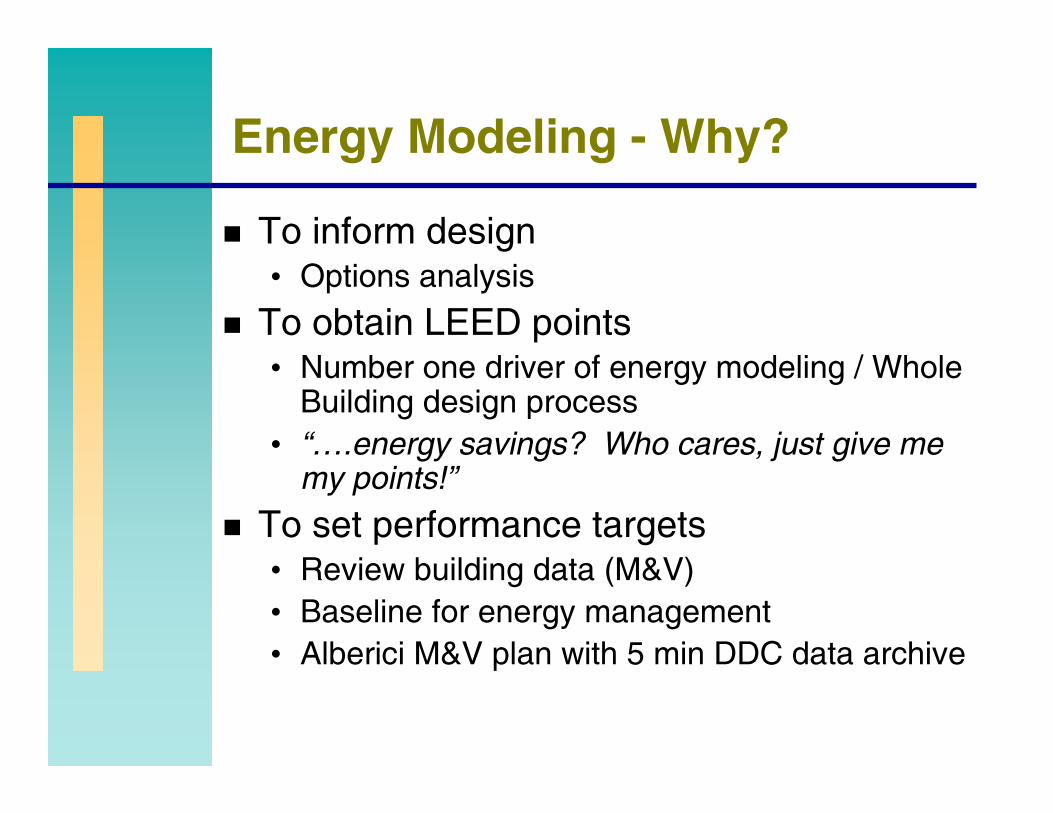
Energy Modeling - Why?
To inform design• Options analysis
To obtain LEED points• Number one driver of energy modeling / Whole
Building design process• “….energy savings? Who cares, just give me
my points!”To set performance targets• Review building data (M&V)• Baseline for energy management• Alberici M&V plan with 5 min DDC data archive
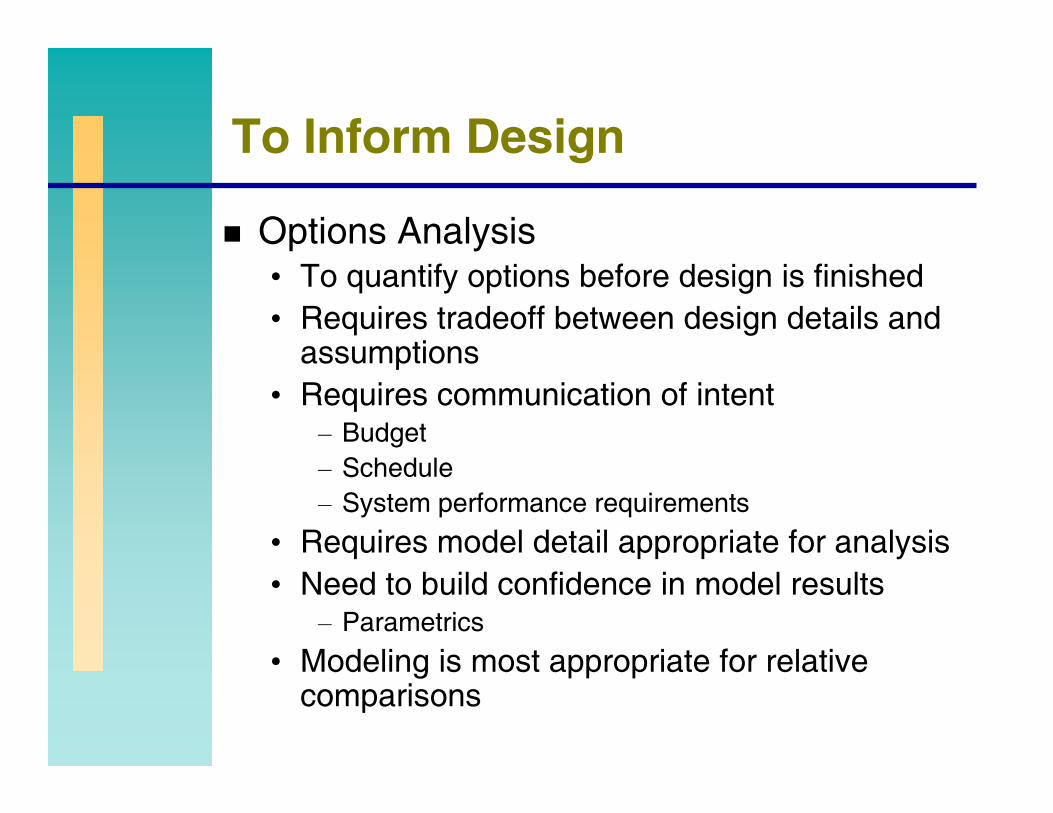
To Inform Design
Options Analysis• To quantify options before design is finished• Requires tradeoff between design details and
assumptions• Requires communication of intent
– Budget– Schedule– System performance requirements
• Requires model detail appropriate for analysis• Need to build confidence in model results
– Parametrics• Modeling is most appropriate for relative
comparisons
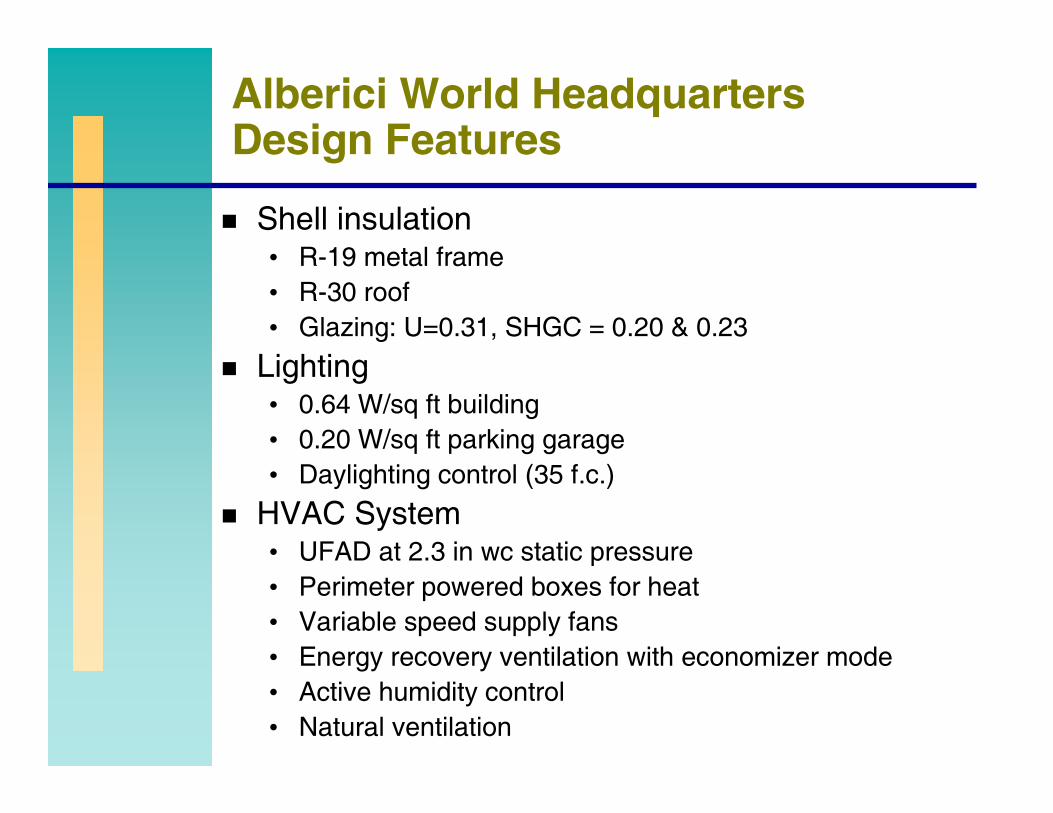
Alberici World HeadquartersDesign Features
Shell insulation• R-19 metal frame• R-30 roof• Glazing: U=0.31, SHGC = 0.20 & 0.23
Lighting• 0.64 W/sq ft building• 0.20 W/sq ft parking garage• Daylighting control (35 f.c.)
HVAC System• UFAD at 2.3 in wc static pressure• Perimeter powered boxes for heat• Variable speed supply fans• Energy recovery ventilation with economizer mode• Active humidity control• Natural ventilation
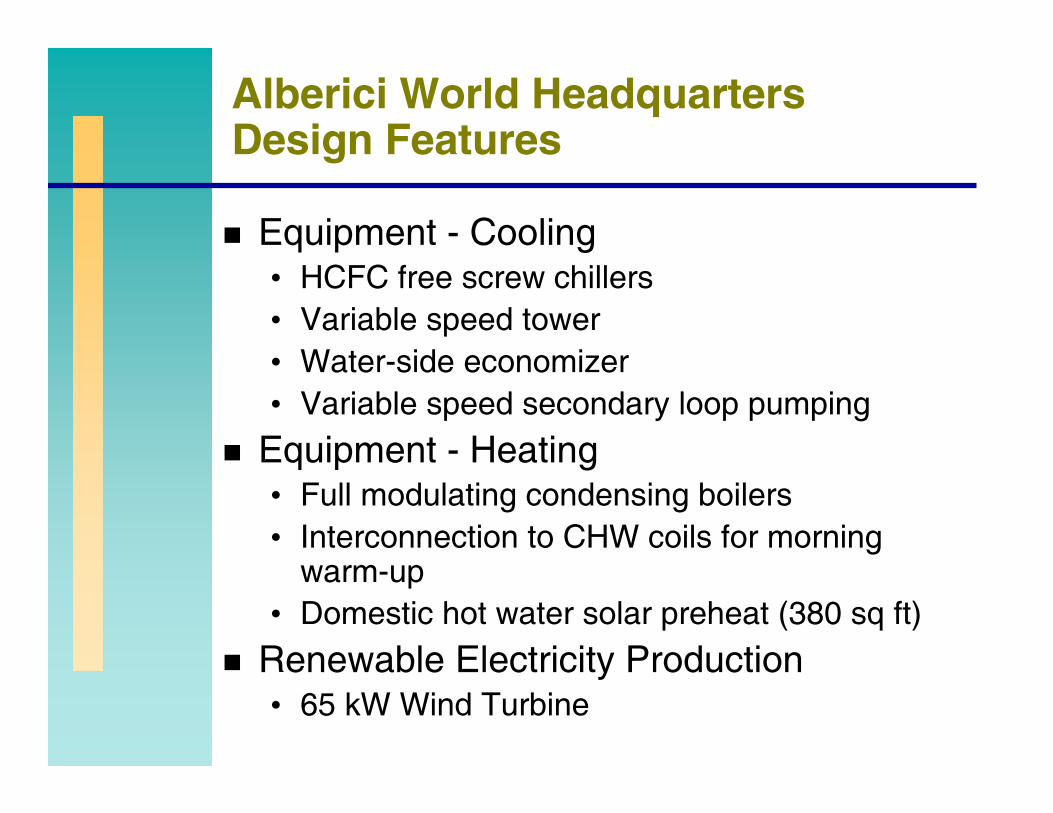
Alberici World HeadquartersDesign Features
Equipment - Cooling• HCFC free screw chillers• Variable speed tower• Water-side economizer• Variable speed secondary loop pumping
Equipment - Heating• Full modulating condensing boilers• Interconnection to CHW coils for morning
warm-up• Domestic hot water solar preheat (380 sq ft)
Renewable Electricity Production• 65 kW Wind Turbine
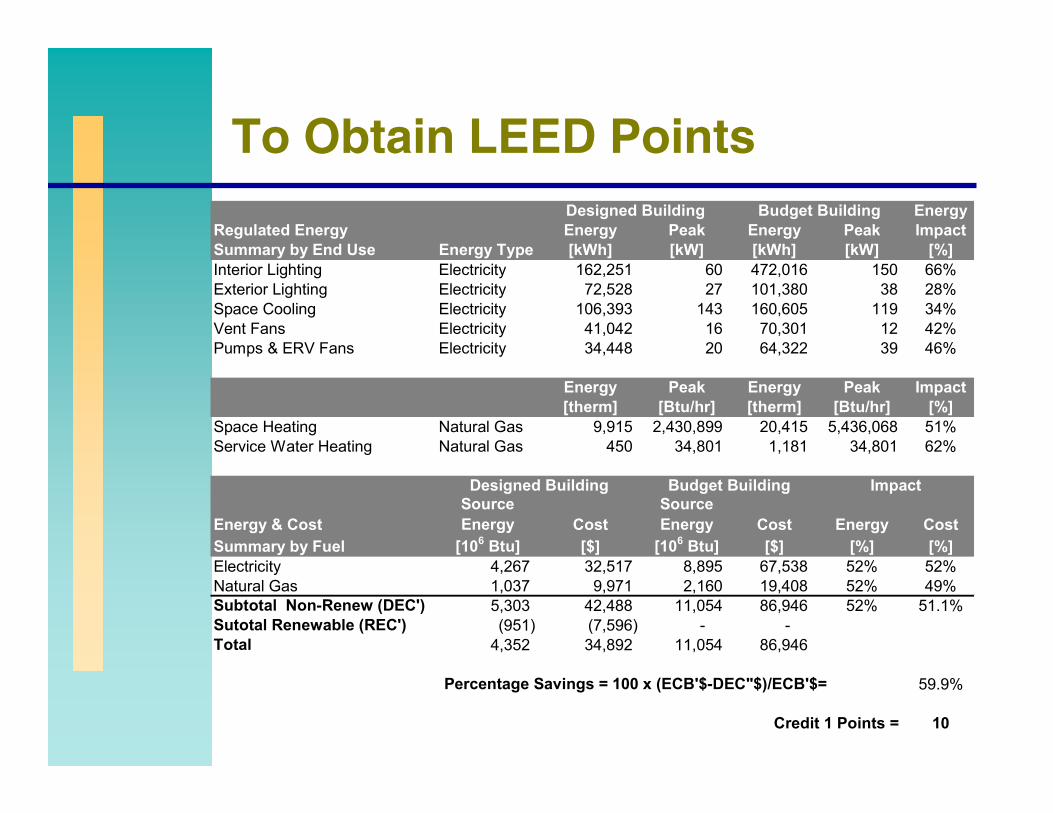
To Obtain LEED PointsEnergy
Regulated Energy Energy Peak Energy Peak ImpactSummary by End Use Energy Type [kWh] [kW] [kWh] [kW] [%]Interior Lighting Electricity 162,251 60 472,016 150 66%Exterior Lighting Electricity 72,528 27 101,380 38 28%Space Cooling Electricity 106,393 143 160,605 119 34%Vent Fans Electricity 41,042 16 70,301 12 42%Pumps & ERV Fans Electricity 34,448 20 64,322 39 46%
Energy Peak Energy Peak Impact[therm] [Btu/hr] [therm] [Btu/hr] [%]
Space Heating Natural Gas 9,915 2,430,899 20,415 5,436,068 51%Service Water Heating Natural Gas 450 34,801 1,181 34,801 62%
Energy & CostSource Energy Cost
Source Energy Cost Energy Cost
Summary by Fuel [106 Btu] [$] [106 Btu] [$] [%] [%]Electricity 4,267 32,517 8,895 67,538 52% 52%Natural Gas 1,037 9,971 2,160 19,408 52% 49%Subtotal Non-Renew (DEC') 5,303 42,488 11,054 86,946 52% 51.1%Sutotal Renewable (REC') (951) (7,596) - - Total 4,352 34,892 11,054 86,946
Percentage Savings = 100 x (ECB'$-DEC"$)/ECB'$= 59.9%
Credit 1 Points = 10
Designed Building Budget Building
Designed Building Budget Building Impact
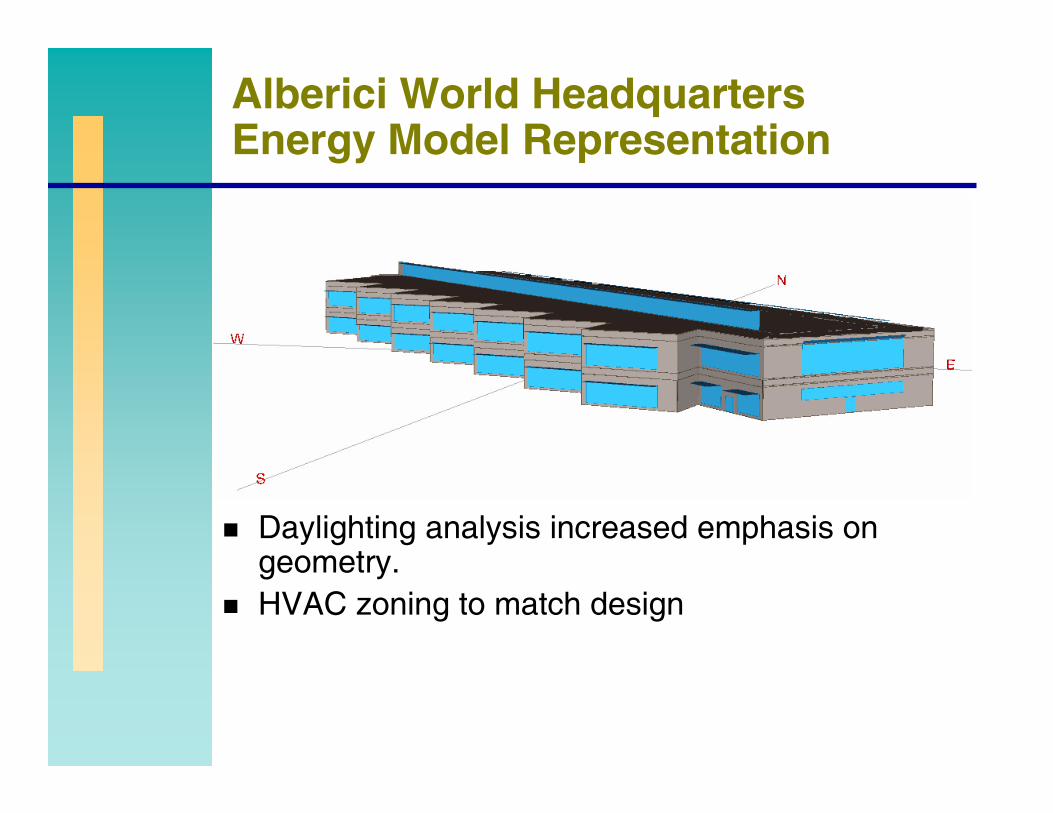
Alberici World HeadquartersEnergy Model Representation
Daylighting analysis increased emphasis on geometry.HVAC zoning to match design
Energy Management• Whole Building• Systems & Equipment Performance
Model calibration vs system performance• Schedules• Operating parameters• Performance curves
M&V plan closes loop to verify performanceRequires building operational data and analysis• Alberici M&V plan with 5 min DDC data archive
To Set Performance Targets
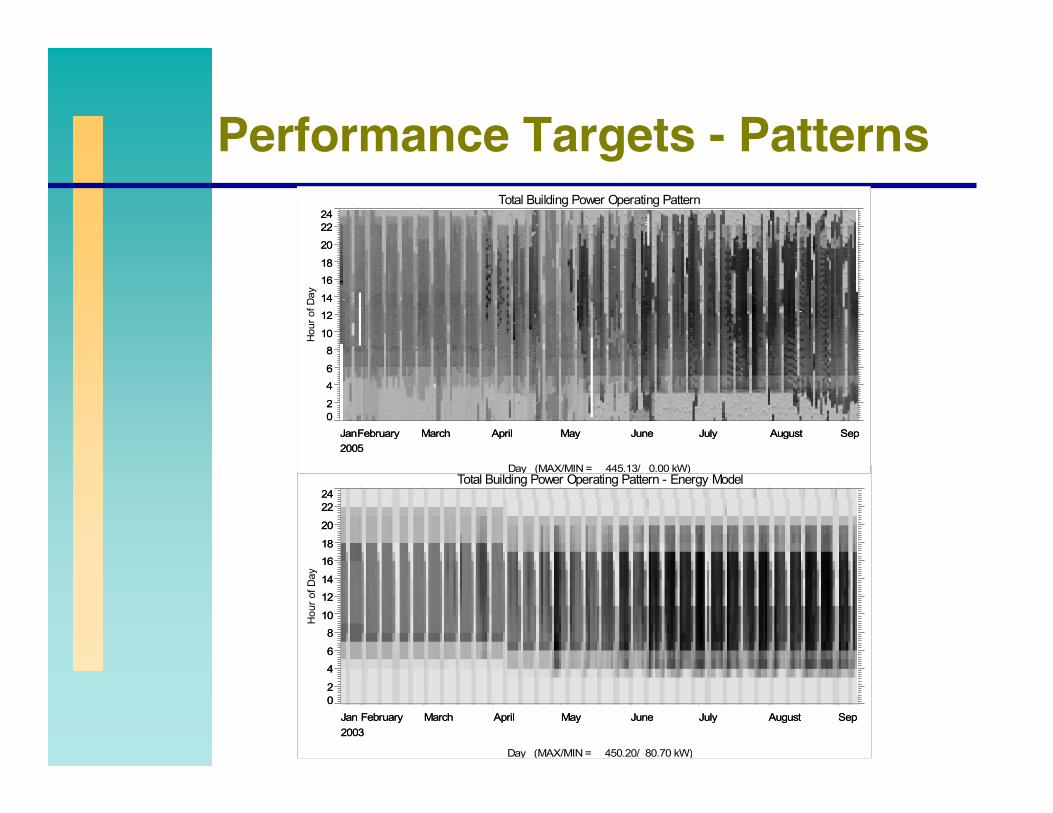
Performance Targets - Patterns
Total Building Power Operating Pattern - Energy Model
Day (MAX/MIN = 450.20/ 80.70 kW)
Jan February March April May June July August Sep2003
02
4
6
8
10
12
14
16
18
20
2224
Hou
r of D
ay
Jan February March April May June July August Sep2003
02
4
6
8
10
12
14
16
18
20
2224
Total Building Power Operating Pattern
Day (MAX/MIN = 445.13/ 0.00 kW)
JanFebruary March April May June July August Sep2005
02
4
6
810
12
14
16
18
20
2224
Hou
r of D
ay
JanFebruary March April May June July August Sep2005
02
4
6
810
12
14
16
18
20
2224
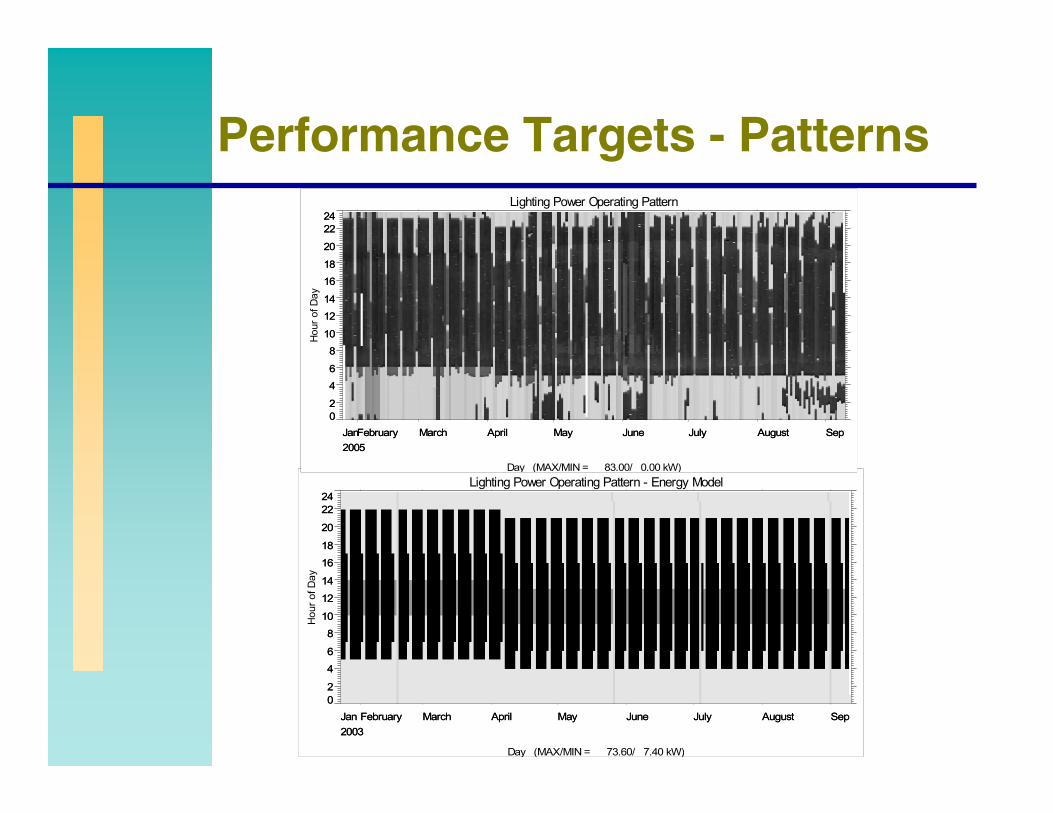
Performance Targets - Patterns
Lighting Power Operating Pattern - Energy Model
Day (MAX/MIN = 73.60/ 7.40 kW)
Jan February March April May June July August Sep2003
02
4
6
8
10
12
14
16
18
20
2224
Hou
r of D
ay
Jan February March April May June July August Sep2003
02
4
6
8
10
12
14
16
18
20
2224
Lighting Power Operating Pattern
Day (MAX/MIN = 83.00/ 0.00 kW)
JanFebruary March April May June July August Sep2005
02
4
6
8
10
12
14
16
18
20
2224
Hou
r of D
ay
JanFebruary March April May June July August Sep2005
02
4
6
8
10
12
14
16
18
20
2224
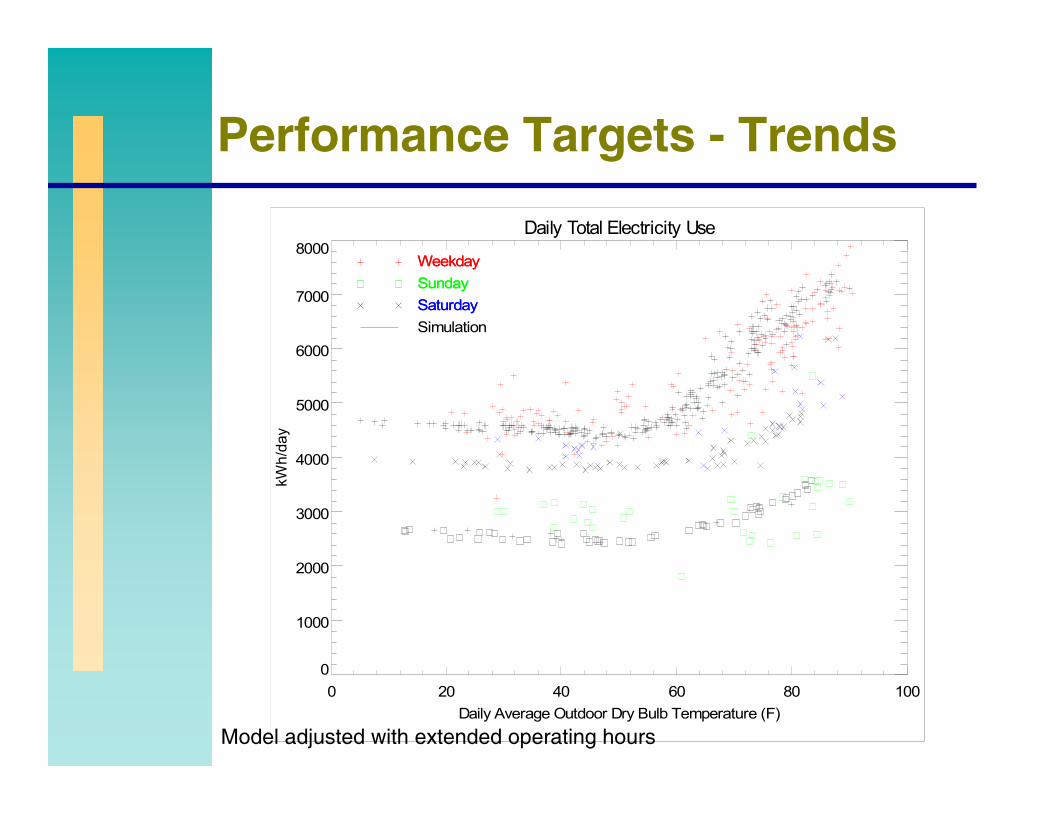
Performance Targets - Trends
Daily Total Electricity Use
0 20 40 60 80 100Daily Average Outdoor Dry Bulb Temperature (F)
0
1000
2000
3000
4000
5000
6000
7000
8000
kWh/
day
WeekdaySundaySaturday
WeekdaySundaySaturdaySimulation
Model adjusted with extended operating hours
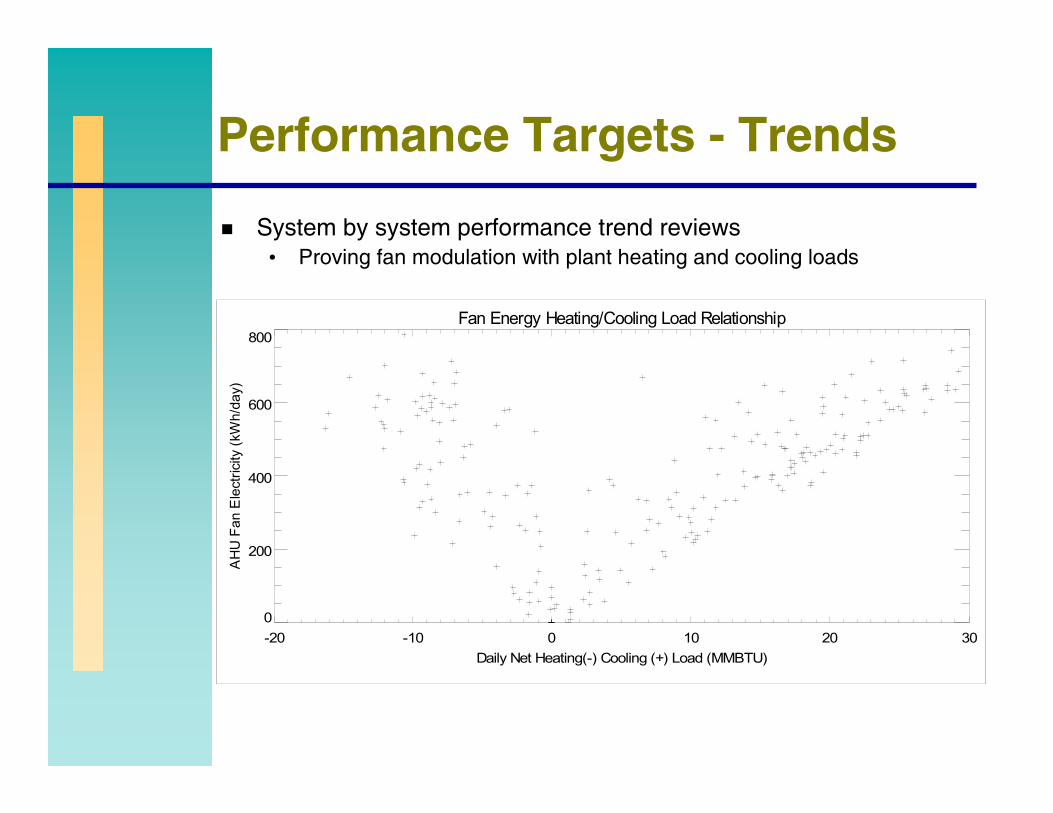
Performance Targets - Trends
System by system performance trend reviews• Proving fan modulation with plant heating and cooling loads
Fan Energy Heating/Cooling Load Relationship
-20 -10 0 10 20 30Daily Net Heating(-) Cooling (+) Load (MMBTU)
0
200
400
600
800
AH
U F
an E
lect
ricity
(kW
h/da
y)
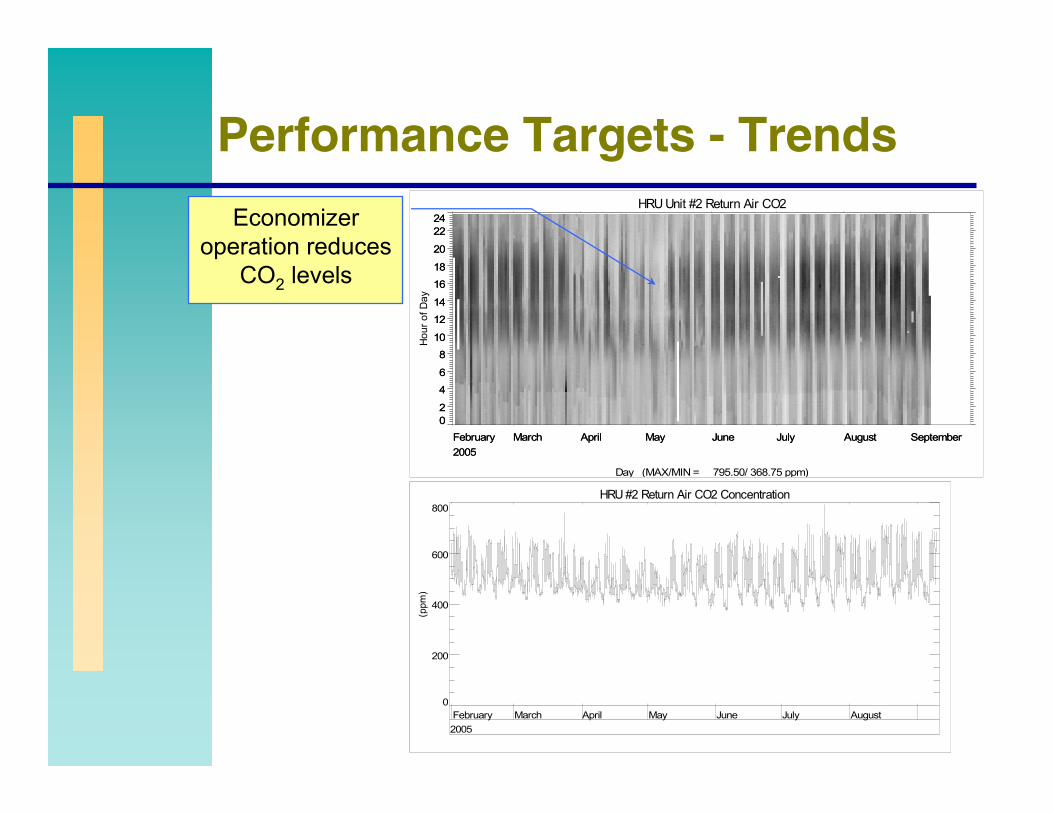
Performance Targets - Trends
HRU #2 Return Air CO2 Concentration
February March April May June July August2005
0
200
400
600
800
(ppm
)
HRU Unit #2 Return Air CO2
Day (MAX/MIN = 795.50/ 368.75 ppm)
February March April May June July August September2005
02
4
6
8
10
12
14
16
18
20
2224
Hou
r of D
ayFebruary March April May June July August September2005
02
4
6
8
10
12
14
16
18
20
2224Economizer
operation reduces CO2 levels
Summary – Effective Modeling
Adds value by integrating energy simulation into design process• Options analysis• Model informs the design
Goes beyond modeling for points• Modeling alone does not improve efficiency
Provides a tool for energy management• Baseline / Performance Targets
– Whole building– System– Equipment– Sequence of Operations
• Close the loop – data informs the model• Build confidence in the process – ready for next project