Embed Size (px)
Citation preview
Psychophysiology, 33 (1996), 175-183, Cambridge University Press, Printed in the USA,Copyright © 1996 Society for Psychophysiological Research
MKTHODOLOGY
Effect sizes and p values: What should bereported and what should be replicated?
ANTHONY G. GREENWALD,' RICHARD GONZALEZ,'RICHARD .1. HARRIS,*^ AND DONALD"Department of Psychology, University of Washington, Seattle, USA''Department of Psychology, University of New Mexico, Albuquerque, USA'Department of Psychiatry, University of California, Los Angeles, USA
Abstract
Despite publication of many well-argued critiques of null hypothesis testing (NHT), behavioral science research-ers continue to rely heavily on this set of practices. Although we agree with most critics' catalogs of NHT's flaws,this article also takes the unusual stance of identifying virtues that tnay explain why NHT continues to be so exten-sively used. These virtues include providing results in the form of a dichototnous (yes/no) hypothesis evaluationand providing an index (/; value) that has a justifiable tnapping onto confidence in repeatability of a null hypoth-esis rejection. The most-criticized flaws of NHT can be avoided when the importance of a hypothesis, rather thanthep value of its test, is used to determine that a finding is worthy of report, and when/;= ,05 is treated as insuf-ficient basis for confidence in the replicability of an isolated non-null finding. Together with many recent criticsof NHT, we also urge reporting of important hypothesis tests in enough descriptive detail to permit secondaryuses such as meta-analysis.
Descriplors: Replication, Statistical significance. Null hypothesis testing. Methodology
To demonstrate that a natural phenomenon is experimentally detnonstra-ble, we need, not an isolated record, but a reliable method of ptocedurc.In relation to the test of significance, we may say that a phenotiienonis experimentally demonstrable when we know how to conduct an exper-iment |that| will rarely fail to give us a statistically significant result,(Fisher, 1951, p, 14)
Readers of research reports reasonably desire confidence thatpublished results constitute what Fisher called "demonstrable"phenomena —ones that can be confidently reproduced by con-scientious and skilled researchers. Such confidence is question-able for the class of isolated findings-ones that are not yet
supported by replications. Isolated findings are likely to occureither in initial empirical tests of novel hypotheses or as unpre-dicted results frotn exploratory analyses of data.
An isolated finding might be judged as demonstrable (inFisher's sense) if its empirical support suggests that it can be rep-licated. Before being able to discuss the relation of empirical evi-dence to a conclusion about an isolated finding's replicability,it is necessary to clarify what is meant by a finding being repli-cated or replicable. This, in turn, requires a choice between twoapproaches to conceiving replication: the choice between con-sidering the tneaning of replication in the context of null hypoth-esis testing (NHT)' versus estimation.
Preparation of this report was aided by National Science Founda-tion grants DIK-9205890, SFS-9110572, and SBR-9422242, and byNational Institute of Mental Health grant MH-41328,
We thank J, Scott Artnstrong, David Bakan, Ronald P, Carver,Jacob C ohen, Alice Fagly, 1 ynne Edwards, Robert lYick, Gideon Keren,Lester Krueger, Fred I eavitt, Joel R, Levin, Clifford 1 unneborg, DavidLykken, Paul F, Meehl. Ronald C, Serlin, Bruce Thompson, DavidWeiss, and this journal's reviewers for cotnments on an earlier draft.Although these comments helped greatly in sharpening and clarityingargutnents, the article's subject inatter regrettably affords no unitormconsensus, so the final version contains assertions that will be unaccept-able to some commenters.
Address reprint requests to: Anthony G, Greenwald at Departmentof Psychology, Box 351525, University of Washington, Seattle, WA98195-1525, USA, E-mail: agg@u,Washington,edu.
Editor's note. This paper was invited by the Board of Editors of Psy-chophy.siology to address standards for reporting data and replicationin psychophysiological research. The perspectives that were developedare not specific to psychophysiological data but rather apply to the anal-ysis and interpretation of various forms of empirical data. Although theauthors' recommendations regarding statistical tiiethodology tnight beregarded as controversial, it is our hope that the examples and recom-mendations oftered in thi,s article will locus attention on important issuesconcerning replicability in the field.
' What is called null hypothesis testing here is called null hypothesissignificance testing or simply significance testing elsewhere. The labelsignificance is deliberately minimized in this article because some of themost objectionable characteristics of NHT stem from misleading usesof that word, which have developed in association with NHT,
175
176 A.G. Greenwald et al.
In the NHT context, two statistical tests can be said to rep-licate one another when they support the .same conclusion (non-rejection or rejection in a specific direction) with respect to thesame null hypothesis,' In contrast, in the estimation contexttwo point or interval estimates are said to replicate one anotherwhen they meet some criterion of proximity (e.g., overlap ofconfidence intervals). These two meanings of replication in theNHT and estimation contexts are so divergent that it does notappear to be possible to discuss replication coherently in a gen-eral fashion that encompasses both. Although the estimationapproach to data analysis and reporting is often preferable toNHT, nevertheless it was easy to choose NHT as the perspec-tive on which to focus in this article. The choice was determinedboth because of NHT's prevalence in published empirical reportsand because the problem of interpreting isolated findings is onethat arises especially in the context of NHT,
As will be seen below, there is a large literature of authori-tative attacks against NHT, Because there has been relatively lit-tle published defense of NHT in response to those attacks, it isremarkable that NHT nevertheless remains virtually uncontestedin its dominance both of texts used in basic behavioral sciencestatistics courses and of journals that publish original behavioralscience empirical reports. As will be seen, the paradox of thisopposition between pundits and practitioners has motivatedmuch of this article, which is organized into three sections. Thefirst section surveys some well-established criticisms of NHT,The second section describes some virtues of NHT that mayexplain why it remains so popular in the face of sustained heavycriticism. The third section gives recommendations for usingNHT in a way that minimizes its flaws while sustaining its virtues.
Criticism of Null Hypothesis Testing (NHT):Three Severe Haws
Because the \uU Hypothesis Is "Quasi-Always" False,Testing It Is UninformativeIn comparing psychology with physics, Meehl (1967; see also1978) noted that, because of the complexity of influences onmeasures used in psychological research, psychologists' nullhypotheses are almost never exactly true. As Meehl describedit, "the point-null hypothesis , , . is [quasi-] always false in bio-logical and social science" (p, 108). Furthermore, empirical testsusually associate the researcher's preferred theoretical predic-tion with a rejection ofthe null hypothesis. It follows from thequasi-falsity assumption that, when the researcher's theory isincorrect or irrelevant, there may nevertheless be a good chancethat an empirical test will yield a null hypothesis rejection in thepredicted direction. That is, assuming quasi-falsity, the nullhypothesis should be false in an incorrect or irrelevant theory'spredicted direction half of the time, and possibly more, if thisdirection is plausible from multiple theoretical perspectives.Therefore, the probability that an incorrect or irrelevant theorywill be supported by a prediction-confirming null hypothesisrejection approaches SO o (or more) as the test's power increases,Meehl contrasted this analysis of spurious confirmation of theoryresulting from increased research power in psychology with adescription of statistical practice in physics. In physics, Meehl
'This concept of replication in the NHT context is given a more for-mal definition below.
observed, statistics are used chiefly to estimate theory-specifiedparameter values from empirical data. In this context of esti-mation (rather than NHT), increased power yields increasedprecision and in turn reduces the likelihood of spurious theoryconfirmations.
In the fashion just described, Meehl targeted NHT as a meth-odological culprit responsible for spurious theoretical conclu-sions. Although similar observations had been made previouslyby (at least) Nunnally (1960), Binder (1963), and Edwards (1%5)and although other analysts have argued that the psychology-versus-physics comparison is not so unfavorable to psychology(Hedges, 1987; Serlin & Lapsley, 1993), Meehl's critique nev-ertheless attracted great attention and continues to be cited asan authoritative statement ofthe view that NHT is fundamen-tally flawed because psychological null hypotheses are virtuallynever true.
NHT Doesn't Tell Researchers WhatThey Want to KnowSeveral critics have pointed out that the information thatresearchers should most want to learn from research findingsis not, and cannot, be provided by NHT, In particular, NHTdoes not establish the degree of truth or belief that can be cred-ited to the null hypothesis (Gigerenzer & Murray, 1987; Oakes,1986; Rozeboom, I960), NHT does not offer an estimate ofthemagnitude of a treatment effect or of a relationship betweenvariables (Cohen, 1994; Rosenthal, 1993), And NHT does notprovide the probability that a finding can be replicated (Ciigercn-zer& Murray, 1987; Lykken, 1968; Rosenthal, 1991), Rather,the p value provided by NHT gives only a measure of the prob-ability of results as extreme as (or more extreme than) theobtained data, contingent on the truth of the null hypothesis,"*
NHT Is Biased Against the Null HypothesisA very familiar cotnmcnt about NHT is that it permits only oneconclusive direction of interpretation, that is, against the nullhypothesis. The folklore of the field has it that "You can't provethe null hypothesis," In terms of this folklore, what you can dois reject the null hypothesis and conclude that it is wrong, or youcan fail to reject the null hypothesis and thereby be left uncer-tain about its truth. This folkloric assertion is somewhat mis-leading because it implies, incorrectly, that point hypothesesother than the null hypothesis can be proved. More properly,any point hypothesis (null or otherwise) has equal status inregard to provability. None is provable by the methods of NHT,Generally neglected in this debate is the possibility that, by usingBayesian or estimation methods, any hypothesis (including thenull) can gain considerable credibility (see, e,g,, CJoodman andRoyall, 1988; Greenwald, 1975), Nevertheless, there is indeedan asymmetry between the null and alternative hypotheses inNHT, which can be described as follows,
A null hypothesis rejection discredits the null hypothesis andthereby supports alternative hypotheses, but a nonrejectionresult does not correspondingly support the null hypothesis and
'Although Meehl's description of the pervasive falsity of psycholog-ical point null hypotheses continues to have force, Frick (1995) recentlypointed out that there are important cases of psychological research forwhich it is reasonable to treat the point null hypothesis as true,
•"In the second section of this article, it is shown that this assertionunderstates the information provided by /; values.
Effect sizes and p values 177
discredit alternatives. There are several reasons for this asym-metry, including (a) the null is typically a point hypothesis,whereas the alternative is typically a set or range of hypotheses;(b) when used in the Neyman-Pearson decision form, proba-bility of Type 2 error (falsely accepting the null) typically exceedsthat of Type 1 error (falsely rejecting the null); and (c) perhapsmost importantly, nonrejection ofthe null hypothesis is consid-ered to result plausibly from the researcher's use of invalid re-search operations,
Greenwald (1975) investigated these and other fortns of prej-udice against the null hypothesis by conducting a survey ofresearchers' practices and by constructing a simulation modelof the effects of these practices on information transmissioncharacteristics ofthe research-publication system (see also Oakcs,1986, chapter 1). One ofthe tnore important varieties of preju-dice against the null hypothesis identified in that review comesabout as a consequence of researchers much more often identi-fying their own theoretical predictions with rejections (ratherthan with acceptances) of the null hypothesis. The consequenceis an ego involvement with rejection ofthe null hypothesis thatoften leads researchers to interpret null hypothesis rejections asvalid confirmations of their theoretical beliefs while interpret-ing nonrejections as uninformative and possibly the result offlawed methods. Consistent with this conception of researcherbias, Greenwald's (1975) survey of 75 active social psychologi-cal researchers revealed that nonrejections ofthe null hypothesisare reported as being much less likely (than null hypothesis rejec-tions) to be submitted for publication (1:8 ratio).
Another sense in which NHT is biased against the nullhypothesis is captured by the concept of alpha inflation. It is wellunderstood that p values become inaccurate when multiple nullhypothesis tests are conducted sinutltaneously (e,g,. Miller,1981; Sclvin & Stuart, 1966), As a tninimal exatnple, when anexperiment includes two independent tests of the .same hypoth-esis, the probability that at least one of them will achieve ana < ,05 criterion, conditional on truth of the null hypothesis,is not ,05 but apptoxitnately ,10 ( s I - ,95"^), When multiplenull hypothesis tests are conducted, but not all are reported-as when one reports only null hypothesis rejections from mul-tiple tests conducted in a single study, or when one publishesonly studies that achieved null hypothesis rejections frotn a scriesof,studies-the inflation ofthe reported (nomitial)/» value hasbeen ignored and the reported value is therefore patently mis-leading. Despite the known impropriety of this practice, ignor-ing alpha inflation nevertheless remains a common practice, onethat clearly reveals bias against the null hypothesis.
Why Does NHT Remain Popular? Three Reasons
In summary of the preceding section, NHT is multiply misused.In highly powerful studies, null hypothesis rejection is a virtualcertainty. Null hypothesis rejections arc likely to be overintcr-preted as theory confirmations. Null hypothesis tests are mis-interpreted as providing information about the plausibility ofthe null hypothesis. Null hypothesis tests fail to provide the typeof information that researchers want most to obtain. In use,NHT is biased toward rejection of the null hypothesis. All ofthese practices render NHT ptone to faulty conclusions thatleave readers of research reports, not to tncntion the NHT-usingresearchers themselves, misinformed about the etnpirical statusof hypotheses under investigation. Nevertheless, and despite re-peated and prominent publication of critiques of NHT that have
established these anti-NHT conclusions, behavioral scientistsappear not to have been deflected from sustained heavy use ofNHT,
One is tempted to conclude that NHT is an addictive afflic-tion of behavioral scientists. Despite repeated admonitions aboutits harmful effects, re,searchers not only sustain the behaviorof NHT but practice it at the increasing pace afforded by mod-ern computational technology. Perniciously, the harmful ef-fects of using NHT may be felt more by audiences who see prod-ucts of NHT's practice than by the practicing users themselves,who experience the benefit of an occasional joyous rush towardpublication.
The metaphor of the NHT user as an addict may be clever,but it must also be, if not simply inaccurate, at least very incom-plete. This conclusion comes partly from observing the absenceof impact of NHT-critical literature. This critical literature hasbeen appearing steadily and with relatively little published oppo-sition for more than 30 years. An indicator of the balance ofintellectual firepower on the NHT topic can be obtained bycounting pro-NHT versus anti-NHT publications in prominentjournals. This test indicates a heavy anti-NHT majority. Carver(1993) commented: "During the past 15 years, I have not seenany compelling arguments in defense of statistical significancetesting" (p, 287), A prospective test of the present balance ofauthoritative opinion can be obtained by watching to seewhether Cohen's (1994) recent and very prominent broadsideagainst NHT elicits any substantial public defense of NHT,
Despite sustained and consistent expert opposition, NHT per-sists as a dominant practice among behavioral scientists. In addi-tion, introductory behavioral science statistics courses persist inusing texts that are based on NHT, An especially ironic indica-tor of the lack of impact of anti-NHT critiques occurs in theform of etnpirical publications by authors of NHT critiques(including one of the present authors), published after the ap-pearance of their critiques. Not invariably, but nevertheless veryfrequently, these publications reveal extensive use of NHT (e.g.,Ambady & Rosenthal, 1993; Eckert, Halmi, Marchi, & Cohen,1987; Greenwald, Klinger, & Schuh, 1995; Hell, Gigerenzer,Gauggel, Mall, & Muller, 1988; Lykken, McGue, Bouchard, &Tellegen, 1990), Even in a journal for which a prominent edi-torial "discouraged" the use of NHT (Loftus, 1993, p, 3), e.xam-ination of the most recent issues indicated use of NHT in everyempirical article.
Why does NHT not succumb to criticistn? For lack of a bet-ter answer, it is tetnptitig to credit the persistence of NHT tobehavioral scientists' lack of character. Behavioral scientists'unwillingness to renounce the guilty pleasure of obtaining pos-sibly spurious null hypothesis rejections may be like a drinker'sunwillingness to renounce the habit of a pre-dinner cocktail.
Now for a change of pace. In contrast to the despairingaddiction metaphor that has been developed above, the follow.,ing paragraphs argue that NHT survives because it provides twoadvantages to its users: (a) a dichotomous outcotne that can beused as the basis for making needed decisions and (b) a mea-sure of confidence in the outcome of a study. The assertion thatNHT has these two desirable properties requires reconsiderationof two of the anti-NHT criticisms that were described in the firstsection of this article.
Reason I: HT Provides a Dichotomous OutcomeBecause of widespread adoption of the convention that p < .05translates to "statistically significant," NHT can be used to yield
178 A.G. Greenwald et al.
a dichotomous answer (reject or don't reject) to a question abouta null hypothesis. This may often be regarded as a useful answerfor theoretical questions that are stated in terms of a directionof prediction rather than in terms of the expected value of aparameter, (Estimation is clearly the preferred method for thelatter case,) Examination of published empirical reports in mostareas of behavioral science reveals that theory-based hypothesesare very often stated in terms of the direction (and without spec-ifying the magnitude) of a difference between treatments or ofa relationship between variables, (Such an observation wasessential to Meehl's [1967] critique, and the observation contin-ues to be valid,) For these directional predictions, methods thatyield answers in continuous form (such as effect size estimatesor Bayesian estimates of posterior likelihoods of hypotheses)may be unsatisfying,'
An argument for the desirability of dichotomous researchoutcomes is not to be found in purely statistical reasoning. Rather,this virtue derives from the inescapable need of humans to act -more precisely, to choose between alternative potential paths ofaction. The following questions hint at the wide variety of sit-uations for which an answer in the form of yes versus no, or goversus no-go, is more valuable than one that, although possiblymore informative statistically, is equivocal with respect to action,
• Is this treatment superior to a placebo?
• Does this experimental procedure constitute an effectivemanipulation of my independent variable (or do 1 need to lookfor an alternative)?
• Is the predictive validity of this aptitude test sufficient so thatI should add it to the battery used to make my hiring or admis-sions decision?
• Is the similarity between monozygotic twins on this traitgreater than that between dizygotic twins?
• Is there a match between this defendant's DNA and thatfound at the scene of the crime?
Even though it is not a behavioral scientist's question, this lastquestion, perhaps more than any of the others, justifies theassertions that (a) a point null hypothesis can sometimes be true,and (b) there can be a compelling practical need to convert astatistic's value on some continuous numerical dimension intoa yes-no decision. In turn, this observation makes clear thatdichotomous outcomes are not an intrinsic property of any sta-tistical test but only of the way in which the test is interpretedby its users. In the case of behavioral sciences, the widespreaduse of NHT as a basis for decisions depends on the willingnessof a research community to treat some agreed-on p value as theboundary for deciding how to act on an empirical result.
'An almost reflexive response to this assertion by an estimationadvocate could be: "Yes, but the estimation method of computing con-fidence intervals provides the advantages of estimation while also per-mitting a dichotomous judgment on the data," To that response, we canonly reply "Amen." The recommendations offered in the third sectionof this article urge uniform reporting of estimation statistics to accom-pany NHT.
Reason 2: p Value as a Meaningful Common-Language Translation for Test StatisticsComputed /; values provide a well-established common trans-lation for a wide variety of statistics used in NHT. The transla-tion to p value is produced in the routine operation of manycomputerized procedures for calculating /, F, r, 0, x^, andother familiar statistics. As a consequence, most researchersaccumulate far more numerical experience with p values thanwith the various statistics that are so translated. Furthermore,p values have an informal, intuitive interpretation that is farmore readily perceived frotn the report of a test outcotne inp value form than from its report in an unconverted two-dimen-sional metric that combines degrees of freedom with / or F o rr, and so on. In its informal interpretation, the p value is anapproximate measure of how surprised we should be by a resultwhen we assume that the theoretical or other basis for predict-ing it is nonsense. Unlike anything that can be perceived sodirectly from /, F, or r values (with their associated df),ap val-ue's measure of surprise is simply captured by the number ofconsecutive zeros to the right of its decimal point, A result withtwo or more leading zeros in its p value is not easy to dismiss,no matter how misguided its underlying rationale appears to be.
Reason 3: p Value Provides a Measure of Confidence""in Replicability of Null Hypothesis RejectionsThe published anti-NHT literature is a source of many assertionsabout the lack of justification for interpreting p values in anyof several ways that suggest their providing a continuous mea-sure oi f,ome interesting property of re,search outcomes. Theseassertions are often contestably accurate. In particular, as theinvestigators cited in the following list and others have pointedout, /7 values (more properly, their completnents) should not beinterpreted as (a) the probability that the null hypothesis is false(e.g,, Cohen, 1994; Oakes, 1986), (b) the probability that thetheory that motivated the empirical test is correct (e.g., Meehl,l%7), (c) the probability that an exact replication will repeat theoriginal finding (Carver, 1978, p. 385; Gigerenzer & Murray,1987, p, 24), or (d) a measure of any parameter of the popula-tion from which subjects were sampled (Bakan, 1966, p, 428),
Although p values are not legitimately interpreted in any ofthe ways just listed, one can also find authoritative assertionsthat p values do provide continuous measures of some aspectof confidence that can be placed in research findings. The fol-lowing are some examples,
|S|urely, Ciod loves the ,06 nearly as much as the ,05, Can there be anydoubt that God views the strength of evidence for or against the nullas a fairly continuous function of the magnitude of pi (Rosnow &Rosenthal, 1989, p, 1277)
[Editors must make] a judgment with respect to confidence to be placedin the findings-confidence that the results of the experiment would berepeatabic under the conditions described. . . , [A|n isolated finding . . . atthe ,05 level or even the ,01 level was frequently judged not sufficientlyimpressive to warrant archival publication. (Melton, 1962, pp, 553-554),
It has been argued in this section that the associated probability [i,e,,p value] of a significance test is indeed amenable to an inferential inter-pretation, (Oakes, 1986, p, 29)
*Thls use of confidence is its customary meaning found in any dic-tionary, not to be confused with its usage in the statistical concept ofconfidence interval.
Effect sizes and p values 179
t = 0 r = 0
n = 120— n = 100
n = 80= 60
n = 40n = 20
005 .0005 .00005.1 .01 .001 .0001
p value at Study 1 (log scale)
= 20
0.4 0.6 0.8
d at Study 1
n = 20
1.2
1
0,8
5 0,6
& 0.4(T
0,2
0
• •
^ ^
, . / .
1
1
1 />
/L/ ,1/ /
/
/ ,
' • • • /
' ^
• " / ^ \
f = ,f = .
II II
8642)
1 01 .001 .0001
p value at Study 1 (log scale)
0.2 0.4 0.6 0.8 1
d at Study 11.2
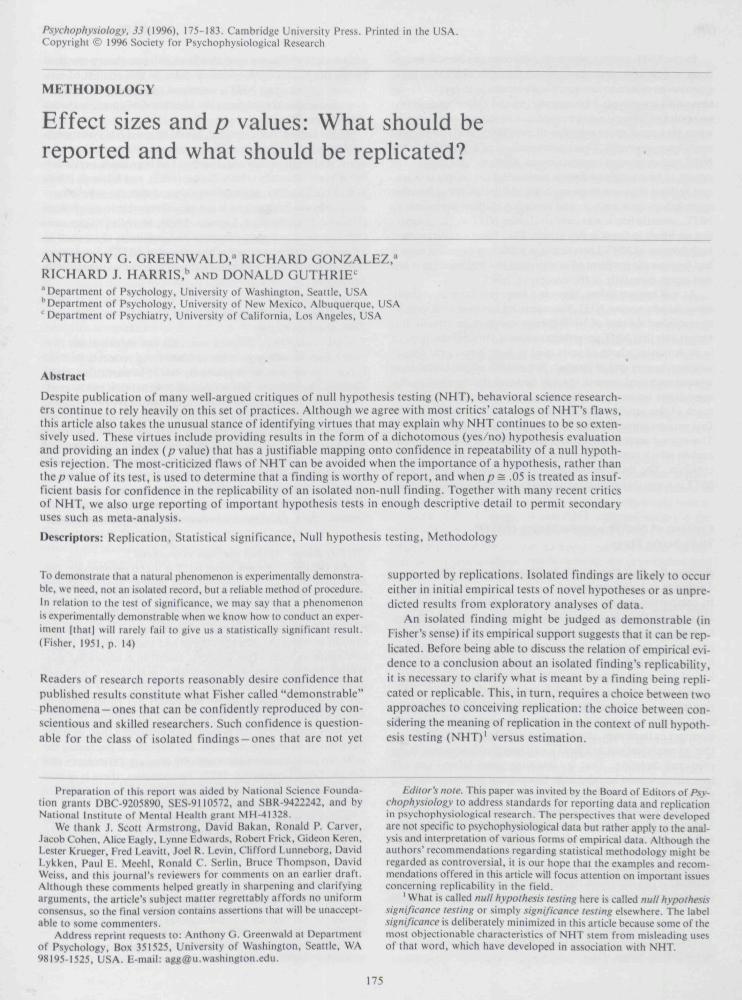
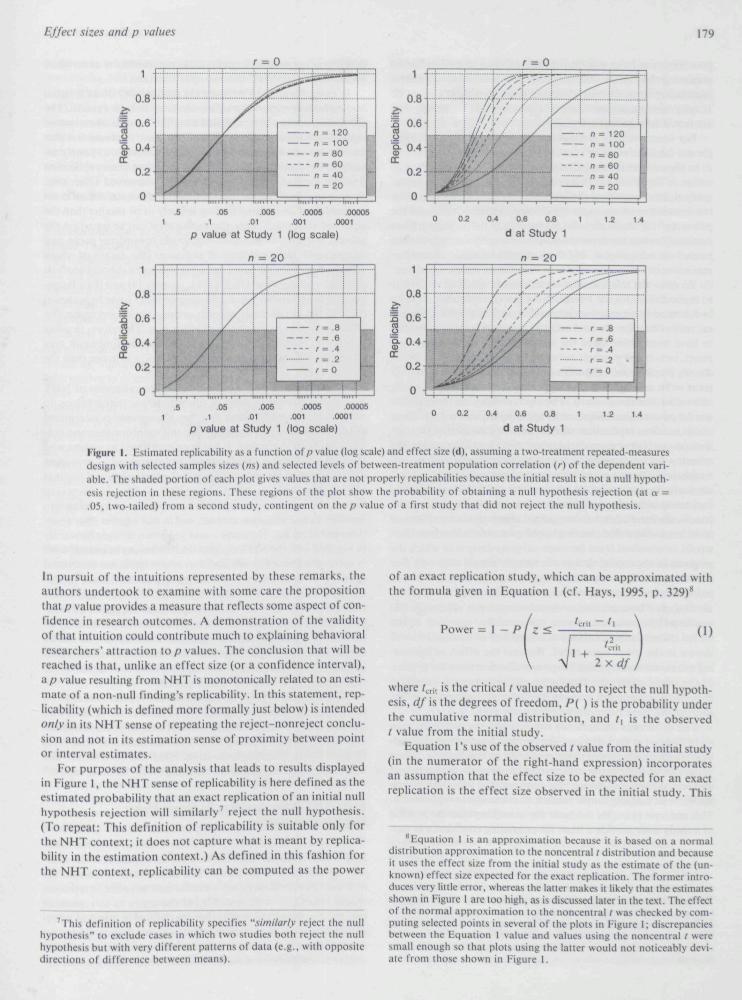
L Fstimatcd replicability as a function of p value (log scale) and etfect si/e (d), assumitig a two-treatment repeated-tneasuresdesign with selected satnples sizes (ns) and selected levels of between-treatment population correlation (/•) of the dependent vari-able. The shaded portion of each plot gives values that are not properly replicabilities because the initial result is not a null hypoth-esis rejection in these regions. These regions of the plot show the probability of obtaining a null hypothesis rejection (at a =,05, two-tailed) from a second study, contingent on the/ ; value of a tirst study that did not reject the null hypothesis.
In pursuit of the intuitions represented by these remarks, theauthors undertook to cxatninc with sotnc care the propositionthat p value provides a tneasure that rcfiects sotne aspect of con-fidence in research outcomes. A demonstration of the validityof that intuition could contribute tnuch to explaining behavioralresearchers' attraction to /) values. The conchtsion that will bereached is that, unlike an effect size (or a confidence interval),a p value resulting from NHT is monotonically related to an esti-mate of a non-null finding's replicability. In this statement, rep-licability (which is defined more lortnally just below) is intendedonly in its NHT sense of repeating the rcject-nonrcject conclu-sion and not in its estimation sense of proxittiity between pointor interval estimates.
For purposes of the analysis that leads to results displayedin Figure 1, the NHT sense of replicability is here defined as thecstitnated probability that an exact replication of an initial nullhypothesis rejection will similarly' reject the null hypothesis,(To repeat: This definition of replicability is suitable only forthe NHT context; it docs tiot capture what is tncant by replica-bility in the estimation context.) As defined in this fashion forthe NHT context, replicability can be computed as the power
'This definition of replicability specifies "similarly reject the nullhypothesis" to exclude cases in which two studies both reject the nullhypothesis but with very different patterns of data (e.g,, with oppositedirections of difference between means).
of an exact replication study, which can be approximated withthe formula given in Equation 1 (cf. Hays, 1995, p, 329)"*
Power = I - P z <'crit ~ ' l
(1)
where /,.„, is the critical / value needed to reject the null hypoth-esis, df is the degrees of freedom, P( ) is the probability underthe cumulative normal distribution, and r, is the observedI value from the initial study.
Equation 1 's use of the observed / value frotn the initial study(in the numerator of the right-hand expression) incorporatesan assumption that the effect size to be expected for an exactreplication is the effect size observed in the initial study. This
"Equation I is an approximation because it is based on a normaldistribution approximation to (he noncentral t distribution and becauseit uses the effect size from the initial study as the estimate of the (un-known) effect size expected for the exact replication. The former intro-duces very little error, whereas the latter makes it likely that the estimatesshown in Figure 1 are too high, as is discussed later in the text. The effectof the normal approximation to the noncentral / was checked by com-puting selected points in several of the plots in Figure 1: discrepanciesbetween the Fquation 1 value and values using the noncentraf t werestiiall enough so that plots using the latter would not noticeably devi-ate from those shown in Figure I,
180 A.G. Greenwald el al.
generalization from past to future involves a step of inductivereasoning that is (a) well recognized to lack rigorous logicalfoundation but is (b) nevertheless es.sential to ordinary scientificactivity. Some concerns about the accuracy of this assumptionare noted four paragraphs below.
For computations in producing the plots of Figure 1, sam-ple size (and therefore df) for the replication study was assumedto be the same as for the initial study. An easily seen direct impli-cation of Equation 1 is that, when the observed / for the initialstudy equals the critical / value (and p is thus exactly ,05), thenthe numerator of the right-hand term becomes zero, and thepower for the replication is ,50 (= P[z < 0,0]), Stated moreintuitively, when the expected effect size exactly matches the oneneeded to achieve p = ,05, there should be equal chances ofexceeding or falling short of that value in an exact replication.
To show the relation of/? value, sample size, and effect sizeto replicability. Figure I displays estimated replicabilities for atwo-treatment repeated-measures design. The/? values, samplens, and effect size ds used as parameters are values assumedto have been observed in the initial study. For the upper leftpanel, two-tailed p values between I and ,0(XX)5 and ns of 20,40, 60, 80, 100, and 120 were converted into /, values and df(= n - I), and t^.,,, was the tabled critical value for « = ,05,two-tailed, for the given df. The replicabilities on the ordinateare the power values obtained by applying Equation I, (In thesecomputations, replication success does not mean that the rep-lication matches or exceeds the initial study's p value; rather, thecriterion for replication of a null hypothesis rejection is uni-formly a = ,05, two-tailed,) The upper right panel was producedsimilarly, by converting ds between 0.0 and 1.4 along with thevarious ns into values of t, used in Equation I, For both upperpanels, the correlation between paired observations was assumedto be zero. Note that the two upper plots resemble those thatwould be obtained from between-subjects designs in which thens given in the legend denote the sample size in each cell. Forthe lower panels, with n fixed at 20, the correlation betweenpaired observations was varied across the levels of r = 0, ,2, ,4,,6, and ,8, These increasing correlations leave effect size (d)unaltered'' but increase power substantially, resulting in thevaried curves for replicability as a function of r and effect sizeshown in the lower right panel. Because the effect of increas-ing rthat increases replication power also decreases ihe p valueof the initial study, the five curves of the lower left panel areentirely superimposed, leaving the (incorrect) appearance thatfour curves have been omitted from the plot.
The difference between the two left and the two right pan-els of Figure 1 is very striking. The two left panels show that rep-licability is closely related to the p value of an initial study, acrossvariations of sample size and correlation between treatments ina repeated-measures design. By contrast, the two right panelsshow the lack of any simple relation of effect size to replicability.This contrast provides the basis for observing that the p valueof a .Study does provide a ba,si.s for estimating confidence in rep-
licabillty of an isolated finding, when replicability is understoodexclusively in its NHT-context interpretation.
In using Figure 1 to estimate the replicability of an isolatedfinding from its reported p value, one must exercise caution. Theplotted curves are best regarded as upper bounds of estimatedreplicability because of one difficult-to-justify assumption thatwas used in constructing the figure. The difficult-to-justify as-sumption is that the expected effect size of an exact replicationis well estimated by an isolated finding's observed effect size,A more justifiable expectation is that the effect size for an exactreplication of an isolated finding is likely to be smaller than theobserved effect size. This alternative view can be based on thegeneral principle of expected regression toward the mean andon two more technical lines of argument (the details of whichwill not be presented here): (a) a maximum likelihood analysisoffered by Hedges and Olkin (1985, chapter 14) and (b) a Bayes-ian analysis whenever the distribution of belief (over hypotheses)prior to the initial study accords greater likelihood to smallereffect sizes than to the observed effect size. Therefore, in usingFigure I to estimate replicability of an isolated finding, it maybe wi.se to assume that expected replicability is lower than theplotted value.
In conclusion of this section, one of the criticisms of NHTreviewed in the first section of this article was that /; values donot provide the information that they are sometimes interpretedas providing. It is now apparent that this uninformativeness crit-icism has been overstated. It has been overstated by writers whohave asserted that p values cannot be interpreted as providingany information about confidence in the replicability of findings(e,g,, Bakan, 1966, p, 429; Carver, 1993, p, 291). In fairness tothese writers, they were implicitly or explicitly interpreting rep-licability in an estimation context, and in that context their asser-tions are accurate. However —and as shown straightforwardlyin Figure I —in the NHT context that continues to prevail bothin archival publication and statistic* education in the behavioralsciences, p value does provide a measure of confidence in rep-licability of a null hypothesis rejection. Although neither thenumerical value of p nor its complement (as suggested by Nun-nally, 1975) can be interpreted as an estimated probability ofreplicating a null hypothesis rejection, nevertheless, as can beseen in Figure 1, p value docs provide a continuous measure thathas an orderly and monotonic mapping onto confidence in thereplicability of a null hypothesis rejection.
This analysis of NHT should make the typical reader (whois with high probability a user of NHT) feel like the drinker whohas just learned that moderate alcohol consumption has desir-able effects such as reducing the risk of heart attack (Peele, 1993;Shaper, 1993), Used in moderation, NHT can be of value. Thenext section gives suggestions for using NHT "in moderation,"
'More preci.sely, effect size is unaltered by variations in /-when theunit for effect size is the pooled within-treatment standard deviation.This is the effect size measure that is considered most justifiable in meta-analysis, especially when results from between- and within-subjectsdesigns are being combined in estimating a common effect size (Glass,McGaw, & Smith, 1981, p. 117), By contrast, the unit for effect size thatis used in computing power is the standard deviation of the differencebetween treatments.
NHT While AvuidinK Us Severe Flaws:Five Recommendations
When used in conjunction with a conventional criterion (suchas a = ,05), NHT's p value allows a yes-no appraisal of the accu-racy of a directional prediction and can be u,sed to estimate (asin Figure I) confidence that a similar null hypothesis rejectionwould result if it were possible for the study to be rep]icatedexactly. For empirical results that are defined in terms of a pre-dicted direction of treatment effect or correlation, these twotypes of information are directly useful in assessing what Fisher(1951) called demonstrability. Because many theory-based hy-

Effect sizes and p values 181
potheses in behavioral science are formulated only as directionalpredictions, NHT is justifiably regarded as useful in appraisingthe results of their empirical tests.
Although useful for evaluating empirical success of direc-tional predictions, NHT nevertheless bears severe flaws forwhich it has been justly criticized. In tnost cases, these flaws,which were summarized in the first section of this article, areavoidable accompaniments of NHT that can be minimized byusing NHT cautiously and carefully. The remainder of this arti-cle attempts to give specific form to this advice.
Recommendation I: Report p Vahies With an =Rather Than With a < or a >This recomtnendation is first, not because it is the most impor-tant but because it follows most directly from the analysis ofthepreceding section, where it was shown that replicability of a nullhypothesis rejection is a continuous, increasing function of thecomplement of its p value. This attribute of p values makes itpreferable to report them numerically rather than either in themore traditional NHT form of relation to an alpha criterion orsimply as "significant" or "not significant," That is, it is moreinformative to describe a result as (say) p = ,003 rather than aseither "p < .05" or "statistically significant," and, similarly, itis more useful to describe a result as (say) p = ,07 rather thanas either "p > ,05" or "not significant," Because the most inter-prctable characteristic of p values is well captured by countingthe nutnber of successive zeros to the right of the decitnal point,a useful rule of thumb may be to report p values rounded to theA th decimal place, where k is the position in which the first non-zero digit occurs: For example, p - ,3, .07, ,002, ,0008, . . . ,6 X 10^'.
Recommendation 2: Treat p s .05 as an Interesting, butUnconvincing, .Support for an Isolated NHT ResultFrom Figure 1 (or Equation 1), it can be seen that /) s ,05 tratis-lates to an upper boutid estitnate of 50% chance of obtaininga similar null hypothesis rejection from an exact replication. This50% figure is well short of any rea.sonable interpretation of whatFisher (1951) meant by a phenomenon being demonstrable.Therefore, when p = ,05 for an isolated fitiding, an appropri-ate response on the part of the researcher should be to seek fur-ther support by conducting a replication.
This second recommendation should not be treated as anabsolute. There will be situations in which an isolated nullhypothesis rejection at /; = .05 warrants publication without rep-lication. When the theoretical content of a report is exceptiotial,evidence for the replicability of the accompanying data mayseetn a relatively minor consideration in appraising the valueof the report, Atid, when the cost of collectitig t cplication datais very expensive, the information value of reporting preciousavailable evidence may outweigh the more ordinary value ofestablishing that the observed phenotncnon is (in Fisher's .sense)demonstrable.
In attempting to replicate an isolated finding for which p =.05, the researcher should bear in mind that the estimated rep-licability of 50% shown in Figure 1 is almost certainly an over-estimate. It is an overestitnate both becaase (a) as already noted,true effect size will often be lower than the initial study's ob-served effect size (on which the 50% replicability estimate isbased); and (b) the 50% figure assumes an exact replication,which is a practical impossibility (see Caution I), Furthermore,
and as argued by Lykken (1%8), the researcher is generally welladvised to conduct a replication that varies details of proceduresthat are irrelevant to the theory or hypothesis under investiga-tion. Success in such a conceptual replication provides greaterconfidence in the theory underlying the finding than does suc-cess in a literal or exact replication.
Recommendation 3: Treat p = . 005 as an Indicator ofDemonstrability for an Isolated NH T ResultAlthough other numerical replicability values could be sug-gested, the tnost obvious choice for a minimum level that wouldjustify description as "demonstrable" is the 80% figure thatCohen (e.g,, 1977, p, 56) advocated as a conventionally accept-able level of statistical power for NHT, Reading the abscissa ofFigure 1 to find the/) value that corresponds to an estimated rep-licability of ,80 (for an isolated finding) yields p s ,005 for allbut the smallest value of sample size in the upper left panel ofFigure 1, However, two substantial cautions must be attachedto the suggestion that p s ,005 can serve as a /? value criterionof demonstrability.
Caution I. The 80% estimate of replicability that is associ-ated with p = ,005 in Figure 1 applies to the ideal case of an exactreplication. An exact replication is a test conducted with addi-tional subjects sampled in the same fashion as those in the ini-tial study and tested under conditions identical to those of theinitial study. This can be recognized as a practical impossibil-ity, unless this replication has already been conducted-that is,conducted at the same titne as the initial study and with randomassignment of subjects either to the initial study or to the repli-cation. Any other replication would be rendered nonidenticalat least by the intervening passage of time (cf, the discussion of"history" as a threat to validity by Campbell & Stanley, 1966),
Caution 2. Figure 1 's upper bounds become inaccurate to theextent that investigators engage in selective reporting of NHTtests. To the extent that investigators are more likely to reportlow than high p values or to report null hypothesis rejectionsrather than nonrejections, the p-value-based estimates of rep-licability provided by Figure 1 will be too high, possibly muchtoo high.
As the authors have discovered in responses to an earlierdraft, this recommendation — its cautions notwithstanding —willbe the most controversial assertion in this article. Some willobject that p s ,005 is too conservative a criterion for warrant-ing confidence in a result; it poses too great a hurdle for a newresult to overcome to earn the approbation afforded by publi-cation. Others, taking just the opposite perspective, will observethat even /) = ,005 should be regarded as insufficient to justifyconfidetice in the demonstrability of an isolated finding; no find-ing should be treated as confidently demonstrated when it hasbeen obtained in only a single study.
Recommendation 4: Report Results for .All ImportantHypothesis TestsThe selective reporting that prompted Caution 2 is a well-recog-nized flaw of NHT that was discussed in the first section of thisarticle. There exist several tnethods (see Miller, 1981) for anupward adjusttnent of /) values to compensate for the alphainflation that is associated with selective reporting of tests thatyield low p values. It is not generally recognized that these ad-justments are unnecessary when researchers report all of the null
182 A.G. Greenwald el at.
hypothesis tests that they conduct. For example, consider aresearcher who has used NHT in a series of five tests of the samehypothesis, only one of which yielded a null hypothesis rejec-tion. If the report of this research neglects to mention the fournonrejection results, the reader can have no idea that a p valuereported at (say) p = ,03 might be more properly interpreted as/7 s ,15, a value that is Bonferroni adjusted for alpha inflation(see Kirk, 1995, pp, 119-122) and assumes the five tests to beindependent of one another. The misleading lower/; value im-plies (by using Figure 1) a replicability of about 60%, comparedwith the more appropriate infiation-adjusted estimate of about30%, If the researcher had instead reported all five tests, read-ers would not be misled by the single result. More generally,when researchers report all NHT tests, it is possible to use nom-inal (rather than adjusted)/? values without misleading readers —granted, the readers' information processing task becomes morecomplex.
Unfortunately, the recommendation to report all findings isoften difficult to follow. Furthermore, there are several goodrea.sons for reporting results selectively. For example, some por-tion of the results may have been obtained with flawed proce-dures, producing results that might deserve to be considereduninformative; editors may request the suppression of indeci-sive findings; publication space considerations may oblige reportof only a subset of findings; and so on. It is therefore frequentlyleft to readers' imaginations to judge the extent to which a reporthas selectively presented findings. Editors might seek to mini-mize this problem by asking researchers to report all results fortests of interesting hypotheses, regardless of the fit betweenresult and prediction. However, editors are unlikely to requestsuch full reporting routinely, not only because of the demandthat this policy would place on precious publication space butalso (more to the point) because whatever their other skills, edi-tors are rarely clairvoyant.
Recommendation 5: Report F.nough Data to PermitSecondary A nalysisEven while undertaking to document some virtues of NHT thatjustify its use with care and caution, the present authors havementioned a few times that they regard estimation as having gen-erally greater value than NHT, The result of NHT, when re-ported in minimal form (i,e,, as /; < « or p > a ) , has little usebeyond the immediate one of informing a dichotomous reject-nonreject judgment. An accompanying report of either the nu-merical p value or the numerical value and df of a test statisticsuch as /, F, or X" (from which p value can be determined) addsto the information value of an NHT report. Reporting of stan-dard deviations of dependent measures further facilitates sec-ondary uses of the reported results (especially in translating
findings into effect sizes that can be included in a subsequentmeta-analysis). The strong arguments for (a) considering effectsizes in the design and statistical analysis of research and (b)reporting data in detail sufficient to permit secondary use havebeen made so effectively elsewhere that it suffices here to pointreaders toward those arguments (e,g,, Cohen, 1990; Rosenthal,1993; Serlin & Lapsley, 1993),
Conclusion
Despite the dominant anti-NHT character of statistical meth-odological critiques of the past 30 years, NHT retains a tena-cious grip on methodological practice in behavior science. Thisarticle describes two features of NHT that can explain this par-adox. First, NHT allows conversion of test statistics into dichot-omous outcomes that can guide decisions in situations that callfor practical action. Second, the p value computed in NHT isinformative both about the surprise value of a null hypothesisrejection when one disbelieves its theoretical basis and as an indi-cator of the likelihood that an exact replication would similarlyreject the null hypothesis.
This article provides a very limited appreciation of NHT, Theunusualness of even this limited appreciation will altnost cer-tainly cause the article to be misread as providing unmitigatedpraise for NHT and the following sentence to be read as less thanheartfelt. To the contrary, however, the authors (a) agree withthe majority of published criticism of NHT (and have writtensotne of it), (b) greatly dislike statistical analyses that locus moreon "statistical significance" than on de.scription of findings andtheir theoretical or practical importance, (c) regard estimationas a necessary approach for the long-term future of behavioralscience, and, as was stated directly in the final section of thisarticle, (d) endorse the reporting of estimation statistics (suchas effect sizes, variabilities, and.confidence intervals) for allimportant hypothesis tests.
As Fisher (1951) stated in the passage quoted at the begin-ning of this article, an NHT result can be regarded as demon-strable when there exists a "reliable method of procedure" thatwill "rarely fail to give us a statistically significant result," Estab-lishing that a finding is confidently detnonstrabic in Fisher's(NHT) sense typically depends on conducting and reportingactual replications, even when an isolated finding seems statis-tically secure, NHT can advise a researcher who observes an iso-lated null hypothesis rejection as to whether a replication effortis likely to succeed in repeating that result. As this article es-tablishes, the finding that "p = ,05" falls well short of provid-ing confidence that the isolated finding will "rarely fail" to beobserved.
RKFERKNCKS
Ambady, N,, & Rosenthal, R. (1993). Haifa minute: Predicting teacherevaluations from thin slices of nonverbal behavior and physicalattractiveness. Journal of Personalitv and Social Psychology, 64,431-441,
Bakan, D. (1966). The test of significance in psychological research. Psy-chological Bulletin. ««, 423-437.
Binder, A. (1963). Further considerations on testing the null hypothesisand the strategy and tactics of investigating theoretical models. Psy-chological Review. 70, 107-115,
Campbell, D. T., & Stanley, J. C, (1966), Experimental and quasi-experimental designs for re.search. Chicago: Rand McNally,
Carver, R, P. (1978). The case against statistical significance testing. Har-vard Educational Review, 4H, 378-399,
Carver, R. P. (1993), The case against statistical significance testing,revisited. Journal of Experimental Education, 61. 287-292,
Cohen, J, (1977), Statistical power analysis for the behavioral sciences(rev, ed.). New York: Academic Press,
Cohen, J, (1990). Things I have learned (so far), American Psycholo-gist. 45. 1304-1312.
Cohen, J. (1994). The earth is round (p < ,05). American Psychologist,49. 997 1003.
Bckert, E, D., Halmi, K. A,, Marchi, P., & Cohen, ,1, (1987), Compar-
Effect sizes and p values 183
ison of bulimic and non-bulimic anorexia nervosa patients duringtreatment. Psychological Medicine, 17. 891-898,
Edwards, W. (1965). Tactical note on the relation between scientific andstatistical hypotheses. Psychological Bulletin, 63. 4(K)-402,
Fisher, R. A, (1951). The design of experiments (6th ed,). Edinburgh:Oliver & Boyd. (Originally published 1935)
Frick, R. W. (1995), Accepting the null hypothesis. Memory and Cog-nition, 23, 132-138,
Gigerenzer, G,, & Murray, D, .1, (1987), Cognition as intuitive statis-tics. Hillsdale, N,!: Erlbaum,
Glass, Cl, V,, McCiaw, B,, & Smith, M. 1, (1981). Meta-analysis in socialre.search. Beverly Hills, C A: Sage,
Goodman, S. N,, & Royall, R, (1988). Evidence and scientific research.American Journal of Public Health. 78. 1568-1574.
Greenwald, A. G. (1975), Consequences of prejudice again.st the nullhypothesis. Psychological Bulletin, 82, 1-20,
Greenwald, A. G., Klinger, M. R., & Schuh, E. S. (1995). Activationby marginally perccplibic ("subliminal") stimuli: Dissociation ofunconscious from conscious cognition. Journal of Expetimental Psy-chology: General, 124, 11-A2.
Hays, W. L, (1995), Statistics ($\h cd) . New York: Holt, Rincharl, andWinston.
Hedges, 1., V, (1987), How hard is hard science, how sott is sott .science?The empirical cumulativcncss of research. .-Xmerican Psychologist,42, 443-455,
Hedges, 1 , V,, & Olkin, I. (1985). Statistical methods for meta-analysis.Orlando, FL: Academic Press,
Hell, W,, Gigerenzer, G., Gauggel, S,, Mall, M, & Miillcr, M, (1988).Hindsight bias: An interaction of automatic and motivational fac-tors? Memorv and Cognition, 16. 533-538.
Kirk, R. i:, (1995), Experimental design: Procedures for the behavioral.sciences (3rd ed.). Pacific Grove, CA: Brooks-Cole,
Loftus, G. R, (1993), Editorial comment. Memory and Cognition. 21.1-3,
Lykken, D, T. (1968), Statistical significance in psychological research.Psychological Bulletin. 70. 151-159,
Lykken, 0, L, McGue, M., Bouchard, T. .1., & Tellegen, A. (1990). Docscontact lead to similarity or sitnilarity to contact? Behavior Genet-ics, 20, 547-561,
McchI, P, E, (1967), Theory-testing in psychology and physics: A meth-odological paradox. Philosophy of Science, 34, 103-115,
Meehl, P. E, (1978), Theoretical risks and tabular risks: Sir Karl, Sir Ron-ald, and the slow progress of soft psychology. Journal of Consult-ing and Clinical Psychology, 46, 806-834,
Melton, A, W. (1962), Editorial, Journal of Experimental Psychology,64, 553-557,
Miller, R. G, Jr, (1981). Simultaneous statistical inference,(2ni ed,). NewYork: McGraw-Hill,
Nunnally, J, V. (I960). The place of statistics in psychology. Educationaland Psychological Measurement, 20, 641-650,
Nunnally, J, C, (1975). Introduction to statistics for psychology and edu-cation. New York: McGraw-Hill,
Oakes, M. (1986), Statistical inference. Chichester: Wiley.Peele, S, (1993). The conflict between public health goals and the tem-
perance mentality. American Journal of Public Health, 83, 805-810.Rosenthal, R, (1991). Cumulating psychology: An appreciation of Don-
ald T. Campbell, Psychological Science, 2, 213, 217-221,Rosenthal, R, (1993), Cumulating evidence. In G, Keren & C. Lewis
(Eds,), .4 handbook of data analysis in the behavioral sciences: Meth-odological issues (pp. 519-559). Hillsdale, NJ: Erlbaum,
Rosnow, R, L., & Rosenthal, R, (1989), Statistical procedures and thejustification of knowledge in psychological research, American Psv-chologisi. 44. 1276-1284.
Rozeboom, W, W, (1960), The fallacy of the null-hypothesis significancetest, P.sychological Bulletin. 57, 416-428.
Sclvin, H. C , & Stuart, A. (1966), Data-dredging procedures in surveyanalysis, .American Statistician, 20, 20-23,
Serlin, R, C , & Lapsley, D, K. (1993). Rational appraisal of psycho-logical research and the good-enough principle. In G. Keren & C,Lewis (Eds,), A handbook of data analysis in the behavioral .sciences:Methodological issues (pp. 199-228). Hillsdale, NJ: Erlbaum,
Shaper, A, G, (1993), Editorial: Alcohol, the heart, and health, Amer-ican Journal of Public Health, 83. 799-801.
(RK( t:rvHD September 19, 1994; ArcEPTED November 3, 1995)


![Graphical displays for meta-analysis: An overview with ...psych.colorado.edu/~willcutt/pdfs/Anzures-Cabrera_2010.pdf · graphical displays for meta-analysis ... [18] or an ordering](https://img.pdfslide.us/doc/110x75/5aaf91297f8b9a07498d811e/graphical-displays-for-meta-analysis-an-overview-with-psych-willcuttpdfsanzures-cabrera2010pdfgraphical.jpg)


![Untitled Document [psych.colorado.edu]psych.colorado.edu/~carey/pdfFiles/Endophenotypes_Gottesman.pdf · Title: Untitled Document Created Date: 1/20/2007 9:30:49 AM](https://img.pdfslide.us/doc/110x75/603ffda08d59854a706d7f81/untitled-document-psych-psych-careypdffilesendophenotypesgottesmanpdf.jpg)


