Embed Size (px)
Citation preview
Effect Size Overheads 1
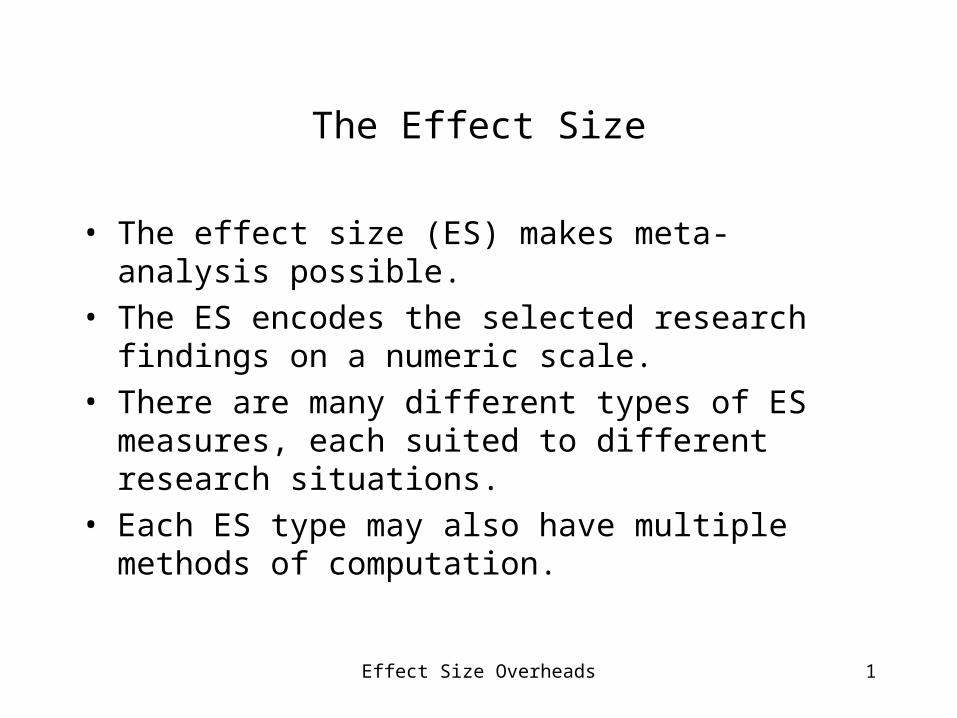
The Effect Size
• The effect size (ES) makes meta-analysis possible.• The ES encodes the selected research findings on a
numeric scale.• There are many different types of ES measures, each
suited to different research situations.• Each ES type may also have multiple methods of
computation.
Effect Size Overheads 2
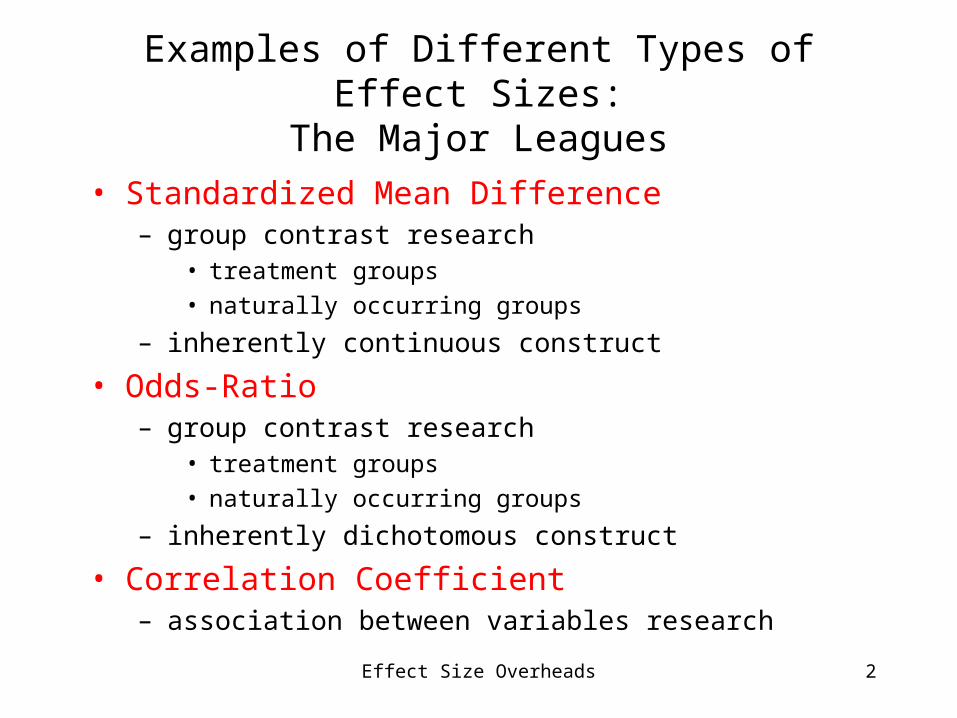
Examples of Different Types of Effect Sizes:
The Major Leagues• Standardized Mean Difference
– group contrast research• treatment groups
• naturally occurring groups
– inherently continuous construct
• Odds-Ratio– group contrast research
• treatment groups
• naturally occurring groups
– inherently dichotomous construct
• Correlation Coefficient– association between variables research
Effect Size Overheads 3
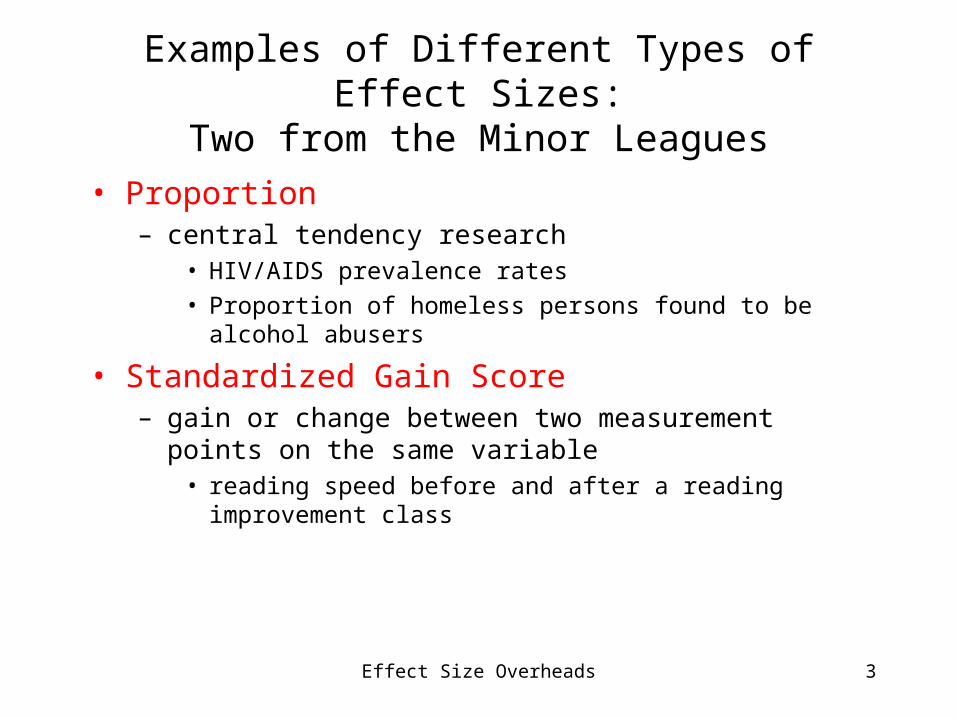
Examples of Different Types of Effect Sizes:
Two from the Minor Leagues• Proportion
– central tendency research• HIV/AIDS prevalence rates
• Proportion of homeless persons found to be alcohol abusers
• Standardized Gain Score– gain or change between two measurement points on the
same variable• reading speed before and after a reading improvement class
Effect Size Overheads 4
What Makes Something an Effect Sizefor Meta-Analytic Purposes
• The type of ES must be comparable across the collection of studies of interest.
• This is generally accomplished through standardization.
• Must be able to calculate a standard error for that type of ES– the standard error is needed to calculate the ES weights,
called inverse variance weights (more on this latter)– all meta-analytic analyses are weighted
Effect Size Overheads 5
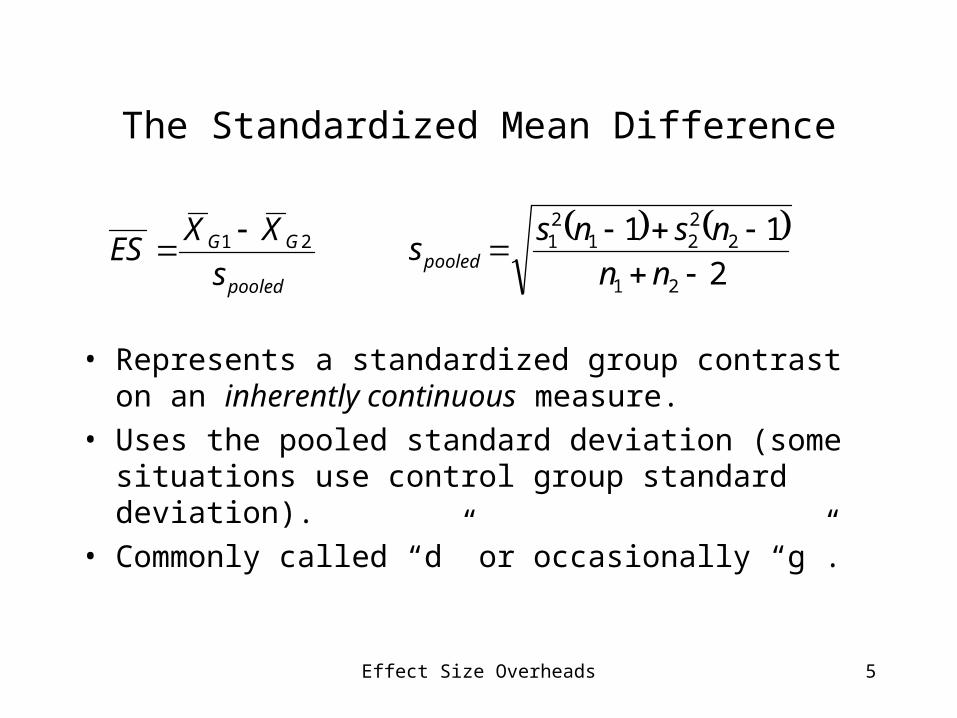
The Standardized Mean Difference
• Represents a standardized group contrast on an inherently continuous measure.
• Uses the pooled standard deviation (some situations use control group standard deviation).
• Commonly called “d” or occasionally “g”.
pooled
GG
s
XXES 21
2
11
21
2221
21
nn
nsnsspooled
Effect Size Overheads 6
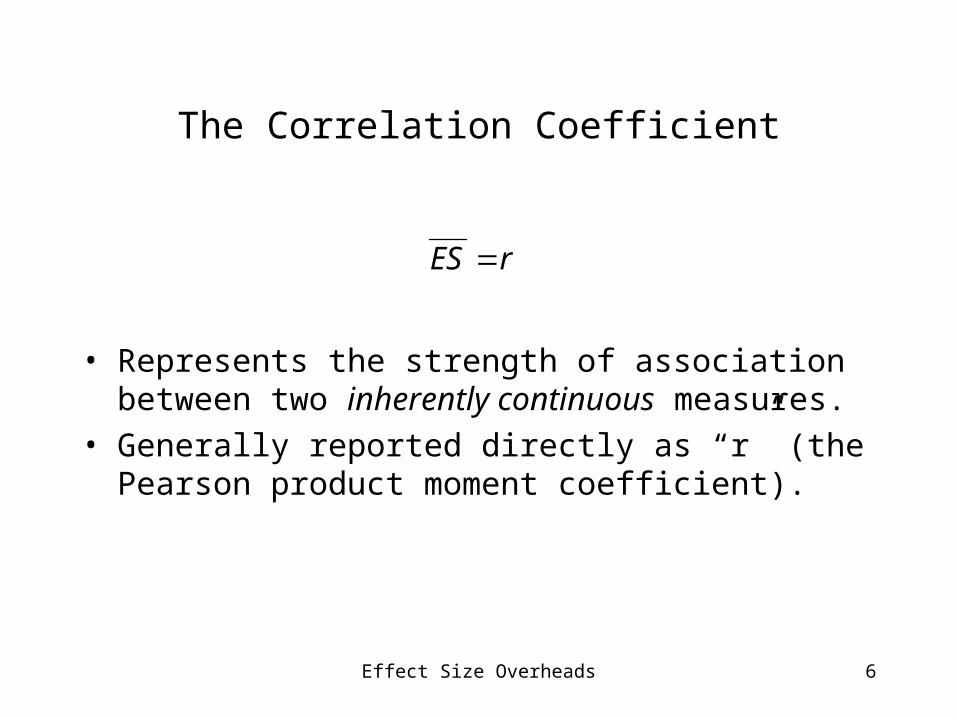
The Correlation Coefficient
• Represents the strength of association between two inherently continuous measures.
• Generally reported directly as “r” (the Pearson product moment coefficient).
rES
Effect Size Overheads 7
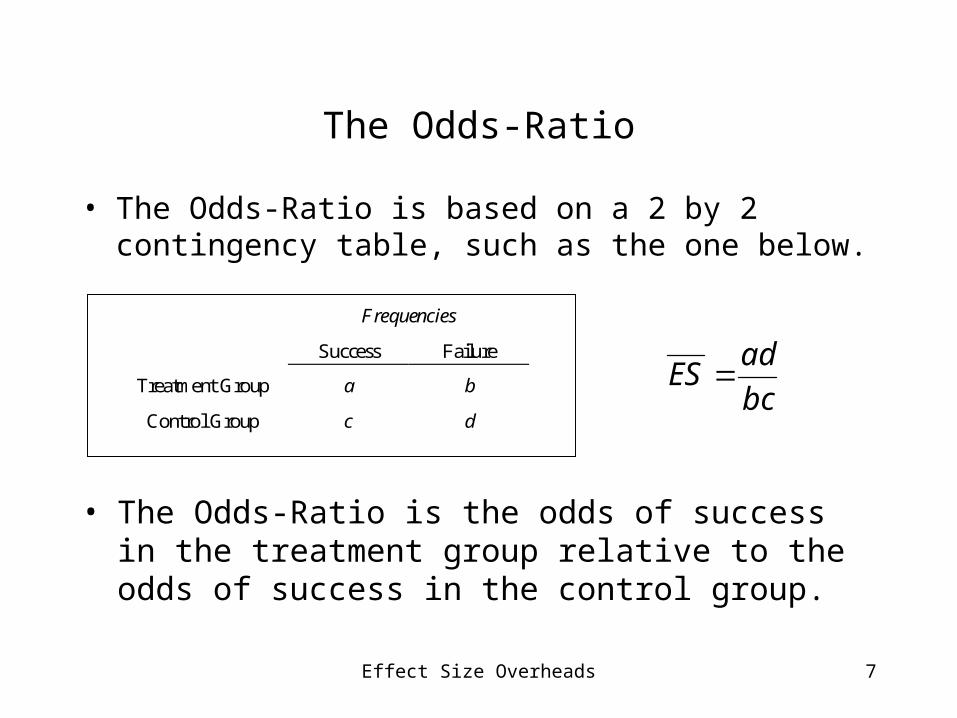
The Odds-Ratio
• The Odds-Ratio is based on a 2 by 2 contingency table, such as the one below.
Frequencies
Success Failure
Treatment Group a b
Control Group c dbc
adES
• The Odds-Ratio is the odds of success in the treatment group relative to the odds of success in the control group.
Effect Size Overheads 8
Methods of Calculating the Standardized Mean Difference
• The standardized mean difference probably has more methods of calculation than any other effect size type.
Effect Size Overheads 9
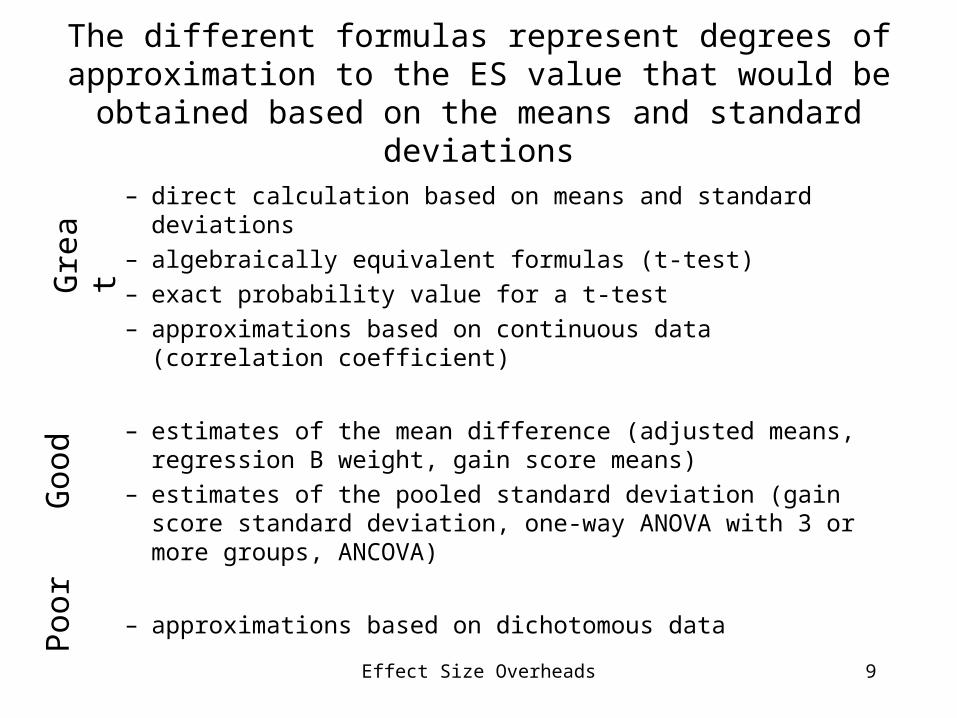
The different formulas represent degrees of approximation to the ES value that would be obtained based on the
means and standard deviations
– direct calculation based on means and standard deviations– algebraically equivalent formulas (t-test)– exact probability value for a t-test– approximations based on continuous data (correlation
coefficient)
– estimates of the mean difference (adjusted means, regression B weight, gain score means)
– estimates of the pooled standard deviation (gain score standard deviation, one-way ANOVA with 3 or more groups, ANCOVA)
– approximations based on dichotomous data
Gre
atG
ood
Poo
r
Effect Size Overheads 10
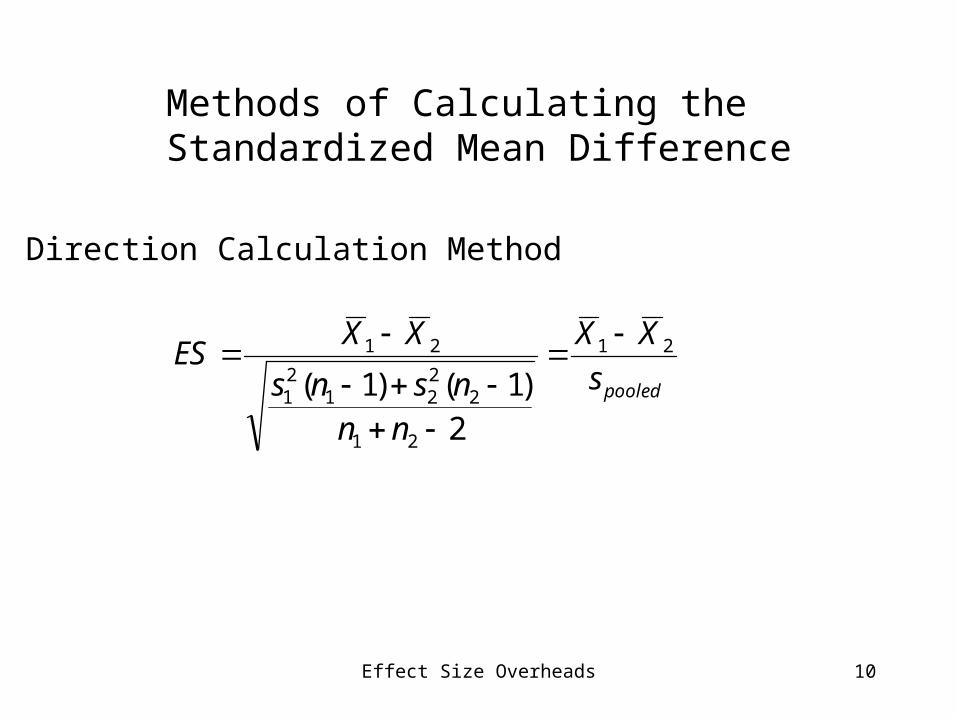
Methods of Calculating the Standardized Mean Difference
pooleds
XX
nnnsns
XXES 21
21
2221
21
21
2)1()1(
Direction Calculation Method
Effect Size Overheads 11
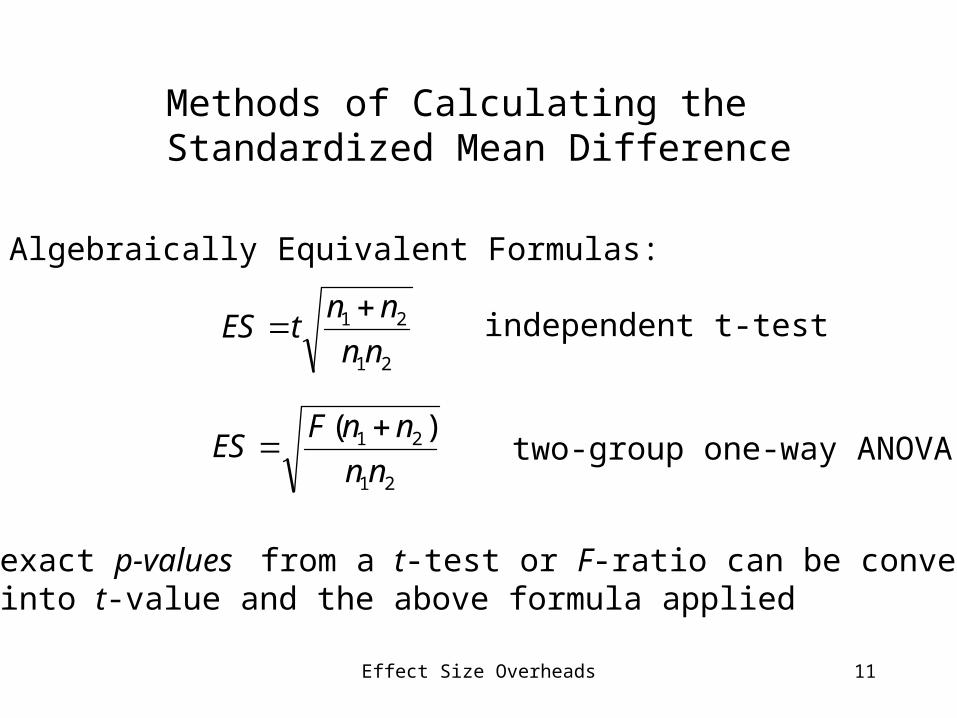
Methods of Calculating the Standardized Mean Difference
21
21
nn
nntES
Algebraically Equivalent Formulas:
21
21 )(
nn
nnFES
independent t-test
two-group one-way ANOVA
exact p-values from a t-test or F-ratio can be convertedinto t-value and the above formula applied
Effect Size Overheads 12
Methods of Calculating the Standardized Mean Difference
A study may report a grouped frequency distributionfrom which you can calculate means and standard deviations and apply to direct calculation method.
Effect Size Overheads 13
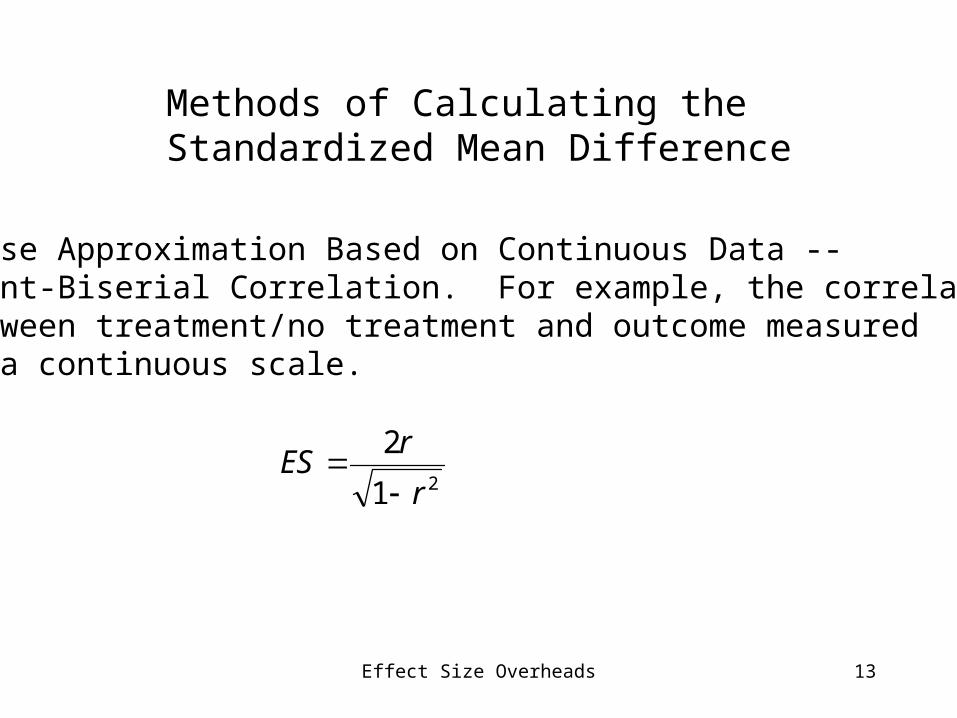
Methods of Calculating the Standardized Mean Difference
21
2
r
rES
Close Approximation Based on Continuous Data --Point-Biserial Correlation. For example, the correlationbetween treatment/no treatment and outcome measuredon a continuous scale.
Effect Size Overheads 14
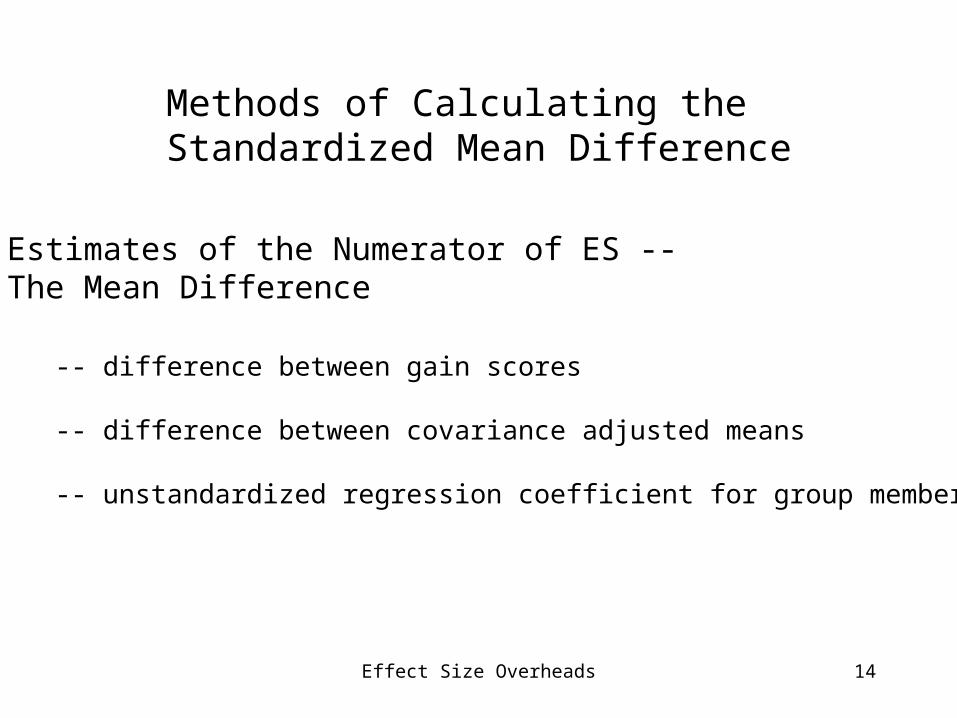
Methods of Calculating the Standardized Mean Difference
Estimates of the Numerator of ES --The Mean Difference
-- difference between gain scores
-- difference between covariance adjusted means
-- unstandardized regression coefficient for group membership
Effect Size Overheads 15
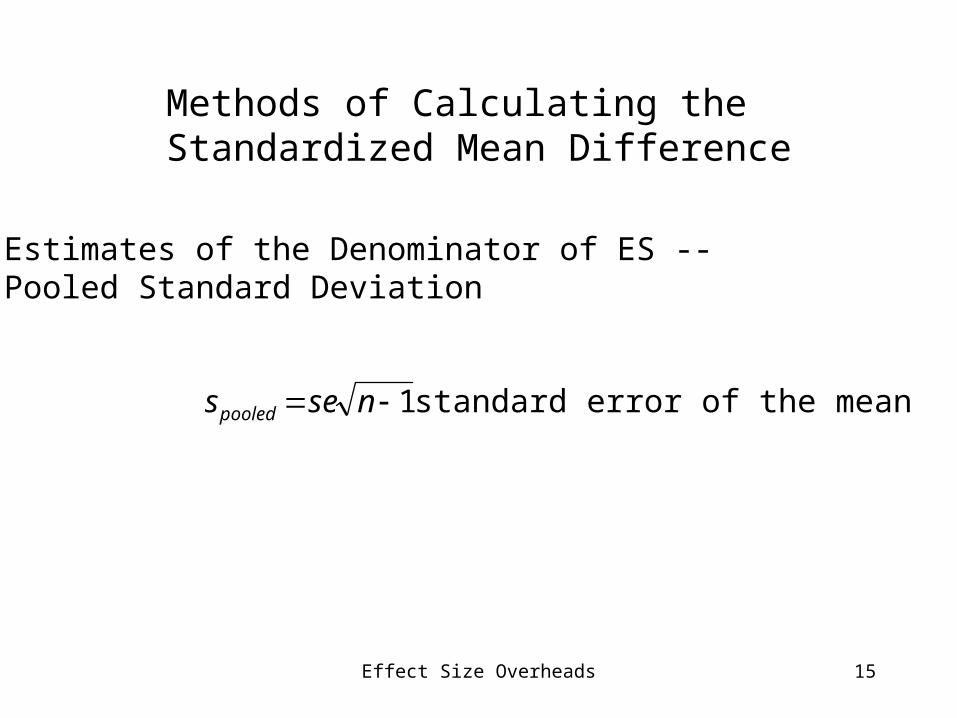
Methods of Calculating the Standardized Mean Difference
Estimates of the Denominator of ES --Pooled Standard Deviation
1 nsespooled standard error of the mean
Effect Size Overheads 16
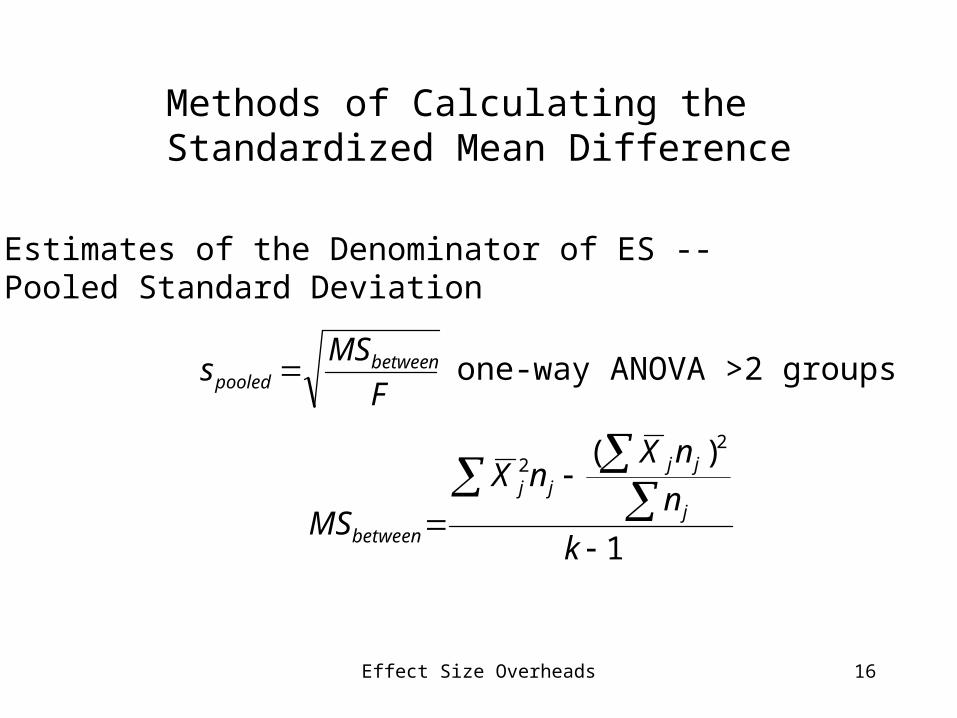
Methods of Calculating the Standardized Mean Difference
Estimates of the Denominator of ES --Pooled Standard Deviation
F
MSs between
pooled
1
)( 22
k
n
nXnX
MS j
jjjj
between
one-way ANOVA >2 groups
Effect Size Overheads 17
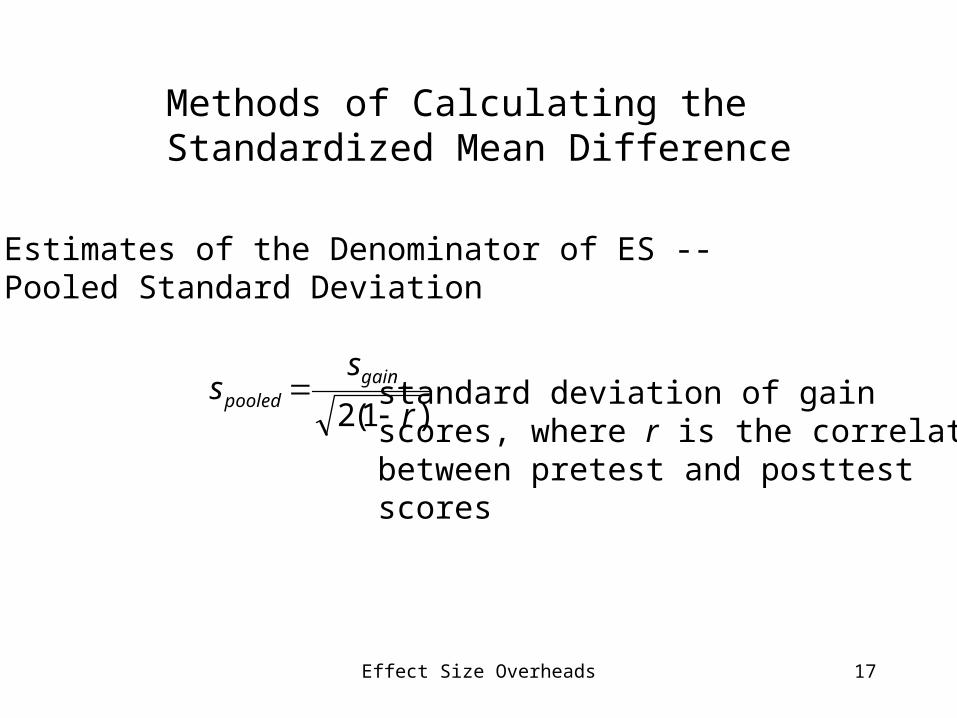
Methods of Calculating the Standardized Mean Difference
Estimates of the Denominator of ES --Pooled Standard Deviation
)1(2 r
ss gain
pooled standard deviation of gain
scores, where r is the correlationbetween pretest and posttestscores
Effect Size Overheads 18
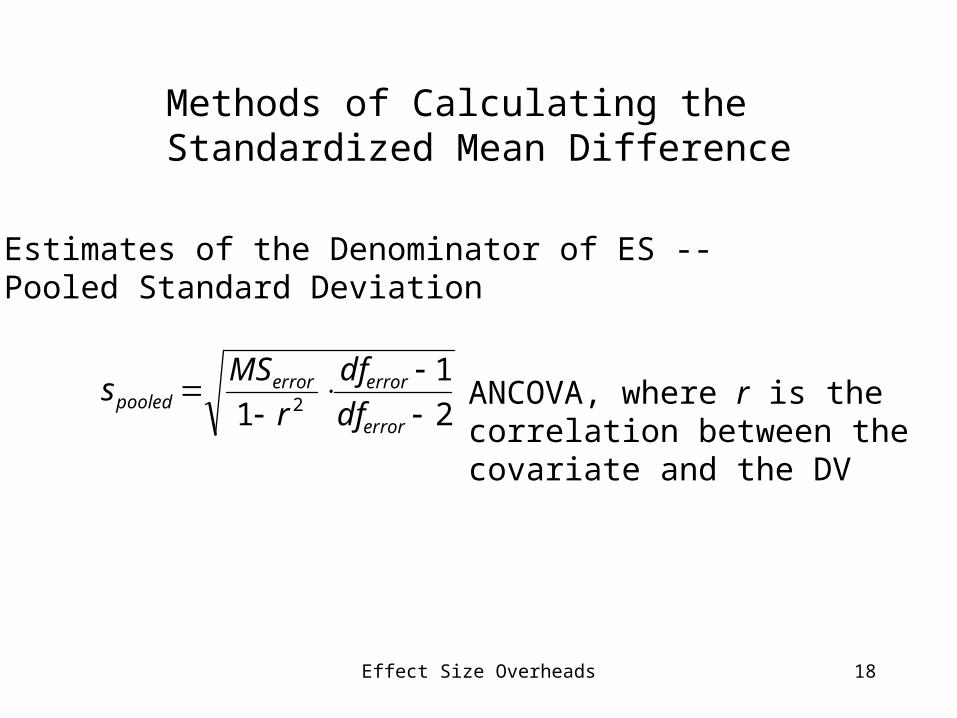
Methods of Calculating the Standardized Mean Difference
Estimates of the Denominator of ES --Pooled Standard Deviation
2
1
1 2
error
errorerrorpooled df
df
r
MSs ANCOVA, where r is the
correlation between thecovariate and the DV

Effect Size Overheads 19
Methods of Calculating the Standardized Mean Difference
Estimates of the Denominator of ES --Pooled Standard Deviation
WABB
WABBpooled dfdfdf
SSSSSSs
A two-way factorial ANOVAwhere B is the irrelevant factorand AB is the interactionbetween the irrelevant factorand group membership (factorA).
Effect Size Overheads 20
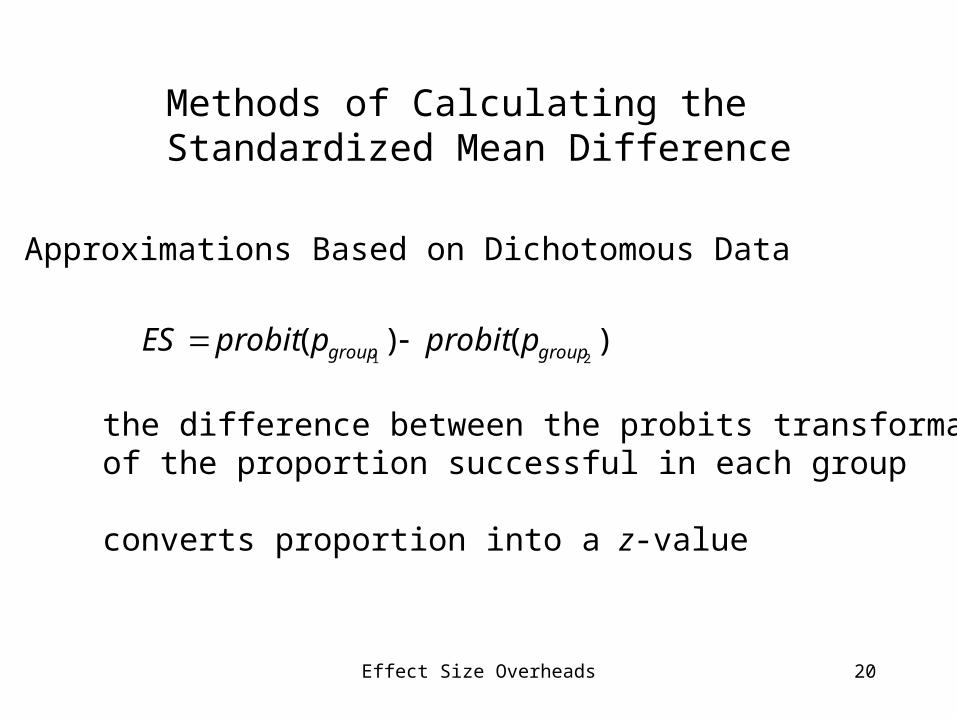
Methods of Calculating the Standardized Mean Difference
Approximations Based on Dichotomous Data
)()(21 groupgroup pprobitpprobitES
the difference between the probits transformationof the proportion successful in each group
converts proportion into a z-value
Effect Size Overheads 21
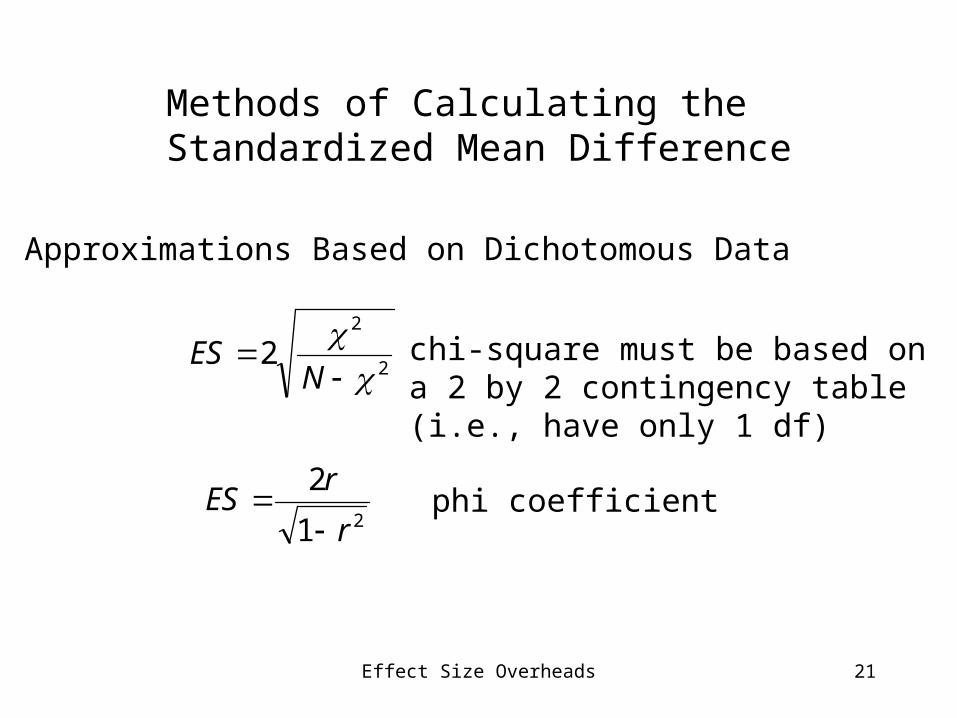
Methods of Calculating the Standardized Mean Difference
Approximations Based on Dichotomous Data
2
2
2
N
ES chi-square must be based ona 2 by 2 contingency table(i.e., have only 1 df)
21
2
r
rES
phi coefficient
Effect Size Overheads 22
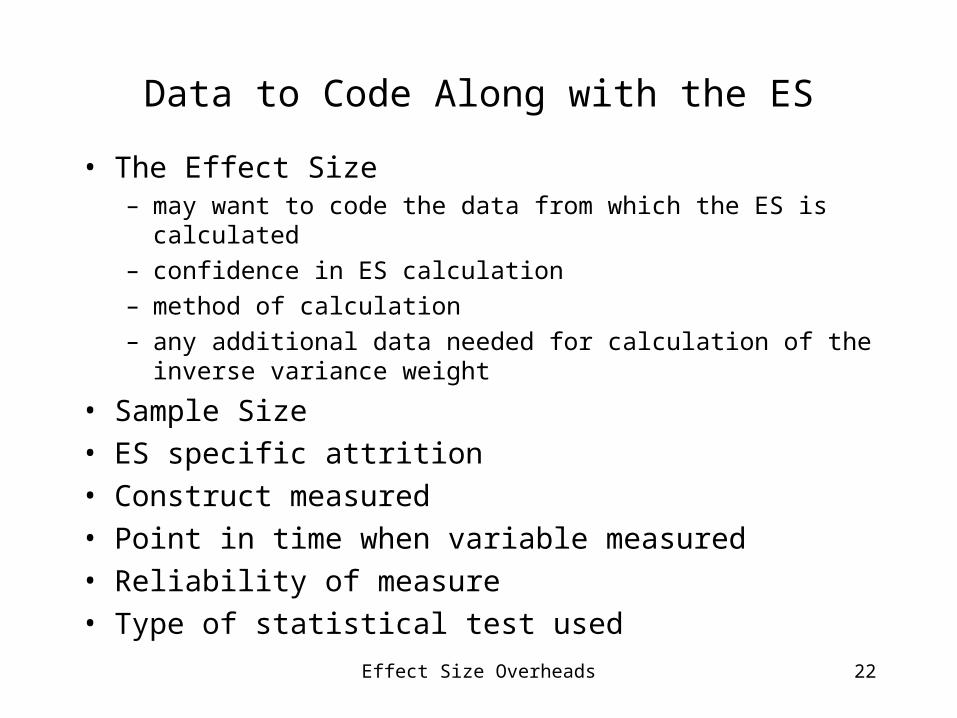
Data to Code Along with the ES
• The Effect Size– may want to code the data from which the ES is calculated– confidence in ES calculation– method of calculation– any additional data needed for calculation of the inverse
variance weight
• Sample Size• ES specific attrition• Construct measured• Point in time when variable measured• Reliability of measure• Type of statistical test used
Effect Size Overheads 23
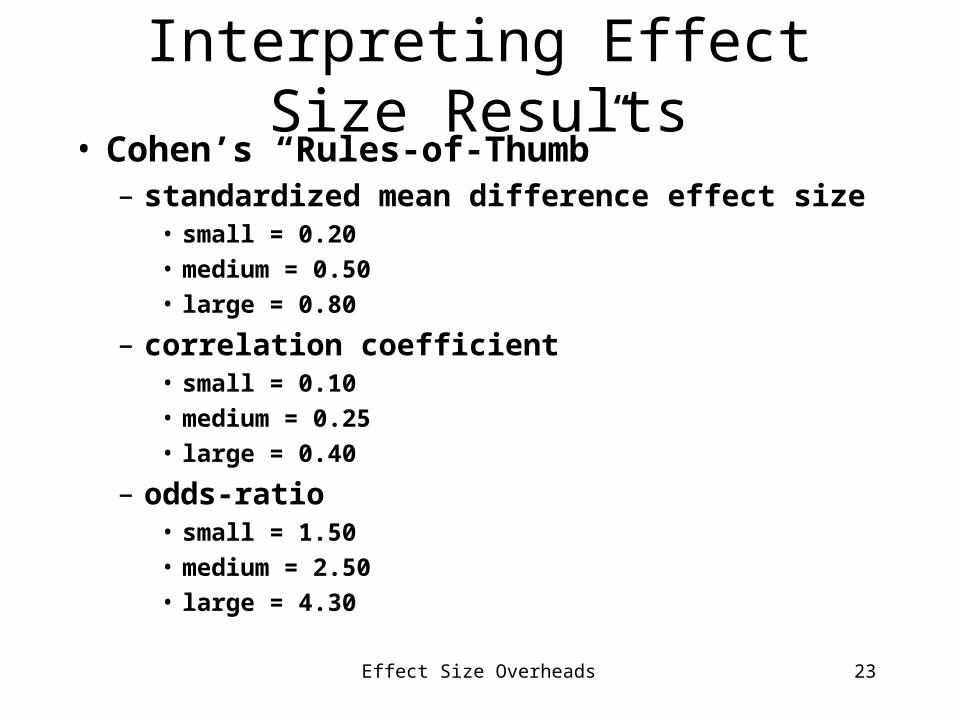
Interpreting Effect Size Results• Cohen’s “Rules-of-Thumb”
– standardized mean difference effect size• small = 0.20
• medium = 0.50
• large = 0.80
– correlation coefficient• small = 0.10
• medium = 0.25
• large = 0.40
– odds-ratio• small = 1.50
• medium = 2.50
• large = 4.30
Effect Size Overheads 24
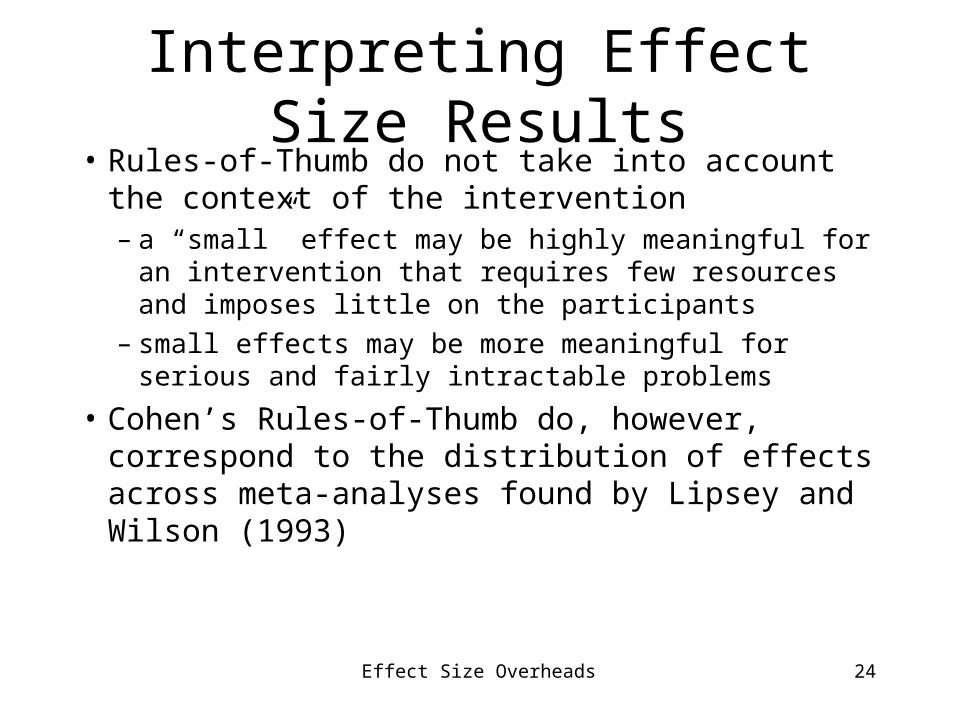
Interpreting Effect Size Results• Rules-of-Thumb do not take into account the
context of the intervention– a “small” effect may be highly meaningful for an
intervention that requires few resources and imposes little on the participants
– small effects may be more meaningful for serious and fairly intractable problems
• Cohen’s Rules-of-Thumb do, however, correspond to the distribution of effects across meta-analyses found by Lipsey and Wilson (1993)
Effect Size Overheads 25
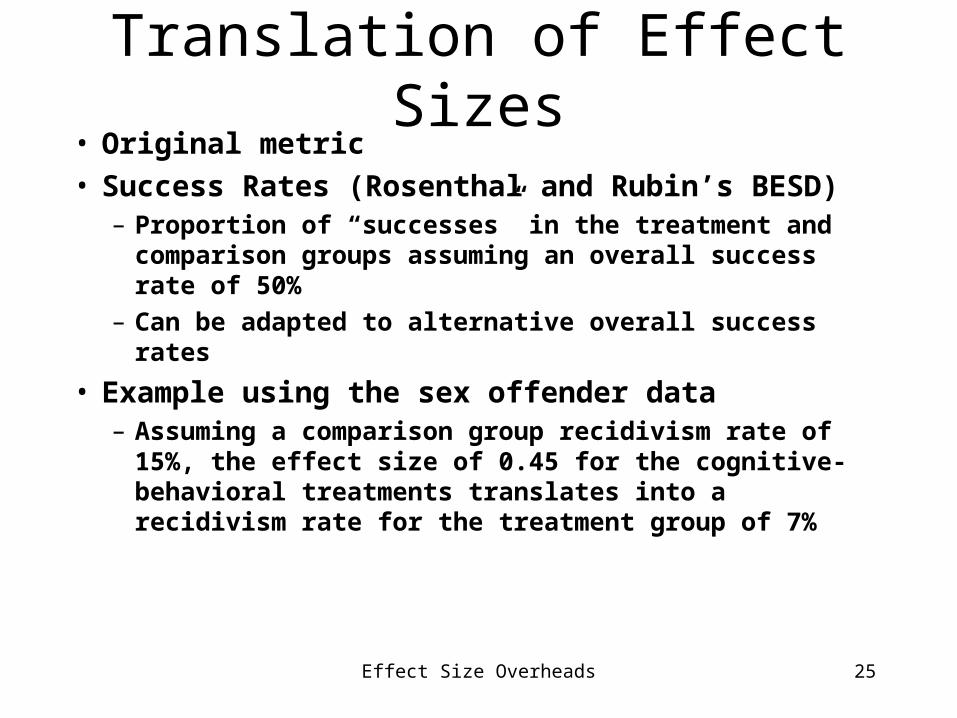
Translation of Effect Sizes• Original metric• Success Rates (Rosenthal and Rubin’s BESD)
– Proportion of “successes” in the treatment and comparison groups assuming an overall success rate of 50%
– Can be adapted to alternative overall success rates
• Example using the sex offender data– Assuming a comparison group recidivism rate of 15%, the
effect size of 0.45 for the cognitive-behavioral treatments translates into a recidivism rate for the treatment group of 7%
Effect Size Overheads 26
Methodological Adequacy of Research Base
• Findings must be interpreted within the bounds of the methodological quality of the research base synthesized.
• Studies often cannot simply be grouped into “good” and “bad” studies.
• Some methodological weaknesses may bias the overall findings, others may merely add “noise” to the distribution.
Effect Size Overheads 27
Confounding of Study Features
• Relative comparisons of effect sizes across studies are inherently correlational!
• Important study features are often confounding, obscuring the interpretive meaning of observed differences
• If the confounding is not severe and you have a sufficient number of studies, you can model “out” the influence of method features to clarify substantive differences
Effect Size Overheads 28
Concluding Comments• Meta-analysis is a replicable and defensible method
of synthesizing findings across studies• Meta-analysis often points out gaps in the research
literature, providing a solid foundation for the next generation of research on that topic
• Meta-analysis illustrates the importance of replication
• Meta-analysis facilitates generalization of the knowledge gain through individual evaluations