Embed Size (px)
Citation preview
Effect of Wet-Mat Curing Time and Earlier Loading on Long-Term Durability of Bridge Decks: Literature Review
By Sanjaya Senadheera, Randal Scott Phelan, Hector Garcia-Monzon, Aruna Amarasiri, Montasheema Afroze, Hari Aamidala, Sang-Yun Lee, Hassan Ghanem
Performed in Cooperation with the Texas Department of Transportation and the Federal Higway Administration
Research Project 0-2116 Research Report 0-2116-2 http://www.techmrt.ttu.edu/reports.php
Texas Tech University | Lubbock, Texas 79409P 806.742.3503 | F 806.742.4168

Notice
The United States Government and the State of Texas do not endorse products or manufacturers. Trade or manufacturers’ names appear herein solely because they are considered essential to the object of this report.
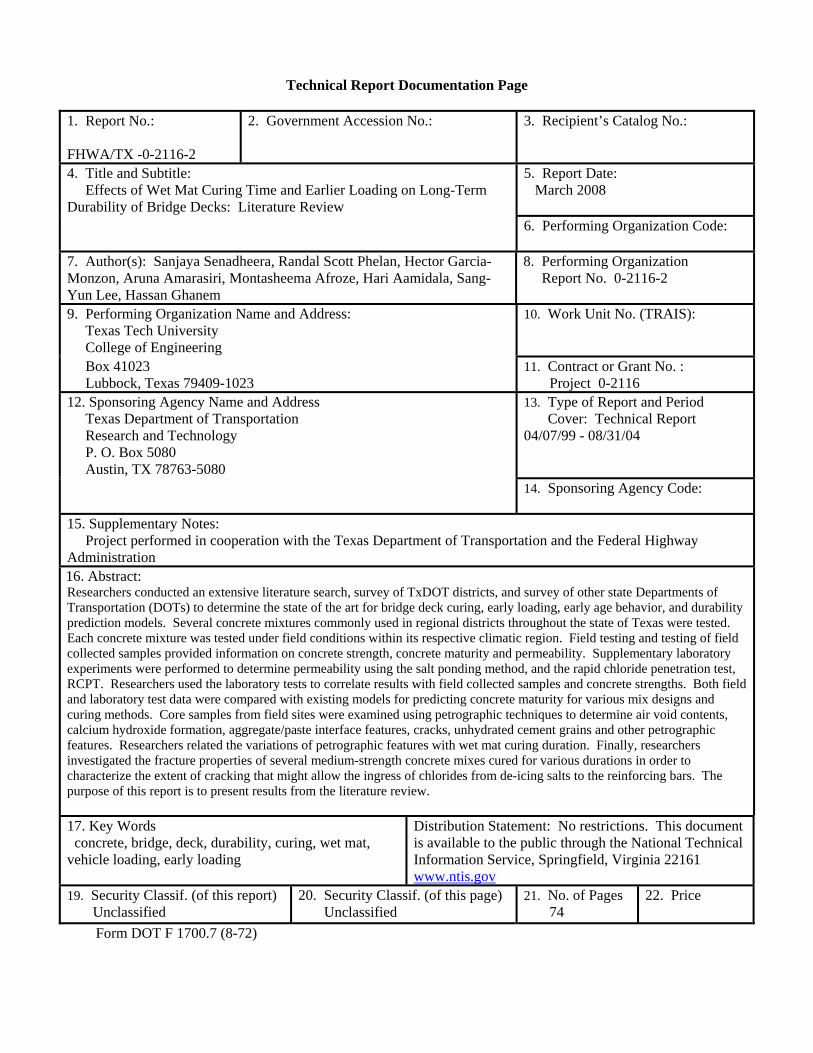
Technical Report Documentation Page
1. Report No.: FHWA/TX -0-2116-2
2. Government Accession No.:
3. Recipient’s Catalog No.:
4. Title and Subtitle: Effects of Wet Mat Curing Time and Earlier Loading on Long-Term Durability of Bridge Decks: Literature Review
5. Report Date: March 2008
6. Performing Organization Code:
7. Author(s): Sanjaya Senadheera, Randal Scott Phelan, Hector Garcia-Monzon, Aruna Amarasiri, Montasheema Afroze, Hari Aamidala, Sang-Yun Lee, Hassan Ghanem
8. Performing Organization Report No. 0-2116-2
9. Performing Organization Name and Address: Texas Tech University College of Engineering
10. Work Unit No. (TRAIS):
Box 41023 Lubbock, Texas 79409-1023
11. Contract or Grant No. : Project 0-2116
12. Sponsoring Agency Name and Address Texas Department of Transportation Research and Technology P. O. Box 5080 Austin, TX 78763-5080
13. Type of Report and Period Cover: Technical Report
04/07/99 - 08/31/04
14. Sponsoring Agency Code:
15. Supplementary Notes: Project performed in cooperation with the Texas Department of Transportation and the Federal Highway Administration 16. Abstract: Researchers conducted an extensive literature search, survey of TxDOT districts, and survey of other state Departments of Transportation (DOTs) to determine the state of the art for bridge deck curing, early loading, early age behavior, and durability prediction models. Several concrete mixtures commonly used in regional districts throughout the state of Texas were tested. Each concrete mixture was tested under field conditions within its respective climatic region. Field testing and testing of field collected samples provided information on concrete strength, concrete maturity and permeability. Supplementary laboratory experiments were performed to determine permeability using the salt ponding method, and the rapid chloride penetration test, RCPT. Researchers used the laboratory tests to correlate results with field collected samples and concrete strengths. Both field and laboratory test data were compared with existing models for predicting concrete maturity for various mix designs and curing methods. Core samples from field sites were examined using petrographic techniques to determine air void contents, calcium hydroxide formation, aggregate/paste interface features, cracks, unhydrated cement grains and other petrographic features. Researchers related the variations of petrographic features with wet mat curing duration. Finally, researchers investigated the fracture properties of several medium-strength concrete mixes cured for various durations in order to characterize the extent of cracking that might allow the ingress of chlorides from de-icing salts to the reinforcing bars. The purpose of this report is to present results from the literature review. 17. Key Words concrete, bridge, deck, durability, curing, wet mat, vehicle loading, early loading
Distribution Statement: No restrictions. This document is available to the public through the National Technical Information Service, Springfield, Virginia 22161 www.ntis.gov
19. Security Classif. (of this report) Unclassified
20. Security Classif. (of this page) Unclassified
21. No. of Pages 74
22. Price
Form DOT F 1700.7 (8-72)

0-2116-2 ii
Effects of Wet Mat Curing Time and Earlier Loading on Long-Term Durability of Bridge Decks: Literature Review
by Sanjaya Senadheera, Randal Scott Phelan, Hector Garcia-Monzon,
Aruna Amarasiri, Montesheema Afroze, Hari Aamidala, Sang-Yun Lee and Hassan Ghanem
Report Number 0-2116-2
Conducted for
Texas Department of Transportation
in cooperation with the U.S. Department of Transportation Federal Highway Administration
By the Center for Multidisciplinary Research in Transportation
0-2116-2 iii
AUTHOR’S DISCLAIMER The contents of this report reflect the views of the authors who are responsible for the facts and the accuracy of the data presented herein. The contents do not necessarily reflect the official view of policies of the Texas Department of Transportation or the Federal Highway Administration. This report does not constitute a standard, specification, or regulation.
PATENT DISCLAIMER There was no invention or discovery conceived or first actually reduced to practice in the course of or under this contract, including any art, method, process, machine, manufacture, design or composition of matter, or any new useful improvement thereof, or any variety of plant which is or may be patentable under the patent laws of the United States of America or any foreign country. ENGINEERING DISCLAIMER Not intended for construction, bidding, or permit purposes. TRADE NAMES AND MANUFACTURERS’ NAMES The United States Government and the State of Texas do not endorse products or manufacturers. Trade or manufacturers’ names appear herein solely because they are considered essential to the object of this report.
0-2116-2 iv
TABLE OF CONTENTS
Technical Documentation Page .................................................................................... i Title Page ...................................................................................................................... ii Disclaimers ................................................................................................................... iii Table of Contents.......................................................................................................... iv List of Tables ................................................................................................................ vi List of Figures ............................................................................................................... vi 1. INTRODUCTION.................................................................................................. 1 1.1 Curing ............................................................................................................... 1 1.1.1 Water Curing............................................................................................ 1 1.1.2 Sealed Curing........................................................................................... 2 1.2 Wet Mat Curing in Texas ................................................................................ 3 1.2.1 Objective .................................................................................................. 3 1.2.2 Approach.................................................................................................. 4 1.2.3 Purpose of this Report.............................................................................. 4 1.3 Composition of Cement .................................................................................... 5 1.3.1 Hydration of Cement................................................................................ 6 1.3.2 Supplementary Cementitious Materials................................................... 6 1.3.3 Fly Ash..................................................................................................... 7 1.3.4 Ground Granulated Blast-Furnace Slag ................................................... 7 1.3.5 Silica Fume .............................................................................................. 8 1.4 Studies of Concrete Curing............................................................................... 8 1.4 1 Studies of Curing Regimen Effects on Concrete Temperatures ............. 8
1.4.2 Studies of Curing Regimen Effects on Concrete Strength....................... 8 1.4.3 Studies of Curing Regimen Effects on Concrete Permeability................ 9 1.5 Methods to Determine Concrete Permeability ................................................. 9 1.5.1 Rapid Chloride Permeability Test............................................................ 10 1.5.2 Ponding Test ............................................................................................ 13 1.5.3 Related Integral Chloride and RCPT ....................................................... 15
2. DURABILITY OF CONCRETE........................................................................... 18 2.1.1 Permeability of Concrete ......................................................................... 20 2.1.2 Concrete Porosity..................................................................................... 21 2.1.3 Steel Corrosion......................................................................................... 22 2.2 Chloride Attacks and Carbonation.................................................................... 22 2.2.1 Classification of Chloride in Concrete..................................................... 22 2.3 Methods of Chloride Ion Transport .................................................................. 24 2.4 Effect of the Pore System on Chloride Ion Transport....................................... 25 2.5 Effect of Cracks on Chloride Penetration ......................................................... 27 2.6 Corrosion Mechanisms ..................................................................................... 27 2.6.1 Mechanism of Electrochemical Corrosion............................................... 27 2.6.2 Pourbaix Diagrams................................................................................... 28 2.6.3 Polarization .............................................................................................. 29 2.6.4 Passivity ................................................................................................... 30 2.6.5 Concrete as an Electrolyte ....................................................................... 30 2.6.6 Structure of Concrete ............................................................................... 31
0-2116-2 v
2.6.7 Concrete Electrolyte................................................................................. 32 2.6.8 Principles of Steel Corrosion in Concrete................................................ 33 2.6.9 Initiation of Steel Corrosion in Concrete ................................................. 36 2.7 Forms of Corrosion ........................................................................................... 37 2.8 Threshold Chloride Concentration.................................................................... 38 2.9 Effect of Pozzolans and other Supplementary Cementitious Materials on Concrete Properties........................................................................................... 40 2.9.1 Fly Ash..................................................................................................... 41 2.9.2 Slag Cement ............................................................................................. 44 2.10 Ion and Mass Transport in Concrete Mixes During RCPT............................. 45 2.10.1 Specific Electrical Conductivity of Concrete Pore Solution.................. 46 2.10.2 Effect of Supplementary Cementing Materials on Specific Electrical Conductivity of Concrete Pore Solution ........................................................... 47 2.11 Ion and Mass Transport in Concrete Mixes During Ponding Tests................ 49 2.12 Effect of the Interface Zone and Aggregate Type on Permeability of Concrete........................................................................................................ 51 2.13 Correlation Between Ponding Results and Rapid Chloride Permeability Tests............................................................................................. 52 REFERENCES ........................................................................................................... 57
0-2116-2 vi
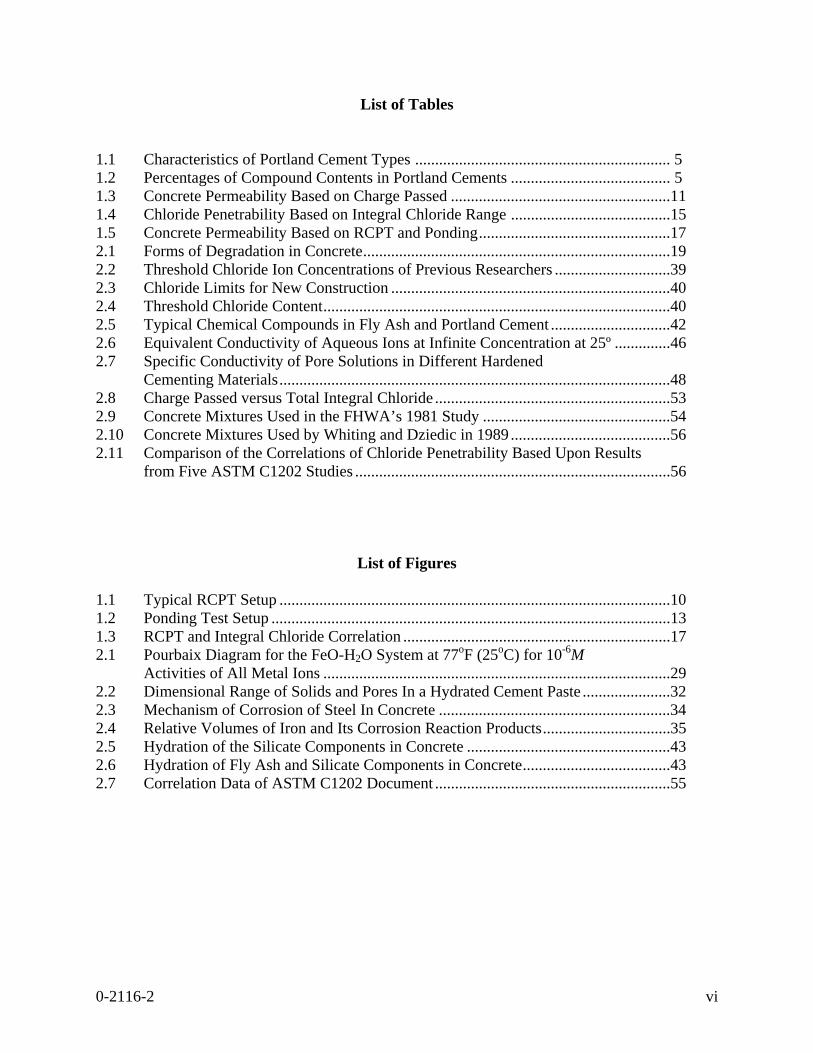
List of Tables
1.1 Characteristics of Portland Cement Types ................................................................ 5 1.2 Percentages of Compound Contents in Portland Cements ........................................ 5 1.3 Concrete Permeability Based on Charge Passed .......................................................11 1.4 Chloride Penetrability Based on Integral Chloride Range ........................................15 1.5 Concrete Permeability Based on RCPT and Ponding................................................17 2.1 Forms of Degradation in Concrete.............................................................................19 2.2 Threshold Chloride Ion Concentrations of Previous Researchers .............................39 2.3 Chloride Limits for New Construction ......................................................................40 2.4 Threshold Chloride Content.......................................................................................40 2.5 Typical Chemical Compounds in Fly Ash and Portland Cement ..............................42 2.6 Equivalent Conductivity of Aqueous Ions at Infinite Concentration at 25º ..............46 2.7 Specific Conductivity of Pore Solutions in Different Hardened Cementing Materials..................................................................................................48 2.8 Charge Passed versus Total Integral Chloride ...........................................................53 2.9 Concrete Mixtures Used in the FHWA’s 1981 Study ...............................................54 2.10 Concrete Mixtures Used by Whiting and Dziedic in 1989 ........................................56 2.11 Comparison of the Correlations of Chloride Penetrability Based Upon Results from Five ASTM C1202 Studies ...............................................................................56
List of Figures
1.1 Typical RCPT Setup ..................................................................................................10 1.2 Ponding Test Setup ....................................................................................................13 1.3 RCPT and Integral Chloride Correlation ...................................................................17 2.1 Pourbaix Diagram for the FeO-H2O System at 77oF (25oC) for 10-6M Activities of All Metal Ions .......................................................................................29 2.2 Dimensional Range of Solids and Pores In a Hydrated Cement Paste ......................32 2.3 Mechanism of Corrosion of Steel In Concrete ..........................................................34 2.4 Relative Volumes of Iron and Its Corrosion Reaction Products................................35 2.5 Hydration of the Silicate Components in Concrete ...................................................43 2.6 Hydration of Fly Ash and Silicate Components in Concrete.....................................43 2.7 Correlation Data of ASTM C1202 Document ...........................................................55

0-2116 R2 1
CHAPTER I
INTRODUCTION
1.1 CURING
Curing is the practice of maintaining a favorable moisture content and temperature
within a concrete for a period of time (Garcia-Monzon, 2006). The duration and
effectiveness of a curing treatment affects the development of concrete properties such as
strength, permeability, and resistance to freeze-thaw deterioration. Insufficient moisture
during curing has been found to produce cracks, compromise strength, and reduce long-
term durability (Wojcik and Fitzjarrald 2001). For Portland cements, typically the highest
rate of heat generation occurs during the first 24 hours after initial contact between water
and cement, and a large amount of heat due to hydration evolves within the first three days
(PCA, 1997). To prevent mix water from evaporating due to the heat of hydration and /or
ambient conditions and to ensure sufficient moisture is present, concrete should be kept
moist or saturated during this critical period.
There are primarily two methods of curing which can be used in the field – water
and sealed curing. Water curing supplies additional moisture to the concrete as well as
prevents mix water evaporation. Sealed curing does not supply additional moisture but
rather relies on the prevention of moisture loss.
1.1.1 Water Curing
Water curing can be accomplished by spraying or ponding water on the concrete
surface or applying moist coverings. The use of lawn sprinklers is one method of spraying
water on concrete and keeping it saturated. Spraying tends to consume large amounts of
water, however, and is not economical when water supplies at the site are limited. If
spraying is performed in intervals, drying of the concrete must not be allowed to prevent
surface crazing (PCA 1998). Care must also be taken to prevent erosion of freshly finished
concrete.
Curing concrete by way of ponding requires maintaining a layer of water on the
concrete surface. This is performed by surrounding the perimeter of the concrete with
0-2116 R2 2
earth or sand dikes which can sustain a pond of water. Ponding is a good method to
prevent moisture loss, provide sufficient moisture, and maintain a constant temperature
during concrete hydration. Although ponding may be a good method, it requires a great
deal of work.
Moist coverings are another form of water curing and include cotton mats, burlap,
and other moisture-retaining fabrics. These coverings should be: (1) applied on top of the
concrete as soon as the concrete has hardened sufficiently, (2) saturated with water, and
(3) kept continually moist for the duration of the curing period. Periodic supervision is
necessary since coverings tend to dry out and therefore need occasional moistening.
If water curing is the method of choice, it should be applied as soon as possible to prevent
the sealing of capillary pores due to drying. However, it cannot be applied too early due to
the possible existence of bleed water, which can increase the water cement ratio of the
cement paste at the top surface.
1.1.2 Sealed Curing
Sealed curing can consist of plastic sheeting, waterproof paper or membrane-
forming curing compound. Plastic sheeting or waterproof paper should be applied to the
surface of the concrete as soon as possible. However, it cannot be placed too soon or
marring of the surface will occur. Plastic sheeting traps evaporated moisture within the
sheeting. The moisture condenses on the sheeting and redistributes itself over the surface of
the concrete. This condensed moisture helps continue the hydration process.
Curing compounds or membrane-forming compounds have become a very popular
form of curing as they can be applied much sooner than sheets or mats. Although curing
compounds have found wide acceptance, they provide the least amount of curing
protection. Also, they do not necessarily prevent complete evaporation of mix water.
Instead, they only retard this process, as it is typically impossible to completely seal the
entire concrete deck surface with the compound. As a result of an impermeable layer
forming on the concrete surface, mix water generally is the primary means for hydration,
with some help possible from moist curing if applied later. The use of curing compounds is
best after there has been some initial time of moist curing (e.g., sprinkling water, ponding,
or saturated covering).
0-2116 R2 3
1.2 WET MAT CURING IN TEXAS
The Texas Department of Transportation (TxDOT) allows the use of what is termed
“wet mats” to aid in the curing of concrete in Specification 420 (TxDOT, 2004). Fresh
concrete in bridge decks is kept continuously wet by maintaining wet cotton mats in direct
contact with the fresh concrete for a specified curing time. The specification requirement
for wet mat curing is 8 days for decks with Type I cement, 10 days for decks with Type II
or I/II cement, and 10 days for decks with supplementary cementing materials. (TxDOT,
2004). The concrete can be opened to all traffic after the specification requirement of 8 –
10 days wet mat curing plus a day for the surface to dry and a day to apply the concrete
surface treatment, for a total of 10 – 12 days. The 1995 specification required a minimum
of 14 days for construction traffic not to exceed three-quarter ton vehicles and a minimum
of 21 days to open to all traffic. The 1982 specification required 14 days before
construction traffic was allowed and a minimum of 30 days before opening to all traffic.
The longer times required by the earlier specifications were based upon concerns that
younger concrete might have more microcracking due to applied loads.
1.2.1 Objective
Although concrete mix designs have improved in high early strength and durability
capabilities, there is a paucity of quantitative field and laboratory data on the durability
properties of early-loaded concrete. TxDOT and the general public would like to open
newly-cast concrete bridge decks to full traffic as early as possible to relieve roadway
congestion and decrease project costs. The objective of this research program was to
collect field and laboratory data leading to a better understanding of the relationships of
concrete mix designs across the state of Texas, allowance of early loading, and long-term
durability of the concrete bridge decks. Additionally, researchers developed a method
named the Strength Durability Index, SDI method, to predict the strength and permeability
of concrete. The SDI method can be used as a guideline for terminating wet mat curing and
determining when traffic loading can be allowed.
0-2116 R2 4
1.2.2 Approach
Researchers conducted an extensive literature search, survey of TxDOT districts,
and survey of other state Departments of Transportation (DOTs) to determine the state-of-
the-art for bridge deck curing, early loading, early age behavior, and durability prediction
models (Phelan, undated, Phelan and Senadheera, February 2001). Several concrete
mixtures commonly used in regional districts throughout the state of Texas were tested
(Garcia-Monzon, 2006). Each concrete mixture was tested under field conditions within its
respective climatic region. Field testing and testing of field-collected samples provided
information on concrete strength, concrete maturity and permeability. Supplementary
laboratory experiments were performed to determine permeability using the salt ponding
method (Garcia-Monzon, 2006), and the Rapid Chloride Permeability Test, RCPT, (Afroze,
2002). Researchers used the laboratory tests to correlate results with field-collected
samples and concrete strengths. Both field and laboratory test data were compared with
existing models for predicting concrete maturity, and a Strength Durability Index (SDI) was
developed to predict strength and permeability of concrete for various mix designs and
curing methods (Garcia-Monzon, 2006). Core samples from three field sites were
examined using petrographic techniques to determine air void contents, calcium hydroxide
contents, aggregate/paste interface features, cracks, unhydrated cement grains and other
petrographic features (Lee, 2000). Researchers related the variations of petrographic
features with wet mat curing duration. Finally, researchers investigated the fracture
properties of several medium-strength concrete mixes cured for various durations in order
to characterize the extent of cracking that might allow the ingress of chlorides from de-
icing salts to the reinforcing bars (Amarasiri, 2003).
1.2.3 Purpose of This Report
The purpose of this report is to present results from an extensive literature review
completed in the initial stages of the research project. The literature review topics included
concrete curing, early loading of concrete bridge decks, early age behavior of concrete,
durability prediction models, descriptions of test procedures used in the research and
descriptions of test sites. A brief description of concrete composition, hydration, curing,
and strength development is first provided as an introduction. In addition, the Rapid
0-2116 R2 5
Chloride Permeability Test (RCPT) and ponding test are presented. With these are
accompanied the guidelines which assign a permeability classification to the concrete.
1.3 COMPOSITION OF CEMENT
Ordinary Portland cement is generally composed of four major compounds:
tricalcium silicate (C3S), dicalcium silicate (C2S), tricalcium aluminate (C3A), and
tetracaclicum aluminoferrite (C4AF). The percentages of these compounds can be
manipulated to modify properties of cement to achieve desirable qualities. ASTM C150
distinguished five types of Portland cement: Types I, II, III, IV, and V. The characteristics
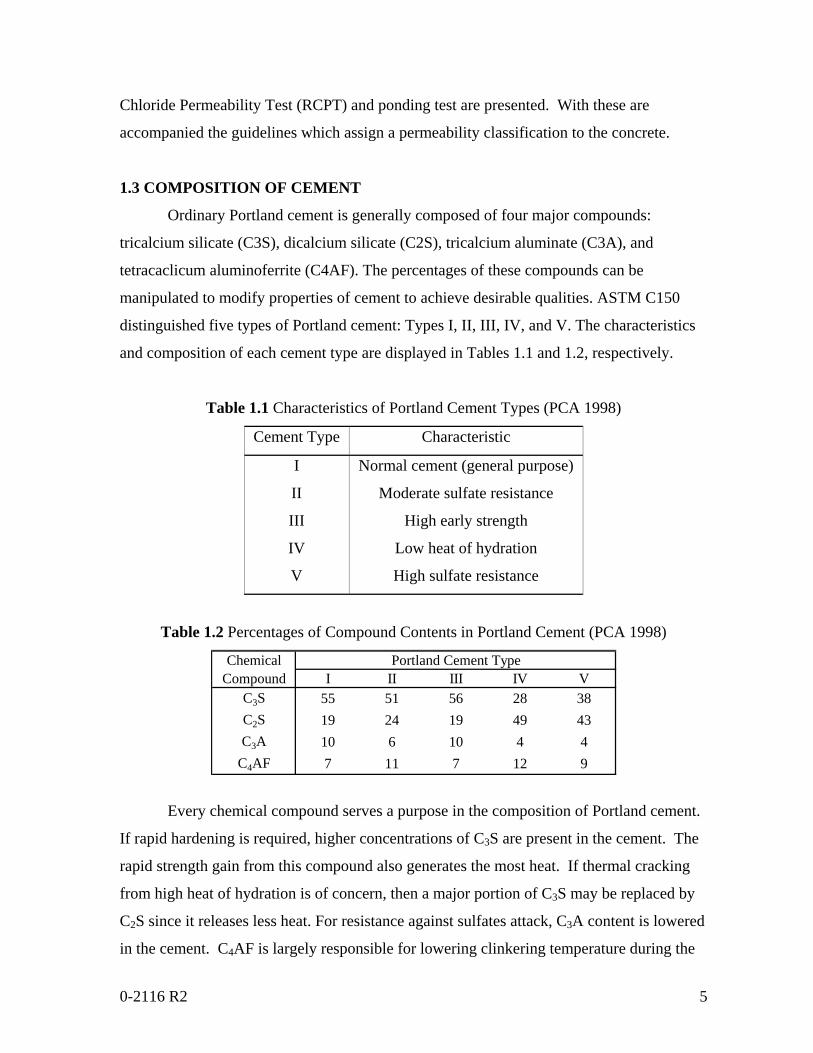
and composition of each cement type are displayed in Tables 1.1 and 1.2, respectively.
Table 1.1 Characteristics of Portland Cement Types (PCA 1998)
Cement Type Characteristic
I
II
III
IV
V
Normal cement (general purpose)
Moderate sulfate resistance
High early strength
Low heat of hydration
High sulfate resistance
Table 1.2 Percentages of Compound Contents in Portland Cement (PCA 1998)
ChemicalCompound I II III IV V
C3S 55 51 56 28 38C2S 19 24 19 49 43C3A 10 6 10 4 4
C4AF 7 11 7 12 9
Portland Cement Type
Every chemical compound serves a purpose in the composition of Portland cement.
If rapid hardening is required, higher concentrations of C3S are present in the cement. The
rapid strength gain from this compound also generates the most heat. If thermal cracking
from high heat of hydration is of concern, then a major portion of C3S may be replaced by
C2S since it releases less heat. For resistance against sulfates attack, C3A content is lowered
in the cement. C4AF is largely responsible for lowering clinkering temperature during the
0-2116 R2 6
production of Portland cement and also contributes to the cement’s color.
1.3.1 Hydration of Cement
The hydration of concrete is an exothermic chemical process. Heat generated from
this process is primarily due to the interaction between water and C3S within the cement
(Mindess et al., 2002). Although other chemicals are present in Portland cement, they
generally have minor roles in the production of heat during the hydration process.
When cement first comes into contact with water a period of rapid heat evolution
occurs and lasts approximately 15 minutes, followed by a dormant period of inactivity that
indicates the plastic state of concrete. Concrete will generally remain in a plastic state
anywhere from 2 to 4 hours after mixing.
Following the plastic state, an acceleration period of renewed reaction within the
cement occurs. Hydration products consisting of a hydrate layer form around the surface of
C3S particles and are produced at a high rate. The reaction is accompanied by an increased
rate of heat generation (Mindess et al. 2002). As the temperature rises in the concrete, the
hydration rate is further accelerated and concrete gains strength rapidly (PCA, 1997). It is at
the end of this stage that the maximum rate of heat generation is achieved. The
acceleration period lasts for about 4 to 8 hours.
A deceleration period, resulting from the constant growth of the hydrate layer
around C3S particles, follows the acceleration period. The hydrate layer begins to obstruct
the path of free pore water in the concrete from reaching unhydrated C3S particles. With
increasing pore water path obstruction from growing hydrate layers, the hydration process
approaches the steady state, where hydration continues to occur, but at a very slow and
steady rate. The steady state period starts about 18 to 36 hours from initial contact between
water and cement. Once this stage has been reached, hydration approaches 100%
completion asymptotically (Mindess et al., 2002).
1.3.2 Supplementary Cementitious Materials (SCMs)
Supplementary Cementitious Materials (SCMs) are siliceous or aluminosiliceous
materials with little to no cementitious attributes in themselves. However, SCMs do react
with water and calcium hydroxide produced from the hydration of Portland cement. The
0-2116 R2 7
use of SCM as a cement replacement can produce a lower cost concrete, since some SCMs
can be half the price of cement (Mindess 2002) and concrete with more desirable
properties. The properties warranted for a concrete mixture can determine the quantity and
required SCM material.
SCMs usually have a slower rate of reduction. This results in lower heats of
hydration and reduced early-age strength. Long-term strength, however, is not affected
and can be improved with the correct addition of SCM. In order to gain the benefits from
the addition of SCMs, a longer period of moist curing is needed to progress the hydration
of such material, otherwise it will act as a filler. SCMs primarily for cement replacement
include fly ash and silica fume. The benefits of both are discussed in the following
sections.
1.3.3 Fly Ash
Fly ash is a noncombustible inorganic residue from coal burning in power plants.
The two common types of fly ash are class C and F. Class C fly ash is higher in calcium
content than class F fly ash. In addition, class C fly ash reacts with water and hardens
whereas class F fly ash will remain relatively dormant.
The use of fly ash in a concrete mixture can reduce the amount of heat generated
during hydration and thus minimize thermal cracking. Fly ash aids in the placement of
concrete by improving workability and reducing segregation and bleeding. Fly ash can
reduce concrete permeability and improve long term strength provided a prolonged and
sufficient curing duration is used (PCA 1998).
1.3.4 Ground Granulated Blast-Furnace Slag (GGBS)
GGBS is primarily a by-product from blast furnace production of iron from ore.
The advantages of using GGBS in a concrete mixture include a reduction in heat of
hydration, improved workability, and reduced permeability with a period of adequate
curing. A negative effect of GGBS is the potential of increased bleeding after concrete
placement (PCA 1998).
0-2116 R2 8
1.3.5 Silica Fume
Silica fume is produced from the oxidized vapor resulting from the manufacture
of silicon or ferrosilicon alloy. Silica fume can lessen segregation and bleeding of a
concrete mixture and is very effective in reducing permeability with appropriate curing.
However, concrete mixtures containing silica fume generally required more water to
produce the same slump as in a concrete without silica fume (PCA 1998). Thus,
workability may be reduced if mix water is not increased.
1.4 STUDIES OF CONCRETE CURING 1.4.1 Studies of Curing Regimen Effects on Concrete Temperature
Curing method can affect and/or control the temperature rise in concrete slabs.
Findings by Cable, Wang, and Ge (2003) have shown moist-curing to be the most effective
method to minimize the variation in concrete surface temperatures due to diurnal
atmospheric conditions when compared to utilizing only a curing compound or nothing at
all. Sections receiving the curing compound treatment had better surface temperature
control with respect to the section with no cure coverage. Moreover, Khan, Cook, and
Mitchell (1998) have found cure treatment to affect peak temperature. They subjected 4-
inch thick concrete slabs to three different cure treatments under laboratory conditions of
22 °C (71.6 °F) and relative humidity of 50%. The cure treatments used were moist (wet
burlap), sealed (covered with polyethylene), and air cured. Both the moist and sealed cured
concretes produced relatively high peak temperatures (approximately 120 to 127 °F) at 21
hours when compared to the air-cured slabs (95 °F at 24 hours). Moist and sealed curing
would be beneficial during cold weather concreting since the increase in peak temperature
would help progress hydration.
1.4.2 Studies of Curing Regimen Effects on Concrete Strength
The factors affecting concrete strength development, other than mixture
composition, are primarily temperature and moisture. Findings from other researchers
(Soroka and Baum 1994, Aïtcin et al. 1994, Nassif and Suksawang 2002, Conroy-Jones and
Barr 2003) consistently reveal very low compressive and tensile strengths for air-cured (no
protection against moisture loss) specimens when compared to specimens with either water
0-2116 R2 9
or sealed curing. These studies support the fact that moisture is an important factor for
proper hydration and strength development.
With proper hydration during curing, early age compressive strength may be
accelerated by increasing curing temperature. Of course, this increase in temperature can
cause lower ultimate strengths when compared to curing at normal temperatures (Topcu
and Toprak 2005, Klieger 1958, Chanvillard and D’Aloia 1997). If a high early age
compressive strength is desired, engineers must decide on an acceptable degree of strength
acceleration without sacrificing ultimate strength.
1.4.3 Studies of Curing Regimen Effects on Concrete Permeability
Nassif and Suksawang (2002) reported lower permeability from concrete samples
that were moist-cured with wet burlap as opposed to no curing. Permeability was further
reduced with increased cure duration. Cable, Wang, and Ge (2003) discovered that the top
concrete of a slab was affected by the type of concrete treatment. Slab sections treated with
either a double application of curing compound or moist covering had lower permeability
when compared to uncured slabs. They found, however, concrete at the bottom of the slabs
to have similar permeability irrespective of the cure treatment used.
Therefore, the structure of the top layer concrete is of major concern during curing.
Assuring adequate protection against drying reduces porosity (Alsayed 1994) and results in
a tighter and less permeable matrix.
1.5 METHODS TO DETERMINE CONCRETE PERMEABILITY
Concrete strength is sometimes used as an indirect durability measure. This
parameter alone is not sufficient to dictate the level of durability but should be coupled with
additional parameters. The level of concrete permeability has long been an accepted
measure of durability. A strong durable concrete would be characterized as having low
permeability. Concretes with low permeability have a high penetration resistance towards
harmful liquids or gases, such as chlorine ions. This high resistance helps deter damaging
reactions which may occur from these harmful materials. Conversely, high permeable
concretes (low resistance to penetration) offer little protection from such intrusion. These
unsafe agents can lead to the breakdown of the concrete matrix by creating internal
0-2116 R2 10
pressures from the formation of rust on reinforcement steel.
A number of tests are available to determine concrete permeability. Some of these
test methods measure chloride ion penetrability directly while others measure it indirectly.
Of the test methods available, the Rapid Chloride Permeability Test (RCPT) and the Test
for Resistance of Concrete to Chloride Ion Penetration (hereafter referred to as ponding
test) are the most popular. Both these methods have desirable qualities as well as
shortcomings, which are discussed in the following sections.
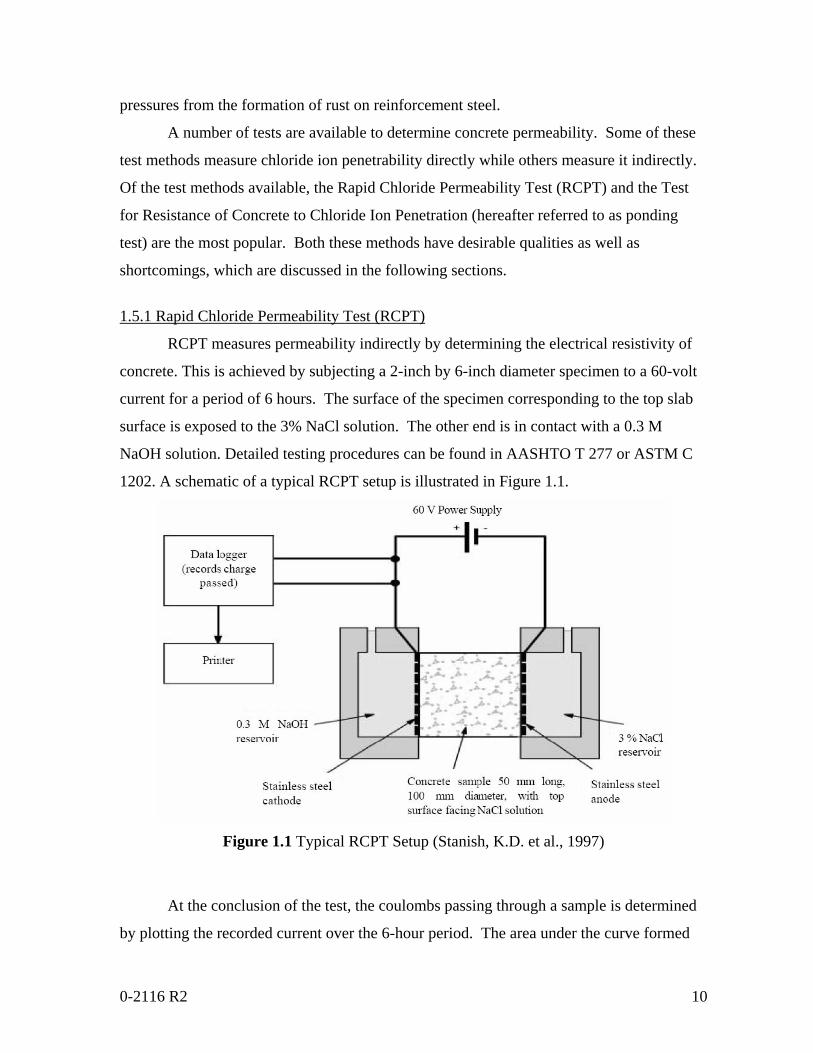
1.5.1 Rapid Chloride Permeability Test (RCPT)
RCPT measures permeability indirectly by determining the electrical resistivity of
concrete. This is achieved by subjecting a 2-inch by 6-inch diameter specimen to a 60-volt
current for a period of 6 hours. The surface of the specimen corresponding to the top slab
surface is exposed to the 3% NaCl solution. The other end is in contact with a 0.3 M
NaOH solution. Detailed testing procedures can be found in AASHTO T 277 or ASTM C
1202. A schematic of a typical RCPT setup is illustrated in Figure 1.1.
Figure 1.1 Typical RCPT Setup (Stanish, K.D. et al., 1997)
At the conclusion of the test, the coulombs passing through a sample is determined
by plotting the recorded current over the 6-hour period. The area under the curve formed
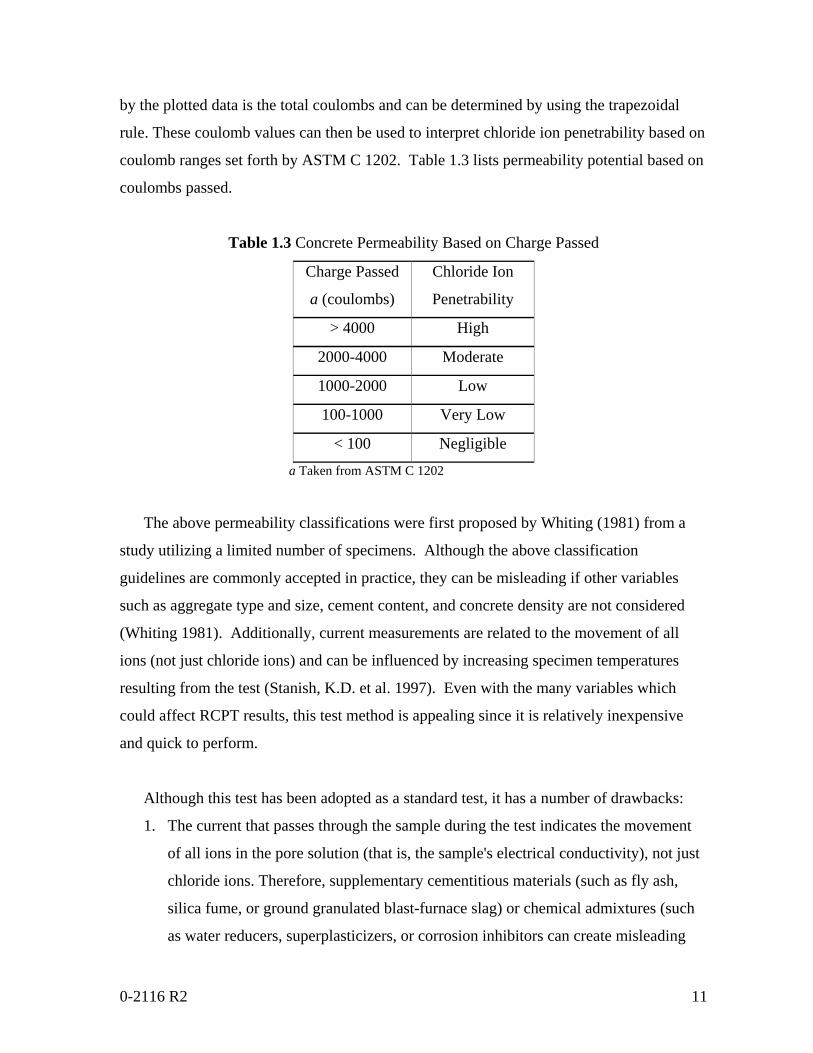
0-2116 R2 11
by the plotted data is the total coulombs and can be determined by using the trapezoidal
rule. These coulomb values can then be used to interpret chloride ion penetrability based on
coulomb ranges set forth by ASTM C 1202. Table 1.3 lists permeability potential based on
coulombs passed.
Table 1.3 Concrete Permeability Based on Charge Passed
Charge Passed
a (coulombs)
Chloride Ion
Penetrability
> 4000 High
2000-4000 Moderate
1000-2000 Low
100-1000 Very Low
< 100 Negligible
a Taken from ASTM C 1202
The above permeability classifications were first proposed by Whiting (1981) from a
study utilizing a limited number of specimens. Although the above classification
guidelines are commonly accepted in practice, they can be misleading if other variables
such as aggregate type and size, cement content, and concrete density are not considered
(Whiting 1981). Additionally, current measurements are related to the movement of all
ions (not just chloride ions) and can be influenced by increasing specimen temperatures
resulting from the test (Stanish, K.D. et al. 1997). Even with the many variables which
could affect RCPT results, this test method is appealing since it is relatively inexpensive
and quick to perform.
Although this test has been adopted as a standard test, it has a number of drawbacks:
1. The current that passes through the sample during the test indicates the movement
of all ions in the pore solution (that is, the sample's electrical conductivity), not just
chloride ions. Therefore, supplementary cementitious materials (such as fly ash,
silica fume, or ground granulated blast-furnace slag) or chemical admixtures (such
as water reducers, superplasticizers, or corrosion inhibitors can create misleading
0-2116 R2 12
results largely due to the chemical composition of the pore solution, rather than
from the actual permeability. As a result, some researchers do not recommend the
RCPT to evaluate the chloride permeability of concrete containing these materials
(Shi et al., 1998).
2. The conditions under which the measurements are taken may cause physical and
chemical changes in the specimen, resulting in unrealistic values (Feldman et al.,
1994). For example, the high voltage applied during the test increases the
temperature of the sample, which can accelerate hydration, particularly in younger
concretes.
3. The test has low inherent repeatability and reproducibility characteristics. As stated
in the ASTM procedure, a single operator will have a coefficient of variation of
12.3%; thus the results from two properly conducted tests on the same material by
the same operator could vary by as much as 42% (ASTM C1202.97). The
multilaboratory coefficient of variation has been found to be 18.0%; thus two
properly conducted tests on the same material by different laboratories could vary
by as much as 51%. For this reason, three tests are usually conducted and the test
results averaged, which brings the multilaboratory average down to 29%.
4. Another difficulty with the RCPT test is that it depends upon the conductivity of the
concrete being in some way related to the chloride ion penetrability. Thus, any
conducting material present in the concrete sample will bias the results, causing
them to be too high. This would be the case if any reinforcing steel is present, if
conductive fibers are used (e.g. carbon or steel), or if a highly ionic conductive pore
solution is present (ASTM C 1202). This pore solution effect may be noticed if
calcium nitrite is included as a corrosion inhibiting admixture, and other admixtures
may also have this effect (ASTM C1202). Because these conductors all influence
the results, a higher coulomb value than would otherwise be recorded may be
determined. Nevertheless, the method still can serve as a quality control test. It can
qualify a mix, but not necessarily disqualify it (Ozyildirim, 1994). If an acceptably
low rating is achieved, it is known that the concrete is not worse than that, at least
within the precision of the test method.
0-2116 R2 13
1.5.2 Ponding Test
The ponding test directly measures chloride ion concentration at different depths of
a concrete sample. This procedure is performed on concrete specimens that have a
minimum top surface area of 300-mm by 300-mm (12-in. x 12-in.) and at least 75-mm (3-
in.) in height. Concrete samples are cured for 14 days and stored for 28 days as outlined in
AASHTO T 259. Some variations to the curing and storage procedure can be made if
experimental work seeks to investigate non-standard laboratory conditions, as is the case
for this study. Alterations to the standards are discussed in more detail in subsequent
chapters.
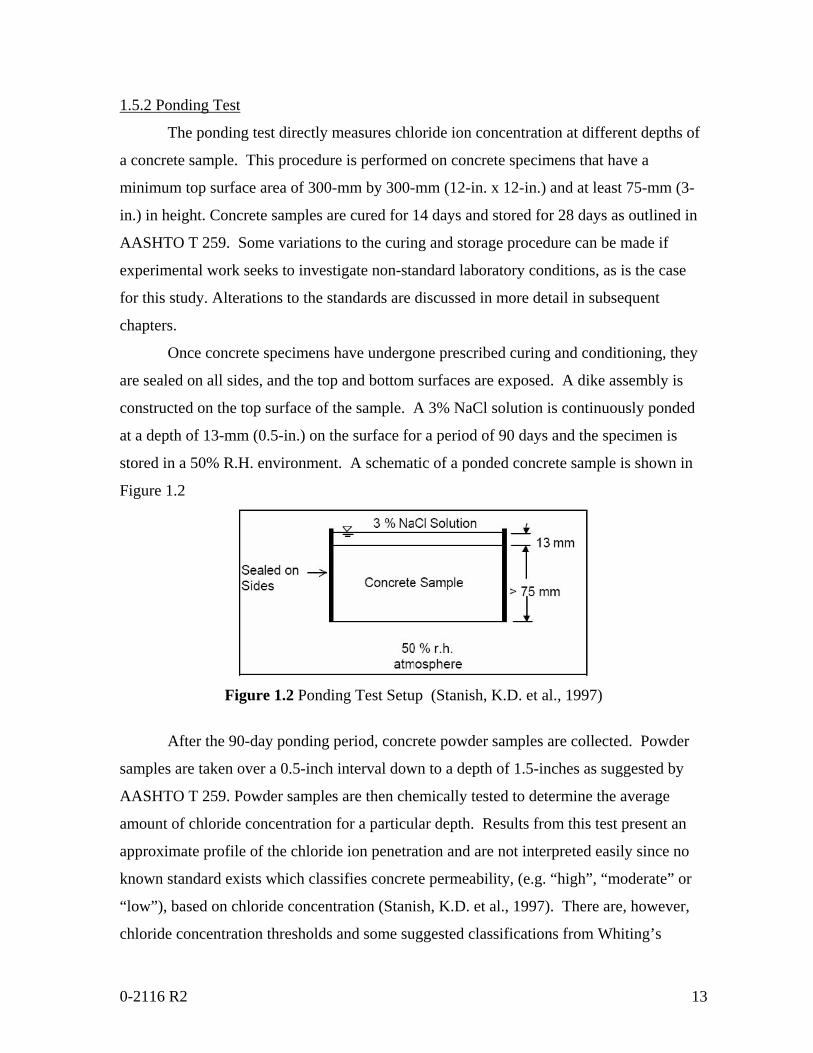
Once concrete specimens have undergone prescribed curing and conditioning, they
are sealed on all sides, and the top and bottom surfaces are exposed. A dike assembly is
constructed on the top surface of the sample. A 3% NaCl solution is continuously ponded
at a depth of 13-mm (0.5-in.) on the surface for a period of 90 days and the specimen is
stored in a 50% R.H. environment. A schematic of a ponded concrete sample is shown in
Figure 1.2
Figure 1.2 Ponding Test Setup (Stanish, K.D. et al., 1997)
After the 90-day ponding period, concrete powder samples are collected. Powder
samples are taken over a 0.5-inch interval down to a depth of 1.5-inches as suggested by
AASHTO T 259. Powder samples are then chemically tested to determine the average
amount of chloride concentration for a particular depth. Results from this test present an
approximate profile of the chloride ion penetration and are not interpreted easily since no
known standard exists which classifies concrete permeability, (e.g. “high”, “moderate” or
“low”), based on chloride concentration (Stanish, K.D. et al., 1997). There are, however,
chloride concentration thresholds and some suggested classifications from Whiting’s
0-2116 R2 14
(1981) previous work on RCPT development, which are discussed in the following section.
The ponding test has several limitations including:
1. It takes at least 132 days from the time the samples are made to complete the test,
requiring the concrete samples be cast at least five months before job site casting to
evaluate the chloride permeability of a specific concrete.
2. A ponding period of 90 days is often too short to differentiate between the chloride
permeability of different high performance concretes. A longer ponding time,
however, extends the lead time necessary.
3. The .433 in. - and .511 in. thicknesses of the chloride samples do not provide a fine
enough measurement to allow for determination of a profile of the chloride
penetration. The test method allows an option - specifying other thicknesses - which
many researchers exercise.
4. The ponding test provides a crude one-dimensional chloride ingress profile, but this
profile is not just a function of chloride diffusion. Since the specimens have been
left to dry for 28 days, there is an initial sorption effect when the slabs are first
exposed to the solution. Salt solution is drawn quickly into the pores of the concrete.
Also, the exposure of the bottom face to a 50 percent relative humidity environment
during the test causes chlorides to be drawn into the concrete through a mechanism
other than pure diffusion. There is vapor transmission from the wet front in the
concrete to the drier atmosphere at the external face, causing more water to be
drawn into the concrete and bringing chloride ions with it. This effect is called
wicking (Stanish et al., 1997).
5. Although all these transport mechanisms may be present in a structure, the relative
importance of each is not necessarily reflected by this test procedure. The test
overemphasizes the importance of sorption, and to a lesser extent wicking. The
relative amount of chloride pulled into the concrete by capillary absorption to the
amount entering by diffusion will be greater when the test is only 90 days than
when compared to the relative quantities entering during the lifetime of a structure.
Also, if wicking is occurring in the concrete element of interest, the relative
0-2116 R2 15
humidity gradient will likely be less, at least for part of the time, than that which is
set up during the test (Stanish et al., 1997).
1.5.3 Relating Integral Chloride and RCPT
Whiting’s (1981) study of rapid chloride permeability determination led to the
accepted chloride penetrability classifications presented in Table 1.3. While establishing
this coulomb-based classification system, Whiting determined chloride concentrations for
the same concrete mixtures in the study. Whiting presented this parameter as total integral
chloride and defined it as the chloride concentration versus unit depth of 0.2-inch
increments as opposed to actual depth. Whiting believed this approach to be best since
“sufficient results were not available on the lateral distribution of chloride within the test
slabs” and “an integration using the actual depth values would only indicate how much
chloride was contained in the particular drill hole sample, not in the slab as a whole”
(Whiting 1981).
Cross-referencing results between ponding specimens and electrical resistivity
tests performed on slab specimens, Whiting (1981) determined mean integral chloride
values for corresponding permeability classifications. The integral chloride was
calculated as a percentage of concrete sample weight. Plotted data correlating coulomb
and integral chloride did not completely lie on a line of best fit, therefore Whiting
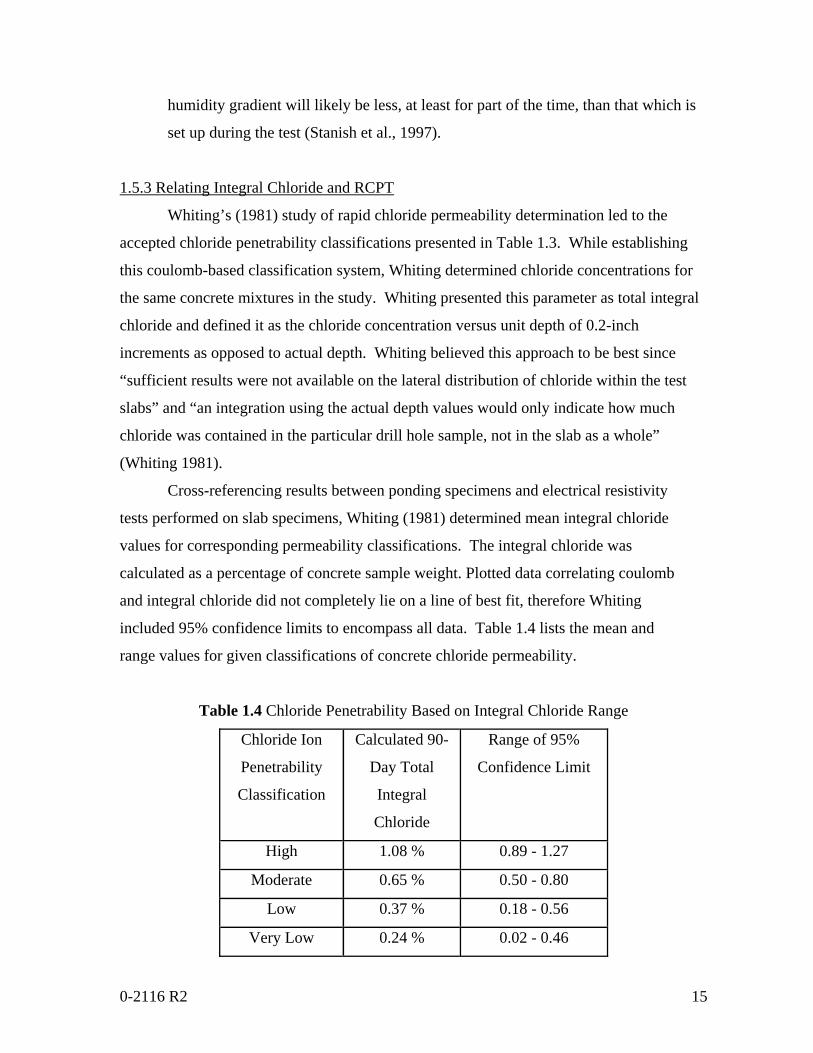
included 95% confidence limits to encompass all data. Table 1.4 lists the mean and
range values for given classifications of concrete chloride permeability.
Table 1.4 Chloride Penetrability Based on Integral Chloride Range
Chloride Ion
Penetrability
Classification
Calculated 90-
Day Total
Integral
Chloride
Range of 95%
Confidence Limit
High 1.08 % 0.89 - 1.27
Moderate 0.65 % 0.50 - 0.80
Low 0.37 % 0.18 - 0.56
Very Low 0.24 % 0.02 - 0.46
0-2116 R2 16
It should be noted that the penetrability classification from the previous table was
derived from electrical resistivity tests performed on slab specimens with a 12-inch by 12-
inch surface area and not the customary 4-inch diameter samples used in current practice.
Confidence limits from Table 1.4 show the high end of the “very low” category
encompasses a large portion of the “low” category and the “low” category slightly includes
a portion of the “moderate” category. Whiting (1981) concludes the overlapping integral
chloride ranges are the result of a broad confidence limit at low permeability.
The correlation between electrical resistivity from 4-inch diameter cores and
integral chloride from ponding samples has less agreement (correlation coefficient, R, of
0.83) when compared to the relationship using slab specimens for both test method (R of
0.92). Although the comparison using electrical resistivity from slab specimens is better, a
comparison utilizing 4-inch diameter specimens is desirable since it is the easiest to
perform of the two.
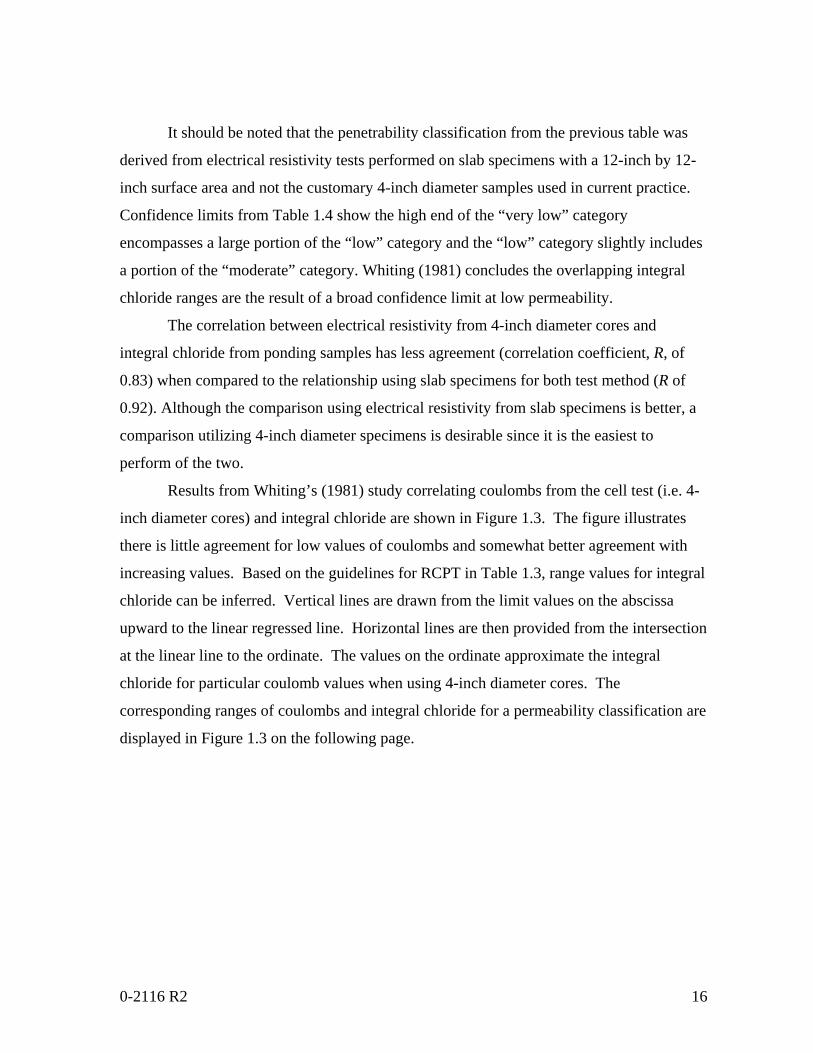
Results from Whiting’s (1981) study correlating coulombs from the cell test (i.e. 4-
inch diameter cores) and integral chloride are shown in Figure 1.3. The figure illustrates
there is little agreement for low values of coulombs and somewhat better agreement with
increasing values. Based on the guidelines for RCPT in Table 1.3, range values for integral
chloride can be inferred. Vertical lines are drawn from the limit values on the abscissa
upward to the linear regressed line. Horizontal lines are then provided from the intersection
at the linear line to the ordinate. The values on the ordinate approximate the integral
chloride for particular coulomb values when using 4-inch diameter cores. The
corresponding ranges of coulombs and integral chloride for a permeability classification are
displayed in Figure 1.3 on the following page.
0-2116 R2 17
Charge Passed During Cell Test - (coulombs)
Figure 1.3 RCPT and Integral Chloride Correlation (Whiting 1981)
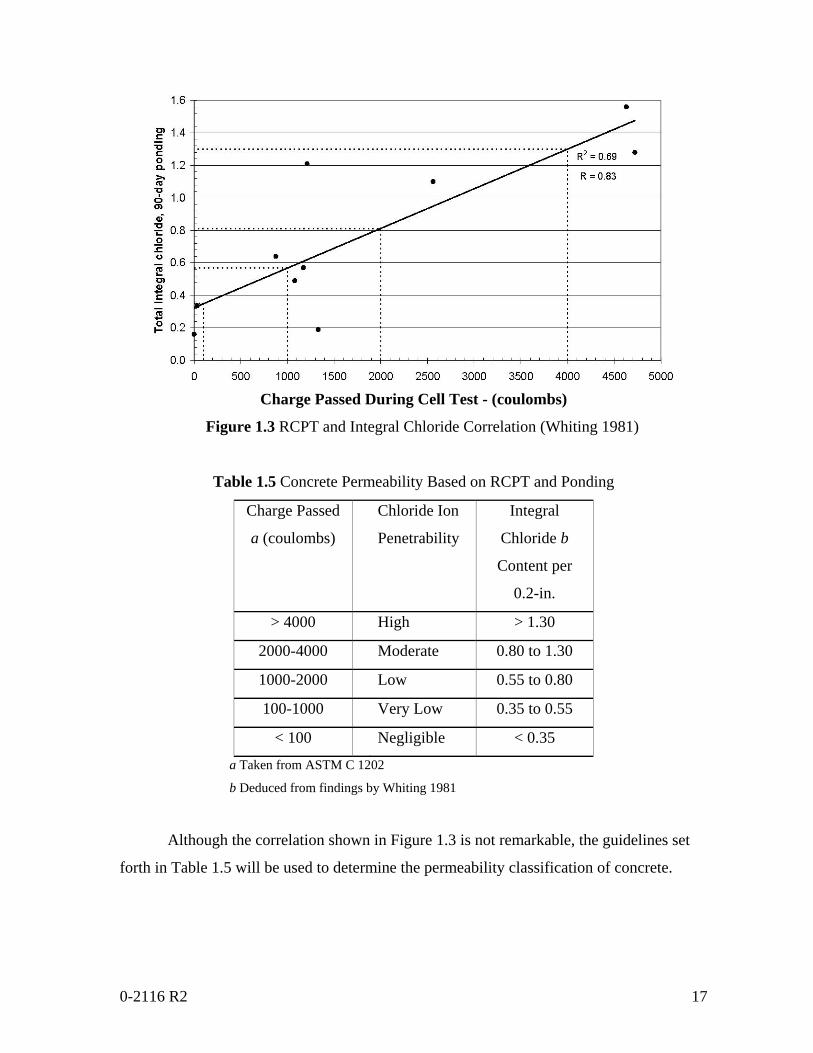
Table 1.5 Concrete Permeability Based on RCPT and Ponding
Charge Passed
a (coulombs)
Chloride Ion
Penetrability
Integral
Chloride b
Content per
0.2-in.
> 4000 High > 1.30
2000-4000 Moderate 0.80 to 1.30
1000-2000 Low 0.55 to 0.80
100-1000 Very Low 0.35 to 0.55
< 100 Negligible < 0.35
a Taken from ASTM C 1202
b Deduced from findings by Whiting 1981
Although the correlation shown in Figure 1.3 is not remarkable, the guidelines set
forth in Table 1.5 will be used to determine the permeability classification of concrete.

0-2116 R2 18
CHAPTER II
DURABILITY OF CONCRETE
2.1 DURABILITY OF CONCRETE
The durability of concrete usually is measured by the number of years’ service it
provides. If a correct prediction can been made of the conditions to which the concrete will
be subjected (including applied loads), there is no reason for a properly proportioned
concrete not to last for decades without significance maintenance (Nielsen, 1985). With the
knowledge and experience currently available to protect concrete from aggressive agents,
the selection of sound constitutive materials and the production of high quality concrete
have become more attainable. However, economic pressure to reduce initial costs of
construction and the desire for rapid construction often prevent the desired outcome. High
durability concrete can be perceived to be more expensive to produce and sometimes more
difficult to place than normal concrete. Also, its benefits are mostly evident in the long
term. Life cycle cost analyses usually indicate that for many structures, the final cost of
repairing avoidable damage is much greater than the additional cost to prevent problems
from occurring. However, predictions from these analyses are not always needed.
In many cases, damage in concrete structures begins many years before any visible
signs are observed. Once the material is compromised, concrete becomes vulnerable to
many degradation mechanisms. Thus, damage occurs exponentially and concrete that has
apparently survived for fifteen years may need to be replaced several years later.
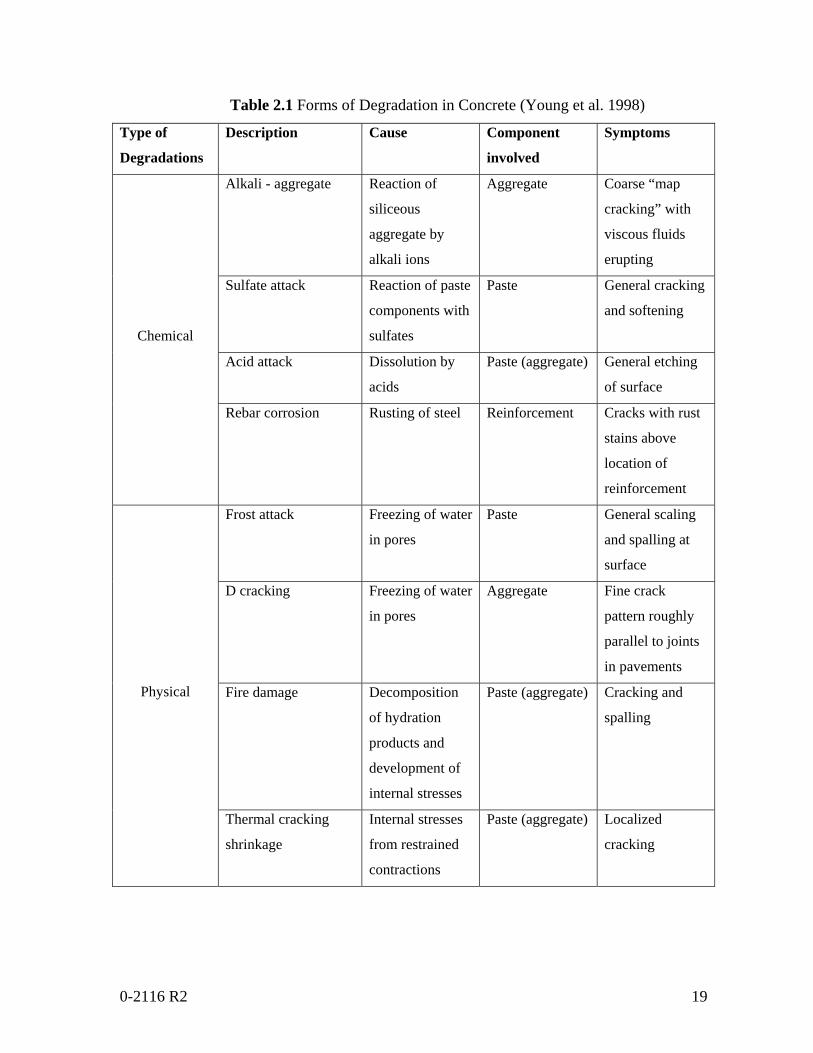
Degradation of concrete can be divided into chemical attack and physical attack as
shown in Table 2.1 (Young et al, 1998). One of the most widespread forms of concrete
deterioration is cracking and spalling due to corrosion of the steel reinforcement,
particularly when promoted by chloride salts. A more detailed explanation on the cause of
corrosion and its mechanisms is presented in section 2.6.
0-2116 R2 19
Table 2.1 Forms of Degradation in Concrete (Young et al. 1998)
Type of
Degradations
Description Cause Component
involved
Symptoms
Alkali - aggregate Reaction of
siliceous
aggregate by
alkali ions
Aggregate Coarse “map
cracking” with
viscous fluids
erupting
Sulfate attack Reaction of paste
components with
sulfates
Paste General cracking
and softening
Acid attack Dissolution by
acids
Paste (aggregate) General etching
of surface
Chemical
Rebar corrosion Rusting of steel Reinforcement Cracks with rust
stains above
location of
reinforcement
Frost attack Freezing of water
in pores
Paste General scaling
and spalling at
surface
D cracking Freezing of water
in pores
Aggregate Fine crack
pattern roughly
parallel to joints
in pavements
Fire damage Decomposition
of hydration
products and
development of
internal stresses
Paste (aggregate) Cracking and
spalling
Physical
Thermal cracking
shrinkage
Internal stresses
from restrained
contractions
Paste (aggregate) Localized
cracking
0-2116 R2 20
2.1.1 Permeability of Concrete
Permeability is a measure of how easy it is for water, air and other aggressive media
to enter concrete. Concrete is a porous material, and therefore fluid movement inside
concrete can occur by flow, diffusion, or sorption. Larger pores allow easier entry, while
smaller pores decrease the rate at which these substances enter the concrete.
By definition, diffusion is the net movement of molecules from an area of high
concentration to low concentration. This is a spontaneous process, requiring no input of
energy (Neville, 1996). If a membrane separates the regions of high and low
concentrations, diffusion occurs across the membrane from the region of higher
concentration to the region of lower concentration, as long as the membrane is permeable to
that substance. This is called passive transport, because it requires no energy to make it
happen. Much of the movement of molecules across cell membranes occurs this way. By
comparison, active transport goes against the concentration gradient, and requires the input
of energy.
The coefficient of diffusion depends on the degree of packing of molecules relative
to each other. The more closely packed the molecules are in the substance, the less space
they have to maneuver, and therefore diffusion will be much more difficult. This is the case
of solid substances that are composed of particles packed tightly together.
Sorption is the result of capillary movement in the pores open to an ambient
medium. Capillary suction takes place only in partially-saturated concrete. Thus, there is no
sorption of water in either completely dry or completely saturated concrete.
2.1.2 Concrete Porosity
In properly consolidated, good quality, hardened concrete, fluid movement occurs
through the hardened cement paste and through the interfacial zone between concrete
“macro components” (e.g., aggregates, reinforcing materials, fibers.) The paste-aggregate
interfacial zone is known to be different from the bulk cement paste. It is usually more
porous, richer in calcium hydroxide, and is more prone to microcracking than the rest of the
paste matrix (Asbridge et al., 2001). The interfacial zone is normally in the order of 50µm
in thickness, and can occupy 30 to 50% of the total volume of cement paste in concrete. In
comparison to the bulk hydrated cement paste, the paste-aggregate interfacial zone is

0-2116 R2 21
weaker, more soluble due to the presence of calcium hydroxide, and can be a less resistant
path for migrating moisture and other harmful substances.
It should be noted that although aggregates are porous, their pores are normally
discontinuous in a concrete matrix, usually being completely enveloped by cement paste.
Discrete voids or pores in concrete, including entrained air bubbles, do not contribute
significantly to concrete permeability.
Concrete porosity is usually expressed in terms of percentage by volume of
concrete. It is the interconnectivity of pores, rather than total porosity that determines a
concrete’s permeability. A concrete with a high proportion of disconnected pores may be
less permeable than a concrete with a much smaller proportion of connected or continuous
pores. It is the overall nature of the matrix pore structure that ultimately affects its
permeability, sorptivity, and diffusivity. The size, distribution, interconnectivity and shape
of pores are all determining factors in the overall permeability of a concrete matrix
(Asbridge et al., 2001).
Completely waterproof or watertight Portland cement concrete is not attainable.
Therefore, the goal in design mixture and formulation of durable concrete mixtures is to
slow down, or minimize the potential for and rate of fluid ingress and movement.
2.1.3 Steel Corrosion
Low permeability concrete can help reduce the potential for reinforcing steel to
corrode when exposed to chlorides by limiting the permeation of those chlorides into
concrete. When reinforcing steel comes into contact with plastic concrete, a chemical
reaction occurs between the steel and the concrete that causes a protective layer, also
known as the passivation layer to develop around reinforcing steel. This passive layer
protects against corrosion of the reinforcing steel (González et al., 1980).
Concrete can be exposed to salts – either after hardening by the use of de-icing salts,
or prior to hardening by the addition of salts to the concrete mix, most often as an
accelerating admixture. These salts can migrate down to the reinforcing steel through small
pores in the concrete. Over time, the chlorides in these salts react with the reinforcing steel,
breaking down the passivation layer and causing the steel to corrode. When reinforcing
steel in concrete corrodes, the product of that corrosion (rust) takes up more volume than
0-2116 R2 22
the original steel, and causes the concrete to expand crack (Smith, 2001). After cracks
develop, the deterioration accelerates as chlorides are allowed fairly easy ingress to the
reinforcing steel. Deterioration of both the concrete and reinforcing steel compromises the
integrity of the structure. This deterioration typically reduces the load-bearing capacity and
the overall service life of the structure.
2.2 CHLORIDE ATTACK AND CARBONATION
The main and frequent cause of corrosion of reinforcement in reinforced concrete
structures is chloride attack and carbonation. Chlorides come from several sources. They
can be cast in concrete but often they can diffuse into concrete as a result of sea salt spray
and direct seawater wetting. Further, they can diffuse into concrete due to the application of
chloride de-icing salts and from the storage of chloride substances in concrete tanks, as an
example.
2.2.1 Classification of Chloride in Concrete
Chloride in concrete is classified into two categories:
• external or internal chloride
• bound or free chloride
2.2.1.1 External Chlorides
Exposure to chlorides can occur in areas that experience freezing temperatures so
that de-icing salts are applied to the bridge deck and/or concrete pavement. Reinforced
concrete bridge decks are at a high risk of experiencing deterioration from chloride
penetration. The problem of external chloride penetration does not end at the roadway.
Chlorides in solution may adhere to cars and pedestrians transporting these salts and
affecting parking garages, walkways, and even building entrances that may not be directly
exposed to weather.
Chloride penetration can also be a problem in marine environments. Concrete docks
and piers are exposed to the high chloride content of salt water. However, corrosion is
seldom a problem in structures that are continuously submerged. This is apparently due to
the lack of diffused oxygen available. The concrete will allow the penetration of chlorides
0-2116 R2 23
and water, but without the presence of oxygen, corrosion will not occur (Berke et al., 1988).
In this case, the concrete cover over the rebar typically provides significant protection.
2.2.1.2 Internal Chlorides
In some cases, chlorides are added to the concrete during mixing, whether
intentionally or unintentionally. These internal chlorides also lead to corrosion of the rebar.
Some aggregates contain traces of chlorides within pores, which become free ions when
water is added to the mixture. Certain chemical admixtures contain chloride compounds,
which may ionize, thus aiding the corrosion process. Calcium chloride is an accelerating
admixture which may increase the amount of free chlorides available for corrosion. The
severity of chlorides added by admixtures is under some debate, because these chlorides
may remain in compound form, and therefore would not contribute to corrosion (Berke et
al., 1988).
2.2.1.3 Bound and Free Chloride
Chlorides in cementitious materials have free and bound components. The bound
components exist in the form of chloro-aluminates and appear on the adsorbed phase on the
pore walls, making them unavailable for free transport. It has been reported that the amount
of bound chlorides is dependent on the binder material, electric potential of the pore wall,
and the pH level in pore solution. In contrast, free chlorides are dissolved in the pore
solution. They can migrate to reach the reinforcement in the concrete. Typically, only the
free chloride ions cause the degradation of reinforced concrete structures by causing
corrosion of steel.
Chloride binding in cementitious systems is dominated by the content of tricalcium
aluminate (C3A) and tetracalcium aluminoferrite (C4AF) no matter the chloride source.
Both C3A and C4AF form Friedels salt, even with sodium chloride (Justnes, 2001). The
sulphates in the cement form stronger bonds than the chlorides, so only a fraction of the
original content of C3A and C4AF is accessible for chloride binding. Chloride sorption is
dominated by the amount of CSH gel (Justnes, 2001).
Calcium chloride can in addition be bound through the formation of compounds
with calcium hydroxide. Such compounds are not formed to any significant extent by
0-2116 R2 24
sodium chloride. Replacement of cement or addition of fly ash and ground blast furnace
slag increases the chloride binding since these mineral additives form additional calcium
aluminate hydrates in their reaction, while silica fume replacements will decrease the
chloride binding (Justnes, 2001).
Bound chlorides can again be released if the cement paste at a later stage is
carbonated or intruded by sulphates. Fewer chlorides are bound from seawater than the
corresponding concentration of sodium chloride from fresh water if intermixed, since the
sulphates from the sea water will be bound first and occupy sites otherwise available for
chloride.
2.3 METHODS OF CHLORIDE ION TRANSPORT
Related to durability issues, there are three fluids which can enter the concrete:
water, aggressive ions in solution, carbon dioxide and oxygen. They can move through the
concrete in different ways, but all transports depend primarily on the structure of the
hydrated cement paste.
Capillary absorption (sorption), hydrostatic pressure (permeation) and diffusion are
the ways by which chloride ions penetrate concrete. The most familiar method is diffusion,
the movement of chloride ions under a concentrated gradient. For this to occur the concrete
must have a continuous liquid phase and there must be a chloride ion concentrated gradient
(Thomas, et al., 1995).
The second mechanism for chloride penetration is permeation, driven by pressure
gradients. If there is an applied hydraulic head on one face of the concrete and chlorides are
present, they permeate into the concrete.
The most common method for chloride penetration is absorption. When concrete is
exposed to external conditions, it will undergo wetting and drying cycles. When water
(generally containing chlorides) encounters a dry surface, it is drawn into the pore structure
through capillary suction. Absorption is driven by moisture gradients. Typically, the depth
of drying is small, and this transport mechanism alone will not bring chloride to the level of
the reinforcing steel unless the concrete is of extremely poor quality and the reinforcing
steel is near the top surface. It does, however, serve to quickly bring chlorides to some
0-2116 R2 25
depth in the concrete and therefore reduce the distance that they must diffuse to reach the
rebar (Thomas, et al., 1995)
It is rare for a significant hydraulic head to be exerted on the structure, and the
effect of absorption is typically limited to a shallow cover region. In the bulk of the
concrete, the pores remain saturated and chloride ion movement is controlled by
concentration gradients. Thus, diffusion is the primary transport mechanism described that
can bring chlorides into the concrete to the level of the rebar.
2.4 EFFECT OF THE PORE SYSTEM ON CHLORIDE ION TRANSPORT
The aspect of the structure of hardened cement paste relevant to permeability is the
nature of the pore system both within the bulk of the hydrated cement paste and in the zone
near the interface between the cement paste and the aggregate (Larbi, 1993). The interfacial
zone occupies as much as one-third to one-half of the total volume of hardened cement
paste in concrete and is known to have a different microstructure from the bulk of the
hardened cement paste. The interface is also the location of early microcracking. For this
reason, the interface zone contributes significantly to the permeability of concrete (Young,
1988).
As stated above, the penetrability of concrete is obviously related to the pore
structure of the cement paste matrix. This will be influenced by the water-cement ratio of
the concrete, the inclusion of supplementary cementitious materials which serve to
subdivide the pore structure (McGrath, 1996), and the degree of hydration of the concrete.
Generally, the older the concrete, the greater the amount of hydration that has occurred and
thus, generally the more highly developed pore structure. This is especially true for
concrete containing slower reacting supplementary cementitious materials such as fly ash
that require a longer time to hydrate (Tang and Nilsson, 1992; Bamforth, 1995).
Another influence on the pore structure is the temperature at the time of casting.
High-temperature curing accelerates the curing process so that at young concrete ages, a
high-temperature cured concrete will be more mature and thus have a better resistance to
chloride ion penetration than a normally-cured, but otherwise identical, concrete at the
same at age. However, at later ages when the normally-cured concrete has had a chance to
hydrate more fully, it will have a lower chloride ion diffusion coefficient than the high-
0-2116 R2 26
temperature-cured concrete (Detwiler, et al., 1991; Cao and Detwiler, 1995). This finding
has been attributed to the coarse initial structure developed in the high-temperature-cured
concrete due to its initial rapid rate of hydration as well as the possible development of
initial internal microcracking.
The rate of chloride penetration into concrete is affected by the chloride binding
capacity of the concrete. Concrete is not inert relative to the chlorides in the pore solution.
A portion of the chloride ions reacts with the concrete matrix, becoming either chemically
or physically bound, and this binding reduces the rate of diffusion. However, if the
diffusion coefficient is measured after steady-state conditions have been reached, all the
binding can be presumed to have taken place and this effect will not then be observed. If a
steady state condition has not been reached, then not all of the binding will have occurred
and this will affect test results. The chloride binding capacity is controlled by the cementing
materials used in the concrete. The inclusion of supplementary cementing materials affects
binding, though the exact influence is unclear (Byfors, et al., 1986; Rasheeduzafar, et al.,
1992; Sandberg and Larrson, 1993; Thomas, et al., 1995). Also, the C3A content of the
cement influences its binding capacity, with increased C3A content leading to increased
binding (Holden, et al., 1983; Midgely and Illston, 1984; Hansson and Sorenson, 1990).
The pores relevant to permeability are those with a diameter of at least 120 to 160
nanometers. These pores must be continuous. Pores that are ineffective to permeability are
the discontinuous pores and the pores which contain adsorbed water.
After intensive research, Sato and Agopian (2001) found that pores with dimensions
larger than 0.1 micrometers contribute to the mass transport by diffusion, ionic migration
and capillarity, while the smaller pores influence only the process of gaseous diffusion and
sorption and also of ionic diffusion and migration. They also observed that dried concrete
when put in contact with salt solutions, the transport of water due to capillary action
prevails only in the superficial layers that present open and connected pores.
Although the pores may be connected to the deep interior of the concrete, the capillary
transport takes place only in the superficial layers of the concrete as the pore walls provide
resistance to the flow of liquid. The degree of this resistance depends on pore dimensions,
with smaller pores presenting larger hydraulic resistance than larger pores (Sato and
Agopian, 2001).
0-2116 R2 27
2.5 EFFECT OF CRACKS ON CHLORIDE PENETRATION
In the case of reinforced concrete structures, the penetration of chlorides depends
not only on concrete transfer properties but also on the load applied, on the state of strains,
macroscopically characterized by the presence of cracking.
In concrete structures, cracks act as interconnecting channels for the penetration of
potential aggressive agents, mainly chloride ions. The effect of cracks on the corrosion
development of the reinforcement has long been a controversy among researchers.
Danilecki (1969) found that the cracks were directly responsible for the start of the
corrosion. However, Shiessl (1988) has found that the width of the crack does not play an
important factor as the cracks only accelerate the corrosion initiation.
Additional research conducted by Francois and Arliguie (1999) concludes that the
development of the reinforcement corrosion is not influenced by the width of the cracks or
by the existence of the cracks themselves. However, it was clear that the load applied to the
concrete played a significant role in the penetration of aggressive agents and then in the
corrosion of the reinforcement. This was due to the damage of the paste aggregate interface.
This damage will consequently reduce the service life of the reinforced concrete.
2.6 CORROSION MECHANISMS
Corrosion is defined as the degradation of a metal by an electrochemical reaction
within its environment (Uhlig, 1948). According to the thermodynamic laws, there is a
strong tendency for high energy states to transform into low energy states. It is this
tendency of metals to recombine with elements present in the environment that leads to the
phenomenon known as corrosion. All interactions between elements and compounds are
governed by the free energy changes commonly referred to as “DG” available to them. For
a spontaneous reaction to occur, DG must be negative. At room temperature most chemical
compounds of metals have lower values (more negative) of DG than the uncombined
metals; therefore, most metals have an inherent tendency to corrode.
2.6.1 Mechanism of Electrochemical Corrosion
In electrochemical corrosion, there are two reactions which occur at the metal/liquid
interface: the electron producing reaction which is an anodic reaction (oxidation) and the
0-2116 R2 28
electron consuming reaction which is a cathodic reaction (reduction). For a basic corrosion
cell, there are four essential components involved:
a. The anode. The anode usually corrodes by loss of electrons from electrically
neutral metal atoms to form discrete ions. These ions may remain in solution or react to
form insoluble corrosion products. The corrosion reaction of a metal M is usually expressed
by the simplified equation:
M → Mz+ + ze- (2.1)
in which the number of electrons taken from each atom is governed by the valency of the
metal. For iron, z equals two.
b. The cathode. The cathode reaction must consume the electrons produced by the
anode process. There are two basic reactions which occur at the cathode depending on the
pH of the solution:
(a) PH < 7 : 2 H+ + 2e- → H2 (2.2)
(b) PH > 7 : 2H2O + O2 + 4e- → OH- (2.3)
c. An electrolyte. This is the name given to the solution, which must of necessity
conduct electricity. In the solution cations can move from anodic to cathodic regions.
Anions move in the opposite direction.
d. Electrical connection. The anode and cathode must be in electrical contact for a
current to flow in the corrosion cell. The removal of any one of the four components of the
simple corrosion cell will stop the corrosion reaction.
2.6.2 Pourbaix Diagrams
Based on thermodynamic data on reactions between metal and water, Pourbaix
(1976) developed potential versus pH diagrams which indicate thermodynamically stable
phases as a function of electrode potential and pH. The Pourbaix diagram for iron is shown
in Figure 2.1.
0-2116 R2 29
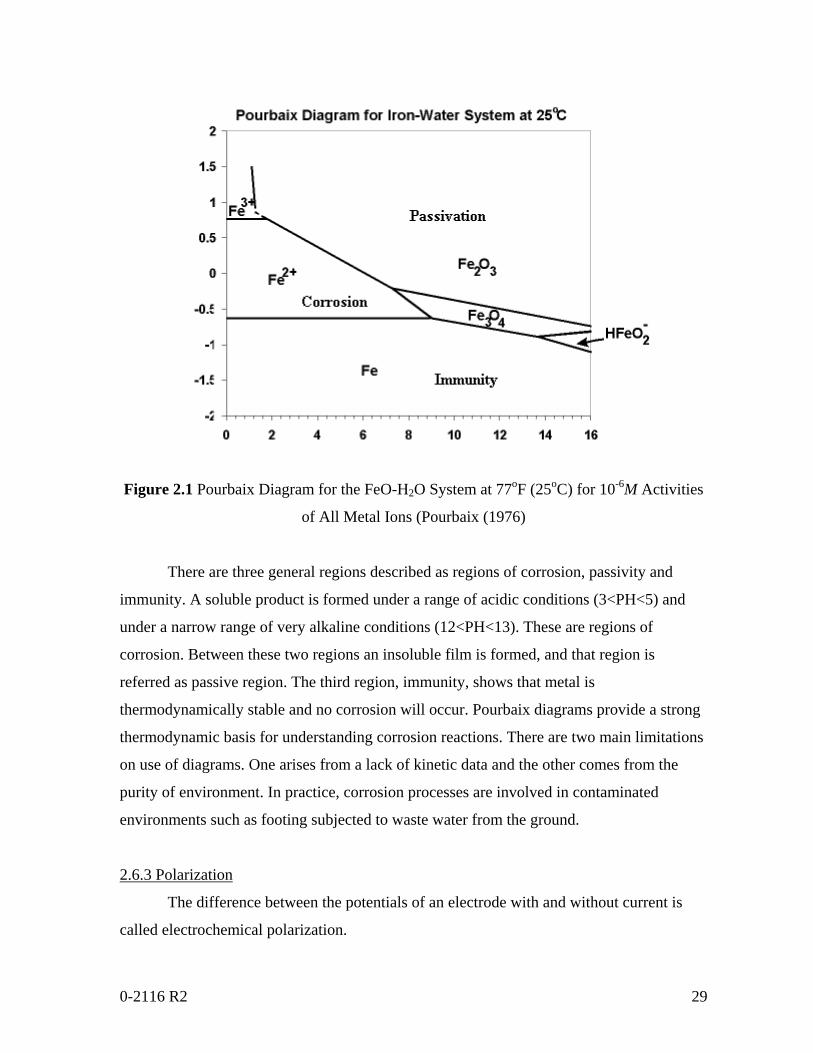
Figure 2.1 Pourbaix Diagram for the FeO-H2O System at 77oF (25oC) for 10-6M Activities
of All Metal Ions (Pourbaix (1976)
There are three general regions described as regions of corrosion, passivity and
immunity. A soluble product is formed under a range of acidic conditions (3<PH<5) and
under a narrow range of very alkaline conditions (12<PH<13). These are regions of
corrosion. Between these two regions an insoluble film is formed, and that region is
referred as passive region. The third region, immunity, shows that metal is
thermodynamically stable and no corrosion will occur. Pourbaix diagrams provide a strong
thermodynamic basis for understanding corrosion reactions. There are two main limitations
on use of diagrams. One arises from a lack of kinetic data and the other comes from the
purity of environment. In practice, corrosion processes are involved in contaminated
environments such as footing subjected to waste water from the ground.
2.6.3 Polarization
The difference between the potentials of an electrode with and without current is
called electrochemical polarization.
0-2116 R2 30
There are three kinds of polarizations which may act separately or simultaneously,
namely concentration, resistance (ohmic) and activation polarization.
Concentration polarization is caused by the concentration on the electrode surface
from that of the bulk solution. An example of this would be depletion of oxygen at the
cathode. The rate of oxygen diffusion through the concrete to the reinforcement determines
the rate of corrosion (Evans, 1960).
Resistance (ohmic) polarization is due to an ohmic resistance in a film, e.g. an oxide
film on the electrode surface, causing an ohmic potential drop.
Activation polarization occurs due to a certain slow step in the electrode process
requiring activation energy for overcoming the reaction hindrance (Evans, 1960).
2.6.4 Passivity
Passivity occurs when the corrosion product is insoluble and adherent and results in
the formation of an ultra-thin protective film on the surface of the metal. Passivity can be
either chemical or mechanical.
Chemical Passivity. This type of passivity is due to an invisible thin but dense and
semi-conducting oxide film on the metal surface, displacing the electrode potential of the
metal strongly in the positive direction.
Mechanical Passivity. This is due to the precipitation of solid salts on the metal
surface. The cause of strongly reduced corrosion rate for mechanical passivity is a thick but
essentially porous salt layer, usually non-conducting in itself.
The maintenance of passivity needs certain electrochemical environmental
conditions. The breakdown of passive film is usually brought about by changes of the
electrochemical environmental conditions or mechanical forces (Young et al., 1998).
2.6.5 Concrete as an Electrolyte
The steel corrosion process in concrete is generally considered electrochemical in
nature, and basic mechanisms of electrochemical theory of corrosion developed for liquid
electrolytes apply (Page, 1979; Cabrera, 1996). However, electrochemical corrosion of iron
in concrete has a number of characteristic differences that are determined by the
peculiarities of electrochemical processes in the complex “concrete electrolyte,” the
0-2116 R2 31
properties of which are affected by the microporous structure of the concrete and service
exposure conditions.
2.6.6 Structure of Concrete
Concrete is a highly heterogeneous and complex structure, which contains a
heterogeneous distribution of different types and amounts of solid phases, pores, and
microcracks (Mehta, 1993). In addition, the structure of concrete is also subject to change
with time, environmental humidity and temperature. A large amount of water can exist in
the hydrated cement paste, depending on the environmental humidity, porosity and pore
size distribution of the hydrated cement paste. The presence and transport of the corrosion
reactants (water, oxygen and various ions), the corrosion products, and the passage of the
ionic current necessary to support corrosion are normally dependent on the cement paste
pore solution and the structure and distribution of pores.
The composition of the pore solution is the decisive factor in determining whether
embedded steel will be passivated or whether it will actively corrode. Research on the
influence of a number of factors concerning the composition of pore solution (Byfors et al.,
1986, Hansson et al., 1985) has shown that the presence of sodium and potassium oxides in
the cement, as well as calcium hydroxide produced in the hydration reactions of cement
components can give the pore solution of ordinary Portland cement a pH of about 13 while
the pH of blended cement is somewhat lower. The range of high pH values of typical
concrete is within the pH domain in which insoluble oxides of iron are thermodynamically
stable to maintain a passive film on steel surface. Unfortunately, the pH value of concrete
can be reduced by carbonation and by leaching.
The structure, pore size distribution and pore connectivity in the cement phase
determine the availability of oxygen and moisture at the steel surface, both of which are
necessary for the maintenance of a passive film. They also determine the penetration or
diffusion rate of chloride ion and carbon dioxide which, as mentioned above, are the two
most common causes in the corrosion of embedded steel in concrete.
The typical sizes of both the solid phase and the voids in hydrated cement paste are
shown in Figure 2.2 (Mehta, 1993). Pore size distributions are mainly affected by the
water/cement ratio, and the degree of hydration.
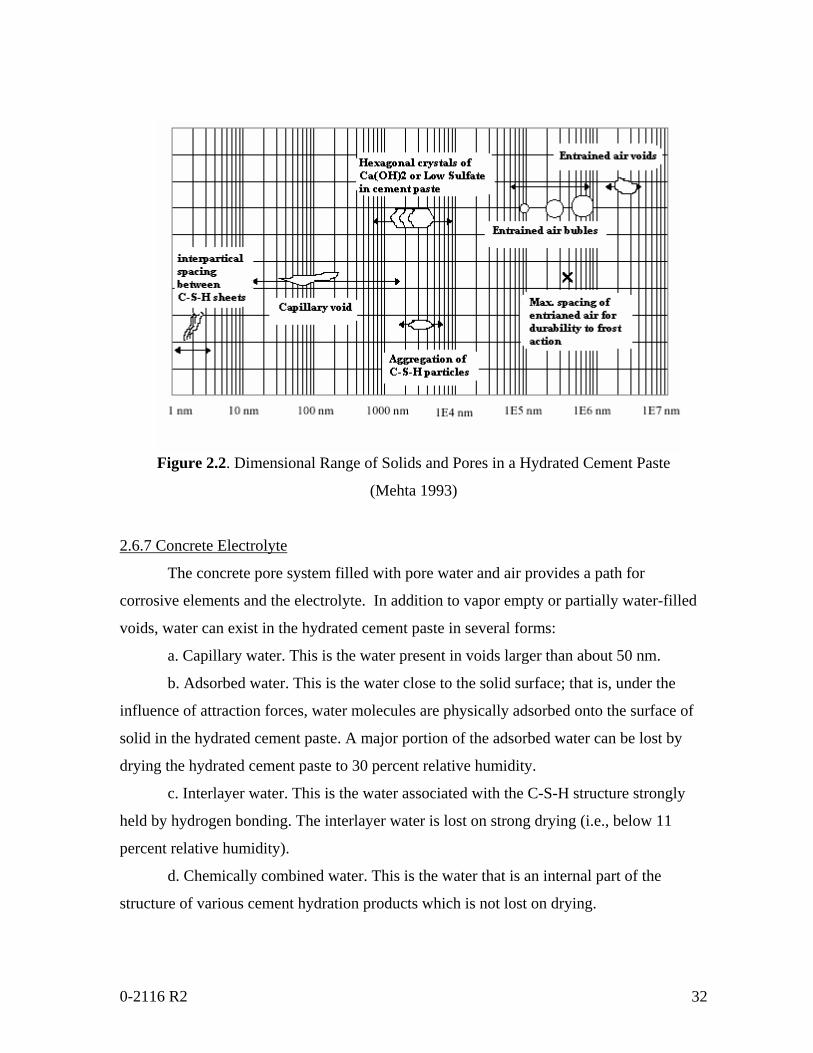
0-2116 R2 32
Figure 2.2. Dimensional Range of Solids and Pores in a Hydrated Cement Paste
(Mehta 1993)
2.6.7 Concrete Electrolyte
The concrete pore system filled with pore water and air provides a path for
corrosive elements and the electrolyte. In addition to vapor empty or partially water-filled
voids, water can exist in the hydrated cement paste in several forms:
a. Capillary water. This is the water present in voids larger than about 50 nm.
b. Adsorbed water. This is the water close to the solid surface; that is, under the
influence of attraction forces, water molecules are physically adsorbed onto the surface of
solid in the hydrated cement paste. A major portion of the adsorbed water can be lost by
drying the hydrated cement paste to 30 percent relative humidity.
c. Interlayer water. This is the water associated with the C-S-H structure strongly
held by hydrogen bonding. The interlayer water is lost on strong drying (i.e., below 11
percent relative humidity).
d. Chemically combined water. This is the water that is an internal part of the
structure of various cement hydration products which is not lost on drying.
0-2116 R2 33
It is important to note that concrete is an ionic conductor of electric current with the
exception of its very dry condition, and it can be considered to be corrosive electrolyte.
However, it is quite different from the usual liquid electrolyte, because of its
physicochemical and electrochemical properties.
The electrochemical properties of the concrete vary within very wide limits,
depending not only on its internal structure but also on its location, and seasonal weather
condition. Therefore, concrete can vary considerably in electrical conductivity during its
service life.
These properties of concrete as an electrolyte will influence the character of the
electrochemical reactions significantly by changing the conditions required for cathodic and
anodic processes. The most fundamental characteristic is the difference in mechanism and
the rate of oxygen supply under different corrosion conditions: through the liquid
electrolyte (corrosion of metal in solution), through a thin film of electrolyte (such as
atmospheric corrosion), or through a solid microporous electrolyte (such as steel corrosion
in concrete). In solution, access of oxygen to the corroding surface of the metal is
dependent primarily on diffusion; in the atmosphere, on the moisture thickness; and in
concrete, on its structure (pore size distribution, porosity and pore connectivity), degree of
saturation and cover depth. The corrosion process (or rate of corrosion) in concrete also is
dependent on the conductivity of concrete electrolyte.
2.6.8 Principles of Steel Corrosion in Concrete
Corrosion of steel in concrete is an electrochemical process. The corroding system
consists of an anode in which steel is corroded, a cathode, an electrical conductor, and an
electrolyte (concrete pore solution). The potential difference between anode and cathode is
the driving electrical force for steel corrosion.
Usually, the process can be divided into primary electrochemical processes and
secondary processes.
2.6.8.1 Primary Electrochemical Processes
For steel in concrete, as the passive film is degraded by chloride ions or the pH level
is reduced by carbonation, the metallic Fe at the anode is oxidized to form ferrous ions
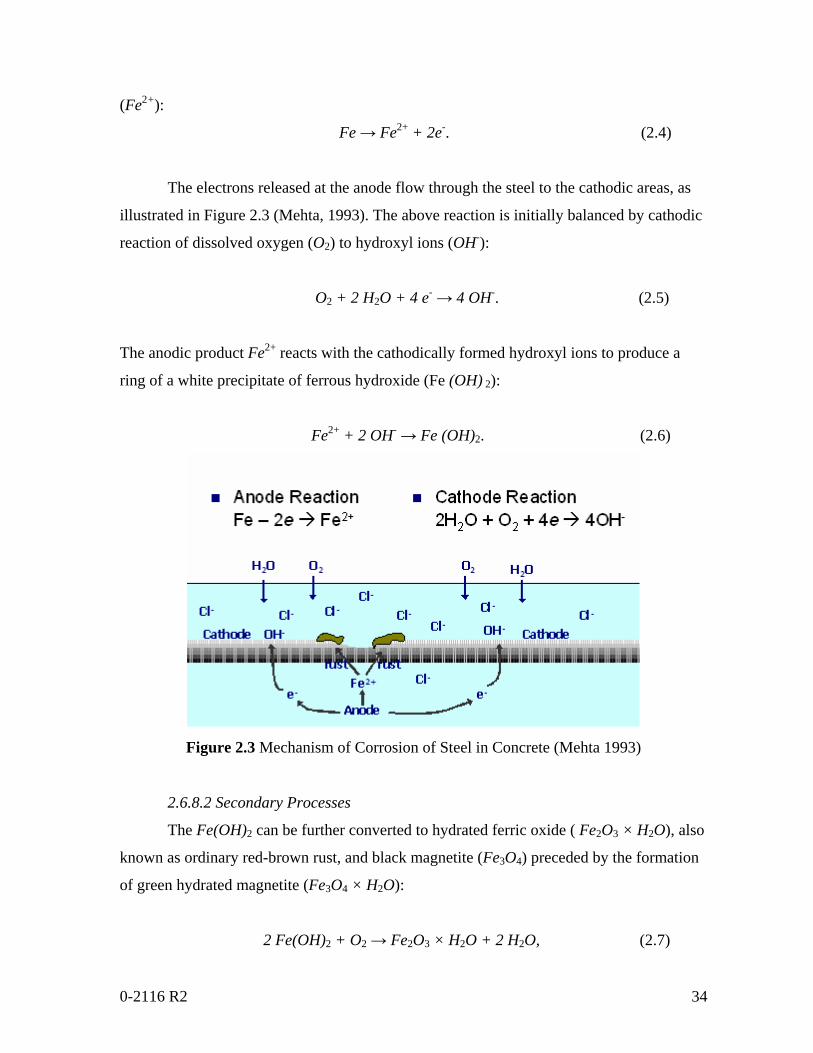
0-2116 R2 34
(Fe2+):
Fe → Fe2+ + 2e-. (2.4)
The electrons released at the anode flow through the steel to the cathodic areas, as
illustrated in Figure 2.3 (Mehta, 1993). The above reaction is initially balanced by cathodic
reaction of dissolved oxygen (O2) to hydroxyl ions (OH-):
O2 + 2 H2O + 4 e- → 4 OH-. (2.5)
The anodic product Fe2+ reacts with the cathodically formed hydroxyl ions to produce a
ring of a white precipitate of ferrous hydroxide (Fe (OH) 2):
Fe2+ + 2 OH- → Fe (OH)2. (2.6)
Figure 2.3 Mechanism of Corrosion of Steel in Concrete (Mehta 1993)
2.6.8.2 Secondary Processes
The Fe(OH)2 can be further converted to hydrated ferric oxide ( Fe2O3 × H2O), also
known as ordinary red-brown rust, and black magnetite (Fe3O4) preceded by the formation
of green hydrated magnetite (Fe3O4 × H2O):
2 Fe(OH)2 + O2 → Fe2O3 × H2O + 2 H2O, (2.7)
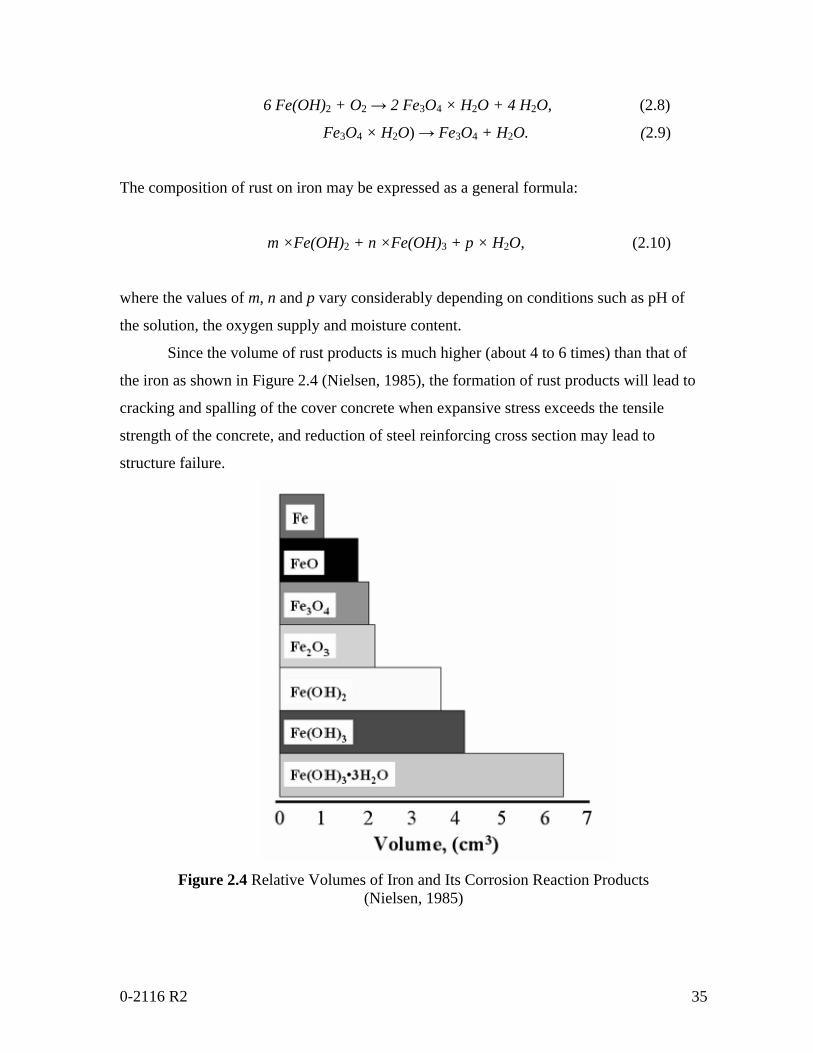
0-2116 R2 35
6 Fe(OH)2 + O2 → 2 Fe3O4 × H2O + 4 H2O, (2.8)
Fe3O4 × H2O) → Fe3O4 + H2O. (2.9)
The composition of rust on iron may be expressed as a general formula:
m ×Fe(OH)2 + n ×Fe(OH)3 + p × H2O, (2.10)
where the values of m, n and p vary considerably depending on conditions such as pH of
the solution, the oxygen supply and moisture content.
Since the volume of rust products is much higher (about 4 to 6 times) than that of
the iron as shown in Figure 2.4 (Nielsen, 1985), the formation of rust products will lead to
cracking and spalling of the cover concrete when expansive stress exceeds the tensile
strength of the concrete, and reduction of steel reinforcing cross section may lead to
structure failure.
Figure 2.4 Relative Volumes of Iron and Its Corrosion Reaction Products
(Nielsen, 1985)
0-2116 R2 36
2.6.9 Initiation of Steel Corrosion in Concrete
The high alkaline environment of good quality concrete forms a passive film on the
surface of the embedded steel which normally prevents the steel from further corroding.
The maintenance of passivity of steel in concrete requires a high pH and presence of both
water and oxygen. Two major causes of steel corrosion in reinforced concrete and
consequent initiation of active corrosion are carbonation-induced corrosion and chloride-
induced corrosion.
2.6.9.1 Carbonation-Induced Corrosion
Concrete structures are constantly affected by CO2 in the atmosphere. In the
presence of CO2 which play the role of a weak acid in an aqueous solution, the different
hydrates in cement paste such as portlandite (Ca (OH) 2) and CSH can react with CO2 and
become carbonated as shown in Equation 2.12 and 2.13.
Ca(OH)2 + CO2 → CaCO3 + H2O, (2.12)
2NaOH + CO2 → Na2CO3 + H2O. (2.13)
The results of carbonation lowers the pH value (Parrott, 1987), and the protective
film covering the steel surface which is maintained in a high pH environment is dissolved.
Therefore, corrosion of steel occurs.
The carbonation rate is mainly determined by the quality of concrete, which is a
function of cement type, water/cement ratio and proportion of cement. The degree of
saturation of the concrete is also a decisive factor in determining the carbonation rate as the
CO2 permeates the concrete most rapidly in the gas phase while carbonation reaction takes
place in the liquid phase. In a completely dry concrete or a completely saturated concrete,
the carbonation reaction rate is very slow. When the pores have a layer of moisture on the
walls but are not completely saturated (50 to 80 percent relative humidity), the CO2 can
rapidly reach the vicinity of the pore walls and have enough water to be able to react
(Parrott, 1987).
0-2116 R2 37
2.6.9.2 Chloride-Induced Corrosion
Researchers (Mehta, 1993; Venuat, 1977) show that the presence of chloride ions in
reinforced concrete can cause the steel to corrode if sufficient oxygen and moisture are
present to sustain the reaction. The chloride-induced corrosion is the most prevalent and
damaging cause of corrosion of steel in concrete and this is the focus of this thesis.
Once in contact with the metal surface, chloride ions favor hydration of metal ions
and increase the ease in which metal ions go into solution. Hime and Erlin (1987) showed
that a reaction between the chloride ions and the ferrous and hydroxyl ions, as shown in
Equations 2.14 through 2.16, removes ferrous ions from the lattice to produce rust and at
the same time releases chlorides ions for further reaction with the ferrous ions:
Fe+2 + 6Cl – → FeCl6-4, (2.14)
Fe+3 + 6Cl – → FeCl6-3, (2.15)
FeCl6-3 + 6OH – → Fe(OH)2 + 6Cl – . (2.16)
2.7 FORMS OF CORROSION
Five types of corrosions occur in steel reinforcement (Khan, 1991):
1- General Corrosion: Rusting is the most familiar form of steel corrosion. It can be
considered a uniform corrosion process. In atmospheric exposures, oxygen in the air is the
usual oxidizing agent, and water necessary for the reaction is readily available in the form
of rain, condensation or humidity (water vapor in the air). In the rusting of ordinary steel,
the corrosion product (rust) does not form an effective barrier to further corrosion, but
permits reactants to penetrate to the steel surface beneath and continue the rusting cycle.
2- Pitting corrosion: this is a non-uniform, highly localized form of corrosion that
occurs at distinct locations where deep pits form. (A pit is a small electro-chemical
corrosion cell, with the bottom of the pit acting as the anode.) Pitting is considered more
dangerous than uniform corrosion damage because it is more difficult to detect, predict and
design against. Chloride-induced corrosion is of this type and can be seen frequently in
structures exposed in coastal areas. Pitting is initiated by:
a. Localized chemical or mechanical damage to the protective oxide film;
water chemistry factors which can cause the breakdown of a passive film are
0-2116 R2 38
acidity, low dissolved oxygen concentrations (which tend to render a
protective oxide film less stable) and high concentrations of chloride (as in
seawater)
b. Localized damage to, or poor application of, a protective coating
c. The presence of non-uniformities in the metal structure of the component,
e.g. nonmetallic inclusions.
3- Galvanic corrosion: when two metals of different electrochemical potential are
joined or coupled electrically in the presence of moisture or an aqueous solution, one will
act as the anode and corrode; the corrosion of steel in contact with copper is a familiar
example.
4- Stress Corrosion: under stress, corrosion processes proceed much faster and can
lead to brittle failure as corrosion tends to be localized.
5- Crevice Corrosion: it occurs when moisture and contaminants retained in
crevices accelerate corrosion.
2.8 THRESHOLD CHLORIDE CONCENTRATION
To initiate corrosion, a threshold concentration of chloride (minimum concentration
of chloride necessary to destroy the passive film) is required in excess of the amount
immobilized by reaction with tricalcium aluminate in cement (i.e. bounded). Many
researchers (Schiessel and Raupach, 1991) believe that only freely dissolved chloride ions
in the concrete pore water can be involved in the corrosion reactions.
The threshold concentration of chloride ions to initiate corrosion is controversial
between researchers as it depends on several factors, including the pH value of concrete,
the water content, the type of cement, the proportion of water-soluble chloride, the sulfate
content and the temperature (Schiessel, 1990; Clear, 1983).
The results of previous studies on threshold chloride ion concentration
determination are presented in Table 2.2 (Miki, 1990). A level of 0.71 to 0.89 kg/m3 is
usually considered a threshold level for bare steel in regular reinforced concrete bridge
decks (Miki, 1990). According to AASHTO, a concentration less than 1.42 kg/m3 are
acceptable for bridge decks; however, deck replacement should occur when the level of
chlorides reaches 2.8 kg/m3 (Miller et al., 1993).
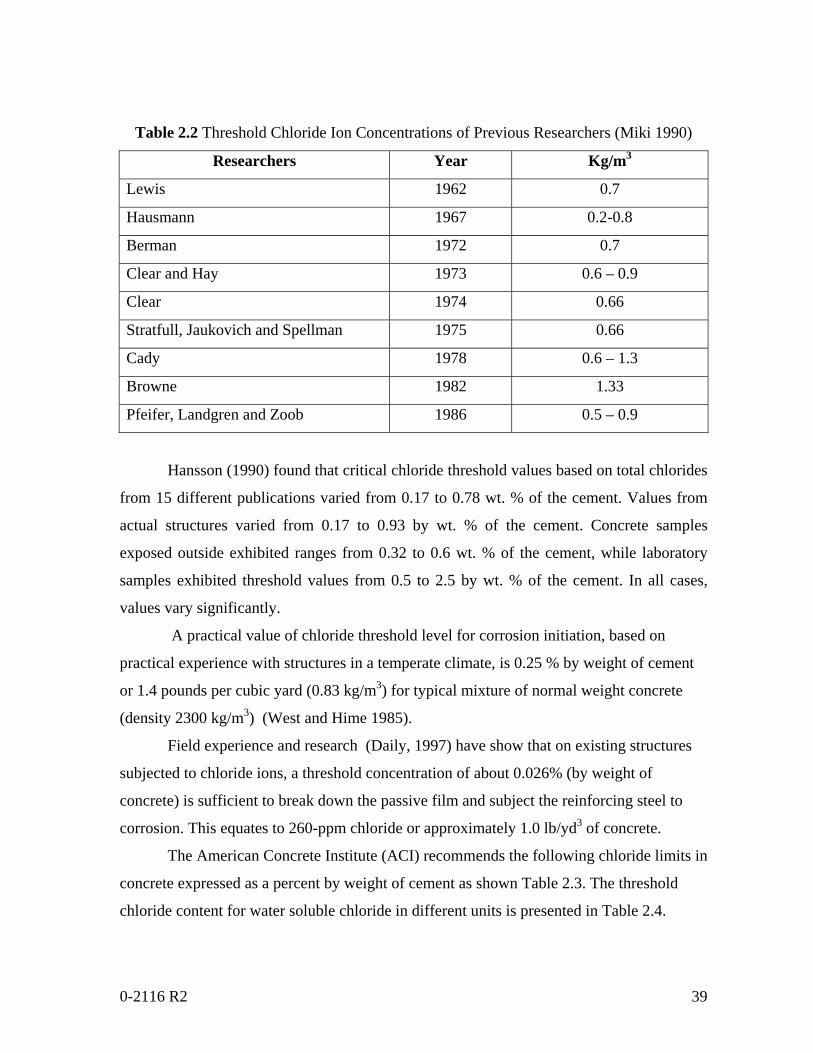
0-2116 R2 39
Table 2.2 Threshold Chloride Ion Concentrations of Previous Researchers (Miki 1990)
Researchers Year Kg/m3
Lewis 1962 0.7
Hausmann 1967 0.2-0.8
Berman 1972 0.7
Clear and Hay 1973 0.6 – 0.9
Clear 1974 0.66
Stratfull, Jaukovich and Spellman 1975 0.66
Cady 1978 0.6 – 1.3
Browne 1982 1.33
Pfeifer, Landgren and Zoob 1986 0.5 – 0.9
Hansson (1990) found that critical chloride threshold values based on total chlorides
from 15 different publications varied from 0.17 to 0.78 wt. % of the cement. Values from
actual structures varied from 0.17 to 0.93 by wt. % of the cement. Concrete samples
exposed outside exhibited ranges from 0.32 to 0.6 wt. % of the cement, while laboratory
samples exhibited threshold values from 0.5 to 2.5 by wt. % of the cement. In all cases,
values vary significantly.
A practical value of chloride threshold level for corrosion initiation, based on
practical experience with structures in a temperate climate, is 0.25 % by weight of cement
or 1.4 pounds per cubic yard (0.83 kg/m3) for typical mixture of normal weight concrete
(density 2300 kg/m3) (West and Hime 1985).
Field experience and research (Daily, 1997) have show that on existing structures
subjected to chloride ions, a threshold concentration of about 0.026% (by weight of
concrete) is sufficient to break down the passive film and subject the reinforcing steel to
corrosion. This equates to 260-ppm chloride or approximately 1.0 lb/yd3 of concrete.
The American Concrete Institute (ACI) recommends the following chloride limits in
concrete expressed as a percent by weight of cement as shown Table 2.3. The threshold
chloride content for water soluble chloride in different units is presented in Table 2.4.
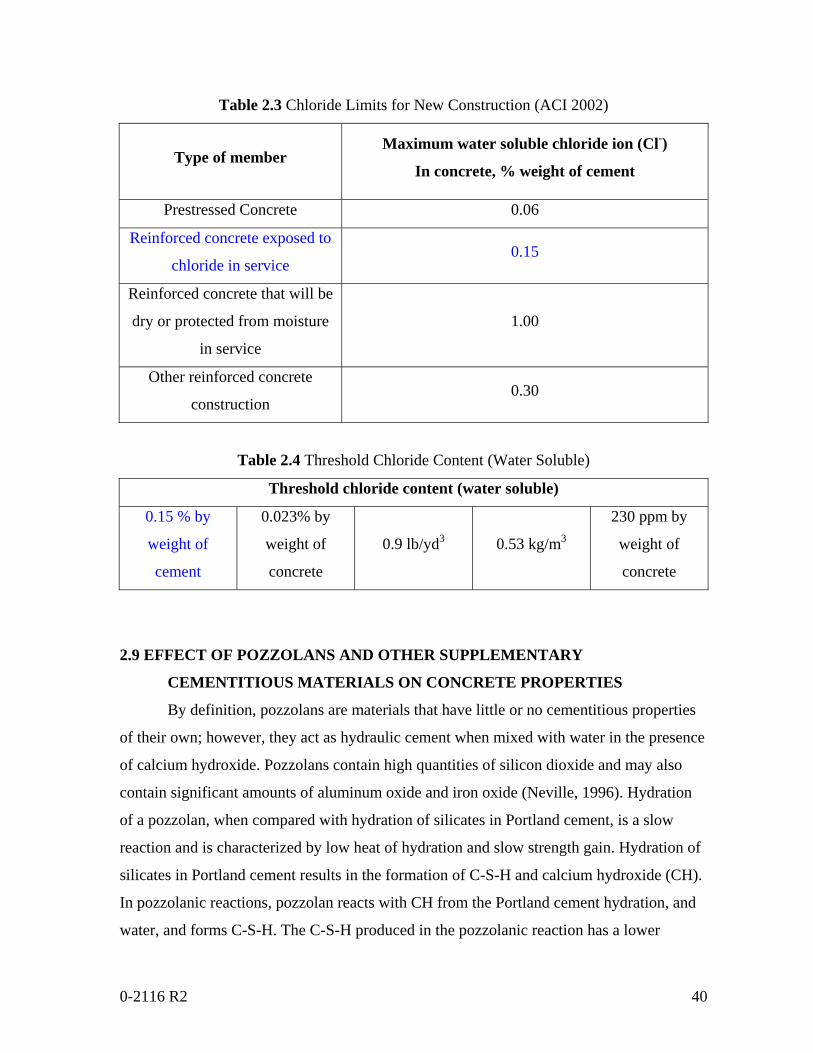
0-2116 R2 40
Table 2.3 Chloride Limits for New Construction (ACI 2002)
Type of member Maximum water soluble chloride ion (Cl-)
In concrete, % weight of cement
Prestressed Concrete 0.06
Reinforced concrete exposed to
chloride in service 0.15
Reinforced concrete that will be
dry or protected from moisture
in service
1.00
Other reinforced concrete
construction 0.30
Table 2.4 Threshold Chloride Content (Water Soluble)
Threshold chloride content (water soluble)
0.15 % by
weight of
cement
0.023% by
weight of
concrete
0.9 lb/yd3 0.53 kg/m3
230 ppm by
weight of
concrete
2.9 EFFECT OF POZZOLANS AND OTHER SUPPLEMENTARY
CEMENTITIOUS MATERIALS ON CONCRETE PROPERTIES
By definition, pozzolans are materials that have little or no cementitious properties
of their own; however, they act as hydraulic cement when mixed with water in the presence
of calcium hydroxide. Pozzolans contain high quantities of silicon dioxide and may also
contain significant amounts of aluminum oxide and iron oxide (Neville, 1996). Hydration
of a pozzolan, when compared with hydration of silicates in Portland cement, is a slow
reaction and is characterized by low heat of hydration and slow strength gain. Hydration of
silicates in Portland cement results in the formation of C-S-H and calcium hydroxide (CH).
In pozzolanic reactions, pozzolan reacts with CH from the Portland cement hydration, and
water, and forms C-S-H. The C-S-H produced in the pozzolanic reaction has a lower
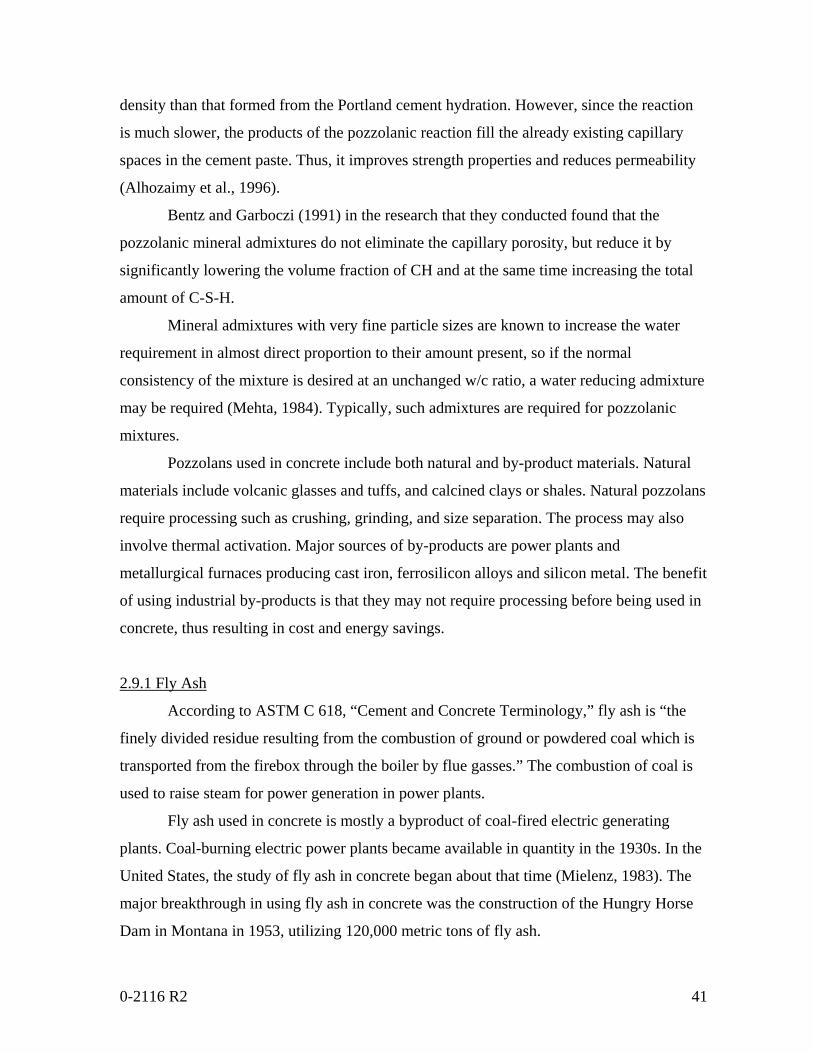
0-2116 R2 41
density than that formed from the Portland cement hydration. However, since the reaction
is much slower, the products of the pozzolanic reaction fill the already existing capillary
spaces in the cement paste. Thus, it improves strength properties and reduces permeability
(Alhozaimy et al., 1996).
Bentz and Garboczi (1991) in the research that they conducted found that the
pozzolanic mineral admixtures do not eliminate the capillary porosity, but reduce it by
significantly lowering the volume fraction of CH and at the same time increasing the total
amount of C-S-H.
Mineral admixtures with very fine particle sizes are known to increase the water
requirement in almost direct proportion to their amount present, so if the normal
consistency of the mixture is desired at an unchanged w/c ratio, a water reducing admixture
may be required (Mehta, 1984). Typically, such admixtures are required for pozzolanic
mixtures.
Pozzolans used in concrete include both natural and by-product materials. Natural
materials include volcanic glasses and tuffs, and calcined clays or shales. Natural pozzolans
require processing such as crushing, grinding, and size separation. The process may also
involve thermal activation. Major sources of by-products are power plants and
metallurgical furnaces producing cast iron, ferrosilicon alloys and silicon metal. The benefit
of using industrial by-products is that they may not require processing before being used in
concrete, thus resulting in cost and energy savings.
2.9.1 Fly Ash
According to ASTM C 618, “Cement and Concrete Terminology,” fly ash is “the
finely divided residue resulting from the combustion of ground or powdered coal which is
transported from the firebox through the boiler by flue gasses.” The combustion of coal is
used to raise steam for power generation in power plants.
Fly ash used in concrete is mostly a byproduct of coal-fired electric generating
plants. Coal-burning electric power plants became available in quantity in the 1930s. In the
United States, the study of fly ash in concrete began about that time (Mielenz, 1983). The
major breakthrough in using fly ash in concrete was the construction of the Hungry Horse
Dam in Montana in 1953, utilizing 120,000 metric tons of fly ash.
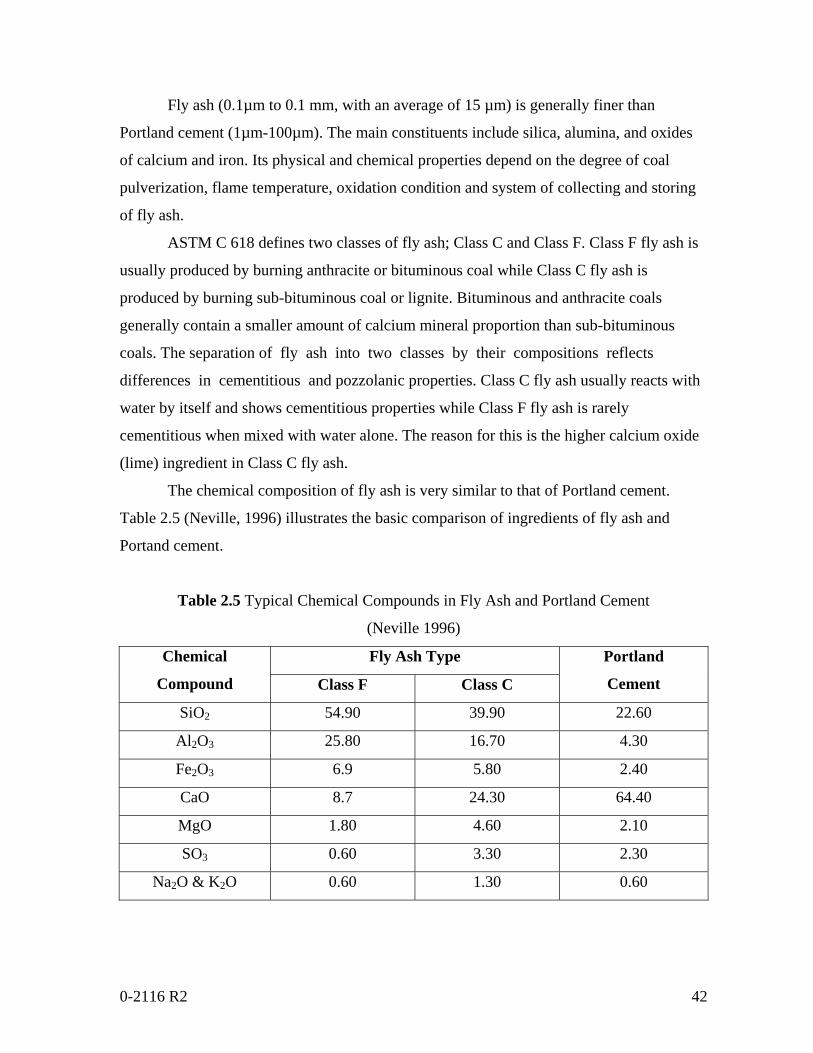
0-2116 R2 42
Fly ash (0.1µm to 0.1 mm, with an average of 15 µm) is generally finer than
Portland cement (1µm-100µm). The main constituents include silica, alumina, and oxides
of calcium and iron. Its physical and chemical properties depend on the degree of coal
pulverization, flame temperature, oxidation condition and system of collecting and storing
of fly ash.
ASTM C 618 defines two classes of fly ash; Class C and Class F. Class F fly ash is
usually produced by burning anthracite or bituminous coal while Class C fly ash is
produced by burning sub-bituminous coal or lignite. Bituminous and anthracite coals
generally contain a smaller amount of calcium mineral proportion than sub-bituminous
coals. The separation of fly ash into two classes by their compositions reflects
differences in cementitious and pozzolanic properties. Class C fly ash usually reacts with
water by itself and shows cementitious properties while Class F fly ash is rarely
cementitious when mixed with water alone. The reason for this is the higher calcium oxide
(lime) ingredient in Class C fly ash.
The chemical composition of fly ash is very similar to that of Portland cement.
Table 2.5 (Neville, 1996) illustrates the basic comparison of ingredients of fly ash and
Portand cement.
Table 2.5 Typical Chemical Compounds in Fly Ash and Portland Cement
(Neville 1996)
Fly Ash Type Chemical
Compound Class F Class C
Portland
Cement
SiO2 54.90 39.90 22.60
Al2O3 25.80 16.70 4.30
Fe2O3 6.9 5.80 2.40
CaO 8.7 24.30 64.40
MgO 1.80 4.60 2.10
SO3 0.60 3.30 2.30
Na2O & K2O 0.60 1.30 0.60
0-2116 R2 43
+
Ca(OH)2
Fly Ash +
+ Fly Ash
Calcium Silicates
C3S, C2S
Water
H2O
Calcium Silicate Hydrate (CSH)
Durable Binder
The setting of Portland cement is related to the hydration of the silicate components,
C3S and C2S as shown in Figure 2.5:
Figure 2.5 Hydration of the Silicate Components in Concrete
Calcium silicate hydrate gel (C-S-H) comprises about 60% of hydrated cement
volume and it is the most important hydration product that provides strength and bond to
the cement paste (Neville, 1996). The other component of hydrated cement is Ca(OH)2
(calcium hydroxide) which forms 20% of hydrated cement volume and does not contribute
to strength. Ca(OH)2 can react with siliceous and aluminous materials in fly ash to
form strong and durable cementing compounds, no different than those formed during
hydration of ordinary Portland cement. This reaction is shown in Figure 2.6:
Figure 2.6 Hydration of Fly Ash and Silicate Components in Concrete
The advantages of using fly ash in concrete are numerous (Jerzy, 1998):
a. Improved workability
b. Lower heat of hydration
c. Lower cost concrete
d. Improved resistance to sulfate attack
e. Improved resistance to alkali-silica reaction
Calcium Silicates + Water
Calcium Silicate Hydrate (CSH)
Free Lime (Ca(OH)2 ) Non-durable by product
H2O C3S, C2S
0-2116 R2 44
f. Higher long-term strength
g. Opportunity for higher strength concrete
h. Equal or increased freeze thaw durability
i. Lower shrinkage characteristics
j. Lower porosity and improved impermeability
The main disadvantages of fly ash are that concrete mixtures take more time to
attain the required strength and thus increase the importance of curing, and the high carbon
content in certain fly ash products absorbs some air entraining agents (which controls the
freeze-thaw durability) reducing the amount of air produced in the concrete frost damage.
The addition of fly ash to concrete changes both the microstructure and the pore
solution composition of the concrete, resulting in a finer pore structure in both the cement
paste matrix and the paste aggregate interface in concrete (Liu and Beaudoin, 2000).
Class F fly ash reduces permeability at low level of cement substitution (10 % by
weight). In class C fly ash, twenty to thirty percent by weight is required to produce any
significant reduction in permeability. Work done by Alhozaimy et al (1996) showed Class
C fly ash gives higher permeability than class F, except for a 30 % substitution level at 28
day testing, although Class C effectively reduces water demand.
2.9.2 Slag Cement
Slag is a by-product from the production of copper. During metal production, liquid
slag is rapidly quenched from a high temperature by immersion in water (Mehta, 1993).
The slag is a glassy, granular, non-metallic product that consists “essentially of silicates and
aluminosilicates of calcium and other bases” (Klieger et al., 1994). It is also known as
granulated blast furnace slag (GBFS). Slag, in addition to pozzolanic properties, and unlike
Class F fly ash and silica fume, also has cementitious properties. With regard to strength,
there are three grades of slag: Grade 80, Grade 100, and Grade 120. Each number
corresponds to a minimum 28-day compressive strength ratio of a mortar cube made with
only Portland cement and a mortar cube made with 50% Portland cement and 50% slag.
Because of cementitious properties, particles smaller than 10 µm contribute to early
strength, while particles larger than 10 µm and smaller than 45 µm contribute to later
0-2116 R2 45
strength. Since particles greater than 45 µm are difficult to hydrate, slag is mostly
pulverized to particles with diameters less than 45 µm (Mehta, 1993).
When used in concrete, slag provides the following benefits (Lewis, 1985): high
ultimate strength with low early strength, high ratio of flexural to compressive strength,
resistant to sulfates and seawater, improved alkali-silica reaction resistance, low heat of
hydration and decreased porosity and permeability.
Substitution of cement materials with ground granulated slag increases the chloride
binding since these mineral additives form additional calcium aluminate hydrates in their
reaction - which is not the case for silica fume, chloride binding increases. Bound chloride
can be released again if at a later stage, cement paste is carbonated or attacked by sulfate
(Afroze, 2002).
Sato and Agopian (2001) also proved that the addition of slag to a mix directly
affects its porosity and its pore structure. They found that concrete without slag had 61 %
of its pores larger than 0.12 micrometers in diameter (larger pores) while the concrete with
slag, of the same mixture proportions presented only 39 % of these larger pores.
2.10 ION AND MASS TRANSPORT IN CONCRETE MIXES DURING RCPT
The permeability of concrete depends on the pore structure of concrete, while
electrical conductivity or resistivity of concrete is determined by both pore structure and the
chemistry of the pore solution. Factors that have little to do with the transport of chloride
can have great effect on the electrical conductivity of concrete. Thus, the electrical
conductivity or resistivity of concrete mixtures cannot always be used as an accurate
indication of its permeability. However, the electrical conductivity or resistivity can be used
as a quality control indicator when the particular concrete mixtures have similar
components and mixing proportions.
The RCPT has been used to evaluate the chloride permeability of hardened cement
mortars and concretes made with special cements or supplementary cementing materials
(Ozyildirm et al., 1988). Unfortunately, the use of RCPT in some studies has resulted in
some invalid or misleading conclusions. In one study (Roy et al., 1987), it was found that
the inclusion of sands or Class F fly ash decreases chloride permeability significantly, while
their effects on water permeability are much smaller. In another study (Alhozaimy, 1996), a
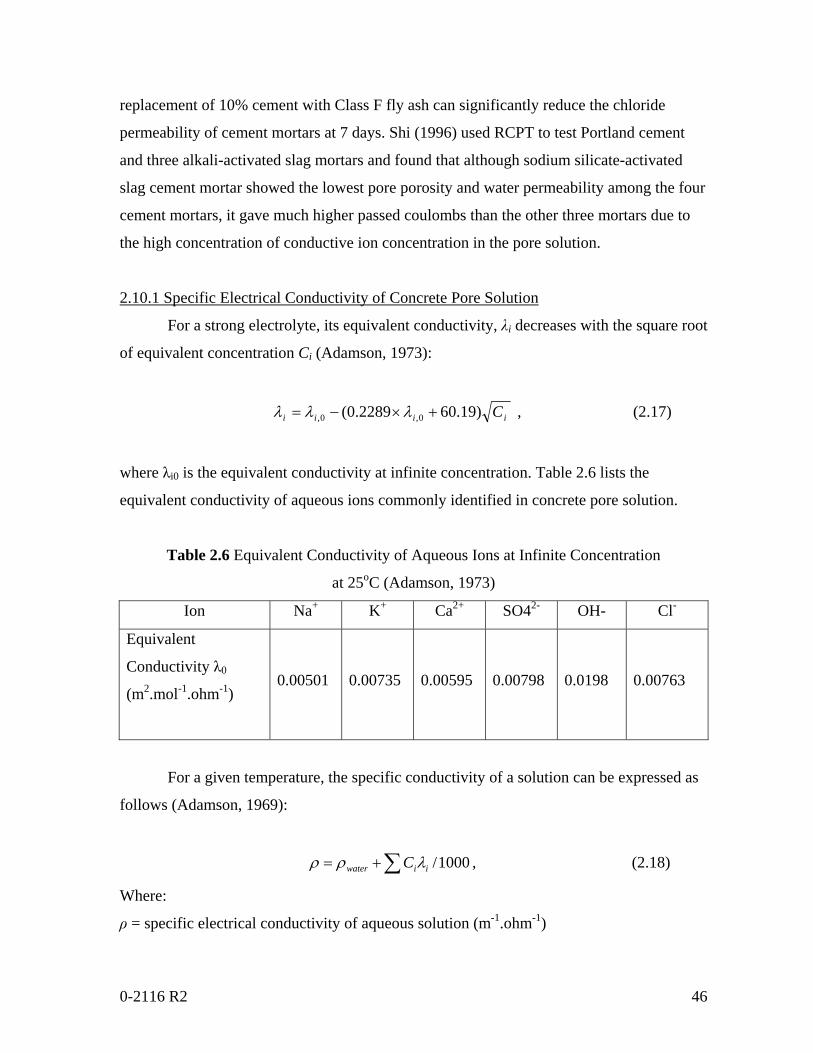
0-2116 R2 46
replacement of 10% cement with Class F fly ash can significantly reduce the chloride
permeability of cement mortars at 7 days. Shi (1996) used RCPT to test Portland cement
and three alkali-activated slag mortars and found that although sodium silicate-activated
slag cement mortar showed the lowest pore porosity and water permeability among the four
cement mortars, it gave much higher passed coulombs than the other three mortars due to
the high concentration of conductive ion concentration in the pore solution.
2.10.1 Specific Electrical Conductivity of Concrete Pore Solution
For a strong electrolyte, its equivalent conductivity, λi decreases with the square root
of equivalent concentration Ci (Adamson, 1973):
iiii C)19.602289.0( 0,0, +×−= λλλ , (2.17)
where λi0 is the equivalent conductivity at infinite concentration. Table 2.6 lists the
equivalent conductivity of aqueous ions commonly identified in concrete pore solution.
Table 2.6 Equivalent Conductivity of Aqueous Ions at Infinite Concentration
at 25oC (Adamson, 1973)
Ion Na+ K+ Ca2+ SO42- OH- Cl-
Equivalent
Conductivity λ0
(m2.mol-1.ohm-1)
0.00501 0.00735 0.00595 0.00798 0.0198 0.00763
For a given temperature, the specific conductivity of a solution can be expressed as
follows (Adamson, 1969):
1000/iiwater C λρρ ∑+= , (2.18)
Where:
ρ = specific electrical conductivity of aqueous solution (m-1.ohm-1)
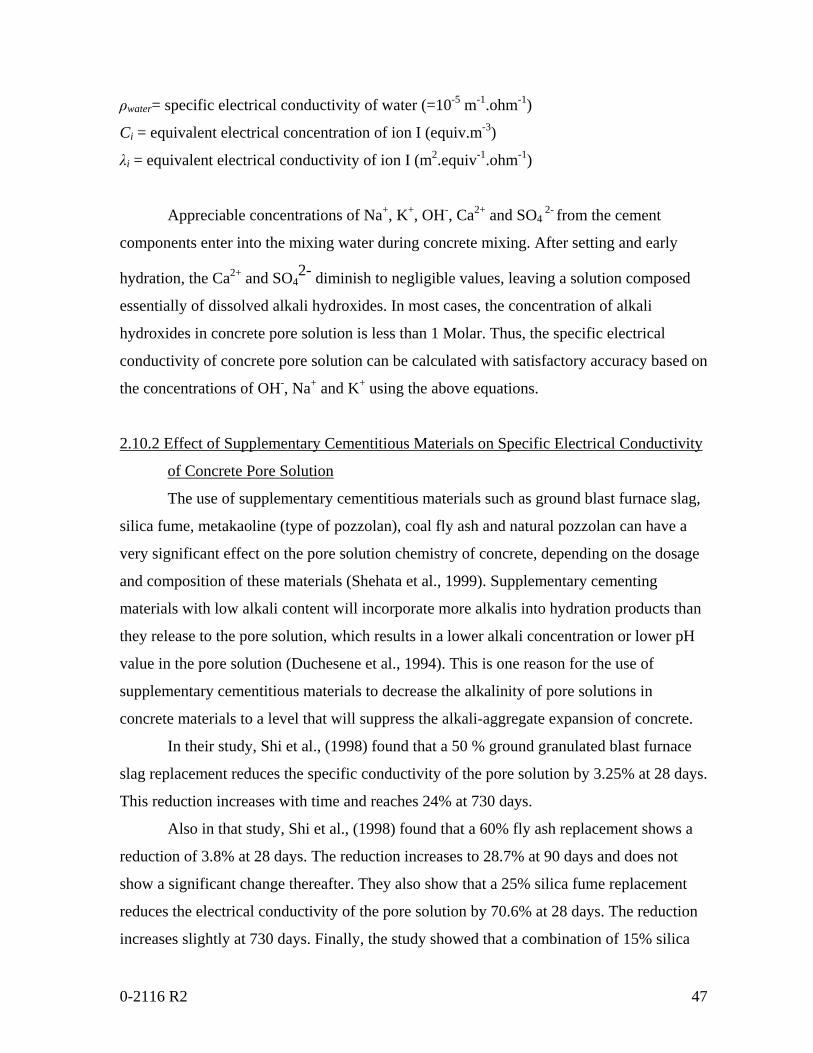
0-2116 R2 47
ρwater= specific electrical conductivity of water (=10-5 m-1.ohm-1)
Ci = equivalent electrical concentration of ion I (equiv.m-3)
λi = equivalent electrical conductivity of ion I (m2.equiv-1.ohm-1)
Appreciable concentrations of Na+, K+, OH-, Ca2+ and SO4 2-
from the cement
components enter into the mixing water during concrete mixing. After setting and early
hydration, the Ca2+ and SO42- diminish to negligible values, leaving a solution composed
essentially of dissolved alkali hydroxides. In most cases, the concentration of alkali
hydroxides in concrete pore solution is less than 1 Molar. Thus, the specific electrical
conductivity of concrete pore solution can be calculated with satisfactory accuracy based on
the concentrations of OH-, Na+ and K+ using the above equations.
2.10.2 Effect of Supplementary Cementitious Materials on Specific Electrical Conductivity
of Concrete Pore Solution
The use of supplementary cementitious materials such as ground blast furnace slag,
silica fume, metakaoline (type of pozzolan), coal fly ash and natural pozzolan can have a
very significant effect on the pore solution chemistry of concrete, depending on the dosage
and composition of these materials (Shehata et al., 1999). Supplementary cementing
materials with low alkali content will incorporate more alkalis into hydration products than
they release to the pore solution, which results in a lower alkali concentration or lower pH
value in the pore solution (Duchesene et al., 1994). This is one reason for the use of
supplementary cementitious materials to decrease the alkalinity of pore solutions in
concrete materials to a level that will suppress the alkali-aggregate expansion of concrete.
In their study, Shi et al., (1998) found that a 50 % ground granulated blast furnace
slag replacement reduces the specific conductivity of the pore solution by 3.25% at 28 days.
This reduction increases with time and reaches 24% at 730 days.
Also in that study, Shi et al., (1998) found that a 60% fly ash replacement shows a
reduction of 3.8% at 28 days. The reduction increases to 28.7% at 90 days and does not
show a significant change thereafter. They also show that a 25% silica fume replacement
reduces the electrical conductivity of the pore solution by 70.6% at 28 days. The reduction
increases slightly at 730 days. Finally, the study showed that a combination of 15% silica
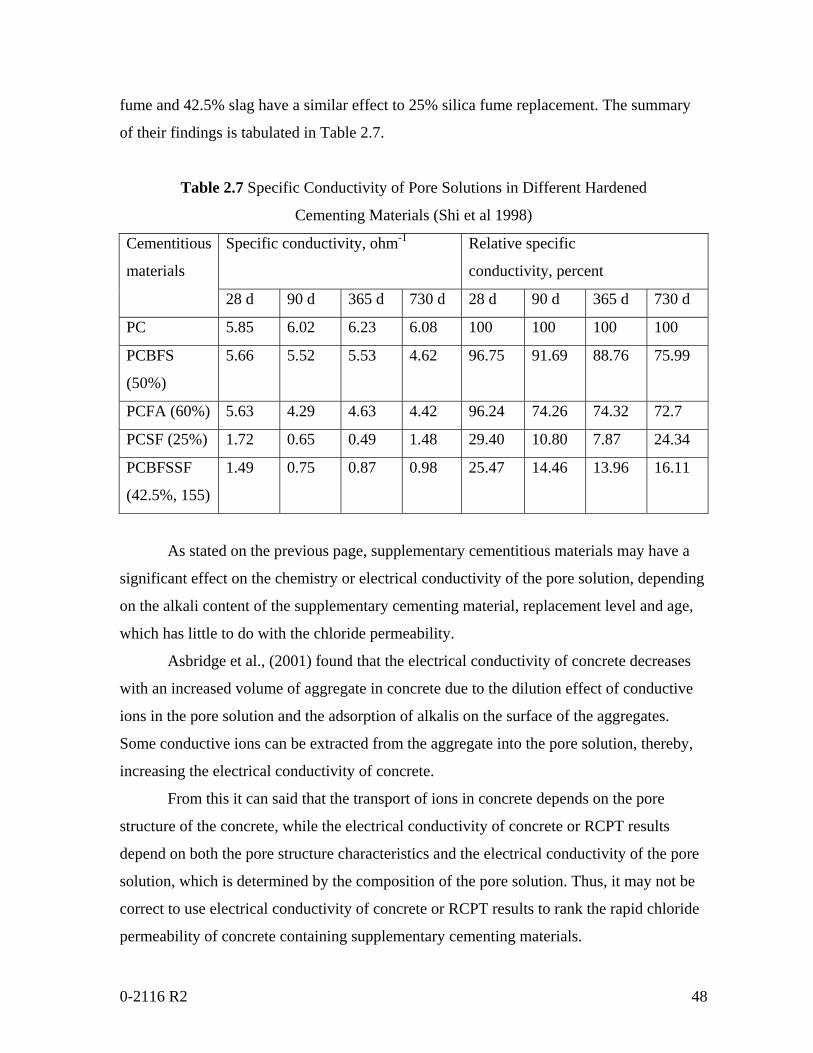
0-2116 R2 48
fume and 42.5% slag have a similar effect to 25% silica fume replacement. The summary
of their findings is tabulated in Table 2.7.
Table 2.7 Specific Conductivity of Pore Solutions in Different Hardened
Cementing Materials (Shi et al 1998)
Specific conductivity, ohm-1 Relative specific
conductivity, percent
Cementitious
materials
28 d 90 d 365 d 730 d 28 d 90 d 365 d 730 d
PC 5.85 6.02 6.23 6.08 100 100 100 100
PCBFS
(50%)
5.66 5.52 5.53 4.62 96.75 91.69 88.76 75.99
PCFA (60%) 5.63 4.29 4.63 4.42 96.24 74.26 74.32 72.7
PCSF (25%) 1.72 0.65 0.49 1.48 29.40 10.80 7.87 24.34
PCBFSSF
(42.5%, 155)
1.49 0.75 0.87 0.98 25.47 14.46 13.96 16.11
As stated on the previous page, supplementary cementitious materials may have a
significant effect on the chemistry or electrical conductivity of the pore solution, depending
on the alkali content of the supplementary cementing material, replacement level and age,
which has little to do with the chloride permeability.
Asbridge et al., (2001) found that the electrical conductivity of concrete decreases
with an increased volume of aggregate in concrete due to the dilution effect of conductive
ions in the pore solution and the adsorption of alkalis on the surface of the aggregates.
Some conductive ions can be extracted from the aggregate into the pore solution, thereby,
increasing the electrical conductivity of concrete.
From this it can said that the transport of ions in concrete depends on the pore
structure of the concrete, while the electrical conductivity of concrete or RCPT results
depend on both the pore structure characteristics and the electrical conductivity of the pore
solution, which is determined by the composition of the pore solution. Thus, it may not be
correct to use electrical conductivity of concrete or RCPT results to rank the rapid chloride
permeability of concrete containing supplementary cementing materials.
0-2116 R2 49
2.11 ION AND MASS TRANSPORT IN CONCRETE MIXES DURING PONDING
TESTS
Ionic and molecular diffusion are the two main modes of chloride transport during
the ponding test. Concrete mixtures containing silica fume, fly ash or slag attain a higher
resistance against chloride penetration than a control mixture as the development of a dense
pore structure due to the pozzolanic reaction. This reaction transforms the calcium
hydroxide into calcium silicate hydrate, resulting in a refinement of the pore structure
through the transformation of the larger pores into smaller ones. Owing the net reduction in
calcium hydroxide content in the mix to the pozzolanic reaction, the volume of continuous
capillary pores will be proportionally decreased. The microstructure becomes relatively
more dense, tortuous and discontinuous in comparison with the control mixture. These
properties of the pore structure affect the resistance of concrete to chloride penetration
(Wee et al., 2000).
The filler effect in concrete with silica fume, due to its ultra fine particle size (0.1 to
0.2µm) allows the silica fume to fill the voids: i) in the cement paste and also ii) between
the cement paste and the coarse aggregate particles. This allows a denser microstructure to
develop. Therefore, for mixtures with mineral admixtures, the activation energy for
chloride diffusion is high compared to the control mixtures (Afroze., 2002).
In addition to the pore refinement (in the case of silica fume and slag concrete) and
filler action (in the case of silica fume), the chemical interaction between the diffusing
chlorides and the cement phases (C3A and C4AF) lead to chloride binding. The electrical
double layer formed on the pore wall surface may also restrict the depth of chloride
penetration. As a result of chloride binding, the voluminous chloride binding phases such as
Friedel’s salt tend to deposit into the coarser pores ( greater than 60 nm in diameter)
causing a greater degree of pore constriction and tortuosity and thereby partially blocking
the subsequent chloride from penetration through the concrete. The aggregate cement paste
zone, however, supports the higher depths of chloride penetration through the early ages (3
days curing) but its influence is negligible in well-cured concrete (28 days) mixtures. In
contrast, the aggregate cement paste transition zones in silica fume concrete are generally
considered to be denser due to the filler action of the silica fume and hence may not allow
0-2116 R2 50
the chloride penetration even in the early age concrete. So, the diffusion of chloride through
concrete is dependent on the microstructure of the concrete (Afroze., 2002).
The ionic diffusion of chlorides during the ponding test depends on the nature and
extent of chemical interaction such as chloride binding, electrical double layer between the
chlorides and the pore wall surfaces. Consequently, the subsequent chloride diffusion
during the ponding test experiences a greater degree of resistance from the pore structure.
(Afroze., 2002).
In their recent study Wee et al., (2000) tried to find a correlation between the
charge-passed data derived from the rapid chloride permeability test (RCPT) and the
chloride penetration coefficient K derived through a 90-day soaking test for the concrete
containing mineral admixture. For this purpose, concrete specimens containing varying
proportions and fineness of mineral admixtures, such as ground granulated blast-furnace
slag (GGBS) and silica fume (SF),were moist-cured for different periods (3, 7 and 28 days)
and were subjected to both a 90-day soaking test and an RCPT. To supplement the results,
the electrical resistivity and compressive strengths of the concrete mixtures were also
evaluated.
Wee et al., (2000) found that for the majority of mixtures containing SF and GGBS,
the chloride penetration coefficient K and the charge-passed data followed different trends.
The coefficient K was derived from empirical equations and the steps of AASHTO
T259/260 were not followed. Thus, comparison is not available between the ponding results
from this research project and the findings of Wee et al., (2000). i.e., when the moist curing
period was extended (3 to 28 days), the amount of reduction in the magnitude of charge
passed through the mixture was significantly higher than the corresponding reduction in K.
This also suggests a greater influence of the extended curing period (3 to 28 days) on the
quantity of charge passed through the concrete compared to that on K and that the charges
passed and K are the independent properties of concrete controlled by different factors. The
charge passed depends on the microstructure and the pore fluid conductivity (especially
OH– ions) of the concrete, while K depends primarily on the microstructure of the concrete.
Further, the charge passed through SF and GGBS concrete was shown decreasing
exponentially with increasing electrical resistivity of the mixture. Thus, the charge passed
through the concrete mixture containing SF and GGBS can only be used as a measure of
0-2116 R2 51
the overall conductivity of concrete rather than as a measure of the resistance of concrete to
chloride penetration.
2.12 EFFECT OF THE INTERFACE ZONE AND AGGREGATE TYPE ON
PERMEABILITY OF CONCRETE
In the past, concrete has been considered a two-phase material, consisting of
aggregate particles dispersed in a cementitious matrix. For such a material, the mechanical
and transport properties are assumed to depend partially on the w/cm ratio and on the type
of aggregate. However, recent research (Nielsen, 1993) has shown that concrete should be
modeled as a three phase system: the cement paste, the aggregate and the transition zone
between the aggregate and the cement paste. The transition zone develops where the
hydration cement system comes in contact with the aggregate and which determines the
strength of the cement/aggregate bond.
The resistance of concrete to aggressive agents including chloride ions depends
mainly on the strength and densification of the transition zone which provides channels for
chloride ions to penetrate through the concrete. The microstructure of the hydrated cement
paste in the immediate vicinity of coarse aggregate differs significantly from that of the
bulk of the cement paste, because dry cement particles are unable to become closely packed
against the relatively large particles of aggregate during mixing. Therefore there is less
cement present to hydrate and fill the original voids. In consequence, the interface zone has
a much higher porosity than the hydrated cement paste further away from the coarse
aggregate.
The microstructure of the interface zone is as follows: the surface of the aggregate is
covered with a layer of calcium hydroxide about 0.5 µm. Beyond this calcium hydroxide
layer, there is a layer of calcium silicate hydrate (C-S-H) of about the same thickness.
Moving further away from the aggregate lies the main interface zone, some 50 µm thick,
containing products of hydration of cement with large crystals of calcium hydroxide but
with no unhydrated cement.
The strength of the interface zone increases with time in consequence of a
secondary reaction described above between the calcium hydroxide and the pozzolans.
0-2116 R2 52
Although the interface zone of primary interest is that at the surface of the coarse
aggregate, such a zone is also formed around the fine aggregate particles. In this case, the
thickness of the interface zone is smaller but the surface effects originating from the fine
particles interfere with those of the coarse aggregate and thus affects the overall extent of
the interface zone.
The mineralogical characteristics of the coarse aggregate also affect the
microstructure of the transition zone; in the case of limestone, there is a chemical reaction
between the limestone and the cement paste and consequently a dense interface zone is
formed (Monteiro et al., 1985). The result is a lower permeability of concrete. However,
this is not the case when siliceous gravel is used during mixing.
2.13 CORRELATION BETWEEN PONDING RESULTS AND RAPID CHLORIDE
PERMEABILITY TESTS
Specifying concrete directly on the basis of performance rather than indirectly by
strength requires a suitable durability test measure that is simple and reliable. While
accelerated durability tests exist, they are costly, time consuming, and limited to laboratory
use. On the other hand, correlations between permeability and durability have long been
justified and studied.
As described in Section 1.6 of this report, the two tests most often used to determine
concrete permeability are AASHTO T-277, Rapid Chloride Permeability Test (RCPT), and
T-259, Resistance of Concrete to Chloride on Penetration (ponding test). The AASHTO
T259 test has long been favored among concrete corrosion specialists for assessing the
chloride penetration of concrete. In contrast, with a growing need for a faster and less
expensive indicator of chloride permeability, AASHTO T 277 is becoming more popular
among owners and specifiers. Today, the rapid 6-hour test (T277) is a common requirement
in construction projects specifications where engineers are specifying low values between
700 and 1000 coulombs to ensure durable concrete. The following sections discuss the
original correlation developed between these two tests by previous researchers and
investigate the correlation between the two tests for the seven sites studied during this
research.
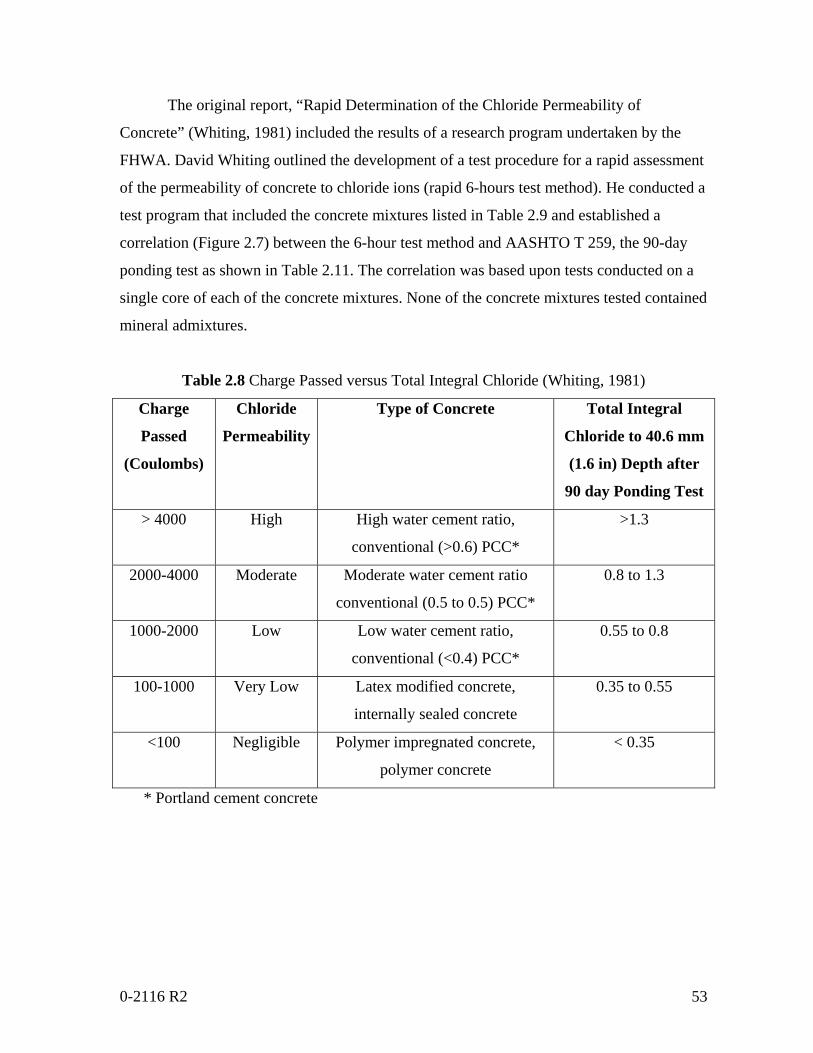
0-2116 R2 53
The original report, “Rapid Determination of the Chloride Permeability of
Concrete” (Whiting, 1981) included the results of a research program undertaken by the
FHWA. David Whiting outlined the development of a test procedure for a rapid assessment
of the permeability of concrete to chloride ions (rapid 6-hours test method). He conducted a
test program that included the concrete mixtures listed in Table 2.9 and established a
correlation (Figure 2.7) between the 6-hour test method and AASHTO T 259, the 90-day
ponding test as shown in Table 2.11. The correlation was based upon tests conducted on a
single core of each of the concrete mixtures. None of the concrete mixtures tested contained
mineral admixtures.
Table 2.8 Charge Passed versus Total Integral Chloride (Whiting, 1981)
Charge
Passed
(Coulombs)
Chloride
Permeability
Type of Concrete Total Integral
Chloride to 40.6 mm
(1.6 in) Depth after
90 day Ponding Test
> 4000 High High water cement ratio,
conventional (>0.6) PCC*
>1.3
2000-4000 Moderate Moderate water cement ratio
conventional (0.5 to 0.5) PCC*
0.8 to 1.3
1000-2000 Low Low water cement ratio,
conventional (<0.4) PCC*
0.55 to 0.8
100-1000 Very Low Latex modified concrete,
internally sealed concrete
0.35 to 0.55
<100 Negligible Polymer impregnated concrete,
polymer concrete
< 0.35
* Portland cement concrete
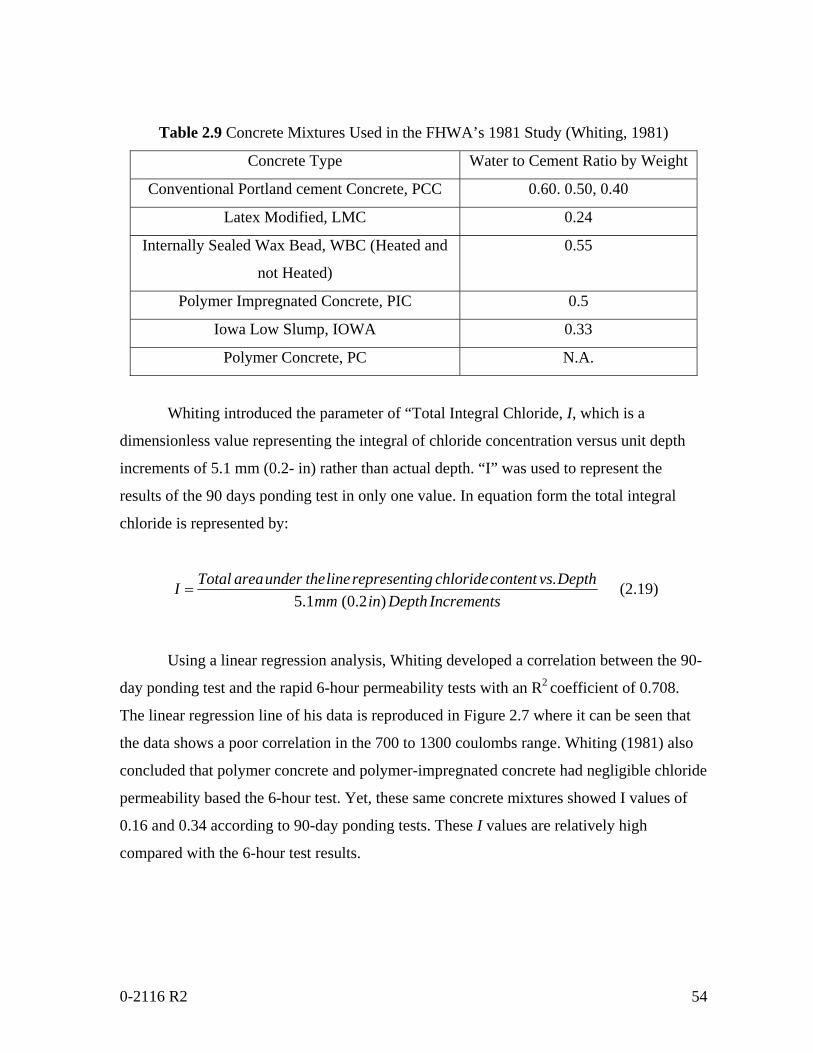
0-2116 R2 54
Table 2.9 Concrete Mixtures Used in the FHWA’s 1981 Study (Whiting, 1981)
Concrete Type Water to Cement Ratio by Weight
Conventional Portland cement Concrete, PCC 0.60. 0.50, 0.40
Latex Modified, LMC 0.24
Internally Sealed Wax Bead, WBC (Heated and
not Heated)
0.55
Polymer Impregnated Concrete, PIC 0.5
Iowa Low Slump, IOWA 0.33
Polymer Concrete, PC N.A.
Whiting introduced the parameter of “Total Integral Chloride, I, which is a
dimensionless value representing the integral of chloride concentration versus unit depth
increments of 5.1 mm (0.2- in) rather than actual depth. “I” was used to represent the
results of the 90 days ponding test in only one value. In equation form the total integral
chloride is represented by:
IncrementsDepthinmm
DepthvscontentchloridengrepresentilinetheunderareaTotalI)2.0(1.5
.= (2.19)
Using a linear regression analysis, Whiting developed a correlation between the 90-
day ponding test and the rapid 6-hour permeability tests with an R2 coefficient of 0.708.
The linear regression line of his data is reproduced in Figure 2.7 where it can be seen that
the data shows a poor correlation in the 700 to 1300 coulombs range. Whiting (1981) also
concluded that polymer concrete and polymer-impregnated concrete had negligible chloride
permeability based the 6-hour test. Yet, these same concrete mixtures showed I values of
0.16 and 0.34 according to 90-day ponding tests. These I values are relatively high
compared with the 6-hour test results.
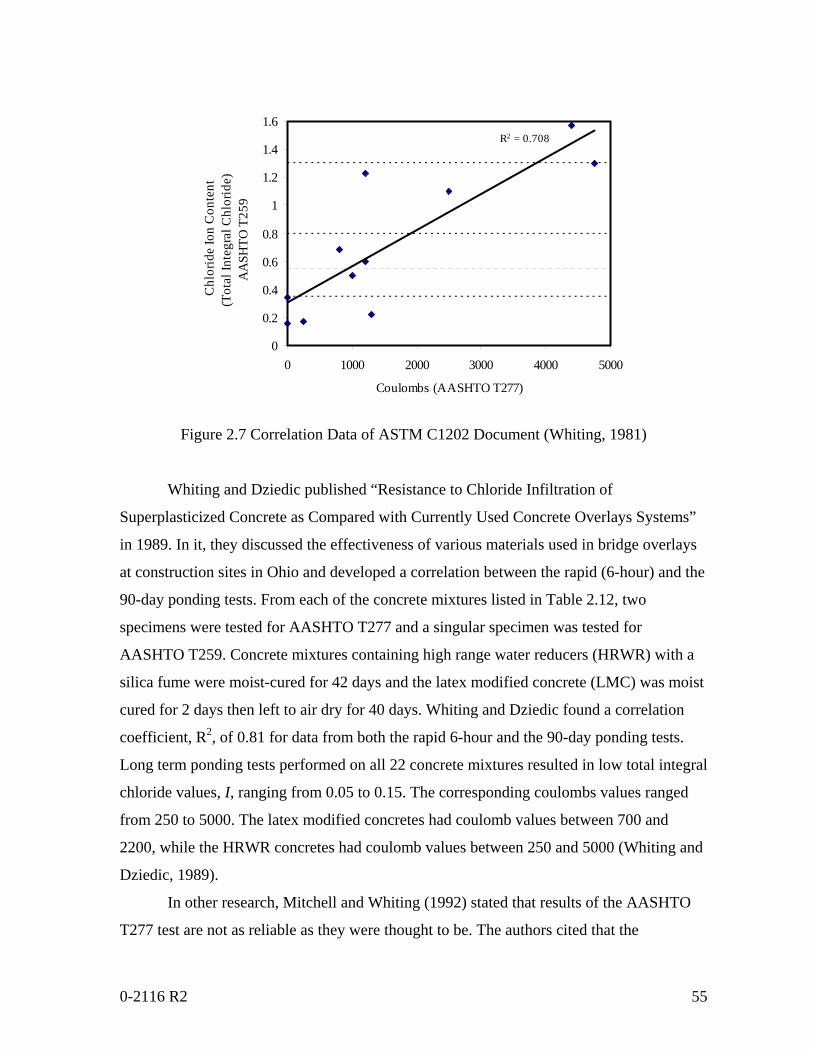
0-2116 R2 55
R2 = 0.708
0
0.2
0.4
0.6
0.8
1
1.2
1.4
1.6
0 1000 2000 3000 4000 5000
Coulombs (AASHTO T277)
Chl
orid
e Io
n C
onte
nt
(Tot
al In
tegr
al C
hlor
ide)
A
ASH
TO T
259
Figure 2.7 Correlation Data of ASTM C1202 Document (Whiting, 1981)
Whiting and Dziedic published “Resistance to Chloride Infiltration of
Superplasticized Concrete as Compared with Currently Used Concrete Overlays Systems”
in 1989. In it, they discussed the effectiveness of various materials used in bridge overlays
at construction sites in Ohio and developed a correlation between the rapid (6-hour) and the
90-day ponding tests. From each of the concrete mixtures listed in Table 2.12, two
specimens were tested for AASHTO T277 and a singular specimen was tested for
AASHTO T259. Concrete mixtures containing high range water reducers (HRWR) with a
silica fume were moist-cured for 42 days and the latex modified concrete (LMC) was moist
cured for 2 days then left to air dry for 40 days. Whiting and Dziedic found a correlation
coefficient, R2, of 0.81 for data from both the rapid 6-hour and the 90-day ponding tests.
Long term ponding tests performed on all 22 concrete mixtures resulted in low total integral
chloride values, I, ranging from 0.05 to 0.15. The corresponding coulombs values ranged
from 250 to 5000. The latex modified concretes had coulomb values between 700 and
2200, while the HRWR concretes had coulomb values between 250 and 5000 (Whiting and
Dziedic, 1989).
In other research, Mitchell and Whiting (1992) stated that results of the AASHTO
T277 test are not as reliable as they were thought to be. The authors cited that the
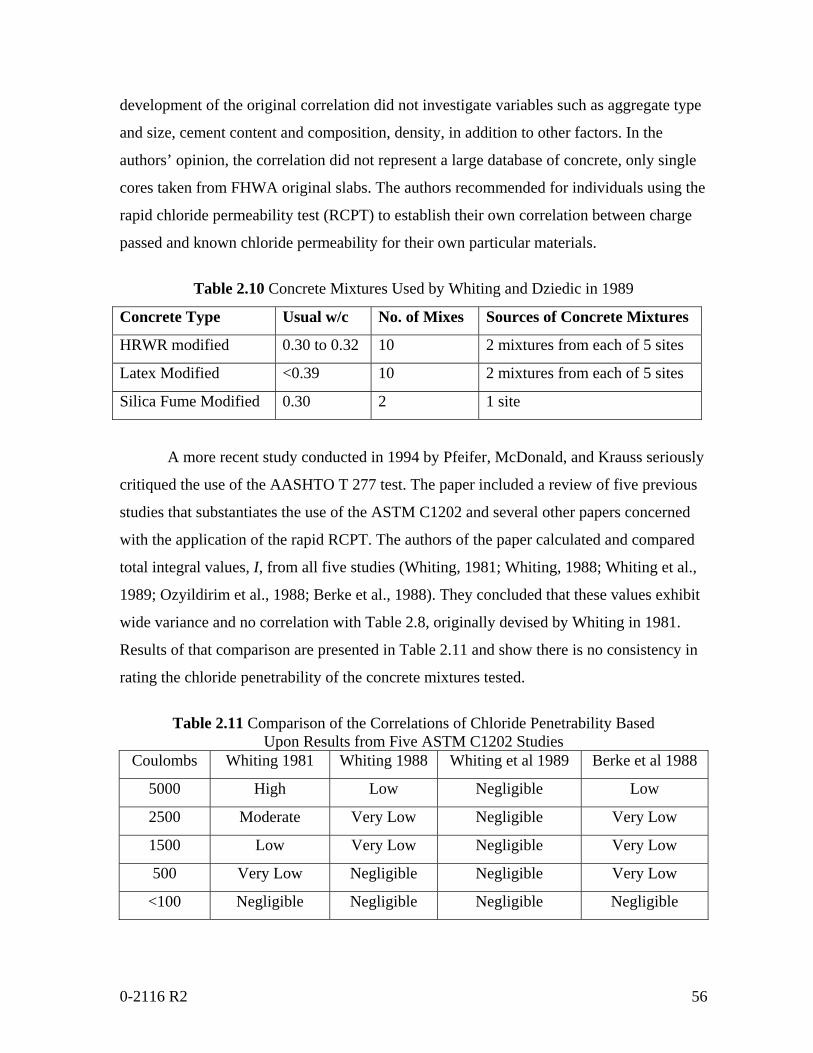
0-2116 R2 56
development of the original correlation did not investigate variables such as aggregate type
and size, cement content and composition, density, in addition to other factors. In the
authors’ opinion, the correlation did not represent a large database of concrete, only single
cores taken from FHWA original slabs. The authors recommended for individuals using the
rapid chloride permeability test (RCPT) to establish their own correlation between charge
passed and known chloride permeability for their own particular materials.
Table 2.10 Concrete Mixtures Used by Whiting and Dziedic in 1989
Concrete Type Usual w/c No. of Mixes Sources of Concrete Mixtures
HRWR modified 0.30 to 0.32 10 2 mixtures from each of 5 sites
Latex Modified <0.39 10 2 mixtures from each of 5 sites
Silica Fume Modified 0.30 2 1 site
A more recent study conducted in 1994 by Pfeifer, McDonald, and Krauss seriously
critiqued the use of the AASHTO T 277 test. The paper included a review of five previous
studies that substantiates the use of the ASTM C1202 and several other papers concerned
with the application of the rapid RCPT. The authors of the paper calculated and compared
total integral values, I, from all five studies (Whiting, 1981; Whiting, 1988; Whiting et al.,
1989; Ozyildirim et al., 1988; Berke et al., 1988). They concluded that these values exhibit
wide variance and no correlation with Table 2.8, originally devised by Whiting in 1981.
Results of that comparison are presented in Table 2.11 and show there is no consistency in
rating the chloride penetrability of the concrete mixtures tested.
Table 2.11 Comparison of the Correlations of Chloride Penetrability Based
Upon Results from Five ASTM C1202 Studies Coulombs Whiting 1981 Whiting 1988 Whiting et al 1989 Berke et al 1988
5000 High Low Negligible Low
2500 Moderate Very Low Negligible Very Low
1500 Low Very Low Negligible Very Low
500 Very Low Negligible Negligible Very Low
<100 Negligible Negligible Negligible Negligible
0-2116 R2 57
REFERENCES
AASHTO. (1998). “Standard Method of Test for Resistance of Concrete to Chloride Ion
Penetration.” T259-80. American Association of State Highway and Transportation
Officials. Washington, D.C.
AASHTO. (1998). “Standard Method for Sampling and Testing for Chloride Ion in
Concrete and Concrete Raw Materials.” T260-94. American Association of State
Highway and Transportation Officials. Washington, D.C
AASHTO. (2002). “Electrical Indication of Concrete’s Ability to Resist Chloride Ion
Penetration.” T277-96. American Association of State Highway and Transportation
Officials. Washington, D.C.
ACI. (2002). “Publication 222R-96 Corrosion of Metals in Concrete.” The American
Concrete Institute, Detroit, Michigan.
Adamson, A.W. (1969). Understanding Physical Chemistry. Second Edition, W. A.
Benjamin, Inc.
Adamson, A.W. (1973). Physical Chemistry. Academic Press, 2nd edition.
Afroze, M. (2002). Effect of Curing on Permeability and Freeze-thaw Durability of
Bridge Deck Concrete. Master’s thesis. Texas Tech University.
Aïtcin, P. Miao, B., Cook, W.D., and Mitchell, D. (1994). “Effect of Size and Curing on
Cylinder Compressive Strength of Normal and High-Strength Concretes.” ACI
Materials Journal. Volume 91. No. 4. 349.
Alhozaimy, A., Soroushian, P., Mirza, F. (1996). “Effects of Curing Conditions and Age on
Chloride Permeability of Fly Ash Mortar.” ACI Material Journal, Vol. 93, N0.1, pp
87-95.
Alsayed, S.H. and Amjad, M.A. (1994). “Effect of Curing Conditions on Strength,
Porosity, Absorptivity, and Shrinkage of Concrete in Hot and Dry Climate.”
Cement and Concrete Research. Volume 24. No. 7. 1390.
Asbridge, A. H., Chadbourn G. A., Page, C. L. (2001). “Effects of Metakaoine and the
Interfacial Transition Zone on the Diffusion of Chloride Ions Through Cement
Mortars.” Cement and Concrete Research, Vol.31, No.11, pp.1567-1572.
0-2116 R2 58
ASTM. (1997). “Standard Specification for Fly Ash and Raw or Calcined Natural Pozzolan
for Use as Mineral Admixture in Portland cement Concrete.” American Society for
Testing and Materials, Annual Book of ASTM Standards, C618, Volume 04.02,
West Conshohocken, Pennsylvania.
ASTM. (1997). “Standard Test Method for Electrical Indication of Concrete's Ability to
Resist Chloride Ion Penetration.” Annual Book of ASTM Standards, C 1202-97,
Vol. 04.02, pp. 639-644.
ASTM. (2002). “Standard Specification for Portland cement.” C 150-99. American
Society for Testing Materials. Philadelphia, PA.
ASTM. (2002). “Standard Test Method for Electrical Indication of Concrete’s Ability to
Resist Chloride Ion Penetration.” C 1202-97. American Society for Testing
Materials. Philadelphia, PA.
Bamforth, P.B. (1995). “Improving the Durability of Concrete Using Mineral Admixtures.”
Concrete Durability in the Arabian Gulf, pp. 1-26.
Bentz, D.P., Garboczi, E. J. (1991). “Simulation Studies of the Effects of Mineral
Admixtures on the Cement Paste-Aggregate Interfacial Zone.” ACI Materials
Journal (American Concrete Institute), v. 88, n. 5, September- October, pp. 518-
529.
Berke, N.S., Pfeifer, D.W. (1988). “Protection against Chloride Induced Corrosion.”
Concrete International, Vol 10, No. 12, pp. 44-55.
Byfors, K., Hansson C. M., Tritthart. J. (1986). “Pore Solution Expression as a Method to
Determine the Influence of Mineral Additives on Chloride Binding.” Cem. Concr.
Res., vol. 16, pp. 760-770.
Cable, J.K., Wang, K., and Ge, Z. (2003). “Investigation into Improved Curing Materials
and Techniques: Part 2 (Phase III).” Research Report Number TR-479. Center for
Portland cement Concrete Pavement Technology, Iowa State University. Ames, IA.
Cabrera, J. G. (1996). “Deterioration of Concrete Due to Reinforcement Steel Corrosion.”
Cement Concrete Composites, vol. 18, pp. 47-59.
Cao, Y., Detwiler, R.J. (1995). “Backscatter Electron Imaging of Cement Pastes Cured at
Elevated Temperatures.” Cement and Concrete Research, Vol. 25, No. 3, pp. 627-
638.
0-2116 R2 59
Chanvillard, G., and D’Aloia, L. (1997). “Concrete Strength Estimation at Early Ages:
Modification of the Method of Equivalent Age.” ACI Materials Journal. Volume
94. Number 6. 520.
Clear, K.C. (1983). “Chloride at the Threshold.” Report of Kenneth C. Clear Inc., March,
pp. 1011.
Conroy-Jones, A.G. (2004). “Effect of Curing on the Tensile Strength of Medium to High
Strength Concrete.” Magazine of Concrete Research. Volume 56. Number
3. 151-158.
Daily, S.F. (1997). “Understanding Corrosion and Cathodic Protection of Reinforced
Concrete Structures.” Corrpro Companies, Inc.
Danilecki, W. (1969). “An Investigation into the Effect of Crack Width on the Corrosion of
Reinforcement in Reinforced Concrete.” RILEM Symposium on the Durability of
Concrete. Prague.
Detwiler, R.J., Kjellsen, K.O., Gjorv, O.E. (1991). “Resistance to Chloride Intrusion of
Concrete Cured at Different Temperatures.” ACI Materials Journal, Vol. 88, No. 1,
pp. 19-24.
Duchesene, J., Berube, M.A. (1994). “The Effectiveness of Supplementary Cementing
Materials in Suppressing Expansion due to ASR: Another Look at the Reaction
Mechanism, Part 2: Pore Solution Chemistry.” Cement and Concrete Research,
Vol.24, No.2, pp. 221-230.
Evans, U. R. (1960). The Corrosion and Oxidation of Metals. Arnold & Co., London.
Feldman, R., Chan, G., Brousseau, R., Tumidajski, P. (1994). “Investigation of the Rapid
Chloride Permeability Test.” ACI Materials Journal, May-June, pp. 246-255.
Francois, R., Arliguie, G. (1999). “Effect of Microcracking and Cracking on the
Development of Corrosion in Reinforced Concrete Members.” Magazine of
Concrete Research, 51, No.2, Apr., 143-150.
Ghanem, H.A. (2004). Chloride Ion Transport in Bridge Deck Concrete under Different
Curing Conditions. Master’s thesis. Texas Tech University.
González, J. A., Algaba, S., Andrade, C. (1980). “Corrosion of Reinforcing Bars in
Carbonated Concrete.” Br. Corr. J., 3, pp. 135-139.
0-2116 R2 60
Hansson, C.M., Markussen J. B., Frølund, T. (1985). “The Effect of Chloride Cation Type
on the Corrosion of Steel in Concrete by Chloride Salts.” Cem. Concr. Res., vol. 15,
pp. 65-73.
Hansson, C.M., Sorenson, B. (1990). “The Threshold Concentration of Chloride in
Concrete for the Initiation of Corrosion.” Corrosion Rates of Steel in Concrete,
ASTM SP 1065, 99.3-16.
Hime, W., Erlin, B. (1987). “Some Chemical and Physical Aspects of Phenomena
Associated with Chloride-Induced Corrosion.” Corrosion, Concrete, and Chlorides,
ACI SP-102, pp 1-12, Ed. F.W. Gib-son.
Holden, W.R., Page, C.L., Short, N.R. (1983). “The Influence of Chlorides and Sulphates
on Durability.” Corrosion of Reinforcement in Concrete Construction, (ed. A.P.
Crane), Ellis, Horwood, Chichester, pp. 143-150.
Jerzy, Zemajtis, “Modeling the Time to Corrosion Initiation for Concretes with Mineral
Admixtures and/or Corrosion Inhibitors in Chloride-Laden Environments”,
Dissertation Paper, Virginia Polytechnic Institute and State University, January,
1998.
Justnes, H. (2001). “A Review of Chloride Binding in Cementitious Systems.” Cement and
Concrete, N-7034 Trondheim, Norway.
Khan, A.A., Cook, W.D., and Mitchell, D. (1998). “Thermal Properties and Transient
Thermal Analysis of Structural Members during Hydration.” ACI Materials
Journal. Volume 95. Number 3.
Khan, M. S. (1991). “Corrosion State of Reinforcing Steel in Concrete at Early Ages.” ACI
Materials J., vol. 88, No. 1, pp. 37-40.
Klieger, P., Lamond. J.F. (1994). “Significance of Tests and Properties of Concrete and
Concrete-Making Materials.” ASTM STP 169C.
Klieger, P. (1958). “Effects of Mixing and Curing Temperature on Concrete Strength.”
Journal of Amercian Concrete Institute. Volume 54. Number 12. 1063.
Larbi, L.A. (1993). “Microstructures of the Interfacial Zone around Aggregate Particles in
Concrete.” Heron, 38, No. 1, 69 pp.
Lewis, D. W. (1985). Discussion of “Admixtures for Concrete.” (ACI 212.1R-81),
Concrete International: Design and Construction, Vol. 27, No. 5, pp. 64-65.
0-2116 R2 61
Liu, Z., Beadoin, J.J. (2000). “The Permeability of Cement Systems to Chloride Ingress and
related Test Methods.” Cement, Concrete and Aggregates, CCAGDP, V.22, N0.1,
pp.16-23.
McGrath, P. (1996). “Development of Test Methods for Predicting Chloride Penetration
into High Performance Concrete.” Ph.D. Thesis, Department of Civil Engineering,
University of Toronto.
Mehta, P. K. (1993). Concrete Structure, Properties, and Materials. Prentice- Hall, Inc.,
Englewood Cliffs, N.J. 07632.
Mehta, P. K. (1984). Mineral Admixtures from Concrete Admixtures Handbook, Properties
Science and Technology, Ed. V. S. Ramachandran.
Midgley, H.G., Illston, J.M. (1984). “The Penetration of Chlorides into Hardened Cement
Pastes.” Cement and Concrete Research, Vol. 14, No. 4, pp. 546-558
Miki, F. (1990). “Predicting Corrosion-free Service Life of a Concrete Structure in a
Chloride Environment.” ACI Materials Journal (American Concrete Institute), v.
87, n. 6, pp. 581-587.
Miller, R., Krouskop, B., Minkarah, I., Bodocsi, A. (1993). “Chloride Penetration and the
Effect on Porosity in a Pavement.” Paper No. 930327, Transportation Research
Board, 72nd Annual Meeting.
Mindess, S., Young , J.F., and Darwin, D. (2002). Concrete. Second Edition. Prentice-
Hall. Englewood Cliffs, NJ.
Monteiro, P.J.M., Maso, J.C., Ollivier, J.P. (1985). “The Aggregate Mortar Interface.”
Cement and Concrete Research, 15, No.6, pp. 963-8.
Nassif, H., and Suksawang, N. (2002). “Effect of Curing Methods on Durability of High-
Performance Concrete.” Transportation Research Record. No. 1798.
Neville, A.M. (1996). Properties of Concrete. Fourth Edition, Wiley & Sons.
Nielsen, A. (1985). Durability, Beton Bogen, Aalborg Cement Company, Aalborg,
Portland, pp. 200-243.
Nielsen, L.F. (1993). “Strength Development in Hardened Cement Paste: Examination of
some Empirical Equations.” Materials and Structures, 26, No.159, pp. 225-60.
Nurse, R.W., (1949). “Steam Curing of Concrete.” Magazine of Concrete Research.
Volume 1. Number 2.
0-2116 R2 62
Owens, P.L. (1985). “Effect of Temperature Rise and Fall on the Strength and
Permeability of Concrete Made With and Without Fly Ash.” Temperature Effects
on Concrete, ASTM STP 858. T.R. Naik, Ed. American Society for Testing and
Materials, Philadelphia. 134-149.
Ozyildirim, C. (1994). “Rapid Chloride Permeability Testing of Silica-Fume Concrete.”
Cement, Concrete and Aggregates, CCAGPD, Vol. 16, No. 1, pp. 53-56.
Ozyildirim, C., Halstead, W. (1988). “Resistance to Chloride Ion Permeability of Concrete
Containing Fly Ash, Silica Fume, or Slag.” Permeability of Concrete, SP-108,
American Concrete Institute, pp.35-61.
Ozyildirim, C., Halstead, W.J. (1988). “Use of Admixtures to attain Low Permeability
Concrete.” Final Report No. FHWA/VA-88-R11, Virginia Transportation Research
Council.
Page, C. L. (1979). The Corrosion of Reinforcing Steel in Concrete: Its Cause and Control.
Bulletin, 77, Institution of Corrosion Science and Technology, UK.
Parrott, L. J. (1987). “A Review of Carbonation in Reinforced Concrete.” BRE/C&CA
Report C/1-0987, July, 369 pages.
PCA. (1998). Design and Control of Concrete Mixtures. 13th
Edition. Skokie, IL.
PCA. (1997). “Portland cement, Concrete, and the Heat of Hydration.” Concrete
Technology Today. Volume 18. Number 2. Skokie, IL.
Pfeifer, D.W., MacDonald, D.B, Krauss, P.D. (1994). “The Rapid Chloride Permeability
Test and its Correlation to the 90 Day Chloride Ponding Test.” PCI Journal, Vol. 39,
No. 1, pp. 38-47.
Phelan, S., and Senadheera, S. (2001). “Effects of Wet Mat Curing and Earlier Loading on
Long-Term Durability of Bridge Decks: Survey Results.” Research Report 2116-1.
Center for Multidisciplinary Research in Transportation, Texas Tech University.
Lubbock, TX.
Pourbaix, M. (1976). Atlas of Electrochemical Equilibrium in Aqueous Solutions.
Pergamon, London.
Rasheeduzafar, Dakhil, F.D., Bader, M.A., Khan, M.M. (1992). “Performance of Corrosion
Resisting Steels in Chloride Bearing Concrete.” ACI Materials Journal, Vol. 89,
No. 5, pp. 439-448
0-2116 R2 63
Rastrup, E., (1956). “The Temperature Function for Heat of Hydration in Concrete.”
Proceedings of the RILEM Symposim: Winter Concreting, Theory and Practice.
Session BII. Danish Institute for Building Research, Copenhagen.
Roy, D.M., Malek. R., Licastro, P. (1987). “Chloride Permeability of Fly Ash-Cement
Pastes and Mortars.” Concrete Durability (Katharine and Bryant Mather
International Conference), SP-100, American Concrete Institute, Vol.2, pp.1459-
1475.
Sandberg, P., Larsson, J. (1993). “Chloride Binding in Cement Pastes in Equilibrium with
Synthetic Pore Solutions.” Chloride Penetration into Concrete Structures, Nordic
Miniseminar, Gotenberg, pp. 98-107.
Sato, N.M., Agopyan, V. (2001). “Influence of Porosity on Water and Chloride Ion
Transport through Concrete.” Proceeding Third International Conference on
Concrete under Severe Conditions, Canada, pp. 412-419.
Saul, A.G.A. (1951). “Principles Underlying the Steam Curing of Concrete at
Atmospheric Pressure.” Magazine Concrete Research. Volume 2. Number 6.
Shehata, M.H., Thomas, M.D.A., Bleszynski, R.F. (1999). “The Effects of Fly Ash
Composition on the Chemistry of Pore Solution in Hydrated Cement Pastes.”
Cement and Concrete Research, Vol. 29, No. 12.
Shi, C. (1996). “Strength, Pore Structure and Permeability of High Performance Alkali-
Activated Slag Mortars.” Cement and Concrete Research, Vol.26, No.12, pp.1789-
1800.
Shi, C., Stegemann, J., Caldwell, R. (1998). “Effect of Supplementary Cementing Materials
on the Specific Conductivity of Pore Solution and Its Implications on the Rapid
Chloride Permeability Test Results.” (AASHTO T277 and ASTM C 1202) pp. 389-
394.
Shiessl, P. (1988). Cracking of Concrete and Durability of Concrete Structures. AFREM-
CCE. St Remy les Chevreuses, France.
Smith, B. G. (2001). “Durability of Silica Fume Concrete Exposed to Chloride in Hot
Climate.” Journals of Materials in Civil Engineering, January/February, 2001, pp
41-48.
Soroka, I., and Baum, H. (1994). “Influence of Specimen Size on Effect of Curing
0-2116 R2 64
Regime on Concrete Compressive Strength.” Journal of Materials in Civil
Engineering. Vol. 6. No. 1. 15.
Stanish, K.D., Hooton, R.D., and Thomas, M.D.A. (1997). “Testing the Chloride
Penetration Resistance of Concrete: A Literature Review.” Prediction of Chloride
Penetration in Concrete. FHWA Contract DTFH61-97-R-00022.
Tang, L., Nilsson, L.O. (1992). “Chloride Diffusivity in High Strength Concrete.” Nordic
Concrete Research, Vol. 11, pp. 162-170.
Thomas, M.D.A., Pantazopoulou, S.J., Martin-Perez, B. (1995). “Service Life Modeling of
Reinforced Concrete Structures Exposed to Chlorides-A Literature Review.”
Prepared for the Ministry of Transportation, Ontario, at the University of Toronto.
TxDOT (1993). Standard Specifications for Construction of Highways, Streets and Bridges.
Texas Department of Transportation, Austin, TX.
TxDOT (1998). Special Provisions to Item 420 Concrete Structures. Texas Department of
Transportation, Austin, TX.
TxDOT. (2000). “Obtaining and Testing Drilled Cores of Concrete.” Tex – 424 – A.
Manual of Testing Procedures. Texas Department of Transportation, Austin, TX.
TxDOT (2004). Standard Specification for Construction of Highways, Streets and
Bridges. Texas Department of Transportation, Austin, TX.
Topcu, I.B., and Toprak, M.U. (2005). “Fine Aggregate and Curing Temperature Effect on
Concrete Maturity.” Cement and Concrete Research. Volume 35. Number 4.
311.
Uhlig, H.H. (1948). The Corrosion Handbook. Wiley, New York.
Venuat, M. (1977). “Relationship between Concrete Carbonation and the Corrosion of
Reinforcement.” Recentres CEFRA COR-77, JTBTP.
Wee, T.H., Suryavanshi, A.K., Tin, S.S. (2000). “Evaluation of Rapid Chloride
Permeability Test (RCPT) Results for Concrete Containing Mineral Admixtures.”
ACI Material Journal, V97, No.2, pp.221-236.
West, R. E., Hime, W. G. (1985). “Chloride Profiles in Salty Concrete.” National
Association of Corrosion Engineers, pp. 29 - 38.
Whiting, D. (1981). Rapid Determination of the Chloride Permeability of Concrete.
Final Report No. FHWA/RD-81/119. Federal Highway Administration.
0-2116 R2 65
Whiting, D. (1988). “Permeability of selected structures.” Permeability of Concrete, ACI
SP-108, American Concrete Institute, Detroit, Michigan, pp.195-222.
Whiting, D., Dzeidzic, W. (1989). “Resistance to Chloride Infiltration of Superplasticizers
Concrete as Compared with Currently Used Concrete Overlays Systems.” Final
Report No. FHWA/OH-89/009, Construction Technology Laboratories.
Whiting, D. Mitchell, T.M. (1992). “A History of the Rapid Chloride Permeability Test.”
Transportation Research Record 1335, Washington, D.C.
Wojcik, G.S., and Fitzjarrald, D.R. (2001). “Energy Balances of Curing Concrete Bridge
Decks.” Journal of Applied Meteorology.
Young, J.F., Mindess, S., Gray, R.J., Bentur, A. (1998). The Science and Technology of
Civil Engineering Materials. Prentice Hall.


Effect of Wet-Mat Curing Time and Earlier Loading on Long-Term Durability of Bridge Decks: Literature Review
By Sanjaya Senadheera, Randal Scott Phelan, Hector Garcia-Monzon, Aruna Amarasiri, Montasheema Afroze, Hari Aamidala, Sang-Yun Lee, Hassan Ghanem
Performed in Cooperation with the Texas Department of Transportation and the Federal Higway Administration
Research Project 0-2116 Research Report 0-2116-2 http://www.techmrt.ttu.edu/reports.php
Texas Tech University | Lubbock, Texas 79409P 806.742.3503 | F 806.742.4168