Embed Size (px)
Citation preview
80
J.Agric.&Env.Sci.Dam.Univ.,Egypt Vol.11 (2) 2012
EFFECT OF WATER QUALITY AND DEFICIT
IRRIGATION ON TOMATO GROWTH, YIELD AND
WATER USE EFFICIENCY AT DIFFERENT
DEVELOPMENTAL STAGES
MAHMOUD A. WAHB-ALLAH
1,2*AND ABDULRASOUL M. AL-OMRAN
3
1Department of Vegetable Crops, Faculty of Agriculture, Alexandria University, Egypt. 2Department of Plant Production, 3Department of Soil Science, College of Food and Agricultural
Sciences, King Saud University, P.O. BOX 2460, Riyadh 11451, Saudi.
*Corresponding author E-mail [email protected]
ABSTRACT
A major problem affect agriculture worldwide is a lack
of adequate water resources. Deficit irrigation is an
optimization strategy that allows to some extent of water stress
during a certain cropping stage or the whole season without a
significant reduction in yield. A greenhouse experiment was
conducted during the growing seasons of 2009/2010 and
2010/2011 to study the effect of water quality and deficit
irrigation on growth, yield and water use efficiency of tomato
(Solanum lycopersicon L.) cv. Red Gold at different growth
stages. Two different water qualities; saline and non-saline
water with electrical conductivities (EC) 3.6 and 0.9 dS m-1
,
respectively and nine irrigation deficit treatments; three fixed
irrigation regimes through the whole crop cycle at 100, 75 and
50% of the maximum crop evapotranspiration (ETc), irrigation
deficit at 75% of ETc during vegetative, reproductive or
fruiting stage and irrigation deficit at 50% of ETc during the
aforementioned three growth stages; were used. The
experimental layout was split-plot system in a randomized
complete block design. The results showed that, irrigation with
saline water reflected negative significant effects on tomato
fruits yield and water use efficiency (WUE). The reductions in
tomato fruits yield were 22% and 24% in the first and second

81
J.Agric.&Env.Sci.Dam.Univ.,Egypt Vol.11 (2) 2012
season, respectively. The negative effect of deficit irrigation (DI)
was more obvious when coupled with salt stress. Fruiting and
vegetative growth stages were the most tolerant to deficit
irrigation whereas, the reproductive stage was the most
sensitive one. The crop response factor (Ky) values ranged
between 0.24 and 0.75. Irrigation with non saline water at 75%
ETc through the fruiting or vegetative growth stage did not
significantly reduce the growth and fruits yield but, enhanced
WUE , increased vitamin C and total soluble solids (T.S.S)
content and saved 10 % of water irrigation.Therefore, this
treatment could be recommended for tomato production under
greenhouse conditions. To save approximately 21% of
irrigation water, a deficit irrigation rate of 50% ETc could be
used during the fruiting stage with non-saline water, but the
total yield was reduced by 8.6%.
Keywords: Solanum lycopersicon L., water quality, water saving, salt stress,
fruit quality, crop response factor.
INTRODUCTION
The sustainable use of water in agriculture has become a major
concern. The adoption of strategies for saving irrigation water and
maintaining acceptable yields may contribute to the preservation of this
ever more restricted resource (Topcu et al., 2007). In areas of water
shortage and long summer droughts, maximizing water productivity may
be more beneficial to the farmer than maximizing crop yield. A recent
innovative approach to save agricultural water is conventional deficit
irrigation (DI). It is a water-saving strategy under which crops are
exposed to a certain level of water stress either during a particular
developmental stage or throughout the whole growing season (Pereira et
al., 2002). The expectation is that any yield reduction will be insignificant
compared with the benefits that are gained from the conservation of
water.
82
J.Agric.&Env.Sci.Dam.Univ.,Egypt Vol.11 (2) 2012
The goal of deficit irrigation is to increase crop water use
efficiency (WUE) by reducing the amount of water that is applied or by
reducing the number of irrigation events (Kirda, 2002). The DI process
irrigates the root zone with less water than that required for
evapotranspiration and makes use of suitable irrigation schedules, which
are usually derived from field trials (Oweis and Hachum, 2001). Crop
tolerance to DI during the growing season changes with the phenological
stage (Istanbulluoglu, 2009). Optimal irrigation schedules are often based
on water productivity (Oweis and Zhang, 1998). DI strategies have the
potential to optimize horticultural water productivity. Nevertheless, the
effects of deficit irrigation on yield or harvest quality are crop specific
(Costa et al., 2007). Information on how different crops cope with mild
water deficits forms the basis for a successful application of deficit
irrigation.
Irrigation water quality can affect soil fertility and irrigation
system performance as well as crop yield and soil physical conditions
(Al-omran et al., 2010) . Therefore, knowledge of irrigation water quality
is critical in understanding the management changes that are necessary for
long-term productivity. Plant responses to salt stress depend on several
interacting variables including the cultural environment, plant
developmental stage and salinity level during the growth period (Munns,
2002). Most horticultural production areas are located in hot and dry
climates because of their favourable weather conditions (high light, high
temperature). However, the soil water deficit is rather frequent in these
areas. Water-saving irrigation strategies such as DI may allow for the
optimization of water productivity in these places by stabilizing yields
and improving product quality (Costa et al., 2007).
Tomato (Solanum lycopersicon L.) is one of the most important
vegetable crops and is one of the most demanding in terms of water use
(Peet, 2005). The application of DI strategies to this crop may
significantly led to save irrigation water (Costa et al., 2007). Furthermore,
studies have shown that water deficit occurs during certain stages of the
growing season improves fruit quality, although water limitations may
determine fruit yield losses (Patane and Cosentino, 2010). According to
83
J.Agric.&Env.Sci.Dam.Univ.,Egypt Vol.11 (2) 2012
Patane et al. (2011), the adoption of DI strategies in which a 50%
reduction in ETc was applied for the whole or partial growing season to
save water helped to minimize fruit losses and maintain high fruit quality.
Pulupol et al. (1996) observed a significant reduction in dry mass yield
for a glasshouse tomato cultivar using deficit irrigation, while Zegbe-
Domínguez et al. (2006) did not find a reduction in tomato fruits yield of
field-grown processing cultivar. Although, the effects of DI on tomato
fruits yield may be different, many investigators such as Kirda et al.(
2004 ) and Topcu et al.( 2006) have demonstrated that DI saves
substantial amounts of irrigation water and increases WUE.
Tomato is classified as moderately tolerant crop to salinity at all
plant developmental stages (Lim and Ogata, 2005). For maximum yield,
the electrical conductivity (EC) of soil extracted from the root zone and in
the irrigation water should not exceed 2.5 dS m-1
(Mass,1986). Higher
salinity levels (12 dS m-1
) caused a significant reduction in total fruits
yield (49.7%) in comparison with the control (1.2 dS m-1
), while a
moderate level (2.4 dS m-1
) had no significant effect in this concern
(Alsadon et al., 2009). According to Olympios et al. (2003), increasing
EC of irrigation water from 1.5 to 3.2 dS m-1
did not affect the vegetative
growth, but the yield was 45% less. A better understanding of the
relationships among water quality, soil water deficit, fruit yield and
quality traits could be better for growers to control irrigation water
management.
In arid regions such as Riyadh (Saudi Arabia), water scarcity is an
increasing concern and water costs are rising. These challenges have
forced farmers to use low-quality water, and thus deficit irrigation
strategies are quite important in these environments. Therefore, two
identical greenhouse experiments, during the seasons of 2009/ 2010 and
2010/2011, were conducted to assess the main and interaction effects of
water quality and deficit irrigation program at different stages of plant
growth on tomato fruits yield, fruits quality and water use efficiency.

84
J.Agric.&Env.Sci.Dam.Univ.,Egypt Vol.11 (2) 2012
MATERIALS AND METHODS
1.Experimental site and plant materials
Two greenhouse experiments were conducted in 2009/2010 and
2010/2011 seasons at the Agricultural Research and Experimental
Station, Faculty of Food and Agricultural Sciences, King Saud
University, 35 km southwest of Riyadh, Saudi Arabia (24o 39
-N, 46
o 44
-
E). Before starting the experiment for each season, a composite soil
sample was taken from surface and subsurface layers from the study area
for analysis. Some physical and chemical characteristics of the
experimental soil site are presented in Table 1.
Table 1. Some physical and chemical characteristics of the upper
soil layer (0-50cm) of the experimental soil site in
2009/2010 and 2010/011 seasons. Parameters 2009/2010 2010/2011
Sand (%)
Silt (%)
Clay (%)
Organic matter content (%)
CaCO3 ( %)
Saturation water content (%w/w)
Field capacity (%w/w)
Permanent wilting point (%w/w)
Plant available water (%w/w)
pH
Electrical conductivity (dS m-1
)
Ca2+
(me L-1
)
Mg2+
(me L-1
)
Na+
(me L-1
)
K+ (me L
-1)
CO3-2
(me L-1
)
HCO3- (me L
-1)
Cl- (me L
-1)
SO4-2
(me L-1
)
88
4
8
0.14
27
29.0
17.2
5.5
10.5
7.9
2.2
11.5
5.8
6.8
1.9
Tr.
3.0
8.0
11.2
88
4
8
0.12
28
30
17.5
5.6
10.7
8.4
2.37
9.5
5.21
8.22
1.98
Tr.
3.1
8.5
7.5
Seeds of commercial greenhouse tomato (Solanum lycopersicon
L.) cv. Red Gold were sown in seedling trays on August 14 and 16 in
2009 and 2010,respectively. The seeds were grown in fibreglass

85
J.Agric.&Env.Sci.Dam.Univ.,Egypt Vol.11 (2) 2012
greenhouse under controlled conditions at temperatures of 25 ± 1ºC/ day
and 20 ± 1ºC/ night. After four weeks of seed sowing, seedlings of
uniform size having five true leaves were transplanted into rows of 8m
length and 1m width . The distance between plants was 40 cm. The air
temperature in the greenhouse was set at 25 ± 2°C during the day and 29
± 2ºC throughout the night with a relative humidity of 74 ± 2% through
the entire growing seasons. Fertilization and other cultural practices were
applied as commonly recommended in commercial tomato production
(Maynard and Hochmuth, 2007).
2. Irrigation treatments
Each experiment included 18 treatments represent all
combinations of two sources of irrigation water quality and nine treatments of deficit irrigation. The two sources for irrigation water
quality were; saline water with average electrical conductivity (EC) of 3.6
dS m-1
that was obtained from an existing local well and non-saline water
with an EC of 0.9 dS m-1
that was gained from the same well and purified
in a water desalination station. The chemical properties of the two water
sources used in irrigation are listed in Table 2. The nine deficit irrigation
treatments of maximum evapotranspirition (ETc) are listed in Table 3.
The growing season of tomato was divided into three growth stages;
vegetative stage; started from the beginning of transplanting till the beginning of flowering, reproductive stage; started from the beginning of
flowering till the formation of first full-sized green fruit and fruiting
stage; started from the development and ripening of fruits till the
termination of the experiment.

86
J.Agric.&Env.Sci.Dam.Univ.,Egypt Vol.11 (2) 2012
Table 2. Chemical analysis of the two sources of irrigation water in
2009/2010 and 2010/011 seasons. Parameters Saline water Non-saline water
2009/2010 2010/2011 2009/2010 2010/2011
pH
EC (dS m-1
)
Ca++
(me L-1
)
Mg++
(me L-1
)
Na+ (me L
-1)
K+ (me L
-1)
CO3-- (me L
-1)
HCO3- (me L
-1)
Cl- (me L
-1)
SO4--
(me L-1
)
No3- (ppm)
B (ppm)
SAR
7.50
3.40
12.50
10.50
16.50
0.60
Tr.
4.30
14.50
5.90
12.40
2.11
5.80
7.45
3.75
17.31
11.95
18.96
0.51
Tr.
4.00
16.40
8.4
14.3
2.27
5.60
6.40
0.90
2.50
1.20
7.10
0.20
Tr.
1.10
5.10
2.90
7.20
1.51
7.50
6.05
0.86
2.30
1.36
7.00
0.17
Tr.
1.00
4.80
4.40
8.28
1.73
7.70
Table 3. Deficit irrigation treatments for each source of water Treatment Description
T1 irrigation at100% of ETc during the different growth stages (100%).
T2 irrigation at 75% of ETc during the vegetative growth stage, then
irrigation at 100% of ETc for the remainder growth stages. (75%
S1).
T3 irrigation at 75% of ETc at during the reproductive growth stage,
then irrigation at 100% of ETc for the remainder growth stages (75%
S2).
T4 irrigation at 75% of ETc during the fruiting growth stage, then
irrigation at 100% of ETc for the remainder growth stages. (75%
S3).
T5 irrigation at 75% of ETc during the different growth stages. (75%).
T6 irrigation at 50% of ETc during the vegetative growth stage, then
irrigation at 100% of ETc for the remainder growth stages (50% S1).
T7 irrigation at 50% of ETc during the reproductive growth stage, then
irrigation at 100% of ETc for the remainder growth stages. (50%
S2).
T8 irrigation at 50 % of ETc during the fruiting growth stage, then
irrigation at 100% of ETc for the remainder growth stages. (50% S3)
T9 irrigation at 50 % of ETc during the different growth stages. (50%)

87
J.Agric.&Env.Sci.Dam.Univ.,Egypt Vol.11 (2) 2012
Irrigation scheduling methods were based on pan evaporations,
which are available and easy to use in the greenhouse (Harmanto et
al.,2004).Crop evapotranspiration (ETc) was calculated using the
following equation:
ETc = Eo Kp Kc (1)
Where:
ETc = maximum daily crop evapotranspirition in mm.
Eo = evaporation from a class A pan in mm.
Kp = pan coefficient with ranges between 0.7 and 0.9.
Kc = crop coefficient with ranges between 0.4 and 1.2 depending on
growth stage.
The Kp and Kc were calculated according to the equations of Allen et al.
(1998).
The gross water requirement (GWR) was calculated with the following
equation
GWR= ETc/ (1-LR) Effirr (Cuenca, 1989) (2)
Where:
GWR= gross water requirement ( mm/day).
Effirr = irrigation efficiency.
LR = Leaching requirement ( %)
Water use efficiency (WUE) was used to evaluate the comparative
benefits of the different irrigation treatments. It was calculated as the ratio
between total epigeous dry matter at harvest and total water used
measured by balance. Total yield water use efficiency (TYWUE) was
also calculated from the fresh total fruits yield and total water use (Lovelli
et al., 2007).
WUE = Total biomass yield/Total water applied (3)
TYWUE = Total fresh yield/ Total water applied (4)
The relationship between the evapotranspiration deficit (1 –
(ETa/ETc)) and yield depression (1 – (Ya/Ym)) is always linear
(Doorenbos and Kassam, 1986) with a slope called the yield response
factor for the crop or crop response factor (Ky) (Kirda et al., 2004). The
Ky is the yield response factor that is defined as the decrease in yield per

88
J.Agric.&Env.Sci.Dam.Univ.,Egypt Vol.11 (2) 2012
unit decrease in ET (Singh et al., 2010). This relationship is expressed by
the following equation:
(1- Ya/Ym) = Ky (1- ETa/ETm) (5)
where Ym (kg ha−1
) and Ya (kg ha−1
) are the maximum (from a fully
irrigated treatment) and actual yields, respectively. The ETm (m3 ha
−1)
and ETa (m3 ha
−1) are the maximum (from a fully irrigated treatment) and
actual evapotranspiration, respectively, while Ky is the yield response
factor.
3. Experimental design
The experimental layout was a split-plot system in a randomised
complete block design with three replications. Water sources and deficit
irrigation treatments were randomly allocated to the main and sub-plots,
respectively. The sub-plot area was 8 m2 including 20 plants. A total of
1080 plants were used in each experiment.
A drip irrigation network was designed for this study. The
experimental area was divided into three equal parts, represent three
replicates, with a buffer strip of 3 m. Each replicate was divided into two
equal main plots with a buffer strip of 2 m. Each main plot, represents a
source of water, contained nine rows (sub plot area) that were connected
through a valve. Each row in the main plots represents a level of deficit
irrigation treatment.
4. Data Recorded
At harvest, three representative plant samples were randomly
chosen from each sub-plot and separated into stems , leaves and fruits.
The plant parts were dried at 70oC in a forced-air oven until the weight
became constant and the total dry biomass ha-1 was calculated.
Afterwards, the total tomato fruits weight through the entire harvesting
period ,for each experimental unit, was recorded and converted into total
tomato fruits yield ha-1.
Average fruit weight was calculated by dividing
the total weight of all harvested fruits from each sub-plot across the whole
season by their number.
A random samples of fruits (approximately 2 kg from the first and
second trusses) were taken from each experimental unit at the peak of
harvesting (the fourth picking) for laboratory analyses. The homogenised
89
J.Agric.&Env.Sci.Dam.Univ.,Egypt Vol.11 (2) 2012
fruits juice was subjected to the following determinations; total soluble
solids (T.S.S, °Brix) using a portable refractometer , vitamin C content
using the pigment of 2,6-dichlorophenol-indophenol while, acidity (pH)
was measured with a glass electrode pH meter (A.O.A.C., 1990)
2.5. Statistical analysis
Data on the dry biomass, total fruits yield and quality traits were
statistically analysed using Statistical Analysis System (SAS) version 8.1
(SAS Institute, 2008). An analysis of variance was conducted separately
within each year. Differences among the means were evaluated for
significance using a Revised Least Significant Difference (L.S.D.) test at
0.05 level, as described by Snedecor and Cochran (1989).
RESULTS AND DISCUSSION
1. Total biomass and total fruits yield
The impact of water quality and deficit irrigation treatments on
total dry biomass and total tomato fruit yield, in 2009/2010 and
2010/2011 seasons, are presented in Table 4. Irrigation with saline water
significantly reduced total dry biomass and total fruits yield compared to
irrigation with non saline water , in both seasons. The reduction in total biomass and total fruits yield were approximately 31% and 21%,
respectively. Similar results were reported by Al-harbi et al. ( 2009 ).
They mentioned that, irrigation with saline water having EC 4.7 dS m-1
significantly reduced the total fruits yield by 24.3%. Cuartero and
Fernandez-Munnza (1999) suggested that, even under normal growing
conditions, the EC of root solution is close to the threshold value for yield
reduction. Similarly, Maggio et al. (2007) reported that there was an
approximately 6% reduction in plant dry mass per one dS m-1
increase
until approximately 9 dS m-1
, whereas only 1.4% decrease in yield per dS
m-1
after 9 dS m-1
.

90
J.Agric.&Env.Sci.Dam.Univ.,Egypt Vol.11 (2) 2012
Table 4. total biomass and total fruits yield of tomato as affected by
water quality and deficit irrigation, in 2009/2010 and
2010/011 seasons. Water
quality
Deficit
irrigation
treatment
Total biomass
(ton ha-1
DW)
Total fruits yield
(ton ha-1
FW)
2009/2010 2010/2011 2009/2010 2010/2011
Non-saline water 14.274 a 14.353 a 114.347 a 115.04
Saline water 9.839 b 9.926 b 90.301 b 90.68 b
T1 (100%) 11.583 cd 11.795 cd 112.460 a 113.422 a
T2 (75% S1) 12.140 ab 11.951 bc 109.872 b 110.661 ab
T3 (75% S2) 11.289 d 11.422 d 106.508 c 107.255 c
T4 (75% S3) 12.582 a 12.427 ab 110.862 ab 110.470 ab
T5 (75%) 11.620 cd 11.754 d 95.641 f 96.350 f
T6 (50% S1) 12.338 ab 12.564 a 99.106 de 99.715 de
T7 (50% S2) 12.023 bc 12.207 abc 96.962 ef 97.270 ef
T8 (50% S3) 12.177 ab 12.217 abc 101.904 d 102.670 d
T9 (50%) 11.913 bc 12.089 abc 87.602 g 87.922 g * Values followed by the same letter(s), within a comparable group of means, do not significantly
differ using revised L.S.D test at 0.05 probability level.
The total dry biomass accumulation was significantly increased
using deficit irrigation treatments T2, T4, T6 and T8, in 2009/2010 and
only T4 and T6, in 2010/2011 (Table 4). However, no significant
differences were observed among the remainder of DI treatments. The
lowest biomass value was observed using T3, in both seasons, while the
highest value was observed with T4 followed by T6, in the first season and
T6 followed by T4, in the second season. These results illustrated that
deficit irrigation treatments(T2 and T6) during the vegetative growth stage
or (T4 and T8) during the fruiting growth stage significantly increased the
total dry biomass; however, deficit irrigation treatments (T3 and T7)
during the reproductive growth stage or during the whole season (T5 and
T9) did not induce significant changes in the final dry biomass, in both
seasons. Generally, a similar DI effect was reported by Patane et al.
(2011). They mentioned that the DI at a 50% ETc did not induce any
losses in tomato total dry biomass when starting from the initial stages or
from flowering and onwards.

91
J.Agric.&Env.Sci.Dam.Univ.,Egypt Vol.11 (2) 2012
Under all DI treatments, the total fruits yield was significantly
decreased, except when T4 treatment was utilized in the 1st season and
both T2 and T4 treatments were used in the 2nd
season (Table 4). When the
amount of irrigation water was reduced from 100 to 75% ETc during the vegetative (T2) or fruiting (T4) stage, there was insignificant reduction in
total fruits yield. As compared to the control treatment (T1), the reduction
in yield was only 1.6 ton ha-1
(1.4%) and 2.9 ton ha-1
(2.6%) when the
treatment T4 was conducted in the first and second seasons, and 2.6 ton
ha-1
(2.3%) and 2.7 ton ha-1
(2.4%) when T2 was achieved in the first and
second seasons, respectively. Deficit irrigation during the reproductive
stage at T3 and T7 significantly reduced the total fruits yield by
approximately 5.4% and 14% in comparison with the control T1 , as an
average of the two experimental seasons, respectively. However, Deficit
irrigation during all growth stages at T5 and T9 was negatively
pronounced and significantly produced lower total fruits yield than the
control T1 nearly by 15% and 22%, as an average of the two experimental
seasons, respectively. These results indicated that the most tolerant
growth phases to deficit irrigation were fruiting and vegetative growth
stages and the most sensitive one was reproductive stage. These findings
are in line with the results of Srinivasa et al. (2000) who showed that the
reproductive tomato growth stage is more sensitive phenological stage to
water deficit than vegetative growth stage. According to Savic et al.
(2011) they reported that, the phenological stages of tomato may react
differently to deficit irrigation and scheduling irrigation should take into
account the stages in which the crop is particularly sensitive to water
deficits.
The interaction effects of water quality and deficit irrigation
significantly affected both the total dry biomass and total fruits yield, in
the two growing seasons (Table 5). The obtained results illustrated that
when the two types of stresses; saline and deficit irrigation were coupled
together, a serious reduction occurred on total dry biomass and total fruits
yield. The highest value of total dry biomass was recorded when deficit
irrigation at 75% of Etc (T4), through fruiting stage, combined with non-
saline water, during the two growing seasons. The lowest value of total

92
J.Agric.&Env.Sci.Dam.Univ.,Egypt Vol.11 (2) 2012
biomass gained when irrigation at 100% of Etc (T1), through all growth
stages, combined with saline water, during both seasons. The highest
value of total fruits yield was obtained when the irrigation was performed at 100% of Etc (T1) at all growth stages combined with non saline water,
in both seasons. While, the lowest magnitude of total fruits yield was
recorded when the irrigation through all growth stages was achieved with
non saline water at 50% of Etc (T9) , in both seasons.
Table 5. Total biomass and total fruits yield of tomato as affected by
the interaction of water quality and deficit irrigation, in
2009/2010 and 2010/011 seasons. Water
quality
Deficit
irrigation
treatment
Total biomass
(ton ha.-1
DW)
Total fruits yield
(ton ha.-1
FW)
2009/2010 2010/2011 2009/2010 2010/2011
Non-saline
water
T1 (100%) 14.328 bcd 14.354 c 124.597 a 125.920 a
T2 (75% S1) 14.137 bcd 13.862 d 121.872 b 122.673 ab
T3 (75% S2) 13.256 e 13.237 e 118.366 c 119.260 c
T4 (75% S3) 14.878 a 15.081 a 122.966 ab 123.620 ab
T5 (75%) 13.956 d 13.941 d 108.189 f 108.920 ef
T6 (50% S1) 14.483 abc 14.789 ab 110.563 e 111.200 e
T7 (50% S2) 14.655 ab 14.745 abc 108.560 ef 108.420 f
T8 (50% S3) 14.464 bc 14.735 abc 113.893 d 115.120 d
T9 (50%) 14.316 bcd 14.431 bc 100.116 g 100.220 g
Saline
water
T1 (100%) 9.129 j 9.486 i 100.323 g 100.925 g
T2 (75% S1) 10.276 fg 10.160 fg 97.872 h 98.650 gh
T3 (75% S2) 9.465 ij 9.715 hi 94.650 i 95.250 i
T4 (75% S3) 10.468 f 10.023 g 98.758 gh 97.320 hi
T5 (75%) 9.472 ij 9.718 ghi 83.092 m 83.780 l
T6 (50% S1) 10.343 fg 10.499 f 87.650 k 88.230 jk
T7 (50% S2) 9.646 hi 9.903 gh 85.364 l 86.120 k
T8 (50% S3) 10.070 gh 9.924 gh 89.914 j 90.220 j
T9 (50%) 9.686 hi 9.906 gh 75.088 n 75.625 m
* Values followed by the same letter(s), within a comparable group of means, do not significantly
differ using revised L.S.D test at 0.05 probability level.
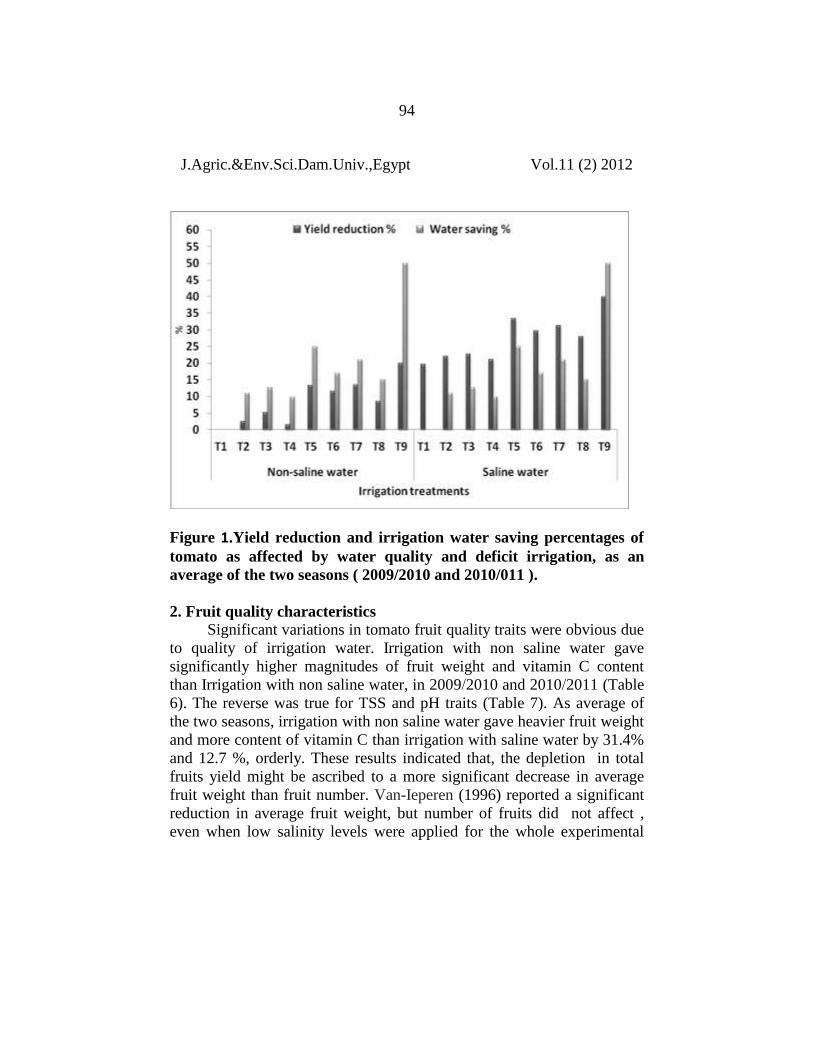
The effects of water quality and deficit irrigation through variant
growth stages on reduction of fruits yield and saving of irrigation water,
in 2009/2010 and 2010/2011, are summarised in Figure 1. As an average

93
J.Agric.&Env.Sci.Dam.Univ.,Egypt Vol.11 (2) 2012
of the two seasons, irrigation with non saline water during vegetative or
fruiting stage at 75% of Etc i.e T2 and T4 resulted in a reduction of total
fruits yield by 2.6 and 1.6 %, but saved 10.9 and 9.8% of irrigation water,
consecutively. However, irrigation with non saline water during flowering
stage at 75% of Etc (T3) reduced total fruits yield by 5.2 %, but conserved
12.7% of irrigation water. Moreover, irrigation with non saline water
during fruit set stage at 50% of Etc (T8) reduced total fruits yield by
8.6%, but saved 15 % of irrigation water. Irrigation with saline water
throughout all growth stages at 50% of Etc (T9) attained the lowest total
fruits yield (20%) compared to the control treatment (T1) , however, T9
treatment saved 50%. of water irrigation.
However, when the crop was only exposed to salt stress (saline
water combined with T1 treatment), the yield reduction (19.6%) was
approximately equal with the results of a higher degree of water stress
using good quality water (T9), but without any savings in irrigation water.
Furthermore, the yield reduction was doubled (40%) when saline water
was combined with T9. These results indicated that salt stress had a more
adverse impact on tomato total yield than water stress at the different
developmental stages.
94
J.Agric.&Env.Sci.Dam.Univ.,Egypt Vol.11 (2) 2012
Figure 1.Yield reduction and irrigation water saving percentages of
tomato as affected by water quality and deficit irrigation, as an
average of the two seasons ( 2009/2010 and 2010/011 ).
2. Fruit quality characteristics
Significant variations in tomato fruit quality traits were obvious due
to quality of irrigation water. Irrigation with non saline water gave
significantly higher magnitudes of fruit weight and vitamin C content
than Irrigation with non saline water, in 2009/2010 and 2010/2011 (Table
6). The reverse was true for TSS and pH traits (Table 7). As average of
the two seasons, irrigation with non saline water gave heavier fruit weight
and more content of vitamin C than irrigation with saline water by 31.4%
and 12.7 %, orderly. These results indicated that, the depletion in total
fruits yield might be ascribed to a more significant decrease in average
fruit weight than fruit number. Van-Ieperen (1996) reported a significant
reduction in average fruit weight, but number of fruits did not affect ,
even when low salinity levels were applied for the whole experimental

95
J.Agric.&Env.Sci.Dam.Univ.,Egypt Vol.11 (2) 2012
period. Results of Favatil et al.( 2009) clarified that the larger the tomato
fruit, the lower was the vitamin C content. This association is mainly due
to the secondary osmotic stress induced by this a biotic stress. As average
of the two seasons, irrigation with saline water gave significantly higher
values of total soluble solids (T.S.S.) and acidity(PH) than irrigation with
non saline water by 11.1% and 6.9 %, orderly. The positive effect of
irrigation with saline water on T.S.S. content of fruits probably arised as a
result of reduction in water intake by the fruits (Sakamoto et al., 1999;
Tantawy, 2009 and Al-Yahyai ,2010). Moreover, Munns (2002) reported
that, under saline conditions an active accumulation of solutes, which
were mainly ions and organic molecules, occurred. The enhancing effect
of irrigation with saline water on acidity is in harmony with those of
Sanders et al. (1989) who reported a positive relationship between
salinity rate in irrigation water and acidity in tomato fruits.
Table 6. Fruit weight and vitamin C content of tomato as affected
by water quality and deficit irrigation, in 2009/2010 and
2010/011 seasons. Water
quality
Deficit
irrigation
treatment
Average fruit weight
(g)
vitamin C content
(mg/100g FW)
2009/2010 2010/2011 2009/2010 2010/2011
Non-saline water 111.7 a 113.1 a 32.4 a 32.3 a
Saline water 76.2 b 78.1 b 29.2 b 27.3 b
T1 (100%) 109.3 a 110.6 a 28.1 d 28.1 e
T2 (75% S1) 106.3 bc 107.3 b 29.0 d 28.9 e
T3 (75% S2) 104.7 c 104.7 b 29.5 cd 28.9 e
T4 (75% S3) 107.6 ab 108.1 ab 29.3 d 29.1 cde
T5 (75%) 91.8 d 97.2 c 32.8 ab 30.9 b
T6 (50% S1) 82.1 e 84.8 e 30.6 c 30.2 bc
T7 (50% S2) 79.1 f 79.1 f 32.1 b 30.1 bcd
T8 (50% S3) 91.9 d 94.2 d 31.8 b 29.8 bcd
T9 (50%) 72.9 g 74.1 g 33.8 a 32.4 a
* Values followed by the same letter(s), within a comparable group of means, do not significantly
differ using revised L.S.D test at 0.05 probability level.
96
J.Agric.&Env.Sci.Dam.Univ.,Egypt Vol.11 (2) 2012
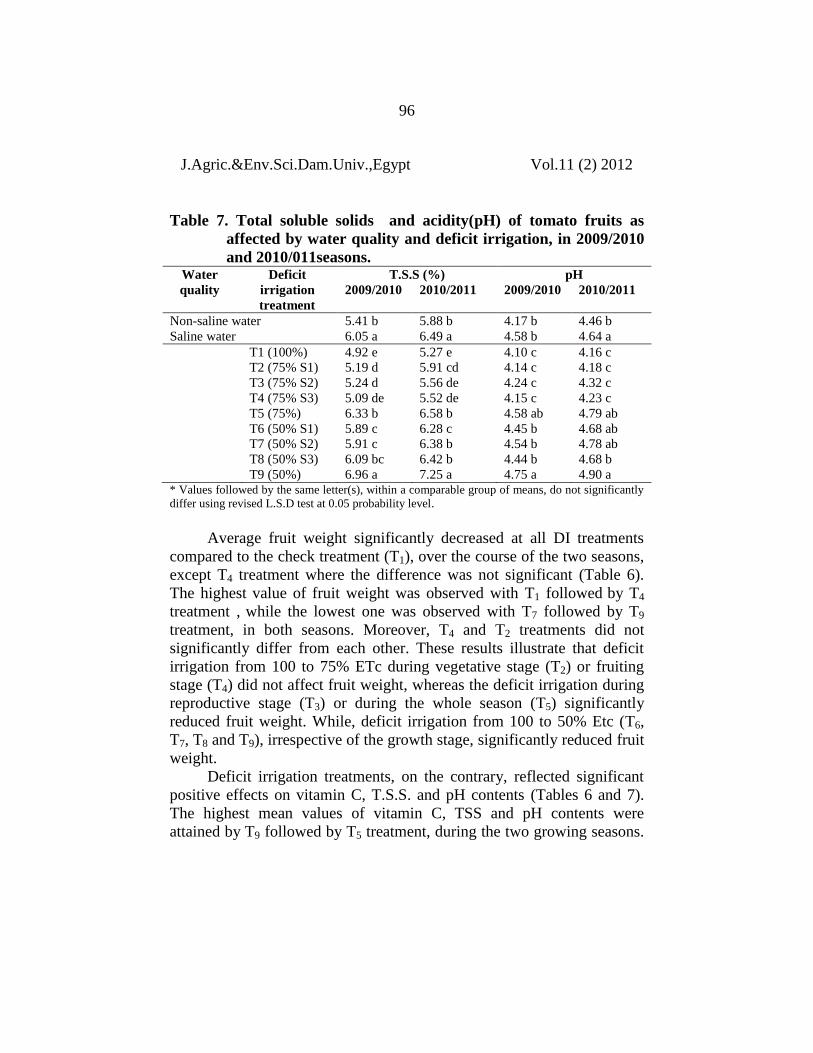
Table 7. Total soluble solids and acidity(pH) of tomato fruits as
affected by water quality and deficit irrigation, in 2009/2010
and 2010/011seasons. Water
quality
Deficit
irrigation
treatment
T.S.S (%) pH
2009/2010 2010/2011 2009/2010 2010/2011
Non-saline water 5.41 b 5.88 b 4.17 b 4.46 b
Saline water 6.05 a 6.49 a 4.58 b 4.64 a
T1 (100%) 4.92 e 5.27 e 4.10 c 4.16 c
T2 (75% S1) 5.19 d 5.91 cd 4.14 c 4.18 c
T3 (75% S2) 5.24 d 5.56 de 4.24 c 4.32 c
T4 (75% S3) 5.09 de 5.52 de 4.15 c 4.23 c
T5 (75%) 6.33 b 6.58 b 4.58 ab 4.79 ab
T6 (50% S1) 5.89 c 6.28 c 4.45 b 4.68 ab
T7 (50% S2) 5.91 c 6.38 b 4.54 b 4.78 ab
T8 (50% S3) 6.09 bc 6.42 b 4.44 b 4.68 b
T9 (50%) 6.96 a 7.25 a 4.75 a 4.90 a * Values followed by the same letter(s), within a comparable group of means, do not significantly
differ using revised L.S.D test at 0.05 probability level.
Average fruit weight significantly decreased at all DI treatments
compared to the check treatment (T1), over the course of the two seasons,
except T4 treatment where the difference was not significant (Table 6).
The highest value of fruit weight was observed with T1 followed by T4
treatment , while the lowest one was observed with T7 followed by T9
treatment, in both seasons. Moreover, T4 and T2 treatments did not
significantly differ from each other. These results illustrate that deficit
irrigation from 100 to 75% ETc during vegetative stage (T2) or fruiting stage (T4) did not affect fruit weight, whereas the deficit irrigation during
reproductive stage (T3) or during the whole season (T5) significantly
reduced fruit weight. While, deficit irrigation from 100 to 50% Etc (T6,
T7, T8 and T9), irrespective of the growth stage, significantly reduced fruit
weight.
Deficit irrigation treatments, on the contrary, reflected significant
positive effects on vitamin C, T.S.S. and pH contents (Tables 6 and 7).
The highest mean values of vitamin C, TSS and pH contents were
attained by T9 followed by T5 treatment, during the two growing seasons.

97
J.Agric.&Env.Sci.Dam.Univ.,Egypt Vol.11 (2) 2012
The enhancing effect of deficit irrigation on vitamin C content can be
explained on the basis that, tomato plants irrigated at 100% Etc produced
large canopy which probably results in suitable fruits cover and shading
relative to those exposed to moderate or severe water stress during their
growth (Patanè, 2011). Previous studies revealed that vitamin C content
decreased in tomato fruits that were shaded during ripening (Gautier et
al., 2008). The stimulating effect of deficit irrigation on T.S.S. content
can be discussed on the basis that, reduction of fruit size under deficit
irrigation was mainly attributed to the reduction of water rather than the
reduction of assimilates imported into the fruit (Ho,1987). This
observation might explain why the plants subjected to deficit irrigation
produce higher content of T.S.S. in fruits.
Comparisons among the mean values of the interaction between
water quality and deficit irrigation treatments showed significant
differences in the studied fruits quality traits, throughout the two
experimental seasons (Tables 8 and 9).Regarding average fruit weight,
the highest magnitudes were recorded when irrigation with non saline
water combined with deficit irrigation at 100%Etc followed by irrigation
at 75%Etc during fruiting stage (T4) , 75%Etc during vegetative stage (T2)
and 75%Etc during flowering stage (T3) , consecutively , in both seasons
(Table 8). Meanwhile, the lowest value of average fruit weight was
obtained when irrigation with saline water combined with deficit
irrigation at 50%Etc during all growth stages (T9), in both years.
Concerning the fruit vitamin C content, The highest magnitudes
were recorded when irrigation with non saline water combined with
deficit irrigation at 50%Etc during all growth stages (T9) followed by
irrigation at 75% ETc during all growth stages (T5) , 50% Etc during
flowering stage (T7) and 50%Etc during vegetative stage (T6), orderly ,in
both seasons (Table 9 ). Meanwhile, the lowest value of vitamin C
content was obtained when irrigation with saline water combined with
irrigation at 100%Etc during whole growth stages (T1), in both years.
As for total soluble solids and acidity(pH), the highest content of
both were attained when irrigation with saline water combined with
deficit irrigation at 50% Etc during all growth stages (T9) followed by

98
J.Agric.&Env.Sci.Dam.Univ.,Egypt Vol.11 (2) 2012
deficit irrigation at 75% Etc during whole growth stages (T5) whereas, the
lowest ones were occurred when irrigation with non saline water coupled
with irrigation at 100%Etc during whole growth stages (T1), in both years
with one exception (Table 9) .
Table 8. Average fruit weight and vitamin C content of tomato fruits
as affected by the interaction of water quality and deficit
irrigation, in 2009/2010 and 2010/2011 seasons. Water
quality
Deficit
irrigation
treatment
Average fruit weight
(g)
vitamin C content
(mg/100g FW)
2009/2010 2010/2011 2009/2010 2010/2011
Non-saline
water
T1 (100%) 128.2 a 130.1 a 29.9 efg 30.5 f
T2 (75% S1) 125.5 ab 124.6 b 30.2 efg 31.4 ef
T3 (75% S2) 124.1 b 123.3 b 30.8 d-g 31.9 cde
T4 (75% S3) 127.2 ab 126.1 ab 31.1 cde 32.2 b-e
T5 (75%) 108.4 d 116.1 c 34.4 a 33.2 ab
T6 (50% S1) 98.5 e 99.5 d 31.8 cd 32.8 bcd
T7 (50% S2) 94.1 ef 95.1 de 34.2 a 33.1 bc
T8 (50% S3) 113.3 c 115.2 c 33.9 ab 31.6 def
T9 (50%) 86.4 gh 88.2 fg 35.2 a 34.4 a
Saline water
T1 (100%) 90.5 fg 91.2 ef 26.4 i 25.8 i
T2 (75% S1) 87.2 fgh 90.1 efg 27.8 hi 26.4 hi
T3 (75% S2) 85.4 h 86.2 g 28.2 hi 25.9 i
T4 (75% S3) 88.1 fgh 90.2 efg 27.6 l 26.1 i
T5 (75%) 75.2 i 78.3 h 31.2 cde 28.7 g
T6 (50% S1) 65.8 jk 70.2 i 29.4 gh 27.6 gh
T7 (50% S2) 64.2 k 63.1 j 29.9 efg 27.0 hi
T8 (50% S3) 70.6 j 73.2 hi 29.8 fg 28.1 g
T9 (50%) 59.4 l 60.1 j 32.4 bc 30.4 f
* Values followed by the same letter(s), within a comparable group of means, do not significantly
differ using revised L.S.D test at 0.05 probability level.

99
J.Agric.&Env.Sci.Dam.Univ.,Egypt Vol.11 (2) 2012
Table 9. Total soluble solids and acidity(pH) of tomato fruits as
affected by the interaction of water quality and deficit
irrigation, in 2009/2010 and 2010/2011 seasons. Water
quality
Deficit
irrigation
treatment
TSS (%) pH (%)
2009/2010 2010/2011 2009/2010 2010/2011
Non-saline
water
T1 (100%) 4.72 i 4.93 g 3.96 k 4.04 i
T2 (75% S1) 4.96 hi 5.91 cde 3.98 jk 4.06 i
T3 (75% S2) 5.02 hi 5.26 fg 4.12 ij 4.20 hi
T4 (75% S3) 4.86 i 5.12 g 4.02 jk 4.14 hi
T5 (75%) 5.95 d 6.18 c 4.30 fgh 4.66 cde
T6 (50% S1) 5.36 fg 5.64 def 4.16 hij 4.56 ef
T7 (50% S2) 5.50 ef 5.92 cde 4.27 f-i 4.72 cde
T8 (50% S3) 5.78 de 6.04 cd 4.21 f-i 4.63 def
T9 (50%) 6.61 bc 6.98 b 4.56 de 4.75 b-e
Saline water
T1 (100%) 5.12 gh 5.62 ef 4.25 f-i 4.28 gh
T2 (75% S1) 5.42 fg 5.92 cde 4.30 fgh 4.30 gh
T3 (75% S2) 5.46 ef 5.86 cde 4.36 ef 4.45 fg
T4 (75% S3) 5.32 fgh 5.93 cde 4.28 fgh 4.32 gh
T5 (75%) 6.72 b 6.98 b 4.86 ab 4.92 ab
T6 (50% S1) 6.42 bc 6.92 b 4.75 bcd 4.81 bcd
T7 (50% S2) 6.31 c 6.85 b 4.81 abc 4.85 bc
T8 (50% S3) 6.40 bc 6.81 b 4.68 cd 4.73 cde
T9 (50%) 7.31 a 7.53 a 4.95 a 5.06 a
* Values followed by the same letter(s), a comparable group of means, do not significantly differ
using revised L.S.D test at 0.05 probability level.
3. Water use efficiency
Irrigation with saline water, significantly, reduced WUE and
TYWUE; calculated on the basis of total dry biomass and total fresh fruits
yield respectively, in comparison with irrigation with non saline water, in
both experimental seasons (Table 10). The adverse effect of irrigation
with saline water on total dry biomass and total fresh fruits yield (Table
5) confirm the reduction in WUE and TYWUE. Similar conclusions on
tomato crop were documented by Al-Harbi et al.(2009) and Al-Omran et
al.(2012).
Significant differences in WUE and TYWUE due to deficit
irrigation rate were detected, in both seasons (Table 10). Comparisons

100
J.Agric.&Env.Sci.Dam.Univ.,Egypt Vol.11 (2) 2012
among mean values of the different deficit irrigation treatments showed
that deficit irrigation at 50%Etc through the various growth stages (T9)
recorded the highest mean values of WUE and TYWUE followed by deficit irrigation at 75%Etc through all growth stages (T5) which saved
the largest amounts of irrigation water, in both experimental years.
Meanwhile, deficit irrigation at 100% Etc through the different growth
stages recorded the lowest magnitudes of WUE and TYWUE, in 2009/
2010 and 2010/2011. The obtained results are in agreement with previous
findings of tomato plants grown under a wide range of deficit irrigation
treatments (Ozbahce and Tari, 2010; Patane et. al., 2010 and Wahb-Allah
et. al. ,2011).
Table 10. Water use efficiency (WUE) and total yield water use
efficiency (TYWUE) of tomato as affected by water quality
and deficit irrigation in 2009/2010 and 2010/011 seasons. Water
quality
Deficit
irrigation
treatment
WUE (kg DW m-3
) TYWUE (kg FW m-3
)
2009/2010 2010/2011 2009/2010 2010/2011
Non-saline water 3.56 a 3.58 a 28.58 a 28.75 a
Saline water 2.45 b 2.48 b 22.57 b 22.67 b
T1 (100% ) 2.41 e 2.45 e 23.42 e 23.62 e
T2 (75% S1) 2.75 cd 2.70 cd 24.88 cd 25.05 cd
T3 (75% S2) 2.61 cd 2.64 d 24.65 cd 24.82 d
T4 (75% S3) 2.81 cd 2.78 d 24.83 cd 24.74 d
T5 (75% ) 3.23 b 3.27 b 26.62 b 26.82 b
T6 (50% S1) 3.06 bc 3.11 bc 24.57 d 24.73 d
T7 (50% S2) 3.13 bc 3.17 c 25.25 bc 25.33 c
T8 (50% S3) 2.94 cd 2.95 d 24.68 cd 24.87 d
T9 (50% ) 4.96 a 5.03 a 36.50 a 36.63 a
* Values followed by the same letter(s), within a comparable group of means, do not significantly
differ using revised L.S.D test at 0.05 probability level.
The interaction effects of water quality and deficit irrigation
treatments significantly affected both WUE and TYWUE, over the two
seasons (Table 11). Irrigation with non saline water together with deficit
irrigation at 50% Etc, during all growth stages (T9) , reflected best values

101
J.Agric.&Env.Sci.Dam.Univ.,Egypt Vol.11 (2) 2012
of WUE and TYWUE, while irrigation with saline water at 100%Etc
during all growth stages (T1), in 2009/2010 and 2010/2011 (Table 12).
These results indicate that the productivity of water irrigation for both dry
biomass (WUE) and fresh total fruits yield (TYWUE) were positively
affected by DI, while being negatively affected by water salinity.
Consequently, it is possible to improve the WUE and save water through
a DI strategy for tomato production; however, to attain sufficient fruits
yield, good-quality water should be applied to the crop throughout the
whole growing season, even if at a low rate (50% ETc). Increasing water
productivity in response to DI can be explained on the basis that DI can
increase the ratio of yield over crop water consumption
(evapotranspiration) through the following strategies; reducing water loss
by unproductive evaporation, increasing the proportion of marketable
yield to the total biomass produced (harvest index) and applying adequate
fertiliser and avoiding bad agronomic conditions during crop growth
such as water logging in the root zone, pests and diseases, and other
challenges (Steduto and Albrizio, 2005; Geerts and Raes, 2009).

102
J.Agric.&Env.Sci.Dam.Univ.,Egypt Vol.11 (2) 2012
Table 11. water use efficiency (WUE) and total yield water use
efficiency (TYWUE) of tomato as affected by the interaction of water quality and deficit irrigation, in
2009/2010 and 2010/2011 seasons Water
quality
treatment
Deficit
irrigation
treatment
WUE (kg DW m-3
) TYWUE (kg FW m-3
)
2009/2010 2010/2011 2009/2010 2010/2011
Non-saline
water
T1 (100% ) 2.98 fgh 2.99 fg 25.95 de 26.23 de
T2 (75% S1) 3.20 ef 3.13 ef 27.59 cd 27.77 cd
T3 (75% S2) 3.06 fg 3.06 fg 27.39 cd 27.60 cd
T4 (75% S3) 3.33 def 3.37 def 27.54 cd 27.69 cd
T5 (75% ) 3.88 bc 3.88 bc 30.11 bc 30.32 bc
T6 (50% S1) 3.59 b-e 3.66 bcd 27.42 cd 27.57 cd
T7 (50% S2) 3.81 bcd 3.83 bcd 28.27 bcd 28.23 bcd
T8 (50% S3) 3.50 c-f 3.56 cde 27.59 cd 27.88 bcd
T9 (50% ) 5.96 a 6.01 a 41.71 a 41.75 a
Saline water
T1 (100% ) 1.90 j 1.97 i 20.90 f 21.03 f
T2 (75% S1) 2.32 ij 2.30 hi 22.16 ef 22.33 f
T3 (75% S2) 2.19 ij 2.24 hi 21.91 f 22.04 f
T4 (75% S3) 2.34 ij 2.24 hi 22.12 ef 21.80 f
T5 (75% ) 2.63 ghi 2.70 gh 23.13 ef 23.32 ef
T6 (50% S1) 2.56 ghi 2.60 gh 21.73 f 21.88 f
T7 (50% S2) 2.51 hi 2.57 gh 22.23 ef 22.42 ef
T8 (50% S3) 2.43 i 2.40 i 21.78 f 21.85 f
T9 (50% ) 4.03 b 4.12 ab 31.28 b 31.51 b
* Values followed by the same letter(s), within a comparable group of means, do not significantly
differ using revised L.S.D test at 0.05 probability level.
4. Crop yield response factor
The crop yield response factor (Ky) was determined for the
different deficit irrigation treatments. The Ky usually indicates a linear
relationship of the relative reduction in water that was consumed with a
relative reduction in yield (Lovelli et al., 2007). When crops have Ky
values that are lower than one, they are considered to be tolerant of water
deficiency. On the contrary, crops with Ky values greater than one are
considered to not be tolerant to deficit irrigation, as noted by Ayas and
Domirtas (2009). The yield response factor was calculated in this

103
J.Agric.&Env.Sci.Dam.Univ.,Egypt Vol.11 (2) 2012
experiment for both non-saline and saline water by considering the pooled
data from the two seasons. The average crop response factor for different
treatments throughout the tomato growth stages was 0.49 and 0.56 for
non-saline and saline water, respectively (Figure 2), indicating that the
reduction in crop productivity is proportionally less than the relative ET
deficit in both cases. This finding indicates that tomatoes grown in
greenhouse conditions could be considered to be a water stress-tolerant
crop. However, plants were more tolerant to water stress using non-saline
water than saline water. These results were similar to those reported by
Patane et al. (2010). Furthermore, when the Ky values were calculated for
each growth stage, a lower value was obtained for the fruiting stage,
while the highest value was obtained for the reproductive stage. This
observation indicates that the fruiting stage was less affected by soil water
deficit than at other stages.
Fig. 2 Relative yield decrease as function of relative
evapotranspiration decrease measured in tomato
(pooled of the two seasons).

104
J.Agric.&Env.Sci.Dam.Univ.,Egypt Vol.11 (2) 2012
CONCLUSION
Tomatoes grown under greenhouse conditions could be
considered to be a water stress-tolerant crop. A water deficit at the
vegetative or fruiting growth stages at a rate of 75% of Etc, while using
non-saline water insignificantly reduce the yield and enhanced WUE. The
fruiting and vegetative growth stages could be considered to be the most
tolerant to deficit irrigation and the reproductive stage could be
considered the most sensitive one. To save approximately 21% of the
irrigation water, a deficit irrigation rate of 50% ETc could be used during
the fruiting stage with non-saline water, but the total fruit yield was
reduced by 8.6%. It is possible to improve the WUE and save water
through a DI strategy for tomato production; however, to attain sufficient
fruit yield and minimize fruit losses, good-quality water should be applied
to the crop throughout the whole growing season, even if at a low rate,
50% of ETc.
REFERENCES
Allen, R. G., Pereira, L. S., Raes, D. and M. Smith. 1998. Crop
evapotranspiration guidelines for computing crop water
requirements. FAO Irrigation and Drainage paper No 56., FAO,
Rome, Italy.
Al-Harbi A. R., Wahb-Allah, M.A. and A.M. Al-Omran. 2009. Effects
of salinity and irrigation management on growth and yield of
tomato grown under greenhouse conditions. Acta Horticulturae,
807:201-206.
Al-Omran, A. M., Al-Harbi, A. R., Wahb-Allah, M. A., Nadeem, M.
and A. Eleter. 2010. Impact of irrigation water quality, irrigation
systems, irrigation rates and soil amendments on tomato production
in sandy calcareous soil. Turk J. Agric. For. 34: 59 –73.
Al-Omran, A. M., Al-Harbi, A. R., Wahb-Allah, M. A., Alwabel. M.
A., Nadeem, M. and A. Eleter. 2012. Management of Irrigation

105
J.Agric.&Env.Sci.Dam.Univ.,Egypt Vol.11 (2) 2012
water salinity in greenhouse tomato production under calcareous
sandy soil and drip Irrigation J. Agric. Sci. Tech. 14: 939 – 950.
Alsadon, A. A., Wahb-Allah, M. A. and S.O. Khalil. 2009. Evaluation
of salinity tolerance of tomato cultivars, breeding lines and their
hybrid combinations under greenhouse conditions. Acta Hort.
807:207 - 214.
Al-Yahyai, R., Al-Ismaily, S.and A.S. Al-Rawahy. 2010. Growing
tomatoes under saline field conditions and the role of fertilizers. A
Monograph on management of salt-affected soils and water for
sustainable agriculture, 83-88, Sultan Qaboos University.
AOAC, 1990. Official methods of analysis, 15th ed. Association of
official analytical chemists, Washington, DC, USA.
Ayas, S. and C. Demirtas. 2009. Deficit irrigation effects on onion
(Allium cepa L. E.T. Grano 502) yield in unheated greenhouse
condition. Inter. J. Food, Agric. and Environ. 7: 239 - 243.
Costa, J. M., Ortuno, M. F. and M. M. Chaves. 2007. Deficit irrigation
as a strategy to save water : physiology and potential application to
horticulture. J. Integr. Plant Biol. 49 : 1421–1434.
Cuartero, J.and R. Fernandez-Munoz. 1999. Tomato and salinity. Sci.
Hort. 78: 83-125.
Cuenca, R. H. 1989. Irrigation System Design: An engineering approach.
Prentice Hall, Inc., Englewood Cliffs, New Jersy, USA.
Doorenbos, J. and A. H. Kassam . 1986. Yield response to water. FAO
Irrigation and Drainage Paper No. 33, FAO, Rome, Italy.
Favati, F., Lovelli, S., Galgano, F., Miccolis, V., Di Tommaso, T.and
V. Candido. 2009. Processing tomato quality as affected by
irrigation scheduling. Sci. Hort. 122: 562 –571.
Gautier, H., Diakou-Verdin, V., Bénard, C., Reich, M., Buret, M.,
Bourgaud, F., Poëssel, J. L., Caris-Veyrat, C. and M. Génar.
2008. How does tomato quality (sugar, acid, and nutritional quality)
vary with ripening stage, temperature, and irradiance. J. Agric.
Food Chem. 56: 1241 – 1250.

106
J.Agric.&Env.Sci.Dam.Univ.,Egypt Vol.11 (2) 2012
Geerts, S. and D. Raes. 2009. Deficit irrigation as an on-farm strategy to
maximize crop water productivity in dry areas. Agric. Water
Management, 96: 1275 – 1284.
Harmanto, V., Babel, M.S. and H.J. Tantau. 2004. Water Requirement
of drip irrigated tomatoes grown in greenhouse in Tropical
Environment .Agric. Water Management. 71 (3): 225-242.
Ho, L.C., Grange, R.I., Pickerr, A.J., 1987. An analysis of the
accumulation of water and dry matter in tomato fruit. Plant Cell and
Enviro. 10: 157 - 162.
Istanbulluoglu, A. 2009. Effects of irrigation regimes on yield and water
productivity of safflower (Carthamus tinctorius L.) under
mediterranean climatic conditions. Agric. Water Management, 96:
1792 – 1798.
Kirda, C. 2002. Deficit irrigation scheduling based on plant growth
stages showing water stress tolerance. Deficit irrigation practices.
In: FAO Corp. Doc. Rep. 22 , Rome, pp. 3–10.
Kirda, C., Cetin, M., Dasgan, Y., Topcu, S., Kaman, H., Ekici, B.,
Derici, M. R. and A. I. Ozguven. 2004. Yield response of
greenhouse-grown tomato to partial root drying and conventional
deficit irrigation. Agric. Water Management, 69: 191– 201.
Lim, P. and T. Ogata. 2005. Salinity effect on growth and toxin
production of four tropical Alexandrium species (Dinophyceae).
Toxicon. 45: 699 - 710.
Lovelli, S., Perniola, M., Ferrara, A. and T. Di Tommaso. 2007. Yield
response factor to water (Ky) and water use efficiency of
Carthamus tinctorius L. and Solanum melongena L. Agric. Water
Management. 92: 73–80.
Machado, R. M. A. and M. R. G. Oliveira. 2005. Tomato root
distribution, yield and fruit quality under different subsurface drip
irrigation regimes and depths. Irrigation Sci. 24: 15 – 24.
Maggio, A., Raimondi, G., Martino, A. and S. De Pascale. 2007. Salt
stress response in tomato beyond the salinity tolerance threshold.
Environ. Exper. Bot. 59:276-282.
Mass, E. V. 1986. Salt tolerance of plants. Appl. Agric. Res. 1:12 - 26.

107
J.Agric.&Env.Sci.Dam.Univ.,Egypt Vol.11 (2) 2012
Maynard, D. N. and G. J. Hochmuth. 2007. Knott's Handbook for
Vegetable Growers. 5th Ed. John Wiley and Sons, Inc. New York.
621 pp.
Munns, R. 2002. Comparative physiology of salt and water stress. Plant
Cell Environ. 25:239-250.
Olympios, C.M., Karapanos, I.C., Lionoudakis, K.and I.
Apidianakis. 2003. The growth, yield and quality of greenhouse
tomato in relation to salinity applied at different stages of plant
growth. Acta Hort. 609:313-320.
Oweis, T. and H. Zhang. 1998. Water use efficiency: index for
optimizing supplemental irrigation of wheat in water scarce areas.
Zeitschrift f. Bewaesserungswirtschaft, 33 321 – 336.
Oweis, T. and A. Hachum. 2001. Reducing peak supplemental irrigation
demand by extending sowing dates. Agric. Water Managemen,
50:109 – 124.
Ozbahce, A. and A. Tari. 2010. Effects of different emitter space and
water stress on yield and quality of processing tomato under semi-
arid climate conditions. Agric. Water Management, 97: 1405 –
1410.
Patane, C.and S. L. Cosentino. 2010. Effects of soil water deficit on
yield and quality of processing tomato under a Mediterranean
climate. Agric. Water Management, 97:131–138.
Patane, C., Tringali, S. and O. Sortino. 2011. Effects of deficit
irrigation on biomass, yield, water productivity and fruit quality of
processing tomato under semi-arid Mediterranean climate
conditions. Scientia Horticulturae, 129: 590 – 596.
Peet, M. M.. 2005. Irrigation and fertilization. In: Heuvelink E, ed.
Tomatoes, Crop Production Science in Horticulture. CABI
Publishing, UK. pp. 171–198.
Pereira, L. S., Oweis, T. and A. Zairi. 2002. Irrigation management
under water scarcity. Agric. Water Management, 57: 175 – 206.
Pulupol, L. U., Behboudian, M. H. and K. J. Fisher. 1996. Growth,
yield and post harvest attributes of glasshouse tomatoes produced
under deficit irrigation. Hort. Sci. 31: 926 – 929.
108
J.Agric.&Env.Sci.Dam.Univ.,Egypt Vol.11 (2) 2012
Sakamoto Y, Watanabe S, Nakashima T, Okanok K (1999). Effects of
salinity at two ripening stages on the fruit quality of single-truss
tomato grown in hydroponics. J Hortic Sci Biotech 74: 690-693.
Sanders, D. C., Howell, T. A., Hile, M. M. S., Hodges, L., Meek D.
and C.J. Phene. 1989. Yield and quality of processing tomatoes in
response to irrigation rate and schedule. J. Amer. Soc. Hort. Sci. 114
(6): 904 - 908.
SAS . 2008. Statistical analysis system institute. Cary, NC, USA.
Savic S., Stikic R., Jovanovic Z., Vucelic-Radovic B., Paukovic M.and
S. Djordjevic. 2011. Deficit irrigation strategies for production of
tomato in greenhouse conditions. Proceedings of the 46th
Croatian
and 6th
International Symposium on Agriculture, Opatia, Croatia
201, pp. 567-570.
Singh, Y., Rao, S.S. and O.L. Regar. 2010. Deficit irrigation and
nitrogen effects on seed cotton yield, water productivity and yield
response factor in shallow soils of semi-arid environment. Agric.
Water Management 97: 965–970.
Snedecor, G.W.and W.G. Cochran. 1989. Statistical methods, 8th ed.
Iowa state university press, Ames, Iowa.
Srinivasa, R.N.K., Bhatt, R.M. and A.T. Sadashiva. 2000. Tolerance to
water stress in tomato cultivars. Photosynthetica, 38: 465- 467.
Steduto, P. and R. Albrizio. 2005. Resource use efficiency of field-
grown sunflower, sorghum, wheat and chickpea. II. Water use
efficiency and comparison with radiation use efficiency. Agric.
Forest Meteorol, 130: 269 - 281.
Tantawy, A.S, Abdel-Mawgoud, A. M. R., El-Nemr, M. A. and Y.G.
Chamoun. 2009. Alleviation of salinity effects on tomato plants by
application of amino acids and growth regulators. Eur. J. Sci. Res.
30 (3): 484-494.
Topcu, S., Kirda, C., Dasgan, Y., Kaman, H., Cetin, M., Yazici, A.
and M. A. Bacon. 2006. Yield response and N-fertilizer recovery of
tomato grown under deficit irrigation. Eur. J. Agron. 26: 64 – 70.

109
J.Agric.&Env.Sci.Dam.Univ.,Egypt Vol.11 (2) 2012
Topcu, S., Kirda, C., Dasgan, Y., Kaman, H., Cetin, M., Yazici, A.
and M.A. Bacon. 2007. Yield response and N-fertiliser recovery of
tomato grown under deficit irrigation. Eur. J. Agron. 26: 64 – 70.
Van-Ieperen, W., 1996. Effects of different day and night salinity levels
on vegetative growth, yield and quality of tomato. J. Hort. Sci. 71:
99 - 111.
Wahb-Allah M. A, Alsadon, A. A and A. A. Ibrahim. 2011. Drought
tolerance of several tomato genotypes under greenhouse conditions.
World Appl. Sci. J. 15 (7): 933-940.
Zegbe-Domínguez, J. A., Behboudian, M. H. and B. E. Clothier. 2006.
Responses of “Peto pride” processing tomato to partial root zone
drying at different phenological stages, Irrig. Sci. 24: 203 – 210.
العربً الملخص
للطماطم على المختلفة النمو مراحل خاللتأثٌر جودة مٌاه الري ونقص الري النمو واإلنتاجٌة وكفاءة استخدام المٌاه
3، و عبد رب الرسول موسى العمران 1،2 محمود عبادي وهب هللا
كلٌة علوم التربة قسم 3و النباتً اإلنتاج قسم 2جامعة اإلسكندرٌة ، -كلٌة الزراعة -قسم الخضر 1 سعود الملك جامعة - والزراعة األغذٌة علوم
المؤثرة على الزراعة فً جمٌع أنحاء العالم عدم وجود موارد كافٌة من المٌاه المشكلة الرئٌسٌة
الذي ٌسمح بقدر من اإلجهاد المائً خالل -واستخدام الري الناقص ،الستخدامها فً األغراض الزراعٌةاحد وسائل التوفٌر فً -بعض أو كل مراحل نمو النبات دون حدوث انخفاض مؤثر فً كمٌة المحصول
تأثٌر كل من جودة مٌاه الري و برنامج تهدف الدراسة الحالٌة إلى اختبار .مٌاه الري المستخدمة كمٌهالري الناقص خالل مراحل النمو المختلفة على النمو واإلنتاجٌة وكفاءة استخدام مٌاه الري لنبات
و 2009/2010أجرٌت تجربتان متماثلتان داخل البٌوت المحمٌة خالل موسمً النمو الطماطم لذلك ذو عادي بئر ماءم . استخدم فً الدراسة نوعان من مٌاه الري ٌختلفان فً جودتهما )2010/2011العادي بعد تنقٌته بمحطة تحلٌه لبئرا/متر وماء نفس دٌسٌسٌمنز 3.6توصٌل كهربائً مقداره معامل
/متر( باإلضافة إلى تسع معامالت للري دٌسٌسٌمنز 0.9توصٌل كهربائً مقداره معامل ذو المٌاه لٌصٌح% من قٌمة البخر نتح طوال حٌاه 50% ، 75% ، 100ثالثة معامالت للري بمعدل الناقص تشمل
البخر نتح خالل مرحلة النمو الخضري أو مرحلة قٌمة ٪ من 75، ثالث معامالت للري بمعدل النبات % من قٌمة البخر نتح خالل بقٌة مراحل النمو ، 100النمو التكاثري أو مرحلة اإلثمار ثم الري بمعدل

110
J.Agric.&Env.Sci.Dam.Univ.,Egypt Vol.11 (2) 2012
الخضري أو مرحلة النمو النمو مرحلة خالل نتح البخر قٌمة ٪ من 50ثالث معامالت للري بمعدل استخدم % من قٌمة البخر نتح خالل بقٌة مراحل النمو . 100ثم الري بمعدل التكاثري أو مرحلة اإلثمار .ع المنشقة لمرة واحدة فً تصمٌم عشوائً كامل بثالثة مكرراتفً تنفٌذ الدراسة نظام القط
أوضحت النتائج تأثٌرات معنوٌة لجودة مٌاه الري على كل من المحصول وكفاءة استخدام المٌاه أثناء الموسم ٪24، ٪22حٌث أدى الري بالماء المالح إلى انخفاض المحصول الكلى للثمار بنسبة
عند وضوحا أكثر كان اإلنتاجٌة على الناقص الري لمعامالت التأثٌر السلبً األول والثانً على التوالً. أكثر الثمري والنمو الخضري النمو مرحله كانت ولقد ، مالح الغٌر بالماء مقارنة المالح الماء استخدام
مٌاه لنقص حساسٌة األكثر اعتبارها ٌمكن والتً التكاثري النمو بمرحلة مقارنه الناقص للري تحمال على ٌدل مما الناقص الري لمعامالت42.0 -42.0 بٌن المحصول استجابة معامل قٌمة تراوحت. الري
بمعدل مالح الغٌر بالماء الري معاملة أن النتائج أشارت أٌضا. الري مٌاه لنقص الطماطم نبات تحمل على معنوٌا تؤثر لم الثمرى النمو مرحلة أو الخضري النمو مرحلة خالل نتح البخر قٌمة من٪ 0.
إلى أدت أنها إلى باإلضافة ،٪ 22. من اقل بنسبة للثمار الكلى المحصول انخفض حٌث واإلنتاجٌة النمو
عالوة ، الكلٌة الذائبة الصلبة المواد و ج فٌتامٌن من الثمار محتوى و المٌاه استخدام كفاءة من كل تحسٌنوبالتالً ٌمكن التوصٌة باستخدام هذه المعاملة عند الري فً المستخدمة المٌاه كمٌة من٪ 04 توفٌر على
٪ من قٌمة 50على الرغم أن معاملة الري بالماء الغٌر مالح بمعدل .إنتاج الطماطم بالبٌوت المحمٌة ٪ من كمٌه المٌاه المستخدمة فً الري إال أن 21البخر نتح خالل مرحلة النمو الثمرى أدت إلى توفٌر
%. 8.6مار بلغ تقرٌبا االنخفاض فً محصول الث